the Creative Commons Attribution 4.0 License.
the Creative Commons Attribution 4.0 License.
 | 10 Mar 2025
Multi-century mean summer temperature variations in the Southern Rhaetian Alps reconstructed from Larix decidua blue intensity data
Riccardo Cerrato
Maria Cristina Salvatore
Michele Brunetti
Andrea Somma
Carlo Baroni
Ongoing climate change is likely to cause a worldwide temperature increase of 1.5 °C by the mid-century. To contextualize these changes in a long-term context, historical climatological data extending beyond data obtained from instrumental records are needed. This is even more relevant in remote areas characterized by complex climatic influences and where climate sensitivity is pronounced, such as the European Alps. Considering their high temporal resolution, dendrochronological data have been recognized as a fundamental tool for reconstructing past climate variations. In this study, we present a comprehensive dendroclimatic analysis in which blue intensity (BI) data derived from European larch (Larix decidua Mill.) trees in the Southern Rhaetian Alps were employed. By establishing the relationships between BI patterns in tree rings and climate variables, we explored the possibility of using the obtained data for constructing a high-resolution, long-term climate record. The results in the high-frequency domain showed that BI data from European larches explained up to 38.4 % (26.7 %–48.5 %) of the June–August mean temperature variance in the study area; this result is 70 % greater than the mean temperature variance percentages explained by total ring width measurements for the same period in the area. Moreover, the correlation values between the BI data and June–August mean temperature are stable over time, ranging between 0.40 and 0.71 (mean value of 0.57), considering a moving window of 50 years, and at spatial scale, with significant values over the western and central Mediterranean areas returned for all the considered time windows. In fine, the regression performance using BI data is comparable to that using data from more expensive methods of analysis. The results from this investigation will extend the current knowledge on the applicability of using BI data to study the European larch, and the reconstruction described herein is the first attempt to determine whether this proxy can be used for dendroclimatic aims. Thus, BI data represent a suitable tool for extending our knowledge beyond that obtained from instrumental records and for facilitating a more robust evaluation of climate models and future climate scenarios in the Alpine region.
- Article
(3101 KB) - Full-text XML
-
Supplement
(4168 KB) - BibTeX
- EndNote


Climate change has been recognized as unequivocally induced by human activities (IPCC, 2023; Eyring et al., 2023), and it is extremely likely that this activity has been the dominant cause of the observed warming since the mid-20th century (IPCC, 2013). Although human-induced global warming is likely to cause a worldwide temperature increase of 1.5 °C between 2030 and 2050 CE (IPCC, 2018), the effects of global warming on high-altitude areas, which have a temperature increase rate that almost doubles that of the global mean, are even more emphasized (Pepin et al., 2015; Brunetti et al., 2009; Auer et al., 2007; Böhm et al., 2001). This enhanced warming rate implies not only accelerated glacier melting, reduced snow cover duration, and permafrost thawing but also, as a consequence, disruption of the hydrological cycles, disturbance of terrestrial and freshwater species and ecosystems, slope instability, and a greater probability of wildfires (Carrer et al., 2023; IPCC, 2019). Understanding the dynamics of climate variability over centuries has been not only a scientific endeavour but also a pressing concern for society at large, as these dynamics provide critical insights into the Earth's response to natural and anthropogenic factors (IPCC, 2023, 2022, 2019, 2018). Thus, to contextualize ongoing climate and global changes in a wider frame, precise information on past environmental and climatic conditions is needed.
Long-term and validated meteorological instrumental time series are the best tools for studying and analysing the climate of the past, but these data are not spatially homogeneous and are rarely available for remote sites. Moreover, the time span of these data can also represent a limitation. For instance, the European Alps are among the areas where long-term meteorological instrumental time series, which cover at least the last 2 centuries, exist (Brunetti et al., 2012, 2006; Auer et al., 2007). However, the number of meteorological stations, and thus their representativeness of the high-elevation and remote regions in the inner alpine valleys, decreased before 1875 CE (Brunetti et al., 2006). Thus, the use of proxies that cover several centuries and that are capable of representing meteorological variables in recent times is useful for inferring the meteorological conditions that occurred before the beginning of the 19th century, thus permitting a better understanding of the climate changes that involved high mountain areas since the end of the Little Ice Age (LIA).
Among the climatic proxies that can be used (Trachsel et al., 2012), dendrochronological data represent an excellent tool for reconstructing past climatic variations. In fact, dendroclimatology has emerged as a powerful science useful for reconstructing past climate variability and offers a unique perspective on long-term environmental changes at both the hemispherical (Esper et al., 2018; Anchukaitis et al., 2017; Wilson et al., 2016) and regional (Büntgen et al., 2011, 2006; Corona et al., 2010) scale at an annual resolution. However, these large-scale reconstructions depend on local data that are also useful for performing reconstructions at the local scale and thus also highlight local climatic patterns. In this context, the Alps are an important site, representing a hinge among a continental climate that characterizes central Europe, a Mediterranean climate that characterizes southern Europe, and a more Atlantic climate that is present in the westernmost portions of the European continent. In this context, the Southern Rhaetian Alps, which host the southernmost glaciers of the central Alps, present an intriguing region for dendroclimatic investigations, as demonstrated by previous studies performed in this area (Unterholzner et al., 2024; Cerrato et al., 2023, 2020, 2019a, b, 2018; Coppola et al., 2013, 2012; Leonelli et al., 2011).
Traditionally, dendroclimatic reconstructions have relied on measuring the annual total ring width (TRW) of trees. However, the quest for more robust and high-resolution climate records that are less affected by growth trend problems has led to the exploration of other methods, such as maximum wood density (MXD), anatomical traits, and isotopes (Leavitt and Roden, 2022; Björklund et al., 2019). Among these, blue intensity (BI) data have emerged as a promising tool, offering a potential alternative to overcome the costs of MXD analysis (McCarroll et al., 2002) and allowing more laboratories to perform MXD-like analysis (Reid and Wilson, 2020; Wilson et al., 2017b, 2014). In fact, BI data, derived from the reflected-light spectral analysis of tree-ring samples (Björklund et al., 2024), provide climatic information that is virtually identical to that acquired through MXD. The BI and MXD data reflect cell wall dimension rather than the TRW or cell wall compounds and thus show strong similarities in terms of temperature correlation strength and autocorrelation (Björklund et al., 2021; Ljungqvist et al., 2020). However, even if BI and MXD data are comparable, differences between the proxies could emerge as a function of the intrinsically different resolutions of the two methods (Björklund et al., 2019), as is also underlined by the anatomical MXD (Seftigen et al., 2022; Björklund et al., 2020).
Blue intensity, albeit a relatively new methodology, has already been tested on several coniferous species (e.g. Scots pine (Pinus sylvestris L.) in Fennoscandia and Scotland; various Picea ssp., Pinus ssp., and Tsuga ssp. in North America and Europe; and other coniferous species in Asia and Oceania (e.g. Cerrato et al., 2023; Reid and Wilson, 2020). Nevertheless, in the European Alps, only a few studies have been performed using BI data (Cerrato et al., 2023; Arbellay et al., 2018; Nicolussi et al., 2015; Österreicher et al., 2014), and even fewer have been performed on the European larch. Thus, additional tests are needed (Reid and Wilson, 2020). The European larch (Larix decidua Mill.), the dominant tree species in the Southern Rhaetian Alps, is particularly well suited for dendroclimatic investigations due to its sensitivity to environmental conditions and longevity, thus indicating its great potential for dendroclimatic studies (Cerrato et al., 2018; Coppola et al., 2013, 2012; Büntgen et al., 2011, 2006). Although this species has been widely studied using both TRW and MXD, the associated BI data were used only for dendroentomological aims (Arbellay et al., 2018), and a dendroclimatic analysis of the BI data from the European larch is still lacking.
Here, we present the first dendroclimatic analysis of European larch BI data from samples collected in the Southern Rhaetian Alps. The methodology, advantages, and limitations of using BI data in the context of climate reconstructions are analysed, and the relationships between BI data and climate variables are examined to construct a high-resolution, long-term record of climate variability.
The study area is located on the Adamello–Presanella and Ortles–Cevedale massifs (southeastern Alps, Southern Rhaetian Alps; Marazzi, 2005). The area is characterized by many peaks exceeding 3000 m a.s.l. (e.g. Mount Vióz – 3645 m; Mount Adamello – 3554 m; and Presanella – 3558 m) and is one of the most glaciated and glacierized areas in the Italian Alps (Salvatore et al., 2015). The sampling stands on the Ortles–Cevedale (Bosco Antico (ANBO) at 46°19 N, 10° E) and Adamello–Presanella (Val di Barco (BARC) at 46° N, 10° E; Pradach di Val Palù (PALP) at 46° N, 10° E) massifs belong to treeline ecotones and span between 1820 and 2270 m a.s.l. with a general northern exposure (Fig. 1). European larch individuals are scattered in an environment where ericaceous species are predominant (Rhododendron ferrugineum L., Vaccinium spp.) (Gentili et al., 2020, 2013; Andreis et al., 2005). Soils are commonly influenced by parent material and superimposed vegetation and can be classified as immature and shallow podzols, Histosols, or Umbrisols (Galvan et al., 2008; IUSS Working Group, 2022).
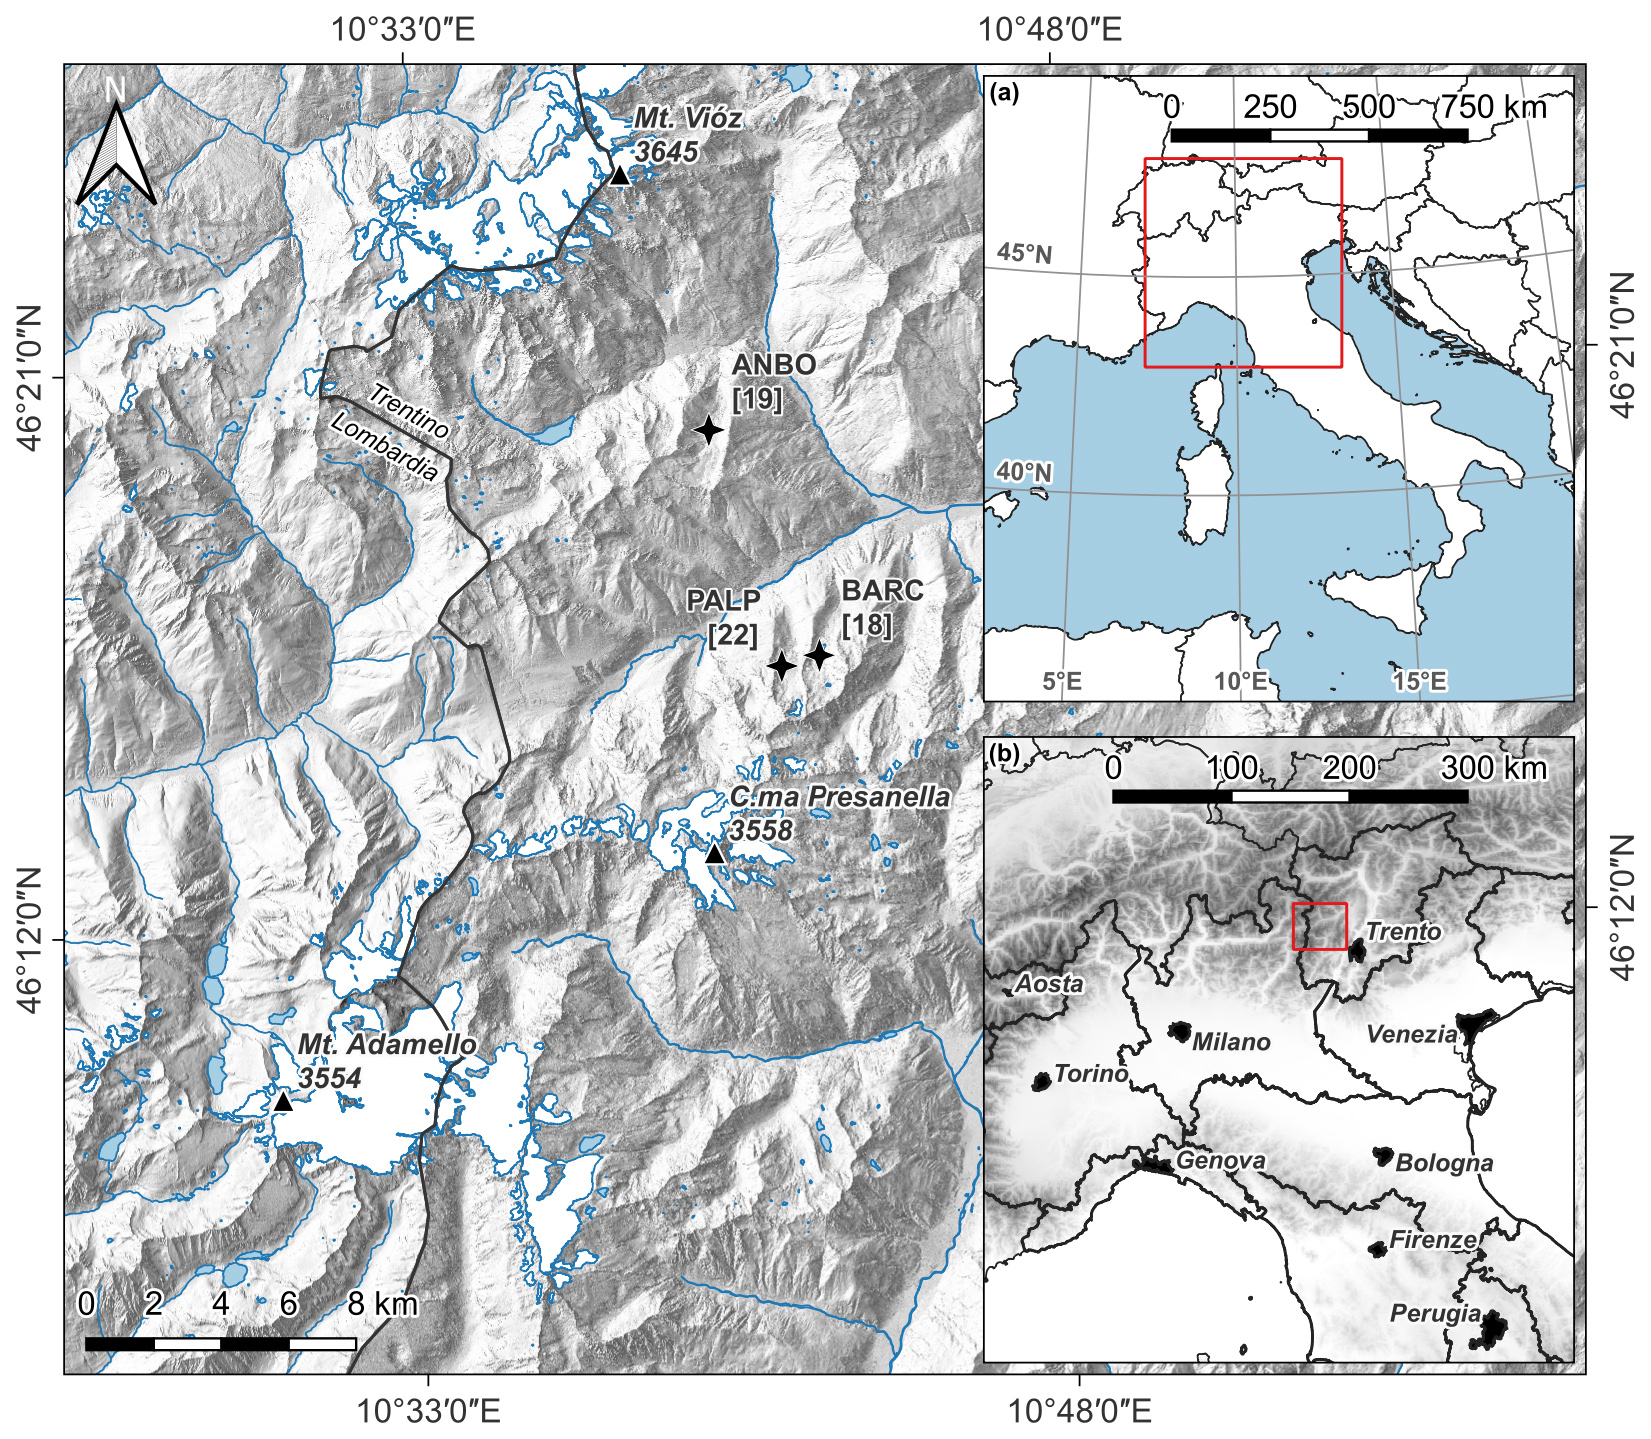
Figure 1Map of the study area and sampling sites. The stars indicate the sampling sites. The numbers within the square brackets indicate the number of trees. Inset (b) base map: European Union Digital Elevation Model (EU-DEM, ver. 1.1. April 2016; https://www.eea.europa.eu/en/datahub/datahubitem-view/d08852bc-7b5f-4835-a776-08362e2fbf4b, last access: 26 February 2025). The red squares in insets (a) and (b) represent the footprint of inset (b) and the main map, respectively (software: QGIS Geographic Information System, Version 3.28.2-Firenze).
The area is characterized by a latitudinal precipitation pattern that decreases northwards and is located just south of the “inner dry alpine zone” (Isotta et al., 2014). The precipitation distribution reaches a minimum in winter (December–February) and a maximum in summer (June–August) at 172 and 292 mm, respectively, whereas the mean annual value is 1017 mm in the 1961–1990 period (Crespi et al., 2018; Carturan et al., 2012; Brunetti et al., 2006). Considering the temperatures, the 1961–1990 mean annual temperature measured at the nearest station (Careser meteorological station ca. 12 km northwards from the sampling stands and located at 2607 m) was −1.2 °C, with February representing the coldest month (−8.3 °C) and July representing the warmest month (+6.9 °C).
3.1 Tree-ring and blue intensity data
In this study, cores from 76 European larch trees were sampled over the past decade and prepared for TRW measurements (for sampling, sample preparation, measurement, and cross-dating details, refer to Cerrato et al., 2019b, 2018). The collected samples were repolished with progressively finer sandpapers with up to P2000 grit to remove pencil marks and to highlight the ring boundaries. The samples were then scanned at 3200 dpi using an Epson Perfection V850 Pro flatbed scanner (Seiko Epson Corporation, Suwa, Japan) with SilverFast Archive Suite 8 software (LaserSoft Imaging AG, Kiel, Germany). The scanner acquisition colours were calibrated using an IT8.7/2 colour card. BI measurements were subsequently performed using CooRecorder 9.5 software (Cybis 2020 – http://www.cybis.se/forfun/dendro/index.htm, last access: 26 February 2025).
The settings of the frame for calculating the BI value can vary depending on the species, site, and scientific purpose (Tsvetanov et al., 2020; Buckley et al., 2018; Kaczka et al., 2018; Schwab et al., 2018; Dannenberg and Wise, 2016; Rydval et al., 2014). In this study, considering that cores with a diameter of 5.15 mm were involved, a frame width of 100 pixels (equal to 0.8 mm at 3200 dpi) was used to measure the minimum latewood blue reflectance (LWBR) and maximum earlywood blue reflectance (EWBR) values. Frame depths of 50 and 200 pixels (corresponding to 0.4 and 1.6 mm at 3200 dpi, respectively) were determined to be optimal compromises between the average wood structure width and the measurement requirements. These frame depths were subsequently employed for measuring the LWBR and EWBR, respectively. The offsets of the frame were set at 5 and −2 pixels for the LWBR and EWBR, respectively (Fig. S1 in the Supplement). For the LWBR measurements, we considered the mean values of 25 % of the darkest pixels in the frame, whereas all the pixels within the frame were considered for the EWBR measurements (Cerrato et al., 2023). For easier comparison with climate data, BR values were inverted following standard procedures to derive BI values (Rydval et al., 2014; Wilson et al., 2014), consistent with the “2024 BI standard terminology” (Björklund et al., 2024).
Extractives and wood discolouration are other issues encountered in BI studies that require attention on the basis of species, site, and scientific purpose (Fuentes et al., 2018; Wilson et al., 2017a; Solomina et al., 2016; Sheppard and Wiedenhoeft, 2007). Following the procedure applied to the European larch (Arbellay et al., 2018) and other conifer species (Wilson et al., 2021, 2019, 2014), in this study, the extractives were not removed; however, to correct the heartwood/sapwood discolouration that characterizes this species, Delta BI (DBI) datasets were calculated as differences between the LWBI and EWBI datasets and analysed (Björklund et al., 2015, 2014).
Visual and statistical cross-dating of ring width, from the core samples, ensured that all obtained BI-based values were also correctly cross-dated. Due to the occurrence of larch budmoth (LBM; Zeiraphera diniana Gn.) outbreaks in the area (Cerrato et al., 2019b; Turchin et al., 2003; Baltensweiler and Rubli, 1999), the BI core series were checked and corrected via the gap-filling procedure (Büntgen et al., 2006). After LBM correction, the BI core series belonging to the same tree were averaged to create the individual BI tree series. Then, individual BI tree series were standardized using a modified negative exponential curve or a linear regression (Cook and Holmes, 1999). Site chronologies were obtained as a biweighted robust mean of the individual BI tree series belonging to each site where the variance was stabilized as a function of the sample depth (Schweingruber, 1988; Fritts, 1976). Only those individual BI tree series that showed high correlation values with the site chronology (i.e. p-values less than 0.001 and Spearman's ρ values greater than or equal to 0.30) were considered. The expressed population signal (EPS) was calculated to estimate the representativeness of each chronology compared to an infinite hypothetical population (Fritts, 1976), and the commonly used threshold of 0.85 was used to limit the site chronologies in time. Finally, to highlight the mid-low-frequency domain (sensu Melvin, 2004), a low-pass Gaussian filter with a window length of 30 years and a sigma of 5 years was applied to the BI site chronologies. The high-frequency domain of the site chronologies was obtained as residuals of the raw data from the low-pass filter.
To highlight the common signals that characterize the three site chronologies, principal component analysis (PCA) and evolutionary principal component analysis (EPCA) were performed on the raw data and on the low- and high-frequency domains (Camiz and Spada, 2023; Camiz et al., 2020). This approach limits the period of analysis to the shortest considered site chronology but allows the retention of only those factors that explain the a priori decided quantity of the original data variance. In this study, the components that explained 80 % of the variance in the original dataset were considered.
All the data were manipulated in the R-project environment (R Core Team, 2024) by using dplR (Bunn, 2010, 2008) and smoother (v. 1.1; https://CRAN.R-project.org/package=smoother, last access: 9 October 2023) packages, whereas principal component analysis was performed using the “stat” and FactoMineR (Lê et al., 2008) packages.
3.2 Instrumental data
Instrumental series for minimum, maximum, and mean temperature and for precipitation were considered to explore the sensitivity of the BI chronologies to climate variability. Meteorological series from 1764 to 2015 specific to the sampling stands were reconstructed by interpolating the climate information provided by meteorological station data by using the anomaly method (Mitchell and Jones, 2005; New et al., 2000) and interpolating the longest and homogenized meteorological series available for the Alpine region (Crespi et al., 2021, 2018; Brunetti et al., 2014, 2012, 2006). The interpolation procedure consists of the independent reconstruction of the climatologies (i.e. the climate normals over a given reference period) and the deviations from them (i.e. anomalies). Climatologies, linked to geographic features of the territory, are characterized by large spatial gradients; anomalies, linked to climate variability and change, are generally characterized by greater spatial coherence than climate normals. Therefore, the former were reconstructed by applying an interpolation technique that exploits the local dependence of meteorological variables on elevation (Crespi et al., 2018; Brunetti et al., 2014). This technique requires a high spatial density station network, even if the data are available for a limited period only. On the other hand, anomalies can be reconstructed through a simpler interpolation technique and a lower station density. However, long temporal coverage is mandatory, as is accurate homogenization of the time series for removing non-climatic signals (e.g. due to instrument relocation and changes in measurement practices). Finally, from the superimposition of climatologies and anomalies, monthly temperature and precipitation series in absolute values that were representative of the specific sites were obtained. Information about the techniques and their accuracy is provided in Brunetti et al. (2014, 2012) and Crespi et al. (2021, 2018). All the information concerning the meteorological stations involved in the climate information reconstruction is summarized in Fig. S2 (in the Supplement), which shows the spatial distribution of temperature and precipitation stations around the sites, the temporal evolution of data availability for those stations located within a radius of 150 km from the centroid of the three sites, and their elevation distribution.
In addition, to assess the spatial coherence of the dendroclimatic signal, high-resolution (0.5×0.5° lat–long) monthly spatially continuous interpolated gridded datasets of minimum, maximum, and mean temperature and precipitation were used (Harris et al., 2020; Climate Research Unit Time-Series (CRU-TS), v. 4.07; last access: 10 October 2023). The meteorological data were filtered as BI data to minimize bias in correlation with the tree-ring data resulting from unfiltered trends (Ols et al., 2023; Seftigen et al., 2020; Cerrato et al., 2019a, 2018)
3.3 Climate correlation and reconstruction
The BI–climate relationship was assessed by calculating Pearson's correlation indices between the BI chronologies and climatic parameters. The correlation indices were calculated over the 1800–2013 period while considering the monthly values from the previous May to October or the current year of growth for a total of 18 months. In addition, considering the climatic sensitivity of the European larches in the area (Cerrato et al., 2018; Coppola et al., 2013), seasonal variables were created and examined by averaging the climatic parameter over the June–August (JJA) period. Using a window width of 50 years, the stability of the BI–climate relationship over time was verified by performing a moving correlation analysis with a 1-year step. Correlation indices were calculated in the R-project statistical environment via the treeclim (Zang and Biondi, 2015) package. The bootstrapping procedure described in DENDROCLIM2002 (Biondi and Waikul, 2004) was applied to calculate the correlation indices and their 95 % confidence intervals via the percentile confidence interval method (Zang and Biondi, 2015; Dixon, 2001).
To test the stationarity of the transfer function and thus to assess the reliability of the reconstruction (Wilmking et al., 2020), a bootstrapped cross-calibration verification (CCV) approach was applied and the reduction in error (RE) and the coefficient of efficiency (CE) were calculated (Cook et al., 1994; Fritts, 1976). Moreover, the bootstrapped transfer function stability (BTFS) test was performed (Buras et al., 2017). The process was repeated 1000 times. Dendroclimatic reconstruction was assessed by performing linear regression between z-scores of both BI values (predictor) and meteorological data (predictand) while considering an ordinary least-squares regression approach. Then, the mean and the variance of the regressed DBI z-score data were adjusted against the instrumental targets to avoid the typical loss of amplitude due to regression error (Carrer et al., 2023) and reducing the inflated error variance observed when only the scaling approach was applied (Esper et al., 2005).
Out of the 76 individual BI tree series from the three sampled stands, 17 were excluded from the study because they exhibited low inter-series correlation values. From the other 59 individual BI tree series, considering the EPS, the BI values of 18 931 rings spanning 514 years (i.e. 1502–2015 CE; Table 1) were obtained. From each site, the EWBI, LWBI, and DBI site chronologies were obtained. The EWBI and LWBI site chronologies showed the influence of wood discolouration at the most recent end (Fig. S3), whereas DBI chronologies did not show an evident influence of discolouration due to the heartwood–sapwood transition (Fig. 2).
Table 1Statistical parameters of the BI chronologies and their Pearson's () and Spearman's () mean inter-series correlation coefficients. The correlation index between chronologies was calculated considering the raw chronologies on the maximum overlap considering the EPS.
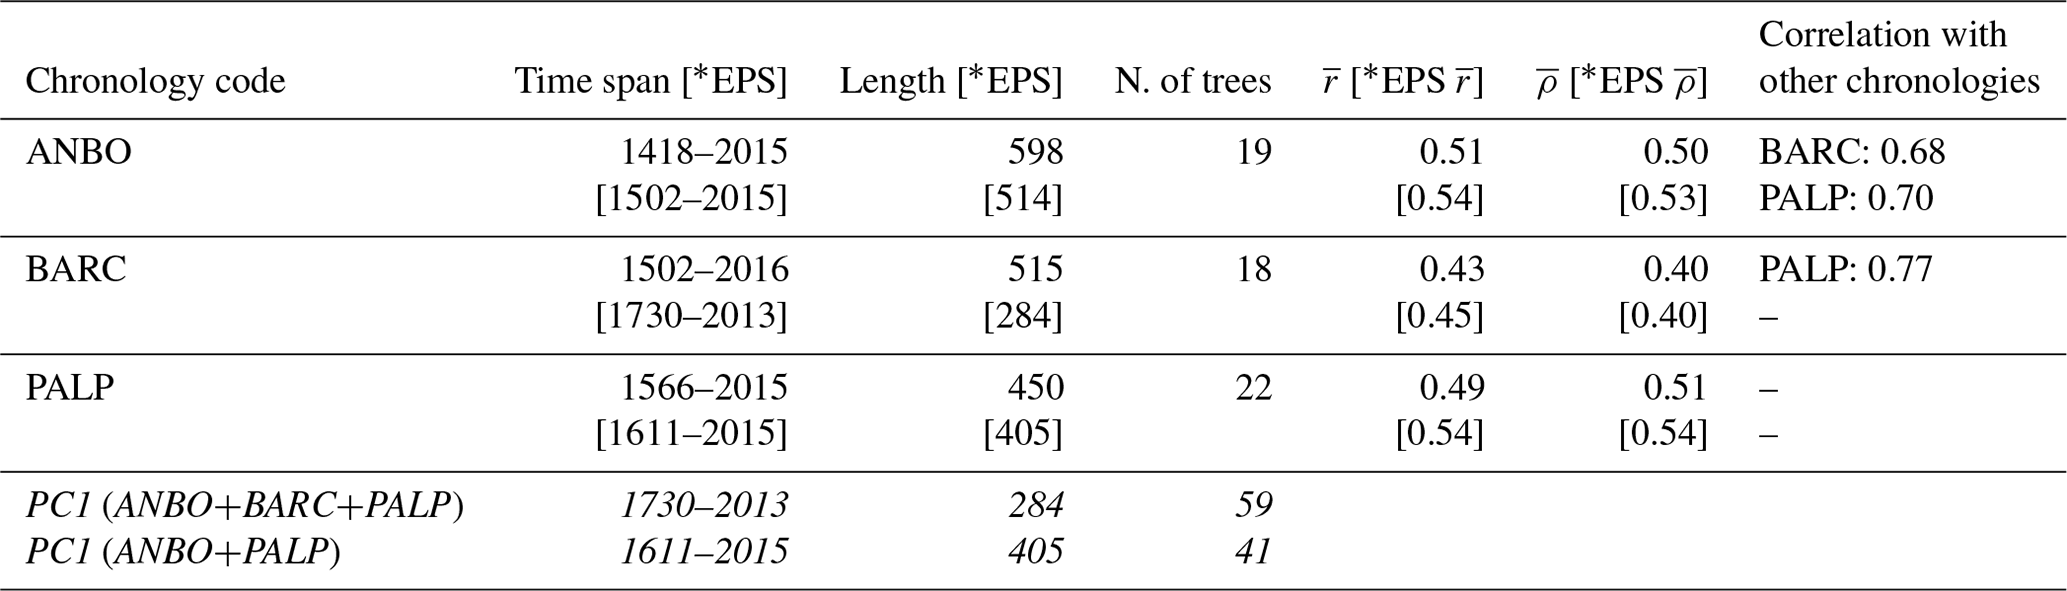
∗ EPS identifies values for the EPS-stripped chronology as described in Sect. 3.1. Italics identify data related to principal-component-derived chronologies.
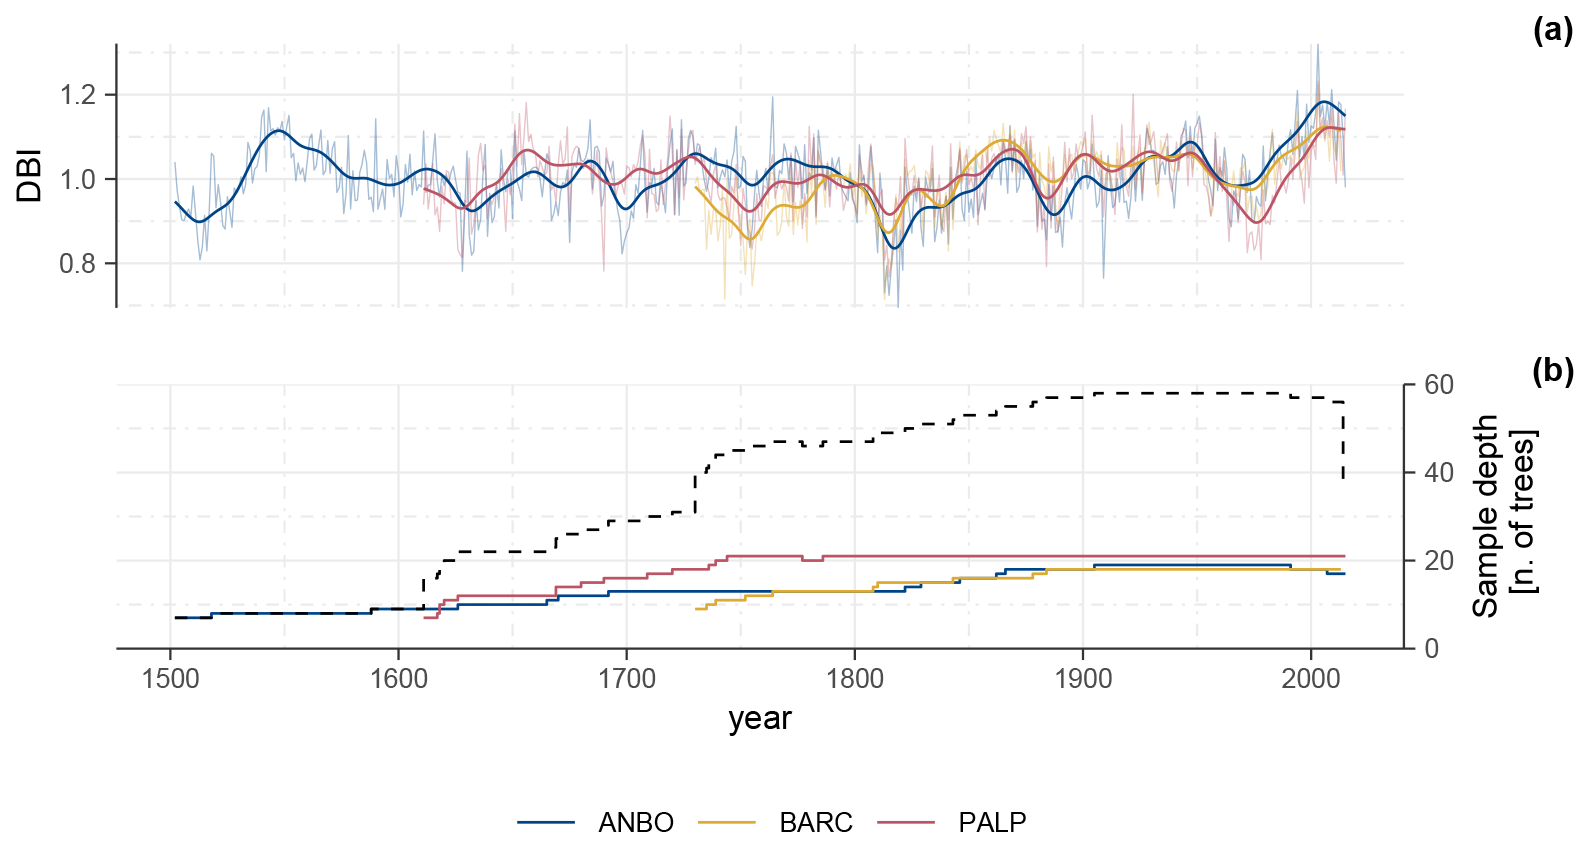
Figure 2Raw delta blue intensity (DBI) chronologies (a) and sample depths (b). The thick solid lines in panel (a) represent 30-year Gaussian-filtered chronologies (σ=5 years); the dashed black line in panel (b) represents the cumulative sample depth.
The three DBI chronologies showed similar decadal variabilities, with only BARC reporting a slightly positive trend over time (Fig. 2). Due to the coherence shown by the DBI chronologies, a PCA was performed to highlight the common patterns of variability and to evaluate their relationships with climate (Seftigen et al., 2020). The results showed that the first principal component (PC1) explained more than 80 % of the variance alone, and all the chronologies were strongly positively correlated with PC1 (see Fig. S4 for further details). However, the correlation values obtained between the mean temperature and both the EWBI and LWBI PC1 (ANBO + BARC + PALP) corroborate the hypothesis that the discolouration due to the heartwood–sapwood transition affects the analysis, whereas the DBI PC1 (ANBO + BARC + PALP) seems not to be affected by this issue (compare Figs. 3 and S5). Moreover, comparing the correlation coefficient obtained between the mean temperature and both DBI PC1 (ANBO + BARC + PALP) and site DBI chronologies shows that the former returned slightly greater values (Fig. S6). Thus, the DBI PC1 (ANBO + BARC + PALP), identified here as PC1 (ANBO + BARC + PALP), was selected to represent the mean areal chronology and was used for further analysis.
4.1 BI–climatic correlations
Concerning the meteorological variables, PC1 (ANBO + BARC + PALP) correlates significantly with temperature (Fig. 3), correlates more strongly with mean temperature than with minimum and maximum temperature, and does not correlate significantly with precipitation (Fig. S7). On both the raw data and low- and high-frequency domains, correlations were evaluated over the whole period and on moving time windows (see Sect. 3.1 for the definition of high- and low-frequency series).
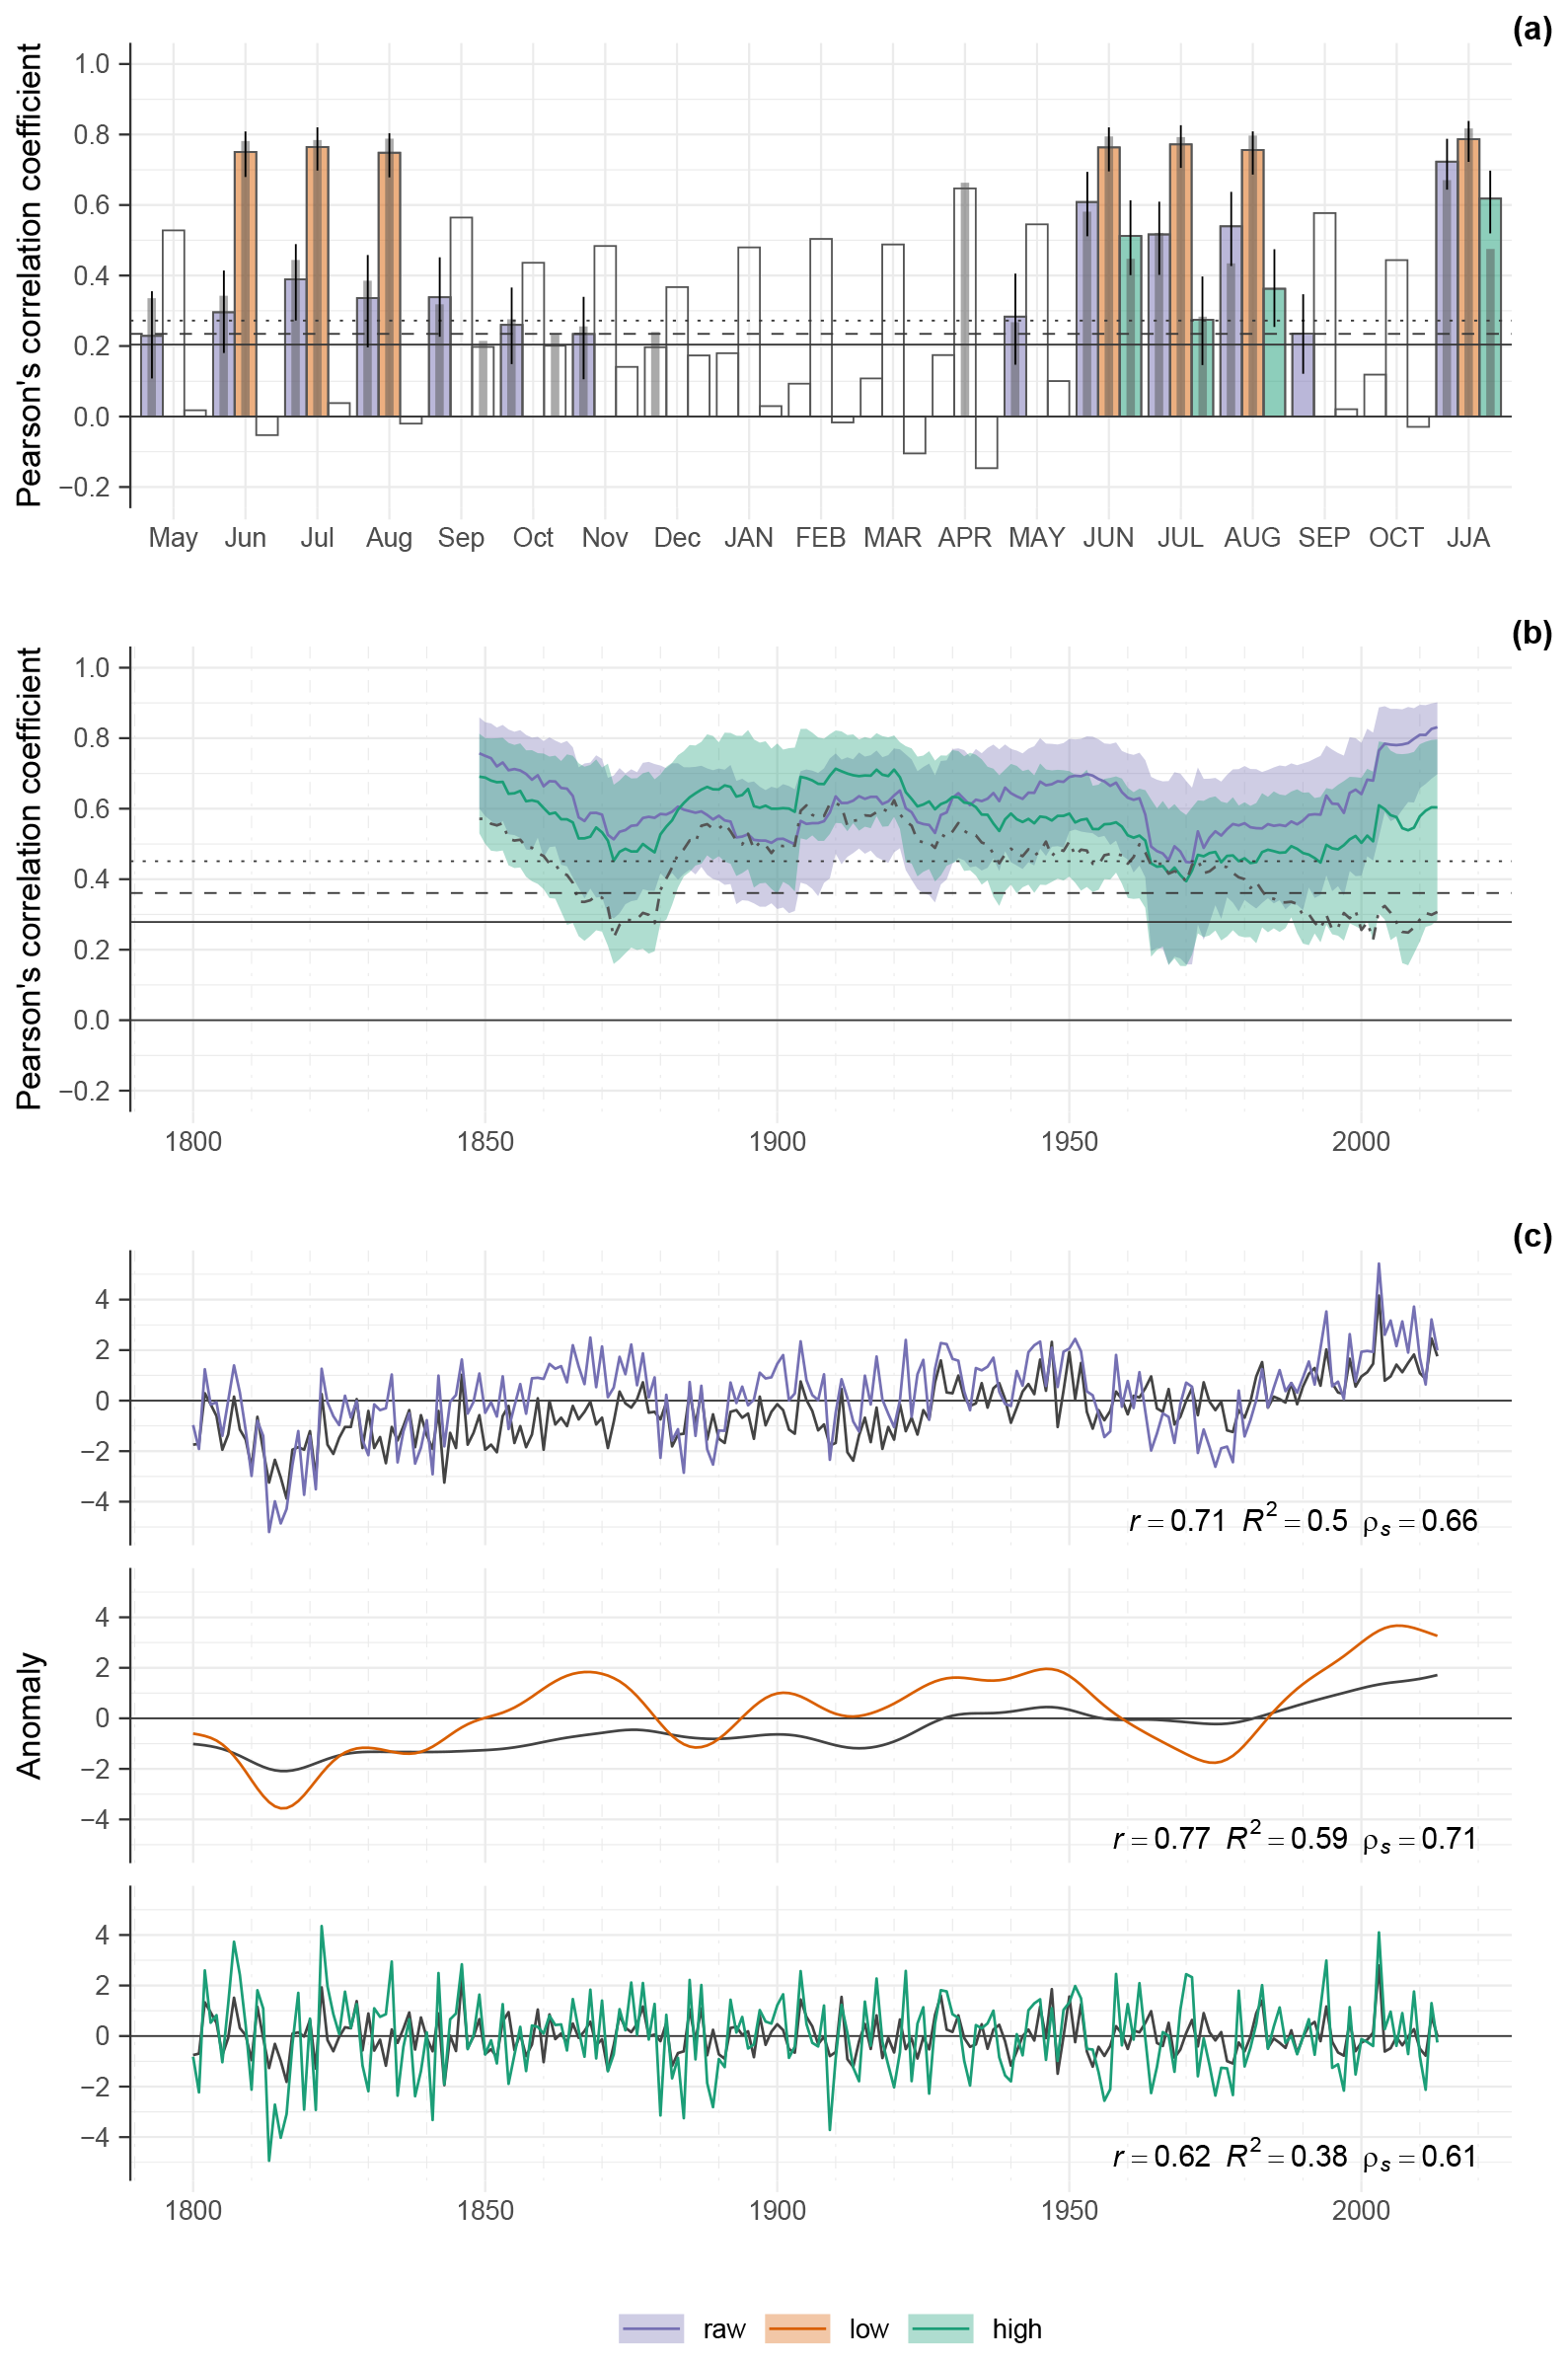
Figure 3Pearson's correlation coefficient between PC1 (ANBO + BARC + PALP) and the mean temperature for the period of 1800–2013. The coloured (BI) and dark-grey shaded (TRW) bars indicate that the correlation values are significant at least at the 0.05 level (note that the significance level for low-frequency data is notably higher due to the loss of degrees of freedom and is not shown as a horizontal threshold for clarity). White bars indicate a not significant correlation value. The solid black vertical line indicates the 95 % confidence interval of the BI correlations. All capitalized month abbreviations indicate the current year (a). Pearson's moving correlation coefficient (50-year window, 1-year step, right-aligned) between PC1 (ANBO + BARC + PALP) and the JJA mean temperature. The shaded area represents the 95 % confidence interval. The dot-dashed dark-grey line refers to the TRW moving correlation in the high-frequency domain for comparison (b). PC1 (ANBO + BARC + PALP) and JJA mean temperature anomalies (grey line) and their Pearson's correlation coefficient (r), explained variance (R2), and Spearman's correlation coefficient (ρs) (c). The solid, dashed, and dotted black lines in panels (a) and (b) represent significance at the 0.05, 0.01, and 0.001 levels, respectively. For interpretation of the references to colour in this figure legend, the reader is referred to the web version of this article.
The correlations of the raw data estimated over the whole period (Fig. 3a) show significant positive correlations with the temperatures of the previous summer and autumn (i.e. May–November of the previous year) and with those of the current late spring and summer (i.e. May–September of the current year). The correlations with the current spring and summer temperatures returned higher values than the correlations with the previous summer and autumn temperatures; the correlation with the mean temperature of JJA returned the highest value (0.71, 95 % confidence interval: [0.62–0.78]; Table S1). In the low-frequency domain, the correlation was always significant and positive, with the highest values occurring in the summer (JJA) of the current year (0.77, [0.70–0.82]) and the summer of the previous year. Finally, for the high-frequency domain, the highest correlation value was obtained with the mean temperature of JJA of the current year (0.62, [0.52–0.70]).
The moving window analysis between PC1 (ANBO + BARC + PALP) and the JJA mean temperature revealed significant and stable correlation values at the 0.01 level when considering the raw data and high-frequency domain (Fig. 3b). Regarding the low-frequency domain, interpreting its significance is challenging, particularly given the loss of degrees of freedom caused by the applied smoothing function. The correlation values of the high-frequency domain, beyond their decadal variability, showed a general negative trend (Mann–Kendall S: –4124; p-value < 0.001; reference period: 1800–2013). However, after a minimum was observed in the 1921–1970 window, a significant upward trend was appreciable (Mann–Kendall S: 728; p-value < 0.001 on the windows ending in the 1971–2013 period; Fig. 3b). The high correlation values between PC1 (ANBO + BARC + PALP) and the JJA mean temperature over the examined period are also evident from the comparison of the two time series in Fig. 3c for the raw, high-frequency, and low-frequency domains, with the DBI explaining between 38 % and 59 % of the temperature variance, depending on the considered frequency domain (Fig. 3c).
To highlight the spatial representativeness of our reconstruction, the spatial correlation between the raw data PC1 (ANBO + BARC + PALP) and JJA mean temperature was estimated over the Euro-Mediterranean domain by exploiting the CRU-TS v. 4.07 data (see Sect. 3.2). The results show a positive and significant correlation over central and southern Europe, northern Africa, and the Middle East (p-value < 0.001; Fig. 4a). However, the spatial correlation is not stable over time. In fact, after an initial decrease that limited the significant correlation values to the areas around the Mediterranean Basin until the beginning of the 1990s, a strong and rapid increase was observed (Fig. S8). Considering the high-frequency domain, significant correlation values were observed over much of the western and central Mediterranean Basin (i.e. from 15° W to 25° E) and from northwestern Africa to central Europe (i.e. from 23 to 53° N; Fig. 4b). Regarding their stability over time, significant values decreased from the central and western Mediterranean and Europe (1955 CE window) to an area that involved mainly Italy, the western Mediterranean, and Algeria in the 2010s (Fig. S9).
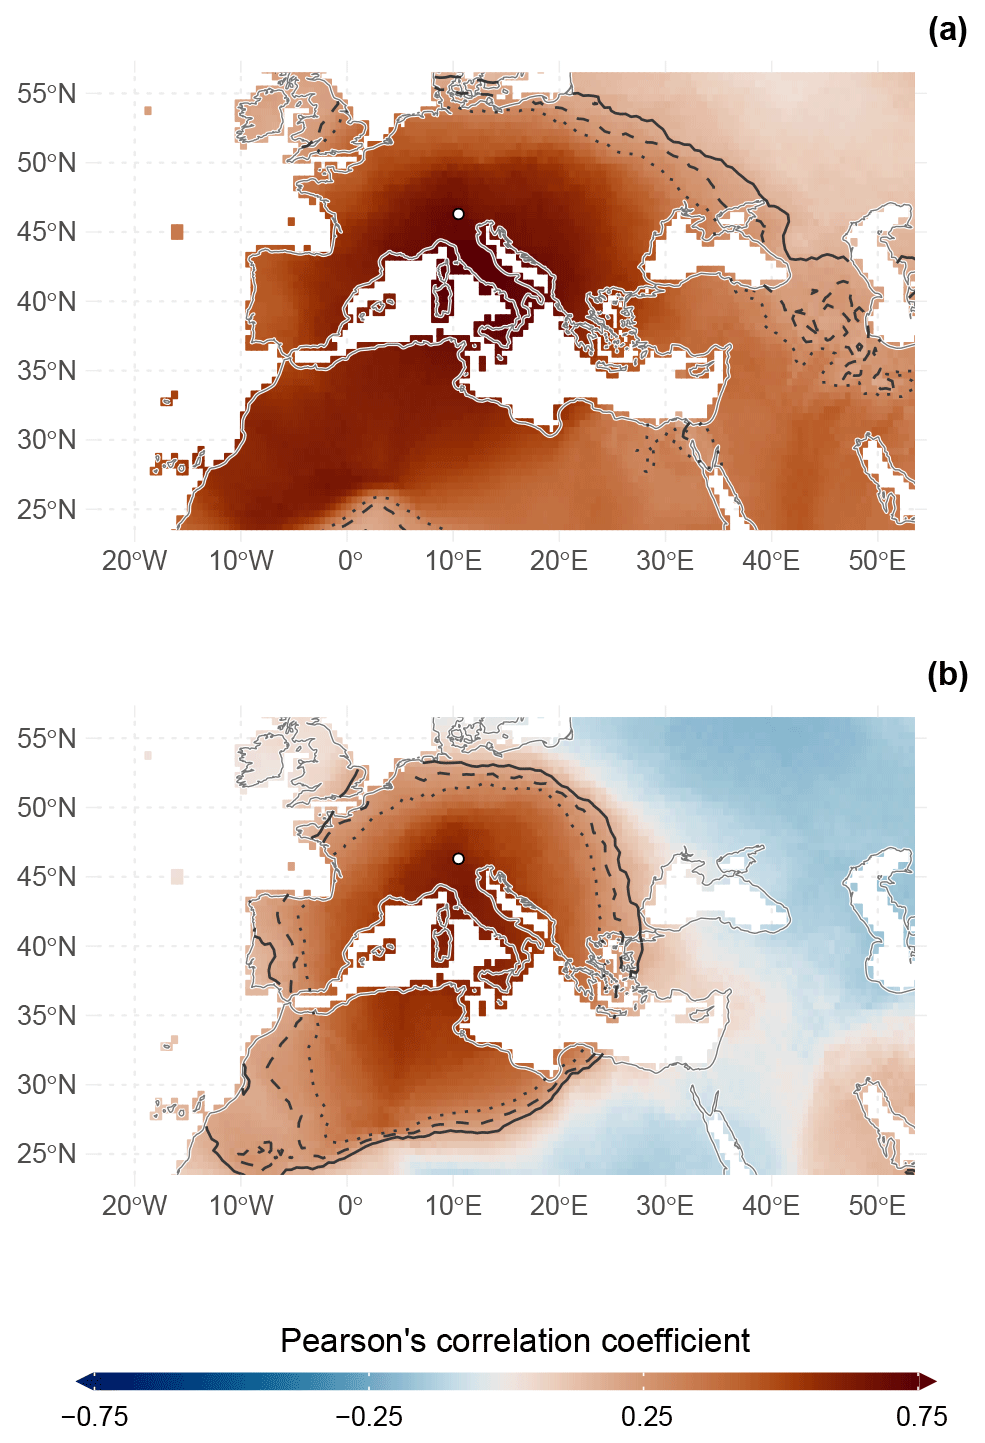
Figure 4Pearson's spatial correlation coefficient between PC1 (ANBO + BARC + PALP) and the CRU TS4.07 mean aggregated JJA temperature for the period 1901–2013 for the raw series (a) and high-frequency domain (b). The solid, dashed, and dotted black lines represent significance levels of 0.05, 0.01, and 0.001, respectively. The white dots represent the locations of the sampling stands. For interpretation of the references to colour in this figure legend, the reader is referred to the web version of this article.
4.2 Mean June–August temperature reconstruction
Based on the results described above, JJA temperature reconstruction was attempted starting from DBI PC1 (ANBO + BARC + PALP). The transfer function was tested using both the CCV and BTFS approaches, which returned stable results in the high-frequency domain, whereas nonstationarity of the transfer function was highlighted for the raw data and low-frequency domain (Table 2). Considering the CCV results, the amount of explained variance was similar for both 1800–1906 and 1907–2013 as the calibration period. The same was true for the RE coefficients, which returned positive values with limited standard deviations. In contrast, the CE values were positive only for the high-frequency domain. The CCV results were corroborated by the results obtained by the more rigorous BTFS tests. Excluding the low-frequency domain, only in one case (i.e. the raw data intercept ratio) did the calculated 95 % confidence interval fail to pass the test, thus indicating a difference in offset between the two considered calibration periods (i.e. calibration and validation). Similar results were also obtained for DBI PC1 (ANBO + PALP) and DBI ANBO chronology-based reconstructions (Tables S2 and S3). Finally, the Durbin–Watson test returned significant results for the low-frequency domain and for the regression that used the more recent half of the raw data as the calibration period, thus highlighting a nonzero autocorrelation in the residuals of these models.
Table 2Explained variances in the calibration periods and statistical parameters of the CCV and BTFS procedures between PC1 (ANBO + BARC + PALP) and the JJA mean temperature. Italicized values identify parameters that do not pass the statistical tests (at the 95 % level, when applicable).
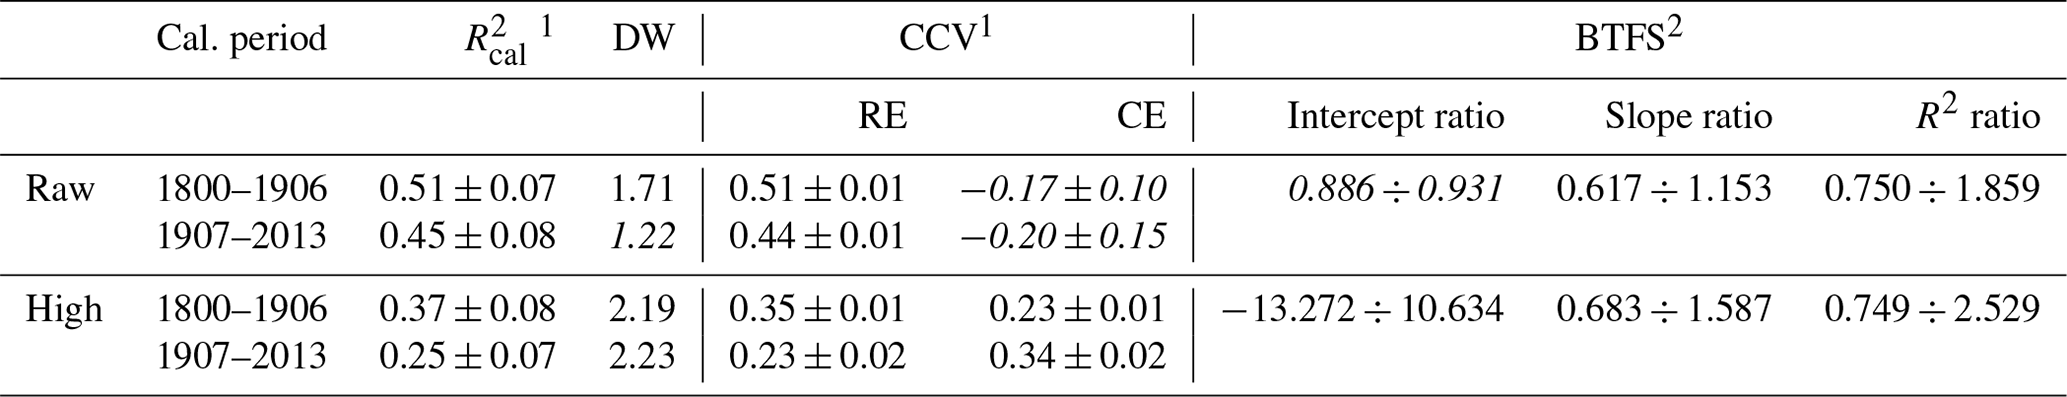
1 We report 1 standard deviation as a measure of uncertainty. 2 Confidence intervals at 95 % are reported for BTFS parameters. For a detailed description of the BTFS parameters, please refer to Buras et al. (2017).
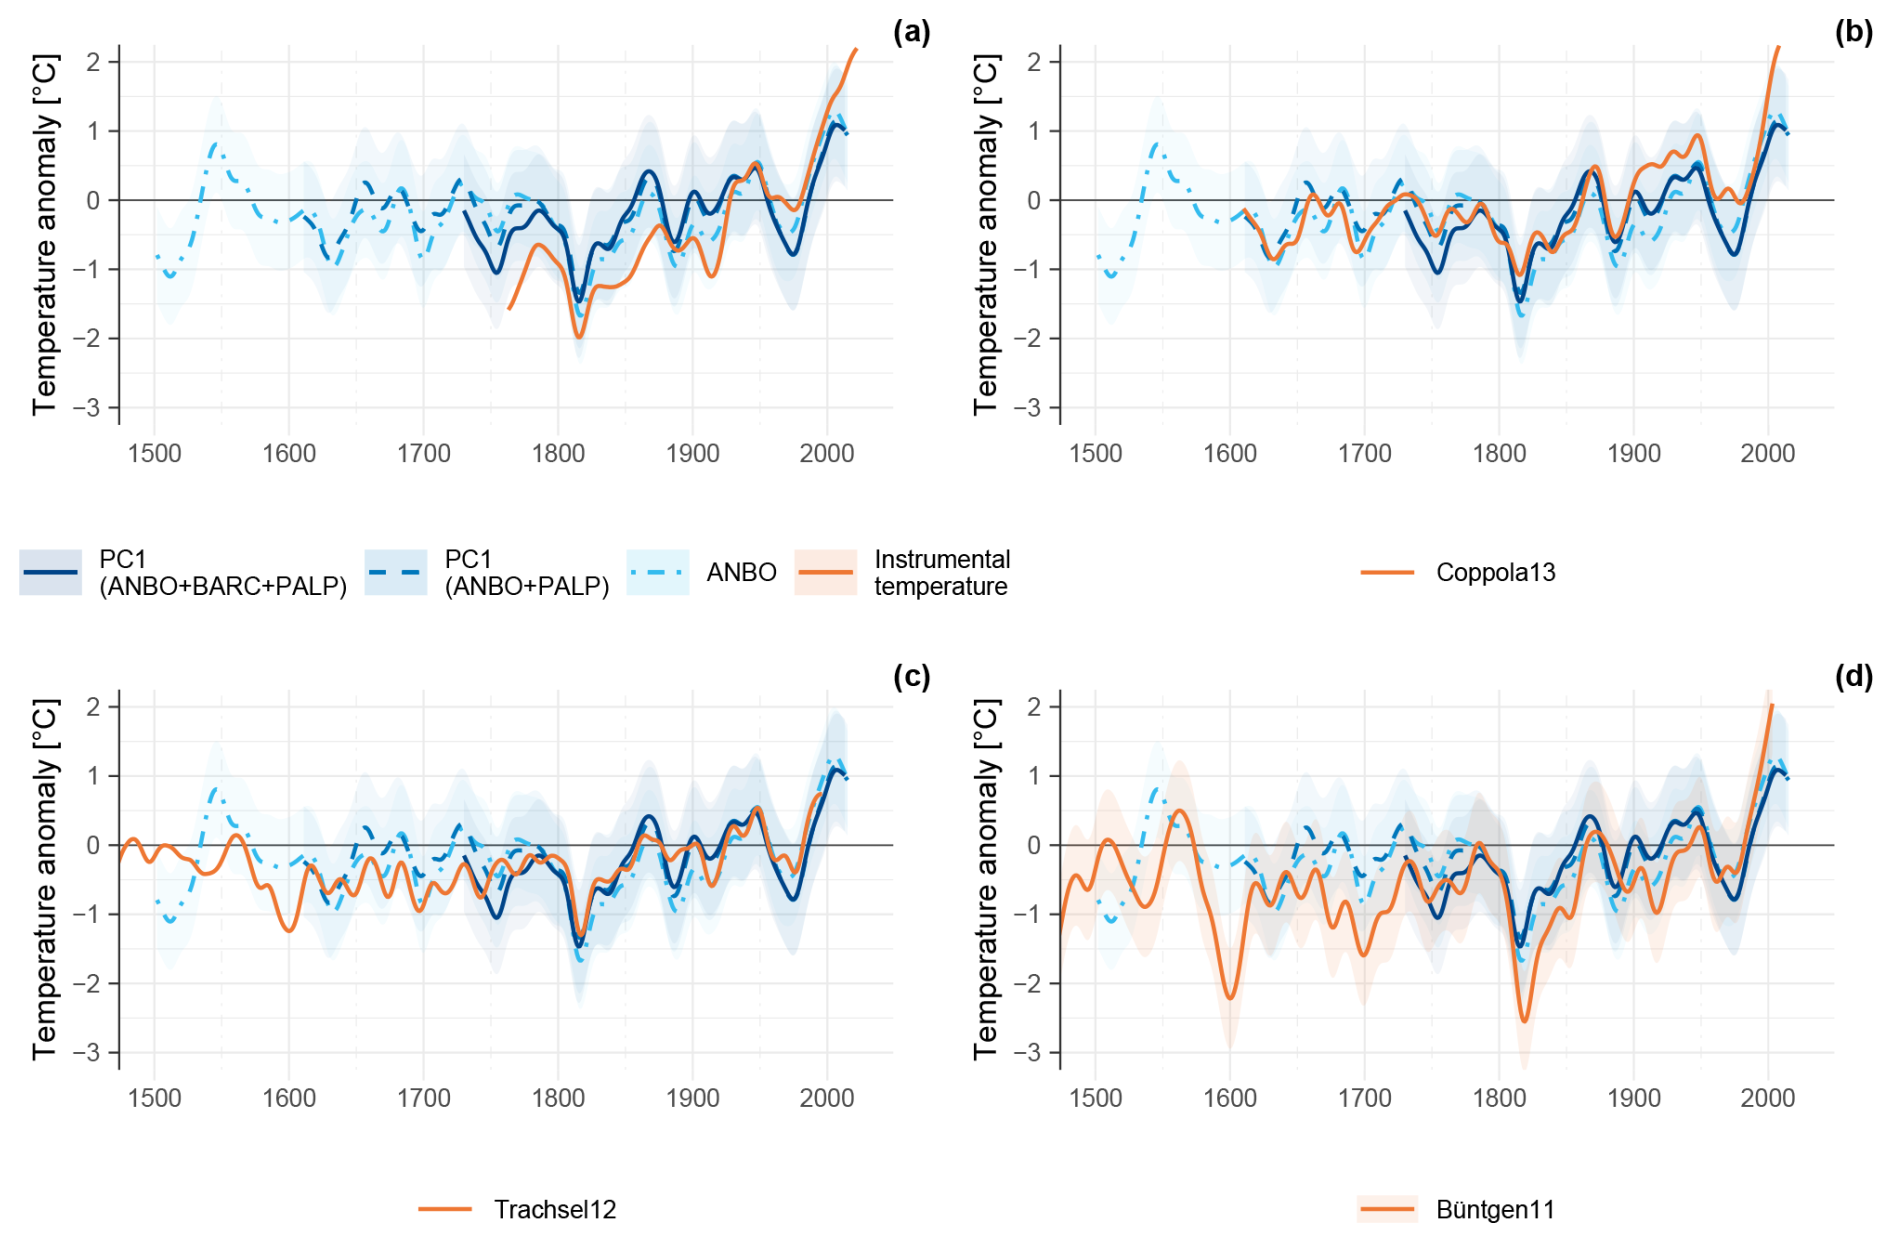
Figure 5Comparison between DBI PC1 and meteorological data (a) or the previously published JJA reconstruction (b–d). The solid, dashed, and dotted blue lines are the JJA reconstructions performed considering the DBI PC1 of ANBO, BARC and PALP (1730–2013), ANBO and PALP (1611–2015), and only the ANBO chronology (1502–2015), respectively. The shaded area identifies the lower and upper confidence intervals at 95 %, where available. For interpretation of the references to colour in this figure legend, the reader is referred to the web version of this article.
According to the PC1 (ANBO + BARC + PALP) JJA reconstruction (1730–2013 CE) based on raw data, periods of negative temperature anomalies, with 1901–2000 as the reference period, were obtained in the 1740s–1850s, 1880s–1910s, and 1960s–1980s (Fig. 5). The PC1 (ANBO + PALP) reconstruction (extending back to 1611 CE, lengthening the previous by 119 years) reported negative anomalies in the 1610s–1640s, 1660s, and 1690s–1710s, in addition to those reported by PC1 (ANBO + BARC + PALP; Fig. 5). The reconstruction performed considering only the ANBO DBI site chronology (extending back to 1502 CE, lengthening the reconstruction based on PC1 (ANBO + BARC + PALP) by 228 years) revealed negative anomalies in the 1500s–1520s and 1570s–1670s, in addition to those reported in other proposed reconstructions (Fig. 5). These cool periods were intercalated by periods with positive anomalies. Starting in the 2000s, the reconstructed temperature anomalies exceeded the symbolic threshold of +1 °C over the 1901–2000 mean. Interestingly, after the 1850s, the number of years with particularly negative anomalies (i.e. anomalies whose values deviate by at least 2 standard deviations from the reconstruction 1901–2000 anomaly mean) rapidly decreased, whereas the number of years with exceptionally positive anomalies increased (Table 3).
Table 3Particularly cold or warm years in which anomaly values differ by at least 2 standard deviations from the mean of the reference period (1901–2000).

The data presented here are, to our knowledge, the first attempt to use European larch BI data for dendroclimatic purposes. In fact, currently, only one study has used BI data for this species (Arbellay et al., 2018); moreover, considering other alpine species, only a few studies have explored the BI–climate relationships in this area (Cerrato et al., 2023; Frank and Nicolussi, 2020; Österreicher et al., 2014; Trachsel et al., 2012; Babst et al., 2009). This gap in knowledge implies that no standard procedures exist for researching samples. In this study, according to Wilson et al. (2021, 2019, 2014) and others (Heeter et al., 2020; Arbellay et al., 2018; Dolgova, 2016; Dannenberg and Wise, 2016), the samples were not treated with solvent for resin and extractive removal. It is known that, in resinous species, the presence of resins and other extractives could hamper BI measurements (Wilson et al., 2021; Rydval et al., 2014); on the other hand, in some species, the creation of DBI chronologies successfully corrects the issues due to the discolouration that occurs at the heartwood–sapwood transition and in resinous zones of the samples (Reid and Wilson, 2020; Fuentes et al., 2018; Wilson et al., 2017a; Björklund et al., 2015, 2014). The larch DBI chronologies obtained in this study did not exhibit sharp differences in values between sapwood and heartwood (Fig. 2) compared with the EWBI and LWBI chronologies.
This led to the conclusion that, unlike for other species (e.g. Pinus sylvestris and Manoao colensoi; Seftigen et al., 2020; Blake et al., 2020; Fuentes et al., 2018), the creation of a DBI chronology in the European larch could be suitable for correcting discolouration bias due to the heartwood–sapwood transition, at least for samples collected from living individuals not affected by fungal or bacterial activity or decay. This hypothesis is also corroborated by the moving correlation analysis, which shows a rapid decrease in correlation values at the most recent end when considering the EWBI PC1 (ANBO + BARC + PALP) and LWBI PC1 (ANBO + BARC + PALP) chronologies. In contrast, DBI PC1 (ANBO + BARC + PALP) showed an upward trend in correlation values (Fig. 3). Our results strengthen the hypothesis that, if the EWBI and LWBI are influenced by diachronic or different climate parameters (e.g. precipitation and/or temperature), the use of the DBI emphasizes climate signals (Blake et al., 2020). In fact, considering the high-frequency domain, the EWBI PC1 (ANBO + BARC + PALP) results are affected by the current July and April mean temperatures, whereas the LWBI is influenced by the current June–August and JJA mean temperatures.
Although the data collected for this study suggest that the creation and use of DBI significantly mitigate discolouration issues occurring at the heartwood–sapwood transitions in European larch samples, this does not imply that the removal of resins and extractives is unnecessary. Instead, it underscores the need for further analysis because no information is currently available on how resins and extractives affect the EWBI and LWBI time series derived from European larch samples. Additionally, resin abundance can vary greatly at a local scale and may not be comparable between earlywood and latewood; therefore it influences the DBI time series. To better understand the influence of resins and extractives on BI – in heartwood, sapwood, and their transition zone – a specifically designed scientific investigation is required.
5.1 BI–climate correlation
The correlation analyses highlighted the strong influence of the summer (i.e. June to August) monthly mean temperature on the single-site chronologies and specially on the PC1 (ANBO + BARC + PALP) chronology (Fig. 3a). These high correlation values with monthly mean temperatures and even greater correlations with JJA mean temperatures indicate that the signal observable in the chronology is due to the influence of this specific climatic parameter on tree growth. These observations indicate that BI responds to the same limiting factors that affect other well-studied tree-ring parameters (e.g. maximum wood density and total ring width), both in the area (Cerrato et al., 2018; Coppola et al., 2013) and in the Alps (Leonelli et al., 2016; Büntgen et al., 2011, 2006, 2005; Frank and Esper, 2005), even if spatial and/or physiological heterogeneity in the climate response within the species may exist (Saulnier et al., 2019; Carrer and Urbinati, 2004). PC1 (ANBO + BARC + PALP) can explain up to 38.4 % (26.7 %–48.5 %) of the JJA mean temperature variance in the study area; this result is 70 % greater than the percentage of temperature variance explained by TRW in the area (Cerrato et al., 2018) and, depending on the reference period, is comparable to the results obtained by using MXD data (Büntgen et al., 2006). This finding reinforces the idea that DBI could also be considered a better predictor than the ring width for summer temperatures for the European larch.
The moving correlation function between PC1 (ANBO + BARC + PALP) and the mean temperature (Fig. 3b) shows a relatively stable correlation in the raw data and in the high-frequency domain. Previous TRW-based studies in the same area (Cerrato et al., 2018; Coppola et al., 2013, 2012) have indicated a reduction in the correlation between tree-ring parameters and climate since the 1960s; this correlation reduction is known as the “divergence problem” (Anchukaitis et al., 2017; Wilson et al., 2016; D'Arrigo et al., 2008; Büntgen et al., 2008, 2006). Our results showed that, compared with the use of TRW chronologies, the use of BI data mitigated the influence of divergence (Cerrato et al., 2018; Coppola et al., 2012), as similarly reported for Swiss stone pine in the same area (Cerrato et al., 2023), for Norway spruce (Picea abies (L.) H. Karst.) in the Carpathians (Buras et al., 2018), and for white spruce (Picea glauca (Moench) Voss) in the Yukon in North America (Wilson et al., 2019). In fact, in recent decades, contrary to the correlation values obtained between TRW and mean temperatures, the correlation values between BI data and mean temperature increased, highlighting the reduced effect of the “divergence problem” on the raw data and in the high-frequency domain (Fig. 3b).
Spatial correlations highlight that the BI data are representative not only of the local temperature but also, as expected, of the spatial homogeneity of this climatic parameter (Brunetti et al., 2006), which is also representative of a broader area (Fig. 4). The temporal variability in the spatial correlation values reflects the same variability observed with the moving correlation analysis at the local scale both in the raw data and in the high-frequency domain. In fact, the spatial correlation values obtained from the analysis of the raw data show greater variation than those obtained from the analysis in the high-frequency domain. This finding is also consistent with the results of the CCV, BTFS, and Durbin–Watson tests performed at the local scale; these results revealed the nonstationarity of the regression intercept between the calibration and verification periods and thus a not completely neglectable influence of the low-frequency domain on the raw data. In fact, the influence of the low-frequency domain on the raw data is not only inferred locally but also spatially represented by a rapid spatial increase in the significant correlation values in the most recent decades. In contrast, the spatiotemporal variability in correlation values in the high-frequency domain is more limited; this variability is consistent with results obtained at the local scale, thus indicating the stability of the transfer function and thus the reliability of the BI data in the high-frequency domain, as also demonstrated for other species in both the Northern and Southern hemispheres (Wilson et al., 2021).
5.2 Mean June–August temperature reconstruction
The PC1s and the ANBO chronologies showed good predictive ability (Table 3; Tables S2 and S3 in the Supplement), especially in the high-frequency domain. All the tested chronologies had positive RE values, whereas the CE values were positive in the high-frequency domain and slightly negative considering the raw PC1 (ANBO + BARC + PALP) and PC1 (ANBO + PALP) data. These results highlight the potential of DBI chronologies as proxies for the selected target climatic factor under certain conditions. These findings are corroborated by more rigorous BTFS tests (Buras et al., 2017), where the PC1's raw chronologies exhibit instability in terms of the regression offset parameter (Table 3), implying weak nonstationarity in the trend (described by scenario I in Buras et al., 2017). The nonstationarity of tree-ring proxies is widespread, and its presence in BI data has already been assessed in other species (e.g. Engelmann spruce, Picea engelmannii Parry ex Engelm. (Wilson et al., 2014); Scot pine, Pinus sylvestris L. (Rydval et al., 2016); and Swiss stone pine (Cerrato et al., 2023)), reflecting complex biological environmental growth interactions (Wilmking et al., 2020) and complex interactions among abiotic entities (i.e. glaciers), biological growth, and the environment (Cerrato et al., 2020; Leonelli et al., 2011). Analysis in the high-frequency domain, however, always passes the BTFS tests but at the expense of the retained low frequency, which is relevant for climatic reconstructions (Esper et al., 2002) and must be reintegrated to obtain reliable long-term reconstructions (Rydval et al., 2016).
Based on these assumptions, raw data-based reconstructions were performed considering PC1s and ANBO chronologies, supposing that the weak nonstationarity of the transfer function returned more useful information than that obtained by the deletion of the entire low-frequency band, at least at this preliminary stage of the study. A comparison between the reconstructed JJA temperature and both instrumental data (Fig. 5a) and previously proposed reconstructions (Fig. 5b–d) reveals good agreement between the considered series. Generally, the DBI-based JJA temperature reconstruction proposed here returns completely comparable anomalies. The slight overestimation of the anomalies is noticeable when the comparison with instrumental data or maximum wood-density-based reconstruction is considered (Fig. 5a and d), as exclusion of the more recent period, where an underestimation occurs. Regarding the recent observed trend, it is important to note that it coincides with a period characterized by the heartwood–sapwood transition in most of the samples used. Although the use of the DBI mitigates the discolouration issue, the notably good agreement between the BI and meteorological data may still be influenced by these conditions. However, it is currently not possible to determine whether, in the future, when the current sapwood will become part of the heartwood, the strong correspondence between the proposed proxy and the meteorological data will persist. Nevertheless, local tree-ring-based and multiproxy-based reconstructions (Fig. 5b–c) corroborate the validity of the proposed BI-based reconstruction, agreeing well with respect to the trend and within the calculated RMSE. In fact, the highest concordance was observed with local data obtained by total ring width reconstruction (Coppola et al., 2013), based on chronologies from adjacent valleys to those sampled for this study and from multiproxy-based reconstruction (Trachsel et al., 2012).
When we analysed the PC1-based reconstructed decadal variabilities, these variations were corroborated by well-known climatic dynamics in the Alps. In fact, the cold phases reconstructed between the 17th and 19th centuries agree well with the known local acmes of the Little Ice Age (LIA), a period well known for colder climatic conditions. During the LIA, the glaciers in the area and along the entire alpine range reached their Holocene maximum extension, even if diachronically within the 17th to mid-19th centuries (Cerrato et al., 2020; Zemp et al., 2015; Carturan et al., 2014, 2013). Regarding the oldest portion of the ANBO raw-based reconstruction, the variability in the anomalies is very similar to that reported by total-ring-width-based reconstruction (Cerrato et al., 2018) and is probably influenced by anthropogenic activities and wood harvesting and/or management performed in the area in the 16th century (Backmeroff, 2001). Moreover, despite the gap-filling procedure applied to the BI core series (Büntgen et al., 2006), some of the particularly negative anomalies observed are coeval to LBM outbreaks reported in the surrounding area (i.e. 1753/54, 1821, 1830, 1838, 1841, 1880, 1884, 1888/89, and 1909 CE; Table 3; Cerrato et al., 2019b; Arbellay et al., 2018; Büntgen et al., 2009; Baltensweiler and Rubli, 1999).
After the coolest phases of the LIA, a progressive noncontinuous increase in the reconstructed JJA anomalies is evident and is corroborated by other reconstructions and instrumental data (Fig. 5). In fact, JJA temperature anomalies started to increase in the 1850s, with a major hiatus occurring during the 1970s–1980s. This latter cooling phase is corroborated by instrumental data, other reconstructions, and environmental evidence that reported the last readvance of some glaciers in the area during this period (Salvatore et al., 2015). After the 1980s, the highest anomaly values of the entire series were reported, in accordance with more recent climate dynamic evidence (IPCC, 2018). Indeed, during this last phase, most of the positive anomalies are identified (Table 3), and they almost correspond with years that are known for their exceptionally warm temperatures across the European Alps (IPCC, 2018; Beniston, 2004; Fink et al., 2004).
In this paper, we focus on the employment of the European larch within the Southern Rhaetian Alps, thus demonstrating its potential for providing insights into the region's climate history. Specifically, we explored the application of blue intensity (BI), a relatively novel technique, to obtain a proxy with predictive skills like those shown by using MXD data. In this context, the application of BI data analysis offers a promising tool for enhancing our understanding of past climate dynamics in the study area and regionally by providing information additional to that retrieved from other methodologies (e.g. TRW, MXD, and wood anatomical traits and isotopes). In fact, the obtained results show that the BI data are representative of the mean JJA temperature at both the local and regional scale. The obtained data and their predictive ability are supported by the positive results obtained by more rigorous tests of regression stationarity, thus highlighting the positive predictive ability of BI for the European larch and for other coniferous species already tested in the area and worldwide, at least in the high-frequency domain. Although the results obtained from using BI from the European larch to reconstruct temperature changes are very encouraging, methodological studies are certainly worthy of further investigation. Particular attention must be given to the effects of (i) removing extractives, (ii) adjusting BI values (Björklund et al., 2015), (iii) scanning resolution and BI frame size, and (iv) regional curve standardization (Helama et al., 2017) combined (or not) with a signal-free approach (McPartland et al., 2020; Melvin and Briffa, 2008). On the other hand, opening the possibility of integrating the use of BI data with more traditional dendrochronological techniques applied to the European larch in the Alps, the methods we employed represent not only a first step towards promoting the use of BI data as a surrogate of MXD in the European Alps but also the possibility of obtaining MXD-like data from more laboratories to address critical questions related to historical climate variations in the Alpine region.
The corresponding author can be contacted if individuals would like to access the code so that we can provide clear caveats.
Data utilized in this article are available at ITRDB as ITAL050 (ANBO TRW; https://doi.org/10.25921/hw52-rp85, Cerrato and Baroni, 2018), ITA072 (ANBO BI; https://doi.org/10.25921/868n-2d38, Cerrato et al., 2025a), ITA073 (BARC TRW and BI; https://doi.org/10.25921/j2vd-tn67, Cerrato et al., 2025b), and ITA074 (PALP TRW and BI; https://doi.org/10.25921/a4kb-dq50, Cerrato et al., 2025c).
The supplement related to this article is available online at https://doi.org/10.5194/cp-21-609-2025-supplement.
RC: conceptualization (equal), data curation (equal), formal analysis, investigation (lead), methodology (lead), project administration, visualization, and writing (original draft). MCS: conceptualization (equal), data curation (equal), supervision (equal), and writing (review and editing; equal). MB: data curation (equal), methodology (supporting), and writing (review and editing; equal). AS: investigation (supporting). CB: conceptualization (equal), funding acquisition, resources, supervision (equal), and writing (review and editing; equal).
The contact author has declared that none of the authors has any competing interests.
Any use of trade, firm, or product names is for descriptive purposes only and does not imply endorsement by the involved universities.
Publisher's note: Copernicus Publications remains neutral with regard to jurisdictional claims made in the text, published maps, institutional affiliations, or any other geographical representation in this paper. While Copernicus Publications makes every effort to include appropriate place names, the final responsibility lies with the authors.
This research was supported by the Laboratory of Dendrochronology of the Department of Earth Sciences (University of Pisa). We are very grateful to Gino Delpero and Luca Colato, Custodi Forestali of Comune di Vermiglio, and to the staff of the Stazione Forestale of the Comune di Ossana (TN) for helping in field activities and sampling. We wish to thank Fabio Angeli, responsible for the Ufficio Distrettuale Forestale di Malè (TN), for sampling permission. The scientific colour maps are used in this study to prevent visual distortion of the data and exclusion of readers with colour-vision deficiencies. We thank Odile Peyron (the editor), Jesper Björklund, and the three anonymous reviewers for their constructive comments and suggestions, which helped improve the article.
This research has been supported by the University of Pisa (research grants Ateneo 2017–2019 to Carlo Baroni and Maria Cristina Salvatore); the PhD Course in Earth Sciences of the University of Pisa, 30th Cycle; and the project of strategic interest NEXTDATA (PNR National Research Programme 2011–2013; project coordinator Antonello Provenzale CNR–IGG, WP 1.6, leader Carlo Baroni UNIPI and CNR–IGG).
This paper was edited by Odile Peyron and reviewed by Jesper Björklund and three anonymous referees.
Anchukaitis, K. J., Wilson, R., Briffa, K. R., Büntgen, U., Cook, E. R., D'Arrigo, R. D., Davi, N., Esper, J., Frank, D. C., Gunnarson, B. E., Hegerl, G., Helama, S., Klesse, S., Krusic, P. J., Linderholm, H. W., Myglan, V. S., Osborn, T. J., Zhang, P., Rydval, M., Schneider, L., Schurer, A., Wiles, G. C., and Zorita, E.: Last millennium Northern Hemisphere summer temperatures from tree rings: Part II, spatially resolved reconstructions, Quaternary Sci. Rev., 163, 1–22, https://doi.org/10.1016/j.quascirev.2017.02.020, 2017.
Andreis, C., Armiraglio, S., Caccianiga, M., Bortolas, D., and Broglia, A.: Pinus Cembra L. nel settore sud-Alpino Lombardo (Italia Settentrionale), Nat. Brescia. – Ann. Mus. Civ. Sc. Nat., Brescia, 34, 19–39, 2005.
Arbellay, E., Jarvis, I., Chavardès, R. D., Daniels, L. D., and Stoffel, M.: Tree-ring proxies of larch bud moth defoliation: Latewood width and blue intensity are more precise than tree-ring width, Tree Physiol., 38, 1237–1245, https://doi.org/10.1093/treephys/tpy057, 2018.
Auer, I., Böhm, R., Jurkovic, A., Lipa, W., Orlik, A., Potzmann, R., Schöner, W., Ungersböck, M., Matulla, C., Briffa, K. R., Jones, P., Efthymiadis, D., Brunetti, M., Nanni, T., Maugeri, M., Mercalli, L., Mestre, O., Moisselin, J.-M., Begert, M., Müller-Westermeier, G., Kveton, V., Bochnicek, O., Šťastný, P., Lapin, M., Szalai, S., Szentimrey, T., Cegnar, T., Dolinar, M., Gajic-Capka, M., Zaninović, K., Majstorović, Ž., and Nieplova, E.: HISTALP – historical instrumental climatological surface time series of the Greater Alpine Region, Int. J. Climatol., 27, 17–46, https://doi.org/10.1002/joc.1377, 2007.
Babst, F., Frank, D. C., Büntgen, U., Nievergelt, D., and Esper, J.: Effect of sample preparation and scanning resolution on the Blue Reflectance of Picea abies, TRACE–Tree Rings Archaeol. Climatol. Ecol., 7, 188–195, 2009.
Backmeroff, C. E.: Historical land-use and upper timberline dynamics determined by a thousand-year larch chronology made up of charcoal fragments from kilns and ancient trees, in: 2001. International Conference Tree rings and people, Davos, Switzerland, 22–26 September 2001, Abstracts, edited by: Kaennel Dobbertin, M. and Bräker, O. U., Birmensdorf, Swiss Federal Research Institute WSL, 1–2, 2001.
Baltensweiler, W. and Rubli, D.: Dispersal: an important driving force of the cyclic population dynamics of the larch bud moth, Zeiraphera diniana Gn., For. Snow Landsc. Res., 74, 3–153, 1999.
Beniston, M.: The 2003 heat wave in Europe: A shape of things to come? An analysis based on Swiss climatological data and model simulations, Geophys. Res. Lett., 31, L02202, https://doi.org/10.1029/2003GL018857, 2004.
Biondi, F. and Waikul, K.: DENDROCLIM2002: A C program for statistical calibration of climate signals in tree-ring chronologies, Comput. Geosci., 30, 303–311, https://doi.org/10.1016/j.cageo.2003.11.004, 2004.
Björklund, J., Gunnarson, B. E., Seftigen, K., Zhang, P., and Linderholm, H. W.: Using adjusted Blue Intensity data to attain high-quality summer temperature information: A case study from Central Scandinavia, Holocene, 25, 547–556, https://doi.org/10.1177/0959683614562434, 2015.
Björklund, J., von Arx, G., Nievergelt, D., Wilson, R., Van den Bulcke, J., Günther, B., Loader, N. J., Rydval, M., Fonti, P., Scharnweber, T., Andreu-Hayles, L., Büntgen, U., D'Arrigo, R., Davi, N., De Mil, T., Esper, J., Gärtner, H., Geary, J., Gunnarson, B. E., Hartl, C., Hevia, A., Song, H., Janecka, K., Kaczka, R. J., Kirdyanov, A. V., Kochbeck, M., Liu, Y., Meko, M., Mundo, I., Nicolussi, K., Oelkers, R., Pichler, T., Sánchez-Salguero, R., Schneider, L., Schweingruber, F., Timonen, M., Trouet, V., Van Acker, J., Verstege, A., Villalba, R., Wilmking, M., and Frank, D.: Scientific Merits and Analytical Challenges of Tree-Ring Densitometry, Rev. Geophys., 57, 1224–1264, https://doi.org/10.1029/2019RG000642, 2019.
Björklund, J., Seftigen, K., Fonti, P., Nievergelt, D., and von Arx, G.: Dendroclimatic potential of dendroanatomy in temperature-sensitive Pinus sylvestris, Dendrochronologia, 60, 125673, https://doi.org/10.1016/j.dendro.2020.125673, 2020.
Björklund, J., Fonti, M. V., Fonti, P., Van den Bulcke, J., and von Arx, G.: Cell wall dimensions reign supreme: cell wall composition is irrelevant for the temperature signal of latewood density/blue intensity in Scots pine, Dendrochronologia, 65, 125785, https://doi.org/10.1016/j.dendro.2020.125785, 2021.
Björklund, J., Seftigen, K., Kaczka, R. J., Rydval, M., and Wilson, R.: A definition and standardised terminology for Blue Intensity from Conifers, Dendrochronologia, 85, 126200, https://doi.org/10.1016/j.dendro.2024.126200, 2024.
Björklund, J. A., Gunnarson, B. E., Seftigen, K., Esper, J., and Linderholm, H. W.: Blue intensity and density from northern Fennoscandian tree rings, exploring the potential to improve summer temperature reconstructions with earlywood information, Clim. Past, 10, 877–885, https://doi.org/10.5194/cp-10-877-2014, 2014.
Blake, S. A. P., Palmer, J. G., Björklund, J., Harper, J. B., and Turney, C. S. M.: Palaeoclimate potential of New Zealand Manoao colensoi (silver pine) tree rings using Blue-Intensity (BI), Dendrochronologia, 60, 125664, https://doi.org/10.1016/j.dendro.2020.125664, 2020.
Böhm, R., Auer, I., Brunetti, M., Maugeri, M., Nanni, T., and Schöner, W.: Regional temperature variability in the European Alps: 1760–1998 from homogenized instrumental time series, Int. J. Climatol., 21, 1779–1801, https://doi.org/10.1002/joc.689, 2001.
Brunetti, M., Maugeri, M., Monti, F., and Nanni, T.: Temperature and precipitation variability in Italy in the last two centuries from homogenised instrumental time series, Int. J. Climatol., 26, 345–381, https://doi.org/10.1002/joc.1251, 2006.
Brunetti, M., Lentini, G., Maugeri, M., Nanni, T., Auer, I., Böhm, R., and Schöner, W.: Climate variability and change in the Greater Alpine Region over the last two centuries based on multi-variable analysis, Int. J. Climatol., 29, 2197–2225, https://doi.org/10.1002/joc.1857, 2009.
Brunetti, M., Lentini, G., Maugeri, M., Nanni, T., Simolo, C., and Spinoni, J.: Projecting North Eastern Italy temperature and precipitation secular records onto a high-resolution grid, Phys. Chem. Earth, Parts A/B/C, 40–41, 9–22, https://doi.org/10.1016/j.pce.2009.12.005, 2012.
Brunetti, M., Maugeri, M., Nanni, T., Simolo, C., and Spinoni, J.: High-resolution temperature climatology for Italy: interpolation method intercomparison, Int. J. Climatol., 34, 1278–1296, https://doi.org/10.1002/joc.3764, 2014.
Buckley, B. M., Hansen, K. G., Griffin, K. L., Schmiege, S., Oelkers, R., D'Arrigo, R. D., Stahle, D. K., Davi, N., Nguyen, T. Q. T., Le, C. N., Wilson, R., and D'Arrigo, R. D.: Blue intensity from a tropical conifer's annual rings for climate reconstruction: An ecophysiological perspective, Dendrochronologia, 50, 10–22, https://doi.org/10.1016/j.dendro.2018.04.003, 2018.
Bunn, A. G.: A dendrochronology program library in R (dplR), Dendrochronologia, 26, 115–124, https://doi.org/10.1016/j.dendro.2008.01.002, 2008.
Bunn, A. G.: Statistical and visual crossdating in R using the dplR library, Dendrochronologia, 28, 251–258, https://doi.org/10.1016/j.dendro.2009.12.001, 2010.
Büntgen, U., Esper, J., Frank, D. C., Nicolussi, K., and Schmidhalter, M.: A 1052-year tree-ring proxy for Alpine summer temperatures, Clim. Dynam., 25, 141–153, https://doi.org/10.1007/s00382-005-0028-1, 2005.
Büntgen, U., Frank, D. C., Nievergelt, D., and Esper, J.: Summer temperature variations in the European Alps, A.D. 755-2004, J. Climate, 19, 5606–5623, https://doi.org/10.1175/JCLI3917.1, 2006.
Büntgen, U., Frank, D. C., Wilson, R., Carrer, M., Urbinati, C., and Esper, J.: Testing for tree-ring divergence in the European Alps, Glob. Chang. Biol., 14, 2443–2453, https://doi.org/10.1111/j.1365-2486.2008.01640.x, 2008.
Büntgen, U., Frank, D. C., Liebhold, A. M., Johnson, D. M., Carrer, M., Urbinati, C., Grabner, M., Nicolussi, K., Levanič, T., and Esper, J.: Three centuries of insect outbreaks across the European Alps, New Phytol., 182, 929–941, https://doi.org/10.1111/j.1469-8137.2009.02825.x, 2009.
Büntgen, U., Tegel, W., Nicolussi, K., McCormick, M., Frank, D. C., Trouet, V., Kaplan, J. O., Herzig, F., Heussner, K.-U., Wanner, H., Luterbacher, J., and Esper, J.: 2500 Years of European Climate Variability and Human Susceptibility, Science, 331, 578–582, https://doi.org/10.1126/science.1197175, 2011.
Buras, A., Zang, C., and Menzel, A.: Testing the stability of transfer functions, Dendrochronologia, 42, 56–62, https://doi.org/10.1016/j.dendro.2017.01.005, 2017.
Buras, A., Spyt, B., Janecka, K., and Kaczka, R. J.: Divergent growth of Norway spruce on Babia Góra Mountain in the western Carpathians, Dendrochronologia, 50, 33–43, https://doi.org/10.1016/j.dendro.2018.04.005, 2018.
Camiz, S. and Spada, F.: Checking the stability of correlation of chronologies over time: an example on Pinus pinea L. rings widths, Ann. Silvic. Res., 49, 13–23, https://doi.org/10.12899/asr-2455, 2023.
Camiz, S., Spada, F., Denimal, J. J., and Piraino, S.: Hierarchical factor classification of dendrochronological time-series, Ann. Silvic. Res., 45, 62–75, https://doi.org/10.12899/asr-1968, 2020.
Carrer, M. and Urbinati, C.: Age-dependent tree-ring growth responses to climate in Larix decidua and Pinus cembra, Ecology, 85, 730–740, https://doi.org/10.1890/02-0478, 2004.
Carrer, M., Dibona, R., Prendin, A. L., and Brunetti, M.: Recent waning snowpack in the Alps is unprecedented in the last six centuries, Nat. Clim. Chang., 13, 155–160, https://doi.org/10.1038/s41558-022-01575-3, 2023.
Carturan, L., Dalla Fontana, G., and Borga, M.: Estimation of winter precipitation in a high-altitude catchment of the Eastern Italian Alps: Validation by means of glacier mass balance observations, Geogr. Fis. e Din. Quat., 35, 37–48, https://doi.org/10.4461/GFDQ.2012.35.4, 2012.
Carturan, L., Baroni, C., Becker, M., Bellin, A., Cainelli, O., Carton, A., Casarotto, C., Dalla Fontana, G., Godio, A., Martinelli, T., Salvatore, M. C., and Seppi, R.: Decay of a long-term monitored glacier: Careser Glacier (Ortles-Cevedale, European Alps), The Cryosphere, 7, 1819–1838, https://doi.org/10.5194/tc-7-1819-2013, 2013.
Carturan, L., Baroni, C., Carton, A., Cazorzi, F., Dalla Fontana, G., Delpero, C., Salvatore, M. C., Seppi, R., and Zanoner, T.: Reconstructing fluctuations of La Mare glacier (Eastern Italian Alps) in the late Holocene: new evidence for a Little Ice Age maximum around 1600 AD, Geogr. Ann. Ser. A, Phys. Geogr., 96, 287–306, https://doi.org/10.1111/geoa.12048, 2014.
Cerrato, R. and Baroni, C.: NOAA/WDS Paleoclimatology – Cerrato – Bosco Antico – LADE – ITRDB ITAL050, ital050.rwl, NOAA National Centers for Environmental Information [data set], https://doi.org/10.25921/hw52-rp85, 2018.
Cerrato, R., Salvatore, M. C., Brunetti, M., Coppola, A., and Baroni, C.: Dendroclimatic relevance of “Bosco Antico”, the most ancient living European larch wood in the Southern Rhaetian Alps (Italy), Geogr. Fis. e Din. Quat., 41, 35–49, https://doi.org/10.4461/GFDQ.2018.41.3, 2018.
Cerrato, R., Salvatore, M. C., Gunnarson, B. E., Linderholm, H. W., Carturan, L., Brunetti, M., De Blasi, F., and Baroni, C.: A Pinus cembra L. tree-ring record for late spring to late summer temperature in the Rhaetian Alps, Italy, Dendrochronologia, 53, 22–31, https://doi.org/10.1016/j.dendro.2018.10.010, 2019a.
Cerrato, R., Cherubini, P., Büntgen, U., Coppola, A., Salvatore, M. C., and Baroni, C.: Tree-ring-based reconstruction of larch budmoth outbreaks in the Central Italian Alps since 1774 CE, iForest – Biogeosciences For., 12, 289–296, https://doi.org/10.3832/ifor2533-012, 2019b.
Cerrato, R., Salvatore, M. C., Gunnarson, B. E., Linderholm, H. W., Carturan, L., Brunetti, M., and Baroni, C.: Pinus cembra L. tree-ring data as a proxy for summer mass-balance variability of the Careser Glacier (Italian Rhaetian Alps), J. Glaciol., 66, 714–726, https://doi.org/10.1017/jog.2020.40, 2020.
Cerrato, R., Salvatore, M. C., Carrer, M., Brunetti, M., and Baroni, C.: Blue intensity of Swiss stone pine as a high-frequency temperature proxy in the Alps, Eur. J. For. Res., 142, 933–948, https://doi.org/10.1007/s10342-023-01566-9, 2023.
Cerrato, R., Salvatore, M. C., Somma, A., and Baroni, C.: NOAA/WDS Paleoclimatology – Cerrato – Bosco Antico Update – LADE – ITRDB ITA072, ita072bl25.rwl, ita072be100.rwl, NOAA National Centers for Environmental Information [data set], https://doi.org/10.25921/868n-2d38, 2025a.
Cerrato, R., Salvatore, M. C., and Baroni, C.: NOAA/WDS Paleoclimatology – Cerrato – Val di Barco – LADE – ITRDB ITA073, ita073.rwl, ita073bl25.rwl, ita073be100.rwl, NOAA National Centers for Environmental Information [data set], https://doi.org/10.25921/j2vd-tn67, 2025b.
Cerrato, R., Salvatore, M. C., and Baroni, C.: NOAA/WDS Paleoclimatology – Cerrato – Pradach di Val Palù – LADE – ITRDB ITA074, ita074.rwl, ita074be100.rwl, ita074bl25.rwl, NOAA National Centers for Environmental Information [data set], https://doi.org/10.25921/a4kb-dq50, 2025c.
Cook, E. R. and Holmes, R. L.: Users Manual for Program ARSTAN, Tucson, Arizona, 13 pp., https://sheppard.ltrr.arizona.edu/DISC2019/arstan.txt (last access: 28 Febuary 2025), 1999.
Cook, E. R., Briffa, K. R., and Jones, P. D.: Spatial regression methods in dendroclimatology: A review and comparison of two techniques, Int. J. Climatol., 14, 379–402, https://doi.org/10.1002/joc.3370140404, 1994.
Coppola, A., Leonelli, G., Salvatore, M. C., Pelfini, M., and Baroni, C.: Weakening climatic signal since mid-20th century in European larch tree-ring chronologies at different altitudes from the Adamello-Presanella Massif (Italian Alps), Quaternary Res., 77, 344–354, https://doi.org/10.1016/j.yqres.2012.01.004, 2012.
Coppola, A., Leonelli, G., Salvatore, M. C., Pelfini, M., and Baroni, C.: Tree-ring–based summer mean temperature variations in the Adamello–Presanella Group (Italian Central Alps), 1610–2008 AD, Clim. Past, 9, 211–221, https://doi.org/10.5194/cp-9-211-2013, 2013.
Corona, C., Guiot, J., Edouard, J. L., Chalié, F., Büntgen, U., Nola, P., and Urbinati, C.: Millennium-long summer temperature variations in the European Alps as reconstructed from tree rings, Clim. Past, 6, 379–400, https://doi.org/10.5194/cp-6-379-2010, 2010.
Crespi, A., Brunetti, M., Lentini, G., and Maugeri, M.: 1961–1990 high-resolution monthly precipitation climatologies for Italy, Int. J. Climatol., 38, 878–895, https://doi.org/10.1002/joc.5217, 2018.
Crespi, A., Brunetti, M., Ranzi, R., Tomirotti, M., and Maugeri, M.: A multi-century meteo-hydrological analysis for the Adda river basin (Central Alps). Part I: Gridded monthly precipitation (1800–2016) records, Int. J. Climatol., 41, 162–180, https://doi.org/10.1002/joc.6614, 2021.
Dannenberg, M. P. and Wise, E. K.: Seasonal climate signals from multiple tree ring metrics: A case study of Pinus ponderosa in the upper Columbia River Basin, J. Geophys. Res.-Biogeosci., 121, 1178–1189, https://doi.org/10.1002/2015JG003155, 2016.
D'Arrigo, R. D., Wilson, R., Liepert, B., and Cherubini, P.: On the “Divergence Problem” in Northern Forests: A review of the tree-ring evidence and possible causes, Glob. Planet. Change, 60, 289–305, https://doi.org/10.1016/j.gloplacha.2007.03.004, 2008.
Dixon, P. M.: Bootstrap Resampling, in: Encyclopedia of Environmetrics, Wiley, https://doi.org/10.1002/9780470057339.vab028, 2001.
Dolgova, E.: June-September temperature reconstruction in the Northern Caucasus based on blue intensity data, Dendrochronologia, 39, 17–23, https://doi.org/10.1016/j.dendro.2016.03.002, 2016.
Esper, J., Cook, E. R., and Schweingruber, F. H.: Low-Frequency Signals in Long Tree-Ring Chronologies for Reconstructing Past Temperature Variability, Science, 295, 2250–2253, https://doi.org/10.1126/science.1066208, 2002.
Esper, J., Frank, D. C., Wilson, R., and Briffa, K. R.: Effect of scaling and regression on reconstructed temperature amplitude for the past millennium, Geophys. Res. Lett., 32, L07711, https://doi.org/10.1029/2004GL021236, 2005.
Esper, J., George, S. S., Anchukaitis, K., D'Arrigo, R., Ljungqvist, F. C., Luterbacher, J., Schneider, L., Stoffel, M., Wilson, R., and Büntgen, U.: Large-scale, millennial-length temperature reconstructions from tree-rings, Dendrochronologia, 50, 81–90, https://doi.org/10.1016/j.dendro.2018.06.001, 2018.
Eyring, V., Gillett, N. P., Rao, K. M. A., Barimalala, R., Barreiro Parrillo, M., Bellouin, N., Cassou, C., Durack, P. J., Kosaka, Y., McGregor, S., Min, S., Morgenstern, O., and Sun, Y.: Human Influence on the Climate System, in: Climate Change 2021: The Physical Science Basis. Contribution of Working Group I to the Sixth Assessment Report of the Intergovernmental Panel on Climate Change, edited by: Masson-Delmotte, V., Zhai, P., Pirani, A., Connors, S. L., Péan, C., Berger, S., Caud, N., Chen, Y., Goldfarb, L., Gomis, M. I., Huang, M., Leitzell, K., Lonnoy, E., Matthews, J. B. R., Maycock, T. K., Waterfield, T., Yelekçi, O., Yu, R., and Zhou, B., Cambridge University Press, Cambridge, United Kingdom and New York, NY, USA, 423–552, https://doi.org/10.1017/9781009157896.005, 2023.
Fink, A. H., Brücher, T., Krüger, A., Leckebusch, G. C., Pinto, J. G., and Ulbrich, U.: The 2003 European summer heatwaves and drought -synoptic diagnosis and impacts, Weather, 59, 209–216, https://doi.org/10.1256/wea.73.04, 2004.
Frank, D. C. and Esper, J.: Characterization and climate response patterns of a high-elevation, multi-species tree-ring network in the European Alps, Dendrochronologia, 22, 107–121, https://doi.org/10.1016/j.dendro.2005.02.004, 2005.
Frank, T. and Nicolussi, K.: Testing different Earlywood/Latewood delimitations for the establishment of Blue Intensity data: A case study based on Alpine Picea abies samples, Dendrochronologia, 64, 125775, https://doi.org/10.1016/j.dendro.2020.125775, 2020.
Fritts, H. C. (Ed.): Tree Rings and Climate, Elsevier, London, 582 pp., https://doi.org/10.1016/B978-0-12-268450-0.X5001-0, 1976.
Fuentes, M., Salo, R., Björklund, J., Seftigen, K., Zhang, P., Gunnarson, B. E., Aravena, J. C., and Linderholm, H. W.: A 970-year-long summer temperature reconstruction from Rogen, west-central Sweden, based on blue intensity from tree rings, Holocene, 28, 254–266, https://doi.org/10.1177/0959683617721322, 2018.
Galvan, P., Ponge, J.-F., Chersich, S., and Zanella, A.: Humus Components and Soil Biogenic Structures in Norway Spruce Ecosystems, Soil Sci. Soc. Am. J., 72, 548, https://doi.org/10.2136/sssaj2006.0317, 2008.
Gentili, R., Armiraglio, S., Sgorbati, S., and Baroni, C.: Geomorphological disturbance affects ecological driving forces and plant turnover along an altitudinal stress gradient on alpine slopes, Plant Ecol., 214, 571–586, https://doi.org/10.1007/s11258-013-0190-1, 2013.
Gentili, R., Baroni, C., Panigada, C., Rossini, M., Tagliabue, G., Armiraglio, S., Citterio, S., Carton, A., and Salvatore, M. C.: Glacier shrinkage and slope processes create habitat at high elevation and microrefugia across treeline for alpine plants during warm stages, CATENA, 193, 104626, https://doi.org/10.1016/j.catena.2020.104626, 2020.
Harris, I., Osborn, T. J., Jones, P., and Lister, D.: Version 4 of the CRU TS monthly high-resolution gridded multivariate climate dataset, Sci. Data, 7, 109, https://doi.org/10.1038/s41597-020-0453-3, 2020.
Heeter, K. J., Harley, G. L., Maxwell, J. T., McGee, J. H., and Matheus, T. J.: Late summer temperature variability for the Southern Rocky Mountains (USA) since 1735 CE: applying blue light intensity to low-latitude Picea engelmannii Parry ex Engelm, Clim. Change, 162, 965–988, https://doi.org/10.1007/s10584-020-02772-9, 2020.
Helama, S., Melvin, T. M., and Briffa, K. R.: Regional curve standardization: State of the art, Holocene, 27, 172–177, https://doi.org/10.1177/0959683616652709, 2017.
IPCC: Summary for policymakers, in: Climate Change 2013: The Physical Science Basis. Contribution of Working Group I to the Fifth Assessment Report of the Intergovernmental Panel on Climate Change, edited by: Stocker, T. F., Qin, D., Plattner, G.-K., Tignor, M., Allen, S. K., Boschung, J., Nauels, A., Xia, Y., Bex, V., and Midgley, P. M., Cambridge University Press, Cambridge, United Kingdom and New York, NY, US, 1–28, https://www.ipcc.ch/site/assets/uploads/2018/02/WG1AR5_SPM_FINAL.pdf (last access: 28 February 2025), 2013.
IPCC: Summary for Policymakers, in: Global warming of 1.5 °C. An IPCC Special Report on the impacts of global warming of 1.5 °C above pre-industrial levels and related global greenhouse gas emission pathways, in the context of strengthening the global response to the threat of climate change, edited by: Masson-Delmotte, V., Zhai, P., Pörtner, H. O., Roberts, D., Skea, J., Shukla, P. R., Pirani, A., Moufouma-Okia, W., Péan, C., Pidcock, R., Connors, S., Matthews, J. B. R., Chen, Y., Zhou, X., Gomis, M. I., Lonnoy, E., Maycock, T., Tignor, M., and Waterfield, T., World Meteorological Organization, Geneva, Switzerland, 32, https://doi.org/10.1017/9781009157940, 2018.
IPCC: Summary for Policymakers, in: The Ocean and Cryosphere in a Changing Climate, edited by: Pörtner, H.-O., Roberts, D. C., Masson-Delmotte, V., Zhai, P., Tignor, M., Poloczanska, E., Mintenbeck, K., Alegría, A., Nicolai, M., Okem, A., Petzold, J., Rama, B., and Weyer, N. M., Cambridge University Press, Cambridge, UK and New York, NY, USA, 3–35, https://doi.org/10.1017/9781009157964.001, 2019.
IPCC: Summary for Policymakers, in: Climate Change and Land: an IPCC special report on climate change, desertification, land degradation, sustainable land management, food security, and greenhouse gas fluxes in terrestrial ecosystems, edited by: Shukla, P. R., Skea, J., Buendia Calvo, E., Masson-Delmotte, V., Pörtner, H.-O., Roberts, D. C., Zhai, P., Slade, R., Connors, S., van Diemen, R., Ferrat, M., Haughey, E., Luz, S., Neogi, S., Pathak, M., Petzold, J., Portugal Pereira, J., Vyas, P., Huntley, E., Kissick, K., Belkacemi, M., and Malley, J., Cambridge University Press, Cambridge, UK and New York, NY, USA, 1–36, https://doi.org/10.1017/9781009157988.001, 2022.
IPCC: Summary for Policymakers, in: Climate Change 2022 – Impacts, Adaptation and Vulnerability, edited by: Pörtner, H.-O., Roberts, D. C., Poloczanska, E. S., Mintenbeck, K., Tignor, M., Alegría, A., Craig, M., Langsdorf, S., Löschke, S., Möller, V., and Okem, A., Cambridge University Press, Cambridge, UK and New York, NY, USA, 3–34, https://doi.org/10.1017/9781009325844.001, 2023.
Isotta, F. A., Frei, C., Weilguni, V., Perčec Tadić, M., Lassègues, P., Rudolf, B., Pavan, V., Cacciamani, C., Antolini, G., Ratto, S. M., Munari, M., Micheletti, S., Bonati, V., Lussana, C., Ronchi, C., Panettieri, E., Marigo, G., and Vertačnik, G.: The climate of daily precipitation in the Alps: Development and analysis of a high-resolution grid dataset from pan-Alpine rain-gauge data, Int. J. Climatol., 34, 1657–1675, https://doi.org/10.1002/joc.3794, 2014.
IUSS Working Group: WRB: World Reference Base for Soil Resources, International soil classification system for naming soils and creating legends for soil maps, 4th edn., International Union of Soil Sciences (IUSS), Vienna, Austria, 132 pp., https://www.isric.org/sites/default/files/WRB_fourth_edition_2022-12-18.pdf (last access: 28 February 2025), 2022.
Kaczka, R. J., Spyt, B., Janecka, K., Beil, I., Büntgen, U., Scharnweber, T., Nievergelt, D., and Wilmking, M.: Different maximum latewood density and blue intensity measurements techniques reveal similar results, Dendrochronologia, 49, 94–101, https://doi.org/10.1016/j.dendro.2018.03.005, 2018.
Lê, S., Josse, J., and Husson, F.: FactoMineR: An R Package for Multivariate Analysis, J. Stat. Softw., 25, 253–258, https://doi.org/10.18637/jss.v025.i01, 2008.
Leavitt, S. W. and Roden, J.: Stable Isotopes in Tree Rings, edited by: Siegwolf, R. T. W., Brooks, J. R., Roden, J., and Saurer, M., Springer International Publishing, Cham, 3–20 pp., https://doi.org/10.1007/978-3-030-92698-4, 2022.
Leonelli, G., Pelfini, M., D'Arrigo, R. D., Haeberli, W., and Cherubini, P.: Non-stationary Responses of Tree-Ring Chronologies and Glacier Mass Balance to Climate in the European Alps, Arctic, Antarct. Alp. Res., 43, 56–65, https://doi.org/10.1657/1938-4246-43.1.56, 2011.
Leonelli, G., Coppola, A., Baroni, C., Salvatore, M. C., Maugeri, M., Brunetti, M., and Pelfini, M.: Multispecies dendroclimatic reconstructions of summer temperature in the European Alps enhanced by trees highly sensitive to temperature, Clim. Change, 137, 275–291, https://doi.org/10.1007/s10584-016-1658-5, 2016.
Ljungqvist, F. C., Thejll, P., Björklund, J., Gunnarson, B. E., Piermattei, A., Rydval, M., Seftigen, K., Støve, B., and Büntgen, U.: Assessing non-linearity in European temperature-sensitive tree-ring data, Dendrochronologia, 59, 125652, https://doi.org/10.1016/j.dendro.2019.125652, 2020.
Marazzi, S.: Atlante orografico delle Alpi: SOIUSA: suddivisione orografica internazionale unificata del sistema alpino, Priuli & Verlucca, 416 pp., 2005.
McCarroll, D., Pettigrew, E., and Luckman, A.: Blue Reflectance Provides a Surrogate for Latewood Density of High-Latitude Pine Tree Rings Reflectance Provides a Surrogate for Latewood of High-latitude Density Pine Tree Rings, Arctic, Antarct. Alp. Res., 34, 450–453, 2002.
McPartland, M. Y., St. George, S., Pederson, G. T., and Anchukaitis, K. J.: Does signal-free detrending increase chronology coherence in large tree-ring networks?, Dendrochronologia, 63, 125755, https://doi.org/10.1016/j.dendro.2020.125755, 2020.
Melvin, T. M.: Historical Growth Rates and Changing Climatic Sensitivity of Boreal Conifers, PhD dissertation, University of East Anglia, 271 pp., https://ueaeprints.uea.ac.uk/id/eprint/42398/1/melvin-2004-thesis.pdf (last access: 28 February 2025), 2004.
Melvin, T. M. and Briffa, K. R.: A “signal-free” approach to dendroclimatic standardisation, Dendrochronologia, 26, 71–86, https://doi.org/10.1016/j.dendro.2007.12.001, 2008.
Mitchell, T. D. and Jones, P. D.: An improved method of constructing a database of monthly climate observations and associated high-resolution grids, Int. J. Climatol., 25, 693–712, https://doi.org/10.1002/joc.1181, 2005.
New, M., Hulme, M., and Jones, P. D.: Representing Twentieth-Century Space–Time Climate Variability. Part II: Development of 1901–96 Monthly Grids of Terrestrial Surface Climate, J. Climate, 13, 2217–2238, https://doi.org/10.1175/1520-0442(2000)013<2217:RTCSTC>2.0.CO;2, 2000.
Nicolussi, K., Österreicher, A., Weber, G., Leuenberger, M., Bauer, A., and Vogeleit, T.: Blue intensity analyses on spruce, larch and cembran pine cores of living trees from the Alps, in: EuroDendro 2015, 18–23 October 2015, Antalya, Turkey, Book of Abstracts, edited by: Akkemik, Ü., 139–140, 2015.
Ols, C., Klesse, S., Girardin, M. P., Evans, M. E. K., DeRose, R. J., and Trouet, V.: Detrending climate data prior to climate–growth analyses in dendroecology: A common best practice?, Dendrochronologia, 79, 126094, https://doi.org/10.1016/j.dendro.2023.126094, 2023.
Österreicher, A., Weber, G., Leuenberger, M., and Nicolussi, K.: Exploring blue intensity – comparison of blue intensity and MXD data from Alpine spruce trees, Sci. Tech. Rep., 56–61, https://doi.org/10.2312/GFZ.b103-15069, 2014.
Pepin, N., Bradley, R. S., Diaz, H. F., Baraer, M., Caceres, E. B., Forsythe, N., Fowler, H., Greenwood, G., Hashmi, M. Z., Liu, X. D., Miller, J. R., Ning, L., Ohmura, A., Palazzi, E., Rangwala, I., Schöner, W., Severskiy, I., Shahgedanova, M., Wang, M. B., Williamson, S. N., and Yang, D. Q.: Elevation-dependent warming in mountain regions of the world, Nat. Clim. Chang., 5, 424–430, https://doi.org/10.1038/nclimate2563, 2015.
R Core Team: R: A Language and Environment for Statistical Computing, https://www.r-project.org/ (last access: 28 February 2025), 2024.
Reid, E. and Wilson, R.: Delta blue intensity vs. maximum density: A case study using Pinus uncinata in the Pyrenees, Dendrochronologia, 61, 125706, https://doi.org/10.1016/j.dendro.2020.125706, 2020.
Rydval, M., Larsson, L. Å., McGlynn, L., Gunnarson, B. E., Loader, N. J., Young, G. H. F., and Wilson, R.: Blue intensity for dendroclimatology: Should we have the blues? Experiments from Scotland, Dendrochronologia, 32, 191–204, https://doi.org/10.1016/j.dendro.2014.04.003, 2014.
Rydval, M., Gunnarson, B. E., Loader, N. J., Cook, E. R., Druckenbrod, D. L., and Wilson, R.: Spatial reconstruction of Scottish summer temperatures from tree rings, Int. J. Climatol., 37, 1540–1556, https://doi.org/10.1002/joc.4796, 2016.
Salvatore, M. C., Zanoner, T., Baroni, C., Carton, A., Banchieri, F. A., Viani, C., Giardino, M., and Perotti, L.: The state of Italian glaciers: A snapshot of the 2006-2007 hydrological period, Geogr. Fis. e Din. Quat., 38, 175–198, https://doi.org/10.4461/GFDQ.2015.38.16, 2015.
Saulnier, M., Corona, C., Stoffel, M., Guibal, F., and Edouard, J.-L.: Climate-growth relationships in a Larix decidua Mill. network in the French Alps, Sci. Total Environ., 664, 554–566, https://doi.org/10.1016/j.scitotenv.2019.01.404, 2019.
Schwab, N., Kaczka, R. J., Janecka, K., Böhner, J., Chaudhary, R., Scholten, T., and Schickhoff, U.: Climate Change-Induced Shift of Tree Growth Sensitivity at a Central Himalayan Treeline Ecotone, Forests, 9, 267, https://doi.org/10.3390/f9050267, 2018.
Schweingruber, F. H.: Tree Rings Basic and Applications of Dendrochronology, Springer Netherlands, Dordrecht, 276 pp., https://doi.org/10.1007/978-94-009-1273-1, 1988.
Seftigen, K., Fuentes, M., Ljungqvist, F. C., and Björklund, J.: Using Blue Intensity from drought-sensitive Pinus sylvestris in Fennoscandia to improve reconstruction of past hydroclimate variability, Clim. Dynam., 55, 579–594, https://doi.org/10.1007/s00382-020-05287-2, 2020.
Seftigen, K., Fonti, M. V., Luckman, B., Rydval, M., Stridbeck, P., von Arx, G., Wilson, R., and Björklund, J.: Prospects for dendroanatomy in paleoclimatology – a case study on Picea engelmannii from the Canadian Rockies, Clim. Past, 18, 1151–1168, https://doi.org/10.5194/cp-18-1151-2022, 2022.
Sheppard, P. R. and Wiedenhoeft, A.: An advancement in removing extraneous color from wood for low-magnification reflected-light image analysis of conifer tree rings, Wood Fiber Sci., 39, 173–183, 2007.
Solomina, O. N., Bushueva, I., Dolgova, E., Jomelli, V., Alexandrin, M., Mikhalenko, V., and Matskovsky, V. V.: Glacier variations in the Northern Caucasus compared to climatic reconstructions over the past millennium, Glob. Planet. Change, 140, 28–58, https://doi.org/10.1016/j.gloplacha.2016.02.008, 2016.
Trachsel, M., Kamenik, C., Grosjean, M., McCarroll, D., Moberg, A., Brázdil, R., Büntgen, U., Dobrovolný, P., Esper, J., Frank, D. C., Friedrich, M., Glaser, R., Larocque-Tobler, I., Nicolussi, K., and Riemann, D.: Multi-archive summer temperature reconstruction for the European Alps, AD 1053–1996, Quaternary Sci. Rev., 46, 66–79, https://doi.org/10.1016/j.quascirev.2012.04.021, 2012.
Tsvetanov, N., Dolgova, E., and Panayotov, M.: First measurements of Blue intensity from Pinus peuce and Pinus heldreichii tree rings and potential for climate reconstructions, Dendrochronologia, 60, 125681, https://doi.org/10.1016/j.dendro.2020.125681, 2020.
Turchin, P., Wood, S. N., Ellner, S. P., Kendall, B. E., Murdoch, W. W., Fischlin, A., Casas, J., McCauley, E., and Briggs, C. J.: Dynamical effects of plant quality and parasitism on population cycles of larch budmoth, Ecology, 84, 1207–1214, https://doi.org/10.1890/0012-9658(2003)084[1207:DEOPQA]2.0.CO;2, 2003.
Unterholzner, L., Castagneri, D., Cerrato, R., Ştirbu, M., Roibu, C.-C., and Carrer, M.: Climate response of a glacial relict conifer across its distribution range is invariant in space but not in time, Sci. Total Environ., 906, 167512, https://doi.org/10.1016/j.scitotenv.2023.167512, 2024.
Wilmking, M., van der Maaten-Theunissen, M., van der Maaten, E., Scharnweber, T., Buras, A., Biermann, C., Gurskaya, M., Hallinger, M., Lange, J., Shetti, R., Smiljanic, M., and Trouillier, M.: Global assessment of relationships between climate and tree growth, Glob. Chang. Biol., 26, 3212–3220, https://doi.org/10.1111/gcb.15057, 2020.
Wilson, R., Rao, R., Rydval, M., Wood, C. V., Larsson, L. Å., and Luckman, B. H.: Blue Intensity for dendroclimatology: The BC blues: A case study from British Columbia, Canada, Holocene, 24, 1428–1438, https://doi.org/10.1177/0959683614544051, 2014.
Wilson, R., Anchukaitis, K. J., Briffa, K. R., Büntgen, U., Cook, E. R., D'Arrigo, R. D., Davi, N., Esper, J., Frank, D. C., Gunnarson, B. E., Hegerl, G., Helama, S., Klesse, S., Krusic, P. J., Linderholm, H. W., Myglan, V. S., Osborn, T. J., Rydval, M., Schneider, L., Schurer, A., Wiles, G. C., Zhang, P., and Zorita, E.: Last millennium northern hemisphere summer temperatures from tree rings: Part I: The long term context, Quaternary Sci. Rev., 134, 1–18, https://doi.org/10.1016/j.quascirev.2015.12.005, 2016.
Wilson, R., D'Arrigo, R., Andreu-Hayles, L., Oelkers, R., Wiles, G., Anchukaitis, K., and Davi, N.: Experiments based on blue intensity for reconstructing North Pacific temperatures along the Gulf of Alaska, Clim. Past, 13, 1007–1022, https://doi.org/10.5194/cp-13-1007-2017, 2017a.
Wilson, R., Wilson, D., Rydval, M., Crone, A., Büntgen, U., Clark, S., Ehmer, J., Forbes, E., Fuentes, M., Gunnarson, B. E., Linderholm, H. W., Nicolussi, K., Wood, C. V., and Mills, C.: Facilitating tree-ring dating of historic conifer timbers using Blue Intensity, J. Archaeol. Sci., 78, 99–111, https://doi.org/10.1016/j.jas.2016.11.011, 2017b.
Wilson, R., Anchukaitis, K. J., Andreu-Hayles, L., Cook, E. R., D'Arrigo, R. D., Davi, N., Haberbauer, L., Krusic, P. J., Luckman, B., Morimoto, D., Oelkers, R., Wiles, G., and Wood, C. V.: Improved dendroclimatic calibration using blue intensity in the southern Yukon, The Holocene, 29, 1817–1830, https://doi.org/10.1177/0959683619862037, 2019.
Wilson, R., Allen, K., Baker, P., Boswijk, G., Buckley, B., Cook, E., D'Arrigo, R., Druckenbrod, D., Fowler, A., Grandjean, M., Krusic, P., and Palmer, J.: Evaluating the dendroclimatological potential of blue intensity on multiple conifer species from Tasmania and New Zealand, Biogeosciences, 18, 6393–6421, https://doi.org/10.5194/bg-18-6393-2021, 2021.
Zang, C. and Biondi, F.: treeclim: an R package for the numerical calibration of proxy-climate relationships, Ecography (Cop.)., 38, 431–436, https://doi.org/10.1111/ecog.01335, 2015.
Zemp, M., Frey, H., Gärtner-Roer, I., Nussbaumer, S. U., Hoelzle, M., Paul, F., Haeberli, W., Denzinger, F., Ahlstrøm, A. P., Anderson, B. M., Bajracharya, S., Baroni, C., Braun, L. N., Cáceres, B. E., Casassa, G., Cobos, G., Dávila, L. R., Delgado Granados, H., Demuth, M. N., Espizua, L., Fischer, A., Fujita, K., Gadek, B., Ghazanfar, A., Ove Hagen, J., Holmlund, P., Karimi, N., Li, Z., Pelto, M., Pitte, P., Popovnin, V. V., Portocarrero, C. A., Prinz, R., Sangewar, C. V., Severskiy, I., Sigurđsson, O., Soruco, A., Usubaliev, R., and Vincent, C.: Historically unprecedented global glacier decline in the early 21st century, J. Glaciol., 61, 745–762, https://doi.org/10.3189/2015JoG15J017, 2015.