the Creative Commons Attribution 4.0 License.
the Creative Commons Attribution 4.0 License.
 | 10 Nov 2025
Hydroclimate Evolution Along Chile Over the Last 20 000 Years: insights from Leaf-Wax Hydrogen Isotope Records
Charlotte Läuchli
Nestor Gaviria-Lugo
Anne Bernhardt
Hella Wittmann
Patrick J. Frings
Mahyar Mohtadi
Andreas Lückge
Dirk Sachse
The climate of the western coast of South America is controlled by large climate systems known as the Intertropical Convergence Zone (ITCZ), the Subtropical Pacific High (SPH) and the Southern Hemisphere Westerly wind (SWW) belt. While the large-scale evolution of the SWW belt and the location of the ITCZ are well constrained, the interaction between these two climate features is not well understood as a high resolution spatial and temporal reconstruction of the SWW belt is still lacking. Here, we use the hydrogen isotope ratios of leaf-wax n-alkanes in marine sediments between 33 and 36° S offshore Chile to reconstruct past hydrological regimes and the evolution of the SWW belt since the Last Glacial Maximum (LGM, ca. 20 000 cal yr BP). Our results reveal distinct dry and wet phases caused by the past latitudinal migration of the SWW belt – with wetter intervals associated with a northerly SWW belt and drier intervals associated with a southerly SWW belt. Our findings imply a northward position of the SWW belt during the LGM, followed by a southward migration of the SWW belt during the deglaciation period. This shift southward was briefly interrupted during the Antarctic Cold Reversal (ca. 14 700 to 13 000 cal yr BP). The SWW belt reached its southernmost latitudes during the early Holocene. At ca. 7500 yr BP, a displacement northward of the SWW belt was detected at latitudes south of 36° S and, during the last 5500 years, the SWW belt progressively migrated northward. From 17 000 to 11 500 cal yr BP, these migrations appear to be tied to atmospheric circulation regimes resulting from large changes in the interhemispheric temperature gradient and subsequent changes in the Hadley cell circulation, while the migrations in the Holocene (11 500 cal yr BP to present) appear to be predominantly controlled by insolation and atmospheric circulation regimes resembling those of El Niño-Southern Oscillation events.
- Article
(7971 KB) - Full-text XML
-
Supplement
(3831 KB) - BibTeX
- EndNote


South America is affected by large-scale climate features that shape the Earth's climate system and its evolution, particularly by the location of the Southern Westerly Wind (SWW) belt, the position and extent of the Subtropical Pacific High (SPH), and of the position and width of the Intertropical Convergence Zone (ITCZ). For example, the migration of the SWW belt located at extratropical to subpolar latitudes is suggested to affect the ventilation of the deep water of the Southern Ocean and, by doing so, impact the atmospheric CO2 (e.g., Menviel et al., 2018; Toggweiler et al., 2006; Völker and Köhler, 2013). At tropical latitudes, the ITCZ – a minimum pressure belt characterized by intense convection corresponding to the ascending branch of the Hadley cell (e.g., Waliser and Gautier, 1993) – potentially influence the Hadley cell circulation (Watt-Meyer and Frierson, 2019) and, thus, the redistribution of moisture and heat both intra- and interhemispherically (e.g., Hadley, 1997; Watt-Meyer and Frierson, 2019). Furthermore, these climate systems strongly affect regional climate. For instance, the seasonal changes in the latitude of the SWW belt determine precipitation regimes in central Chile (Garreaud et al., 2009). The modern components of the SWW and the ITCZ – that is seasonal changes in their position and/or their response to climate phenomena such as the El Niño–Southern Oscillation (ENSO) – are relatively well understood (e.g., Garreaud, 2009; Garreaud et al., 2009) and several studies have investigated their past evolution (e.g., Arbuszewski et al., 2013; Haug et al., 2001b; Kaiser et al., 2024; Lamy et al., 2001; Mohtadi et al., 2004; Sachs et al., 2009), yet forcing mechanisms and especially dynamic feedbacks between these systems remain debated.
Different atmospheric circulation pathways (or teleconnections) have been invoked to connect climate features across latitudes in past climate such as atmospheric pathways resulting from large interhemispheric thermal gradient (e.g., Chiang et al., 2014; Lee et al., 2011) or the well-studied atmospheric pathways associated with the ENSO phenomenon (e.g., Campos and Rondanelli, 2023; Ortega et al., 2019). Yet, uncertainties prevail regarding the timing and nature of these large-scale atmospheric connections in the past. These arise from the lack of high resolution spatial and temporal reconstructions of the SWW belt required to shed light on its interaction with other well-studied climate systems located further north. Here, we aim to investigate the atmospheric pathways acting on the west coast of South America and, thus, the Southern Hemisphere (SH) since the LGM by generating high-resolution hydroclimate records.
The west coast of South America is well-suited to reconstruct past atmospheric pathways as regional precipitation, temperature and winds are highly sensitive to the location of the ITCZ, the SPH and the SWW belt. At tropical latitudes, precipitation regimes are controlled by the trade winds and the ITCZ (Garreaud, 2009; Strub et al., 1998). At subtropical latitudes, arid conditions are associated with the SPH, a high-pressure cell west of the South American landmass caused by the subsidence of air masses of the Hadley cell (Garreaud, 2009; Held and Hou, 1980; Strub et al., 1998). At subtropical to polar latitudes, the SWWs govern precipitation regimes (Garreaud, 2009; Strub et al., 1998). The ascent of moisture-laden air masses from the westerlies' storm track along the Andes generates orographic precipitations in Central and Southern Chile (e.g., Barrett et al., 2009; Garreaud, 2009). Any changes in the position or structure of these climate features, resulting from different atmospheric pathways, should thus be recognizable by changes in regional hydroclimate. High-resolution spatial and temporal reconstructions of hydroclimate along the west coast of South America can thus help shedding lights on past atmospheric pathways.
Here, we focus on the last 20 kyr as this period was characterized by major climate changes, such as the Glacial-Interglacial transition. While the large-scale evolution of the ITCZ (e.g., Arbuszewski et al., 2013; Schneider et al., 2014) and the SWW belt (e.g., Kaiser et al., 2024; Lamy et al., 2001, 2010; Moreno et al., 2018, 2021) have been addressed in several studies, the exact timing of the migration of the SWW belt and its latitudinal extent still lacks clarity. This results from contrasting climate conditions reconstructed across sites along Chile for the same time periods. For instance, increasingly drier conditions were inferred from organic biomarker record and a humidity index record derived from grain-size distribution between 13.5 and 11.5 ka BP at the latitude of 30° S (site GeoB7139-2, Bernhardt et al., 2017; Kaiser et al., 2024), while wetter conditions, inferred from lake sediment archives and pollen assemblages marked this period at the latitude of 34° S (Valero-Garcés et al., 2005). Several palaeobotanical, charcoal and sedimentary records also supported drier conditions along Chile between ca. 11 and 7 ka BP (Jara and Moreno, 2014; Jenny et al., 2002a), while some high-altitude pollen, charcoal and geochemical records indicated increases in relative moisture during the same time period (e.g., Fiers et al., 2019; de Porras et al., 2014). Here we thus focus on generating a high-resolution reconstruction of the past evolution of continental hydrological regimes along Chile to shed light on the past evolution of the SWW belt and the SPH. We then use our reconstruction, that aligns with most existing records, to explore the large-scale forcings on South American climate.
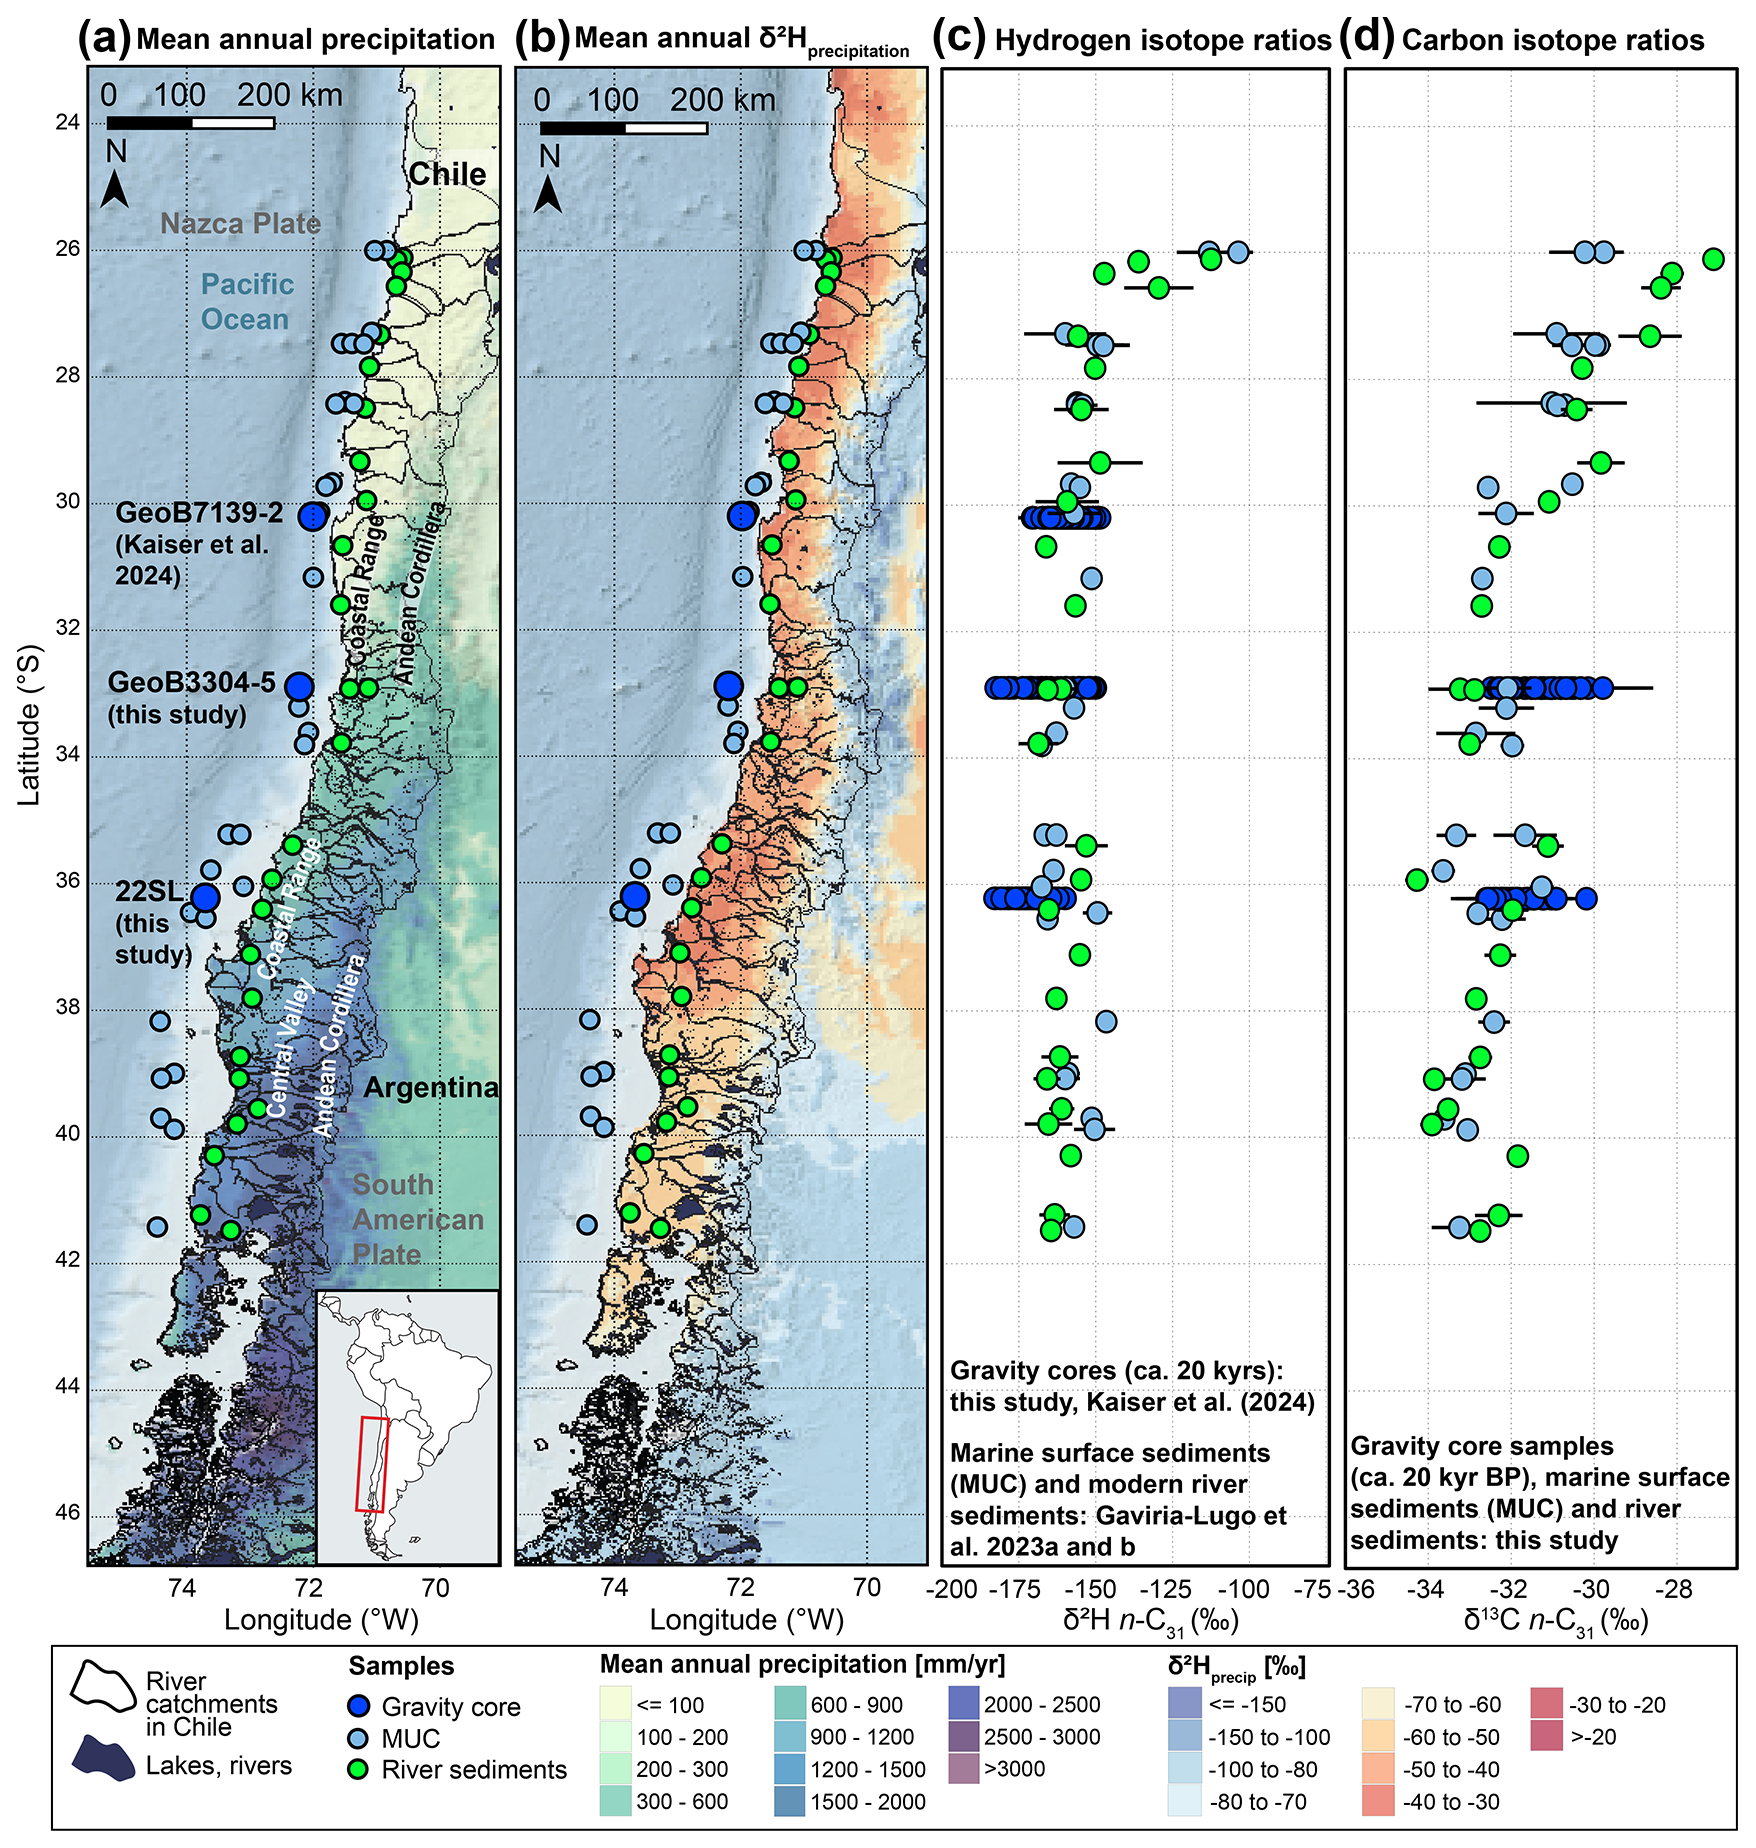
Figure 1Sampling sites and the hydrogen and carbon isotope ratios (measured on n-C31n-alkanes) of fluvial and marine sediments along Chile. Data represent present-day conditions (river and multicorer [MUC] sediments) and variability spanning ca. 20 kyr in gravity cores. (a) Mean annual precipitation map (TRMM 3B43, European Commission, Joint Research Centre (JRC), 2015) and sampling sites (this study, Gaviria-Lugo et al., 2023a, data licensed under CC BY 4.0; Kaiser et al., 2024, data licensed under CC BY 4.0). (b) Mean annual δ2Hprecip map (Bowen, 2024; Bowen et al., 2005; Bowen and Revenaugh, 2003; IAEA/WMO, 2015; Waterisotopes Database, 2017) and sampling sites (this study, Gaviria-Lugo et al., 2023a; Kaiser et al., 2024). (c) Hydrogen isotope composition (n-C31) of modern fluvial sediments (green, Gaviria-Lugo et al., 2023a), marine surface sediments (MUC, light blue, Gaviria-Lugo et al., 2023a) and gravity cores (dark blue, site GeoB7139-2 from Kaiser et al., 2024 and sites GeoB3304-5 and 22SL) by latitude. (d) Carbon isotope composition (n-C31) of fluvial sediments (green), marine surface sediments (light blue) and gravity cores (dark blue) by latitude (this study, see Gaviria-Lugo et al., 2023a for sample site description). The δ13C ratio of modern river and MUC samples were corrected for the pre-industrial carbon isotope composition of the atmosphere (Sect. 3.4). Note the consistency of the modern hydrogen and carbon isotope ratios along Chile despite substantial changes in the mean annual precipitation amount (a). Digital Elevation Model is from the GEBCO Bathymetric Compilation Group (2019). The lake and river maps are from the Biblioteca del Congreso Nacional de Chile (https://www.bcn.cl/siit/, last access: 31 March 2025). Watersheds are from Gaviria-Lugo et al. (2023a). Error bars in panels C and D correspond to two standard deviations (2σ) calculated from the δ2H and the δ13C values reported in Tables 5 to 7 reported in Läuchli et al. (2025, see Data availability).
We reconstruct past continental hydrological regimes along Chile using the hydrogen isotope composition of leaf-wax n-alkanes (2H/H, expressed as δ2Hwax measured on the long-chain n-alkanes n-C29 and n-C31) of sediment deposited at 33 and 36° S offshore Chile (Fig. 1 and Fig. S1 reported in the Supplement). These records were supplemented with the previously published δ2Hwax record of site GeoB7139-2 from Kaiser et al. (2024) to widen the scope of this study. δ2Hwax values recorded in marine sediments are mainly determined by the δ2H composition of past meteoric waters (Gaviria-Lugo et al., 2023a; Sachse et al., 2004, 2006, 2012; Sessions et al., 1999) and thus can be used to trace past hydrological regimes (e.g., Kaiser et al., 2024; Polissar et al., 2009; Rach et al., 2014; Schefuß et al., 2005). However, they can also be influenced by changes in plant evapotranspiration (Kahmen et al., 2013a, b) and plant type (e.g., Collins et al., 2013; Liu and Yang, 2008; Niedermeyer et al., 2016). These secondary controls can be investigated with the carbon isotope composition of leaf-wax long chain n-alkanes (13C/12C, expressed as δ13Cwax measured on the long-chain n-alkanes n-C29 and n-C31). To confirm the dominant role of past hydrology in altering δ2Hwax values along Chile, we therefore measured δ13Cwax values for the marine sites as well as for the modern fluvial sediments and marine surface sediments of Gaviria-Lugo et al. (2023a). Here, we show that the δ2Hwax values from the last 20 kyr can be interpreted as archives of past precipitation δ2H values, which we subsequently use to reconstruct past evolution of South American hydroclimate. Specifically, we reconstruct the past extent of SPH- and SWW-driven moisture based on past changes in regional hydroclimate along Chile and use this new reconstruction to investigate the atmospheric pathways acting on the South American climate since the LGM.
2.1 Geological setting and site selection
The Chilean active margin is ideal to study past continental environments as distances are relatively short between erosional zones (i.e., the Andean and the Coastal Cordillera) and the depositional zones on the Chilean continental margin (Fig. 1, Bernhardt et al., 2017). Between 30 and 36° S, sediments are mainly transported to the Pacific Ocean by rivers. Aeolian transport of sediments – occurring today in the hyper-arid to arid regions of northern Chile – was likely minor south of 33° S during the last 20 kyr (Lamy et al., 1998; Stuut et al., 2007; Stuut and Lamy, 2004). This implies low levels of aeolian deposition of wax at the latitudes of the gravity cores further supported by the influence of the westerly winds at these latitudes (Lamy et al., 2001; Montade et al., 2011). We therefore consider the signal of modern fluvial sediments recorded by Gaviria-Lugo et al. (2023a) as representative of continental conditions and use it to interpret the leaf-wax signal recorded in marine archives. The data set reported in Gaviria-Lugo et al. (2023a) and the associated data publication (Gaviria-Lugo et al., 2023b) is composed of fluvial and marine surface sediments. The fluvial sediments were sampled in March 2019 near the mouth of the main rivers or streams along Chile (26–42° S, Fig. 1), as well as in two smaller catchments in the Coastal Cordillera. The marine surface sediments (MUC) are from the R/V SONNE cruise-SO156 (Hebbeln and Shipboard Scientists, 2001) and the R/V SONNE cruise SO-102 (Hebbeln and Shipboard Scientists, 1995).
We selected two sediment gravity cores to reconstruct past hydrological changes (Fig. 1). At 33° S, core GeoB3304-5 (32.89° S–72.19° W, R/V Sonne Cruise SO102, Hebbeln and Shipboard Scientists, 1995) comprises sediments transported by the Maipo and the Aconcagua Rivers (Fig. S2). At 36° S near the mouth of the Biobío and the Itata Rivers (Fig. S2), we selected core 22SL (36.22° S–73–68° W, Sonne Cruise SO161-5, Wiedicke-Hombach and Shipboard Scientific Party, 2002). To extend the latitudinal coverage of this study, we combined these two records with the published δ2Hwax record of site GeoB7139-2 (30.20° S-71.98° W, R/V Sonne Cruise SO156, Hebbeln and Shipboard Scientists, 2001) from Kaiser et al. (2024). We also report new radiocarbon ages for these three sites. From a sedimentological point of view, site GeoB7139-2, located near the mouth of the Elqui and Limarí Rivers (Fig. S2), closely resembles that of sites GeoB3304-5 and 22SL with source areas extending from the Pacific coast to the high Andes. The δ2Hwax values measured at this site are thus considered directly comparable to the values reported for sites 22SL and GeoB3304-5. This contrasts with latitudes south of 41° S where source areas are restricted to lower altitudes due to important sediment storage associated with the Chilean Lake District (Bernhardt et al., 2017). Consequently, the δ2Hwax record of site ODP 1233 (41° S; Kaiser et al., 2024) is not directly compared to the records further north. This record is however addressed in the Discussion.
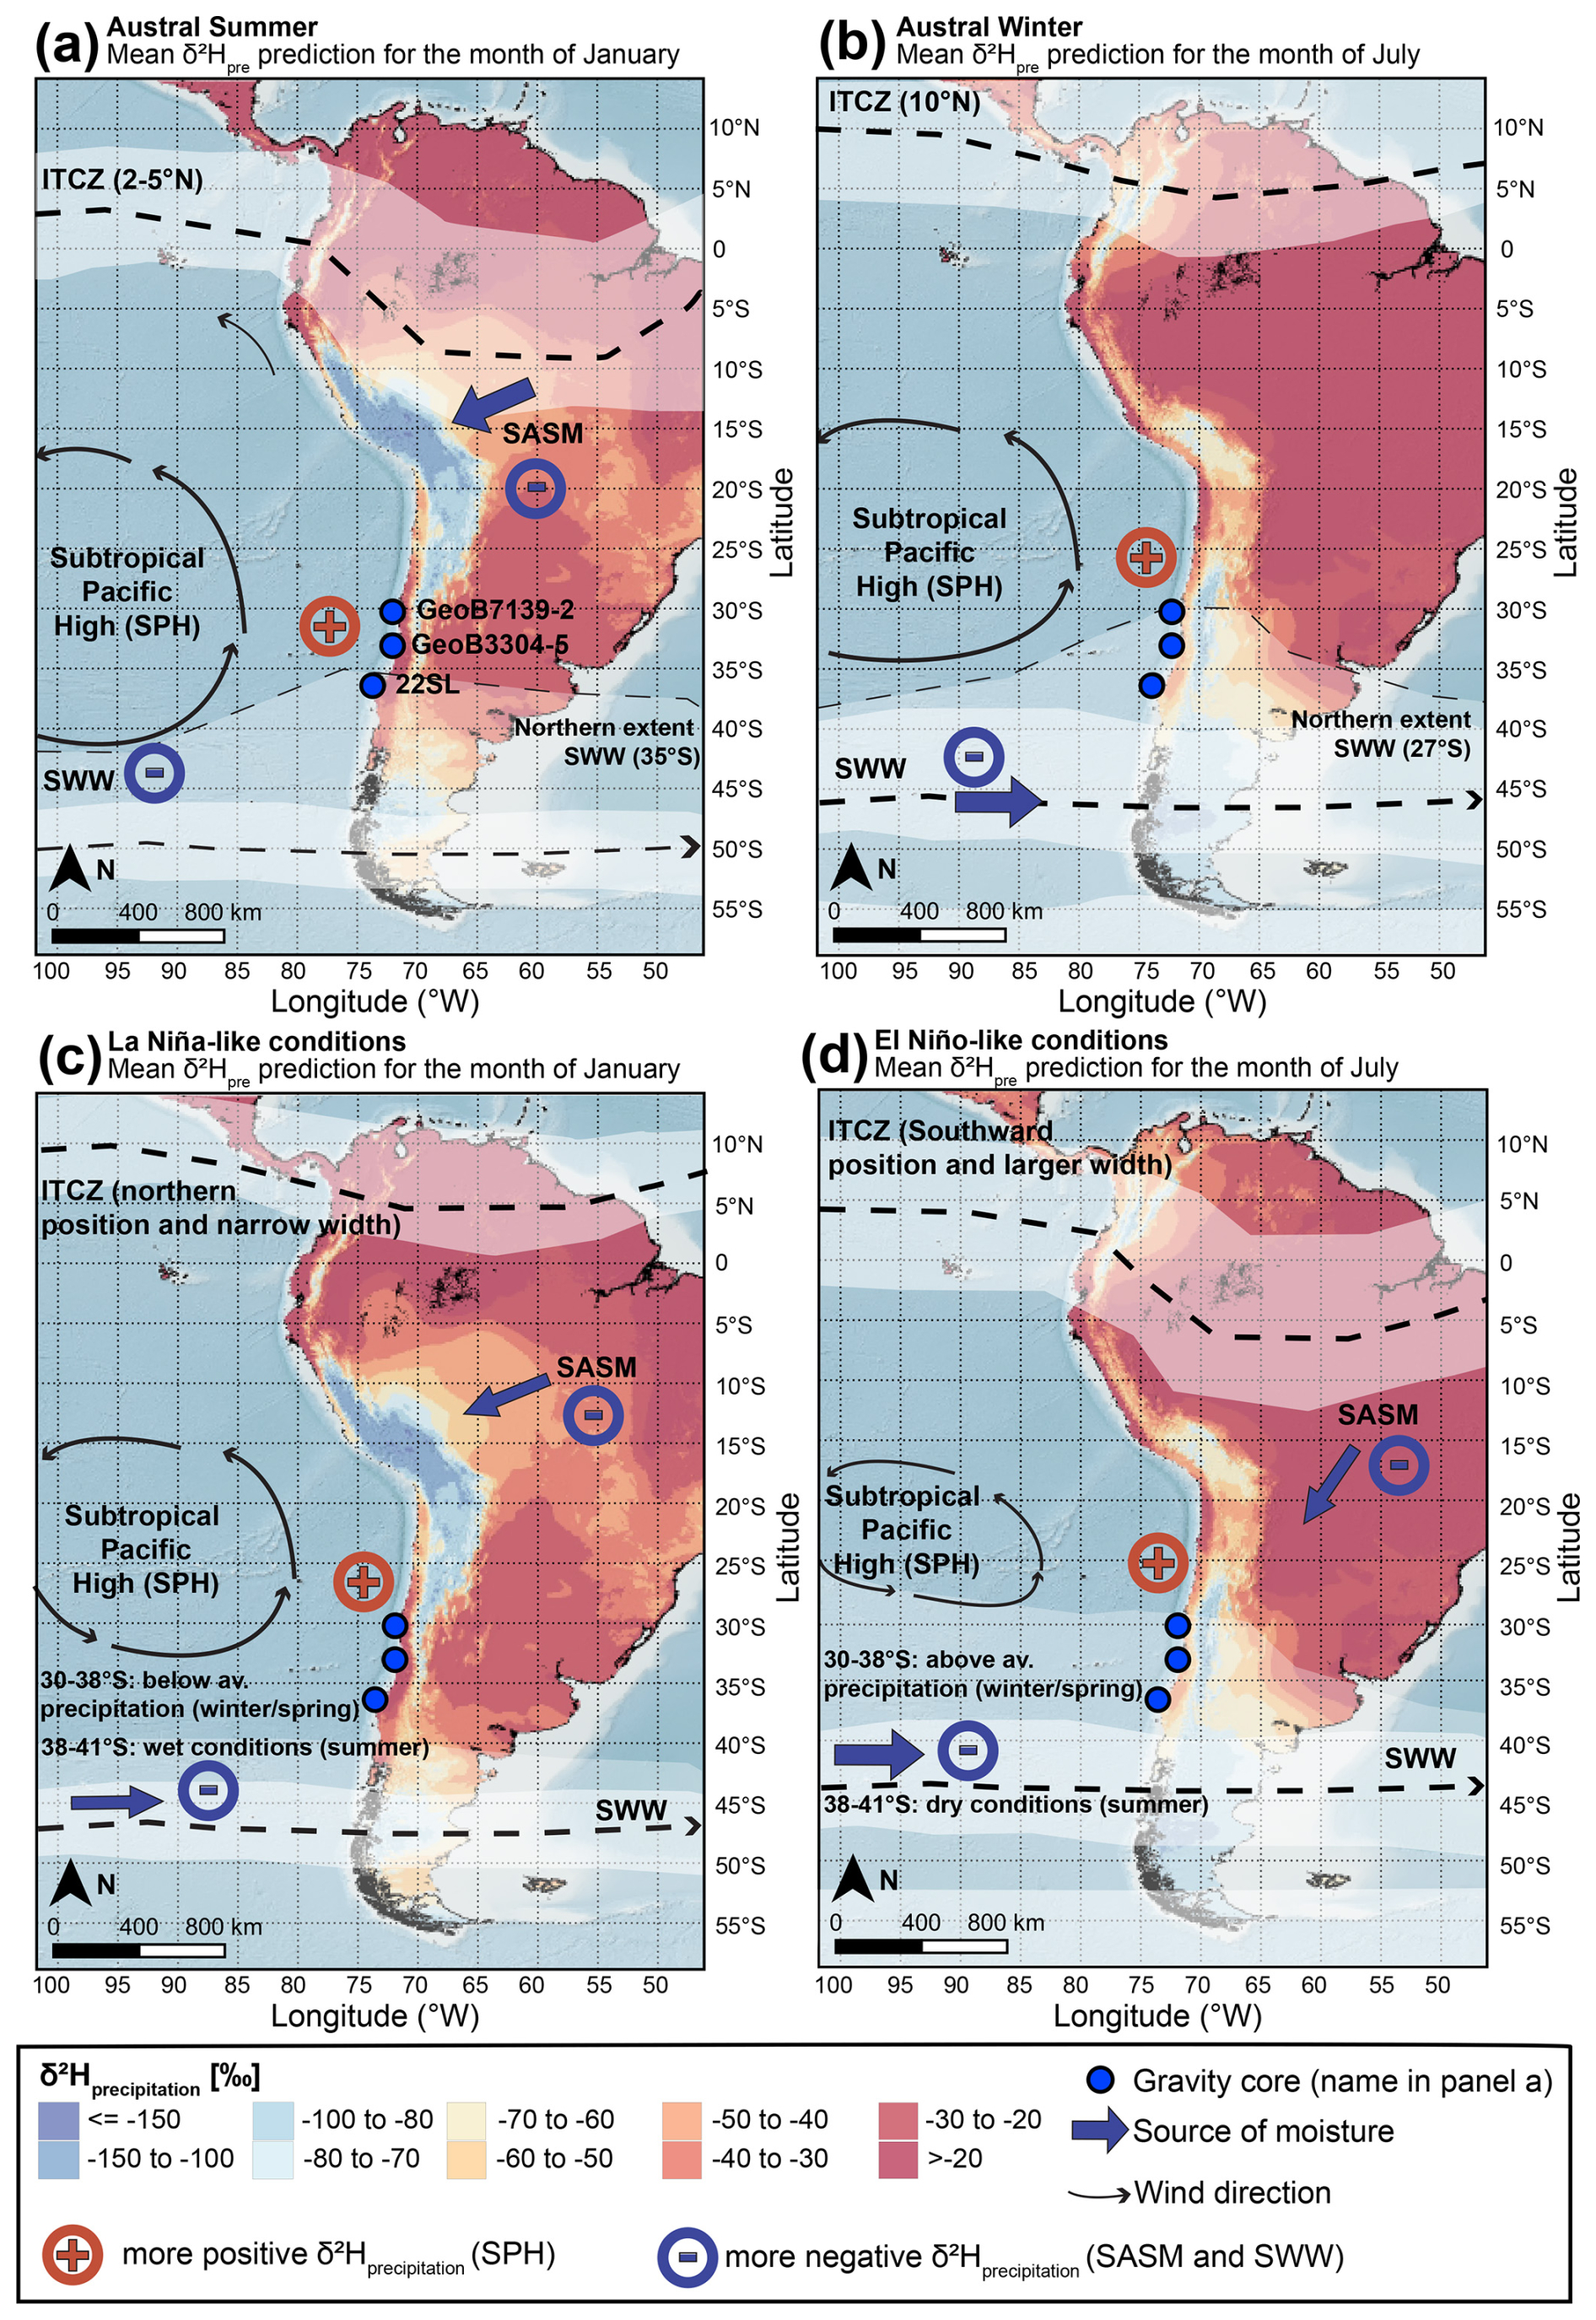
Figure 2Schematic representation of the modern climate conditions on the west coast of South America. (a) Austral Summer, (b) Austral Winter, (c) La Niña-like conditions, (d) El Niño-like conditions. The blue arrows indicate the main source of moisture. The black arrows indicate wind direction and intensity. The dashed lines indicate the core of the ITCZ and the SWW belt. The blue minus and red plus signs indicate more negative and positive δ2Hprecip values, respectively. Note that these schematic climate conditions are described with a focus on the west coast of South America and are only broadly depicting the climate conditions of the Amazon basin and the east coast of South America (see SASM – South American Summer Monsoon). The blue dots correspond to the three marine sampling sites. Mean δ2Hprecip maps in January and July are from Bowen et al. (2005) and Bowen and Revenaugh (2003; IAEA/WMO, 2015; Waterisotopes Database, 2017, http://waterisotopesDB.org last access: 29 March 2024, Bowen, 2024). The digital Elevation Model is from the GEBCO Bathymetric Compilation Group (2019). Section 2.2 and 2.3 for references.
2.2 Climate features and temporal patterns along the west coast of South America
The ITCZ controls precipitation in northern South America (Fig. 2, e.g., Garreaud et al., 2009; Waliser and Gautier, 1993). The latitudinal position and the width of the ITCZ vary at different timescales (e.g., Haug et al., 2001b; Koutavas et al., 2006; Sachs et al., 2009; Yuan et al., 2023). The modern ITCZ migrates in the Pacific region between approximately 10° N in the austral winter to approximately 2–5° N during the austral summer, with a southern extent reaching northern Peru (Fig. 2a and b; Garreaud, 2009; Strub et al., 1998). These seasonal oscillations resemble the trends detected at longer timescales that suggest a migration of the ITCZ to the warmer hemisphere caused by cross-equatorial heat transport (e.g., Haug et al., 2001b; Koutavas et al., 2006; Schneider et al., 2014). This highlights a strong control of temperature differences between the hemispheres, and the energy balance in the tropics on the position of the ITCZ from decadal to orbital timescales (Mohtadi et al., 2016).
The position and intensity of the SPH controls the climate in central Chile (Fig. 2; Ancapichún and Garcés-Vargas, 2015; Barrett and Hameed, 2017; Dima and Wallace, 2003; Garreaud et al., 2009; Strub et al., 1998). At present, the southern extent of the SPH causes warm and dry conditions as far south as ca. 35° S during the austral summer (Fig. 2b), while its southern boundary shifts northward during the austral winter, following the migration of the polar front of the SWWs to around 27° S in modern climate (Fig. 2a; Ancapichún and Garcés-Vargas, 2015; Flores-Aqueveque et al., 2020; Garreaud, 2009; Strub et al., 1998). In addition, the equatorward winds of the SPH enhance upwelling offshore Chile (e.g., Rahn and Garreaud, 2014; Schneider et al., 2017). The ascent of cold subsurface waters causes a cooler and drier atmosphere aloft, and fog formation (e.g., Garreaud et al., 2001, 2008). Moisture spells associated with the SPH are thus primarily sourced from local water.
The SWW belt lies at extratropical and subpolar latitudes (Fig. 2) and undergoes seasonal shifts in configuration (Fig. 2; e.g., Garreaud, 2009; Garreaud et al., 2009; Nakamura and Shimpo, 2004; Strub et al., 1998). During austral winter, modern SWWs split into a subtropical jet at ca. 30–35° S and a subpolar jet at ca. 50–60° S. During the austral summer, the two jets converge into a mid-latitude jet located around 40° S (Bals-Elsholz et al., 2001; Gallego et al., 2005; Garreaud et al., 2009; Inatsu and Hoskins, 2004; Nakamura and Shimpo, 2004). This results in latitudinal migration of SWW-driven precipitation in Chile (Garreaud et al., 2009). During winter, the strengthening of the subtropical jet shifts SWW-driven precipitation northward, while during the austral summer, the alignment of the SWWs with the mid-latitude jet shifts the SWW-driven precipitation southward (Nakamura et al., 2004). On the windward side of the Andes, the SWW-driven precipitation – modulated by the relative strength of the subtropical and mid-latitude jets – is furthermore divided into two zones: a “core” zone corresponding to the primary westerlies storm tracks and a “peripheral” zone influenced by the northward propagation of the disturbances from the core zone. During the austral summer and autumn, the SWW core zone is centered around 50° S and the SWW-driven disturbances (i.e., peripheral zone) extend up to ca. 35° S, where they are blocked by the SPH (see above; Strub et al., 1998). During winter, strong precipitation forming the SWW core prevails south of 40° S, while the strengthening of the subtropical jet drives the SWW-driven precipitation of the peripheral zone northward up to the latitude of 27° S, which corresponds to the southern front of the SPH (Barrett and Hameed, 2017; Flores-Aqueveque et al., 2020; Strub et al., 1998). Note that, in contrast to the moisture spells associated with the SPH, the SWW-driven precipitation originates from more distant water sources along the storm track. Overall, these seasonal changes in precipitation amount as well as moisture sources imply changes in the hydrogen isotope signature of precipitation along Chile that are evaluated further in Sect. 5.2.
Alongside this seasonal variability, climate phenomena acting at intra-annual to decadal timescales influence the climate of the west coast of South America. These include the El Niño-Southern Oscillation (ENSO; e.g., Cai et al., 2020; Garreaud et al., 2009; Montecinos and Aceituno, 2003), the Pacific (Inter)Decadal Oscillation (PDO or ENSO-like variability; e.g., Garreaud et al., 2009; Garreaud and Battisti, 1999; Zhang et al., 1997), the Southern annular mode (Gillett et al., 2006; SAM or Antarctic Oscillation; e.g., Gong and Wang, 1999; Marshall, 2003; Thompson and Wallace, 2000) and the Madden-Julian Oscillation (e.g., Madden and Julian, 1994). Most interannual variance in temperature and precipitation in South America can be explained by ENSO, the PDO and the SAM (Garreaud et al., 2009; Grimm, 2011; Thompson and Wallace, 2000). Here, as the PDO conditions resemble ENSO conditions (further termed here as ENSO-like conditions; Garreaud et al., 2009; Garreaud and Battisti, 1999), we focus on the SAM and the ENSO phenomena.
The SAM affects extra-tropical latitudes in the SH (Garreaud et al., 2009; Gillett et al., 2006; Thompson and Wallace, 2000) and refers to the latitudinal displacement of the SWW belt. A positive mode leads to a strengthened SWWs shifted poleward and a warming of the latitudes south of 40° S, while a negative SAM is associated with an equatorward shift of the SWWs (Garreaud et al., 2009; Thompson and Wallace, 2000). Whereas the SAM primarily affects the extra-tropical latitudes of the SH, the ENSO phenomenon influences all climate systems of South America (e.g., Cai et al., 2020; Garreaud et al., 2009).
The ENSO phenomenon consists of sea-surface temperature (SST) anomalies occurring irregularly every 2 to 7 years in the tropical Pacific (Diaz and Markgraf, 1992) with two typical modes, i.e., the classically defined El Niño and La Niña modes. During the positive or El Niño (negative or La Niña) phase of ENSO, warm (cold) SST anomalies are recorded in the tropical Pacific. During El Niño (La Niña) events, the ITCZ commonly migrates southward (northward) (e.g., Schneider et al., 2014) and has a wider (narrower) width (Fig. 2; Wodzicki and Rapp, 2020). These displacements are associated with changes in the atmosphere-ocean energy balance in the Tropics (Schneider et al., 2014). ENSO also tends to influence the central Pacific Hadley cells that contract equatorward (extended poleward) and strengthen (weaken) during El Niño (La Niña) modes (Li et al., 2023; Nguyen et al., 2013). This results in an equatorward shift of the contracted SPH during El Niño phases (Fig. 2d) and a southward extending SPH during La Niña phases (Fig. 2c; e.g., Campos and Rondanelli, 2023). Similar climate modulations have been observed in connection with the PDO (Ancapichún and Garcés-Vargas, 2015; Pezza et al., 2007). During El Niño events, above-average precipitation also occurs in winter and spring across central Chile (ca. 27–35° S) reflecting a northward shift of SWW-driven precipitation caused by the contraction of the SPH and anticyclonic activities in the Amundsen-Bellingshausen Seas (Fig. 2d; Campos and Rondanelli, 2023; Montecinos and Aceituno, 2003). Conversely, below-average precipitation is associated with the La Niña phase, when the SPH moves south (Fig. 2c; Montecinos et al., 2000; Montecinos and Aceituno, 2003). Overall, the strong response of SWW-driven precipitation to SST anomalies near the Equator highlights the interconnectivity of SH climate features and underlines the presence of atmospheric pathways (or teleconnections).
2.3 Present and past vegetation along Chile
Chile is marked by highly heterogenous vegetation ranging from plant assemblages typical of hyper arid conditions in the north, such as semi-desert scrubs and grasslands, to plant assemblages typical of hyper humid conditions in the south, such as montane evergreen forests (e.g., Luebert and Pliscoff, 2022). Here we focus on describing the dominant macrogroups defined by Luebert and Pliscoff (2022) between the latitudes of 26 and 42° S. Further details on high altitude vegetation or macrogroups occurring in coastal areas can be found in Luebert and Pliscoff (2022).
At present, the Chilean Mediterranean Interior Semi-Desert Scrub & Grassland macrogroup prevails between the latitude of 26 and ca. 32° S (Luebert and Pliscoff, 2022). This macrogroup is composed of drought-resistant plant assemblages and is mainly associated with punctual orogenic precipitation and/or fogs in coastal areas (e.g., Garreaud et al., 2001, 2008). Toward the south, ecosystems typical of Mediterranean vegetation develop with increasing winter precipitation. These includes the Central Chilean Interior Scrub and Chilean Mediterranean Sclerophyllous Forest macrogroups found between ca. 32 and 38° S. Further south, these macrogroups are replaced by the Chilean Mediterranean Deciduous Forest (ca. 35 to 39° S) identified by the presence of Nothofagus obliqua (e.g., Heusser, 2003) and characteristic of more humid conditions (Fig. 1a, Luebert and Pliscoff, 2022). South of 37° S, Mediterranean vegetation is replaced by the Valdivian Lower Montane Deciduous Forest macrogroup occurring between ca. 37 to 42° S and the Valdivian Lower Montane Evergreen Forest macrogroup occurring between ca. 37 and 44° S (Luebert and Pliscoff, 2022). Trees such as Nothofagus obliqua and Nothofagus dombeyi characterize these forests (e.g., Heusser, 2003). These latitudinal changes in plant assemblages align with the detection of higher proportions of herbaceous vegetation relative to woody vegetation under dry conditions derived from land cover data by Gaviria-Lugo et al. (2023a). Despite these important changes in plant assemblages, C4 and CAM plants are only present in minor proportions in the study area (e.g., Arroyo et al., 1990; Powell and Still, 2009; Quezada et al., 2014, 2018) dominated by C3 plants (Powell and Still, 2009).
Evidence from both simulated and palaeobotanical reconstructions suggests important changes in plant assemblages and plant cover in Chile since the Last Glacial Maximum (e.g., Heusser et al., 2006a, b; Werner et al., 2018). At large temporal and spatial scales the reconstruction of Werner et al. (2018) suggested that the modern plant assemblages detected today along Chile were shifted northward and at lower elevation during the LGM. At smaller temporal and spatial scales, several records indicated episodic changes in vegetation over the last 20 ka BP in Chile (e.g., Heusser et al., 2006b; Jara and Moreno, 2014; Jenny et al., 2002a; Maldonado and Villagrán, 2006; Moreno et al., 2010, 2018; Moreno and Videla, 2016; Muñoz et al., 2020; Pesce and Moreno, 2014; Valero-Garcés et al., 2005; Vargas-Ramirez et al., 2008). These changes, mostly associated with past changes in climate, are discussed further in Sect. 5.3.
3.1 Sampling Strategy
The sampling strategy for the modern data set composed of fluvial sediments and used to calibrate the marine archives – for which we report carbon isotope analyses – is described in Gaviria-Lugo et al. (2023a). For hydrogen and carbon isotope analyses, the marine cores GeoB3304-5 (Hebbeln and Shipboard Scientists, 1995) and 22SL (Wiedicke-Hombach and Shipboard Scientific Party, 2002), consisting of approximately 9 m of marine sediments, were sampled with a resolution of ca. 500 years per sample. One to two centimeters of fine hemipelagic sediments were sampled for each depth, specifically targeting the intervals showing low signs of reworking and an absence of turbidite deposits. The samples were stored in pre-combusted glass vials stored in a cold room. To refine age-depth models and complement previously published radiocarbon ages, approximately 50 g of fine hemipelagic sediments were sampled at each targeted depth at sites GeoB3304-5, 22SL and GeoB7139-2.
3.2 Radiocarbon age-depth models
We generated new age-depth models for the three marine sites discussed here using previously published radiocarbon ages (Bernhardt et al., 2015; De Pol-Holz et al., 2010; Martínez Fontaine et al., 2019; Mohtadi and Hebbeln, 2004) supplemented by a set of new radiocarbon ages measured at the Poznań Radiocarbon Laboratory. In total, 6 new radiocarbon ages were acquired on monospecific samples of Globigerina bulloides for site GeoB7139-2, to complete the dataset of Mohtadi and Hebbeln (2004) previously acquired on mixed planktic assemblages. For site GeoB3304-5, the radiocarbon ages published in Bernhardt et al. (2015) were supplemented with 7 new radiocarbon ages from G. bulloides. For site 22SL, the existing radiocarbon ages of De Pol-Holz et al. (2010) and Martínez Fontaine et al. (2019) from monospecific samples of G. bulloides, mixed planktic foraminifera assemblages and mixed benthonic foraminifera assemblages were supplemented by 6 new radiocarbon ages acquired on mixed benthic assemblages (due to the low concentration in planktic foraminifera in the uppermost two meters of sediment). Note that we preferentially selected previously published ages acquired on planktic foraminifera samples over benthic foraminifera samples for core sections with a high density of radiocarbon age measurements (Table 1 reported in Läuchli et al., 2025, see Data availability) as surface waters, in which planktic foraminifera live, are less affected by stratification and ventilation than deeper water masses (e.g., Siani et al., 2013).
The age-depth models were generated using the BACON v3.2.0 Bayesian age-depth model algorithm developed by Blaauuw and Christen (2011). Abrupt changes in sediment accumulation rates as well as turbidites were integrated in the models. To consider the complex ventilation history of the water masses along Chile, two different scenarios were modelled for each site. In the first scenario, we use reservoir ages from offshore Chile combined with the atmospheric SHCal20 calibration curve (Hogg et al., 2020), while in the second scenario, we directly use the Marine20 calibration curve (Heaton et al., 2020) with local corrections to the global ocean reservoir. Further details are given in Sect. 4.1. The parameters used for each BACON age-depth model are detailed in Figs. S3 to S8.
3.3 Lipid extraction and n-alkane abundances
The lipid extraction method of the modern river and marine surface sediments for which carbon isotope measurements are reported here follow the method described in this study (see below). Details regarding calibration settings can be found in Gaviria-Lugo et al. (2023a). For the marine hemipelagic sediments of sites GeoB3304-5 and 22SL, the samples were freeze-dried for 48 h and homogenized in an agate mortar before further treatment. Approximately 20 g of sediments were used to extract and purify lipids following the procedure described in Rach et al. (2020). The total lipid extracts (TLE) were first extracted with a Dionex Accelerated Solvent Extraction system (ASE 350, ThermoFisher Scientific) at 100 °C and 103 bar pressure using a dichloromethane (DCM): methanol (MeOH) mixture (9:1, ). Two extraction cycles of 20 min (static time) were used. The TLE were collected in combusted glass vials and evaporated with nitrogen and spiked with 10 µg of 5α-androstane as internal standard. The organic lipids were then purified and separated into aliphatic, aromatic and alcohol/fatty acid fractions by manual solid phase extraction (SPE) using 8 mL glass columns filled with 2 g of silica gel. Hexane, Hexane : DCM (1:1) and DCM : Methanol (1:1) were used to extract the different fractions. The aliphatic and aromatic fractions showing signs of sulfur were desulfurized by elution with active copper powder. All aliphatic fractions were cleaned by silver nitrate-coated silica gel to remove unsaturated compounds.
The n-alkanes contained in the aliphatic fraction were quantified with an Agilent 7890A gas chromatograph (GC) with a 30 m Agilent DB-5MS UI column (0.25 µm film thickness, 25 mm diameter). The GC was coupled to a flame ionization detector (FID) and an Agilent 5975C mass spectrometer (MS). The internal standard was used to normalize the peak areas of n-alkane and the results normalized to the initial dry weight used for the TLE.
The abundance of the n-alkanes was assessed by the total concentration of the odd-numbered-n-alkanes C25 to C33 of the dry weighted samples. Furthermore, the distribution of the n-alkanes was evaluated using the n-alkane average chain length (ACL) index (i.e., the weighted abundance of higher plant n-alkanes, C25-C35). The ACL index was calculated using the odd-carbon numbered n-alkanes C25 to C33 due to the low abundance of C35 in some samples (Eq. 1).
To evaluate the maturity of the samples and their biological source, we also derived the Carbon Preference Index (CPI) using the concentration of odd- and even-numbered n-alkanes C25 to C33 following Marzi et al. (1993, Eq. 2).
3.4 Hydrogen and carbon isotope analyses
Stable hydrogen (δ2H) and the carbon (δ13C) isotope ratios of the n-alkanes in the aliphatic fraction of the sites GeoB3304-5 and 22SL were measured with a Trace GC 1310 (ThermoFisher Scientific) coupled to a Delta V plus Isotope Ratio Mass Spectrometer (IRMS) (ThermoFisher Scientific) following the procedure described in Rach et al. (2020). 30 m Agilent DB-5MS UI columns (0.25 µm film thickness, 25 mm diameter) were used in the GC. The program used for the GC oven was described in Rach et al. (2014). All measurements were replicated and the average δ2H values was determined for each sample. The associated standard deviation and the number of replicates are reported for each sample.
Before and after each sequence an n-alkane standard mix A6 (n-C16 to n-C30) from A. Schimmelmann (Indiana University) with known hydrogen isotope values was measured and used to correct and transfer the measured δ2H values to the Vienna Standard Mean Ocean Water (VSMOW) scale. The mean standard deviation of all (n) measured for the n-C29 alkane was 1.31 ‰ (n=198) and 1.08 ‰ for the n-C31 alkane (n=199). For all peaks of the A6 standard mix (n=900), we calculated a mean standard deviation of 1.25 ‰. The H3+ factor was determine before each sequence and had a mean of 5.76±0.45 (n=7) over the measuring period.
The carbon isotope ratios of the fluvial and marine surface sediments presented in Gaviria-Lugo et al. (2023a) were acquired following the same procedure. To compare the carbon isotope composition of sedimentary archives from the pre-industrial period with recent sediments, we corrected the δ13C composition of the modern sediments for changes in the carbon isotope composition of the atmosphere caused by anthropogenic activities (Suess effect). Atmospheric CO2 δ13C was ca. −6.6 ‰ before the Industrial Revolution and around −8.4 ‰ in 2015 (Graven et al., 2017). Here, the river sediments sampled in 2019 are regarded as integrating organic matter produced over 5 to 10 years and a correction of 1.8 ‰ (δ13Catm 2015−δ13Catm 1850) was thus applied to their δ13C values. The marine surface sediments sampled between 1 and 2 cm below seafloor (cmbsf) are regarded as integrating over ca. 100 years assuming a sediment accumulation rate of 20 cm kyr−1. A correction of 0.4 ‰ (δ13Catm 1950−δ13Catm 1850) was thus applied to their δ13C values.
Large changes in plant ecophysiology (i.e., C3, C4 or CAM pathway plant assemblages) or their water use efficiency can strongly impact δ2Hwax values (e.g., Feakins and Sessions, 2010; Sachse et al., 2006, 2012). Under evidence for changes in plant ecophysiology or water use efficiency, a correction on δ2Hwax values is thus needed to derive environmental conditions. Along Chile, no correction was applied to the δ2Hwax values as evidence is lacking for significant changes in plant ecophysiology or their water use efficiency in the study area over the last 20 kyr (see below, Sect. 5.1).
3.5 Statistical methods
The isotope ratios reported here were processed using the theory of compositional data analysis (Aitchison, 1982, 2005; Weltje, 2002; Weltje et al., 1996). The isotope ratios were transposed from their conventional notation (δ2H in ‰) into simple ratios (, where R= H H), before being converted into real-valued numbers by log-ratio transformations. The log-ratio transformed data were used to derive simple moving averages (n=15, on the time-series resampled at a frequency of 100 years). All values were transformed back to their native space for further visualizations. Moving averages were used to detect increasing and decreasing trends in the δ2Hwax records.
3.6 GIS methods
To evaluate the controls on the δ2Hprecip signature of modern precipitation along Chile, we extracted catchment-averaged δ2Hprecip values for the month of January, July and for the entire year from the raster maps of Bowen et al. (2005) and Bowen and Revenaugh (2003; Waterisotopes Database, 2017; annual mean, January and July maps) using catchment outlines from the HydroBASINS product (Level 6, Lehner et al., 2006; Lehner and Grill, 2013, Figs. 3 and S2). Catchment-averaged mean annual temperature and precipitation amount were also extracted from WorldClim (WorldClim v. 2.1, 1970–2000, ca. 5 km spatial resolution; Fick and Hijmans, 2017) and the TRMM 3B43 products (European Commission, Joint Research Centre (JRC), 2015), respectively.
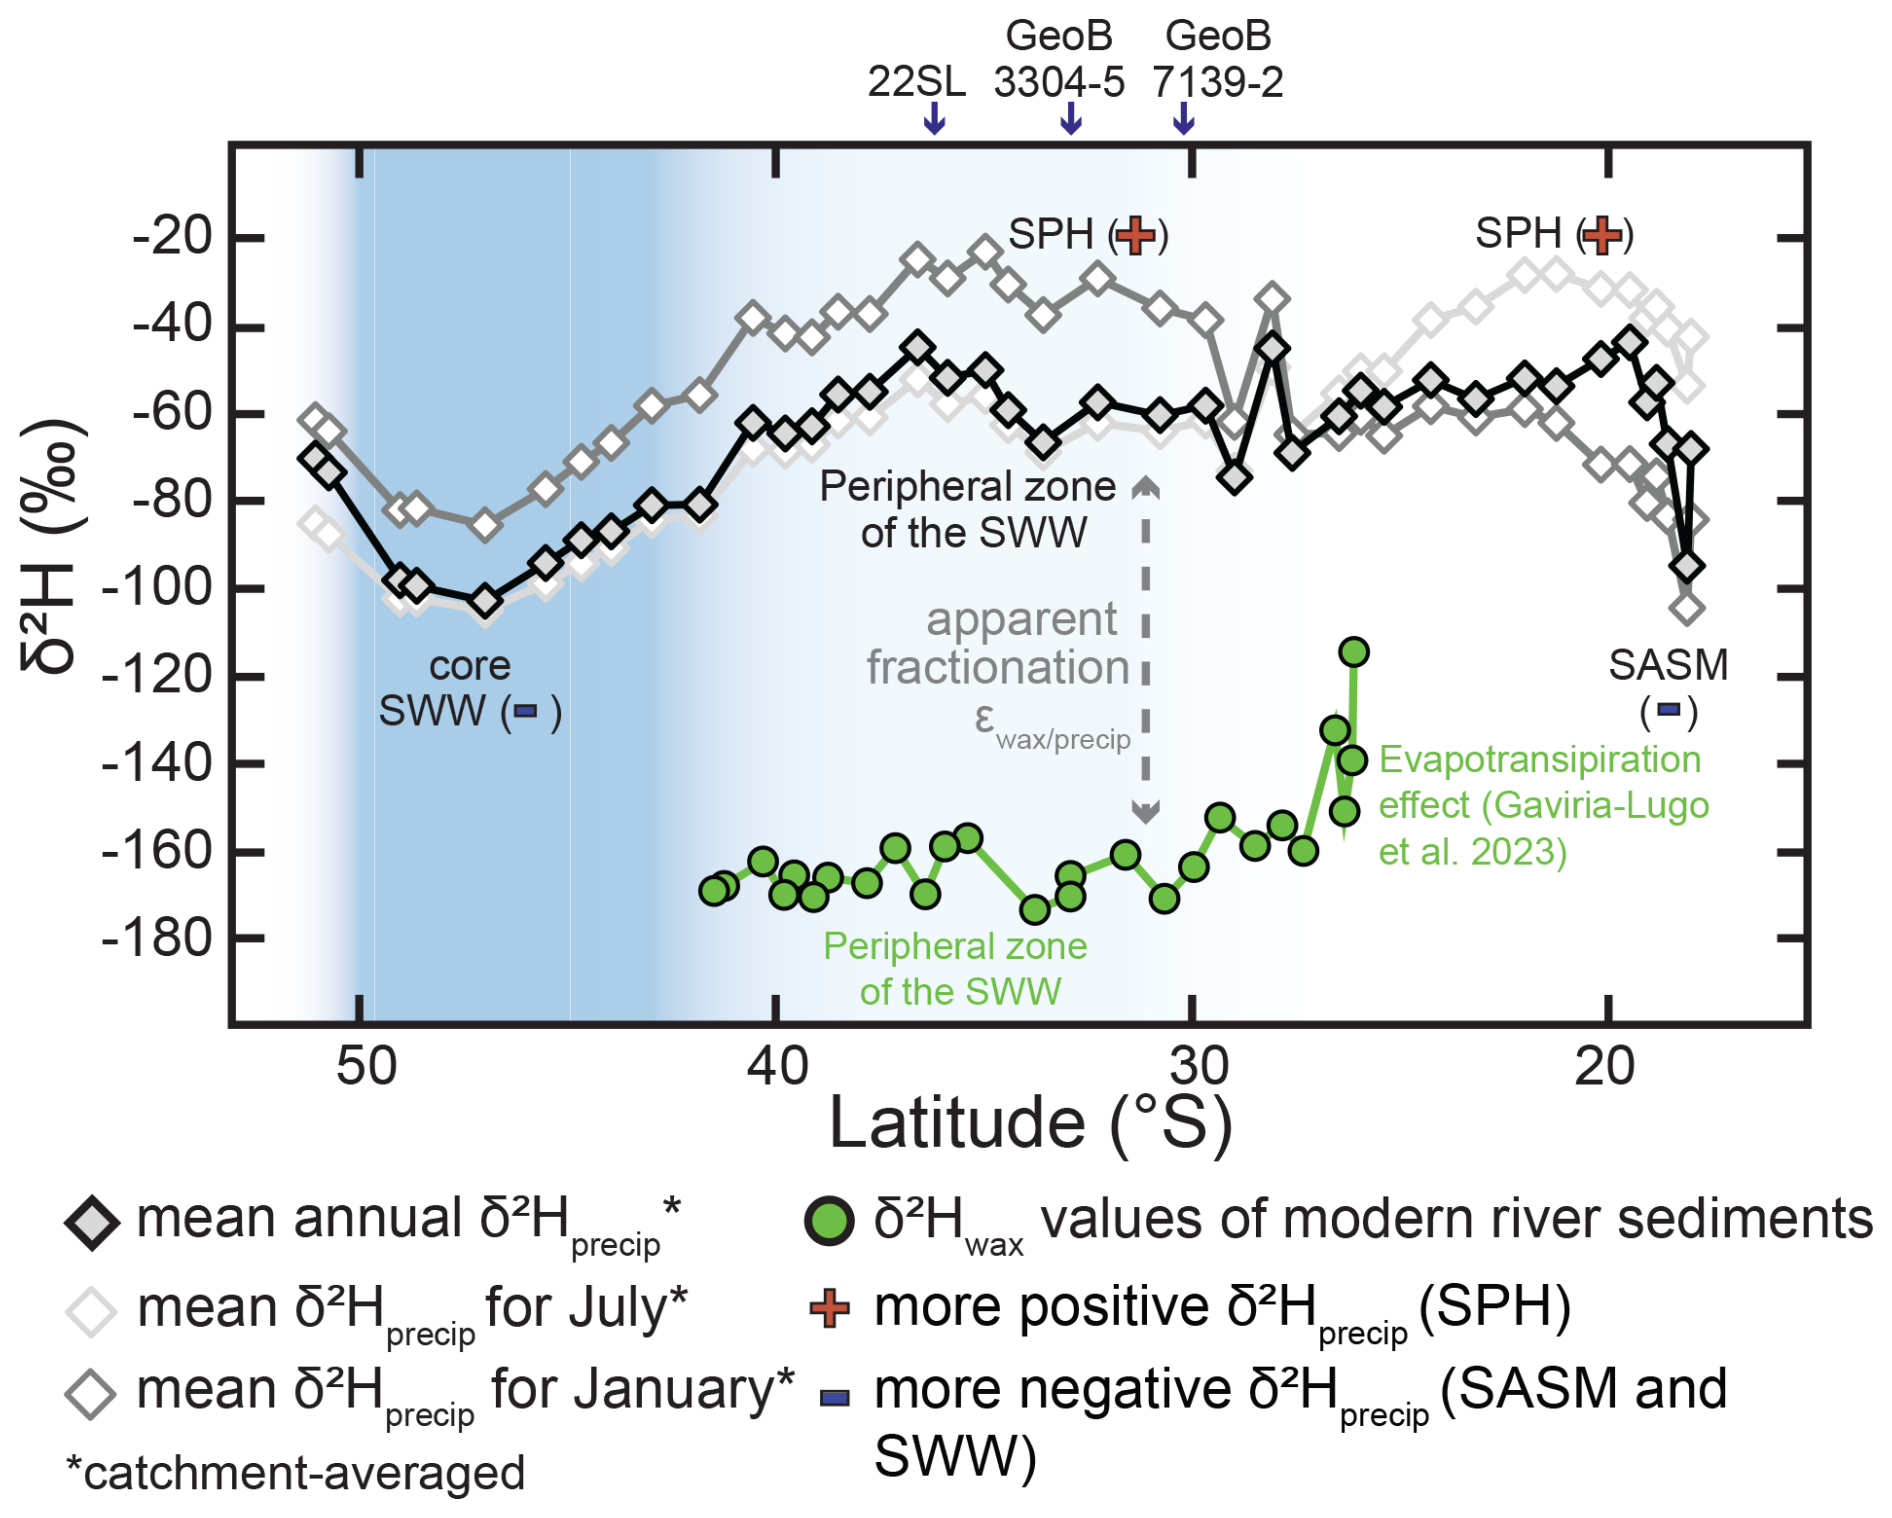
Figure 3Modern catchment-averaged δ2Hprecip values (Sect. 4.2.4) and δ2Hwax values from major river sediments (Gaviria-Lugo et al., 2023a, data licensed under CC-BY-4.0) by latitude in Chile. Note the negative signal of the SWW belt in the three δ2Hprecip models reported here. During austral summer (January), the SPH, characterized by higher δ2Hprecip values due to the more local origin of vapor, is recorded as far south as ca 35° S (Sect. 2.2). The more negative δ2Hprecip values detected north of 27° S are associated with the South American Summer Monsoon (SASM) and thus vapor source from the amazonian basin. During austral winter, the peripheral zone of the SWWs influences precipitation as far north as 27° S, north of which δ2Hprecip values reflect the SPH. Mean annual δ2Hprecip values are mainly controlled by SWW-driven precipitation south of 27° S, as these values resemble those of July, and the SASM-driven precipitation north of 27° S, as values then resemble those of January. The δ2Hwax values of modern river sediments integrating annual precipitation (Gaviria-Lugo et al., 2023a) reflect the signal of the peripheral zone of the SWWs. The blue gradient is a schematic representation of the SWW core and peripheral zones.
4.1 Age-depth models
New age-depth models were established for cores GeoB7139-2 (30° S), GeoB3304-5 (33° S) and 22SL (36° S) using previously published and newly acquired radiocarbon ages (Table 1 in Läuchli et al., 2025, see Data availability). Similar to polar regions, the Chilean active margin is characterized by complex changes in ocean stratification (De Pol-Holz et al., 2010; Haddam et al., 2018; Siani et al., 2013) and the influence of water masses with different reservoir ages (Martínez Fontaine et al., 2019). Under these conditions, the use of the Marine20 calibration curve is not recommended (Heaton et al., 2020). We therefore consider two scenarios. In the first scenario, we apply previously constrained reservoir ages from offshore Chile combined with the atmospheric SHCal20 calibration curve (Hogg et al., 2020) to account for the complex ventilation variability since the Last Glacial Maximum. In the second, used for comparison, we apply the Marine20 calibration curve with local corrections to the global ocean reservoir (see below), acknowledging that this approach does not fully represent the complex stratification and mixing along the Chilean margin.
In the first scenario, the sites are considered influenced predominantly by Subantarctic Water (SAAW) following scenario 1 of Martínez Fontaine et al. (2019). This is supported by the modern occurrence of SAAW at 28° S (Silva et al., 2009) and evidence for a predominant influence of the SAAW at 31° S before ca. 15.5 ka BP (Martínez Fontaine et al., 2019). After around 15.5 ka BP, evidence suggests a mixing of the SAAW, the Equatorial Subsurface Water (ESSW) and the Antarctic Intermediate Water (AAIW) at the studied sites (Martínez Fontaine et al., 2019). However, we followed a conservative approach and attributed the reservoir ages of the SAAW to the entire time-span investigated here as the proportion of the different water masses occurring at each site remains unknown. Furthermore, better constraints exist for the reservoir ages of the SAAW compared to the ESSW near the studied sites. The reservoir ages of the SAAW were determined at 47° S (Haddam et al., 2018; Siani et al., 2013), while the reservoir ages of the ESSW were constrained further away at the equator (Umling and Thunell, 2017). A modification of the reservoir age of the ESSW is also anticipated during its transport south due to potential mixing with Antarctic Intermediate Water (AAIW). A comparison of the reservoir ages of the ESSW and the SAAW suggests a difference of less than ca. 400 years for most of the periods where reservoir ages are available for both water masses since 20 ka BP. An exception occurred at around 14.4 ka BP during which a difference of about 1200 years, caused by the relatively small reservoir ages reconstructed at the equator (Umling and Thunell, 2017), was observed between the reservoir ages of the ESSW and the SAAW. In scenario 1, uncertainties of less than about 400 years are therefore implied for the reservoir ages over the last 20 kyr, with potentially higher uncertainties between 13.8 and 14.8 ka BP. For the first scenario, we thus combined the reservoir ages characterizing the SAAW water mass, as published in Haddam et al. (2018) and Siani et al. (2013), with the SHCal20 calibration curve (Hogg et al., 2020) to reconstruct age-depth models. For each sample, the reservoir age corresponding to the nearest radiocarbon age (14C age) was selected. The reservoir ages derived and used in the BACON v3.2.0 algorithm (Blaauw and Christen, 2011), as well as their references, are reported in Table 1 reported in Läuchli et al. (2025).
In the second scenario, the Marine20 calibration curve (Heaton et al., 2020) was applied directly with corrections to the global ocean reservoir (ΔR) based on n reservoir age deviation from Merino-Campos et al. (2019) reported in the http://calib.org/marine/ (last access: 5 May 2025) database as follows: years for site GeoB7139-2 (n=1), 19±85 years for site GeoB3304-5 (n=6, weighted mean) and 49±30 years for site 22SL (n=6, weighted mean).
In both scenarios, the radiocarbon ages obtained from benthic foraminifera, under the influence of deeper water masses, were corrected using the offsets between benthic and planktic radiocarbon ages reported by Siani et al. (2013) at site MD07-3088 (46° S, 1536 m water depth). The reservoir ages and offsets used in each scenario are provided in Table 1 reported in Läuchli et al. (2025, see Data availability).
The modelled sediment ages span 36 and 1 ka BP (Scenarios 1 and 2, Table 2 reported in Läuchli et al., 2025, see Data availability) for site GeoB7139-2, and up to about 24 and 20 ka BP for sites GeoB3304-5 and 22SL, respectively (Scenarios 1 and 2, Tables 3 and 4 reported in Läuchli et al., 2025, see Data availability). The differences between the two scenarios modelled are reported in the Tables 2 to 4 reported in Läuchli et al. (2025, see Data availability). Reconstructions based on scenario 2 generally yielded older ages compared to those of scenario 1. For sites GeoB7139-2 and GeoB3304-5, the largest differences inferred for the two scenarios during the last 25 kyr were approximately 900 years (Tables 2 and 3 in Läuchli et al., 2025, see Data availability). In contrast, differences up to 2400 years were recorded in site 22SL (between ca. 7 and 9 ka BP in scenario 1). These discrepancies highlight the relatively large uncertainties associated with the age models developed here and the ages inferred throughout this work. However, we consider scenario 1 to more accurately reflect the complex stratification and mixing of the water masses of the study area, which may not be fully captured by the Marine20 calibration curve based on a global-scale simulation. Therefore, we used scenario 1 for further analyses in this study.
4.2 Biomarker analyses
4.2.1 Average chain lengths (ACL), abundances of n-alkanes and Carbon Preference Index (CPI)
The abundance and distribution of n-alkanes in samples from sites GeoB3304-5 and 22SL are reported in Tables 5 and 6 reported in Läuchli et al. (2025, see Data availability). At site GeoB3304-5 (33° S), n-alkane concentrations varied between 0.24 and 4.75 µg g−1 sediment dry weight (dw). At site 22SL (36° S), the n-alkane concentrations ranged between 0.42 and 3.4 µg g−1 dw. Similar ACL were derived for both sites with values ranging between 29.2 and 30 for site GeoB3304-5 and 29.5 and 30 for site 22SL (Tables 6 and 7 in Läuchli et al., 2025, see Data availability). The two most abundant odd-numbered n-alkanes weren-C29 and n-C31, with slightly higher concentrations for the n-C31 homologue. No clear trend was detected in the abundance and distribution of the n-alkanes in the marine archives.
The CPI derived at sites GeoB3304-5 and 22SL displayed values ranging between 4.43 and 9.64. These values indicate higher plant-derived long-chain n-alkanes (Bush and McInerney, 2013; Eglinton and Hamilton, 1967; Rao et al., 2009).
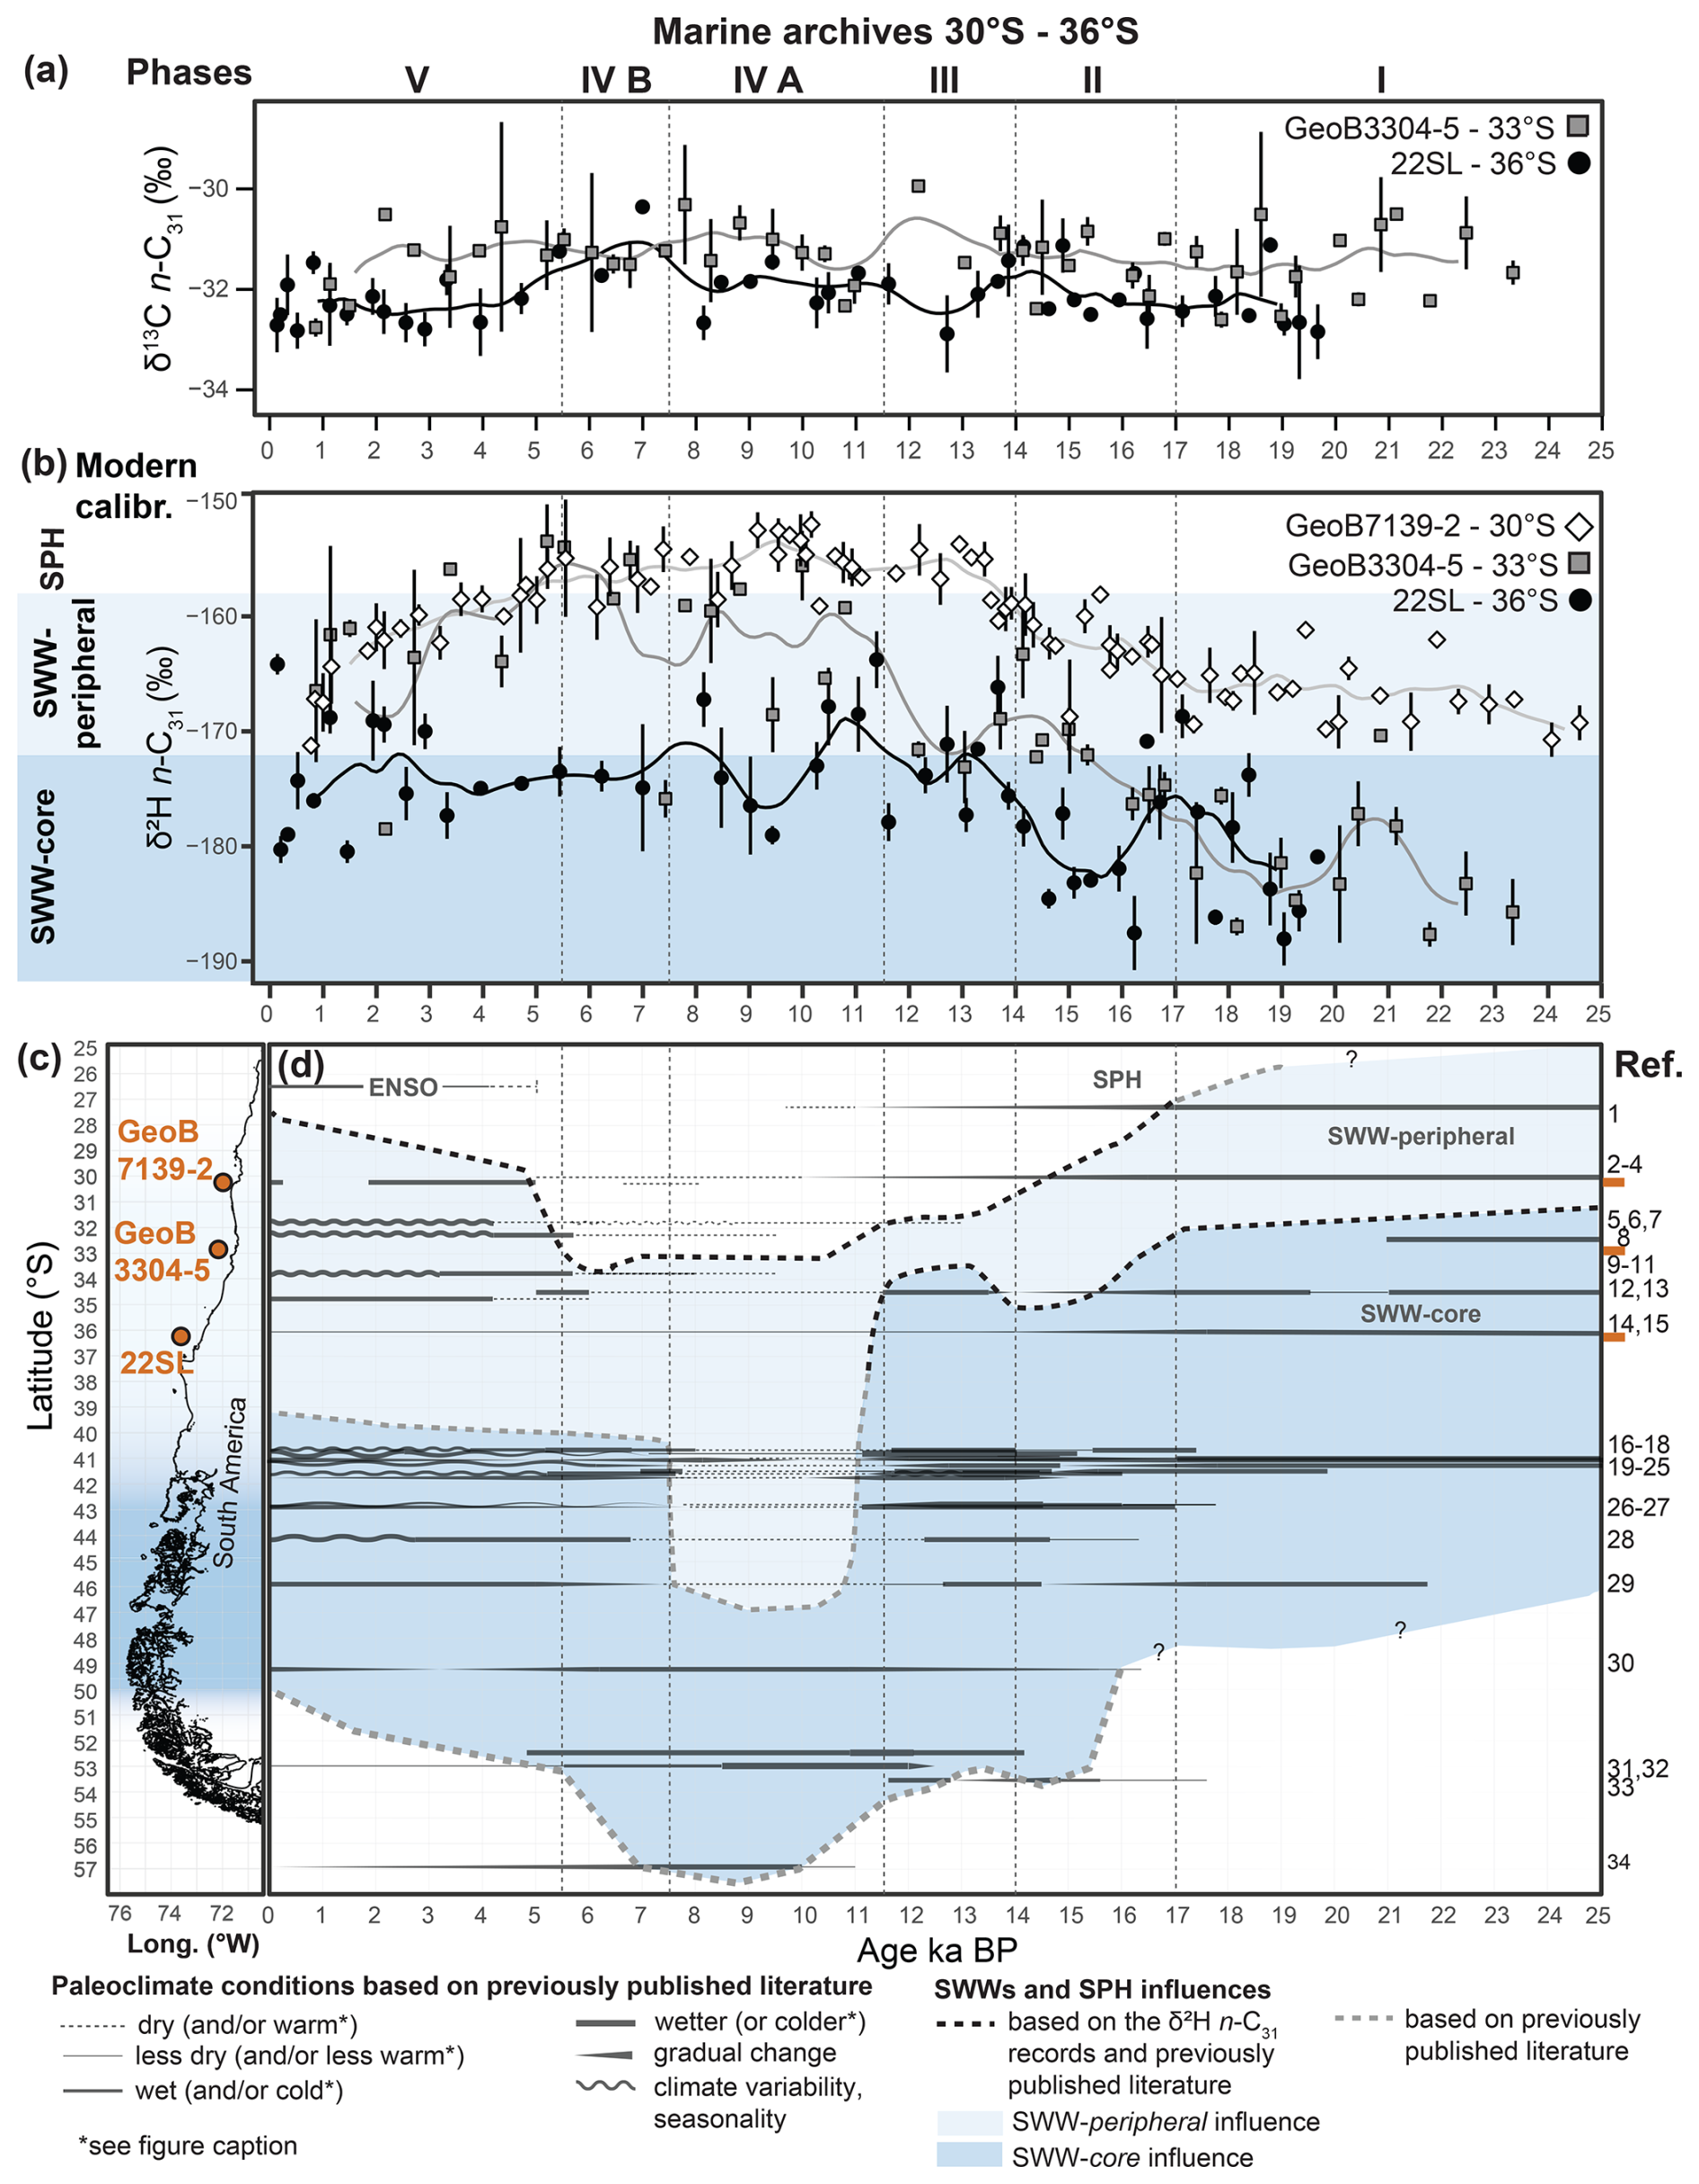
Figure 4Reconstruction of the past extent of the SWW belt and the SPH based on the hydrogen isotope records of leaf-wax n-alkanes (n-C31) and previously published literature (a) δ13Cwax records of sites GeoB3304-5 and 22SL. (b) δ2Hwax records of sites GeoB7139-2 (30° S, Kaiser et al., 2024), GeoB3304-5 and 22SL (this study). (c) Map of the west coast of South America between the latitudes of 25 and 56° S with the locations of the marine sites. (d) Reconstruction of the past extent of the SWW belt and the SPH. Note the southward migration of the SWW belt at around 17 ka BP, its northward migration during Phase III, its abrupt shift southward during Phase IV and its return northward during Phase V. References: (1) Stuut and Lamy (2004), (2) Muñoz et al. (2020), (3) Kaiser et al. (2008), (4) Bernhardt et al. (2017), (5) Ortega et al. (2012), (6) Maldonado and Villagrán (2002), (7) Maldonado and Villagrán (2006), (8) Flores-Aqueveque et al. (2021), (9) Jenny et al. (2002a), (10) Jenny et al. (2003), (11) Villa-Martínez et al. (2003), (12) Valero-Garcés et al. (2005), (13) Frugone-Álvarez et al. (2017), (14) Heusser et al. (2006a), (15) Muratli et al. (2010), (16) Vargas-Ramirez et al. (2008) in which only a cooling was recorded during the ACR, (17) Jara and Moreno (2014), (18) Jara and Moreno (2012), (19) Heusser et al. (2006b), (20) Kaiser et al. (2024), (21) Moreno et al. (2018), (22) Moreno and León (2003), in which only a cooling was recorded during the ACR (23) Moreno and Videla (2016), (24) Moreno (2004), (25) Moreno et al. (2010), (26) Pesce and Moreno (2014), (27) Abarzúa et al. (2004), (28) Haberle and Bennett (2004), (29) Montade et al. (2013) note that in this record, only cold conditions were inferred before 17.8 ka BP, (30) Ashworth et al. (1991), (31) Fesq-Martin et al. (2004), (32) Lamy et al. (2010), centered at 53° S, (33) Heusser et al. (2000), and (34) Perren et al. (2025). See Sect. 5.3.1 to 5.3.5; Sects. S1 to S3 and Fig. S14 for details. Error bars correspond to two standard deviations (2σ) calculated from the values reported in the Tables 5 and 6 reported in Läuchli et al. (2025, see Data availability). The gradient of blue shades in panel C schematically reflects the core and peripheral zone of the SWW belt as shown in Fig. 3.
4.2.2 Leaf-wax n-alkane hydrogen isotope ratios of the marine sites
The hydrogen isotope compositions (δ2Hwax, n-C31) of sites GeoB3304-5 and 22SL varied between −188 ‰ and −154 ‰ and −188 ‰ and −164 ‰, respectively (Figs. 4 and 5, Tables 5 and 6 in Läuchli et al., 2025, see Data availability), while the δ2Hwax values of the n-C29 records varied between −181 ‰ and −145 ‰ and −181 ‰ and −155 ‰, respectively (Figs. S9 to S11, and Tables 5 and 6 reported in Läuchli et al., 2025, see Data availability). Although the n-C29 alkane records closely resemble the δ2Hwaxn-C31 values (Figs. S9 and S10), we utilize the δ2Hwax n-C31 records for further analyses as they can be directly compared to the δ2Hwaxn-C31 record of Kaiser et al. (2024). In site 22SL, δ2Hwax values smoothed using a 1500-year moving average (Sect. 3.5) are relatively stable over time, despite relatively high dispersions of the data (Figs. 4 and S11) and an increase detected in the δ2Hwax n-C31 values between 15 and 13 ka BP (Figs. 4, S10 and S11). At site GeoB3304-5, similar fluctuations were detected in the moving average-smoothed δ2Hwax records of the n-C29 and n-C31 alkanes (Fig. S9). These data suggest past changes in the δ2Hprecip signals along Chile.
4.2.3 Carbon isotope ratios (δ13Cwax) of fluvial and marine sediments
The carbon isotope ratios (δ13Cwax) of leaf-wax n-alkanes in fluvial sediments, corrected for the pre-industrial carbon isotope composition of the atmosphere, ranged from −34.6 ‰ to −26.8 ‰ (n-C31) and −34.2 ‰ to −27.1 ‰ (n-C29, Fig. 1d, Table 7 reported in Läuchli et al., 2025, see Data availability). The δ13Cwax of marine surface sediments, corrected for the pre-industrial carbon isotope composition of the atmosphere, ranged from −34 ‰ to −29.9 ‰ (n-C31) and −33.6 ‰ to −29.3 ‰ (n-C29, Fig. 1d, Table 7 reported in Läuchli et al., 2025, see Data availability). Note that the modern δ13Cwax values of fluvial and marine surface sediments remain unchanged between 30 and 42° S, which aligns with the lack of trends detected in the δ2Hwax values between 27 and 42° S (Gaviria-Lugo et al., 2023a, Fig. 1). Yet, both records display increases north of these latitudes (Fig. 1, Sect. 5.1, Gaviria-Lugo et al., 2023a).
At site GeoB3304-5, the δ13Cwax values varied between −32.7 ‰ and −29.9 ‰ for the n-C31 n-alkane homologue and −32.6 ‰ and −29.3 ‰ for the n-C29 n-alkane homologue (Figs. 4 and S11, Table 5 reported in Läuchli et al., 2025, see Data availability). For site 22SL, the carbon isotope ratios ranged between −32.8 ‰ and −29.9 ‰ for the n-C31 n-alkane homologue and −32.9 ‰ and −30.4 ‰ for the n-C29n-alkane homologue (Figs. 4, S11, Table 4 reported in Läuchli et al., 2025, see Data availability). Relatively stable moving averages were detected in the carbon isotope records at sites GeoB3304-5 and 22SL with both sites displaying similar ranges of values (Figs. 4 and S11).
4.2.4 Catchment-averaged climate variables and δ2H values of modern precipitations along Chile
Catchment-averaged δ2Hprecip values are shown in Fig. 3 and reported in Table 8 reported in Läuchli et al. (2025, see Data availability). The modern mean annual catchment-averaged δ2Hprecip values ranged between ca. −103 ‰ and −44 ‰. Modern mean catchment-averaged δ2Hprecip values ranged between −104 ‰ and −23 ‰ for January and between −105 ‰ and −28 ‰ for July. The modern mean catchment-averaged temperature and precipitation amounts are reported in Table 8 reported in Läuchli et al. (2025, see Data availability). We derived mean annual precipitation amounts of 125 and 264 mm yr−1 for the Elqui and the Limari river catchments, respectively (ca. 30° S). At ca. 33° S, the mean annual precipitation amounts varied between 344 mm yr−1 in catchment of the Aconcagua River and 564 mm yr−1 in the catchment of the Maipo River. At ca. 36° S, mean annual precipitation amounts of 1015 and 1245 mm yr−1 were derived for the catchments of the Itata and Biobío rivers, respectively (Table 8 reported in Läuchli et al., 2025, see Data availability).
5.1 δ13Cwax values as recorders of past changes in plant water use efficiency along Chile
The carbon isotope ratios of leaf-wax n-alkanes (expressed as δ13Cwax values) are mainly controlled by plant ecophysiology (i.e., C3, C4 or CAM plants) and their response to water availability (i.e., water-use efficiency; e.g., Bi et al., 2005; Diefendorf et al., 2015; Liu et al., 2015). At present, the latitudes between 26 and 42° S are characterized by highly heterogenous vegetation, mostly C3 pathway plants (Powell and Still, 2009, Sect. 2.3), and a strong climate gradient, yet the δ13Cwax values from modern river sediments cluster between −34.6 ‰ and −31.3 ‰ (n-C31) between 30 and 42° S (Fig. 1d). This low variability in modern δ13Cwax values is consistent with the predominance of C3 pathway plants and/or suggests similar water use efficiency of the different plant assemblages between 30 and 42° S despite the strong climate gradient of Chile (e.g., Cernusak et al., 2013; Diefendorf and Freimuth, 2017; Kaiser et al., 2008).
The average δ13Cwax values of sites GeoB3304-5 and 22SL remained relatively stable during the last 20 kyr despite evidence for vegetation changes (Fig. S12, e.g., Heusser et al., 2006b; Werner et al., 2018). This suggests similar plant ecophysiology and/or water-use efficiency since the LGM and confirms the secondary role of vegetation type and ecophysiology in setting the isotope composition of leaf-wax plants n-alkanes along Chile.
At present, higher δ13Cwax values characterize the modern arid and hyperarid conditions north of 30° S. The slightly higher δ13Cwax values of the marine archives compared to the present values (corrected for pre-industrial δ13C levels, Fig. 1d) thus suggest overall drier conditions than present at latitudes of 33 and 36° S over the last 20 kyr. Nevertheless, δ13Cwax values above −28 ‰ are absent in the paleorecords. Such values are characteristic of modern latitudes north of 27° S (Fig. 1) and are attributed to plant and soil water evapotranspiration under hyperarid conditions that also affect the hydrogen isotope ratios (Gaviria-Lugo et al., 2023a). We thus hypothesize that the hyperarid conditions of today north of 27° S never occurred at 33 and 36° S during the last 20 kyr.
5.2 Leaf-wax n-alkane hydrogen isotope ratios as a moisture source proxy along Chile
The δ2H values of leaf-wax n-alkanes (Figs. 4 and S11) are mainly controlled by the isotope signature of local meteoric waters (δ2Hprecip) (Gaviria-Lugo et al., 2023a; Sachse et al., 2012). Gaviria-Lugo et al. (2023a) assessed the factors controlling δ2Hwax along Chile and found that modern continental meteoric water δ2H is robustly recorded in offshore δ2Hwax records under humid to arid conditions, while vegetation type is not a significant parameter. With the onset of hyperaridity the relationship between meteoric water δ2H and δ2Hwax ceases to be linear and plant and soil water evapotranspiration additionally leads to higher δ2Hwax signal (> ca. −150 ‰) – confirming sedimentary δ2Hwax as a robust recorder of hydrological change. As high δ2Hwax values (> ca. −150 ‰, Gaviria-Lugo et al., 2023a) do not occur in the marine archives, we interpret the past δ2Hwax records as past changes in δ2Hprecip composition.
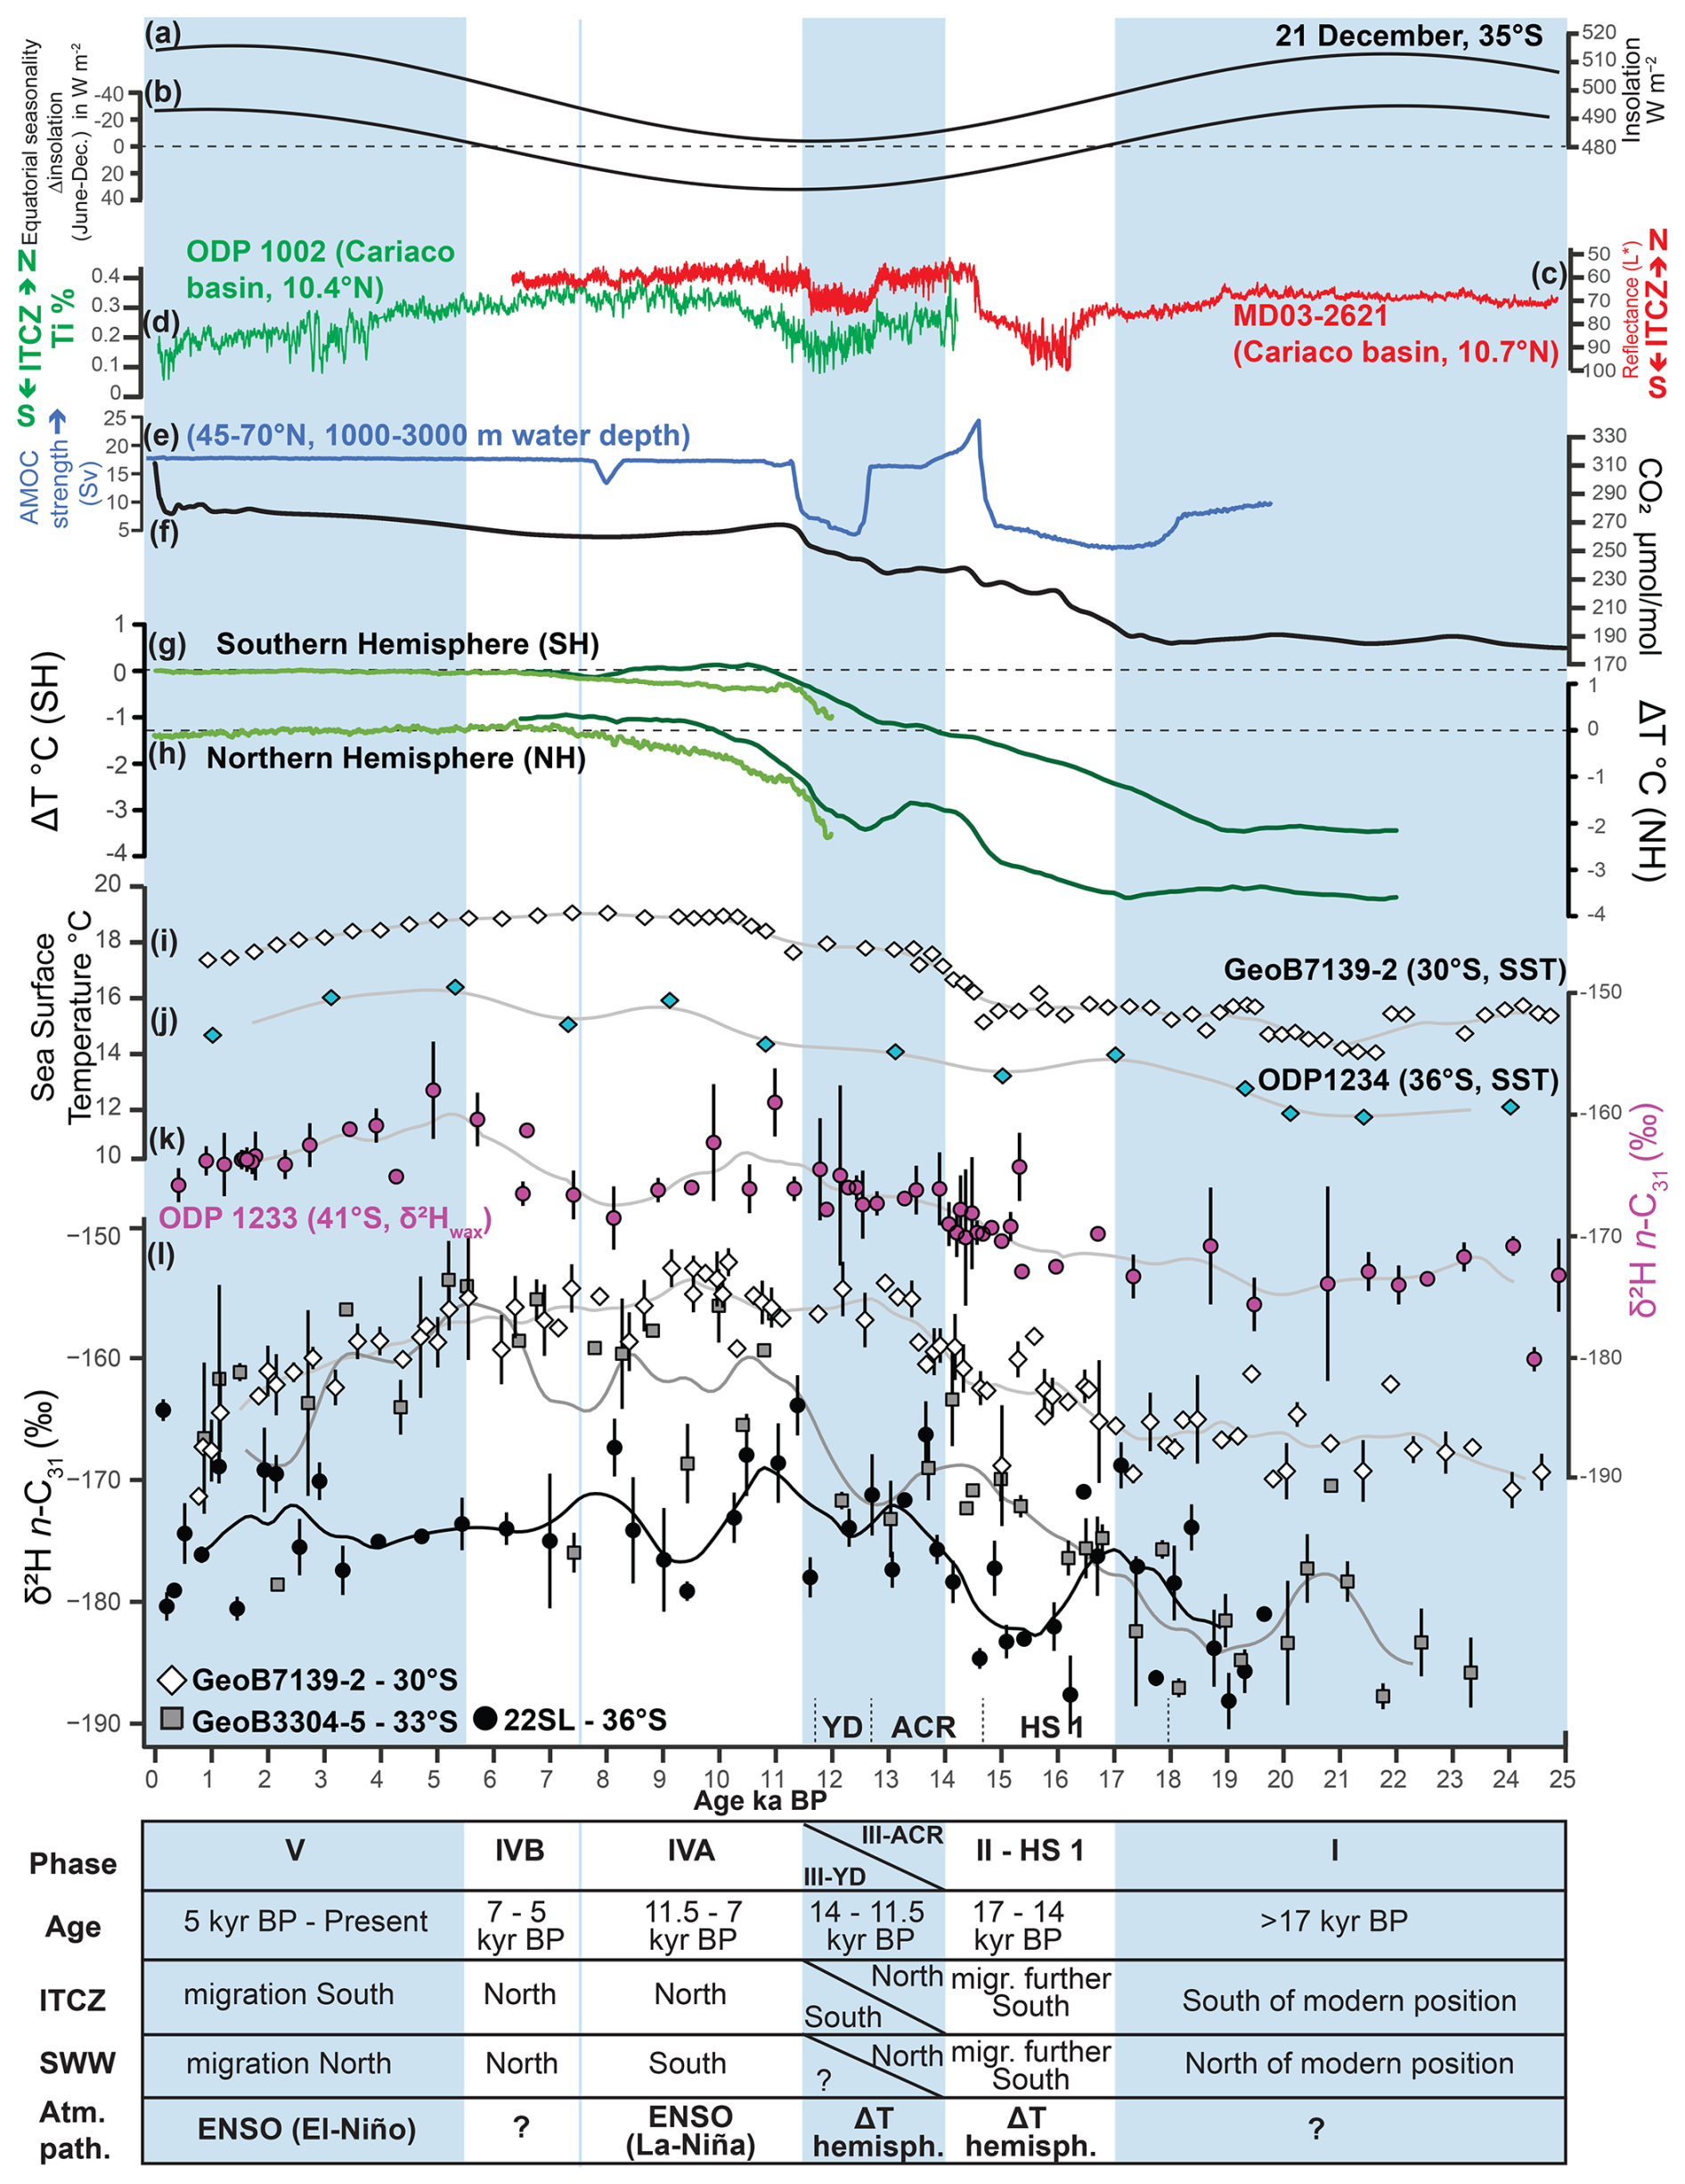
Figure 5Comparison of the leaf-wax n-alkane hydrogen isotope records (n-C31, l) to past changes in insolation (a), seasonality (b) and independent paleoenvironmental records (c–k). (a) Equatorial seasonality modelled as the difference in insolation between June and December at the equator (Berger, 1988; Berger and Loutre, 1991; computed using the palinsol R Package, Crucifix, 2023). (b) Past insolation during the austral summer at the latitude of 35° S (Berger, 1988; Berger and Loutre, 1991; computed using the palinsol R Package, Crucifix, 2023). (c) Reflectance at site MD03-2621 indicating past latitudinal migrations of the ITCZ (Deplazes et al., 2013, data licensed under CC-BY-3.0, https://creativecommons.org/licenses/by/3.0/, last access: 20 October 2025). (d) Titanium content of site ODP 1002 indicating past latitudinal migrations of the ITCZ (Haug et al., 2001b, a, data licensed under CC-BY-3.0). (e) AMOC strength derived from the model of Pöppelmeier et al. (2023b, a, data licensed under CC BY 4.0) for the North Atlantic (45–70° N) between 1000 and 3000 m water depth. (f) Continuous record of atmospheric CO2 (spline-smoothed data) compiled by Köhler et al. (2017a, b, data licensed under CC-BY-3.0). (g) Southern Hemisphere surface temperature from Shakun et al. (2012, © Springer Nature, dark green) and Erb et al. (2022b, a, data licensed under CC BY 4.0, light green) reported as temperature difference to pre-industrial values (ΔT). (h) Northern Hemisphere surface temperature from Shakun et al. (2012, dark green) and Erb et al. (2022b, a, light green) reported as temperature difference to pre-industrial values (ΔT). (i) Sea surface temperature (, SST) at site GeoB7139-2 (30° S, Kaiser et al., 2008, 2024, licensed under CC-BY-4.0). (j) Sea surface temperature (, SST) at site ODP 1234 (36° S, de Bar et al., 2018a, b, data licensed under CC-BY-4.0). (k) δ2Hwax (n-C31) record of site ODP 1233 (41° S, Kaiser et al., 2024). (l) δ2Hwax (n-C31) record of sites GeoB7139-2 (30° S, Kaiser et al., 2024), GeoB3304-5 (33° S) and 22SL (36° S). Error bars in (l) represent two standard deviations (2σ) calculated from the values reported in Tables 5 and 6 reported in Läuchli et al. (2025, see Data availability). Abbreviations: ΔT hemisph.: atmospheric pathways driven by large interhemispheric temperature differences; ACR: Antarctic Cold Reversal; YD: Younger Dryas; HS 1: Heinrich Stadial 1.
The main controls on δ2Hprecip values are air temperature (itself controlled by latitude and elevation, Bowen et al., 2019; Dansgaard, 1964; Rozanski et al., 1993), rainfall amount in tropical regions (Bowen et al., 2019; Dansgaard, 1964), continental re-evaporation (Bowen et al., 2019; Salati et al., 1979), precipitation type (convective or stratiform precipitation, Aggarwal et al., 2016) and/or the moisture source region and vapor transport (Bailey et al., 2018; Bowen et al., 2019; Putman et al., 2017; Tian et al., 2007). The short and homogenous distances to coastline along Chile suggest re-evaporation is unlikely to affect δ2Hprecip values (i.e., δ2Hwax values along Chile). Low to absent correlations determined between catchment-averaged δ2Hprecip values and mean annual precipitation amount (r2=0.22, n=39) also indicate negligible control on δ2Hprecip values by precipitation amount. Catchment-averaged δ2Hprecip values and mean annual temperature are correlated (r2=0.67, n=40 with an increase of ca. 6 ‰ per °C), although this partly results from the modelling of δ2Hprecip values as a function of altitude and latitude (i.e., temperature; Bowen et al., 2005; Bowen and Revenaugh, 2003). A direct comparison of modern δ2Hwax values (n-C31) and mean annual temperature from Gaviria-Lugo et al. (2023a) yields less correlation (r2=0.4, n=26) suggesting a secondary role of temperature in setting δ2Hwax ratios. This secondary role of temperature is confirmed by the divergent response of the GeoB3304-5 and 22SL δ2Hwax records to a ca. 4 °C increase in sea surface temperature observed in the alkenone SST records (UK'37 Index) from nearby sites at 30° S (Fig. 5i, Kaiser et al., 2008, 2024) and 36° S (Fig. 5j, de Bar et al., 2018a). In addition, we consider a change in precipitation type unlikely to explain changes in the δ2Hprecip along Chile as modern precipitation associated with both the SPH and the SWW belt is predominantly stratiform (Viale et al., 2019). By a process of elimination, we thus consider δ2Hprecip values (and thus δ2Hwax ratios) mostly controlled by moisture source origin and vapor transport.
Different moisture sources affect the Chilean climate (Sect. 2). These different moisture sources – evolving at seasonal scale (Sect. 2.2) – are associated with distinct δ2Hprecip signals, as revealed by the modern catchment-averaged δ2Hprecip values along Chile (Figs. 2 and 3). North of 27° S, catchment-averaged δ2Hprecip values more negative than ca. −60 ‰ (January) are associated with South American Summer Monsoon-driven precipitation (SASM, Figs. 2 and 3, e.g., Garreaud et al., 2009; Vera et al., 2006). Such δ2Hprecip values are consistent with water vapor transport over the Amazonian basin (Fig. 2). Note that north of 27° S, mean annual δ2Hprecip values are mainly governed by SASM-driven precipitation. The higher δ2Hprecip values (, Figs. 2 and 3) between ca. 27 and 35° S in January, and north of 27° S in July are consistent with SPH-associated moisture and its more local vapor sources (Sect. 2.2). Further south, SWW-driven precipitation controls δ2Hprecip values. Between ca. 45 and 50° S, values as negative as −100 ‰ characterize the SWW core, while, further north, values around −60 ‰ characterize the peripheral zone of the SWW belt. Note that SWW-driven precipitation controls mean annual δ2Hprecip signals south of 27° S as these values resemble those of July (Fig. 3). This dominant influence of the SWW belt on the mean average hydrogen isotope signature of precipitation is associated with the higher precipitation contribution of the SWW belt compared to the SPH characterized dry conditions (Sect. 2). This dominant influence of the SWW belt on δ2Hprecip values south of 30° S is furthermore confirmed by the modern δ2Hwax values of fluvial and marine surface sediments. Between latitudes of 30 and 33° S, plant growing seasons extend throughout most or all of the year (Hajek and Gutiérrez, 1979). We thus interpret the modern δ2Hwax values between 30 and 33° S as reflecting mean annual δ2Hprecip values and, thus, the hydrogen isotope signal of SWW-driven precipitation. At 36° S, the growing season was determined between October and May (Concepción, Hajek and Gutiérrez, 1979), yet the modern δ2Hwax values reported in Gaviria-Lugo et al. (2023a) still aligns with an influence of the SWW belt. This confirms the predominant role of SWW-driven precipitation in setting mean annual δ2Hprecip values south of 30° S. Past changes in δ2Hprecip values (and thus δ2Hwax values) at a fixed latitude thus reflect mean annual δ2Hprecip values and latitudinal migration of the SPH, the SASM and the SWW belt (see above). As SASM-driven precipitation are largely limited to north of 27° S on the windward side of the Andes by the topographic barrier associated with the Arid Diagonal Zone (Luebert, 2021), we interpret past δ2Hwax records between 30 and 36° S in terms of precipitation associated with the SPH, the peripheral zone of the SWW belt and the SWW core.
We use the modern δ2Hwax values of river sediments reported in Gaviria-Lugo et al. (2023a) to constrain the signal of the peripheral zone of the SWW belt. Under the assumption that modern river sediment δ2Hwax ratios integrate precipitation over the entire year, the values reported in Gaviria-Lugo et al. (2023a) between 30 and 42° S reflect the signal of the peripheral zone of the SWW belt (Fig. 3). We thus derived the 5th and 95th percentiles of the modern δ2Hwax values of rivers located between 30 and 42° S to classify past δ2Hwax records. The δ2Hwax values ranging between −178 ‰ and −156 ‰ (n-C29) and −172 ‰ and −158 ‰ (n-C31) were classified as under the influence of the peripheral zone of the SWW belt. Values above these ranges were classified as under the influence of the SPH and below, as indicating a closer proximity to the SWW core (Figs. 4 and S11). Note that, while the modern δ2Hprecip values cover a range of ca. 60 ‰ , a maximum range of ca. 35 ‰ was recorded by the past δ2Hwax values. This suggests that the latitude between 36 and 30° S did not experienced the entire range of modern conditions (i.e., SWW core to SPH). Nevertheless, we interpret higher δ2Hwax values as indicating a stronger influence of the SPH – that is, drier conditions –, while lower δ2Hwax values reflect a stronger influence of the SWW core – meaning more frequent and intense precipitation.
5.3 Past hydrological regime in central Chile (30 to 36° S)
Here, we first describe the origin of precipitation reconstructed at sites 22SL, GeoB3304-5 (this study) and GeoB7139-2 (Kaiser et al., 2024) and compare it with previously published paleoclimate reconstructions (Sect. 5.3.1 to 5.3.5).
Site 22SL (36° S) is characterized by δ2Hwax values ranging between −181 ‰ and −155 ‰ (n-C29) and −188 ‰ and −164 ‰ (n-C31) that corresponds to an influence of the SWW belt (peripheral and core zones, Sect. 5.2). These δ2Hwax records exhibit considerable scatter, which we attribute to the larger source area at this site compared to sites further north (Fig. S2). The source area of site 22SL encompasses the catchments of the Itata and the Biobío Rivers between 36 and 39° S, while narrower source areas centered around 33 and 30° S characterize sites GeoB3304-5 and GeoB7139-2, respectively. The source area of site GeoB3304-5 corresponds to the catchments of the Maipo and the Aconcagua Rivers (34 to 32° S) and the source area of site GeoB7139-2 to the catchments of the Elqui and Limarí Rivers (29 to 31° S). The records at 36° S are thus more likely to integrate signals from two distinct climate features simultaneously and/or a larger portion of the latitudinal δ2Hprecip range. Alternatively, some alteration of δ2Hwax signals before deposition by mixing with the older sediments stored in the Central Valley (Fig. 1; Lowrie and Hey, 1981) could also explain the dispersion of the data at 22SL, yet the clear trends detected in the nearby high-resolution pollen records of site ODP 1234 (<1 km, Heusser et al., 2006a) suggest terrestrial signals were not significantly altered before deposition. Despite this large scatter, a trend was detected in the δ2Hwaxn-C31 record at 36° S, with lower δ2Hwax values before 14.5 ka BP, suggesting a stronger influence of the SWW core, and slightly higher δ2Hwax n-C31 values after 14.5 ka BP suggesting an influence of the peripheral zone of the SWW belt (Fig. 4). The relatively stable δ2Hwax n-C29 values additionally suggest a persistent influence of the peripheral zone of the SWW belt over the last 20 kyr (Fig. S11). We thus infer a continuous influence of SWW-driven precipitation in the source area of site 22SL for the studied time-span with a potential stronger influence of the SWW core before ca. 14.5 ka BP.
At 33° S (site GeoB3304-5), δ2Hwax values suggest an influence of both the SPH and the SWW belt on local meteoric water composition over the last 20 kyr. Before 17 ka BP, relatively low δ2Hwax values indicate an influence of SWW core precipitation that aligns with the values detected further south (see site 22SL). The records located at 33 and 36° S thus support a northern position of the SWW belt before 17 ka BP that aligns with the δ2Hwax ratios (n-C31) of site GeoB7139-2 (30° S; Kaiser et al., 2024) indicating an influence the peripheral zone of the SWW belt. We thus infer a northern extent of the SWW belt during the LGM (Figs. 4 and S11). The subsequent increases in δ2Hwax values detected at sites GeoB3304-5 (this study) and GeoB7139-2 (Fig. 4, Kaiser et al., 2024) between ca. 17 and 14 ka BP (this study) and ca. 17 and 13 ka BP, respectively, then suggest a southward migration of the SWW belt. This southward migration was likely interrupted between 14 and 11.5 ka BP as a slight decrease in the δ2Hwax value is recorded at 33° S (Fig. 4). Despite these fluctuations, the δ2Hwax records indicate a dominant influence of the SWW belt at 33° S until ca. 11.5 ka BP.
Between 11.5 and 7 ka BP, an influence of both the SPH and the SWW belt is detected at 33° S, with δ2Hwax values ranging between those of sites GeoB7139-2 (30° S, Kaiser et al., 2024) and 22SL (36° S). Site GeoB3304-5 thus likely lay at the boundary between the SPH and the SWW belt at that period, which implies a southward and contracted SWW belt. Between 7 and 5.5 ka BP, a clear influence of SPH-associated moisture is then recorded at 33° S (Figs. 4 and S11) confirming the southward position of the SWW belt. During the last 5.5 kyr, the δ2Hwax records from sites GeoB7139-2 and GeoB3304-5 then converge toward the values recorded further south. This suggests a gradual return northward of SWW-driven precipitation that aligns with the relatively homogenous δ2Hwax values recorded at present along Chile (Figs. 1 and 3, Gaviria-Lugo et al., 2023a). Note that at around 4 ka BP, high variability characterizes the δ2Hwaxn-C29 values of site GeoB3304-5 (Fig. S11), which potentially indicates abrupt climate changes. Overall, the δ2Hwax records of site GeoB3304-5 highlight the strong sensitivity of the latitude of 33° S to past displacements of the SWW belt and the SPH.
The reconstruction of the latitudinal displacement of SSW- and SPH-driven precipitation at 33 and 30° S, alongside compiled paleoclimatic records summarized in Fig. 4, allows defining five phases of hydroclimatic regimes (see below). We acknowledge that the timings of transitions between these phases are relatively uncertain due to uncertainties in our age-depth models (Sect. 4.1), as well as the variability in age constraints in the different records discussed throughout this work. This variability is generally associated with different age-depth model calibrations (e.g., Lamy et al., 1999), low age-depth model resolutions (e.g., Valero-Garcés et al., 2005) and/or different response times of the proxies used (e.g., Tofelde et al., 2021). To validate our results, we compare them with previously published climate reconstructions extending as far south as 56° S to capture the entire structure of the SWW belt. The relative changes in the hydrological regimes of each record are summarized in Figs. 4 and S11, S13 and Table S1 in the Supplement. Note that we consider here almost exclusively past reconstruction of hydrological regimes from low-altitude sites on the windward side of the Andes, as high-altitude or leeward records were potentially influenced by the climate of the lee side of the Andes (e.g., Quade and Kaplan, 2017; Tiner et al., 2018). The overall agreement between past climate conditions inferred from previously published reconstructions and those inferred from past δ2Hwax values corroborate the use of the modern δ2Hwax ratios to calibrate past δ2Hwax records.
5.3.1 Phase I (>17 kyr BP)
Lower δ2Hwax values before 17 ka BP imply a more northern position of the SWW core than today, with wetter conditions between 33 and 36° S. Such conditions are consistent with wet and/or cold conditions previously inferred between 30 and 36° S from stratigraphic, sedimentological, geochemical, and palaeobotanical records distributed onshore and offshore along Chile (Fig. 4, Flores-Aqueveque et al., 2021; Heusser et al., 2006a; Kaiser et al., 2008; Lamy et al., 1999; Valero-Garcés et al., 2005, see Table S1 for more details). In addition, reduced precipitation was inferred at ca. 30° S compared to the southern latitudes by the detection of slightly higher δ2Hwax values at 30° S (Kaiser et al., 2024) indicating an influence of the peripheral zone of the SWW belt, and cold and dry conditions inferred from past glacier dynamics at 31° S (Zech et al., 2007). Overall, these records confirm a northern extent of SWW-driven precipitation during Phase I.
Further south, previously published literature also confirm a northern influence of the SWW core with cold and/or wet conditions inferred between 40 and 46° S from palynological and charcoal records, as well as evidence of high runoff in sedimentary records (Fig. 4, e.g., Heusser et al., 2006b; Montade et al., 2013; Moreno et al., 2018; Moreno and León, 2003, see Table S1 for more details). The lower δ2Hwax values at site ODP 1233 (41° S, Kaiser et al., 2024) relative to the δ2Hwax values recorded during the Holocene also imply a northern position of the SWW core (i.e., wetter conditions, Kaiser et al., 2024). During this period, the full width of the SWW belt cannot be determined as deciphering Pacific from Atlantic moisture sources in records located north of 26° S (e.g., Betancourt et al., 2000; Latorre et al., 2002, 2006) is difficult without constraints on the past hydrogen isotope composition of precipitation. Furthermore, hydroclimate reconstructions are lacking south of 42° S during this period. At the latitude of 46° S, a pollen record exists, yet this record only informs about paleotemperature (Montade et al., 2013). Further south, at ca. 54° S, the pollen record of Heusser et al. (2000) was used to infer hydroclimate, yet this record only extends until ca. 17.6 ka BP. Nevertheless, the relatively dry conditions inferred before 15.5 ka BP at ca. 54° S imply that the core of the SWW belt was located north of this latitude during Phase I (Fig. 4).
5.3.2 Phase II (17 to 14 ka BP)
The southward migration of the SWW belt inferred from the increase in δ2Hwax values at 30 and 33° S during Phase II implies a decrease in humidity, which is recognized in most records along Chile. A gradual decreases in humidity was inferred from grain-size distributions at site GeoB3375-1 between ca. 17 and 11 ka BP (27° S, Stuut and Lamy, 2004) and at site GeoB7139-2 (30° S) between ca. 16 and 12 ka BP (Bernhardt et al., 2017; recalibrated to the new age-depth model). At 33° S, changes in clay assemblages, grain-sizes and sedimentation rates at the marine sites GIK 17748-2 and GeoB3302 also suggested gradually drier conditions after 18 ka BP (Lamy et al., 1999). At 34.5° S, dry conditions were reconstructed in Laguna Tagua Tagua between 17 and 15 ka BP from pollen records and δ18O values (Valero-Garcés et al., 2005). At 36° S, a transition toward drier and warmer conditions was also inferred at ca. 17 ka BP from palynological records and change in sediment provenance at site ODP 1234 (Heusser et al., 2006a; Muratli et al., 2010). However, relatively stable average δ2Hwax values were recorded at site 22SL before 14.5 ka BP. The minor response of site 22SL to the southward migration of the SWW belt is attributed here to the large scatter of the data potentially masking low amplitude changes in the δ2Hwax values. Alternatively, this signal could reflect a persistent influence of the SWW core in the source area of site 22SL. As these two hypotheses support an influence of SWW-driven precipitation in the source area of site 22SL during Phase II, we consider a southward migration of the SWW belt as the most likely scenario during this period.
Between 36 and 46° S, the increase in the δ2Hwax values at site ODP 1233 (Fig. 5, 41° S, Kaiser et al., 2024), and the detection of drier and warmer conditions between ca. 17.8 and 14.8 ka BP from palynological, sedimentary and charcoal evidence (e.g., Montade et al., 2013; Moreno et al., 2018; Moreno and León, 2003; Moreno and Videla, 2016; Pesce and Moreno, 2014, further details in Fig. 4, Fig. S13 and Sect. S1 in the Supplement) also imply a southward migration (or contraction, Kaiser et al., 2024) of the SWW belt. We additionally conclude to a southward migration of the southern limit of the SWW core between 49 and 54° S as transitions from dry to wet conditions were detected starting at ca. 15.5 ka BP at 49 and at 54° S in pollen and beetle records (Ashworth et al., 1991; Heusser et al., 2000). Most records therefore confirm a southward migration of the SWW belt during Phase II.
5.3.3 Phase III (14 to 11.5 ka BP)
Increasing δ2Hwax values in site GeoB7139-2 (Kaiser et al., 2024) and slightly decreasing values in site GeoB3304-5 during Phase III suggest a decoupling of the climate north and south of ca. 32° S. The increasing values at 30° S indicate an increasing influence of the SPH (Kaiser et al., 2024) consistent the drier conditions reconstructed from moisture index records by Bernhardt et al. (2017) and Stuut and Lamy (2004), and the influence of more local moisture spells inferred from the absence of alluvial deposits between 13 and 11.8 ka BP in peat bog deposits (i.e., relatively high local moisture) located at 31.8° S by Ortega et al. (2012). The decreasing δ2Hwax values at 33° S (GeoB3304-5) instead indicate a return northward of SWW-driven precipitation roughly consistent with the colder and/or wetter conditions reconstructed from palynological records at 34.5° S between 13.5 and 11.5 ka BP (Laguna Tagua Tagua, Valero-Garcés et al., 2005). Most palynological, sedimentary and charcoal records located between 40 and 46° S also suggested colder and wetter conditions from ca. 14.8 ka BP and until ca. 12.8 ka BP (e.g., Montade et al., 2013; Moreno et al., 2018; Pesce and Moreno, 2014, Figs. 4, S13 and Sects. S1 and S2 for further references and details). This colder and wetter period was followed by a transition period characterized by slightly less precipitation and climate variability until ca. 11.5 ka BP (e.g., Montade et al., 2013; Moreno et al., 2018; Pesce and Moreno, 2014, Figs. 4, S13 and Sect. S2 for further references and details). Such transition period is however not detected in the δ2Hwax records at site GeoB 3304-5 as this time interval is only covered by one sample. At site ODP 1233 (41° S, Kaiser et al., 2024), the stable values δ2Hwax recorded during Phase III suggest that the northward migration of SWW-driven precipitation only weakly influenced δ2Hwax records in the southern latitudes. During Phase III, we also locate the southern limit of the SWW core at around 54° S as relatively wet conditions were detected from palynological records at ca. 53 °C in a mire (Fesq-Martin et al., 2004), while a drier interval was suggested at 54° S between ca. 14.8 and 12.8 ka BP by the pollen records of Heusser et al. (2000). Overall, these findings confirm a northward migration of SWW-driven precipitation south of 32° S while progressively drier conditions prevailed north of this latitude between ca. 14 and 12 ka BP.
5.3.4 Phase IV (A and B, 11.5 to 5.5 ka BP)
The high δ2Hwax values at sites GeoB7139-2 and GeoB3304-5 during Phase IV suggest the SPH (i.e., dry conditions) reached latitudes as far south as 33° S (Figs. 4 and S11). This agrees with the dry and warm conditions previously detected at 30° S from terrigenous input, sedimentation rates and plant wax n-alkanes records at site GeoB7139-2 (Kaiser et al., 2008) and from pollen moisture index record at the Guanaqueros Bay(30.2° S, Muñoz et al., 2020). Between 32 and 35° S, sedimentological records tracing past lake level fluctuations as well as pollen, microfossils (diatoms and microalgae), charcoal and geochemical records also suggested overall dry conditions until ca. 5.7 ka BP (Jenny et al., 2002a, 2003; Maldonado and Villagrán, 2006; Valero-Garcés et al., 2005; Villa-Martínez et al., 2003) and 4.2 ka BP (Maldonado and Villagrán, 2002, Table S1). This confirms a southern extent of the SPH during Phase IV.
The δ2Hwax values at site GeoB3304-5 (33° S) also showed some lower values between ca. 11 and 7 ka BP. This suggests temporary northward intrusions of SWW-driven precipitation that agrees with the sporadic precipitation events and wetter intervals detected between 11 and 8.5 ka BP in several records distributed between 31 and 33° S in Chile (Jenny et al., 2002a, 2003; Maldonado et al., 2010; Maldonado and Villagrán, 2006; Ortega et al., 2012; Veit, 1996, Table S1). Specifically, evidence for large water level changes at the Laguna Aculeo (34° S) despite overall dry conditions suggests wet intervals between 10 and 9.5 ka BP (Jenny et al., 2002a, 2003). Wetland expansion and evidence for sporadic rainfalls – inferred from pollen records and the presence of alluvial deposits in clayey mud at the Santa Julia archaeological site (31.8° S, Maldonado et al., 2010; Ortega et al., 2012) – also indicated wetter intervals between ca. 10.5 and 8.6 ka BP. This aligns with the reconstruction of a wet phase inferred between ca. 10 and 8.7 ka BP from pollen records at 32.1° S (Maldonado and Villagrán, 2006, swamp forest) and before 7.3 ka BP from geomorphological and pedological evidence found between 27 and 33° S (Veit, 1996). Note that between 8.6 and 6 ka BP, an increase in the frequency of torrential rainfall was also identified in the sedimentological record of the Quebrada Santa Julia archaeological site (31.5° S Ortega et al., 2012). These records support temporary northward intrusions of SWW-driven precipitation during Phase IV and confirm the high sensitivity of site GeoB3304-5 to past δ2Hprecip values.
While predominantly dry and warm conditions prevailed north of 36° S, we recognize two distinct climate periods south of 36° S based on previously published literature. Most palynological, charcoal stratigraphic, sedimentological and geochemical records between 40 and 46° S suggested dry and warm conditions until 7.5 ka BP, after which colder and wetter conditions occurred (e.g., Abarzúa et al., 2004; Moreno et al., 2010, 2018; Pesce and Moreno, 2014, see Figs. 4, S13 and Sect. S3 for further references and details). This implies a northward migration of the SWW core at ca. 7.5 ka BP supported by the lower δ2Hwax values recorded at ca. 8 ka BP in site ODP 1233 (Fig. 5, 41° S, Kaiser et al., 2024). Note however that an increase in the δ2Hwax values at site ODP 1233 was then recorded until 5.5 ka BP (Kaiser et al., 2024) suggesting the latitudinal shift of the SWW core was only brief. During Phase IV, we locate the southern limit of the SWW core south of 56° S between ca. 10 and 7.5 ka BP as suggested by the wet conditions inferred from diatoms assemblages and sediment geochemistry at the Isla Hornos Lake (Perren et al., 2025). After ca. 7.5 ka BP, the SWW core likely migrated northward as drier conditions prevailed after 8.5 ka BP at several sites between 51 and 53° S (Lamy et al., 2010, pollen and sedimentological records) and after 7.5 ka BP at the Isla Hornos Lake at 56° S (Perren et al., 2025, diatom and geochemical records). Because of the pronounced climate changes detected at ca. 7.5 ka BP, we divided Phase IV into Phase IV A (11.5–7.5 ka BP) and B (7.5–5.5 ka BP). Mostly dry conditions prevailed as far south as 56° S during Phase IV A, while a decoupling of the climate north and south of 36° S marked Phase IV B, with dry conditions in the north and wet conditions in the south.
5.3.5 Phase V (last 5.5 kyr)
Decreasing δ2Hwax values at sites GeoB7139-2 and GeoB3304-5 during Phase V suggest a northward migration of SWW-driven precipitation, implying progressively wetter conditions along Chile (Figs. 4 and S11). This agrees with the wetter conditions reconstructed at the Guanaqueros Bay (30° S) after around 5 ka BP (Muñoz et al., 2020, pollen moisture index) and the gradual increase in humidity reconstructed between ca. 5.7 and 4.2 ka BP from pollen records at the Palo Colorado swamp forest (32° S; Maldonado and Villagrán, 2006). An increase in humidity was also inferred between 5.7 and 3.2 ka BP from combined paleoenvironmental tracers at Laguna Aculeo (34° S; Jenny et al., 2002a; Villa-Martínez et al., 2003, Table S1), where higher lake levels were furthermore reconstructed after 6 ka BP (Jenny et al., 2003). A minor change in sediment provenance suggesting a transition toward wetter conditions, and more variable climate were also detected at around 5 ka BP at site GIK 17748-2 (33° S; Lamy et al., 1999). This contrasts with the sedimentological and geochemical records of the Lago Vichuqué (34.5° S) , which indicate a stronger influence of the SPH between 6.2 and 4 ka BP (Frugone-Álvarez et al., 2017). Here, we follow the reconstruction supported by most records and determine the onset of the northward migration of SWW-driven precipitation at ca. 5.5 ka BP.
The high variability of the δ2Hwax n-C29 values at site GeoB3304-5 furthermore indicates some climate variability at ca. 4 ka BP, in line with short-term drought and flood events inferred from pollen records at the Palo Colorado swamp forest after 4.2 ka BP (32° S, Maldonado and Villagrán, 2006) as well as from combined paleoenvironmental tracers at Laguna Aculeo after 3 ka BP (34° S, Jenny et al., 2002a, b, 2003; Villa-Martínez et al., 2003, 2004, see Table S1). Similar climate variability was also detected in Southern Chile.
Between 40 and 46° S , the wet conditions inferred at ca 7.5 ka BP from palynological, charcoal stratigraphic, sedimentological and geochemical records distributed onshore and offshore along Chile (Sect. S3 and Table S1) persisted over the last 5.5 kyr (Fig. 4, Abarzúa et al., 2004; Haberle and Bennett, 2004; Jara and Moreno, 2014; Montade et al., 2013; Moreno, 2004; Moreno et al., 2010, 2018; Moreno and León, 2003; Pesce and Moreno, 2014; Vargas-Ramirez et al., 2008) and progressively led to modern climate (Haberle and Bennett, 2004; Montade et al., 2013; Moreno et al., 2010). This agrees with the northward expansion of the SWW belt previously suggested by the δ2Hwax record at site ODP 1233 (Fig. 5, Kaiser et al., 2024). Superimposed on this progressive increase in precipitation, several records also suggested the occurrence of drier (e.g., droughts) and wetter intervals at centennial to millennial timescales (Abarzúa et al., 2004; Haberle and Bennett, 2004; Jara and Moreno, 2012, 2014; Moreno, 2004; Moreno and Videla, 2016; Pesce and Moreno, 2014; Vargas-Ramirez et al., 2008, Sect. S4 and Table S1). This confirms an overall high climate variability along Chile during Phase V.
During Phase V, we locate the southern limit of the SWW core between 53 and 49° S as dry conditions were inferred during the last 5.5 ka BP between 51 and 53° S based on the pollen and sedimentological records of Lamy et al. (2010), while a return to wetter conditions was inferred from pollen and fossil beetle assemblages after 3 ka BP at 49° S (Ashworth et al., 1991). Considering these findings, we conclude to a northward migration of SWW-driven precipitation, associated with shorter-term climate variability, as the most likely scenario during Phase V.
5.4 Atmospheric pathways of the South American West Coast since the LGM
To investigate the dynamic feedbacks between the climate systems of the west coast of South America, we report and compare the past latitudinal extent of the ITCZ to past latitudes of the SPH and the SWW belt. This allows identifying the dominant large-scale atmospheric circulation pathways (or teleconnections) over the last 20 kyr.
At present, the main atmospheric pathways between tropical and extratropical latitudes in South America are mainly attributed to stationary Rossby wave trains – atmospheric pressure anomalies extending toward the poles (e.g., Mo and Paegle, 2001; Rutllant and Fuenzalida, 1991) – generated by convection at the tropics mainly related to ENSO events (ENSO-atmospheric teleconnections; Cai et al., 2020; Mo and Paegle, 2001; Montecinos and Aceituno, 2003; Rutllant and Fuenzalida, 1991; Turner, 2004; Yeh et al., 2018). Two main atmospheric pathways emerge during ENSO. During the positive phase of ENSO (El Niño), warm SST anomalies and a southward-shifted ITCZ (Schneider et al., 2014) are often associated, through Rossby wave trains, with a positive pressure anomaly over the Amundsen and Bellingshausen Seas, and intensified Hadley cells shifted equatorward in the central Pacific (Li et al., 2023; Oort and Yienger, 1996). This leads to an equatorward displacement of the SPH and a strengthening of the subtropical jet (Cai et al., 2020; Turner, 2004; Yuan et al., 2018) implying enhanced precipitation in central Chile (e.g., Montecinos and Aceituno, 2003; Yeh et al., 2018). El Niño-like teleconnections are thus mainly associated with a southward and northward position of the ITCZ and SWW belt, respectively. The opposite situation tends to prevail during La Niña events (e.g, Campos and Rondanelli, 2023; Sinclair et al., 1997). Cold SST anomalies in the tropical Pacific and a northward-shifted ITCZ are then often associated with a weakened subtropical jet (i.e., a strengthened mid-latitude jet) leading to a decrease in precipitation amounts in central Chile. La Niña events are thus mainly associated with a northward and southward position of the ITCZ and SWW belt, respectively. During ENSO events, the strength of the Hadley cell is mainly controlled by the energy flux at the tropic (Schneider et al 2014).
ENSO events are the primary mode of modern interannual climate variability on the west coast of South America (Garreaud, 2009; Zhang et al., 2022), however, other phenomena such as the Madden–Julian Oscillation or the Pacific Decadal Oscillation (Reboita et al., 2021; Zhang et al., 2022) can interfere with the atmospheric pathways associated with ENSO (Yuan et al., 2018). For instance, during negative ENSO-SAM correlation (e.g., El Niño and a negative SAM, Sect. 2.2, Fogt et al., 2011) – the most frequently observed correlation in recent climate (Carvalho et al., 2005; Dätwyler et al., 2020; Kim et al., 2017) – the above-described ENSO-atmospheric pathways are more frequent. Conversely, when the ENSO-SAM cycles are positively correlated (e.g., La Niña and a negative SAM), these pathways tend to be reduced (Dätwyler et al., 2020; Fogt et al., 2011; Fogt and Bromwich, 2006).
Different atmospheric pathways have been invoked to explain past climate, in which the migration of the ITCZ to the warmer hemisphere – associated with large interhemispheric thermal gradient and cross equatorial heat transport from the warmer to the colder hemisphere (Bjerknes, 1964; Bordoni and Schneider, 2008; Broccoli et al., 2006; Geen et al., 2020; Schneider et al., 2014) is thought to weaken the Hadley cell in the hemisphere to which it migrates (Broccoli et al., 2006; Ceppi et al., 2013; Chiang et al., 2014; Chiang and Bitz, 2005; Chiang and Friedman, 2012; Lee et al., 2011; Lindzen and Hou, 1988; Prohaska et al., 2023). A weakening of the Hadley cell, in turn, results in a weaker subtropical jet and a shift southward of the Westerlies storm tacks, and vice versa (Ceppi et al., 2013; Chiang et al., 2014; Lee et al., 2011; Lindzen and Hou, 1988). Such climate conditions resemble modern seasonal climate changes and imply a southern position of the ITCZ associated with a southern position of the SWW belt, and vice versa. These atmospheric pathways were mainly invoked to explain past climate associated with abrupt changes in interhemispheric temperature (e.g., Chiang et al., 2014; Lee et al., 2011).
Considering the control exerted by the above-mention atmospheric pathways on climate, any changes in the leading atmospheric pathway regime should be reflected by changes in hydroclimate along the west coast of South America. We thus use our reconstruction of the SWW belt, compared to the past latitudes of the ITCZ, to identify dominant atmospheric pathways influencing the South American climate during the last 20 kyr. Our approach focuses exclusively on the influence of the SWW belt and the ITCZ on hydroclimate in Chile. Yet, as these features act at a larger scale, we encourage future research assessing and comparing our results to climate reconstructions at other locations, such as Southwestern Africa or Australia.
5.4.1 Last Glacial Maximum: Phase I (>17 ka BP)
During Phase I, The ITCZ was located south of its modern position (Figs. 5 and S14, Arbuszewski et al., 2013; Koutavas et al., 2002; Koutavas and Lynch-Stieglitz, 2004; Reimi and Marcantonio, 2016; Yuan et al., 2023) and the SWW belt extended as far north as at least 30° S. Such southern and northern positions for the ITCZ and the SWW belt, respectively, imply a contracted Hadley cell consistent with the lack of evidence for a signal of the SPH at the studied sites. A southward ITCZ is furthermore consistent with a colder NH relative to the SH during the LGM (e.g., Annan et al., 2022; Osman et al., 2021; Shi et al., 2023). Yet, considering the mechanisms described by Lee et al. (2011), Ceppi et al. (2013) or Chiang et al. (2014), such conditions also imply a weaker subtropical jet and a shift southward of the SWW belt, which is not consistent with our observations. The northern position of the SWW belt during the LGM thus suggests that mechanisms differing from the above-mentioned ones might have acted on the climate during this period. Further in-depth investigation of climate under the conditions of an ice age – not acquired within the scope of this study – are needed to explain the observed conditions. Particularly, future research should focus on examining the influence of sea ice-wind interactions on regional hydroclimate.
5.4.2 The deglaciation period: Phase II and III (17–11.5 ka BP)
During the deglaciation period (Phase II and III, ca. 17–11.5 ka BP), the climate conditions along the west coast of South America are consistent with the atmospheric pathways described by Lee et al. (2011) and Chiang et al. (2014). Southward shifts of the SWW belt – derived from paleoclimate reconstructions including our δ2H records (see above) – are associated with southward positions of the ITCZ, such as during Phase II (17–14 ka BP, Fig. 5; Arbuszewski et al., 2013; Deplazes et al., 2013; Yuan et al., 2023), roughly corresponding to the Heinrich Stadial I (HS 1, ca. 18–14.7 ka BP, Naughton et al., 2023) or the Younger Dryas (YD, 12.9–11.6 ka BP, Fig. 5; Deplazes et al., 2013; Haug et al., 2001b). Inversely, northward shifts of the SWW belt are associated with northward shifts of the ITCZ, such as during Phase III (Fig. 5; Deplazes et al., 2013; Pedro et al., 2016; Yuan et al., 2023), which roughly corresponds to the Antarctic Cold Reversal (ACR; 14.7 to 13 ka BP; Pedro et al., 2016). Note that some uncertainties are associated with the conditions reconstructed during the Younger Dryas as high-resolution δ2Hwax records are lacking during this period. The southern latitude of the SWW belt during the Younger Dryas is thus deduced solely from evidence of reduced precipitation between 40 and 46° S (Montade et al., 2013; e.g., Moreno et al., 2018; Moreno and León, 2003). Nevertheless, the climate conditions of the deglaciation period align with atmospheric pathways associated with large changes in interhemispheric thermal gradients and a modulation of the Hadley cell circulation (e.g., Chiang et al., 2014; Lee et al., 2011). Specifically, during Phase II and the Younger Dryas, southward shifts of the ITCZ likely caused a reduction of the SH Hadley cell in turn weakening the subtropical jet and strengthening the mid-latitude jet (Chiang et al., 2014; Lee et al., 2011; Pedro et al., 2018). During the ACR, the opposite conditions prevail and a decoupling of the climate is detected north and south of 32° S – confirmed at larger scale by Pedro et al. (2016). This decoupling likely resulted from the stronger subsidence of the air masses of the Hadley cell (i.e., a stronger SPH) leading to a stronger subtropical jet and the blocking of the disturbance of the SWW belt south of 32° S. Here, high-resolution reconstructions of regional climate thus helped identifying large-scale circulation pathways resulting from large changes in the interhemispheric thermal gradient.
Consensus exists on the predominant role of the interhemispheric thermal gradient on large-scale oceanic and atmospheric circulation changes during the deglaciation period (Fig. 5, Osman et al., 2021; Shakun et al., 2012). The atmospheric pathways reconstructed during the deglaciation period are consistent with these findings. During Phase II and the Younger Dryas, the southward positions of the ITCZ and the SWW belt are in line with large temperature differences between the hemispheres and a colder NH relative to the SH (Bjerknes, 1964; Osman et al., 2021; Pedro et al., 2018; Schneider et al., 2014; Shakun et al., 2012) resulting from reduced AMOC (Fig. 5, Crowley, 1992; Deplazes et al., 2013; Haug et al., 2001b; McManus et al., 2004; Moreno-Chamarro et al., 2019; Pedro et al., 2016, 2018; Pöppelmeier et al., 2023b). Inversely, during the Bølling-Allerød interstadial period (or ACR), the northward migration of the ITCZ and the SWW belt are associated with a decrease in interhemispheric thermal gradient caused by the relative warming of the NH compared to the SH (Fig. 5, Deplazes et al., 2013; Osman et al., 2021; Pedro et al., 2016; Shakun et al., 2012; Yuan et al., 2023) resulting from a strengthened AMOC (e.g., McManus et al., 2004; Pöppelmeier et al., 2023b). This confirms the influence of the mechanisms described, among others, by Lee et al. (2011) and Chiang et al. (2014) on the climate of the west coast of South America during the deglaciation period.
5.4.3 The Holocene (Phase IV A and B, 11.5–5.5 ka BP and Phase V, 5.5 ka BP–present)
During the Holocene, insolation is considered the main forcing of climate as stable AMOC strength (Lippold et al., 2019; McManus et al., 2004; Pöppelmeier et al., 2023b) and stable atmospheric CO2 concentrations characterize this period (Köhler et al., 2017a; Monnin, 2006). Specifically, lower summer insolation is recorded in the SH relative to the NH during the early Holocene (Phase IV A, Fig. 5, Berger, 1988) likely causing a relative cooling of the SH, whereas the opposite conditions prevail during the late Holocene (Phase V). Furthermore, at the late Holocene, the relative warming of the NH compared to the SH was likely enhanced by the larger proportion of landmasses in the NH compared to the SH, responding faster to temperature changes than oceans (e.g., Byrne and O'Gorman, 2013; Joshi et al., 2008). The transition between these two periods (mid-Holocene, between Phase IV B and V) was characterized by lower seasonality (Berger, 1988). The above-mentioned changes in insolation imply changes in the interhemispheric thermal gradient, yet the Holocene is characterized by overall small temperature differences between the hemispheres (Fig. 5; Erb et al., 2022b; Osman et al., 2021; Shakun et al., 2012). Some mechanisms, such as atmospheric circulation pathways, therefore likely partly or entirely compensated the insolation effect on the temperature of the hemispheres. Alternatively, the effect of insolation on the interhemispheric thermal gradient was only minor compared to the effect of changes in AMOC strength detected during the deglaciation period.
During the Holocene, we identify different atmospheric pathways based on the climate conditions reconstructed along the west coast of South America – inferred from paleoenvironmental records and δ2H records. These pathways align with past changes in insolation. During most of the early and late Holocene (Phase IV A and V), climate conditions resemble those observed during modern-day ENSO events. Specifically, during Phase IV A (11.5–7.5 ka BP), a northward position of the ITCZ (Fig. 5; Arbuszewski et al., 2013; Haug et al., 2001b; Koutavas et al., 2006; Reimi and Marcantonio, 2016; Schneider et al., 2014; Yuan et al., 2023) – consistent with lower summer insolation in the SH relative to the NH – is associated with a southward SWW belt (Sect. 5.3.4). These conditions resemble La Niña events and/or a positive SAM phase also inferred elsewhere in South America during the same period (Carré et al., 2012; Jenny et al., 2002a; Koutavas et al., 2002; Ortega et al., 2012; Vargas et al., 2006). During the last 5.5 ka BP (Phase V, late Holocene), the opposite conditions prevail. The ITCZ was progressively shifted southward (Fig. 5, Haug et al., 2001b; Schneider et al., 2014; Yuan et al., 2023), reflecting the progressive increase in summer insolation in the SH relative to the NH, while the SWW belt gradually migrated northward (Sect. 5.3.5). This progressive onset of El Niño-like conditions (and/or a negative SAM) aligns with previously publish studies (Haug et al., 2001b; Jenny et al., 2002a; Lamy et al., 2010; Ortega et al., 2019; Sandweiss et al., 1996; Vargas et al., 2006) and the detection of muted ENSO conditions during the mid-Holocene (ca. 5–3 ka BP, e.g., Chen et al., 2016; Emile-Geay et al., 2016; Koutavas and Joanides, 2012). We thus conclude to a relationship between insolation, atmospheric pathways resembling those of modern ENSO events and regional climate during most of the Holocene. Note that our findings do not resolve individual ENSO events and only inform about atmospheric pathways resembling those associated with modern ENSO events. During modern ENSO events, the position of the ITCZ is for instance determined by changes in the energy balance at the tropics and the ITCZ does not typically migrate to the warmer hemisphere. Further investigations, not performed within the scope of this study, are thus needed to confirm a relationship between the changes in sea surface temperature in the Equatorial Pacific – diagnostic of ENSO events – and the atmospheric pathways detected during the Holocene. Our results nevertheless confirm a predominant role of atmospheric pathways resembling those associated with modern ENSO events during the Holocene. Furthermore, their strong response to past changes in insolation highlights the major role of precession cycles (i.e., insolation, Lamy et al., 2019) in setting circulation regimes, and thus regional climate along the west coast of South America during this period.
Between 7.5 and 5.5 ka BP (Phase IV B), the climate mechanisms however remain unclear. Both the ITCZ and the SWW core are then located northward, which resemble the climate conditions of the ACR (see above). Yet, a small interhemispheric thermal gradient mark this period (Fig. 5, Erb et al., 2022b). Both atmospheric pathways resembling those associated with ENSO and those resulting from large interhemispheric thermal gradients therefore cannot explain these climate conditions. Furthermore, time lags are detected between the northward migration of the SWW core at ca. 7.5 ka BP and the short-term decrease in the AMOC strength associated with the NH 8.2 ka BP cooling event (e.g., Renssen et al., 2001; Thomas et al., 2007), the lower seasonality detected at ca. 6 ka BP (Fig. 5, Berger, 1988) and muted-ENSO detected between ca. 5 and 3 ka BP (see above). Here, we hypothesize that Phase IV B climate could result from a positive ENSO-SAM correlation attributed in recent climate to internal forcings (Dätwyler et al., 2020). This agrees with La Niña-like conditions detected north of 36° S (this study, Carré et al., 2012, 2014; Salvatteci et al., 2019; Vargas et al., 2006), while the latitudes south of 36° S resembled El Niño conditions and/or a negative SAM phase. We however consider that further in-depth investigation, not performed within the scope of this study, are needed to understand further such correlations in the climate context of Phase IV B.
This study provides a new, high-resolution reconstruction of past hydrological regimes along Chile over the last 20 000 years, based on δ2 Hwax records from marine sediments at key latitudes spanning the interface between the Southern Westerly Wind (SWW) belt and the Subtropical Pacific High (SPH). Our results demonstrate that δ2 Hwax records, along with previously published hydroclimate reconstructions, can be used to infer the past location of the SWW belt, with more negative δ2 Hwax values suggesting wetter conditions and a more northerly position of the SWW belt and more positive δ2 Hwax values indicating drier conditions and a more southerly position of the SWW belt. Specifically, our records suggest that central Chile was marked by wet conditions and a northerly SWW belt during the Last Glacial Maximum, after which increasingly drier conditions linked to a southward migration of the SWW belt marked the deglaciation period. This southward migration was partly interrupted during the Antarctic Cold Reversal. During the early Holocene, the SWW belt and the SPH reached their southernmost latitudes, as suggested by the dry conditions that characterized central Chile at that time. At ca. 7.5 ka BP, a displacement northward of the SWW-core was detected from wetter conditions reconstructed south of 36° S. The late Holocene was then marked by a progressive northward shift of the SWW belt inferred from a gradual increase in moisture in central Chile over the last 5.5 kyr. By integrating these new δ2 Hwax records with reconstructions of past ITCZ positions, we identify major shifts in circulation regimes.
Our reconstruction, combined with past reconstructions of the ITCZ, reveals two dominant atmospheric pathways modulating the climate of the South American west coast since the LGM. During the deglaciation period, atmospheric pathways driven by large interhemispheric temperature contrasts and variations in the Hadley cell strength likely prevailed, whereas during the Holocene – except between 7.5 and 5.5 ky BP – circulation patterns resembling modern ENSO dynamics were the primary influence. These shifts reflect changing dominant climate drivers: Atlantic Meridional Overturning Circulation (AMOC) and interhemispheric temperature contrasts during the deglaciation period, and orbital insolation forcing (precession) during most of the Holocene. Our results demonstrate the power of δ2Hwax records to resolve complex hydroclimate patterns and highlight the critical need to better constrain large-scale atmospheric pathways to fully unravel past climate variability. Strengthening such constraints is essential for improving predictions of how evolving circulation regimes – amplified by a growing interhemispheric temperature gradient (Friedman et al., 2013) – will shape regional climates in the future.
All data generated or analysed during this study (Tables 1 to 8, reported in the data publication) can be found in the following GFZ Data Services repository: https://doi.org/10.5880/fidgeo.2025.050 (Läuchli et al., 2025).
The samples with are listed in the following GFZ Data Services repository: https://doi.org/10.5880/fidgeo.2025.050 (Läuchli et al., 2025).
The supplement related to this article is available online at https://doi.org/10.5194/cp-21-2083-2025-supplement.
CL: conceptualization, data curation, methodology, supervision, formal analysis, investigation, validation, visualisation, project administration, writing original draft, review and editing. NGL: formal analysis, investigation, writing reviews. AB: conceptualization, funding acquisition, project administration, resources, supervision, writing reviews. HW: conceptualization, funding acquisition, writing reviews. PF: conceptualization, writing reviews. MM: resources, writing reviews. AL resources, writing reviews. DS: conceptualization, funding acquisition, project administration, resources, supervision, writing reviews.
The contact author has declared that none of the authors has any competing interests.
Publisher’s note: Copernicus Publications remains neutral with regard to jurisdictional claims made in the text, published maps, institutional affiliations, or any other geographical representation in this paper. While Copernicus Publications makes every effort to include appropriate place names, the final responsibility lies with the authors. Views expressed in the text are those of the authors and do not necessarily reflect the views of the publisher.
This research was funded by the DFG grants BE 5070/6-1 (to AB), WI 3874/7-1 (to HW) and SA1889/3-1 (to DS) as part of the German Science Foundation (DFG) priority program SPP-1803 “EarthShape: Earth Surface Shaping by Biota”. The MARUM Research Center (Bremen) provided the GeoB cores samples and the 22SL Gravity Core was provided by the Bundesanstalt für Geowissenschaften und Rohstoffe (BGR, Hannover). We thank the Chilean National Park Service (CONAF) for providing on-site support of our research. We thank Esteban Andrés Rodríguez Sepúlveda for help with sampling rivers and Oliver Rach, Emily Ikawi and Gero Fischer for support with lab work.
This research has been supported by the Deutsche Forschungsgemeinschaft (grant nos. BE 5070/6-1, WI 3874/7-1, and SA1889/3-1).
The article processing charges for this open-access publication were covered by the Freie Universität Berlin.
This paper was edited by Erin McClymont and reviewed by two anonymous referees.
Abarzúa, A. M., Villagrán, C., and Moreno, P. I.: Deglacial and postglacial climate history in east-central Isla Grande De Chiloé, Southern Chile (43° S), Quat. Res., 62, 49–59, https://doi.org/10.1016/j.yqres.2004.04.005, 2004.
Aggarwal, P. K., Romatschke, U., Araguas-Araguas, L., Belachew, D., Longstaffe, F. J., Berg, P., Schumacher, C., and Funk, A.: Proportions of convective and stratiform precipitation revealed in water isotope ratios, Nat. Geosci., 9, 624–629, https://doi.org/10.1038/ngeo2739, 2016.
Aitchison, J.: The Statistical Analysis of Compositional Data, J. R. Stat. Soc. Ser. B Methodol., 44, 139–160, https://doi.org/10.1111/j.2517-6161.1982.tb01195.x, 1982.
Aitchison, J.: A Concise Guide to Compositional Data Analysis, Compos. Data Anal. Workshop, 2005.
Ancapichún, S. and Garcés-Vargas, J.: Variability of the Southeast Pacific Subtropical Anticyclone and its impact on sea surface temperature off north-central Chile, Cienc. Mar., 41, 1–20, https://doi.org/10.7773/cm.v41i1.2338, 2015.
Annan, J. D., Hargreaves, J. C., and Mauritsen, T.: A new global surface temperature reconstruction for the Last Glacial Maximum, Clim. Past, 18, 1883–1896, https://doi.org/10.5194/cp-18-1883-2022, 2022.
Arbuszewski, J. A., deMenocal, P. B., Cléroux, C., Bradtmiller, L., and Mix, A.: Meridional shifts of the Atlantic intertropical convergence zone since the Last Glacial Maximum, Nat. Geosci., 6, 959–962, https://doi.org/10.1038/ngeo1961, 2013.
Arroyo, M. K., Medina, E., and Ziegler, H.: Distribution and δ 13C Values of Portulacaceae Species of the High Andes in Northern Chile, Bot. Acta, 103, 291–295, https://doi.org/10.1111/j.1438-8677.1990.tb00163.x, 1990.
Ashworth, A. C., Markgraf, V., and Villagran, C.: Late Quaternary climatic history of the Chilean Channels based on fossil pollen and beetle analyses, with an analysis of the modern vegetation and pollen rain, J. Quat. Sci., 6, 279–291, https://doi.org/10.1002/jqs.3390060403, 1991.
Bailey, A., Posmentier, E., and Feng, X.: Patterns of Evaporation and Precipitation Drive Global Isotopic Changes in Atmospheric Moisture, Geophys. Res. Lett., 45, 7093–7101, https://doi.org/10.1029/2018GL078254, 2018.
Bals-Elsholz, T. M., Atallah, E. H., Bosart, L. F., Wasula, T. A., Cempa, M. J., and Lupo, A. R.: The Wintertime Southern Hemisphere Split Jet: Structure, Variability, and Evolution, J. Clim., 14, 4191–4215, https://doi.org/10.1175/1520-0442(2001)014<4191:TWSHSJ>2.0.CO;2, 2001.
Barrett, B. S. and Hameed, S.: Seasonal Variability in Precipitation in Central and Southern Chile: Modulation by the South Pacific High, J. Clim., 30, 55–69, https://doi.org/10.1175/JCLI-D-16-0019.1, 2017.
Barrett, B. S., Garreaud, R., and Falvey, M.: Effect of the Andes Cordillera on Precipitation from a Midlatitude Cold Front, Mon. Weather Rev., 137, 3092–3109, https://doi.org/10.1175/2009MWR2881.1, 2009.
Berger, A.: Milankovitch Theory and climate, Rev. Geophys., 26, 624–657, https://doi.org/10.1029/RG026i004p00624, 1988.
Berger, A. and Loutre, M. F.: Insolation values for the climate of the last 10 million years, Quat. Sci. Rev., 10, 297–317, https://doi.org/10.1016/0277-3791(91)90033-Q, 1991.
Bernhardt, A., Melnick, D., Hebbeln, D., Lückge, A., and Strecker, M. R.: Turbidite paleoseismology along the active continental margin of Chile – Feasible or not?, Quat. Sci. Rev., 120, 71–92, https://doi.org/10.1016/j.quascirev.2015.04.001, 2015.
Bernhardt, A., Schwanghart, W., Hebbeln, D., Stuut, J.-B. W., and Strecker, M. R.: Immediate propagation of deglacial environmental change to deep-marine turbidite systems along the Chile convergent margin, Earth Planet. Sci. Lett., 473, 190–204, https://doi.org/10.1016/j.epsl.2017.05.017, 2017.
Betancourt, J. L., Latorre, C., Rech, J. A., Quade, J., and Rylander, K. A.: A 22,000-Year Record of Monsoonal Precipitation from Northern Chile's Atacama Desert, Science, 289, 1542–1546, 2000.
Bi, X., Sheng, G., Liu, X., Li, C., and Fu, J.: Molecular and carbon and hydrogen isotopic composition of n-alkanes in plant leaf waxes, Org. Geochem., 36, 1405–1417, https://doi.org/10.1016/j.orggeochem.2005.06.001, 2005.
Bjerknes, J.: Atlantic Air-Sea Interaction, in: Advances in Geophysics, 10, edited by: Landsberg, H. E. and Van Mieghem, J., Elsevier, 1–82, https://doi.org/10.1016/S0065-2687(08)60005-9, 1964.
Blaauw, M. and Christen, J. A.: Flexible paleoclimate age-depth models using an autoregressive gamma process, Bayesian Anal., 6, 457–474, https://doi.org/10.1214/11-BA618, 2011.
Bordoni, S. and Schneider, T.: Monsoons as eddy-mediated regime transitions of the tropical overturning circulation, Nat. Geosci., 1, 515–519, https://doi.org/10.1038/ngeo248, 2008.
Bowen, G. J.: Gridded maps of the isotopic composition of meteoric waters, http://www.waterisotopes.org [data set] (last access: 29 March 2024), 2024.
Bowen, G. J. and Revenaugh, J.: Interpolating the isotopic composition of modern meteoric precipitation, Water Resour. Res., 39, https://doi.org/10.1029/2003WR002086, 2003.
Bowen, G. J., Wassenaar, L. I., and Hobson, K. A.: Global application of stable hydrogen and oxygen isotopes to wildlife forensics, Oecologia, 143, 337–348, https://doi.org/10.1007/s00442-004-1813-y, 2005.
Bowen, G. J., Cai, Z., Fiorella, R. P., and Putman, A. L.: Isotopes in the Water Cycle: Regional- to Global-Scale Patterns and Applications, Annu. Rev. Earth Planet. Sci., 47, 453–479, https://doi.org/10.1146/annurev-earth-053018-060220, 2019.
Broccoli, A. J., Dahl, K. A., and Stouffer, R. J.: Response of the ITCZ to Northern Hemisphere cooling, Geophys. Res. Lett., 33, https://doi.org/10.1029/2005GL024546, 2006.
Bush, R. T. and McInerney, F. A.: Leaf wax n-alkane distributions in and across modern plants: Implications for paleoecology and chemotaxonomy, Geochim. Cosmochim. Acta, 117, 161–179, https://doi.org/10.1016/j.gca.2013.04.016, 2013.
Byrne, M. P. and O'Gorman, P. A.: Link between land-ocean warming contrast and surface relative humidities in simulations with coupled climate models, Geophys. Res. Lett., 40, 5223–5227, https://doi.org/10.1002/grl.50971, 2013.
Cai, W., McPhaden, M. J., Grimm, A. M., Rodrigues, R. R., Taschetto, A. S., Garreaud, R. D., Dewitte, B., Poveda, G., Ham, Y.-G., Santoso, A., Ng, B., Anderson, W., Wang, G., Geng, T., Jo, H.-S., Marengo, J. A., Alves, L. M., Osman, M., Li, S., Wu, L., Karamperidou, C., Takahashi, K., and Vera, C.: Climate impacts of the El Niño–Southern Oscillation on South America, Nat. Rev. Earth Environ., 1, 215–231, https://doi.org/10.1038/s43017-020-0040-3, 2020.
Campos, D. and Rondanelli, R.: ENSO-Related Precipitation Variability in Central Chile: The Role of Large Scale Moisture Transport, J. Geophys. Res. Atmospheres, 128, e2023JD038671, https://doi.org/10.1029/2023JD038671, 2023.
Carré, M., Azzoug, M., Bentaleb, I., Chase, B. M., Fontugne, M., Jackson, D., Ledru, M.-P., Maldonado, A., Sachs, J. P., and Schauer, A. J.: Mid-Holocene mean climate in the south eastern Pacific and its influence on South America, Quat. Int., 253, 55–66, https://doi.org/10.1016/j.quaint.2011.02.004, 2012.
Carré, M., Sachs, J. P., Purca, S., Schauer, A. J., Braconnot, P., Falcón, R. A., Julien, M., and Lavallée, D.: Holocene history of ENSO variance and asymmetry in the eastern tropical Pacific, Science, 345, 1045–1048, https://doi.org/10.1126/science.1252220, 2014.
Carvalho, L. M. V., Jones, C., and Ambrizzi, T.: Opposite Phases of the Antarctic Oscillation and Relationships with Intraseasonal to Interannual Activity in the Tropics during the Austral Summer, J. Clim., 18, 702–718, https://doi.org/10.1175/JCLI-3284.1, 2005.
Ceppi, P., Hwang, Y.-T., Liu, X., Frierson, D. M. W., and Hartmann, D. L.: The relationship between the ITCZ and the Southern Hemispheric eddy-driven jet, J. Geophys. Res. Atmospheres, 118, 5136–5146, https://doi.org/10.1002/jgrd.50461, 2013.
Cernusak, L. A., Ubierna, N., Winter, K., Holtum, J. A. M., Marshall, J. D., and Farquhar, G. D.: Environmental and physiological determinants of carbon isotope discrimination in terrestrial plants, New Phytol., 200, 950–965, https://doi.org/10.1111/nph.12423, 2013.
Chen, S., Hoffmann, S. S., Lund, D. C., Cobb, K. M., Emile-Geay, J., and Adkins, J. F.: A high-resolution speleothem record of western equatorial Pacific rainfall: Implications for Holocene ENSO evolution, Earth Planet. Sci. Lett., 442, 61–71, https://doi.org/10.1016/j.epsl.2016.02.050, 2016.
Chiang, J. C. H. and Bitz, C. M.: Influence of high latitude ice cover on the marine Intertropical Convergence Zone, Clim. Dyn., 25, 477–496, https://doi.org/10.1007/s00382-005-0040-5, 2005.
Chiang, J. C. H. and Friedman, A. R.: Extratropical Cooling, Interhemispheric Thermal Gradients, and Tropical Climate Change, Annu. Rev. Earth Planet. Sci., 40, 383–412, https://doi.org/10.1146/annurev-earth-042711-105545, 2012.
Chiang, J. C. H., Lee, S.-Y., Putnam, A. E., and Wang, X.: South Pacific Split Jet, ITCZ shifts, and atmospheric North–South linkages during abrupt climate changes of the last glacial period, Earth Planet. Sci. Lett., 406, 233–246, https://doi.org/10.1016/j.epsl.2014.09.012, 2014.
Collins, J. A., Schefuß, E., Mulitza, S., Prange, M., Werner, M., Tharammal, T., Paul, A., and Wefer, G.: Estimating the hydrogen isotopic composition of past precipitation using leaf-waxes from western Africa, Quat. Sci. Rev., 65, 88–101, https://doi.org/10.1016/j.quascirev.2013.01.007, 2013.
Crowley, T. J.: North Atlantic Deep Water cools the southern hemisphere, Paleoceanography, 7, 489–497, https://doi.org/10.1029/92PA01058, 1992.
Crucifix, M.: palinsol: Insolation for Palaeoclimate Studies, R package, version 1, [code], https://doi.org/10.32614/CRAN.package.palinsol, 2023
Dansgaard, W.: Stable isotopes in precipitation, Tellus, 16, 436–468, https://doi.org/10.3402/tellusa.v16i4.8993, 1964.
Dätwyler, C., Grosjean, M., Steiger, N. J., and Neukom, R.: Teleconnections and relationship between the El Niño–Southern Oscillation (ENSO) and the Southern Annular Mode (SAM) in reconstructions and models over the past millennium, Clim. Past, 16, 743–756, https://doi.org/10.5194/cp-16-743-2020, 2020.
de Bar, M. W., Stolwijk, D. J., McManus, J. F., Sinninghe Damsté, J. S., and Schouten, S.: A Late Quaternary climate record based on long-chain diol proxies from the Chilean margin, Clim. Past, 14, 1783–1803, https://doi.org/10.5194/cp-14-1783-2018, 2018a.
de Bar, M. W., Stolwijk, D., McManus, J. F., Sinninghe Damsté, J. S., and Schouten, S.: Organic geochemistry of ODP Site 202-1234, PANGAEA, https://doi.org/10.1594/PANGAEA.892651, 2018b.
De Pol-Holz, R., Keigwin, L., Southon, J., Hebbeln, D., and Mohtadi, M.: No signature of abyssal carbon in intermediate waters off Chile during deglaciation, Nat. Geosci., 3, 192–195, https://doi.org/10.1038/ngeo745, 2010.
de Porras, M. E., Maldonado, A., Quintana, F. A., Martel-Cea, A., Reyes, O., and Méndez, C.: Environmental and climatic changes in central Chilean Patagonia since the Late Glacial (Mallín El Embudo, 44° S), Clim. Past, 10, 1063–1078, https://doi.org/10.5194/cp-10-1063-2014, 2014.
Deplazes, G., Lückge, A., Peterson, L. C., Timmermann, A., Hamann, Y., Hughen, K. A., Röhl, U., Laj, C., Cane, M. A., Sigman, D. M., and Haug, G. H.: Links between tropical rainfall and North Atlantic climate during the last glacial period, Nat. Geosci., 6, 213–217, https://doi.org/10.1038/ngeo1712, 2013.
Diaz, H. F. and Markgraf, V.: El Niño: Historical and Paleoclimatic Aspects of the Southern Oscillation, Cambridge University Press, 510 pp., 1992.
Diefendorf, A. F. and Freimuth, E. J.: Extracting the most from terrestrial plant-derived n-alkyl lipids and their carbon isotopes from the sedimentary record: A review, Org. Geochem., 103, 1–21, https://doi.org/10.1016/j.orggeochem.2016.10.016, 2017.
Diefendorf, A. F., Leslie, A. B., and Wing, S. L.: Leaf wax composition and carbon isotopes vary among major conifer groups, Geochim. Cosmochim. Acta, 170, 145–156, https://doi.org/10.1016/j.gca.2015.08.018, 2015.
Dima, I. M. and Wallace, J. M.: On the Seasonality of the Hadley Cell, J. Atmospheric Sci., 60, 1522–1527, https://doi.org/10.1175/1520-0469(2003)060<1522:OTSOTH>2.0.CO;2, 2003.
Eglinton, G. and Hamilton, R. J.: Leaf Epicuticular Waxes, Science, 156, 1322–1335, https://doi.org/10.1126/science.156.3780.1322, 1967.
Emile-Geay, J., Cobb, K. M., Carré, M., Braconnot, P., Leloup, J., Zhou, Y., Harrison, S. P., Corrège, T., McGregor, H. V., Collins, M., Driscoll, R., Elliot, M., Schneider, B., and Tudhope, A.: Links between tropical Pacific seasonal, interannual and orbital variability during the Holocene, Nat. Geosci., 9, 168–173, https://doi.org/10.1038/ngeo2608, 2016.
Erb, M. P., McKay, N. P., Steiger, N., Dee, S., Hancock, C., Ivanovic, R. F., Gregoire, L. J., and Valdes, P.: Holocene temperature reconstruction using paleoclimate data assimilation (1.0.0-beta), Zenodo, https://doi.org/10.5281/zenodo.6426332, 2022a.
Erb, M. P., McKay, N. P., Steiger, N., Dee, S., Hancock, C., Ivanovic, R. F., Gregoire, L. J., and Valdes, P.: Reconstructing Holocene temperatures in time and space using paleoclimate data assimilation, Clim. Past, 18, 2599–2629, https://doi.org/10.5194/cp-18-2599-2022, 2022b.
European Commission, Joint Research Centre (JRC): South America Mean Annual Precipitation Map (TRMM 3B43, data set), PID: http://data.europa.eu/89h/3950386f-1b43-4247-8d99-40dd89f164a3, 2015.
Feakins, S. J. and Sessions, A. L.: Crassulacean acid metabolism influences D/H ratio of leaf wax in succulent plants, Org. Geochem., 41, 1269–1276, https://doi.org/10.1016/j.orggeochem.2010.09.007, 2010.
Fesq-Martin, M., Friedmann, A., Peters, M., Behrmann, J., and Kilian, R.: Late-glacial and Holocene vegetation history of the Magellanic rain forest in southwestern Patagonia, Chile, Veg. Hist. Archaeobotany, 13, 249–255, https://doi.org/10.1007/s00334-004-0047-6, 2004.
Fick, S. E. and Hijmans, R. J.: WorldClim 2: new 1-km spatial resolution climate surfaces for global land areas, Int. J. Climatol., 37, 4302–4315, https://doi.org/10.1002/joc.5086, 2017.
Fiers, G., Bertrand, S., Van Daele, M., Granon, E., Reid, B., Vandoorne, W., and De Batist, M.: Hydroclimate variability of northern Chilean Patagonia during the last 20 kyr inferred from the bulk organic geochemistry of Lago Castor sediments (45° S), Quat. Sci. Rev., 204, 105–118, https://doi.org/10.1016/j.quascirev.2018.11.015 [data set], 2019.
Flores-Aqueveque, V., Rojas, M., Aguirre, C., Arias, P. A., and González, C.: South Pacific Subtropical High from the late Holocene to the end of the 21st century: insights from climate proxies and general circulation models, Clim. Past, 16, 79–99, https://doi.org/10.5194/cp-16-79-2020, 2020.
Flores-Aqueveque, V., Ortega, C., Fernández, R., Carabias, D., Simonetti, R., Cartajena, I., Díaz, L., and González, C.: A multi-proxy reconstruction of depositional environment of a Late Pleistocene submerged site from the Central Coast of Chile (32°): Implications for drowned sites, Quat. Int., 601, 15–27, https://doi.org/10.1016/j.quaint.2021.06.005, 2021.
Fogt, R. L. and Bromwich, D. H.: Decadal Variability of the ENSO Teleconnection to the High-Latitude South Pacific Governed by Coupling with the Southern Annular Mode, J. Clim., 19, 979–997, https://doi.org/10.1175/JCLI3671.1, 2006.
Fogt, R. L., Bromwich, D. H., and Hines, K. M.: Understanding the SAM influence on the South Pacific ENSO teleconnection, Clim. Dyn., 36, 1555–1576, https://doi.org/10.1007/s00382-010-0905-0, 2011.
Friedman, A. R., Hwang, Y.-T., Chiang, J. C. H., and Frierson, D. M. W.: Interhemispheric Temperature Asymmetry over the Twentieth Century and in Future Projections, Journal of Climate, 26, 5419–-5433, https://doi.org/10.1175/JCLI-D-12-00525.1, 2013.
Frugone-Álvarez, M., Latorre, C., Giralt, S., Polanco-Martínez, J., Bernárdez, P., Oliva-Urcia, B., Maldonado, A., Carrevedo, M. L., Moreno, A., Delgado Huertas, A., Prego, R., Barreiro-Lostres, F., and Valero-Garcés, B.: A 7000-year high-resolution lake sediment record from coastal central Chile (Lago Vichuquén, 34° S): implications for past sea level and environmental variability, J. Quat. Sci., 32, 830–844, https://doi.org/10.1002/jqs.2936, 2017.
Gallego, D., Ribera, P., Garcia-Herrera, R., Hernandez, E., and Gimeno, L.: A new look for the Southern Hemisphere jet stream, Clim. Dyn., 24, 607–621, https://doi.org/10.1007/s00382-005-0006-7, 2005.
Garreaud, R. D.: The Andes climate and weather, Adv. Geosci., 22, 3–11, https://doi.org/10.5194/adgeo-22-3-2009, 2009.
Garreaud, R. D. and Battisti, D. S.: Interannual (ENSO) and Interdecadal (ENSO-like) Variability in the Southern Hemisphere Tropospheric Circulation, J. Clim., 12, 2113–2123, https://doi.org/10.1175/1520-0442(1999)012<2113:IEAIEL>2.0.CO;2, 1999.
Garreaud, R. D., Rutllant, J., Quintana, J., Carrasco, J., and Minnis, P.: CIMAR-5: A Snapshot of the Lower Troposphere over the Subtropical Southeast Pacific, Bull. Am. Meteorol. Soc., 82, 2193–2208, https://doi.org/10.1175/1520-0477-82.10.2193, 2001.
Garreaud, R. D., Barichivich, J., Christie, D. A., and Maldonado, A.: Interannual variability of the coastal fog at Fray Jorge relict forests in semiarid Chile, J. Geophys. Res. Biogeosciences, 113, https://doi.org/10.1029/2008JG000709, 2008.
Garreaud, R. D., Vuille, M., Compagnucci, R., and Marengo, J.: Present-day South American climate, Palaeogeogr. Palaeoclimatol. Palaeoecol., 281, 180–195, https://doi.org/10.1016/j.palaeo.2007.10.032, 2009.
Gaviria-Lugo, N., Läuchli, C., Wittmann, H., Bernhardt, A., Frings, P., Mohtadi, M., Rach, O., and Sachse, D.: Climatic controls on leaf wax hydrogen isotope ratios in terrestrial and marine sediments along a hyperarid-to-humid gradient, Biogeosciences, 20, 4433–4453, https://doi.org/10.5194/bg-20-4433-2023, 2023a.
Gaviria-Lugo, N., Läuchli, C., Wittmann, H., Bernhard, A., Frings, P., Mohtadi, M., Rach, O., and Sachse, D.: Data of leaf wax hydrogen isotope ratios and climatic variables along an aridity gradient in Chile and globally, GFZ Data Services [data set], https://doi.org/10.5880/GFZ.3.3.2023.001, 2023b.
GEBCO Bathymetric Compilation Group 2019: The GEBCO_2019 Grid – a continuous terrain model of the global oceans and land, British Oceanographic Data Centre [data set], https://doi.org/10.5285/836f016a-33be-6ddc-e053-6c86abc0788e, 2019.
Geen, R., Bordoni, S., Battisti, D. S., and Hui, K.: Monsoons, ITCZs, and the Concept of the Global Monsoon, Rev. Geophys., 58, e2020RG000700, https://doi.org/10.1029/2020RG000700, 2020.
Gillett, N. P., Kell, T. D., and Jones, P. D.: Regional climate impacts of the Southern Annular Mode, Geophys. Res. Lett., 33, https://doi.org/10.1029/2006GL027721, 2006.
Gong, D. and Wang, S.: Definition of Antarctic Oscillation index, Geophys. Res. Lett., 26, 459–462, https://doi.org/10.1029/1999GL900003, 1999.
Graven, H., Allison, C. E., Etheridge, D. M., Hammer, S., Keeling, R. F., Levin, I., Meijer, H. A. J., Rubino, M., Tans, P. P., Trudinger, C. M., Vaughn, B. H., and White, J. W. C.: Compiled records of carbon isotopes in atmospheric CO2 for historical simulations in CMIP6, Geosci. Model Dev., 10, 4405–4417, https://doi.org/10.5194/gmd-10-4405-2017, 2017.
Grimm, A. M.: Interannual climate variability in South America: impacts on seasonal precipitation, extreme events, and possible effects of climate change, Stoch. Environ. Res. Risk Assess., 25, 537–554, https://doi.org/10.1007/s00477-010-0420-1, 2011.
Haberle, S. G. and Bennett, K. D.: Postglacial formation and dynamics of North Patagonian Rainforest in the Chonos Archipelago, Southern Chile, Quat. Sci. Rev., 23, 2433–2452, https://doi.org/10.1016/j.quascirev.2004.03.001, 2004.
Haddam, N. A., Siani, G., Michel, E., Kaiser, J., Lamy, F., Duchamp-Alphonse, S., Hefter, J., Braconnot, P., Dewilde, F., Isgüder, G., Tisnerat-Laborde, N., Thil, F., Durand, N., and Kissel, C.: Changes in latitudinal sea surface temperature gradients along the Southern Chilean margin since the last glacial, Quat. Sci. Rev., 194, 62–76, https://doi.org/10.1016/j.quascirev.2018.06.023, 2018.
Hadley, G.: VI. Concerning the cause of the general trade-winds, Philos. Trans. R. Soc. Lond., 39, 58–62, https://doi.org/10.1098/rstl.1735.0014, 1997.
Hajek, E. R. and Gutiérrez, J. R.: Growing seasons in Chile: Observation and prediction, Int. J. Biometeorol., 23, 311–329, https://doi.org/10.1007/BF01553103, 1979.
Haug, G. H., Hughen, K. A., Sigman, D. M., Peterson, L. S., and Röhl, U.: Cariaco basin trace metal data (titanium) of ODP Hole 165-1002C, PANGAEA, https://doi.org/10.1594/PANGAEA.81965 [data set], 2001a.
Haug, G. H., Hughen, K. A., Sigman, D. M., Peterson, L. C., and Röhl, U.: Southward Migration of the Intertropical Convergence Zone Through the Holocene, Science, 293, 1304–1308, https://doi.org/10.1126/science.1059725, 2001b.
Heaton, T. J., Köhler, P., Butzin, M., Bard, E., Reimer, R. W., Austin, W. E. N., Ramsey, C. B., Grootes, P. M., Hughen, K. A., Kromer, B., Reimer, P. J., Adkins, J., Burke, A., Cook, M. S., Olsen, J., and Skinner, L. C.: Marine20–The Marine Radiocarbon Age Calibration Curve (0–55,000 cal BP), Radiocarbon, 62, 779–820, https://doi.org/10.1017/RDC.2020.68, 2020.
Hebbeln, D. and Shipboard Scientists: Cruise report of R/V Sonne Cruise SO-102, Valparaiso (Chile)-Valparaiso (Chile), May 09–June 28, 1995, Berichte Fachbereich Geowiss. Univ. Brem. Brem., 1995.
Hebbeln, D. and Shipboard Scientists: PUCK: Report and preliminary results of R/V Sonne Cruise SO156, Valparaiso (Chile) – Talcahuano (Chile), March 29 – May 14, 2001, Department of Geosciences, Bremen University, 195 pp., 2001.
Held, I. M. and Hou, A. Y.: Nonlinear Axially Symmetric Circulations in a Nearly Inviscid Atmosphere, J. Atmospheric Sci., 37, 515–533, https://doi.org/10.1175/1520-0469(1980)037<0515:NASCIA>2.0.CO;2, 1980.
Heusser, C. J. (Ed.): Chapter 8 Vegetation, in: Developments in Quaternary Sciences, 3, Elsevier, 44–73, https://doi.org/10.1016/S1571-0866(03)80011-8, 2003.
Heusser, C. J., Heusser, L. E., Lowell, T. V., Moreira, A. M., and Moreira S. M.: Deglacial palaeoclimate at Puerto del Hambre, subantarctic Patagonia, Chile, J. Quat. Sci., 15, 101–-114, https://doi.org/10.1002/(SICI)1099-1417(200002)15:2<101::AID-JQS500>3.0.CO;2-Y, 2000.
Heusser, L. E., Heusser, C. J., Mix, A., and McManus, J.: Chilean and Southeast Pacific paleoclimate variations during the last glacial cycle: directly correlated pollen and δ18O records from ODP Site 1234, Quat. Sci. Rev., 25, 3404–3415, https://doi.org/10.1016/j.quascirev.2006.03.011, 2006a.
Heusser, L. E., Heusser, C. J., and Pisias, N.: Vegetation and climate dynamics of southern Chile during the past 50,000 years: results of ODP Site 1233 pollen analysis, Quat. Sci. Rev., 25, 474–485, https://doi.org/10.1016/j.quascirev.2005.04.009, 2006b.
Hogg, A. G., Heaton, T. J., Hua, Q., Palmer, J. G., Turney, C. S., Southon, J., Bayliss, A., Blackwell, P. G., Boswijk, G., Ramsey, C. B., Pearson, C., Petchey, F., Reimer, P., Reimer, R., and Wacker, L.: SHCal20 Southern Hemisphere Calibration, 0–55,000 Years cal BP, Radiocarbon, 62, 759–778, https://doi.org/10.1017/RDC.2020.59, 2020.
IAEA/WMO: Mean annual and monthly precipitation, all grids, https://nucleus.iaea.org/wiser [data set] (last access: 29 March 2024), 2015.
Inatsu, M. and Hoskins, B. J.: The Zonal Asymmetry of the Southern Hemisphere Winter Storm Track, J. Clim., 17, 4882–4892, https://doi.org/10.1175/JCLI-3232.1, 2004.
Jara, I. A. and Moreno, P. I.: Temperate rainforest response to climate change and disturbance agents in northwestern Patagonia (41° S) over the last 2600 years, Quat. Res., 77, 235–244, https://doi.org/10.1016/j.yqres.2011.11.011, 2012.
Jara, I. A. and Moreno, P. I.: Climatic and disturbance influences on the temperate rainforests of northwestern Patagonia (40° S) since ∼14,500 cal yr BP, Quat. Sci. Rev., 90, 217–228, https://doi.org/10.1016/j.quascirev.2014.01.024, 2014.
Jenny, B., Valero-Garcés, B. L., Villa-Martínez, R., Urrutia, R., Geyh, M., and Veit, H.: Early to Mid-Holocene Aridity in Central Chile and the Southern Westerlies: The Laguna Aculeo Record (34° S), Quat. Res., 58, 160–170, https://doi.org/10.1006/qres.2002.2370, 2002a.
Jenny, B., Valero-Garcés, B. L., Urrutia, R., Kelts, K., Veit, H., Appleby, P. G., and Geyh, M.: Moisture changes and fluctuations of the Westerlies in Mediterranean Central Chile during the last 2000 years: The Laguna Aculeo record (33° 50′S), Quat. Int., 87, 3–18, https://doi.org/10.1016/S1040-6182(01)00058-1, 2002b.
Jenny, B., Wilhelm, D., and Valero-Garcés, B.: The Southern Westerlies in Central Chile: Holocene precipitation estimates based on a water balance model for Laguna Aculeo (33° 50′S), Clim. Dyn., 20, 269–280, https://doi.org/10.1007/s00382-002-0267-3, 2003.
Joshi, M. M., Gregory, J. M., Webb, M. J., Sexton, D. M. H., and Johns, T. C.: Mechanisms for the land/sea warming contrast exhibited by simulations of climate change, Clim. Dyn., 30, 455–465, https://doi.org/10.1007/s00382-007-0306-1, 2008.
Kahmen, A., Schefuß, E., and Sachse, D.: Leaf water deuterium enrichment shapes leaf wax n-alkane δD values of angiosperm plants I: Experimental evidence and mechanistic insights, Geochim. Cosmochim. Acta, 111, 39–49, https://doi.org/10.1016/j.gca.2012.09.003, 2013a.
Kahmen, A., Hoffmann, B., Schefuß, E., Arndt, S. K., Cernusak, L. A., West, J. B., and Sachse, D.: Leaf water deuterium enrichment shapes leaf wax n-alkane δD values of angiosperm plants II: Observational evidence and global implications, Geochim. Cosmochim. Acta, 111, 50–63, https://doi.org/10.1016/j.gca.2012.09.004, 2013b.
Kaiser, J., Schefuß, E., Lamy, F., Mohtadi, M., and Hebbeln, D.: Glacial to Holocene changes in sea surface temperature and coastal vegetation in north central Chile: high versus low latitude forcing, Quat. Sci. Rev., 27, 2064–2075, https://doi.org/10.1016/j.quascirev.2008.08.025, 2008.
Kaiser, J., Schefuß, E., Collins, J., Garreaud, R., Stuut, J.-B. W., Ruggieri, N., De Pol-Holz, R., and Lamy, F.: Orbital modulation of subtropical versus subantarctic moisture sources in the southeast Pacific mid-latitudes, Nat. Commun., 15, 7512, https://doi.org/10.1038/s41467-024-51985-4, 2024.
Kim, B.-M., Choi, H., Kim, S.-J., and Choi, W.: Amplitude-dependent relationship between the Southern Annular Mode and the El Niño Southern Oscillation in austral summer, Asia-Pac. J. Atmospheric Sci., 53, 85–100, https://doi.org/10.1007/s13143-017-0007-6, 2017.
Köhler, P., Nehrbass-Ahles, C., Schmitt, J., Stocker, T. F., and Fischer, H.: A 156 kyr smoothed history of the atmospheric greenhouse gases CO2, CH4, and N2O and their radiative forcing, Earth Syst. Sci. Data, 9, 363–387, https://doi.org/10.5194/essd-9-363-2017, 2017. 2017a.
Köhler, P., Nehrbass-Ahles, C., Schmitt, J., Stocker, T. F., and Fischer, H.: Continuous record of the atmospheric greenhouse gas carbon dioxide (CO2), final spline-smoothed data of calculated radiative forcing (Version 2), PANGAEA, https://doi.org/10.1594/PANGAEA.876013 [data set], 2017b.
Koutavas, A. and Joanides, S.: El Niño–Southern Oscillation extrema in the Holocene and Last Glacial Maximum, Paleoceanography, 27, https://doi.org/10.1029/2012PA002378, 2012.
Koutavas, A. and Lynch-Stieglitz, J.: Variability of the Marine ITCZ over the Eastern Pacific during the Past 30,000 Years, in: The Hadley Circulation: Present, Past and Future, edited by: Diaz, H. F. and Bradley, R. S., Springer Netherlands, Dordrecht, 347–369, https://doi.org/10.1007/978-1-4020-2944-8_13, 2004.
Koutavas, A., Lynch-Stieglitz, J., Marchitto, T. M., and Sachs, J. P.: El Niño-Like Pattern in Ice Age Tropical Pacific Sea Surface Temperature, Science, 297, 226–230, https://doi.org/10.1126/science.1072376, 2002.
Koutavas, A., deMenocal, P. B., Olive, G. C., and Lynch-Stieglitz, J.: Mid-Holocene El Niño–Southern Oscillation (ENSO) attenuation revealed by individual foraminifera in eastern tropical Pacific sediments, Geology, 34, 993–996, https://doi.org/10.1130/G22810A.1, 2006.
Lamy, F., Hebbeln, D., and Wefer, G.: Terrigenous sediment supply along the Chilean continental margin: modern regional patterns of texture and composition, Geol. Rundsch., 87, 477–494, https://doi.org/10.1007/s005310050223, 1998.
Lamy, F., Hebbeln, D., and Wefer, G.: High-Resolution Marine Record of Climatic Change in Mid-latitude Chile during the Last 28,000 Years Based on Terrigenous Sediment Parameters, Quat. Res., 51, 83–93, https://doi.org/10.1006/qres.1998.2010, 1999.
Lamy, F., Hebbeln, D., Röhl, U., and Wefer, G.: Holocene rainfall variability in southern Chile: a marine record of latitudinal shifts of the Southern Westerlies, Earth Planet. Sci. Lett., 185, 369–382, https://doi.org/10.1016/S0012-821X(00)00381-2, 2001.
Lamy, F., Kilian, R., Arz, H. W., Francois, J.-P., Kaiser, J., Prange, M., and Steinke, T.: Holocene changes in the position and intensity of the southern westerly wind belt, Nat. Geosci., 3, 695–699, https://doi.org/10.1038/ngeo959, 2010.
Lamy, F., Chiang, J. C. H., Martínez-Méndez, G., Thierens, M., Arz, H. W., Bosmans, J., Hebbeln, D., Lambert, F., Lembke-Jene, L., and Stuut, J.-B.: Precession modulation of the South Pacific westerly wind belt over the past million years, Proc. Natl. Acad. Sci., 116, 23455–23460, https://doi.org/10.1073/pnas.1905847116, 2019.
Latorre, C., Betancourt, J. L., Rylander, K. A., and Quade, J.: Vegetation invasions into absolute desert: A 45;th000 yr rodent midden record from the Calama–Salar de Atacama basins, northern Chile (lat 22°–24° S), GSA Bull., 114, 349–366, https://doi.org/10.1130/0016-7606(2002)114<0349:VIIADA>2.0.CO;2, 2002.
Latorre, C., Betancourt, J. L., and Arroyo, M. T. K.: Late Quaternary vegetation and climate history of a perennial river canyon in the Río Salado basin (22° S) of Northern Chile, Quat. Res., 65, 450–466, https://doi.org/10.1016/j.yqres.2006.02.002, 2006.
Läuchli, C., Gaviria-Lugo, N., Bernhardt, A., Wittmann, H., Frings, P., Mohtadi, M., Lückge, A., and Sachse, D.: Carbon and hydrogen isotope compositions of leaf wax n-alkanes, climate variables and age-depth models used to constrain hydrological regimes along Chile during the last 20,000 years, GFZ Data Services [data set], https://doi.org/10.5880/fidgeo.2025.050, 2025.
Lee, S.-Y., Chiang, J. C. H., Matsumoto, K., and Tokos, K. S.: Southern Ocean wind response to North Atlantic cooling and the rise in atmospheric CO2: Modeling perspective and paleoceanographic implications, Paleoceanography, 26, https://doi.org/10.1029/2010PA002004, 2011.
Lehner, B. and Grill, G.: Global river hydrography and network routing: baseline data and new approaches to study the world's large river systems, Hydrol. Process., 27, 2171–2186, https://doi.org/10.1002/hyp.9740, 2013.
Lehner, B., Verdin, K., and Jarvis, A.: HydroSHEDS technical documentation, World Wildl. Fund US Wash. DC, 5, 2006.
Li, Y., Xie, S.-P., Lian, T., Zhang, G., Feng, J., Ma, J., Peng, Q., Wang, W., Hou, Y., and Li, X.: Interannual Variability of Regional Hadley Circulation and El Niño Interaction, Geophys. Res. Lett., 50, e2022GL102016, https://doi.org/10.1029/2022GL102016, 2023.
Lindzen, R. S. and Hou, A. V.: Hadley Circulations for Zonally Averaged Heating Centered off the Equator, J. Atmospheric Sci., 45, 2416–2427, https://doi.org/10.1175/1520-0469(1988)045<2416:HCFZAH>2.0.CO;2, 1988.
Lippold, J., Pöppelmeier, F., Süfke, F., Gutjahr, M., Goepfert, T. J., Blaser, P., Friedrich, O., Link, J. M., Wacker, L., Rheinberger, S., and Jaccard, S. L.: Constraining the Variability of the Atlantic Meridional Overturning Circulation During the Holocene, Geophys. Res. Lett., 46, 11338–11346, https://doi.org/10.1029/2019GL084988, 2019.
Liu, W. and Yang, H.: Multiple controls for the variability of hydrogen isotopic compositions in higher plant n-alkanes from modern ecosystems, Glob. Change Biol., 14, 2166–2177, https://doi.org/10.1111/j.1365-2486.2008.01608.x, 2008.
Liu, W., Yang, H., Wang, H., An, Z., Wang, Z., and Leng, Q.: Carbon isotope composition of long chain leaf wax n-alkanes in lake sediments: A dual indicator of paleoenvironment in the Qinghai-Tibet Plateau, Org. Geochem., 83–84, 190–201, https://doi.org/10.1016/j.orggeochem.2015.03.017, 2015.
Lowrie, A. and Hey, R.: Geological and geophysical variations along the western margin of Chile near lat 33° to 36° S and their relation to Nazca plate subduction, in: Nazca Plate: Crustal Formation and Andean Convergence, edited by: Kulm, L. V. D., Dymond, J., Dasch, E. J., Hussong, D. M., and Roderick, R., Geological Society of America, https://doi.org/10.1130/MEM154-p741, 1981.
Luebert, F.: The two South American dry diagonals, Front. Biogeogr., 13, https://doi.org/10.21425/F5FBG51267, 2021.
Luebert, F. and Pliscoff, P.: The vegetation of Chile and the EcoVeg approach in the context of the International Vegetation Classification project, Veg. Classif. Surv., 3, 15–28, https://doi.org/10.3897/VCS.67893, 2022.
Madden, R. A. and Julian, P. R.: Observations of the 40–50-Day Tropical Oscillation–A Review, Mon. Weather Rev., 122, 814–837, https://doi.org/10.1175/1520-0493(1994)122<0814:OOTDTO>2.0.CO;2, 1994.
Maldonado, A. and Villagrán, C.: Paleoenvironmental Changes in the Semiarid Coast of Chile (∼32° S) during the Last 6200 cal Years Inferred from a Swamp–Forest Pollen Record, Quat. Res., 58, 130–138, https://doi.org/10.1006/qres.2002.2353, 2002.
Maldonado, A. and Villagrán, C.: Climate variability over the last 9900 cal yr BP from a swamp forest pollen record along the semiarid coast of Chile, Quat. Res., 66, 246–258, https://doi.org/10.1016/j.yqres.2006.04.003, 2006.
Maldonado, A., Méndez, C., Ugalde, P., Jackson, D., Seguel, R., and Latorre, C.: Early Holocene climate change and human occupation along the semiarid coast of north-central Chile, J. Quat. Sci., 25, 985–988, https://doi.org/10.1002/jqs.1385, 2010.
Marshall, G. J.: Trends in the Southern Annular Mode from Observations and Reanalyses, J. Clim., 16, 4134–4143, https://doi.org/10.1175/1520-0442(2003)016<4134:TITSAM>2.0.CO;2, 2003.
Martínez Fontaine, C., De Pol-Holz, R., Michel, E., Siani, G., Reyes-Macaya, D., Martínez-Méndez, G., DeVries, T., Stott, L., Southon, J., Mohtadi, M., and Hebbeln, D.: Ventilation of the Deep Ocean Carbon Reservoir During the Last Deglaciation: Results From the Southeast Pacific, Paleoceanogr. Paleoclimatology, 34, 2080–2097, https://doi.org/10.1029/2019PA003613, 2019.
Marzi, R., Torkelson, B. E., and Olson, R. K.: A revised carbon preference index, Org. Geochem., 20, 1303–1306, https://doi.org/10.1016/0146-6380(93)90016-5, 1993.
McManus, J. F., Francois, R., Gherardi, J.-M., Keigwin, L. D., and Brown-Leger, S.: Collapse and rapid resumption of Atlantic meridional circulation linked to deglacial climate changes, Nature, 428, 834–837, https://doi.org/10.1038/nature02494, 2004.
Menviel, L., Spence, P., Yu, J., Chamberlain, M. A., Matear, R. J., Meissner, K. J., and England, M. H.: Southern Hemisphere westerlies as a driver of the early deglacial atmospheric CO2 rise, Nat. Commun., 9, 2503, https://doi.org/10.1038/s41467-018-04876-4, 2018.
Merino-Campos, V., Pol-Holz, R. D., Southon, J., Latorre, C., and Collado-Fabbri, S.: Marine Radiocarbon Reservoir Age Along the Chilean Continental Margin, Radiocarbon, 61, 195–210, https://doi.org/10.1017/RDC.2018.81, 2019.
Mo, K. C. and Paegle, J. N.: The Pacific–South American modes and their downstream effects, Int. J. Climatol., 21, 1211–1229, https://doi.org/10.1002/joc.685, 2001.
Mohtadi, M. and Hebbeln, D.: Mechanisms and variations of the paleoproductivity off northern Chile (24° S–33° S) during the last 40,000 years, Paleoceanography, 19, https://doi.org/10.1029/2004PA001003, 2004.
Mohtadi, M., Romero, O. E., and Hebbeln, D.: Changing marine productivity off northern Chile during the past 19 000 years: a multivariable approach, J. Quat. Sci., 19, 347–360, https://doi.org/10.1002/jqs.832, 2004.
Mohtadi, M., Prange, M., and Steinke, S.: Palaeoclimatic insights into forcing and response of monsoon rainfall, Nature, 533, 191–199, https://doi.org/10.1038/nature17450, 2016.
Monnin, E.: EPICA Dome C high resolution carbon dioxide concentrations, PANGAEA, https://doi.org/10.1594/PANGAEA.472488 [data set], 2006.
Montade, V., Nebout, N. C., Kissel, C., and Mulsow, S.: Pollen distribution in marine surface sediments from Chilean Patagonia, Mar. Geol., 282, 161–168, https://doi.org/10.1016/j.margeo.2011.02.001, 2011.
Montade, V., Combourieu Nebout, N., Kissel, C., Haberle, S. G., Siani, G., and Michel, E.: Vegetation and climate changes during the last 22,000yr from a marine core near Taitao Peninsula, southern Chile, Palaeogeogr. Palaeoclimatol. Palaeoecol., 369, 335–348, https://doi.org/10.1016/j.palaeo.2012.11.001, 2013.
Montecinos, A. and Aceituno, P.: Seasonality of the ENSO-Related Rainfall Variability in Central Chile and Associated Circulation Anomalies, J. Clim., 16, 281–296, https://doi.org/10.1175/1520-0442(2003)016<0281:SOTERR>2.0.CO;2, 2003.
Montecinos, A., Díaz, A., and Aceituno, P.: Seasonal Diagnostic and Predictability of Rainfall in Subtropical South America Based on Tropical Pacific SST, J. Clim., 13, 746–758, https://doi.org/10.1175/1520-0442(2000)013<0746:SDAPOR>2.0.CO;2, 2000.
Moreno, P. I.: Millennial-scale climate variability in northwest Patagonia over the last 15 000 yr, J. Quat. Sci., 19, 35–47, https://doi.org/10.1002/jqs.813, 2004.
Moreno, P. I. and León, A. L.: Abrupt vegetation changes during the last glacial to Holocene transition in mid-latitude South America, J. Quat. Sci., 18, 787–800, https://doi.org/10.1002/jqs.801, 2003.
Moreno, P. I. and Videla, J.: Centennial and millennial-scale hydroclimate changes in northwestern Patagonia since 16,000 yr BP, Quat. Sci. Rev., 149, 326–337, https://doi.org/10.1016/j.quascirev.2016.08.008, 2016.
Moreno, P. I., Francois, J. P., Moy, C. M., and Villa-Martínez, R.: Covariability of the Southern Westerlies and atmospheric CO2 during the Holocene, Geology, 38, 727–730, https://doi.org/10.1130/G30962.1, 2010.
Moreno, P. I., Videla, J., Valero-Garcés, B., Alloway, B. V., and Heusser, L. E.: A continuous record of vegetation, fire-regime and climatic changes in northwestern Patagonia spanning the last 25,000 years, Quat. Sci. Rev., 198, 15–36, https://doi.org/10.1016/j.quascirev.2018.08.013, 2018.
Moreno, P. I., Henríquez, W. I., Pesce, O. H., Henríquez, C. A., Fletcher, M. S., Garreaud, R. D., and Villa-Martínez, R. P.: An early Holocene westerly minimum in the southern mid-latitudes, Quat. Sci. Rev., 251, 106730, https://doi.org/10.1016/j.quascirev.2020.106730, 2021.
Moreno-Chamarro, E., Marshall, J., and Delworth, T. L.: Linking ITCZ Migrations to the AMOC and North Atlantic/Pacific SST Decadal Variability, Journal of Climate, 33, 893–905, https://doi.org/10.1175/JCLI-D-19-0258.1, 2019.
Muñoz, P., Rebolledo, L., Dezileau, L., Maldonado, A., Mayr, C., Cárdenas, P., Lange, C. B., Lalangui, K., Sanchez, G., Salamanca, M., Araya, K., Jara, I., Easton, G., and Ramos, M.: Reconstructing past variations in environmental conditions and paleoproductivity over the last ∼ 8000 years off north-central Chile (30° S), Biogeosciences, 17, 5763–5785, https://doi.org/10.5194/bg-17-5763-2020, 2020.
Muratli, J. M., Chase, Z., McManus, J., and Mix, A.: Ice-sheet control of continental erosion in central and southern Chile (36°–41° S) over the last 30,000 years, Quat. Sci. Rev., 29, 3230–3239, https://doi.org/10.1016/j.quascirev.2010.06.037, 2010.
Nakamura, H. and Shimpo, A.: Seasonal Variations in the Southern Hemisphere Storm Tracks and Jet Streams as Revealed in a Reanalysis Dataset, J. Clim., 17, 1828–1844, https://doi.org/10.1175/1520-0442(2004)017<1828:SVITSH>2.0.CO;2, 2004.
Nakamura, H., Sampe, T., Tanimoto, Y., and Shimpo, A.: Observed Associations Among Storm Tracks, Jet Streams and Midlatitude Oceanic Fronts, in: Earth's Climate, American Geophysical Union (AGU), 329–345, https://doi.org/10.1029/147GM18, 2004.
Naughton, F., Toucanne, S., Landais, A., Rodrigues, T., Riveiros, N. V., and Sánchez-Goñi, M. F.: Chapter 5 – Heinrich Stadial 1, in: European Glacial Landscapes, edited by: Palacios, D., Hughes, P. D., García-Ruiz, J. M., and Andrés, N., Elsevier, 37–44, https://doi.org/10.1016/B978-0-323-91899-2.00049-8, 2023.
Nguyen, H., Evans, A., Lucas, C., Smith, I., and Timbal, B.: The Hadley Circulation in Reanalyses: Climatology, Variability, and Change, J. Clim., 26, 3357–3376, https://doi.org/10.1175/JCLI-D-12-00224.1, 2013.
Niedermeyer, E. M., Forrest, M., Beckmann, B., Sessions, A. L., Mulch, A., and Schefuß, E.: The stable hydrogen isotopic composition of sedimentary plant waxes as quantitative proxy for rainfall in the West African Sahel, Geochim. Cosmochim. Acta, 184, 55–70, https://doi.org/10.1016/j.gca.2016.03.034, 2016.
Oort, A. H. and Yienger, J. J.: Observed Interannual Variability in the Hadley Circulation and Its Connection to ENSO, J. Clim., 9, 2751–2767, https://doi.org/10.1175/1520-0442(1996)009<2751:OIVITH>2.0.CO;2, 1996.
Ortega, C., Vargas, G., Rutllant, J. A., Jackson, D., and Méndez, C.: Major hydrological regime change along the semiarid western coast of South America during the early Holocene, Quat. Res., 78, 513–527, https://doi.org/10.1016/j.yqres.2012.08.002, 2012.
Ortega, C., Vargas, G., Rojas, M., Rutllant, J. A., Muñoz, P., Lange, C. B., Pantoja, S., Dezileau, L., and Ortlieb, L.: Extreme ENSO-driven torrential rainfalls at the southern edge of the Atacama Desert during the Late Holocene and their projection into the 21th century, Glob. Planet. Change, 175, 226–237, https://doi.org/10.1016/j.gloplacha.2019.02.011, 2019.
Osman, M. B., Tierney, J. E., Zhu, J., Tardif, R., Hakim, G. J., King, J., and Poulsen, C. J.: Globally resolved surface temperatures since the Last Glacial Maximum, Nature, 599, 239–244, https://doi.org/10.1038/s41586-021-03984-4, 2021.
Pedro, J. B., Bostock, H. C., Bitz, C. M., He, F., Vandergoes, M. J., Steig, E. J., Chase, B. M., Krause, C. E., Rasmussen, S. O., Markle, B. R., and Cortese, G.: The spatial extent and dynamics of the Antarctic Cold Reversal, Nat. Geosci., 9, 51–55, https://doi.org/10.1038/ngeo2580, 2016.
Pedro, J. B., Jochum, M., Buizert, C., He, F., Barker, S., and Rasmussen, S. O.: Beyond the bipolar seesaw: Toward a process understanding of interhemispheric coupling, Quat. Sci. Rev., 192, 27–46, https://doi.org/10.1016/j.quascirev.2018.05.005, 2018.
Perren, B. B., Kaiser, J., Arz, H. W., Dellwig, O., Hodgson, D. A., and Lamy, F.: Poleward displacement of the Southern Hemisphere Westerlies in response to Early Holocene warming, Commun. Earth Environ., 6, 1–10, https://doi.org/10.1038/s43247-025-02129-z, 2025.
Pesce, O. H. and Moreno, P. I.: Vegetation, fire and climate change in central-east Isla Grande de Chiloé (43° S) since the Last Glacial Maximum, northwestern Patagonia, Quat. Sci. Rev., 90, 143–157, https://doi.org/10.1016/j.quascirev.2014.02.021, 2014.
Pezza, A. B., Simmonds, I., and Renwick, J. A.: Southern hemisphere cyclones and anticyclones: recent trends and links with decadal variability in the Pacific Ocean, Int. J. Climatol., 27, 1403–1419, https://doi.org/10.1002/joc.1477, 2007.
Polissar, P. J., Freeman, K. H., Rowley, D. B., McInerney, F. A., and Currie, B. S.: Paleoaltimetry of the Tibetan Plateau from D/H ratios of lipid biomarkers, Earth Planet. Sci. Lett., 287, 64–76, https://doi.org/10.1016/j.epsl.2009.07.037, 2009.
Pöppelmeier, F., Jeltsch-Thömmes, A., Lippold, J., Joos, F., and Stocker, T. F.: Multi-proxy agreement on Atlantic circulation dynamics since the last ice age: Model output data, Zenodo, https://doi.org/10.5281/zenodo.7540200 [data set], 2023a.
Pöppelmeier, F., Jeltsch-Thömmes, A., Lippold, J., Joos, F., and Stocker, T. F.: Multi-proxy constraints on Atlantic circulation dynamics since the last ice age, Nat. Geosci., 16, 349–356, https://doi.org/10.1038/s41561-023-01140-3, 2023b.
Powell, R. L. and Still, C. J.: Biogeography of C3 and C4 vegetation in South America, Simpósio Brasileiro de Sensoriamento Remoto, 14 (SBSR), 2935–2942, 2009.
Prohaska, A., Seddon, A. W. R., Meese, B., Willis, K. J., Chiang, J. C. H., and Sachse, D.: Abrupt change in tropical Pacific climate mean state during the Little Ice Age, Commun. Earth Environ., 4, 1–13, https://doi.org/10.1038/s43247-023-00882-7, 2023.
Putman, A. L., Feng, X., Sonder, L. J., and Posmentier, E. S.: Annual variation in event-scale precipitation δ2H at Barrow, AK, reflects vapor source region, Atmos. Chem. Phys., 17, 4627–4639, https://doi.org/10.5194/acp-17-4627-2017, 2017.
Quade, J. and Kaplan, M. R.: Lake-level stratigraphy and geochronology revisited at Lago (Lake) Cardiel, Argentina, and changes in the Southern Hemispheric Westerlies over the last 25 ka, Quat. Sci. Rev., 177, 173–188, https://doi.org/10.1016/j.quascirev.2017.10.006, 2017.
Quezada, I. M., Zotz, G., and Gianoli, E.: Latitudinal variation in the degree of crassulacean acid metabolism in Puya chilensis, Plant Biol., 16, 848–852, https://doi.org/10.1111/plb.12181, 2014.
Quezada, I. M., Gianoli, E., and Saldaña, A.: Crassulacean acid metabolism and distribution range in Chilean Bromeliaceae: Influences of climate and phylogeny, J. Biogeogr., 45, 1541–1549, https://doi.org/10.1111/jbi.13237, 2018.
Rach, O., Brauer, A., Wilkes, H., and Sachse, D.: Delayed hydrological response to Greenland cooling at the onset of the Younger Dryas in western Europe, Nat. Geosci., 7, 109–112, https://doi.org/10.1038/ngeo2053, 2014.
Rach, O., Hadeen, X., and Sachse, D.: An automated solid phase extraction procedure for lipid biomarker purification and stable isotope analysis, Org. Geochem., 142, 103995, https://doi.org/10.1016/j.orggeochem.2020.103995, 2020.
Rahn, D. A. and Garreaud, R. D.: A synoptic climatology of the near-surface wind along the west coast of South America, Int. J. Climatol., 34, 780–792, https://doi.org/10.1002/joc.3724, 2014.
Rao, Z., Zhu, Z., Wang, S., Jia, G., Qiang, M., and Wu, Y.: CPI values of terrestrial higher plant-derived long-chain n-alkanes: a potential paleoclimatic proxy, Front. Earth Sci. China, 3, 266–272, https://doi.org/10.1007/s11707-009-0037-1, 2009.
Reboita, M. S., Ambrizzi, T., Crespo, N. M., Dutra, L. M. M., de Ferreira, G. W. S., Rehbein, A., Drumond, A., da Rocha, R. P., and de Souza, C. A. : Impacts of teleconnection patterns on South America climate, Ann. N. Y. Acad. Sci., 1504, 116–153, https://doi.org/10.1111/nyas.14592, 2021.
Reimi, M. A. and Marcantonio, F.: Constraints on the magnitude of the deglacial migration of the ITCZ in the Central Equatorial Pacific Ocean, Earth Planet. Sci. Lett., 453, 1–8, https://doi.org/10.1016/j.epsl.2016.07.058, 2016.
Renssen, H., Goosse, H., Fichefet, T., and Campin, J.-M.: The 8.2 kyr BP event simulated by a Global Atmosphere–Sea-Ice–Ocean Model, Geophys. Res. Lett., 28, 1567–1570, https://doi.org/10.1029/2000GL012602, 2001.
Rozanski, K., Araguás-Araguás, L., and Gonfiantini, R.: Isotopic Patterns in Modern Global Precipitation, in: Climate Change in Continental Isotopic Records, American Geophysical Union (AGU), 1–36, https://doi.org/10.1029/GM078p0001, 1993.
Rutllant, J. and Fuenzalida, H.: Synoptic aspects of the central chile rainfall variability associated with the southern oscillation, Int. J. Climatol., 11, 63–76, https://doi.org/10.1002/joc.3370110105, 1991.
Sachs, J. P., Sachse, D., Smittenberg, R. H., Zhang, Z., Battisti, D. S., and Golubic, S.: Southward movement of the Pacific intertropical convergence zone AD 1400–1850, Nat. Geosci., 2, 519–525, https://doi.org/10.1038/ngeo554, 2009.
Sachse, D., Radke, J., and Gleixner, G.: Hydrogen isotope ratios of recent lacustrine sedimentary n-alkanes record modern climate variability, Geochim. Cosmochim. Acta, 68, 4877–4889, https://doi.org/10.1016/j.gca.2004.06.004, 2004.
Sachse, D., Radke, J., and Gleixner, G.: δD values of individual n-alkanes from terrestrial plants along a climatic gradient – Implications for the sedimentary biomarker record, Org. Geochem., 37, 469–483, https://doi.org/10.1016/j.orggeochem.2005.12.003, 2006.
Sachse, D., Billault, I., Bowen, G. J., Chikaraishi, Y., Dawson, T. E., Feakins, S. J., Freeman, K. H., Magill, C. R., McInerney, F. A., van der Meer, M. T. J., Polissar, P., Robins, R. J., Sachs, J. P., Schmidt, H.-L., Sessions, A. L., White, J. W. C., West, J. B., and Kahmen, A.: Molecular Paleohydrology: Interpreting the Hydrogen-Isotopic Composition of Lipid Biomarkers from Photosynthesizing Organisms, Annu. Rev. Earth Planet. Sci., 40, 221–249, https://doi.org/10.1146/annurev-earth-042711-105535, 2012.
Salati, E., Dall'Olio, A., Matsui, E., and Gat, J. R.: Recycling of water in the Amazon Basin: An isotopic study, Water Resour. Res., 15, 1250–1258, https://doi.org/10.1029/WR015i005p01250, 1979.
Salvatteci, R., Schneider, R. R., Blanz, T., and Mollier-Vogel, E.: Deglacial to Holocene Ocean Temperatures in the Humboldt Current System as Indicated by Alkenone Paleothermometry, Geophys. Res. Lett., 46, 281–292, https://doi.org/10.1029/2018GL080634, 2019.
Sandweiss, D. H., Richardson, J. B., Reitz, E. J., Rollins, H. B., and Maasch, K. A.: Geoarchaeological Evidence from Peru for a 5000 Years B.P. Onset of El Niño, Science, 273, 1531–1533, https://doi.org/10.1126/science.273.5281.1531, 1996.
Schefuß, E., Schouten, S., and Schneider, R. R.: Climatic controls on central African hydrology during the past 20,000 years, Nature, 437, 1003–1006, https://doi.org/10.1038/nature03945, 2005.
Schneider, T., Bischoff, T., and Haug, G. H.: Migrations and dynamics of the intertropical convergence zone, Nature, 513, 45–53, https://doi.org/10.1038/nature13636, 2014.
Schneider, W., Donoso, D., Garcés-Vargas, J., and Escribano, R.: Water-column cooling and sea surface salinity increase in the upwelling region off central-south Chile driven by a poleward displacement of the South Pacific High, Prog. Oceanogr., 151, 38–48, https://doi.org/10.1016/j.pocean.2016.11.004, 2017.
Sessions, A. L., Burgoyne, T. W., Schimmelmann, A., and Hayes, J. M.: Fractionation of hydrogen isotopes in lipid biosynthesis, Org. Geochem., 30, 1193–1200, https://doi.org/10.1016/S0146-6380(99)00094-7, 1999.
Shakun, J. D., Clark, P. U., He, F., Marcott, S. A., Mix, A. C., Liu, Z., Otto-Bliesner, B., Schmittner, A., and Bard, E.: Global warming preceded by increasing carbon dioxide concentrations during the last deglaciation, Nature, 484, 49–54, https://doi.org/10.1038/nature10915, 2012.
Shi, X., Werner, M., Yang, H., D'Agostino, R., Liu, J., Yang, C., and Lohmann, G.: Unraveling the complexities of the Last Glacial Maximum climate: the role of individual boundary conditions and forcings, Clim. Past, 19, 2157–2175, https://doi.org/10.5194/cp-19-2157-2023, 2023.
Siani, G., Michel, E., De Pol-Holz, R., DeVries, T., Lamy, F., Carel, M., Isguder, G., Dewilde, F., and Lourantou, A.: Carbon isotope records reveal precise timing of enhanced Southern Ocean upwelling during the last deglaciation, Nat. Commun., 4, 2758, https://doi.org/10.1038/ncomms3758, 2013.
Silva, N., Rojas, N., and Fedele, A.: Water masses in the Humboldt Current System: Properties, distribution, and the nitrate deficit as a chemical water mass tracer for Equatorial Subsurface Water off Chile, Deep Sea Res. Part II Top. Stud. Oceanogr., 56, 1004–1020, https://doi.org/10.1016/j.dsr2.2008.12.013, 2009.
Sinclair, M. R., Renwick, J. A., and Kidson, J. W.: Low-Frequency Variability of Southern Hemisphere Sea Level Pressure and Weather System Activity, Mon. Weather Rev., 125, 2531–2543, https://doi.org/10.1175/1520-0493(1997)125<2531:LFVOSH>2.0.CO;2, 1997.
Strub, P. T., Mesías, J., Montecino, V., Rutllant, J. A., and Salinas, S.: Coastal ocean circulation off Western South America, edited by: Robinson, A. R. and Brink, K. H., John Wiley and Sons, NY, 273–313, 1998.
Stuut, J.-B. W. and Lamy, F.: Climate variability at the southern boundaries of the Namib (southwestern Africa) and Atacama (northern Chile) coastal deserts during the last 120,000 yr, Quat. Res., 62, 301–309, https://doi.org/10.1016/j.yqres.2004.08.001, 2004.
Stuut, J.-B. W., Kasten, S., Lamy, F., and Hebbeln, D.: Sources and modes of terrigenous sediment input to the Chilean continental slope, Quat. Int., 161, 67–76, https://doi.org/10.1016/j.quaint.2006.10.041, 2007.
Thomas, E. R., Wolff, E. W., Mulvaney, R., Steffensen, J. P., Johnsen, S. J., Arrowsmith, C., White, J. W. C., Vaughn, B., and Popp, T.: The 8.2 ka event from Greenland ice cores, Quat. Sci. Rev., 26, 70–81, https://doi.org/10.1016/j.quascirev.2006.07.017, 2007.
Thompson, D. W. J. and Wallace, J. M.: Annular Modes in the Extratropical Circulation. Part I: Month-to-Month Variability, J. Clim., 13, 1000–1016, https://doi.org/10.1175/1520-0442(2000)013<1000:AMITEC>2.0.CO;2, 2000.
Tian, L., Yao, T., MacClune, K., White, J. W. C., Schilla, A., Vaughn, B., Vachon, R., and Ichiyanagi, K.: Stable isotopic variations in west China: A consideration of moisture sources, J. Geophys. Res. Atmospheres, 112, https://doi.org/10.1029/2006JD007718, 2007.
Tiner, R. J., Negrini, R. M., Antinao, J. L., McDonald, E., and Maldonado, A.: Geophysical and geochemical constraints on the age and paleoclimate implications of Holocene lacustrine cores from the Andes of central Chile, J. Quat. Sci., 33, 150–165, https://doi.org/10.1002/jqs.3012, 2018.
Tofelde, S., Bernhardt, A., Guerit, L., and Romans, B. W.: Times Associated With Source-to-Sink Propagation of Environmental Signals During Landscape Transience, Front. Earth Sci., 9, https://doi.org/10.3389/feart.2021.628315, 2021.
Toggweiler, J. R., Russell, J. L., and Carson, S. R.: Midlatitude westerlies, atmospheric CO2, and climate change during the ice ages, Paleoceanography, 21, https://doi.org/10.1029/2005PA001154, 2006.
Turner, J.: The El Niño–southern oscillation and Antarctica, Int. J. Climatol., 24, 1–31, https://doi.org/10.1002/joc.965, 2004.
Umling, N. E. and Thunell, R. C.: Synchronous deglacial thermocline and deep-water ventilation in the eastern equatorial Pacific, Nat. Commun., 8, 14203, https://doi.org/10.1038/ncomms14203, 2017.
Valero-Garcés, B. L., Jenny, B., Rondanelli, M., Delgado-Huertas, A., Burns, S. J., Veit, H., and Moreno, A.: Palaeohydrology of Laguna de Tagua Tagua (34° 30′ S) and moisture fluctuations in Central Chile for the last 46 000 yr, J. Quat. Sci., 20, 625–641, https://doi.org/10.1002/jqs.988, 2005.
Vargas, G., Rutllant, J., and Ortlieb, L.: ENSO tropical–extratropical climate teleconnections and mechanisms for Holocene debris flows along the hyperarid coast of western South America (17°–24° S), Earth Planet. Sci. Lett., 249, 467–483, https://doi.org/10.1016/j.epsl.2006.07.022, 2006.
Vargas-Ramirez, L., Roche, E., Gerrienne, P., and Hooghiemstra, H.: A pollen-based record of late glacial–Holocene climatic variability in the southern lake district, Chile, J. Paleolimnol., 39, 197–217, https://doi.org/10.1007/s10933-007-9115-0, 2008.
Veit, H.: Southern Westerlies during the Holocene deduced from geomorphological and pedological studies in the Norte Chico, Northern Chile (27–33° S), Palaeogeogr. Palaeoclimatol. Palaeoecol., 123, 107–119, https://doi.org/10.1016/0031-0182(95)00118-2, 1996.
Vera, C., Higgins, W., Amador, J., Ambrizzi, T., Garreaud, R., Gochis, D., Gutzler, D., Lettenmaier, D., Marengo, J., Mechoso, C. R., Nogues-Paegle, J., Dias, P. L. S., and Zhang, C.: Toward a Unified View of the American Monsoon Systems, J. Clim., 19, 4977–5000, https://doi.org/10.1175/JCLI3896.1, 2006.
Viale, M., Bianchi, E., Cara, L., Ruiz, L. E., Villalba, R., Pitte, P., Masiokas, M., Rivera, J., and Zalazar, L.: Contrasting Climates at Both Sides of the Andes in Argentina and Chile, Front. Environ. Sci., 7, https://doi.org/10.3389/fenvs.2019.00069, 2019.
Villa-Martínez, R., Villagrán, C., and Jenny, B.: The last 7500 cal yr B.P. of westerly rainfall in Central Chile inferred from a high-resolution pollen record from Laguna Aculeo (34° S), Quat. Res., 60, 284–293, https://doi.org/10.1016/j.yqres.2003.07.007, 2003.
Villa-Martínez, R., Villagrán, C., and Jenny, B.: Pollen evidence for late-Holocene climatic variability at Laguna de Aculeo, Central Chile (lat. 34° S), The Holocene, 14, 361–367, https://doi.org/10.1191/0959683604hl712rp, 2004.
Völker, C. and Köhler, P.: Responses of ocean circulation and carbon cycle to changes in the position of the Southern Hemisphere westerlies at Last Glacial Maximum, Paleoceanography, 28, 726–739, https://doi.org/10.1002/2013PA002556, 2013.
Waliser, D. E. and Gautier, C.: A Satellite-derived Climatology of the ITCZ, J. Clim., 6, 2162–2174, https://doi.org/10.1175/1520-0442(1993)006<2162:ASDCOT>2.0.CO;2, 1993.
Waterisotopes Database: Global precipitation, http://waterisotopesDB.org (last access: 29 March 2024), 2017.
Watt-Meyer, O. and Frierson, D. M. W.: ITCZ Width Controls on Hadley Cell Extent and Eddy-Driven Jet Position and Their Response to Warming, J. Clim., 32, 1151–1166, https://doi.org/10.1175/JCLI-D-18-0434.1, 2019.
Weltje, G. J.: Quantitative analysis of detrital modes: statistically rigorous confidence regions in ternary diagrams and their use in sedimentary petrology, Earth-Sci. Rev., 57, 211–253, https://doi.org/10.1016/S0012-8252(01)00076-9, 2002.
Weltje, G. J., Van Ansenwoude, S. O. K. J., and de Boer, P. L.: High-frequency detrital signals in Eocene fan-delta sandstones of mixed parentage (south-central Pyrenees, Spain); a reconstruction of chemical weathering in transit, J. Sediment. Res., 66, 119–131, https://doi.org/10.1306/D42682CF-2B26-11D7-8648000102C1865D, 1996.
Werner, C., Schmid, M., Ehlers, T. A., Fuentes-Espoz, J. P., Steinkamp, J., Forrest, M., Liakka, J., Maldonado, A., and Hickler, T.: Effect of changing vegetation and precipitation on denudation – Part 1: Predicted vegetation composition and cover over the last 21 thousand years along the Coastal Cordillera of Chile, Earth Surf. Dynam., 6, 829–858, https://doi.org/10.5194/esurf-6-829-2018, 2018.
Wiedicke-Hombach, M. and Shipboard Scientific Party: Cruise Report SO161-5 SPOC (Subduction Processes off Chile), Geologye Geochemistry-Heatflow, Hannover, 2002.
Wodzicki, K. R. and Rapp, A. D.: Variations in Precipitating Convective Feature Populations with ITCZ Width in the Pacific Ocean, J. Clim., 33, 4391–4401, https://doi.org/10.1175/JCLI-D-19-0689.1, 2020.
Yeh, S.-W., Cai, W., Min, S.-K., McPhaden, M. J., Dommenget, D., Dewitte, B., Collins, M., Ashok, K., An, S.-I., Yim, B.-Y., and Kug, J.-S.: ENSO Atmospheric Teleconnections and Their Response to Greenhouse Gas Forcing, Rev. Geophys., 56, 185–206, https://doi.org/10.1002/2017RG000568, 2018.
Yuan, S., Chiang, H.-W., Liu, G., Bijaksana, S., He, S., Jiang, X., Imran, A. M., Wicaksono, S. A., and Wang, X.: The strength, position, and width changes of the intertropical convergence zone since the Last Glacial Maximum, Proc. Natl. Acad. Sci., 120, e2217064120, https://doi.org/10.1073/pnas.2217064120, 2023.
Yuan, X., Kaplan, M. R., and Cane, M. A.: The Interconnected Global Climate System–A Review of Tropical–Polar Teleconnections, J. Clim., 31, 5765–5792, https://doi.org/10.1175/JCLI-D-16-0637.1, 2018.
Zech, R., Kull, Ch., Kubik, P. W., and Veit, H.: Exposure dating of Late Glacial and pre-LGM moraines in the Cordon de Doña Rosa, Northern/Central Chile ( 31° S), Clim. Past, 3, 1–14, https://doi.org/10.5194/cp-3-1-2007, 2007.
Zhang, C., Huang, G., Yan, D., Wang, H., Zeng, G., Wang, S., and Li, Y.: Analysis of South American climate and teleconnection indices, J. Contam. Hydrol., 244, 103915, https://doi.org/10.1016/j.jconhyd.2021.103915, 2022.
Zhang, Y., Wallace, J. M., and Battisti, D. S.: ENSO-like Interdecadal Variability: 1900–93, J. Clim., 10, 1004–1020, https://doi.org/10.1175/1520-0442(1997)010<1004:ELIV>2.0.CO;2, 1997.