the Creative Commons Attribution 4.0 License.
the Creative Commons Attribution 4.0 License.
 | 27 Oct 2025
Persistent contamination in benthic-foraminifera-based Mg ∕ Ca thermometry using standard cleaning methods
Viktoria Larsson
Simon Jung
ratios measured in benthic foraminifera have been explored as a potential palaeothermometry proxy for bottom water temperatures (BWT). -BWT calibrations from the Indian Ocean are rare and comprise conflicting results. Inconsistencies between studies suggest that calibrations may need to be region specific. The aim of this study was to develop -BWT calibrations based on species-specific benthic foraminifera (Uvigerina peregrina, Cibicidoides wuellerstorfi, and Cibicidoides mundulus) in the tropical western Indian Ocean and to optimize the chemical cleaning procedure by Barker et al. (2003) applied to samples analysed in this study. The majority of samples of C. mundulus and U. peregrina, however, remained contaminated, rendering those data unusable for core-top calibrations. Only ratios in C. wuellerstorfi allowed a tentative -BWT calibration with the relationship being: , r2=0.87 and n=4). While this result differs to some degree from previous studies, it principally suggests that existing core-top calibrations from the wider Indian Ocean can be applied to core-tops in the western Indian Ocean. The agreement of ratios at lower temperatures in C. wuellerstorfi, C. mundulus, and U. peregrina with ratios reported for these species at low temperatures in other studies supports this conclusion. The clear difference in contamination between Cibicidoides spp. and U. peregrina, despite using the same cleaning procedure, supports the findings of previous studies that suggest different rigour might be required for different species. Many other uncertainties surrounding the proxy exist and more calibration studies are required to improve this method.
- Article
(14923 KB) - Full-text XML
- BibTeX
- EndNote


There are a range of proxies measured in foraminifera used to reconstruct changes in seawater properties through time. Stable oxygen isotopes (δ18O) have been widely applied to identify changes in water column properties (Lynch-Stieglitz and Fairbanks, 1994). Straightforward interpretation, however, is hampered due to stable oxygen isotopes reflecting more than one environmental factor, i.e. ambient temperatures and seawater δ18O with the latter being controlled by global ice volume and the evaporation-precipitation balance in the water mass source region (Emiliani, 1955; Shackleton, 1967; Shackleton, 1974). In order to improve the use of δ18O values, independent temperature proxies have been developed (Elderfield and Ganssen, 2000; Lea et al., 1999; Nürnberg, 1995; Nürnberg et al., 1996). -based temperature estimates in planktic foraminifera for example are widely used as a proxy for sea surface temperature (SST; Barker et al., 2005). The use of ratios in benthic foraminifera for reconstructions of bottom water temperatures (BWT) is being explored (Rosenthal et al., 1997; Elderfield et al., 2006) although there is no widely accepted method as yet. -based BWT reconstructions, used in combination with other proxies such as δ18O, are potentially crucial for our understanding of reorganizations of deep and bottom waters associated with, for example, past glacial/interglacial transitions (Bickert and Mackensen, 2003; Duplessy et al., 1988; Curry et al., 1988; Sarnthein et al., 1994). In order to assess the robustness of the -based thermometry in deep/intermediate water based on benthic foraminifera, we present -based BWT calibrations derived from the benthic foraminiferal species Uvigerina peregrina (U. peregrina), Cibicidoides wuellerstorfi (C. wuellerstorfi), and Cibicidoides mundulus (C. mundulus) using core-top samples from the western tropical Indian Ocean and compare those with previously published calibrations from the Indian Ocean (Elderfield et al., 2006; Healey et al., 2008). We also assess the usefulness of adaptations of cleaning procedures.
1.1 Mg Ca ratios – a proxy for temperature
Foraminifera form calcite tests, which is a lattice composed of calcium carbonate. During carbonate formation, divalent ions of trace elements such as Mg2+ substitute Ca2+ in the calcite lattice (Erez, 2003). Resulting ratios in benthic foraminifera depend on the ratio of ambient water and elemental partitioning during calcite precipitation with the latter depending on ambient water temperature (Elderfield et al., 1996; Gussone et al., 2016). On glacial-interglacial timescales ratios in seawater can be considered constant due to long residence times for Ca and Mg (∼106 and 107 years, respectively). Hence, ratios can be used to reconstruct BWT. Existing core-top calibrations show a positive correlation between ratios in a number of species of benthic foraminifera and modern BWTs (Martin and Lea, 2002; Elmore et al., 2015). Temperature appears to be the dominant environmental factor controlling incorporation of Mg in tests of some species of Cibicidoides spp. (Rosenthal et al., 1997) but other factors including carbonate ion saturation might also affect Mg inclusion (Elderfield et al., 2006; Yu and Elderfield, 2008). There is discussion surrounding the importance of various factors controlling incorporation in benthic foraminifera, with, for example, Yu and Elderfield (2008) suggesting carbonate ion saturation being dominant whereas Lear et al.'s (2002) work implies only a minor influence. There is also evidence suggesting that the – temperature relationships and the carbonate ion effect varies between different ocean basins and depositional environments (Bryan and Marchitto, 2008).
1.2 Mg Ca analysis – a brief summary
The chemical cleaning procedure is a critical step essential for accurate determination of ratios in foraminifera (Barker et al., 2003) due to the generally low concentration ratios, entailing the need to remove Mg containing contaminants (Barker et al., 2003; Marr et al., 2013). Concurrently, carbonate dissolution of tests may affect ratios (Lear et al., 2002) and therefore the aim of a cleaning procedure is to effectively clean tests while minimizing sample loss (Barker et al., 2003). Silicate contamination is the most critical contaminant affecting ratios, followed by Mn-oxide coatings (Barker et al., 2003). The two most widely used cleaning methods are the “Mg cleaning method” also referred to as the “oxidative cleaning method” by Barker et al. (2003) based on Boyle and Keigwin (1985) and the “Cd cleaning method” also referred to as the “reductive oxidative cleaning method” by Boyle and Keigwin (1985) and Rosenthal et al. (1995, 1997). Both methods include successive rinses with ultrapure water followed by methanol cleaning, and an oxidative cleaning step to remove silicates. The “Cd cleaning method” in addition includes a reductive step to remove Mn-oxide coatings. The procedure was originally intended for determination of ratios (Boyle and Keigwin, 1985) because Cd concentrations in calcite are significantly lower than Mg concentrations and therefore contamination is more critical (Marr et al., 2013). While the more aggressive “Cd cleaning procedure” is not viewed as needed for accurate analyses (Barker et al., 2003; Yu et al., 2007), it is still used (Stirpe et al., 2021) amid continued uncertainty surrounding the requirement of additional rigour for accurate analyses (e.g. Pena et al., 2008; Hasenfratz et al., 2017). Whilst the additional reductive step is implemented to ensure removal of diagenetic coatings, it results in an estimated ∼15 % lowering of ratios due to partial preferential dissolution of Mg-rich calcite (Barker et al., 2003; Yu et al., 2007). In comparison, if the reductive step is excluded, diagenetic coatings only causes an estimated ∼1 % increase in ratios (Barker et al., 2003; Yu et al., 2007) rendering the reductive step not required in most cases. Therefore, the majority of studies have utilized the “Mg cleaning procedure” (e.g. Elderfield et al., 2006, 2010; Elmore et al., 2015), targeting silicate contamination, organic matter, Mn-oxide coatings, and secondary calcification (Barker et al., 2003). Furthermore, rather than analysing multiple whole-shell specimen of foraminifera for analysis by solution in ICP-MS/ICP-OES, Stirpe et al. (2021) used laser ablation ICP-MS measuring ratios revealing unevenly distributed ratios between different chambers in Uvigerina spp. Also, Branson et al. (2013) analysed tests of two species of planktic foraminifera showing a systematic banding of Mg distribution. Based on these findings, whole-shell analysis by solution remains the most appropriate method of determining bulk or whole specimen calcite ratios (Stirpe et al., 2021).
1.3 Species-specific Mg Ca – temperature calibrations
Earlier studies of -BWT calibrations used mixed benthic foraminifera of the same genera, mostly Cibicidoides spp. (e.g. Rosenthal et al., 1997). Later work, however, implies a species-specific temperature sensitivity driving the signal (Lear et al., 2002; see Fig. 1 for locations within the Indian Ocean). C. wuellerstorfi has been one of the most widely used benthic species for stable δ18O and δ13C reconstructions (e.g. Bell et al., 2014; Bickert and Mackensen, 2003; Duplessy et al., 1988; Jung et al., 2009; Sarnthein et al., 1994). It is advantageous over other benthic species because it is a true epifaunal species (Lutze and Thiel, 1989) and suggested to record bottom water properties. However, some core-top studies suggest Mg – signatures or – incorporation in C. wuellerstorfi is significantly influenced by carbonate ion saturation (Elderfield et al., 2006 – see Fig. 1 for locations within the Indian Ocean; Yu and Elderfield, 2008), limiting its use as a proxy for BWT. In contrast ratios in shallow endofaunal Uvigerina spp. seem to be independent of carbonate ion saturation and U. peregrina has therefore been presented as a promising -based thermometry species (Yu and Elderfield, 2008; Elderfield et al., 2010; Stirpe et al., 2021; Elmore et al., 2015). The inconsistencies between studies remain and factors influencing different species require more attention pointing to the need for more core-top calibrations in different depositional environments using more than one species.
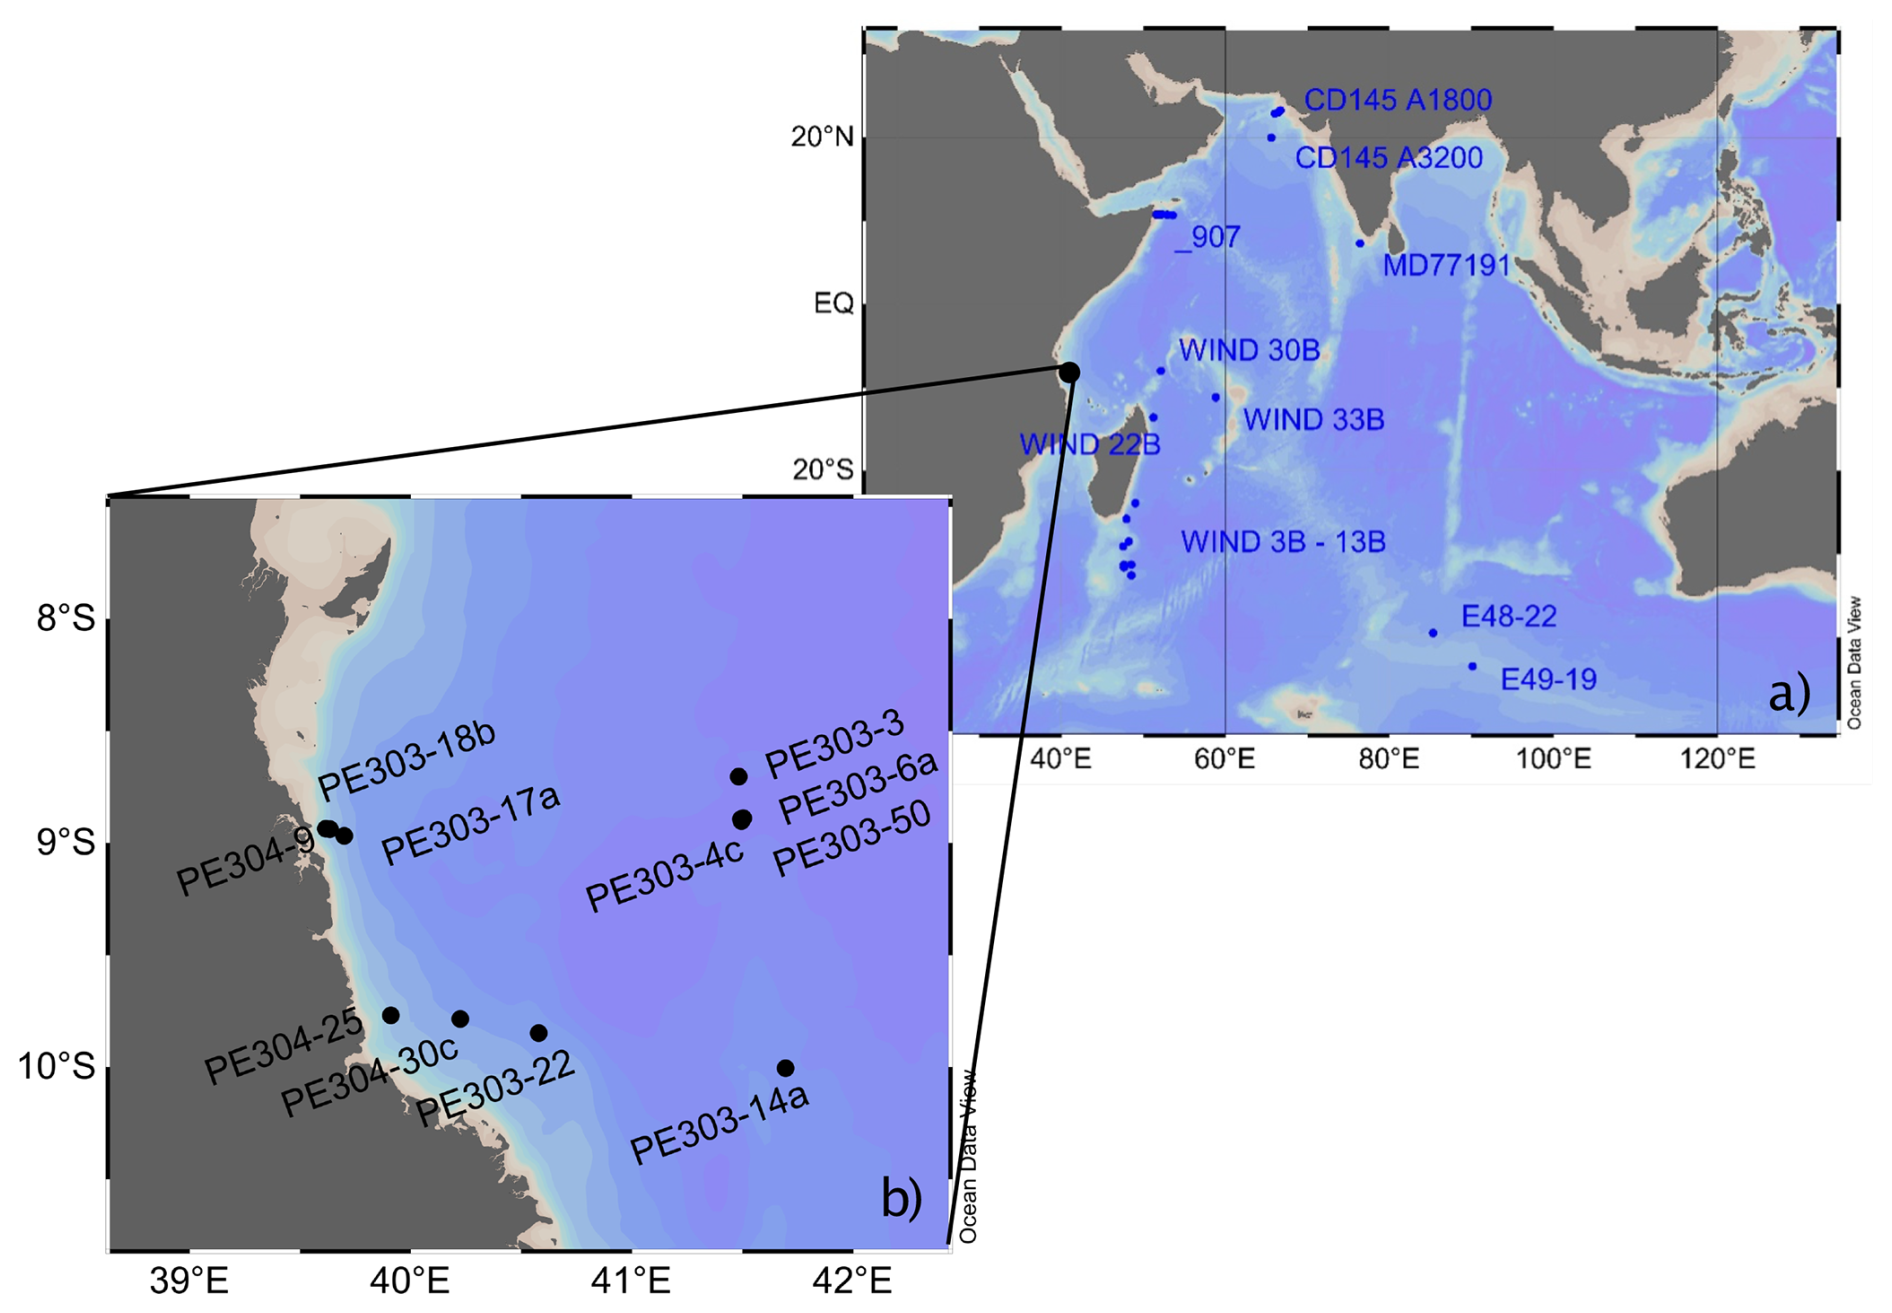
Figure 1Map showing location of (a) existing sediment core-top benthic -BWT calibrations in the Indian Ocean (blue) and (b) the location of cores analysed in this study (black). Map has been produced in Ocean Data View (Schlitzer, 2023).
2.1 Sample location and hydrography
This study is based on a transect of sediment surface samples retrieved from 370 to 3400 m water depth off Tanzania (see Fig. 1 and Table 1). In order to optimize sample quality, only box core or multicorer samples were used (Table 1). The cores have been taken during the Dutch “Indian–Atlantic Exchange (INATEX)” (Brummer and Jung, 2009) and the “Tropical Temperature History during Paleogene Global Warming Events (GLOW)” (Kroon and Shopboard Party, 2010) expeditions. In the modern western Indian Ocean, the water column at our core-top transect is comprised of Antarctic Bottom Water (AABW) below 4000 m and Circumpolar Deep Water (CDW) between 2000 and ∼3500 m (Fig. 3, You, 2000; McCave et al., 2005), the latter itself comprising Lower CDW (LCDW) and Upper (UCDW). North Atlantic Deep Water (NADW) and AABW are the main contributors to LCDW, whereas UCDW is a mix of Indian and Pacific common waters (for a summary see Srinivasan, 1999). Above CDW there is a zone influenced by Red Sea Water (RSW) (Grundlingh, 1985) and/or Antarctic Intermediate Water (AAIW), with both water masses extending south- and northwards, respectively, controlling intermediate depth water properties at the location of our core-top transect (Figs. 2–3; sensu Talley et al., 1999; Grundlingh, 1985; McCave et al., 2005). Based on two nearby CTD profiles (measured during the GLOW expedition, Birch et al., 2013), bottom water temperatures range from 1 to 10 °C (Table 1).
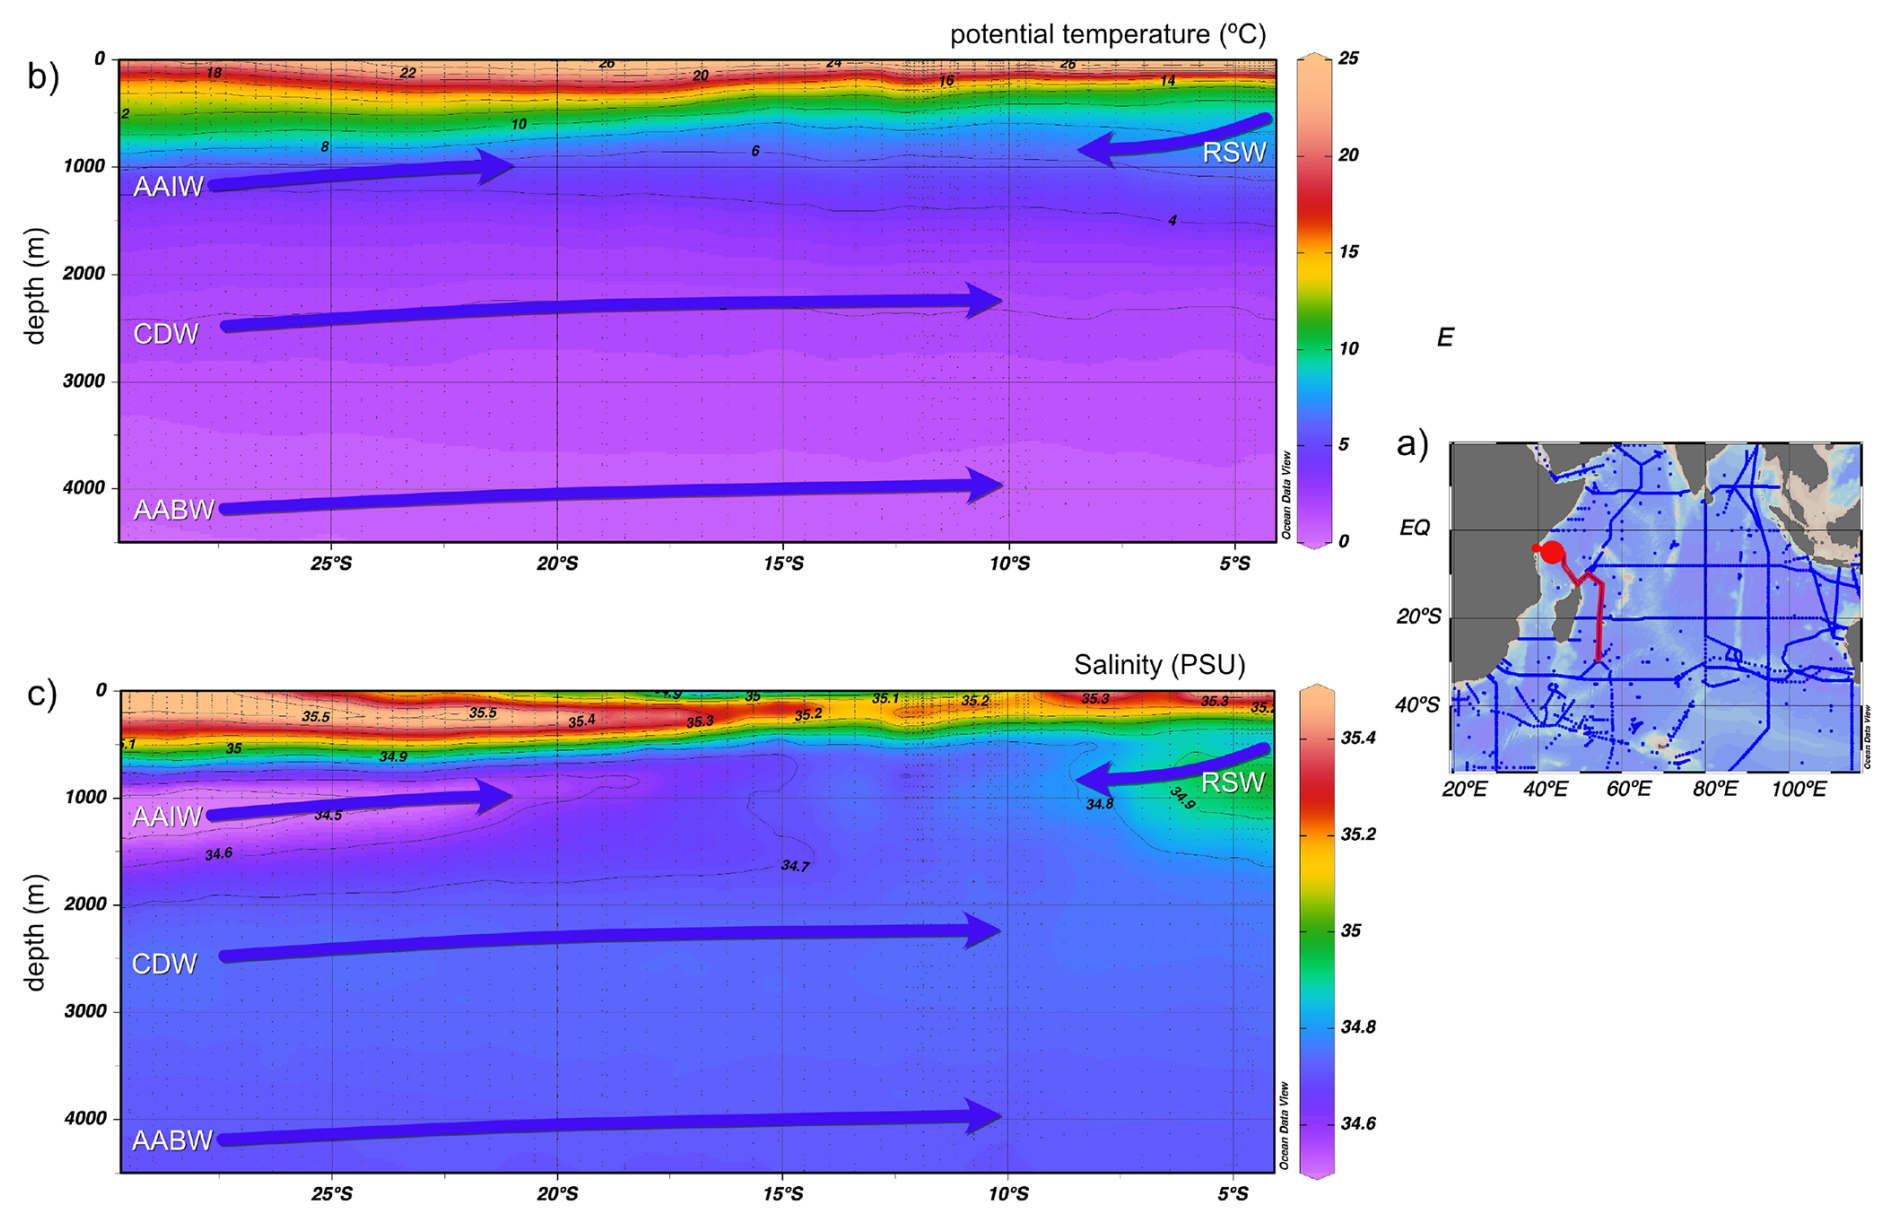
Figure 2(a) Map on the right-hand side shows GLODAPv2_2023 ship tracks; red contours show the transect selected (red dot: nearest available GLDOAPv2_2023 data to core locations in this study). The map has been produced in Ocean Data View (Schlitzer, 2023). (b) and (c) North–south cross sections of potential temperature and salinity, respectively, over depths 0–4500 m in the western Indian Ocean from 28 to 4° S. Arrows show flow direction of the main water masses. Temperature and salinity data from GLODAPv2_2023 (Lauvset et al., 2022, 2024).
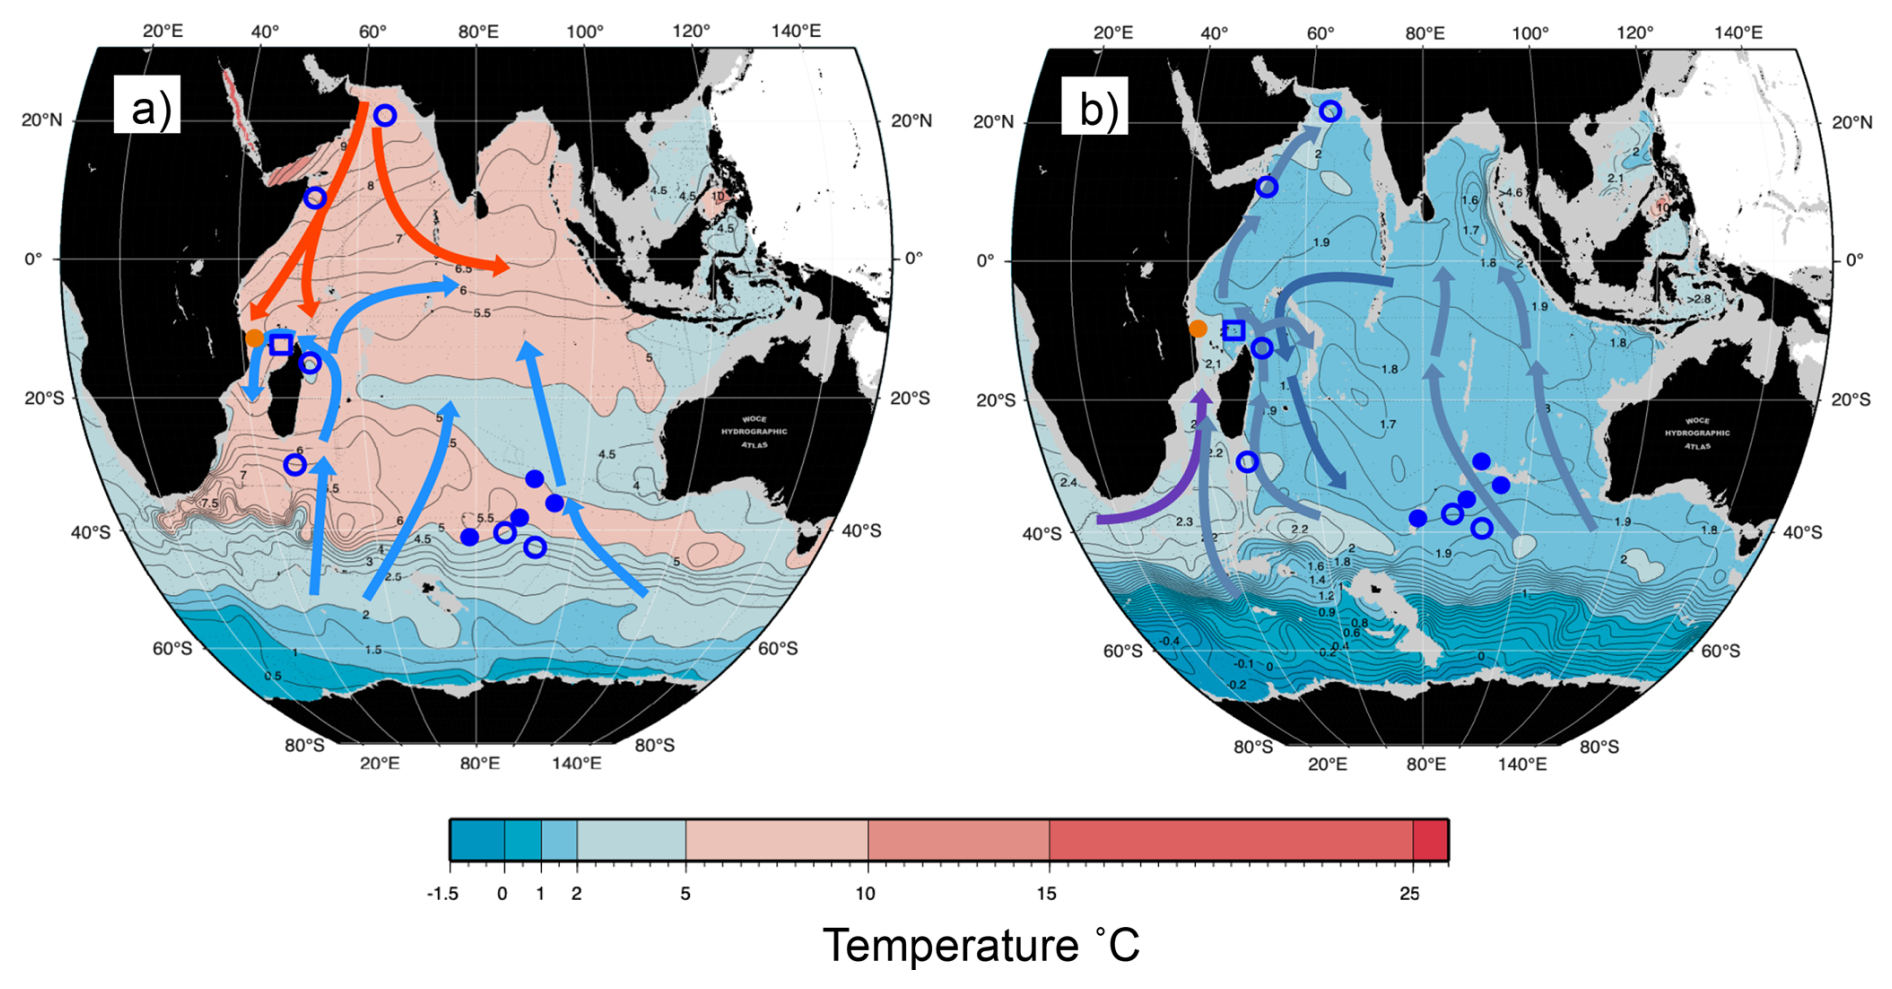
Figure 3Map of potential temperature adapted from the WOCE Indian Ocean Atlas (Talley, 2013) at intermediate and deep-water depths. (a) 1000 m with general intermediate water circulation; blue arrow: AAIW and red: RSW (b) 2500 m with general deep water circulation; lighter blue arrow: LCDW, darker blue arrow: NIDW/UCDW, and purple arrow: NADW. Approximate location of core-tops from the Indian Ocean; orange circle: this study, open square: nearest CTD transect (Birch et al., 2013), filled circle: Healey et al. (2008) and open circle: Elderfield et al. (2010).
Table 1Details of core-top samples of benthic foraminifera analysed in this study.
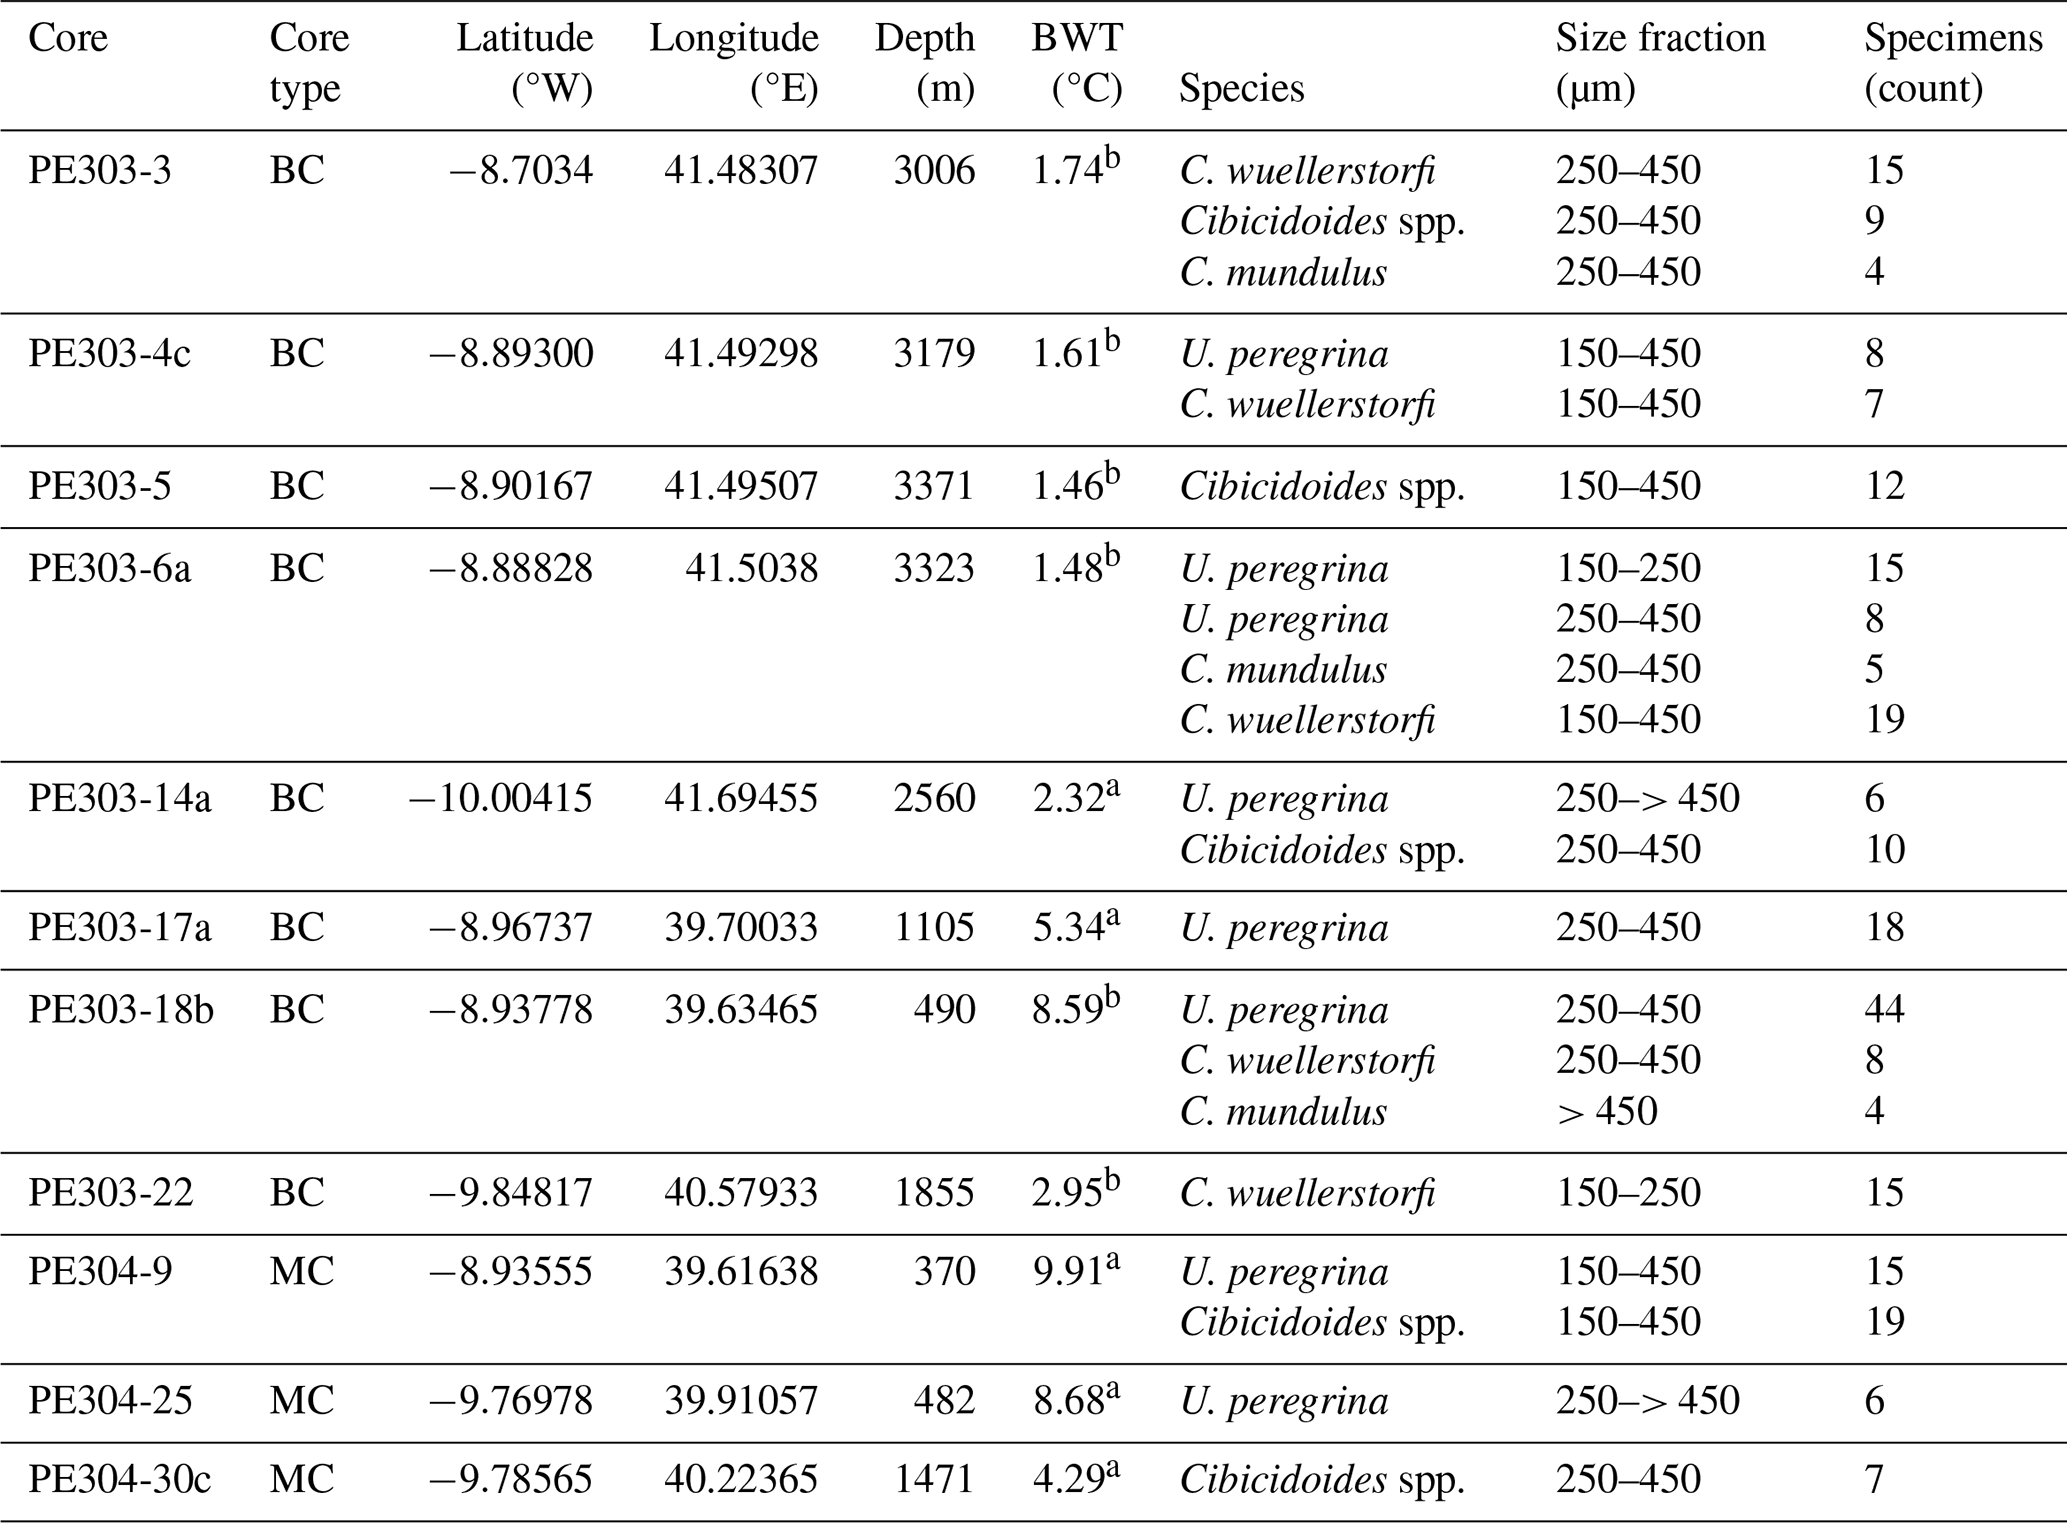
BC = box core, MC = multicore. a,b Bottom water temperatures from nearest CTD profiles from Birch et al. (2013): a= GLOW Station 2 and b= GLOW Station 5.
2.2 Sample preparation
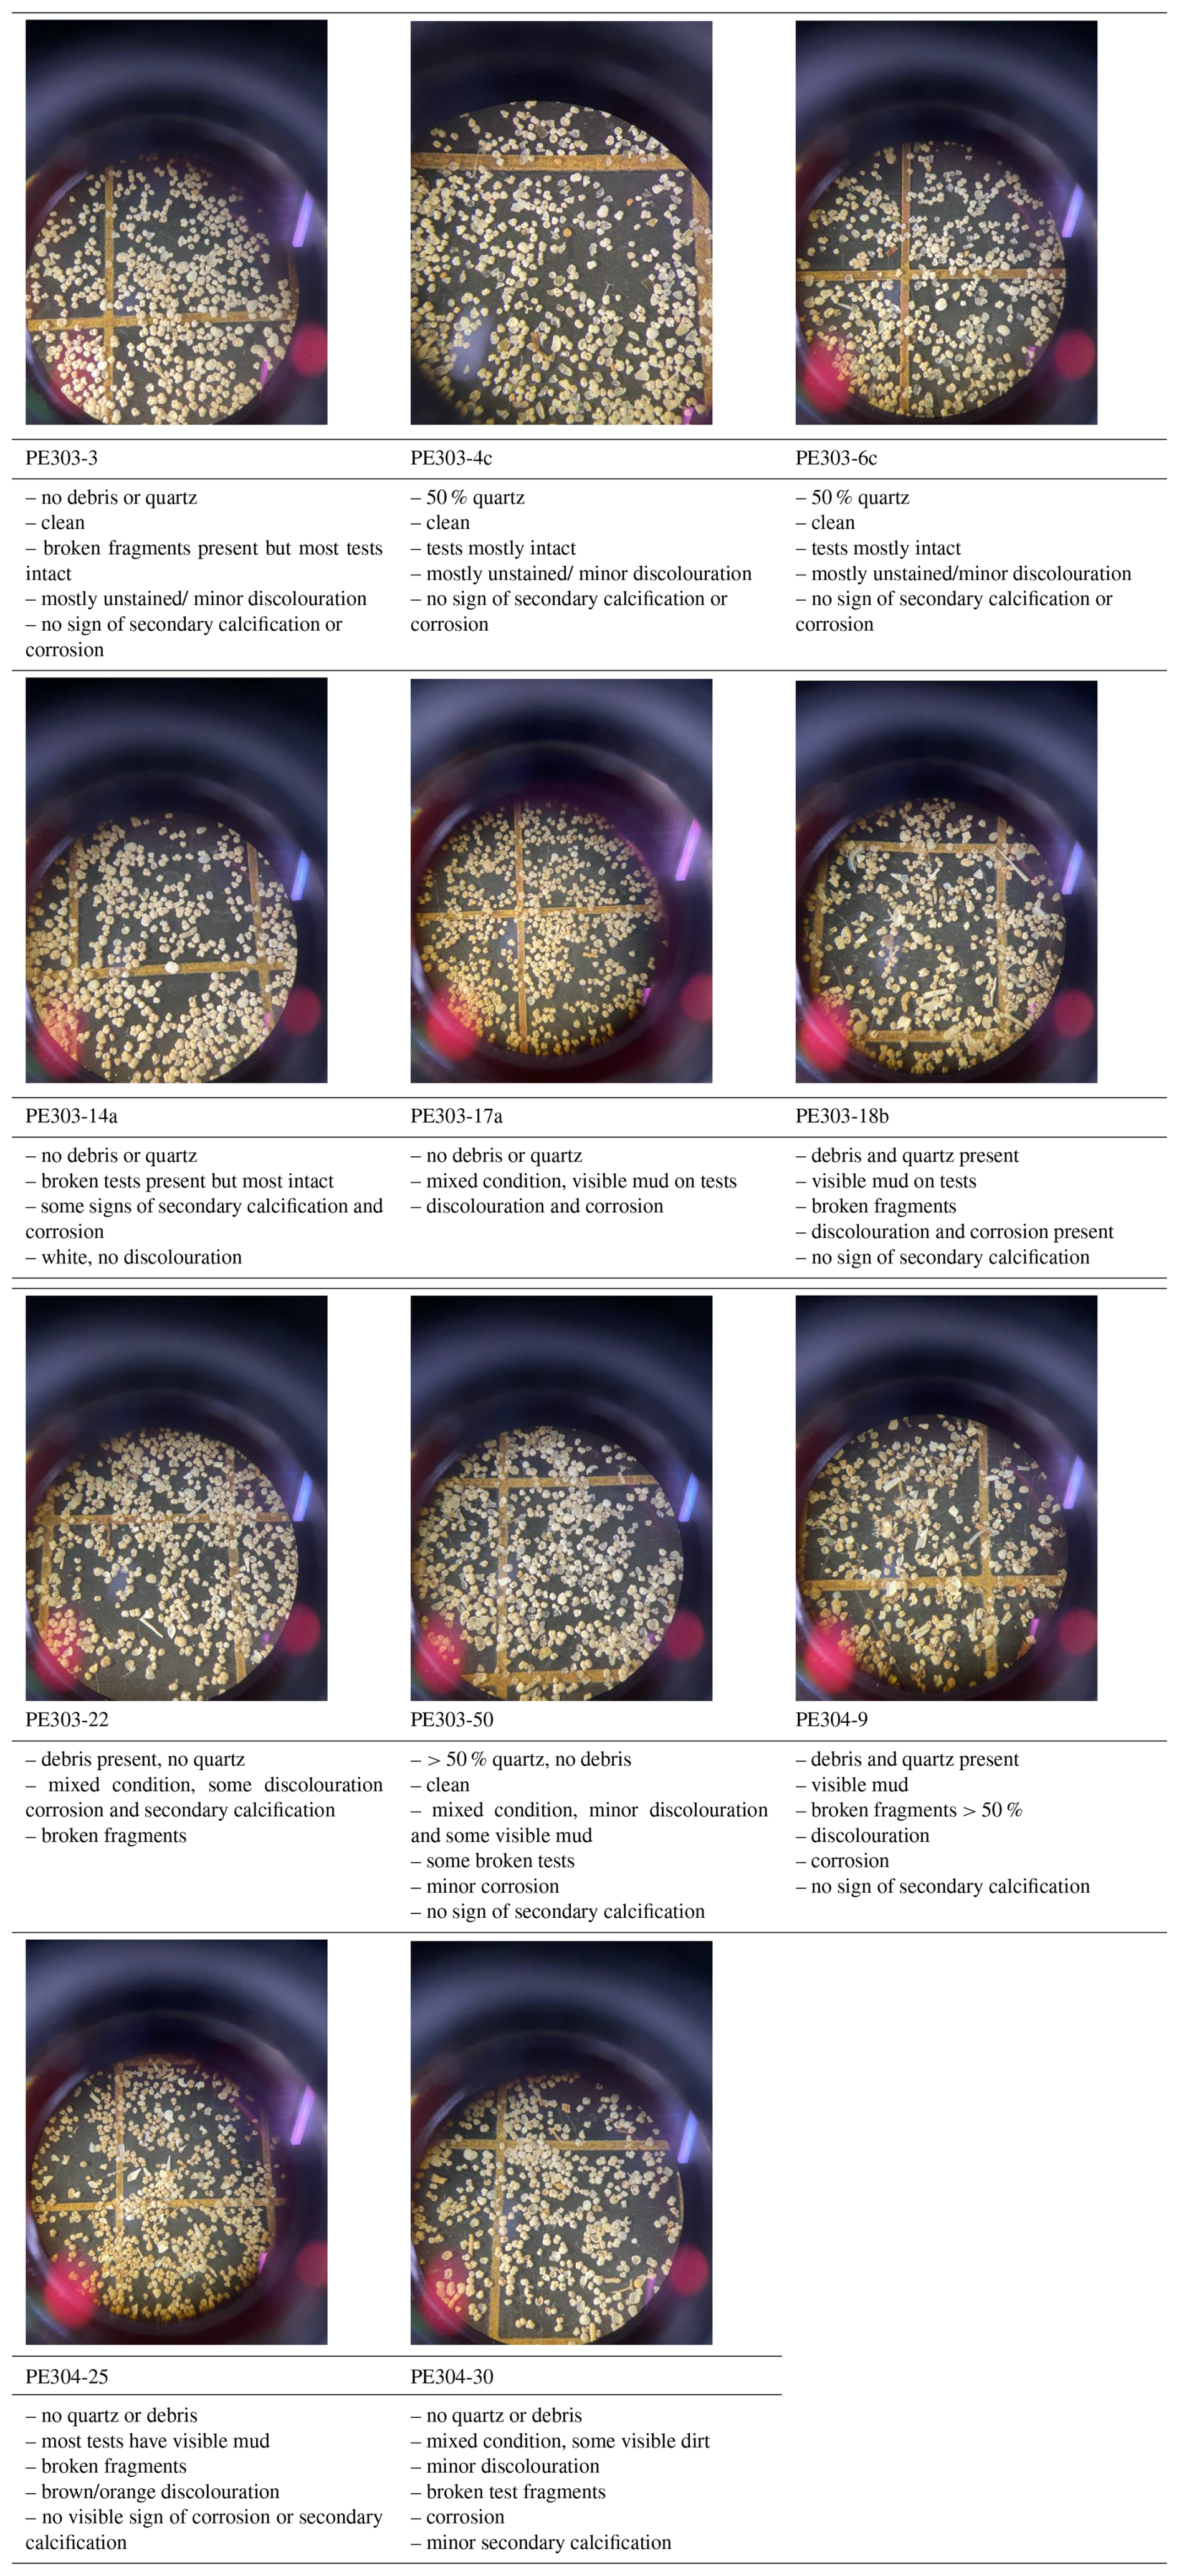
can be affected by intra-shell, intra-species, and inter-species variability referred to as “vital effects” (Bentov and Erez, 2006; de Nooijer et al., 2014; and discussions therein). In order to minimize these effects, we have focussed, where possible, on analysing multiple whole specimens of three benthic foraminifera species: U. peregrina, C. wuellerstorfi, and C. mundulus. In most cases these were picked from comparatively small size fraction windows (i.e. 150–250 and 250–450 µm). Only in a small number of cases a wider size fraction window was used due to low foraminifera abundances (Table 1). Specimens with no signs of stains, discolouration, fragmentation or post depositional calcification were selected based on previous studies suggesting post depositional effects on ratios (Lear et al., 2002) (see qualitative observations in Table C1 in Appendix C). Because temperature sensitivity of in Cibicidoides spp. might be species specific (Lea et al., 1999; Gussone et al., 2016), species of Cibicidoides spp. were analysed separately except for samples containing less than 5 specimens (Table 1). Sample PE303-18b was split into two to check for intra sample variation (the only sample with sufficient sample size). In order to test the cleaning procedure, specimens from the planktic foraminifera species Globigerinoides ruber (G. ruber) were picked from the 250–355 µm size fraction of samples from core NIOP929 (Saher et al., 2009; core NIOP929 was retrieved from the continental slope off Somalia during the Netherlands Indian Ocean expedition in 1993; van Hinte et al., 1995) because there were insufficient planktic and benthic foraminifera specimens in our off Tanzania core-top transect to carry out these tests. The samples were wet sieved over a > 63 µm screen and dried at 40 °C.
All samples were chemically cleaned using water and methanol rinses to remove silicates, a hydrogen peroxide treatment to remove organic matter, and an acid rinse to remove residual treatment chemicals (Barker et al., 2003). The rigour needed to sufficiently clean samples depends on a number of factors including sediment composition and foraminifera morphology, i.e. some species trapping contaminants more than others. Therefore, we have adapted the Mg cleaning methodology by Barker et al. (2003) to find the appropriate level of cleaning required (optimum removal of contaminants while minimizing sample loss) for the benthic samples analysed in this study.
In experiment 1, 6 sets of specimens of G. ruber were treated with the chemical cleaning procedure of Barker et al. (2003) except methanol and MilliQ washes were reduced (methanol rinse: 25 s repeated twice compared to 1–2 min repeated once – see Table 2 for specifications). The chemicals were prepared following Barker et al. (2003). Traditionally, the procedure involves crushing of foraminifera between two glass plates. Given the small sample volume in our study, we tested individual crushing of foraminifera specimens using a metal pin and glass mortar to open the test chambers. The samples were transferred to Eppendorf tubes with 500 µL MilliQ water and washed with MilliQ followed by washing with methanol, in both steps using an ultrasonic bath. This was followed by a hydrogen peroxide treatment in a hot water bath (30 min at 85 °C) and an acid leach using nitric acid (see protocol in Barker et al., 2003).
Table 2Specifications of chemical cleaning procedures used in Experiments 1–3 and core-top analysis.
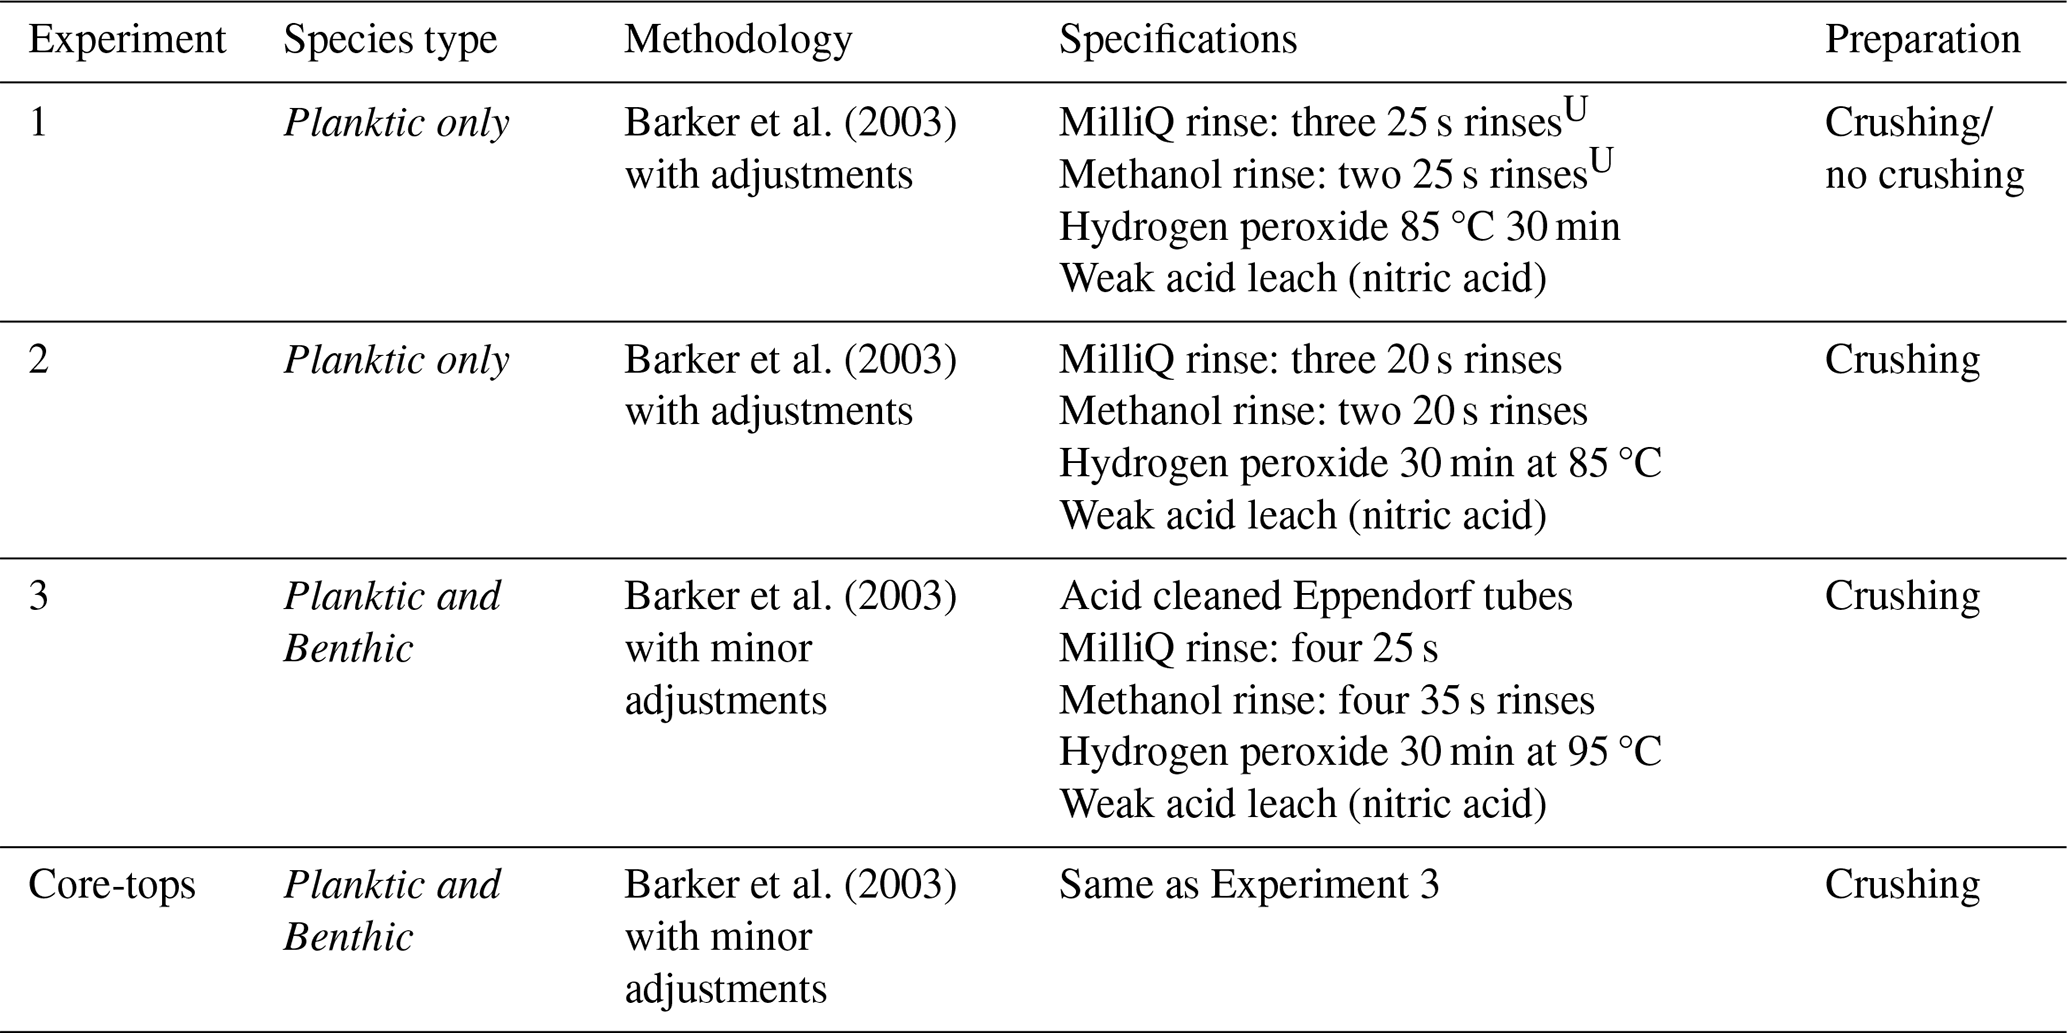
U seconds refers to time in ultrasonic bath at 50 % power.
The results of the first experiment, with some variability, show that average Ca concentrations (normalized to the number of tests) of samples crushed using two glass plates were lower (5.81 ppm, average based on normalized values) than in samples crushed using a metal pin and glass mortar (9.53 ppm, average based on normalized values), see Tables A1 and A2 in Appendix A, suggesting less sample loss in the latter. The average ratios of samples crushed using two glass plates and using a metal pin and a glass mortar was broadly similar, i.e. 4.54 and 5.36 mmol mol−1 , respectively (please note that we regard sample 1a in Table A2 in Appendix A as an outlier due to the very low Ca concentration). In addition, the range of values is similar when comparing results using both crushing methods (Tables A1 and A2 in Appendix A). Also, the variability between samples is comparable with the range in published data (Sadekov et al., 2008; Rustic et al., 2021). This suggests that crushing using a metal pin and a glass mortar does not introduce more Mg or Ca bearing contaminants than the technique using two glass plates. Fe and Al concentrations were below the limit of detection in all samples (< 0.0070 and < 0.0079 ppm) suggesting no silicate contamination. Because the technique using a metal pin and glass mortar entailed less sample loss and there was little difference in ratios we used this technique for our study.
In experiment 2, as a result of the low Ca concentrations in experiment 1 (0.55 to 7.50 ppm, using either crushing technique, Tables 1A and A2 in Appendix A), the chemical cleaning procedure was amended to assess if this was due to calcite dissolution (too rigorous cleaning). In experiment 2, from 8 sets of 20 specimens of G. ruber, picked from core NIOP929 (Table A1 in Appendix A), four sets were manually crushed using a drop of MilliQ water and a metal pin in a glass mortar. Two of those samples were transferred to a small glass vial and ultrasonicated for 3 s. The other two samples were kept intact and transferred to Eppendorf tubes. The cleaning procedure followed Barker et al. (2003) except for reducing the time for the methanol step (methanol rinse: 20 s repeated twice compared to 1–2 min repeated once, see all specifications in Table 2).
Generally, in experiment 2, Ca concentrations are higher than in experiment 1 (range from 7.32 to 30.92 ppm, see Table A3 in Appendix A). In crushed samples (experiment 2), average Ca concentrations of 15.95 ppm (range from 7.92 to 22.54 ppm) are lower than the average in non-crushed samples of 23.15 ppm (range from 7.32 to 30.92 ppm), suggesting more sample loss from crushing (see Table A3 in Appendix A). Based on average ratios, crushed samples have lower ratios than the uncrushed samples (0.37 mmol mol−1 compared to 0.57 mmol mol−1) suggesting less silicate contamination in the crushed samples. There is, however, significant uncertainty because the offset is not consistent and one outlier with a substantially higher ratio (1.56 mmol mol−1) and ratio (9.41 mmol mol−1) is partly responsible for the higher average (see Fig. 4a). The strong correlation between ratios and ratios in both crushed (r2=0.99) and uncrushed (r2=0.93) tests suggest insufficient removal of silicate contaminants in both. It is interesting to note that there is only a small difference in average ratios (2.90 and 3.02 mmol mol−1) with no linear correlation to ratios (Fig. 4b) which suggest only a small difference in silicate contamination. The strong correlation between ratios and ratios in crushed samples (r2=0.95) suggests insufficient removal of Mn-oxide coatings. Similarly, ratios and ratios in uncrushed (r2=0.95) tests also suggest insufficient removal of Mn-oxide coatings in both, although this correlation depends on a potential outlier. These findings support the notion that, regarding Mn-oxide coatings, the rigour of the chemical cleaning is significantly more important than mechanical crushing. From the inconclusive results and because of time constraints, we decided to crush shells prior to chemical cleaning in the subsequent Experiment 3 following previous benthic core-top studies (Elmore et al., 2015; Elderfield et al., 2010; Barker et al., 2003).
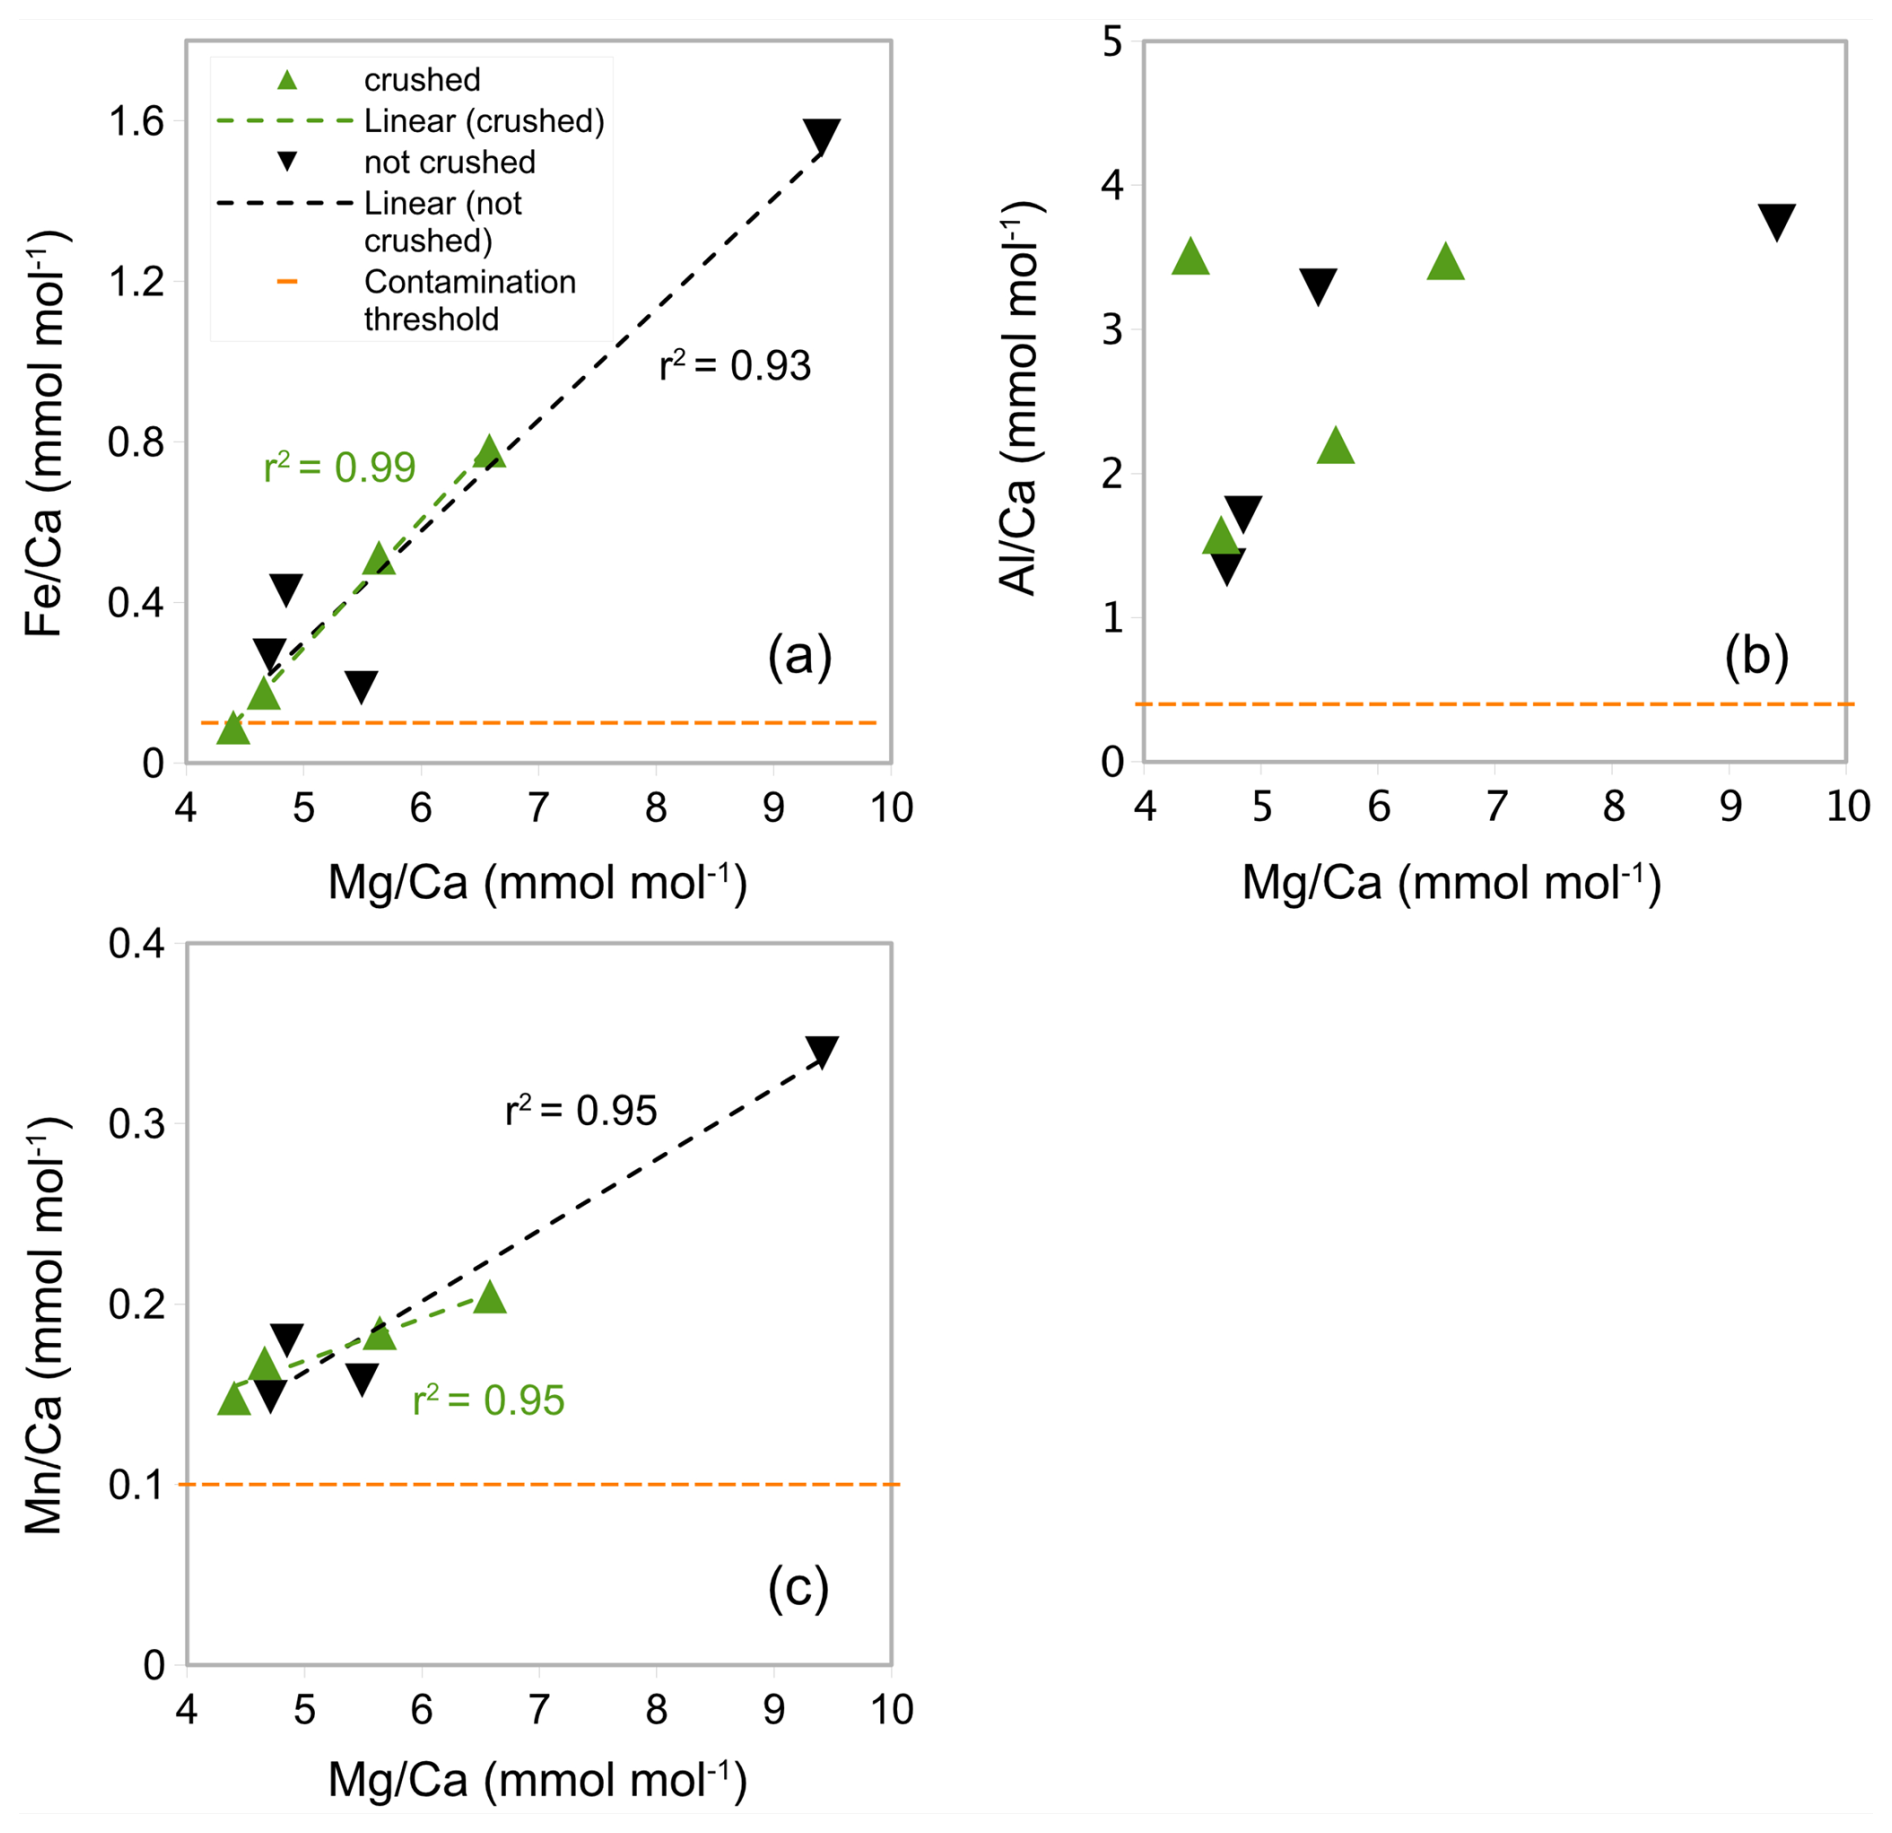
Figure 4 ratios in G. ruber in NIOP929 (Saher et al., 2009) using the procedure of Experiment 2. (a) Correlation between ratios and ratios in crushed and uncrushed samples. See comments in the text regarding the sample with high and ratios. (b) No correlation between ratios and ratios. (c) Correlation between ratios and ratios. Orange horizontal lines: , , and contamination thresholds (0.1, 0.4, and 0.1 mmol mol−1 respectively).
In Experiment 3, Eppendorf tubes were acid-cleaned and methanol rinses increased based on the contamination post-cleaning identified in Experiment 2 (35 s repeated thrice which closely follow Barker et al.'s (2003) total time of 1–2 min repeated twice – see Table 2 for specifications). Specimens of G. ruber (6 sets with a varying amount of 10–50 specimens) picked from core NIOP929, Uvigerina spp. (10 specimens) from core PE303-17a, and Cibicidoides spp. (2 sets of 5 specimens) from cores PE303-17Aa and PE303-13b (Table A1 in Appendix A) were used.
In contrast to Experiment 2, there was no correlation between ratios and (Fig. 5a) and only a weak correlation between ratios and (Fig. 5c). Most samples have Fe concentrations below the limit of detection (< 0.0058 ppm). This suggests no or minimal silicate contamination and Mn-oxide coatings (Barker et al., 2003; Elderfield et al., 2010). The average ratios in samples containing Al concentrations above the limit of detection (6 out of 9) are significantly above the threshold for contamination (> 0.4 mmol mol−1), at 2.27 mmol mol−1 (Fig. 5a, Table A3 in Appendix A), but because there is no correlation with ratios, this could be due to issues with precision of measurements as reported by Elderfield et al. (2010) or due to contamination from contaminants other than silicate. The ratios showed a negative exponential correlation with Ca concentrations (Fig. 5b) where high ratios correlated with low Ca concentration. This could suggest that there is a threshold for a minimum Ca concentration for contaminants to accurately be determined. According to the exponential relationship of ratios and Ca concentrations in Fig. 5b, it is suggested that there is a threshold for total Ca concentration between 15 and 25 ppm. The average ratio was 0.16 mmol mol−1 (Fig. 5c), which is slightly above the contamination threshold > 0.1 mmol mol−1 but below the contamination threshold of 0.2 mmol mol−1 proposed by Hasenfratz et al. (2017). This suggest that Mn-oxide coatings have an insignificant effect on ratios.
Based on the results from Experiment 3, indicating no or minor silicate contamination and Mn-oxide coatings, the cleaning methodology of core-tops followed the methodology used in Experiment 3, i.e. Barker et al. (2003). A summary of the differences in cleaning methodology used in this study is found in Table 2.
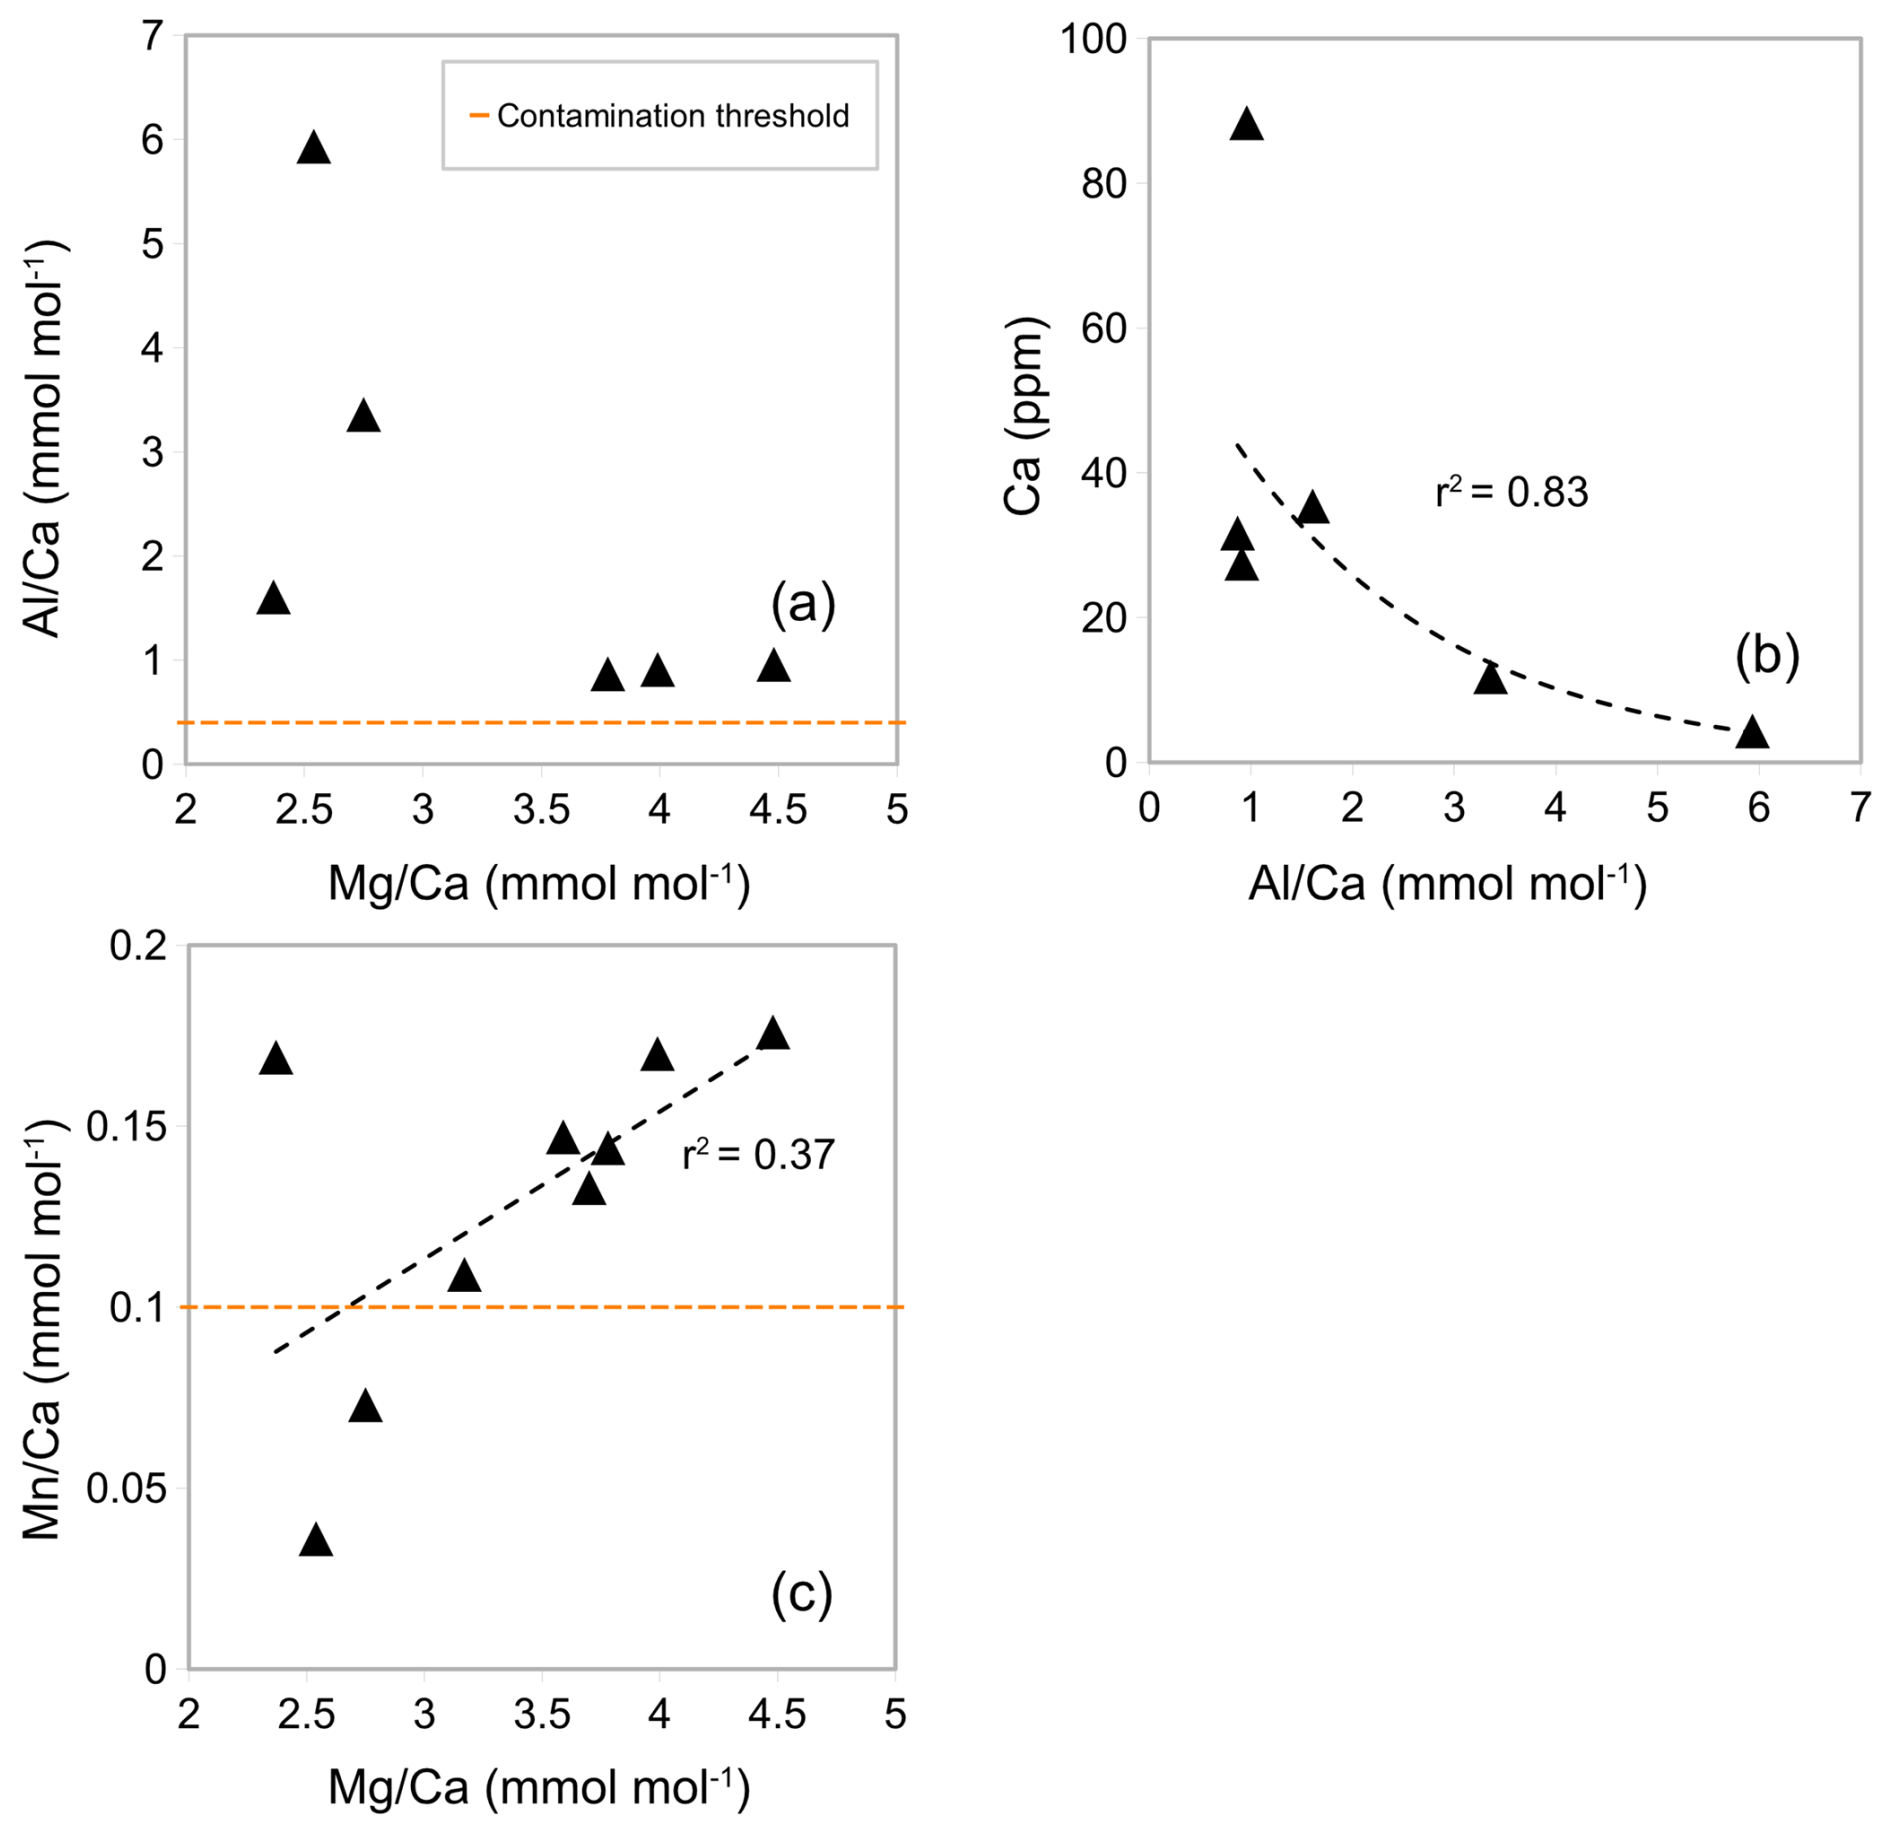
Figure 5Correlation between (a) ratios and ratios, (b) Ca concentration and ratios, and (c) ratios and ratios of samples of G. ruber from core NIOP929 following procedure in Experiment 3. Orange horizontal lines: and contamination thresholds (0.4 and 0.1 mmol mol−1 respectively).
2.3 Mg Ca analysis in ICP-OES
Supernatants (300 µL) of the dissolved samples were transferred to acid-cleaned polypropylene tubes and diluted to 1.8 mL with dilute HNO3. Samples were analysed in an ICP-OES Varian Vista Pro at the Grant Institute at The University of Edinburgh.
Emission intensity was normalized to concentrations using a standard calibration curve based on measurements of high purity standards (Figs. B1 and B2 in Appendix B). Analytical lines (Mg) 285 and (Ca) 315 are used as these are reported to minimize matrix effect (de Villiers et al., 2002). Instrumental precision was ±1 % based on 6 replicate measurements of the ECRM 752-1 carbonate standard. The limit of detection was calculated by 3 multiples of the standard deviation. The calibration curves of the standards have an R2>0.99 (Fig. B2 in Appendix B). To overcome matrix effects associated with Ca analysis, a calibration was produced using standard solutions of increasing ratios (Fig. B2 in Appendix B) as described by De Villiers et al. (2002). In addition, the ECRM was diluted to a concentration of 40 ppm Ca (similar to the concentrations of the samples studied) which also assumes a similar matrix effect. Two procedural blanks and two samples of the ECRM-752-1 carbonate standard with a ratio of 3.762 mmol mol−1 were included in every run. In addition to , , , and were calculated to monitor silicate contamination and Mn-oxide coatings (Barker et al., 2003). For examples of intensity curves see (Fig. B3 in Appendix B).
Following Barker et al. (2003) and Elderfield et al. (2010) contamination thresholds of , , and ratios used were 0.1, 0.4, and 0.1 mmol mol−1, respectively. Linear regression was plotted between ratios and , , and ratios, and the r2 value was used to assess if there was a significant correlation. Procedural blanks were used to correct Mg, Ca, Fe, Al, and Mn concentrations for any introduced contaminants. ratios were calculated using (Ca) 315 and (Mg) 285 concentrations in ppm and ppb, corrected by blanks and converted to mmol mol−1 by
where MMg and MCa refers to the atomic masses of Mg (24.305 g mol−1) and Ca (40.08 g mol−1). This approach was also used for , , and using their respective atomic masses (MFe, MAl, and MMn).
2.4 Mg Ca-BWT calibration
A linear regression was applied to assess the correlation between the ratios measured in C. wuellerstorfi, C. mundulus, U. peregrina, and Cibicidoides spp. and modern bottom water temperatures from the nearest hydrographic temperature profile (see Table 1). The slope of ratios over BWT was compared with previous studies from the Atlantic, Pacific, and Indian Oceans.
3.1 Elemental ratios of Cibicidoides spp. in core-tops
In samples (Table 1) containing C. wuellerstorfi and C. mundulus the Ca concentrations range from 3.99 to 68.73 ppm (see Table 3). ratios range from 1.19 to 6.04±0.03 mmol mol−1 in Cibicidoides spp. (12 samples, Table 3), and 3.16 to 4.18±0.05 mmol mol−1 in G. ruber (6 samples, Table A4 in Appendix A). The ratios range from 0.13 to 0.35 mmol mol−1 in C. wuellerstorfi, from 0.98 to 1.09 mmol mol−1 in C. mundulus and 0.08 to 2.45 mmol mol−1 in Cibicidoides spp. The six samples of G. ruber (analysed in the same run, from core NIOP929) have Fe/Ca ratios between 0.09 and 0.23 mmol mol−1 (Table A4 in Appendix A). The ratios range from 0.28 to 0.57 mmol mol−1 in C. wuellerstorfi, from 0.23 to 2.66 mmol mol−1 in C. mundulus, from 0.21 to 0.35 mmol mol−1 in Cibicidoides spp. (Table 3) and from 0.25 to 0.36 mmol mol−1 in G. ruber (Table A4 in Appendix A). The ratios range from 0.01 to 0.20 mmol mol−1 in Cibicidoides spp. samples (Table 3), and from 0.12 to 0.19 mmol mol−1 in the planktic samples (Table A4 in Appendix A). There is no obvious correlation between the , , and with ratios for any of the Cibicidoides species, except for C. mundulus (Fig. 6a–c). In this figure, although mostly driven by one possible outlier, a correlation of with might be indicated. Regarding contamination thresholds of 0.1, 0.4, and 0.1 mmol mol−1 for the , , and ratios, respectively, all Cibicidoides spp. samples are below the threshold for and ratios. In relation to the ratio, one sample was below, one sample just above, and three samples well above the contamination threshold (Table 3).
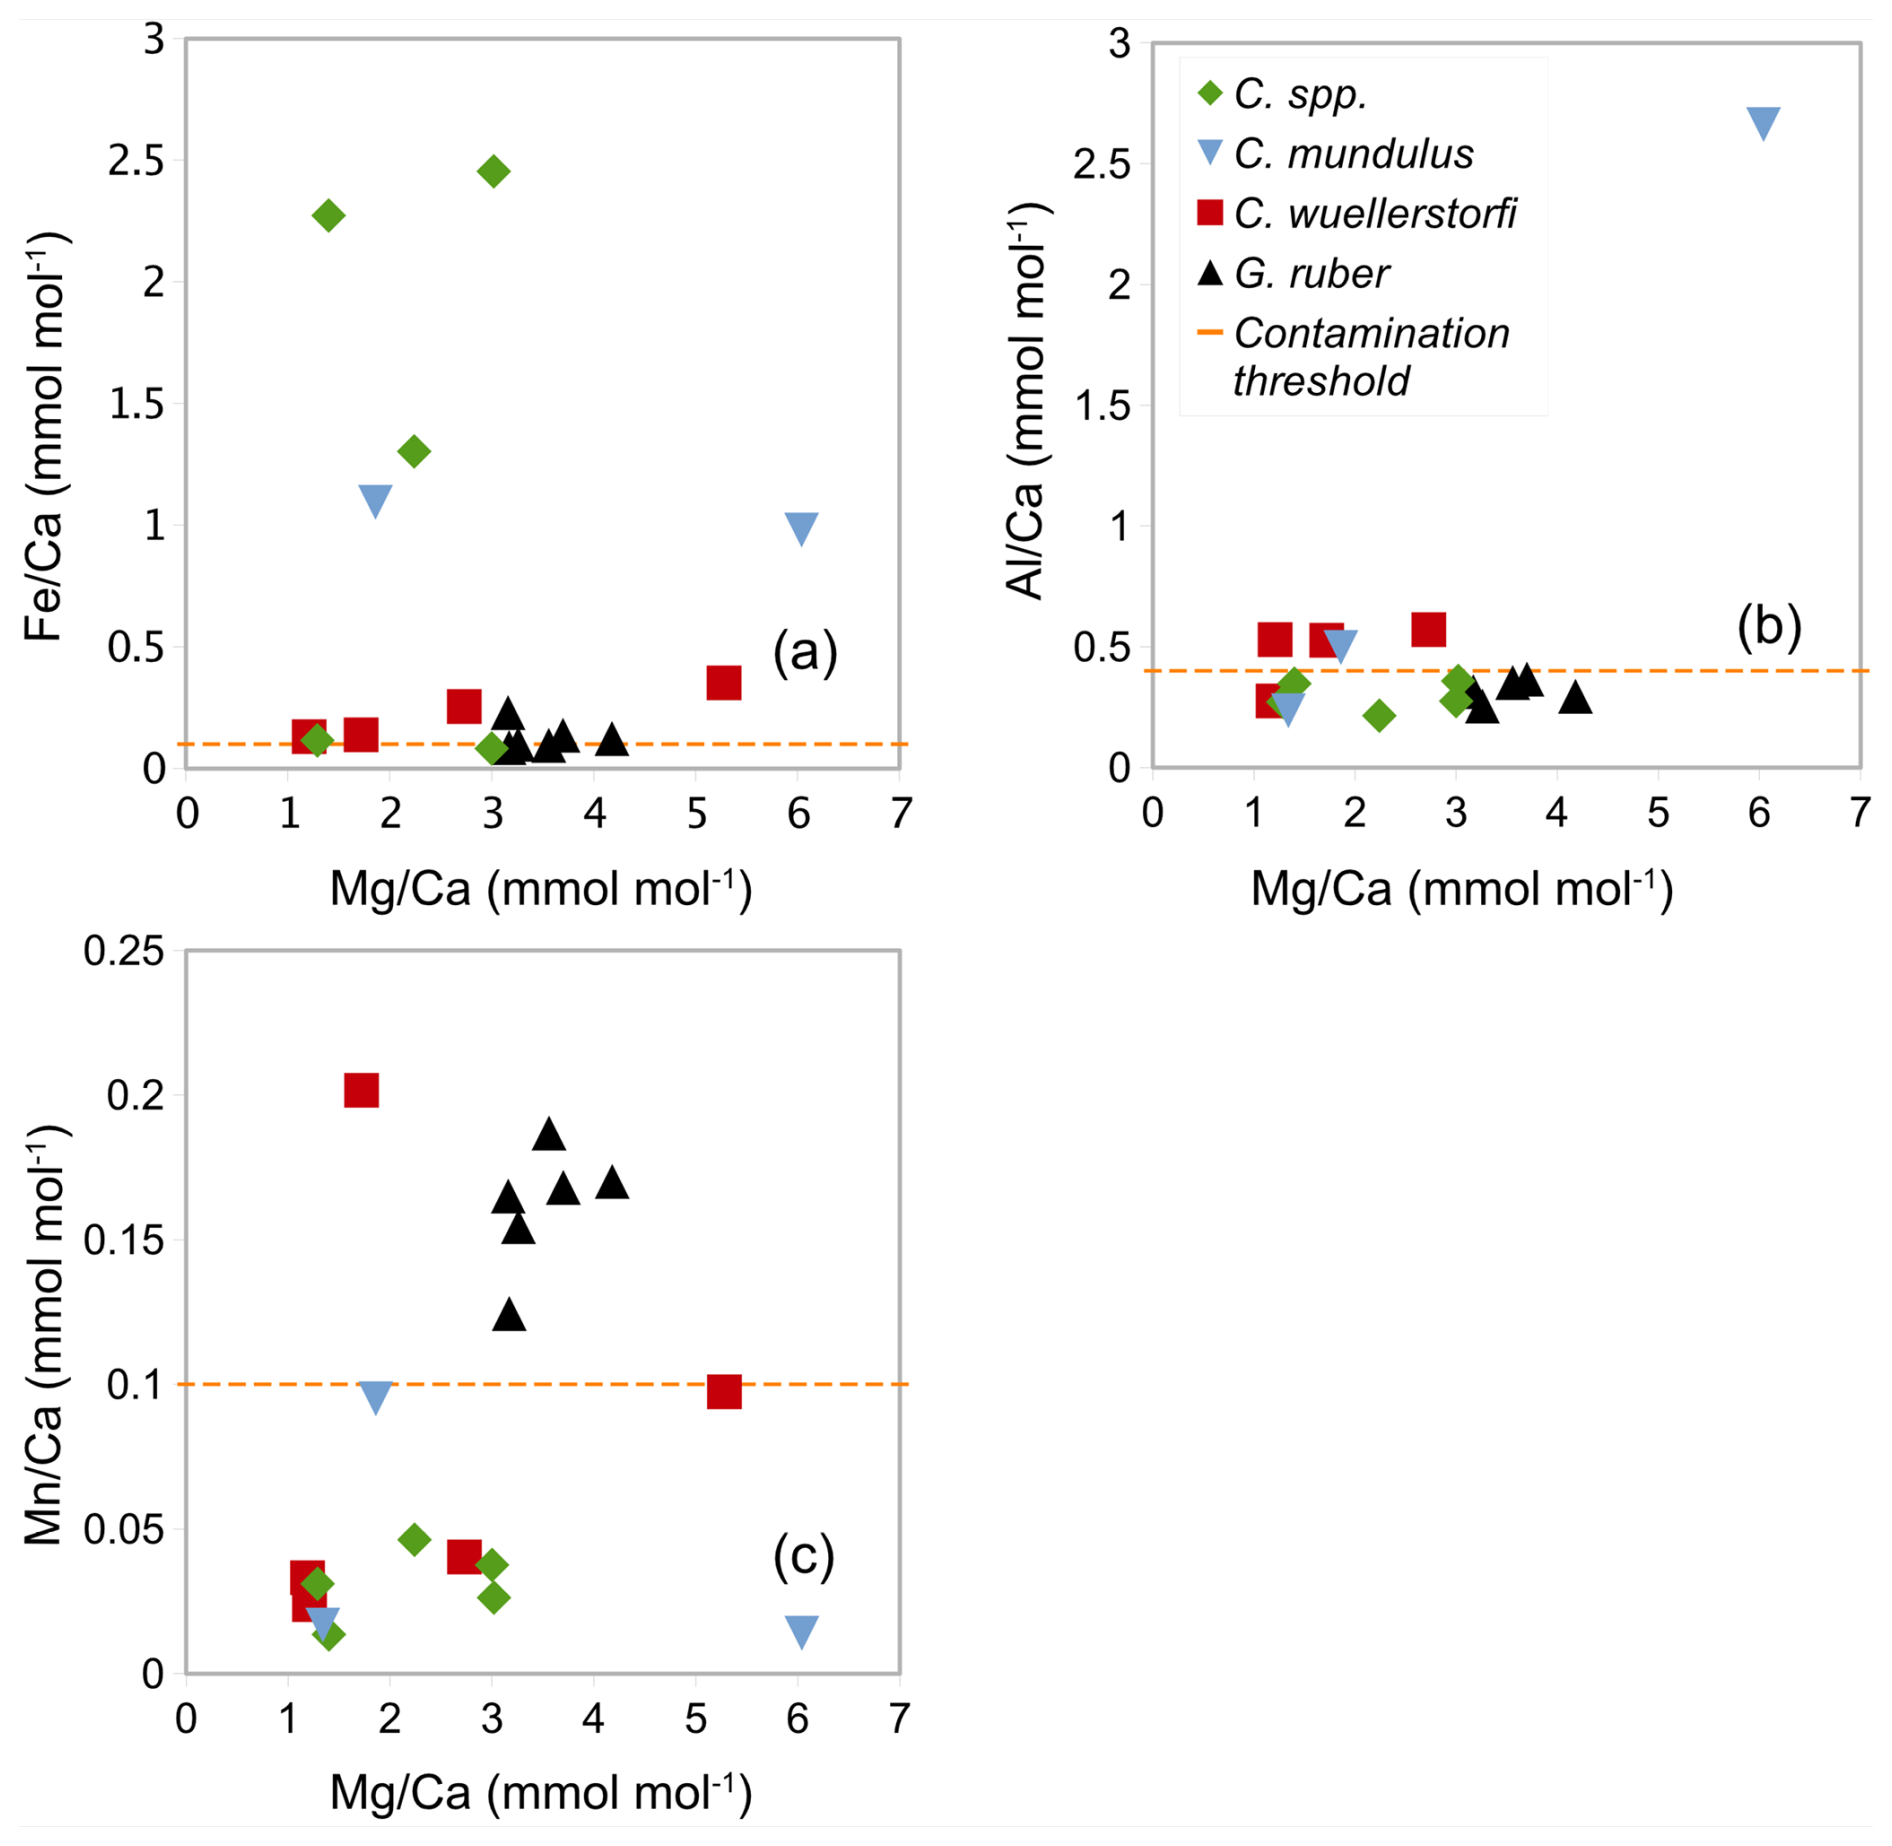
Figure 6Correlation between ratios and (a) ratios, (b) ratios, and (c) ratios in Cibicidoides spp. including C. wuellerstorfi and C. mundulus and G. ruber (control group). The orange horizontal lines show the respective contamination thresholds at 0.1, 0.4, and 0.1 mmol mol−1 for , , and following Barker et al. (2003).
Table 3 ratios, contamination indicators (, , and ratios) and Ca measured in C. wuellerstorfi, Cibicidoides spp., C. mundulus, and U. peregrina from Tanzania core-top samples.
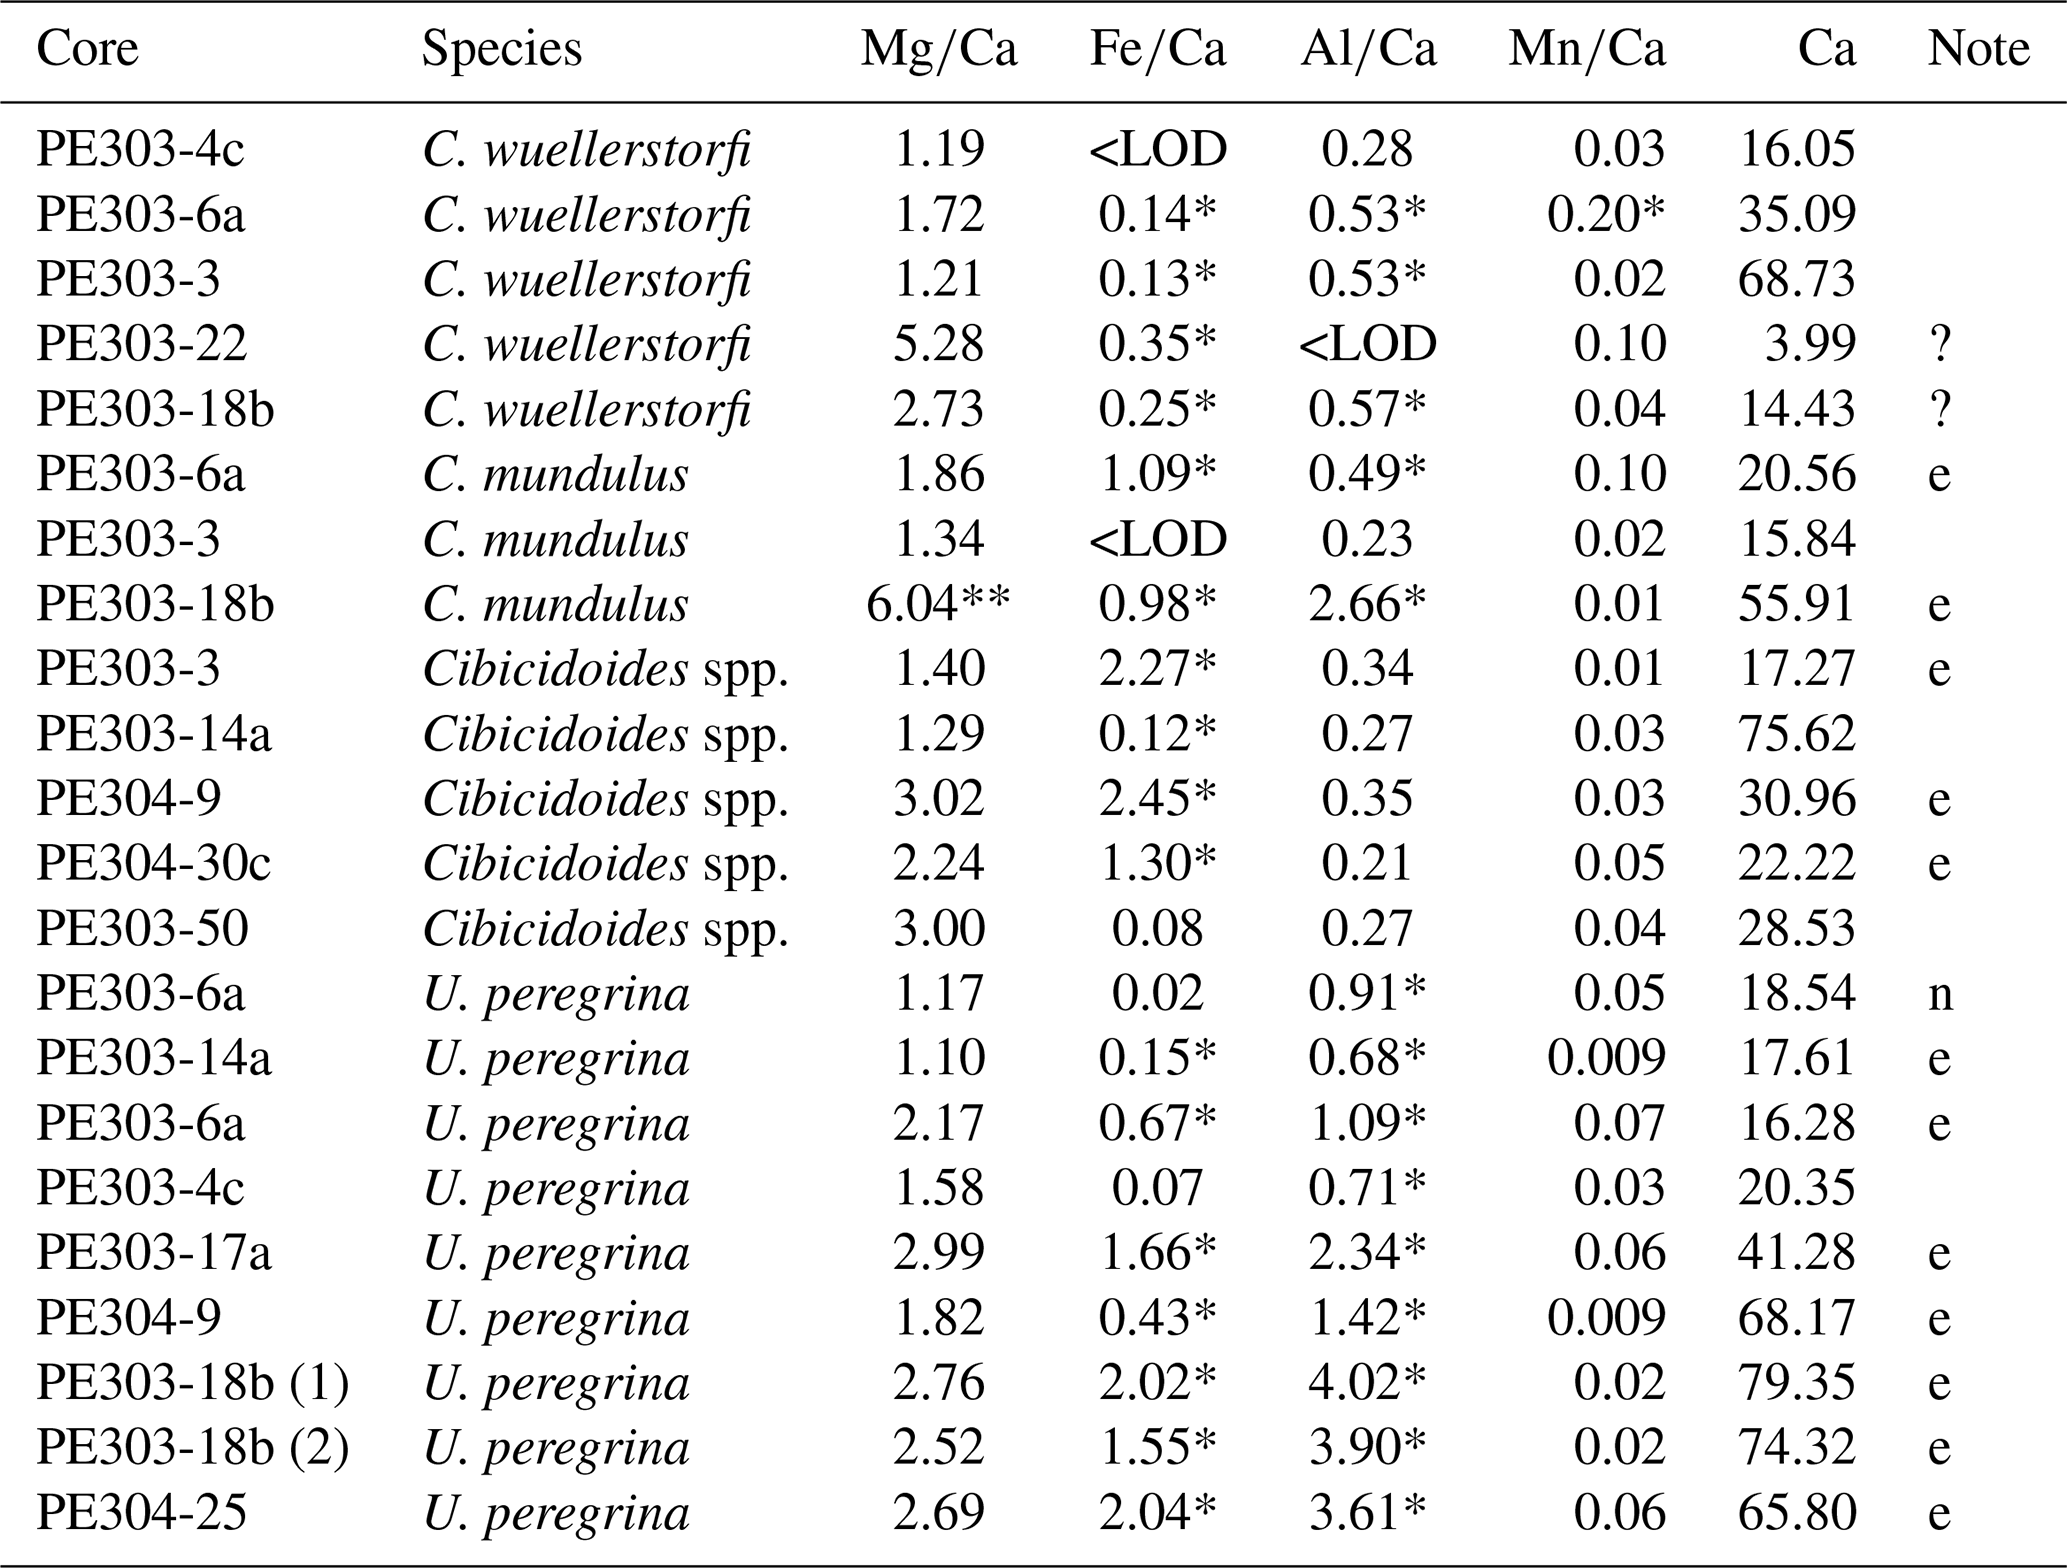
* Above contamination threshold 0.1, 0.4, and 0.1 mmol mol−1 for , , and (Elderfield et al., 2010). ** clear outlier based on typical range reported in previous studies. e = excluded due to high contamination, ? = ambiguous assessment of contamination. <LOD = below limit of detection. n = not excluded based on Elderfield et al. (2006) suggesting not to exclude samples based on above 0.4 mmol mol−1 alone, both and < 0.1 mmol mol−1.
3.2 Elemental ratios of Uvigerina peregrina in core-tops
In the core-top samples (Table 1) the Ca concentration in U. peregrina range from 16.28 to 79.35 ppm (Table 3). The ratios vary between 1.10 and 2.99 mmol mol−1 ±0.02 mmol mol−1 in U. peregrina (9 samples) and between 4.77 and 5.22±0.05 mmol mol−1 in G. ruber (3 samples analysed in the same run from core NIOP929; Fig. 7 and Table A4 in Appendix A). The ratios range from 0.02 to 2.04 mmol mol−1 in U. peregrina and from 0.24 to 0.38 mmol mol−1 in G. ruber. The ratios are between 0.68 and 4.02 mmol mol−1 in U. peregrina and range from 0.92 to 1.31 mmol mol−1 in G. ruber. The ratios vary between 0.01 and 0.07 mmol mol−1 in U. peregrina and 0.11 and 0.14 mol mol−1 in G. ruber. There is a strong positive correlation (r2=0.87) between the ratios and the ratios (Fig. 7a) and a positive correlation (r2=0.66) between the ratios and the ratios (Fig. 7b). There is no correlation between the ratios and the ratios (Fig. 7c). Regarding contamination, all U. peregrina samples are below the threshold for ratios. All samples are above the threshold for ratios, some rather narrowly so. Two samples were below the threshold for , one narrowly above and the remaining 6 samples partially well above the limit (Table 3).
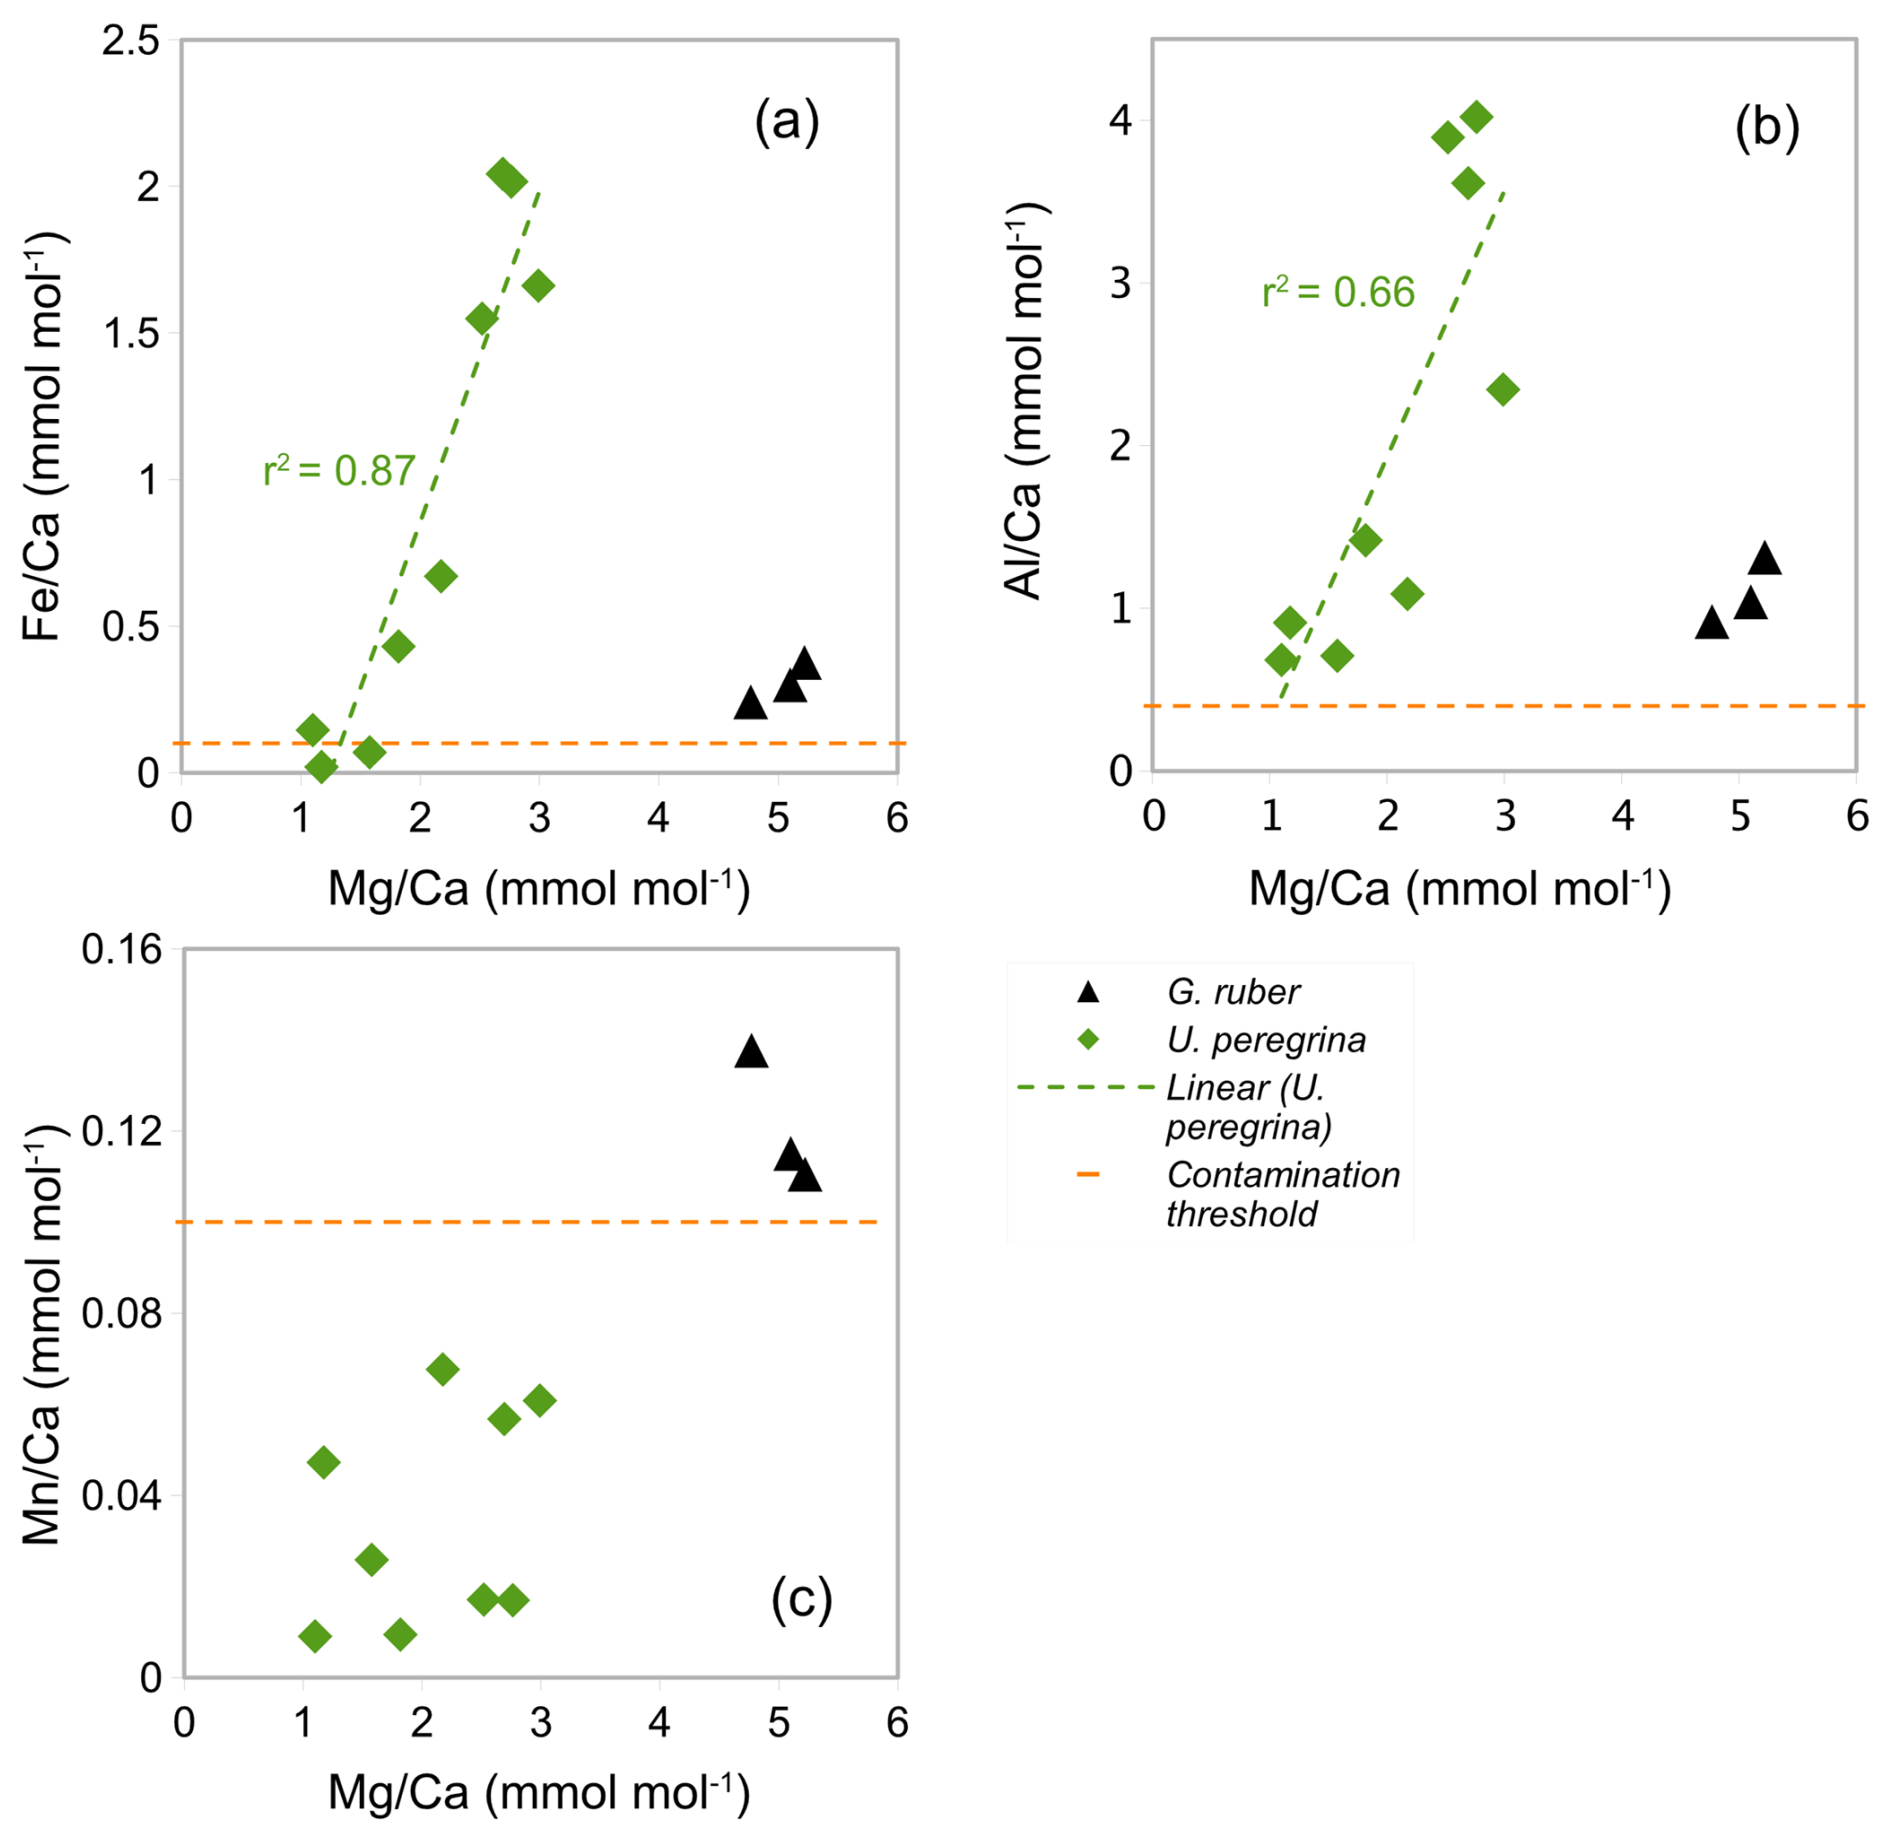
Figure 7The correlation between the ratios and (a) ratios, (b) ratios, and (c) ratios in blue: U. peregrina and black: G. ruber (control group). Horizontal lines show , , and contamination thresholds (0.1, 0.4, and 0.1 mmol mol−1). Values below the limit of detection are not plotted. Trend line in (a) and (b) with r2 show linear correlation of U. peregrina.
3.3 Correlation between contamination and core-top depth
Figure 8a–b shows and ratios from U. peregrina and Cibicidoides spp. versus the retrieval depth of the samples. There is no correlation between or the ratios and depth for Cibicidoides spp. while U. peregrina displays such correlations with r2 values of 0.58 and 0.65, respectively. In water depth > 2500 m, U. peregrina (four samples) shows significantly smaller average and ratios (0.23 and 0.85 mmol mol−1) compared to samples from < 1500 m (five samples) (1.54 and 3.06 mmol mol−1).
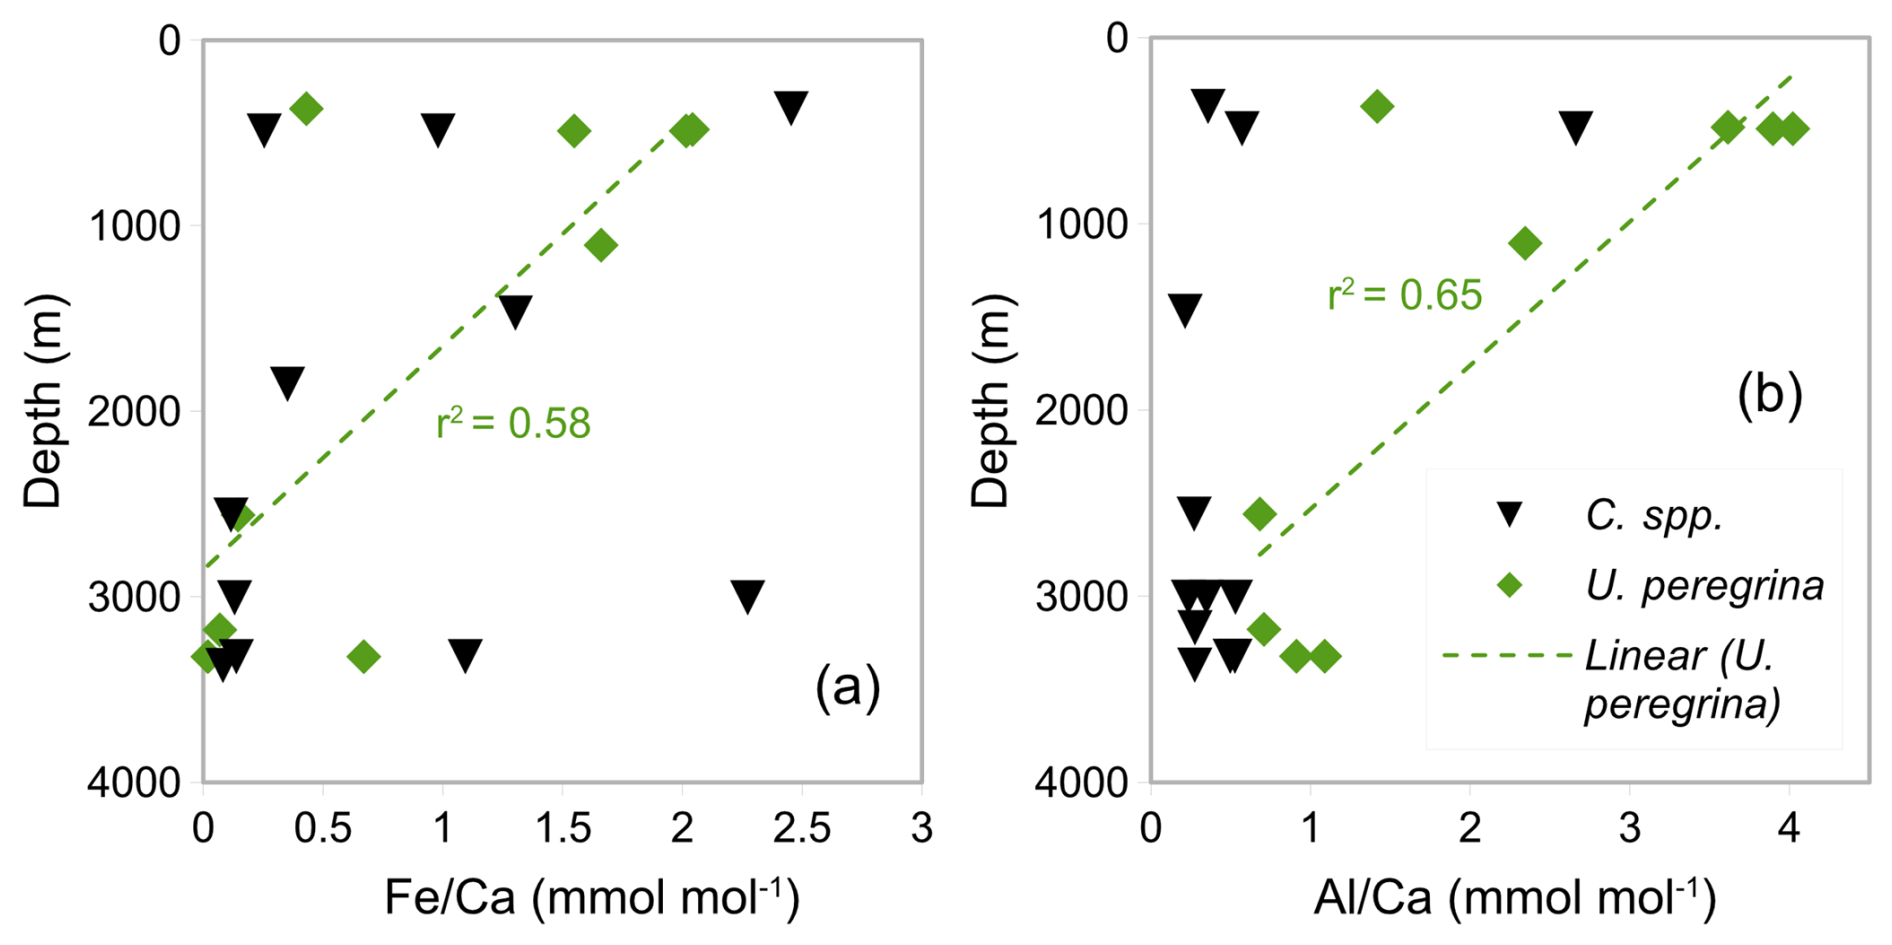
Figure 8Correlation between water depth of sediment surface samples and contamination (a and b ) in Uvigerina peregrina and Cibicidoides spp.
3.4 Mg Ca-BWT calibration
Principally we used the thresholds of 0.1, 0.4, and 0.1 mmol mol−1 of , , and ratios following Elderfield et al. (2010) and Barker et al. (2003) as well as correlations between , , and ratios with ratios following Barker et al. (2003) to assess silicate and/or Mn-oxide contamination. All but two samples of U. peregrina (Table 3) were excluded due to high ratios (> 0.1 mmol mol−1) and a strong correlation with (Fig. 7a). Some of the ratios of Cibicidoides spp. were included even though ratios were > 0.1 mmol mol−1 since they show no correlation between ratios and ratios (Table 3, Fig. 6). The ratios not included in core-top calibration are in Table 3 (annotated “e”).
The ratios of Cibicidoides spp., C. mundulus, and C. wuellerstorfi (Table 3) were plotted versus BWT (temperature profiles from positions close to our core-top transect from Birch et al., 2013; Fig. 9). For Cibicidoides spp., U. peregrina, and C. mundulus discerning robust relationships between the relationships and BWT is not straightforward. Based on the no-correlation argument above, and ignoring contamination thresholds, tentative relationships are indicated for Cibicidoides spp. and C. mundulus. These are, however, partially based on samples with signs of contamination being reflected in the and/or the ratios. Removing those samples entails an insufficient amount of data remaining to establish a relationship (Fig. 9). For C. wuellerstorfi there is little indication of strong contamination. Only some ratios are slightly above the contamination threshold. Establishing a straightforward relationship of with BWT is hampered by one sample with unusually high values. We regard this sample as an outlier for an unknown reason. Figure 9 shows the resulting relationship for C. wuellerstorfi (n=4, see formula below) alongside the remaining samples for the other species. In Fig. 9 the linear correlation for C. wuellerstorfi is:
The standard error of the regression is 1.55 °C, which is broadly in line with published data (Lear et al., 2002; Sadekov et al., 2008).
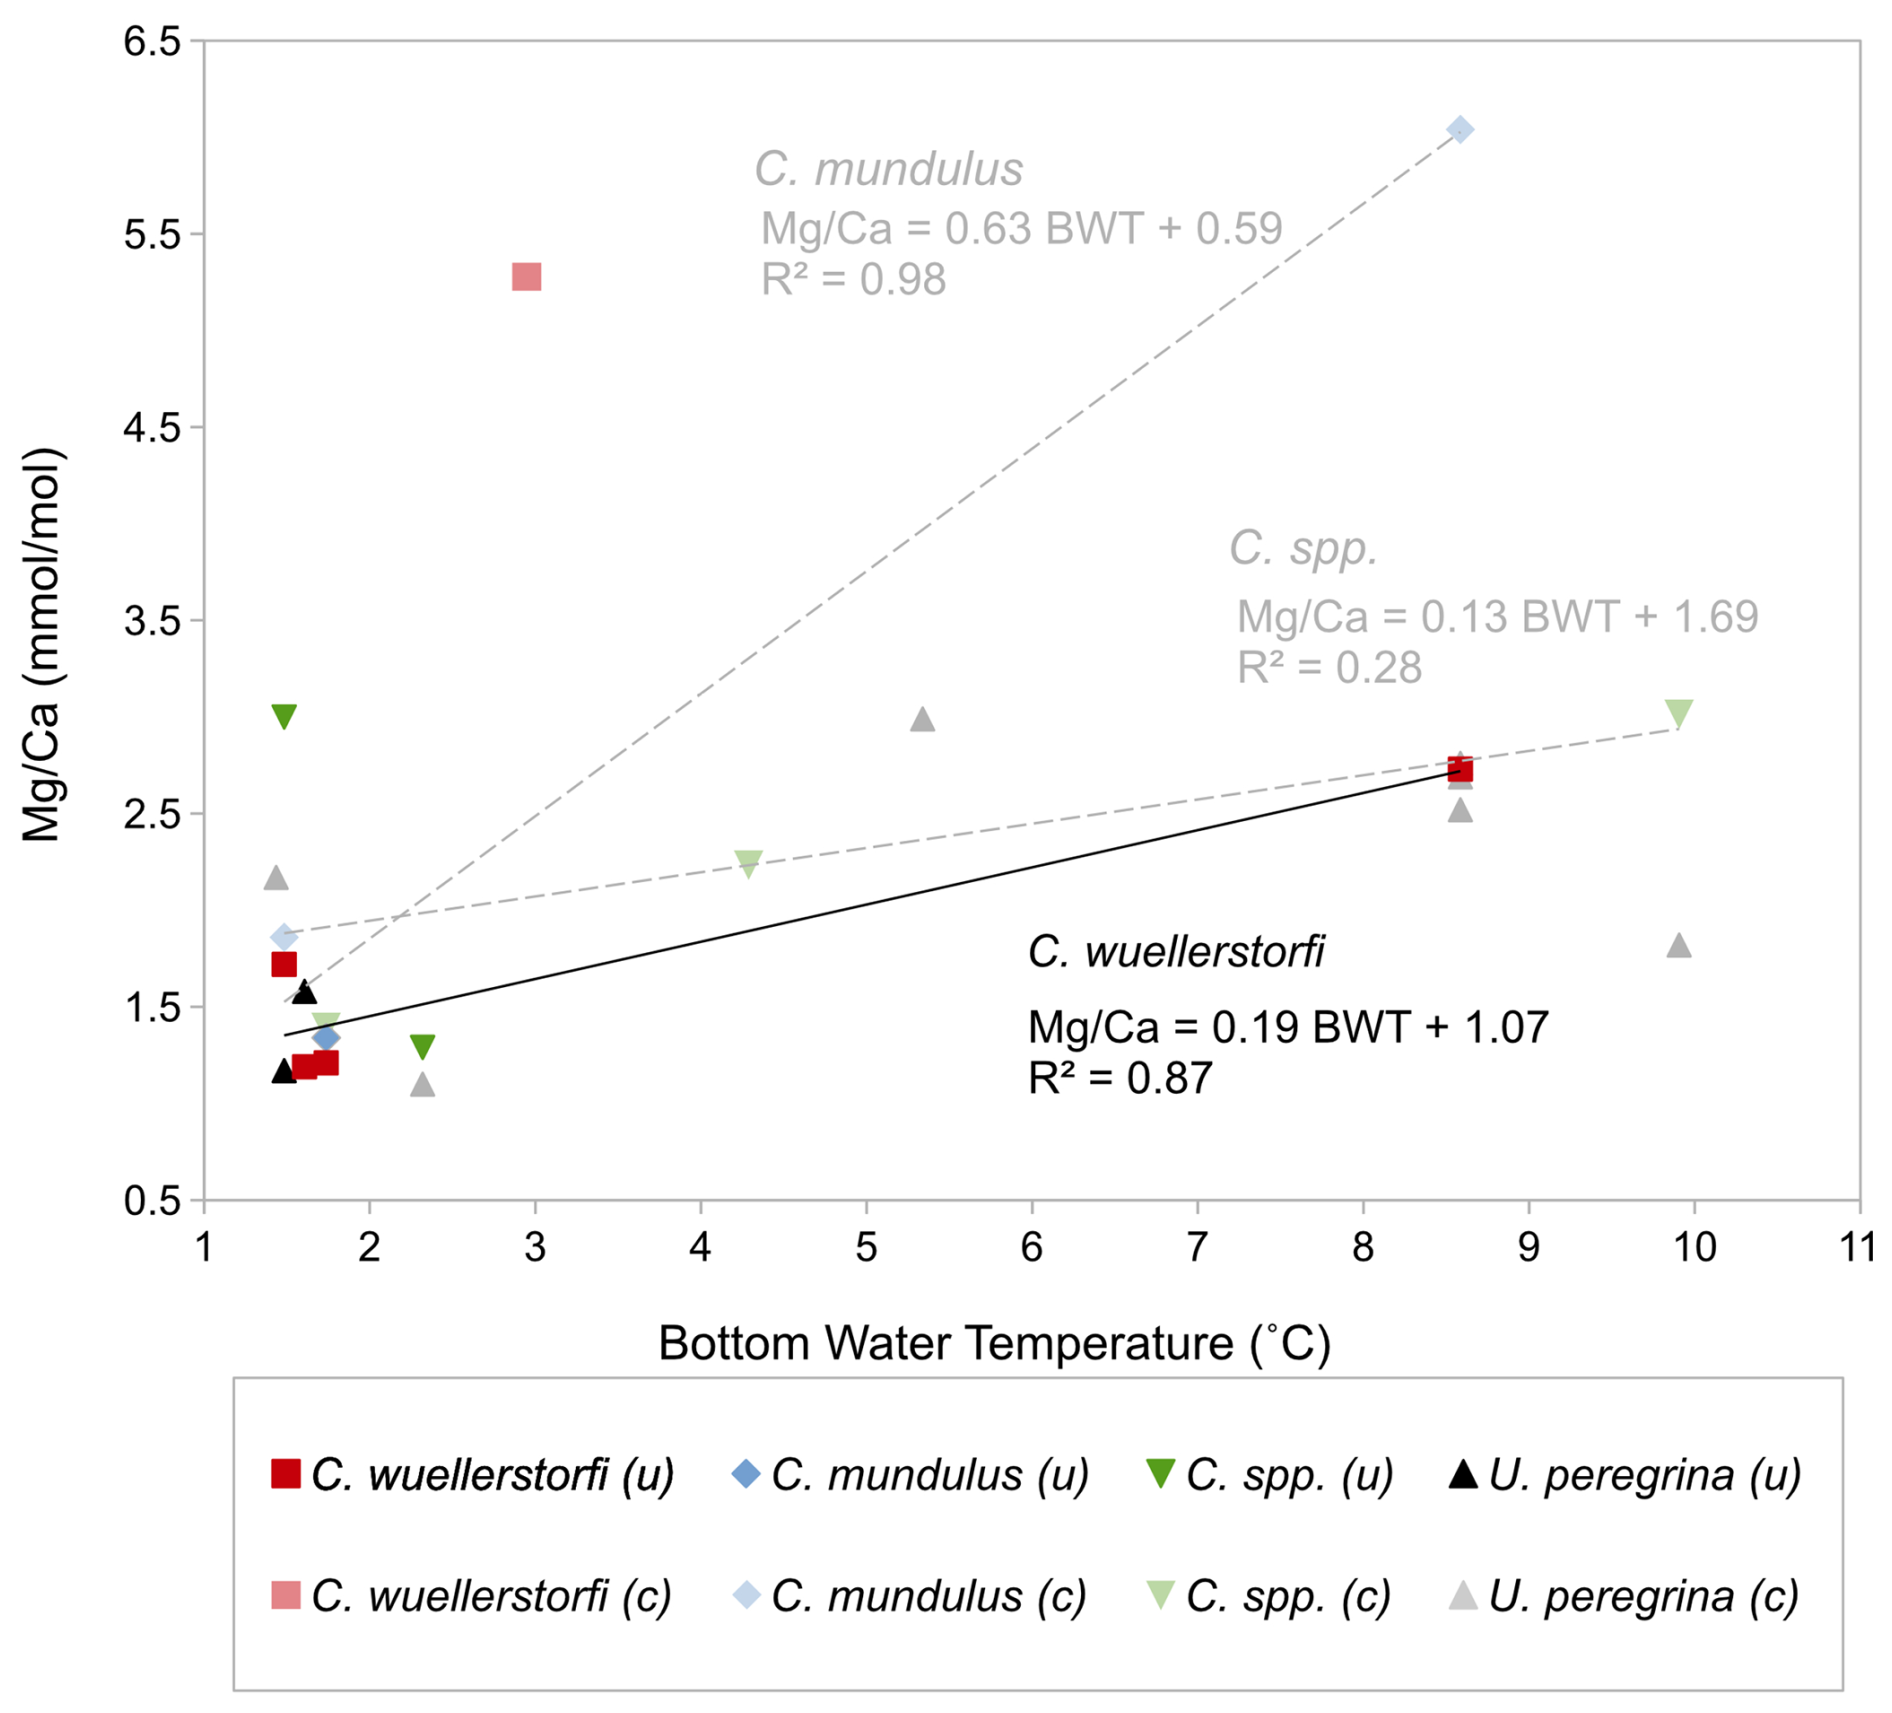
Figure 9 ratios of Cibicidoides spp., C. wuellerstorfi, C. mundulus, and U. peregrina over bottom water temperature (BWT). Pale colours: measurements with suspected significant contamination (c). Solid colours: uncontaminated/minor contamination based on contamination thresholds (0.1 mmol mol−1 , 0.4 mmol mol−1 , and 0.1 mmol mol−1 ) and correlations with (uncontaminated samples indicated by “(u)”). There are several data points where presence of contamination is ambiguous – see discussion. Black trend line represents -BWT linear correlation in C. wuellerstorfi (four samples with minor contamination); grey trend lines represent tentative -BWT linear correlations in C. mundulus and Cibicidoides spp. (contaminated and uncontaminated samples included).
4.1 Mg Ca ratios in Cibicidoides: data quality and core-top calibrations
All samples of Cibicidoides except for one have ratios below the threshold for contamination (< 0.1 mmol mol−1) and no correlation with ratios, suggesting no or insignificant Mn-oxide coatings (Hasenfratz et al., 2017). Based on silicate contamination indicated by and ratios being significantly above the contamination threshold, six samples were excluded (three Cibicidoides spp., two C. mundulus and one C. wuellerstorfi samples) (Table 3). When plotted at the genus level, Cibicidoides show no correlation between or ratios and ratios (Fig. 6a–b) supporting the notion of no silicate contamination, amid this strategy being in line with previous approaches (e.g. Elderfield et al., 2006; Healey et al., 2008). When plotted at a species level, however, there is a strong correlation (r2=0.94) between and ratios for C. wuellerstorfi data (Fig. A1 in Appendix A) which suggests silicate contamination. The indicated contamination levels are small in most cases with ratios below 0.25 mmol mol−1. It is difficult to assess how much this small contamination has affected the data. If the increase in ratios from silicate contamination is within the uncertainty of ratio determinations (∼ 0.03 mmol mol−1) this can be neglected. We therefore used the ratios of four C. wuellerstorfi samples with below 0.25 mmol mol−1 to establish a BWT relationship (Table 3, Fig. 9).
There are two anomalously high ratios measured in C. mundulus (6.04 mmol mol−1) and C. wuellerstorfi (5.28 mmol mol−1; Table 3) compared to ratios in some studies (Elderfield et al., 2006; Rosenthal 1997) but within range of ratios in other reports (Lear 2002; Rosenthal 1997). The C. mundulus sample with a ratio of 6.04 mmol mol−1 shows a broadly similar ratio but a significantly higher ratio (2.66 mmol mol−1) than other measurements from the genus Cibicidoides ( ratios ranging from 0.21 to 0.57 mmol mol−1; Table 3). It is uncertain whether the high ratio is a result from silicate contamination or is due to another Mg bearing contaminant also high in Al. The ratio in this sample is low (0.01 mmol mol−1) indicating no presence of Mn-oxide coatings.
The C. wuellerstorfi sample with a ratio of 5.28 mmol mol−1 does not have significantly higher , , or ratios compared to samples of Cibicidoides spp. suggesting limited contamination. The low Ca concentration (3.99 ppm) could suggest the high ratios are due to calcite dissolution from chemical cleaning. However, low Ca concentrations could also be due to sample loss in crushing or sample loss during transfer in chemical cleaning. Whilst efforts have been made to minimize sample loss from crushing (using individual crushing), sample loss during transfer in chemical cleaning (using MilliQ to rinse brush) and when rinsing samples during MilliQ and methanol rinses (not agitating samples when using vacuum), it is not possible to eliminate sample loss entirely. This is one of the major limitations with the methodology and should be considered a significant source of uncertainty. This sample was excluded from the ratio-BWT calibration model.
The ratio-BWT relationship of C. wuellerstorfi , indicates increasing ratios with increasing temperature and is broadly consistent with previous studies (Fig. 10, Healey et al., 2008; Lear et al., 2002) although there is only one data point reflecting the high temperature end of our calibration range of 3–8 °C. The temperature sensitivity of C. wuellerstorfi in this study (19 % increase per 1 °C) is lower than Elderfield et al. (2006, 46 %, and 52 % increase per 1 °C) and Healey et al. (2008, 30 % increase per 1 °C). Also, two ratios (ignoring a probable outlier with a high ratio) at lower temperatures (< 2 °C) are within the data range of both the southeast Indian Ocean calibration of C. wuellerstorfi by Healey et al. (2008) and the Southwest Indian Ocean calibration of C. wuellerstorfi by Elderfield et al. (2006), but are higher than the ratios of C. wuellerstorfi from the Somali basin (Elderfield et al., 2006; Fig. 10). These high values do, however, fall within the range of values found in C. wuellerstorfi from the Atlantic Ocean. There is a discussion surrounding relatively unmixed NADW crossing the Davie Ridge into the Somali basin (van Aken et al., 2004). Our core-top sample set is in the flow path of NADW, supporting the notion our high ratios reflecting NADW-specific water properties. Firm conclusions are hampered by the limited sample size in our C. wuellerstorfi data set. If correct, however, changing water masses in a given location may add additional uncertainties to BWT reconstructions.
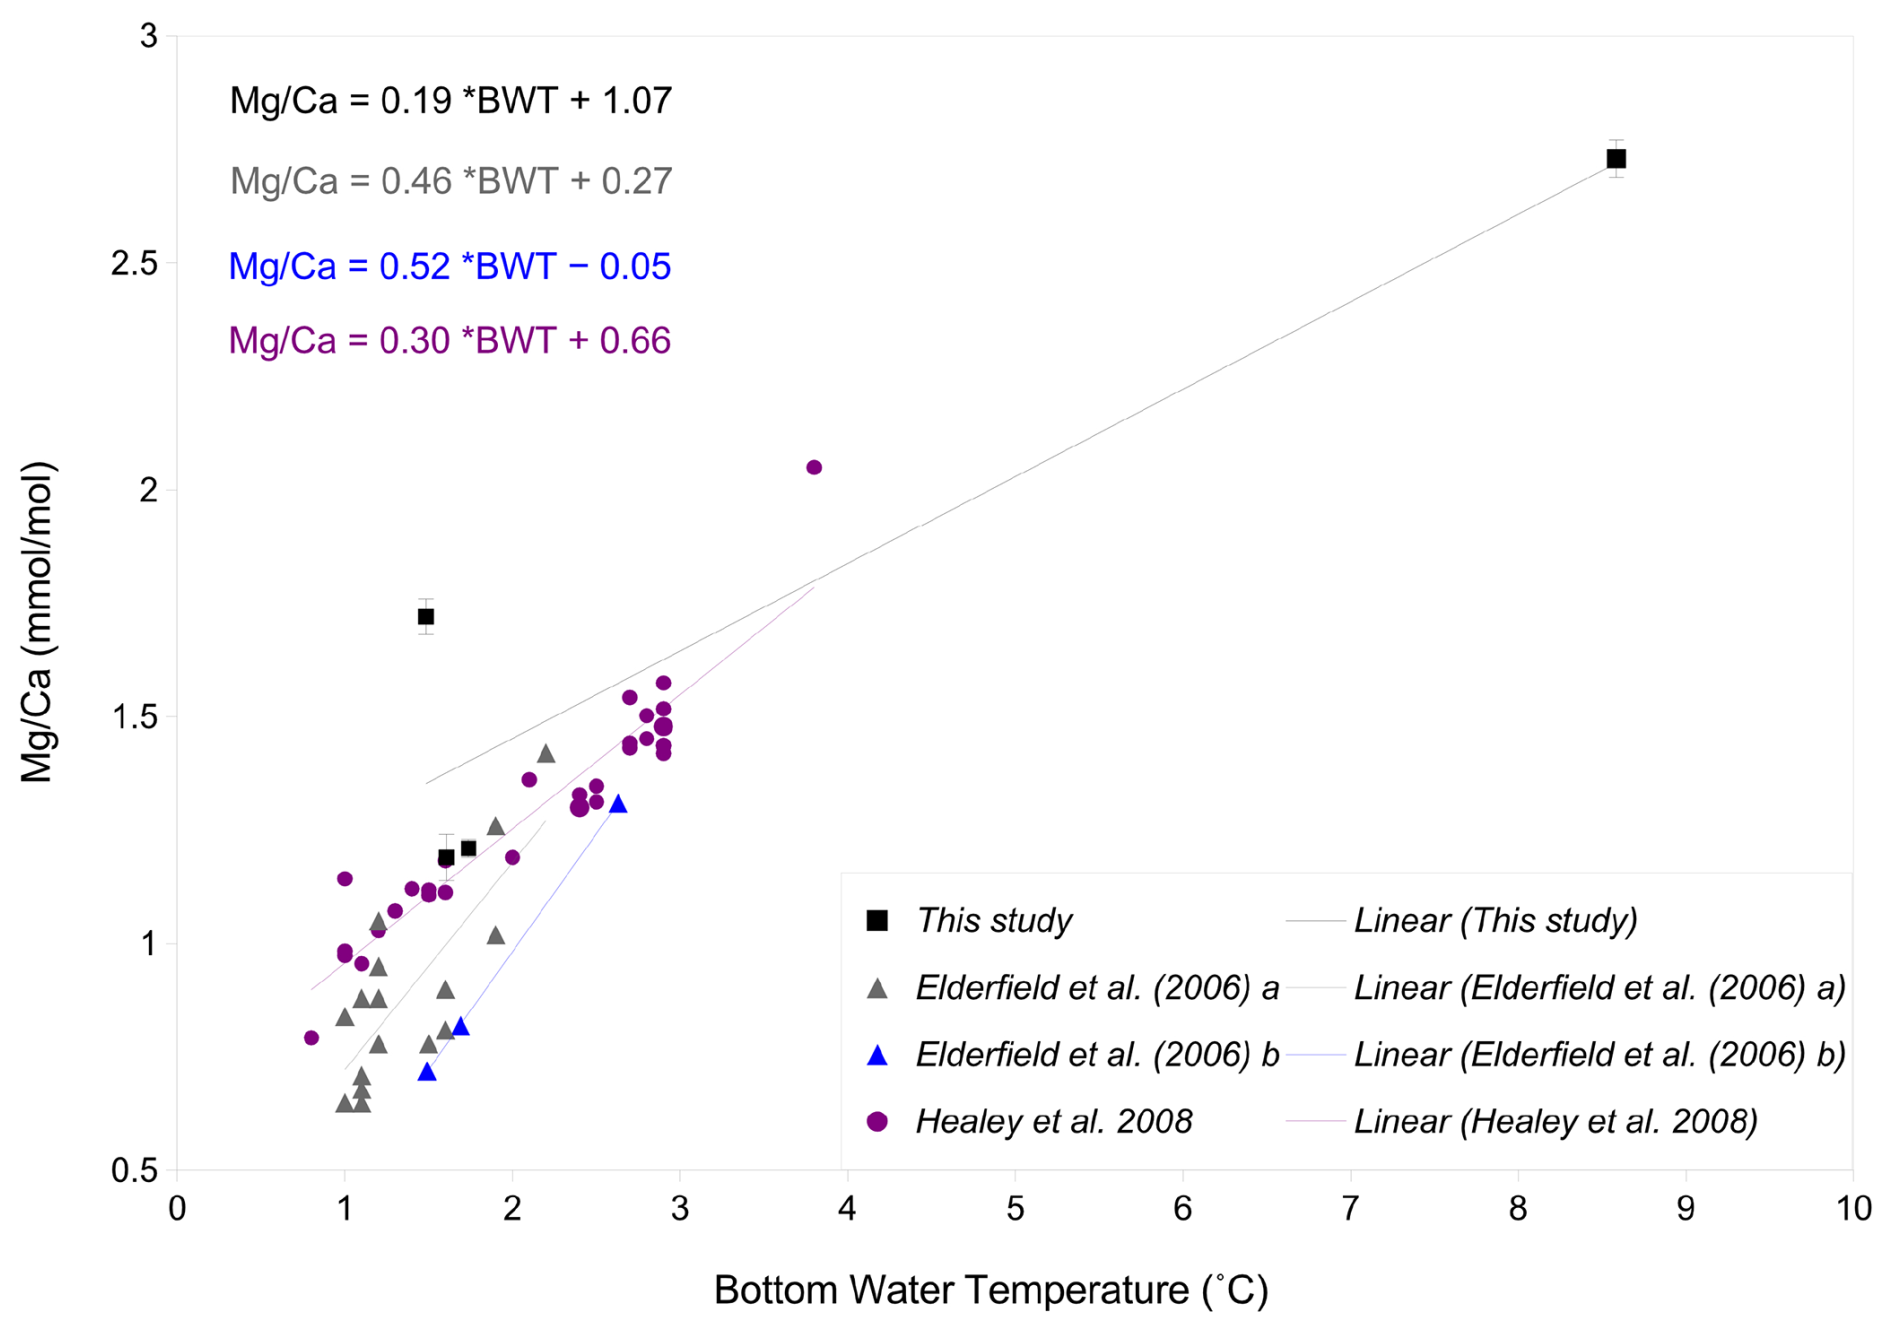
Figure 10-BWT calibrations of C. wuellerstorfi from various studies; in black: this study with error bars showing standard deviation, purple: S.E. Indian Ocean from Healey et al. (2008), grey: S.W. Indian Ocean from Elderfield et al. (2006), and blue: Somali basin from Elderfield et al. (2006).
Previous studies have used both linear and exponential regressions to describe the temperature dependence of ratios (e.g. Healey et al., 2008; Lear et al., 2002, Martin and Lea, 2002; Elderfield et al., 2006) with some studies suggesting the latter being preferable at low temperatures and over narrow temperature ranges (Healey et al., 2008; Stirpe et al., 2021). The small sample size in our study hampers assessment of the better regression strategy. The generally good fit with the linear regression in Healey et al. (2008) and the data ranges in Lear et al. (2002), support the notion of our Indian calibration being broadly correct.
Two out of three and ratios for C. mundulus are significantly above contamination thresholds (Table 3). In the absence of a correlation with ratios (Fig. 6a–b) all three ratios were tentatively plotted and compared to existing C. mundulus core-top calibrations (Fig. 11). The estimated ratios in the temperature range of 1–2 °C are within the range of Healey et al. (2008). One of the data points seems sufficiently cleaned whilst the second does not, based on low and high and ratios, respectively. Because both values lie within the range of data provided by Healey et al. (2008) this suggests high estimates of and ratios being a result of a non-Mg bearing contaminant (not silicate), supported by absent correlations between or with (Fig. 6a–b). Alternatively, this could suggest increased ratios that may be interpreted as silicate contamination but are within the natural variation of ratios in C. mundulus.
The linear relationship of the three ratios of C. mundulus in Fig. 11 closely resembles the linear relationship derived from data by Healey et al. (2008) from core-top estimates from the Atlantic, Pacific, and Indian Oceans combined although the reliability in our study is limited by only three data points and only one value at high temperatures. Our and Healey et al.'s (2008) calibrations differ from the SW Indian Ocean calibration from Elderfield et al. (2006) with the reasons for this discrepancy being unclear.
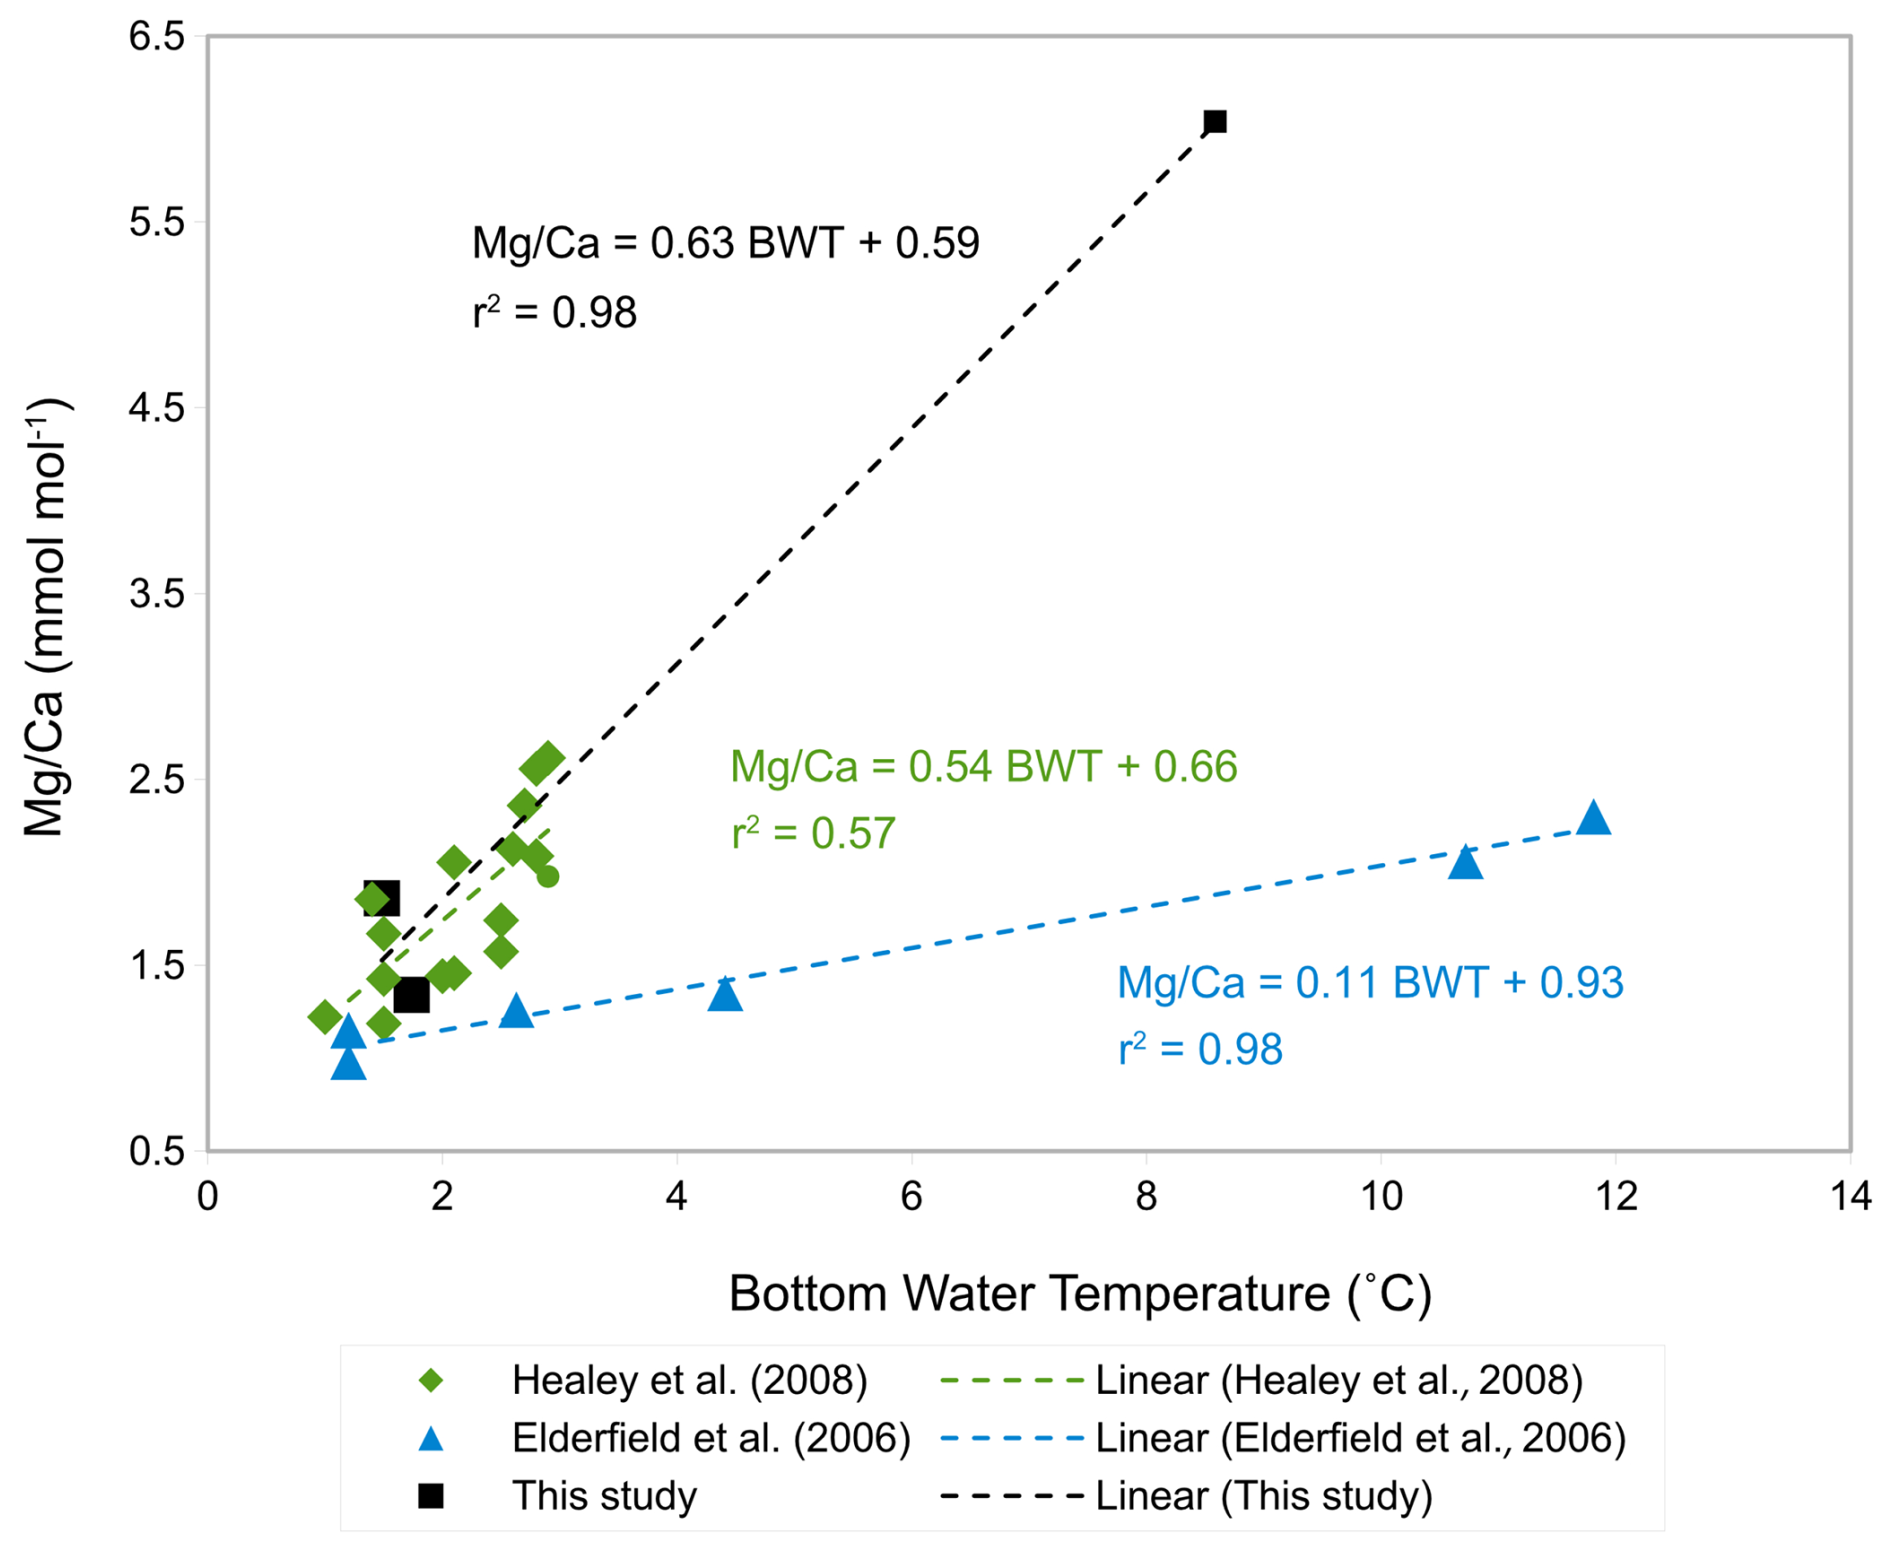
Figure 11Tentative -BWT calibration of C. mundulus in this study (black squares) compared to core-top calibrations by Healey et al. (2008) (green rhombs) and Elderfield et al. (2006) (light blue triangles).
4.2 Mg Ca ratios in Uvigerina peregrina
Our results for U. peregrina show that ratios in nine samples of U. peregrina range from 1.10 to 2.99±0.02 mmol mol−1 (Table 3) covering a depth range of 370–3323 m (Table 1). These ratios are higher than values reported by Stirpe et al. (2021) ranging from 0.68 to 1.50 mmol mol−1 covering a depth range of 663 to 4375 m. In our data set, 7 out of 9 samples have ratios above the contamination threshold (> 0.1 mmol mol−1) and correlate positively with ratios (r2=87, Fig. 7a) suggesting silicate contamination. ratios in all samples are above the contamination threshold (> 0.4 mmol mol−1) and correlate with ratios (r2=0.66, Fig. 7b). These findings suggest silicate contamination is being reflected in our high ratios. ratios in all samples are below the contamination threshold (<0.1 mmol mol−1) which supports the notion of Mn-oxide coatings being absent (Fig. 7c).
To investigate if the high ratios are indeed a result of silicate contamination these were plotted versus bottom water temperatures and compared to previous studies (Fig. 12). Only two samples of U. peregrina are below the contamination threshold of ratios (< 0.1 mmol mol−1, Elderfield et al., 2010). These map onto the relationship of U. peregrina by Elderfield et al. (2006). Most of the samples that were suggested to be silicate contaminated show, as expected, significantly higher ratios than previous estimates (Fig. 12), up to 1.5 mmol mol−1 higher than in the relationship of Elderfield et al. (2006). This supports the notion that and ratios well above the contamination threshold indeed identify samples with contamination that bias the ratios.
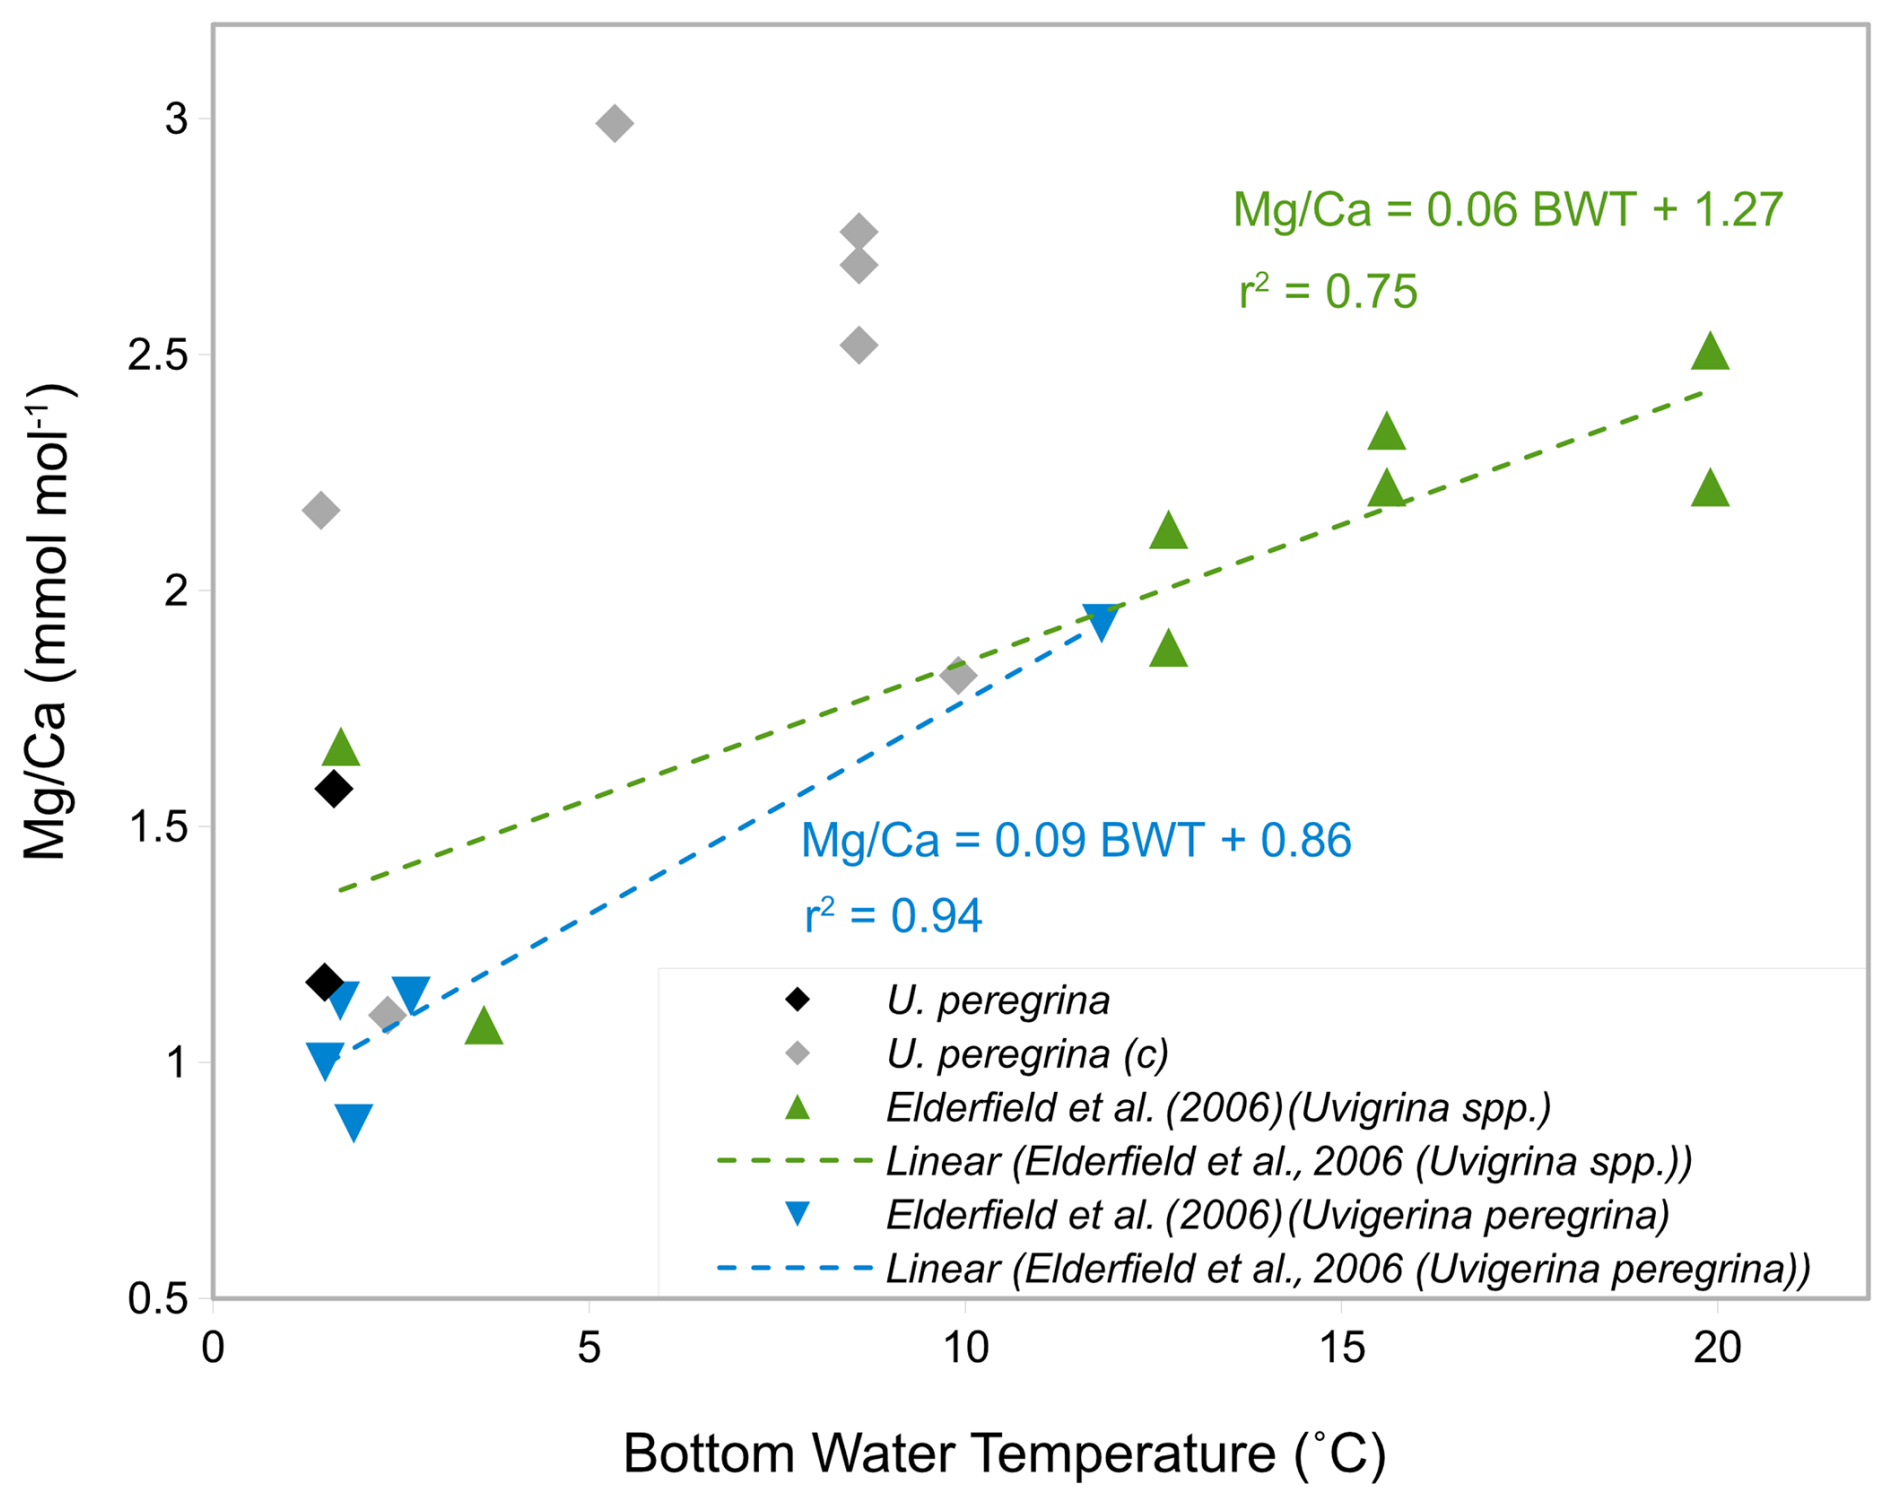
Figure 12-BWT calibration of U. peregrina in this study (grey rhombs: contaminated, black rhombs: uncontaminated) compared to Elderfield et al. (2006) core-top calibrations of light blue triangles: U. peregrina and green triangles: Uvigerina spp.
ratios measured in U. peregrina in a previous study (Yu et al., 2007) showed no significant difference between cleaning method using weaker reductive cleaning reagents and oxidative cleaning only, in contrast to ratios measured in C. wuellerstorfi and C. mundulus showing a significant difference (Yu et al., 2007). The clear difference in contamination between Cibicidoides spp. (Fig. 6) and U. peregrina (Fig. 7), despite using the same cleaning procedure, supports the findings in Yu et al. (2007), which suggest different rigour might be required for different species (please see Sect. 4.6 on variable degree of contamination).
4.3 Sufficient cleaning of Mn-oxide coatings
Although the cleaning procedure by Barker et al. (2003) has been widely used (e.g. Elderfield et al., 2006, 2010, Elmore et al., 2015), the removal of Mn-Mg coatings is inefficient in some cases (Hasenfratz et al., 2017; Pena et al., 2008). The Mn-oxide coatings which are found on the inner shells of foraminifera can cause increased ratios and only the reductive cleaning procedure satisfactorily removes this impurity (Pena et al., 2008). Where ratios are below 0.2 mmol mol−1, it entails a small increase in ratios that is within the uncertainty of ratio determination and therefore can be considered insignificant (Hasenfratz et al., 2017). All but one core-top sample have ratios below 0.2 mmol mol−1 (Figs. 6 and 7, Table 3). This suggests the reductive cleaning step was not needed for samples analysed in this study and therefore it is assumed the “Mg cleaning procedure” utilized in this study is more suitable than the “Cd cleaning procedure”.
4.4 Inefficient cleaning of silicate contaminants
The high as well as the high ratios in most samples of all species used here (Table 3) indicate inefficient removal of silicate contaminants, suggesting that the number of rinse/ultrasonication repetitions of the Barker et al. (2003) procedure is inadequate. Increasing the number of rinse/ultrasonication repeats further (from four to five) entails the risk of considerable calcite dissolution which may lower the ratios (Marr et al., 2013). There is probably a threshold at which tests are thoroughly cleaned and tests dissolve. A stepwise leaching test series could be used to investigate the rigour needed to optimize cleaning whilst avoiding sample loss in the process. Due to time limitations, however, this was not possible. If the methodology needs to be adapted to specific foraminifera species this highly limits the comparability between studies investigating different species from different core locations.
4.5 Species-specific differences in silicate contamination
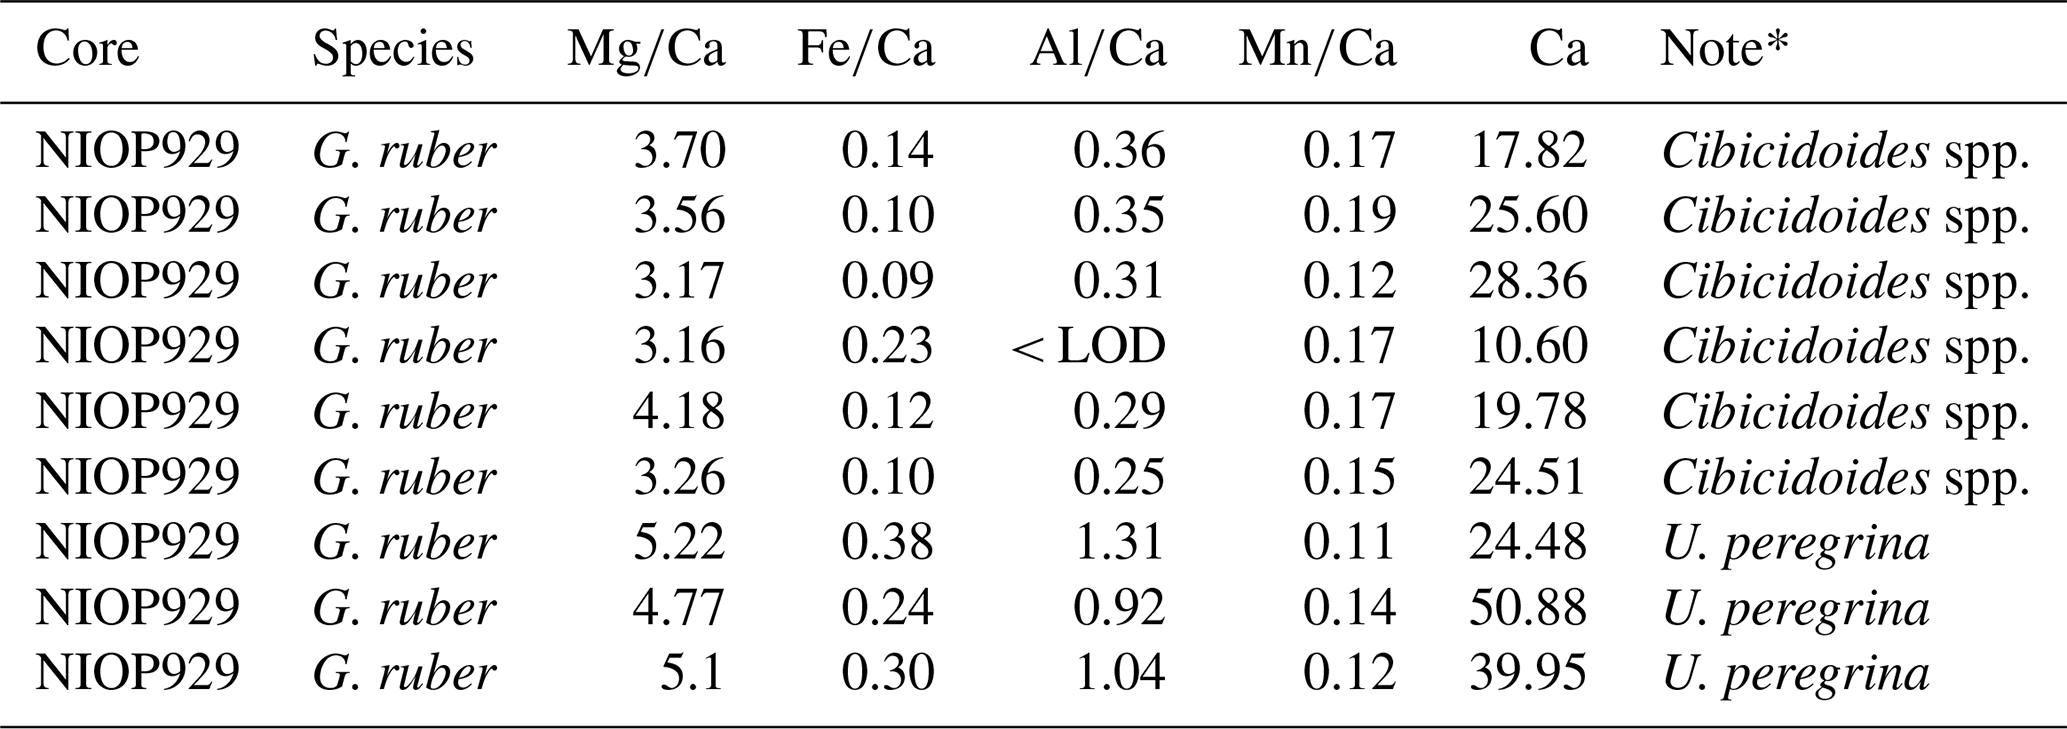
The range of ratios in U. peregrina was wider (0.02 to 2.04 mmol mol−1) than in C. wuellerstorfi (0.13 to 0.35 mmol mol−1; Table 3). This is consistent with Elmore et al. (2015, Supplement) reporting ratios below 0.1 mmol mol−1 in U. peregrina compared to ratios in C. wuellerstorfi below 0.04 mmol mol−1. Both ranges are below the contamination threshold (0.1 mmol mol−1) in contrast to ranges reported in this study. Elmore et al. (2015) also used the procedure of Barker et al. (2003). Samples containing G. ruber from core NIOP 929 were included in the analysis of core-tops and used as a control to monitor cleaning efficiency. On average, G. ruber contained , and ratios of 0.18, 0.60 and 0.15 mmol mol−1 (Table A4 in Appendix A). Both average ratios and average ratios in G. ruber from NIOP929 analysed in runs along with U. peregrina (0.31 and 1.09 mmol mol−1) were higher than that of G. ruber that were analysed in runs alongside Cibicidoides spp. (0.13 and 0.26 mmol mol−1; Table A4 in Appendix A). Since the same procedure was followed, the difference could point to an issue in the repeatability of the cleaning procedure, i.e. build-up of gas bubbles in the hot water bath during the oxidative step, insufficient crushing prior to cleaning, or different quantities of MilliQ water and methanol removed in between rinses affecting efficiency of contaminants being removed in every rinse. Alternatively, the different contamination levels can also result from different samples from core NIOP929 used due to insufficient specimens of G. ruber found within a single sample.
4.6 Variable initial degree of contamination
The degree of contamination of tests depends on factors including sediment composition, sedimentation rates, oxygen concentrations, core depth, water depth, and morphology (Barker et al., 2003; Ni et al., 2020; Pena et al., 2008). While foraminiferal tests that are well preserved and show no to minor signs of contamination were selected for analysis, the condition of specimens selected vary (qualitative observations of samples described in Table C1 in Appendix C). If U. peregrina, as an endobenthic species, is subject to more contact with surrounding sediment particles than C. wuellerstorfi, this could explain higher contamination in U. peregrina. Also, the surface of tests of C. wuellerstorfi is relatively smooth compared to the irregular surface of U. peregrina tests, entailing a larger surface area compared to C. wuellerstorfi which in turn increases the probability of contaminants sticking onto tests of U. peregrina.
4.7 Different depositional environment
Barker et al. (2003) suggest samples from regions of higher clay content require more rigorous cleaning. This study benefits from using core-top samples from a relatively localized area (within a radius of 1° E and S – see Fig. 1) in comparison to previous studies based on more widely distributed samples (e.g. Elderfield et al., 2006). Despite the close proximity of our samples, different depositional environments likely exist in our core-top sample set. To investigate the correlation between depositional environment and silicate contamination, ratios and ratios over depth were plotted (Fig. 8). There is an inverse correlation between ratios and ratios with depth in U. peregrina samples (Fig. 8) and samples at depths > 2000 m having significantly lower ratios and ratios. Our core-top transect is located close to the Rovuma River, implying lithogenic material deposited near its mouth. The redistribution of these sediments may well have affected the upper parts more than the deeper parts of the continental slope in our study area (compare van der Lubbe et al. (2014), which is probably reflected in the higher contamination level at shallower depths).
4.8 Relative impact of contamination
The ratios are typically lower in benthic foraminifera compared to planktic foraminifera and therefore the relative impact of contamination in benthic foraminifera is larger (de Villiers et al., 2002). While contamination thresholds following previous benthic foraminifera core-top studies have been used here, a lower contamination threshold for benthic foraminifera should be used to minimize the relatively higher uncertainty for benthic ratios (Hasenfratz et al., 2017). Different species of benthic foraminifera show different temperature sensitivities, i.e. the relative change in calcite ratios compared to changes in temperature (Gussone et al., 2016). The impact of contamination on -based temperature estimates varies with the temperature sensitivity in different foraminifera species (U. peregrina > Cibicidoides spp.). Cibicidoides spp. have previously been shown to have different temperature sensitivities at different temperature ranges (Elderfield et al., 2006). The temperature sensitivity of Cibicidoides spp. including C. mundulus and C. wuellerstorfi is higher at temperatures above 3 °C and therefore the relative impact is smaller in temperatures above 3 °C.
4.9 Different contamination thresholds
Different studies have used different indicators and thresholds to monitor silicate contamination and Mn-oxide coatings. Barker et al. (2003) consider correlations between ratios and and/or ratios as indicators of silicate contamination. Elderfield et al. (2010) have used contamination thresholds of 0.4, 0.1, and 0.1 mmol mol−1 of , , and ratios, respectively, as indicators of contamination, but also state because of difficulties with the precision of Al concentrations, the ratios were not excluded based on high ratios alone. Yu and Elderfield (2008) used correlations between and ratios with ratios to assess contamination. Lo Giudice Cappeli et al. (2015) have used ratios <1 mmol mol−1 and correlation with ratios to identify silicate contamination. In contrast, Stirpe et al. (2021) have used more strict thresholds of 0.0952, 0.0296, and 0.0189 µmol mol−1 of , , and ratios, respectively. While the most common contamination is based on correlations with , , and , the outlined differences cause uncertainty when comparing results between studies. When only using correlations between and ratios and ratios to assess silicate contamination, no samples of Cibicidoides spp. in this study would have been tagged as contaminated. However, when correlations are used in combination with the contamination thresholds, about half of the samples indicate silicate or other contamination. Also, when assessing correlations at species level, i.e. C. wuellerstorfi, there is a strong correlation between and ratios (Fig. 1A in Appendix A, excluding Cibicidoides spp. and C. mundulus which were analysed in the same run). The species difference could be due to morphological features of C. wuellerstorfi that allow more silicate contaminants to be trapped. On the other hand, if the lower contamination thresholds of Stirpe et al. (2021) are used, all ratios of this study are suggested to be contaminated with both silicate and Mn-oxide coatings. Correlation between , and with helps identify contaminants that also contain Mg (most notably silicate and Mn-oxide coatings) and are therefore relevant for determining calcite ratios. Excluding samples based on strict contamination thresholds for Fe, Al, and Mn, without considering correlations to ratios risks excluding many samples that have minor contaminants which do not affect ratios. These measurements could still prove a reliable estimate of ratios. Still, any presence of contamination is a concern. Even if it does not produce inaccurate ratios (in the case that the contaminant does not contain Mg), it introduces uncertainties. The inconsistencies between studies and the uncertainties used could be resolved by further examination of appropriate contamination thresholds. For example, elemental analysis of a sample containing visible contamination from every core sample that foraminifera tests are picked from could be introduced in the methodology. This would help assess the identified contamination effect on ratios measured in the foraminifera tests from a particular sample and specify contamination thresholds that are specific to each sample. Because the degree of contamination effect depends on factors such as average ratios and temperature sensitivity, a more appropriate contamination threshold should be species specific and at least detailing benthic versus planktic foraminifera differences since average ratios are significantly lower in benthic species (Hasenfratz et al., 2017).
Designed to optimize the relationship between sample cleaning involved in thermometry and sample loss during the procedure, in experiments 1–3 varying methanol and ultra-pure water rinses were used and clearly show a substantial effect on the level of silicate contamination. These experiments showed that the best cleaning method for our study was that of Barker et al. (2003).
The core-top calibration for C. wuellerstorfi in this study, including only four samples, is broadly in line with published data, although there is only one data point in our study at the high temperature end.
Contamination is a general problem. Despite using an established method (Barker et al., 2003), U. peregrina in particular displayed high levels of remanent contamination. The U. peregrina ratios also indicate that the contamination indicating thresholds have generally been correct in identifying samples with silicate contamination.
There are several potential sources of error for ratios including the carbonate ion effect, diagenetic effects, seawater variability, and vital effects. The main limitation in the use of as a palaeothermometer is a general lack of understanding of benthic foraminiferal Mg incorporation and the relative impact of environmental factors, biogenic controls, and diagenetic effects. It is possible that species-specific cleaning protocols are needed to improve comparability of data between studies.
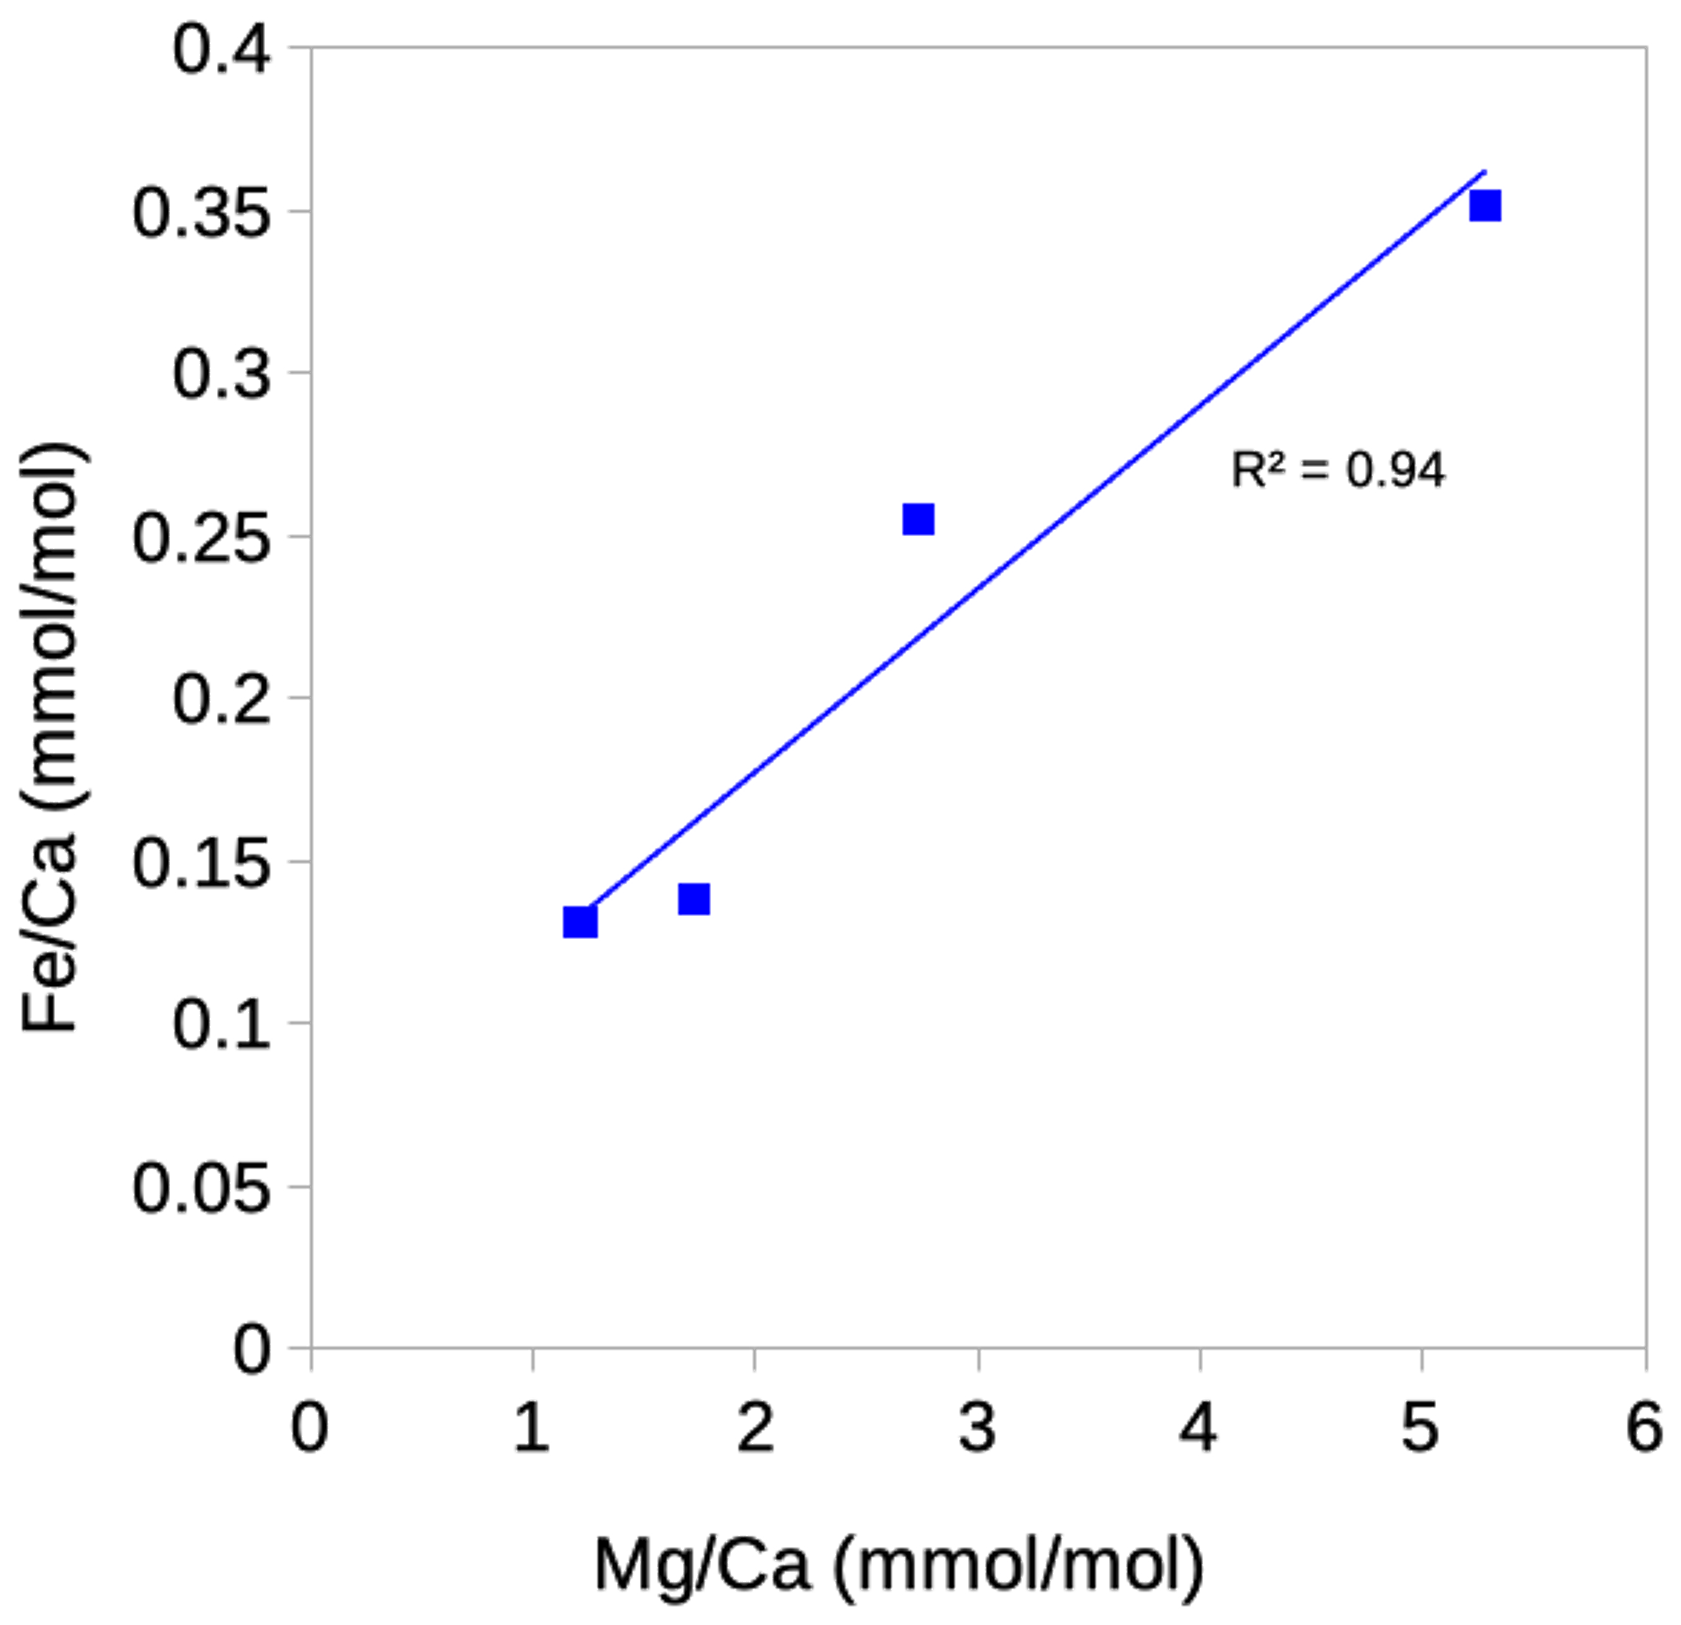
Figure A1Correlation between ratios and ratios in Cibicidoides wuellerstorfi. One data point is excluded where Fe is below limit of detection.
Table A1Samples analysed in Experiment 1–3.
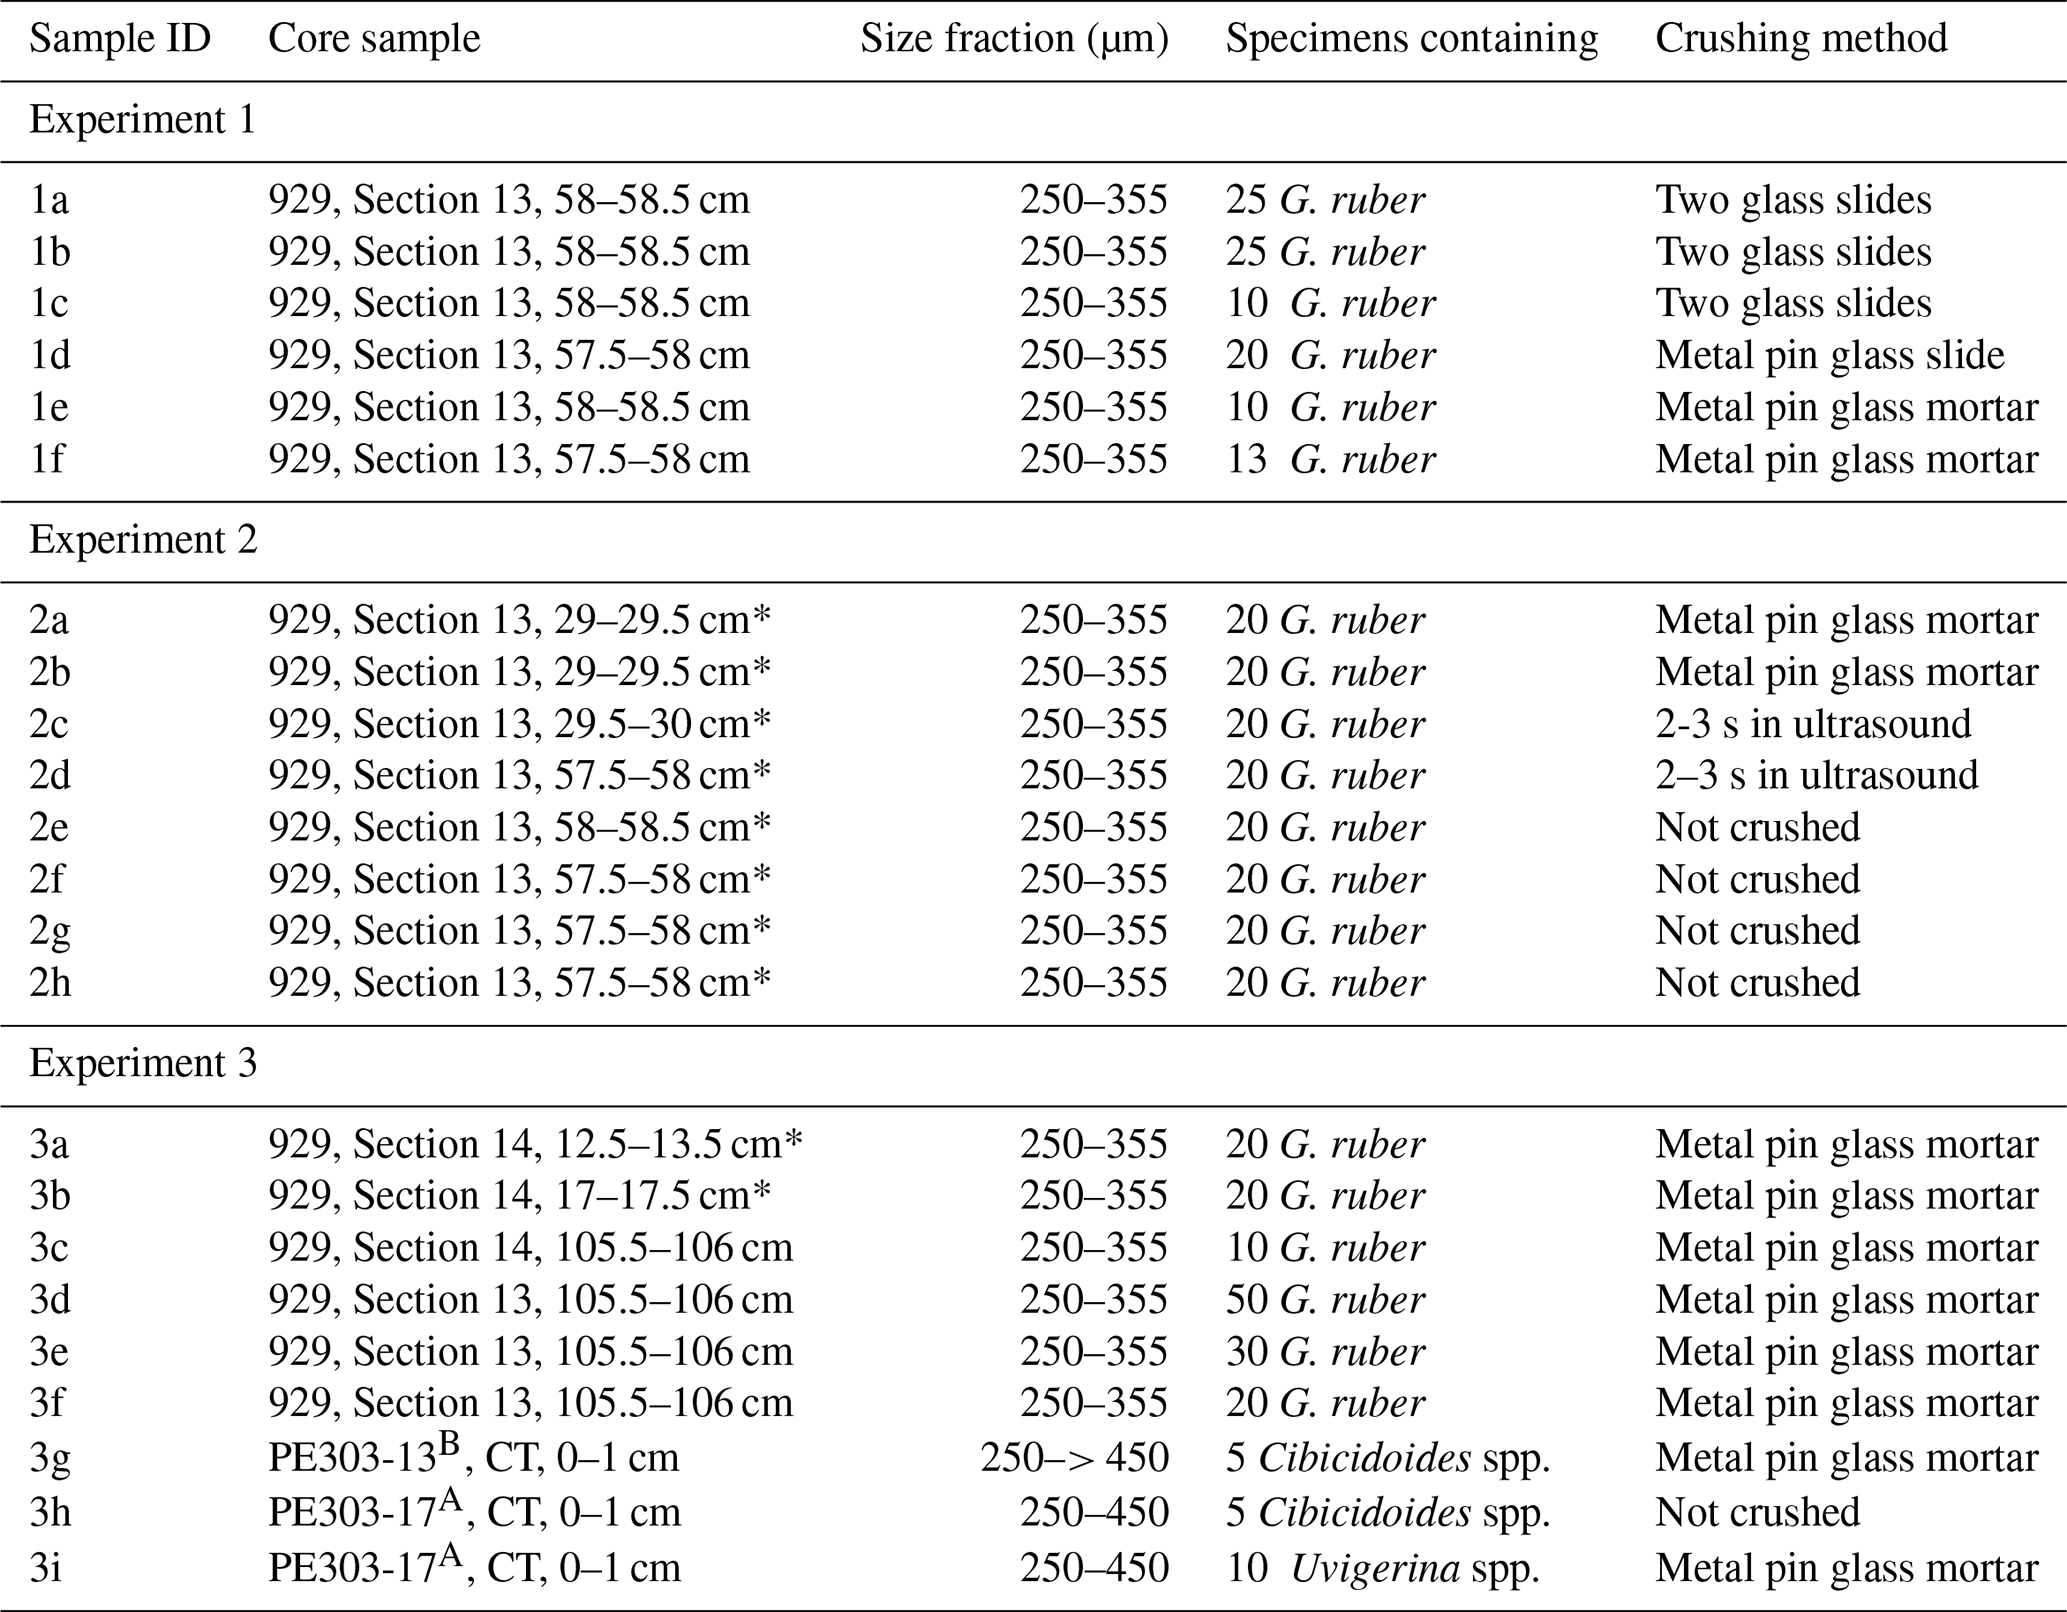
* used for comparison to previously measured ratios by Saher et al. (2009).
Table A2Results from Experiment 1.
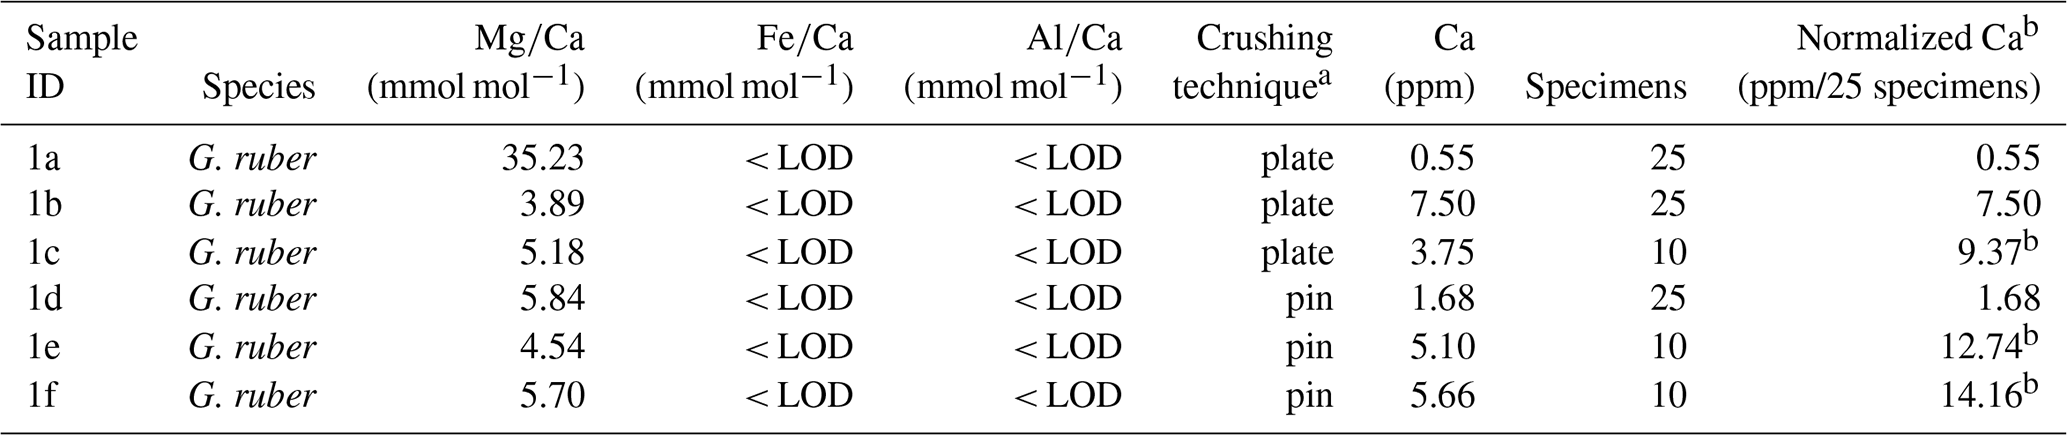
a plate = crushing specimens simultaneously between two glass plates, pin = crushing specimens individually using metal pin. b Samples with specimens less than 25 have been normalized to account for the reduced sample in order to be able to compare effect of crushing technique on Ca content even though different sample size have been used (due to limited specimens available). Where 10 specimens have been analysed the Ca content have been multiplied with 2.5.
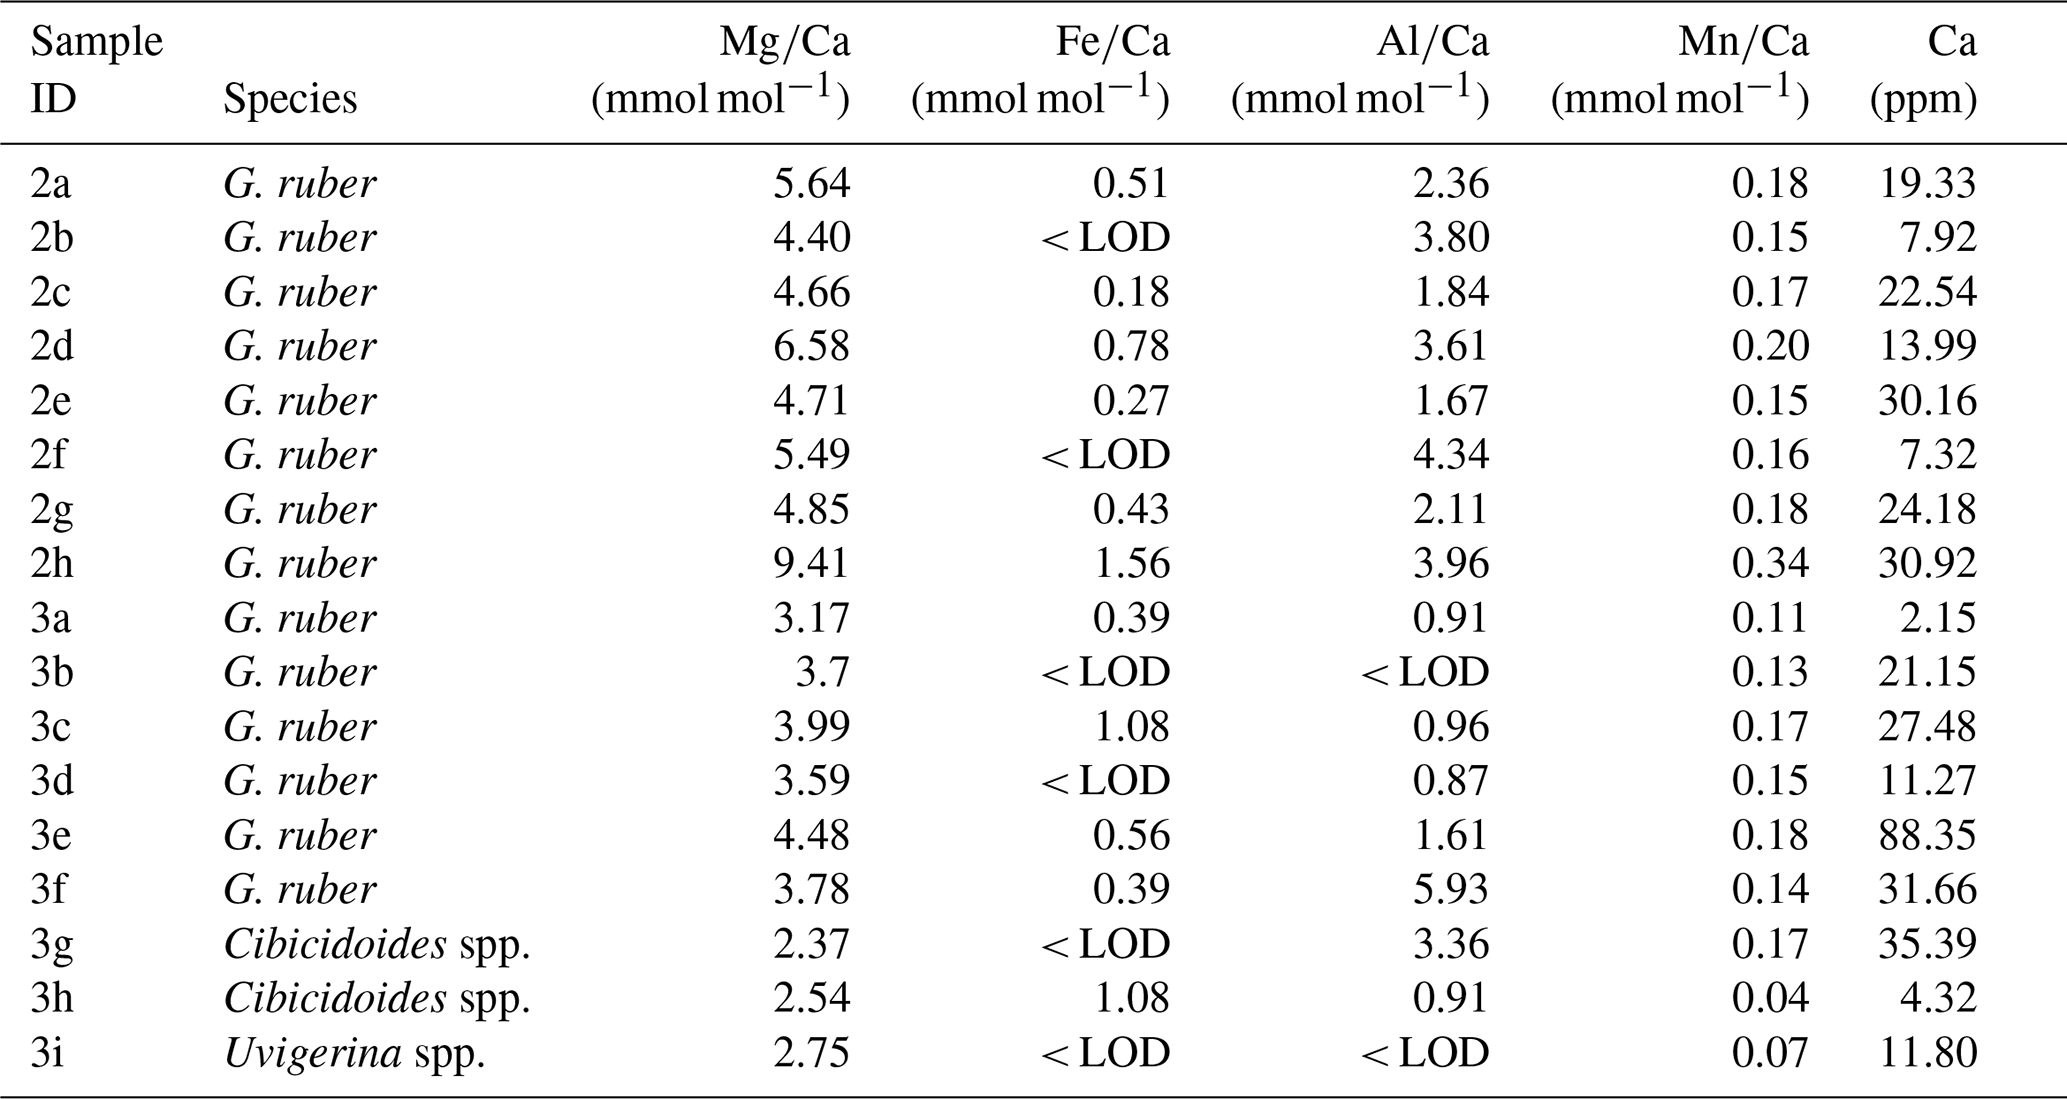
Table A4, Ca, and contamination indicators (, , and ) of samples containing G. ruber analysed in the same runs alongside core-top samples.
* Analysed in run alongside Cibicidoides spp. U. peregrina.
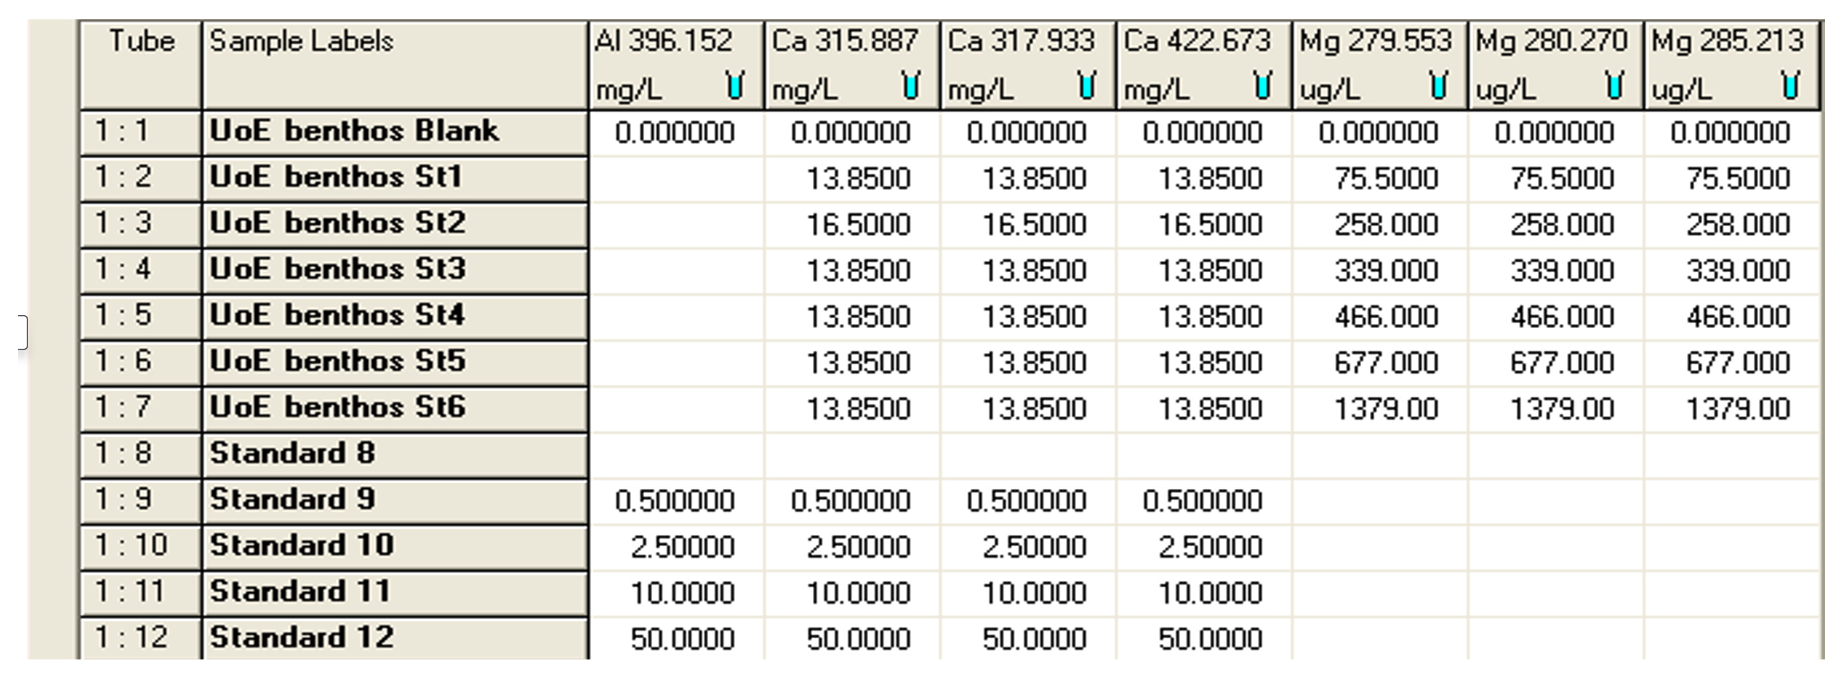
Figure B1Print screen showing the concentration of standards used (Mg in ppb and Ca in ppm) in analyses for calibration and for matrix effect. The ICP analyses were carried out on an Agilent (former Varian) Vista Pro 700. The screenshot below was taken from the ICP Expert software package (distributed by Agilent https://www.agilent.com, last access: August 2022), which is used to operate the ICP-OES.
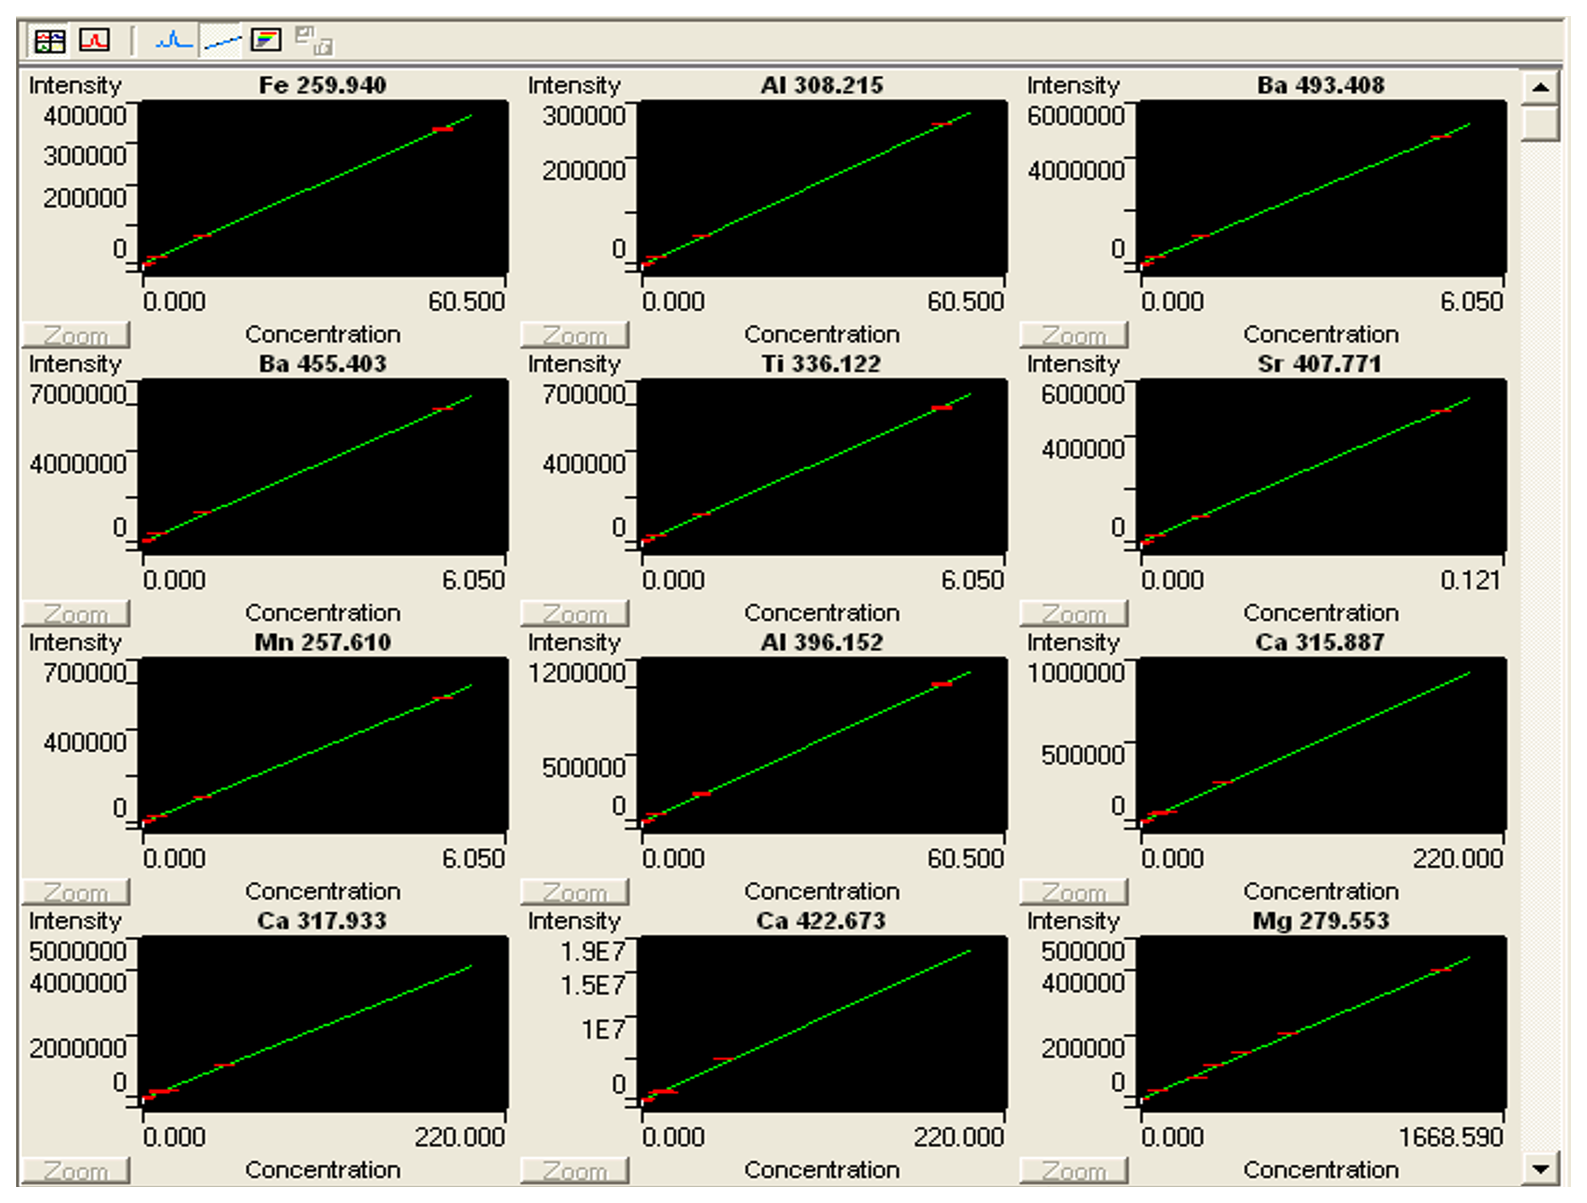
Figure B2Print screen of ICP Expert showing calibration curves for standards in Uvigerina peregrina analyses. The ICP analyses were carried out on an Agilent (former Varian) Vista Pro 700. The ICP Expert software package (distributed by Agilent https://www.agilent.com, last access: August 2022) is used to operate the ICP-OES.
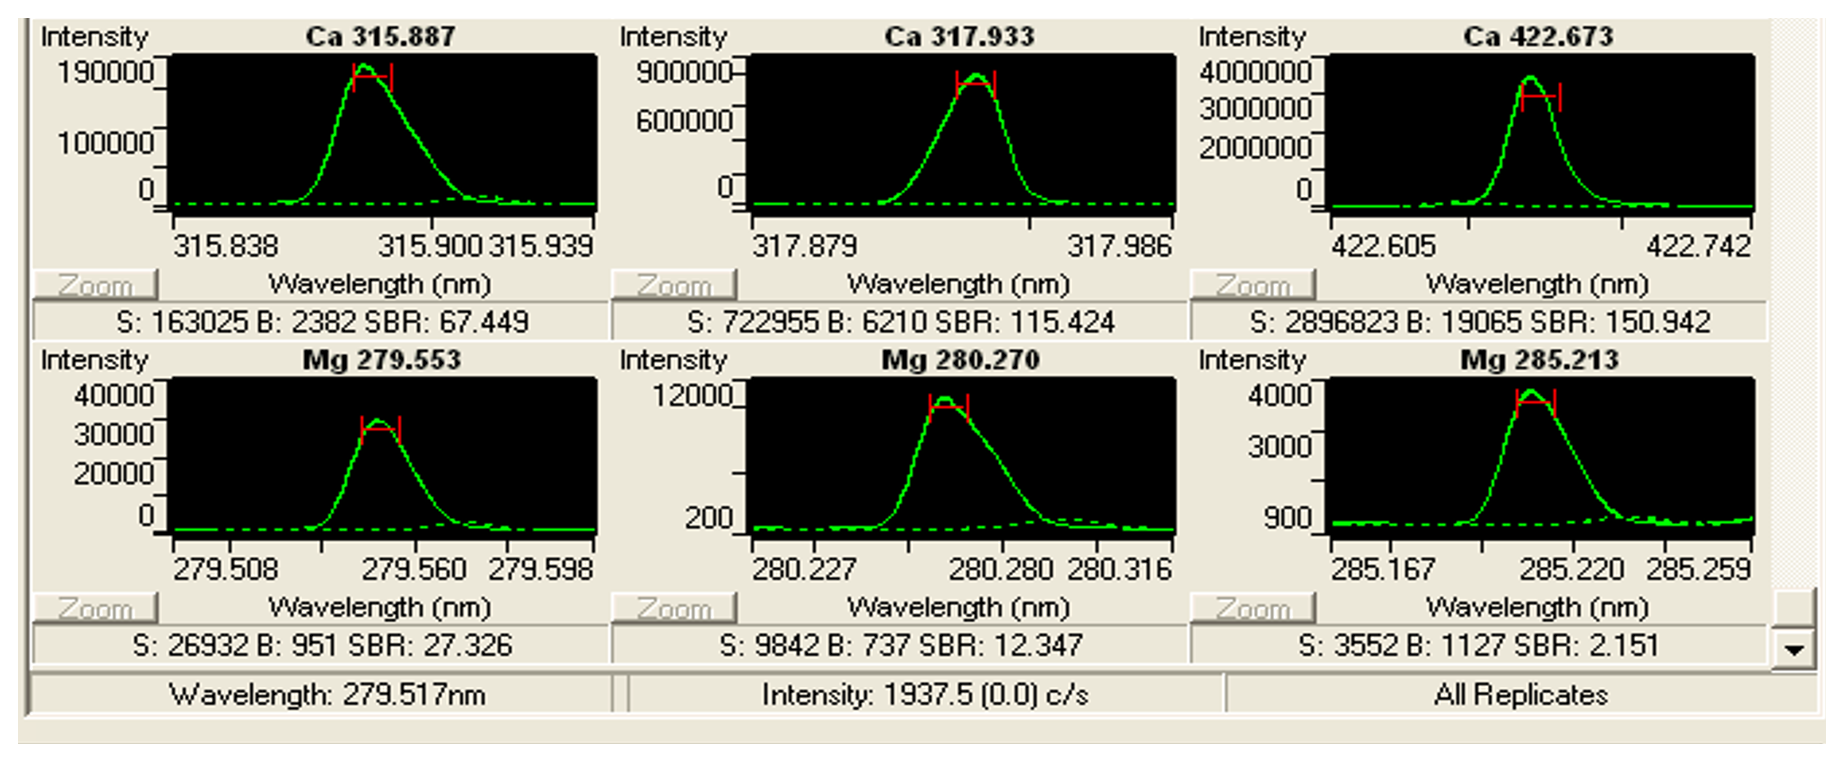
Figure B3Print screen of ICP Expert showing an example of the intensity curves in Cibicidoides spp. analyses. The ICP analyses were carried out on an Agilent (former Varian) Vista Pro 700. The ICP Expert software package (distributed by Agilent https://www.agilent.com, last access: August 2022) is used to operate the ICP-OES.
Table C1Images and qualitative observations of 250–450 µm size fractions of core-top samples containing benthic foraminifera tests analysed.
Data will be available via https://www.pangaea.de/?t=Oceans (section Oceans; last access: 25 August 2025) by the end of 2025.
The research was conceptualized by SJ and VL. VL designed, carried out experiments, conducted data analysis, created visualizations, and prepared the original manuscript. This was done with supervision and validation input from SJ. SJ and VL jointly prepared the final manuscript.
At least one of the (co-)authors is a guest member of the editorial board of Climate of the Past for the special issue “Paleoclimate, from observing modern processes to reconstructing the past: a tribute to Dick (Dirk) Kroon”. The peer-review process was guided by an independent editor, and the authors also have no other competing interests to declare.
Publisher's note: Copernicus Publications remains neutral with regard to jurisdictional claims made in the text, published maps, institutional affiliations, or any other geographical representation in this paper. While Copernicus Publications makes every effort to include appropriate place names, the final responsibility lies with the authors.
This article is part of the special issue “Paleoclimate, from observing modern processes to reconstructing the past: a tribute to Dick (Dirk) Kroon”. It is not associated with a conference.
The authors thank Laetitia Pichevin for advice on the experimental design and statistical analysis, Raja Ganeshram for advice on the cleaning methodology, and the PGR staff in the Geoscience Department at The University of Edinburgh for providing administrative help. We also would like to thank the anonymous referees, who helped improve the manuscript.
This paper was edited by Irina Rogozhina and reviewed by three anonymous referees.
Barker, S., Greaves, M., and Elderfield, H.: A study of cleaning procedures used for foraminiferal paleothermometry, Geochem. Geophys. Geosyst., 4, https://doi.org/10.1029/2003GC000559, 2003.
Barker, S., Cacho, I., Benway, H., and Tachikawa, K.: Planktonic foraminiferal as a proxy for past oceanic temperatures: a methodological overview and data compilation for the Last Glacial Maximum, Quaternary Sci. Rev., 24, 821–834, https://doi.org/10.1016/j.quascirev.2004.07.016, 2005.
Bell, D. B., Jung, S. J. A., Kroon, D., Lourens, L. J., and Hodell, D. A.: Local and regional trends in Plio-Pleistocene δ18O records from benthic foraminifera, Geochem. Geophys. Geosyst., G3, 15, 3304–3321, https://doi.org/10.1002/2014GC005297, 2014.
Bentov, S. and Erez, J.: Impact of biomineralization processes on the Mg content of foraminiferal shells: A biological perspective, Geochem. Geophys. Geosyst., G3, 7, https://doi.org/10.1029/2005GC001015, 2006.
Bickert, T. and Mackensen, A.: Last Glacial to Holocene changes in South Atlantic deep water circulation, in: The South Atlantic in the late Quaternary: Reconstruction of material budgets and current systems, edited by: Wefer, G., Mulitza, S., and Ratmeyer, V., Springer Verlag, Berlin, Heidelberg, New York, Tokyo, 671–695, https://doi.org/10.1007/978-3-642-18917-3_29, 2003.
Birch, H., Coxall, H. K., Pearson, P. N., Kroon, D., and O'Regan, M.: Planktonic Foraminifera stable isotopes and water column structure; disentangling ecological signals, Mar. Micropaleonto., 101, 127–145, https://doi.org/10.1016/j.marmicro.2013.02.002, 2013.
Boyle, E. A. and Keigwin, L. D.: Comparison of Atlantic and Pacific paleochemical records for the last 215,000 years; changes in deep ocean circulation and chemical inventories, Earth Planet. Sci. Lett., 76, 135–150, https://doi.org/10.1016/0012-821X(85)90154-2, 1985.
Branson, O., Redfern, S. A. T., Tyliszczak, T., Sadekov, A., Langer, G., Kimoto, K., and Elderfield, H.: The coordination of Mg in foraminiferal calcite, Earth Planet. Sci. Lett., 383, 134–141, https://doi.org/10.1016/j.epsl.2013.09.037, 2013.
Brummer, G.-J. A. and Jung, S. J. A.: RV Pelagia Cruise Report: Cruise 64PE304 SE African margin NIOZ Rapp., 1–33, https://epic.awi.de/id/eprint/32541/1/64PE304.pdf (last access: 22 August 2025), 2009.
Bryan, S. P. and Marchitto, T. M.: -temperature proxy in benthic foraminifera: New calibrations from the Florida Straits and a hypothesis regarding , Paleoceanography, 23, https://doi.org/10.1029/2007PA001553, 2008.
Curry, W. B., Duplessy, J.-C., Labeyrie, L. D., and Shackleton, N. J.: Changes in the distribution of delta (super 13) C of deep water Sigma CO (sub 2) between the last glaciation and the Holocene, Paleoceanography, 3, 317–341, https://doi.org/10.1029/PA003i003p00317, 1988.
de Nooijer, L. J., Hathorne, E. C., Reichart, G. J., Langer, G., and Bijma, J.: Variability in calcitic and ratios in clones of the benthic foraminifer Ammonia tepida, Mar. Micropaleontol., 107, 32–43, https://doi.org/10.1016/j.marmicro.2014.02.002, 2014.
de Villiers, S., Greaves, M., and Elderfield, H.: An intensity ratio calibration method for the accurate determination of and of marine carbonates by ICP-AES, Geochem. Geophys. Geosyst., G3, 3, https://doi.org/10.1029/2001GC000169, 2002.
Duplessy, J.-C., Shackleton, N. J., Fairbanks, R. G., Labeyrie, L. D., Oppo, D., and Kallel, N.: Deepwater source variations during the last climatic cycle and their impact on the global deepwater circulation, Paleoceanography, 3, 343–360, https://doi.org/10.1029/PA003i003p00343, 1988.
Elderfield, H. and Ganssen, G.: Past temperature and delta (super 18) O of surface ocean waters inferred from foraminiferal ratios, Nature (London), 405, 442–445, https://doi.org/10.1038/35013033, 2000.
Elderfield, H., Bertram, C. J., and Erez, J.: A biomineralization model for the incorporation of trace elements into foraminiferal calcium carbonate, Earth Planet. Sci. Lett., 142, 409–423, https://doi.org/10.1016/0012-821X(96)00105-7, 1996.
Elderfield, H., Yu, J., Anand, P., Kiefer, T., and Nyland, B.: Calibrations for benthic foraminiferal paleothermometry and the carbonate ion hypothesis, Earth Planet. Sci. Lett., 250, 633–649, https://doi.org/10.1016/j.epsl.2006.07.041, 2006.
Elderfield, H., Greaves, M., Barker, S., Hall, I. R., Tripati, A., Ferretti, P., Crowhurst, S., Booth, L., Daunt, C., Masson-Delmotte, V., Waelbroeck, C., Fischer, H., and Wolff, E. W.: A record of bottom water temperature and seawater delta (super 18) O for the Southern Ocean over the past 440 kyr based on of benthic foraminiferal Uvigerina spp, Quaternary Sci. Rev., 29, 160–169, https://doi.org/10.1016/j.quascirev.2009.07.013, 2010.
Elmore, A. C., McClymont, E. L., Elderfield, H., Kender, S., Cook, M. R., Leng, M. J., Greaves, M., and Misra, S.: Antarctic Intermediate Water properties since 400 ka recorded in infaunal (Uvigerina peregrina) and epifaunal (Planulina wuellerstorfi) benthic Foraminifera, Earth Planet. Sci. Lett., 428, 193–203, https://doi.org/10.1016/j.epsl.2015.07.013, 2015.
Emiliani, C.: Pleistocene temperatures, J. Geol., 63, 538–578, 1955.
Erez, J.: The source of ions for biomineralization in Foraminifera and their implications for paleoceanographic proxies, Rev. Mineral. Geochem., 54, 115–149, https://doi.org/10.2113/0540115, 2003.
Grundlingh, M. L.: OCCURRENCE OF RED-SEA WATER IN THE SOUTHWESTERN INDIAN-OCEAN, 1981, J. Phys. Oceanogr., 15, 207–212, https://doi.org/10.1175/1520-0485(1985)015<0207:OORSWI>2.0.CO;2, 1985.
Gussone, N., Filipsson, H. L., and Kuhnert, H.: , and Ca isotope ratios in benthonic foraminifers related to test structure, mineralogy and environmental controls, Geochim. Cosmochim. Acta, 173, 142–159, https://doi.org/10.1016/j.gca.2015.10.018, 2016.
Hasenfratz, A. P., Martinez-Garcia, A., Jaccard, S. L., Vance, D., Waelle, M., Greaves, M., and Haug, G. H.: Determination of the ratio in foraminiferal coatings; an approach to correct temperatures for Mn-rich contaminant phases, Earth Planet. Sci. Lett., 457, 335–347, https://doi.org/10.1016/j.epsl.2016.10.004, 2017.
Healey, S. L., Thunell, R. C., and Corliss, B. H.: The -temperature relationship of benthic foraminiferal calcite: New core-top calibrations in the < 4 °C temperature range, Earth Planet. Sci. Lett., 272, 523–530, https://doi.org/10.1016/j.epsl.2008.05.023, 2008.
Jung, S. J. A., Kroon, D., Ganssen, G., Peeters, F., and Ganeshram, R.: Enhanced Arabian Sea Intermediate Water flow during glacial North Atlantic cold phases, Earth Planet. Sci. Lett., 280, 220–228, https://doi.org/10.1016/j.epsl.2009.01.037, 2009.
Kroon, D. and Shipboard Party: Tropical Temperature History during Paleogene GLObal Warming (GLOW) NIOZ Rapp., 1–59, 2010.
Lauvset, S. K., Lange, N., Tanhua, T., Bittig, H. C., Olsen, A., Kozyr, A., Alin, S., Álvarez, M., Azetsu-Scott, K., Barbero, L., Becker, S., Brown, P. J., Carter, B. R., da Cunha, L. C., Feely, R. A., Hoppema, M., Humphreys, M. P., Ishii, M., Jeansson, E., Jiang, L.-Q., Jones, S. D., Lo Monaco, C., Murata, A., Müller, J. D., Pérez, F. F., Pfeil, B., Schirnick, C., Steinfeldt, R., Suzuki, T., Tilbrook, B., Ulfsbo, A., Velo, A., Woosley, R. J., and Key, R. M.: GLODAPv2.2022: the latest version of the global interior ocean biogeochemical data product, Earth Syst. Sci. Data, 14, 5543–5572, https://doi.org/10.5194/essd-14-5543-2022, 2022.
Lauvset, S. K., Lange, N., Tanhua, T., Bittig, H. C., Olsen, A., Kozyr, A., Álvarez, M., Azetsu-Scott, K., Brown, P. J., Carter, B. R., Cotrim da Cunha, L., Hoppema, M., Humphreys, M. P., Ishii, M., Jeansson, E., Murata, A., Müller, J. D., Pérez, F. F., Schirnick, C., Steinfeldt, R., Suzuki, T., Ulfsbo, A., Velo, A., Woosley, R. J., and Key, R. M.: The annual update GLODAPv2.2023: the global interior ocean biogeochemical data product, Earth Syst. Sci. Data, 16, 2047–2072, https://doi.org/10.5194/essd-16-2047-2024, 2024.
Lea, D. W., Mashiotta, T. A., and Spero, H. J.: Controls on magnesium and strontium uptake in planktonic Foraminifera determined by live culturing, Geochim. Cosmochim. Acta, 63, 2369–2379, 10.1016/S0016-7037(99)00197-0, 1999.
Lear, C. H., Rosenthal, Y., and Slowey, N.: Benthic foraminiferal -paleothermometry: a revised core-top calibration, Geochim. Cosmochim. Acta, 66, 3375–3387, https://doi.org/10.1016/S0016-7037(02)00941-9, 2002.
Lo Giudice Cappelli, E., Regenberg, M., Holbourn, A., Kuhnt, W., Garbe-Schoenberg, D., and Andersen, N.: Refining C. wuellerstorfi and H. elegans temperature calibrations, Mar. Micropaleontol., 121, 70–84, https://doi.org/10.1016/j.marmicro.2015.10.001, 2015.
Lutze, G. F. and Thiel, H.: Epibenthic foraminifera from elevated microhabitats; Cibicidoides wuellerstorfi and Planulina ariminensis, J. Foramin. Res., 19, 153–158, https://doi.org/10.2113/gsjfr.19.2.153, 1989.
Lynch-Stieglitz, J. and Fairbanks, R. G.: A conservative tracer for glacial ocean circulation from carbon isotope and palaeo-nutrient measurements in benthic foraminifera, Nature (London), 369, 308–310, https://doi.org/10.1038/369308a0, 1994.
Marr, J. P., Bostock, H. C., Carter, L., Bolton, A., and Smith, E.: Differential effects of cleaning procedures on the trace element chemistry of planktonic foraminifera, Chem. Geol., 351, 310–323, https://doi.org/10.1016/j.chemgeo.2013.05.019, 2013.
Martin, P. A. and Lea, D. W.: A simple evaluation of cleaning procedures on fossil benthic foraminiferal , Geochem. Geophys. Geosyst., G3, 1–8, https://doi.org/10.1029/2001GC000280, 2002.
McCave, I. N., Kiefer, T., Thornalley, D. J. R., and Elderfield, H.: Deep Flow in the Madagascar: Mascarene Basin over the Last 150 000 Years, Philos. T. Roy. Soc. A, 363, 81–99, https://doi.org/10.1098/rsta.2004.1480, 2005.
Ni, S., Quintana Krupinski, N. B., Groeneveld, J., Persson, P., Somogyi, A., Brinkmann, I., Knudsen, K. L., Seidenkrantz, M. S., and Filipsson, H. L.: Early diagenesis of foraminiferal calcite under anoxic conditions: A case study from the Landsort Deep, Baltic Sea (IODP Site M0063), Chem. Geol., 558, 119871, https://doi.org/10.1016/j.chemgeo.2020.119871, 2020.
Nürnberg, D.: Magnesium in tests of Neogloboquadrina pachyderma sinistral from high northern and southern latitudes, J. Foramin. Res., 25, 350–368, https://doi.org/10.2113/gsjfr.25.4.350, 1995.
Nürnberg, D., Bijma, J., and Hemleben, C.: Assessing the reliability of magnesium in foraminiferal calcite as a proxy for water mass temperatures, Geochim. Cosmochim. Acta, 60, 803–814, https://doi.org/10.1016/0016-7037(95)00446-7, 1996.
Pena, L. D., Cacho, I., Calvo, E., Pelejero, C., Eggins, S., and Sadekov, A.: Characterization of contaminant phases in foraminifera carbonates by electron microprobe mapping, Geochem. Geophys. Geosyst., 9, https://doi.org/10.1029/2008GC002018, 2008.
Rosenthal, Y., Boyle, E. A., Labeyrie, L., and Oppo, D.: Glacial enrichments of authigenic Cd And U in subantarctic sediments: A climatic control on the elements' oceanic budget?, Paleoceanography, 10, 395–413, https://doi.org/10.1029/95PA00310, 1995.
Rosenthal, Y., Boyle, E. A., and Slowey, N.: Temperature control on the incorporation of magnesium, strontium, fluorine, and cadmium into benthic foraminiferal shells from Little Bahama Bank: Prospects for thermocline paleoceanography, Geochim. Cosmochim. Acta, 61, 3633–3643, https://doi.org/10.1016/S0016-7037(97)00181-6, 1997.
Rustic, G. T., Polissar, P. J., Ravelo, A. C., and DeMenocal, P.: Relationship between individual chamber and whole shell ratios in Trilobatus sacculifer and implications for individual foraminifera palaeoceanographic reconstructions, Sci. Rep., 11, 463–463, https://doi.org/10.1038/s41598-020-80673-8, 2021.
Sadekov, A., Eggins, S. M., De Deckker, P., and Kroon, D.: Uncertainties in seawater thermometry deriving from intratest and intertest variability in Globigerinoides ruber, Paleoceanography, 23, https://doi.org/10.1029/2007PA001452, 2008.
Saher, M. H., Rostek, F., Jung, S. J. A., Bard, E., Schneider, R. R., Greaves, M., Ganssen, G. M., Elderfield, H., and Kroon, D.: Western Arabian Sea SST during the penultimate interglacial: A comparison of U37K′ and paleothermometry, Paleoceanography, 24, https://doi.org/10.1029/2007PA001557, 2009.
Sarnthein, M., Winn, K., Jung, S. J. A., Duplessy, J. C., Labeyrie, L., Erlenkeuser, H., and Ganssen, G.: Changes in East Atlantic Deepwater Circulation over the last 30,000 years: Eight time slice reconstructions, Paleoceanography, 9, 209–267, https://doi.org/10.1029/93PA03301, 1994.
Schlitzer, R.: Ocean Data View, https://odv.awi.de (last access: 18 February 2025), 2023.
Shackleton, N.: Oxygen Isotope Analyses and Pleistocene Temperatures Re-assessed, Nature (London), 215, 15–17, https://doi.org/10.1038/215015a0, 1967.
Shackleton, N. J.: Attainment of isotopic equlilibrium between ocean water and the benthic foraminifera: Uvigerina: Isotopic changes in the ocean during the last glacial, Colloques Internatinaux du CNRS, 219, 203–209, 1974.
Srinivasan, A.: Deep circulation in the Indian Ocean: Tracer diagnostics, ProQuest Dissertations & Theses, 122 pp., https://www.proquest.com/docview/304517714?parentSessionId=Zm8HZvhniXCDKyCqWmrurDrr0NLIrsz19F27UD+J0Ek=&pq-origsite=primo&accountid=10673&sourcetype=Dissertations & Theses (last access: 22 August 2025), 1999.
Stirpe, C. R., Allen, K. A., Sikes, E. L., Zhou, X., Rosenthal, Y., Cruz-Uribe, A. M., and Brooks, H. L.: The proxy for temperature: A Uvigerina core-top study in the Southwest Pacific, Geochim. Cosmochim. Acta, 309, 299–312, https://doi.org/10.1016/j.gca.2021.06.015, 2021.
Talley, L. D.: Hydrographic Atlas of the World Ocean Circulation Experiment (WOCE), Volume 4: Indian Ocean, edited by: Sparrow, M., Chapman, P., and Gould, J., International WOCE Project Office, Southampton, UK, ISBN 0904175588, https://sam.ucsd.edu/whp_atlas/indian/atlas_text/WHPAtlas_Vol4_Indian_Introduction.pdf (last access: 22 August 2025), 2013.
Talley, L. D., Clark, P. U., Webb, R. S., and Keigwin, L. D.: Some aspects of ocean heat transport by the shallow, intermediate and deep overturning Circulations, in: American Geophysical Union, Washington, D. C, 1–22, https://doi.org/10.1029/GM112p0001, 1999.
van Aken, H. M., Ridderinkhof, H., and de Ruijter, W. P. M.: North Atlantic deep water in the south-western Indian Ocean, Deep-Sea Res. I, 51, 755–776, https://doi.org/10.1016/j.dsr.2004.01.008, 2004.
van der Lubbe, J. J. L., Tjallingii, R., Prins, M. A., Brummer, G.-J. A., Jung, S. J. A., Kroon, D., and Schneider, R. R.: Sedimentation patterns off the Zambezi River over the last 20,000years, Mar. Geol., 355, 189–201, https://doi.org/10.1016/j.margeo.2014.05.012, 2014.
van Hinte, J. E., van Weering, T. C. E., and Troelstra, S. R.: Tracing a seasonal upwelling: Report on two cruises of R.V. Tyro to the NW Indian Ocean in 1992 and 1993, National Museum of Natural History, Leiden, 146, 1995.
You, Y.: Implications of the deep circulation and ventilation of the Indian Ocean on the renewal mechanism of North Atlantic Deep Water, J. Geophys. Res., Washington, DC, 105, 23895–23926, https://doi.org/10.1029/2000JC900105, 2000.
Yu, J. and Elderfield, H.: in the benthic foraminifera Cibicidoides wuellerstorfi and Cibicidoides mundulus: Temperature versus carbonate ion saturation, Earth Planet. Sci. Lett., 276, 129–139, https://doi.org/10.1016/j.epsl.2008.09.015, 2008.
Yu, J., Elderfield, H., Greaves, M., and Day, J.: Preferential dissolution of benthic foraminiferal calcite during laboratory reductive cleaning, Geochem. Geophys. Geosyst., 8, https://doi.org/10.1029/2006GC001571, 2007.
- Abstract
- Introduction
- Methodology
- Results
- Discussion
- Summary and conclusion
- Appendix A: Mg Ca ratios and contamination indicators
- Appendix B: ICP-OES calibration curves and standards
- Appendix C: Qualitative observations of benthic foraminifera samples analysed
- Data availability
- Author contributions
- Competing interests
- Disclaimer
- Special issue statement
- Acknowledgements
- Review statement
- References