the Creative Commons Attribution 4.0 License.
the Creative Commons Attribution 4.0 License.
 | 11 Jun 2025
Global biome changes over the last 21 000 years inferred from model–data comparisons
Chenzhi Li
Anne Dallmeyer
Manuel Chevalier
Matteo Willeit
Andrei A. Andreev
Xianyong Cao
Laura Schild
Birgit Heim
Mareike Wieczorek
Ulrike Herzschuh
We present a global megabiome reconstruction for 43 time slices at 500-year intervals throughout the last 21 000 years based on an updated, and thus currently the most extensive, global taxonomically and temporally standardized fossil pollen dataset of 3455 records. The evaluation with modern potential natural vegetation distributions yields an agreement of ∼ 80 %, suggesting a high reliability of the pollen-based megabiome reconstruction.
We compare the reconstruction with an ensemble of six biomized simulations derived from transient Earth system models (ESMs). Overall, the global spatiotemporal patterns of megabiomes estimated by both the simulation ensemble and the reconstructions are generally consistent. Specifically, they reveal a global shift from open glacial non-forest megabiomes to Holocene forest megabiomes since the Last Glacial Maximum (LGM), in line with the general climate warming trend and continental ice-sheet retreat. The shift to a global megabiome distribution generally similar to today's took place during the early Holocene; furthermore, the reconstructions reveal that enhanced anthropogenic disturbances since the late Holocene have not altered broad-scale megabiome patterns.
However, certain data–model deviations are evident in specific regions and periods, which could be attributed to systematic climate biases in ESMs or biases in the pollen-based biomization method. For example, at a global scale over the last 21 000 years, the largest deviations between the reconstructions and the simulation ensemble are observed during the LGM and the early deglaciation. These discrepancies are probably attributed to the ESM systematic summer cold biases that overestimate tundra in periglacial regions and to the challenging identification of steppes and tundra from the Tibetan Plateau pollen records. Moderate deviations during the Holocene mainly occur in non-forest megabiomes in the Mediterranean and northern Africa, with increasing discrepancies over time. These deviations may result from the underestimation of woody plant functional type (PFT) cover in simulations due to systematic biases, such as overly warm summers with dry winters in the Mediterranean, and the overrepresentation of woody taxa in reconstructions, misclassifying deserts as savanna in northern Africa.
Overall, our reconstruction, with its relatively high temporal and spatial resolution, serves as a robust dataset for evaluating ESM-based paleo-megabiome simulations and provides potential clues for improving systematic model biases.
- Article
(12565 KB) - Full-text XML
-
Supplement
(21511 KB) - BibTeX
- EndNote


Earth system models (ESMs) that incorporate vegetation dynamics are useful tools for understanding historical simulations and future projections of the composition, structure, and distribution changes of vegetation ecosystems and their responses and feedbacks to climate change (Song et al., 2021; Brierley et al., 2020). However, to assess model biases and further improve these models for obtaining more reliable and reduced uncertainty in future projections, global and long-term paleo-vegetation reconstructions are needed for the evaluation of the vegetation response to climate change (Cao et al., 2019; Dallmeyer et al., 2022). Pollen records, as the most widespread terrestrial paleoecological archives, and their conversion into paleo-vegetation are most suitable for this purpose (Prentice et al., 1996). To date, however, the synthesis of global-scale pollen-based vegetation reconstructions has been limited to selected time slices (i.e., mid-Holocene and Last Glacial Maximum (LGM); Harrison, 2017; Hoogakker et al., 2016), while continuous reconstructions have been limited to specific regions (such as northern and eastern Asia and the extratropical Northern Hemisphere; Tian et al., 2018; Cao et al., 2019). A global view of reconstructed vegetation dynamics and distributions since the LGM with high temporal resolution is still missing.
In a recent effort, we synthesized LegacyPollen 2.0 (Li et al., 2025), a taxonomically and temporally standardized global late Quaternary fossil pollen dataset of 3680 records that covers the main global ecoregions (Herzschuh et al., 2022). In this study, we biomize the LegacyPollen 2.0 dataset for 43 time slices at 500-year intervals throughout the last 21 000 years with a biomization method (Prentice et al., 1996; Prentice and Webb, 1998) that incorporates updated and harmonized pollen taxa–plant functional type–megabiome assignment schemes. For a direct comparison with ESM-simulated vegetation, we assign the reconstructions to the same megabiomes used in the biomization tool for ESM output by Dallmeyer et al. (2019). This paper aims (a) to present megabiome dynamics at the global scale since the LGM, (b) to compare the reconstruction with megabiome simulations from an ensemble of six different transient ESM simulations, and (c) to identify regions and periods with strong data–model mismatches to provide clues for improving systematic model biases.
2.1 Pollen dataset
We expanded the LegacyPollen 1.0 dataset (Herzschuh et al., 2021, 2022) to LegacyPollen 2.0, a taxonomically and temporally standardized global late Quaternary fossil pollen dataset (Fig. A1). The updated dataset comprises 3680 palynological records, approximately 900 more than the previous LegacyPollen 1.0 dataset. Of these new records, 654 were derived from the Neotoma Paleoecology Database (Neotoma hereafter; https://www.neotomadb.org/, last access: 31 August 2022; Williams et al., 2018) and its constituent databases, e.g., the African Pollen Database (APD; Lézine et al., 2021), the European Pollen Database and Alpine Pollen Database (EPD and ALPADABA; Fyfe et al., 2009; Giesecke et al., 2014), and the Latin American Pollen Database (LAPD; Flantua et al., 2015). Also, 52 records from the Abrupt Climate Changes and Environmental Responses (ACER) 1.0 database (Sánchez Goñi et al., 2017a, b), 177 records from the Chinese fossil pollen dataset (Cao et al., 2022; Zhou et al., 2023), and 8 of our own new records (AWI, Alfred Wegener Institute; for a detailed description, see File S1 in the Supplement) were included. A total of 1122 records originate from North America, 1446 originate from Europe, 687 originate from Asia, 187 originate from South America, 159 originate from Africa, and 81 originate from the Indo-Pacific. While there are geographical gaps in pollen record coverage, particularly in the Southern Hemisphere, the dataset LegacyPollen 2.0 covers the world's main vegetation and climate zones.
To improve comparability between pollen records and data quality, we followed the practices recommended by Flantua et al. (2023) for large-scale paleoecological data synthesis when updating the dataset. Specifically, the following key steps were involved: firstly, metadata of pollen records from different data sources were examined to avoid duplicate inclusion; secondly, age–depth models were re-estimated for each record (≥2 radiocarbon dates) using Bacon (Blaauw and Christen, 2011; for a detailed description, see Li et al., 2022); thirdly, pollen morphotypes were harmonized to reduce the effect of taxonomic uncertainty and nomenclatural complexity (i.e. woody taxa and major herbaceous taxa were harmonized to genus level, and other herbaceous taxa were harmonized to family level; for a detailed description, see Herzschuh et al., 2022).
The LegacyPollen 2.0 dataset is archived in the PANGAEA repository (https://doi.org/10.1594/PANGAEA.965907; Li et al., 2025) and is open access. It follows the framework of the LegacyPollen 1.0 dataset (Herzschuh et al., 2021, 2022), providing pollen count and pollen percentage data per continent, a taxa harmonization master table, and site metadata (such as data sources, Dataset ID, site name, location, archive type, site description, and references). To enhance data traceability and ensure high-quality standards, we newly incorporated the Neotoma digital object identifier (DOI) into the metadata for Neotoma-derived records, allowing direct linkage to the living Neotoma database and reducing the risk of data staleness. These DOIs were generated with the doi function from the package neotoma2 (version 1.0.3; Socorro and Goring, 2024) in the R software environment (version 4.4.1; R Core Team, 2023). Additionally, we also newly added the PANGAEA Event (PANGAEA dataset identifier) for each record to ensure that our dataset meets PANGAEA's high standards for quality, usability, and compliance.
2.2 Pollen-based megabiome reconstruction
We converted pollen data from LegacyPollen 2.0 into megabiomes using the biomization method of Prentice et al. (1996). We only analyzed records over the last 21 000 years, resulting in a final megabiome dataset of 55 868 samples at 500-year intervals from 3455 records (Files S1 and S4 in the Supplement). The assignment of pollen taxa to plant functional types (PFTs), the first step required by the biomization procedure, referenced previous biomization schemes on each continent, with some updates and harmonizations based on a globally applicable standardized classification of PFTs (Harrison et al., 2010; Harrison, 2017). The PFTs were then assigned to megabiomes, representing the raw pattern of global vegetation rather than the finer biome categories commonly used in standard biomization studies (Dallmeyer et al., 2019). These megabiomes include tropical forest (TRFO), subtropical forest (WTFO), temperate forest (TEFO), boreal forest (BOFO), (warm) savanna and dry woodland (SAVA), grassland and dry shrubland (STEP), (warm) desert (DESE), and tundra and polar desert (TUND). These categories were also applied to biomize Earth system model results, which generally use different types and numbers of PFTs to represent global vegetation, enabling direct data–model comparisons and evaluations (Dallmeyer et al., 2019). The pollen sample at each target time slice was selected from the time-nearest sample within ±250 years.
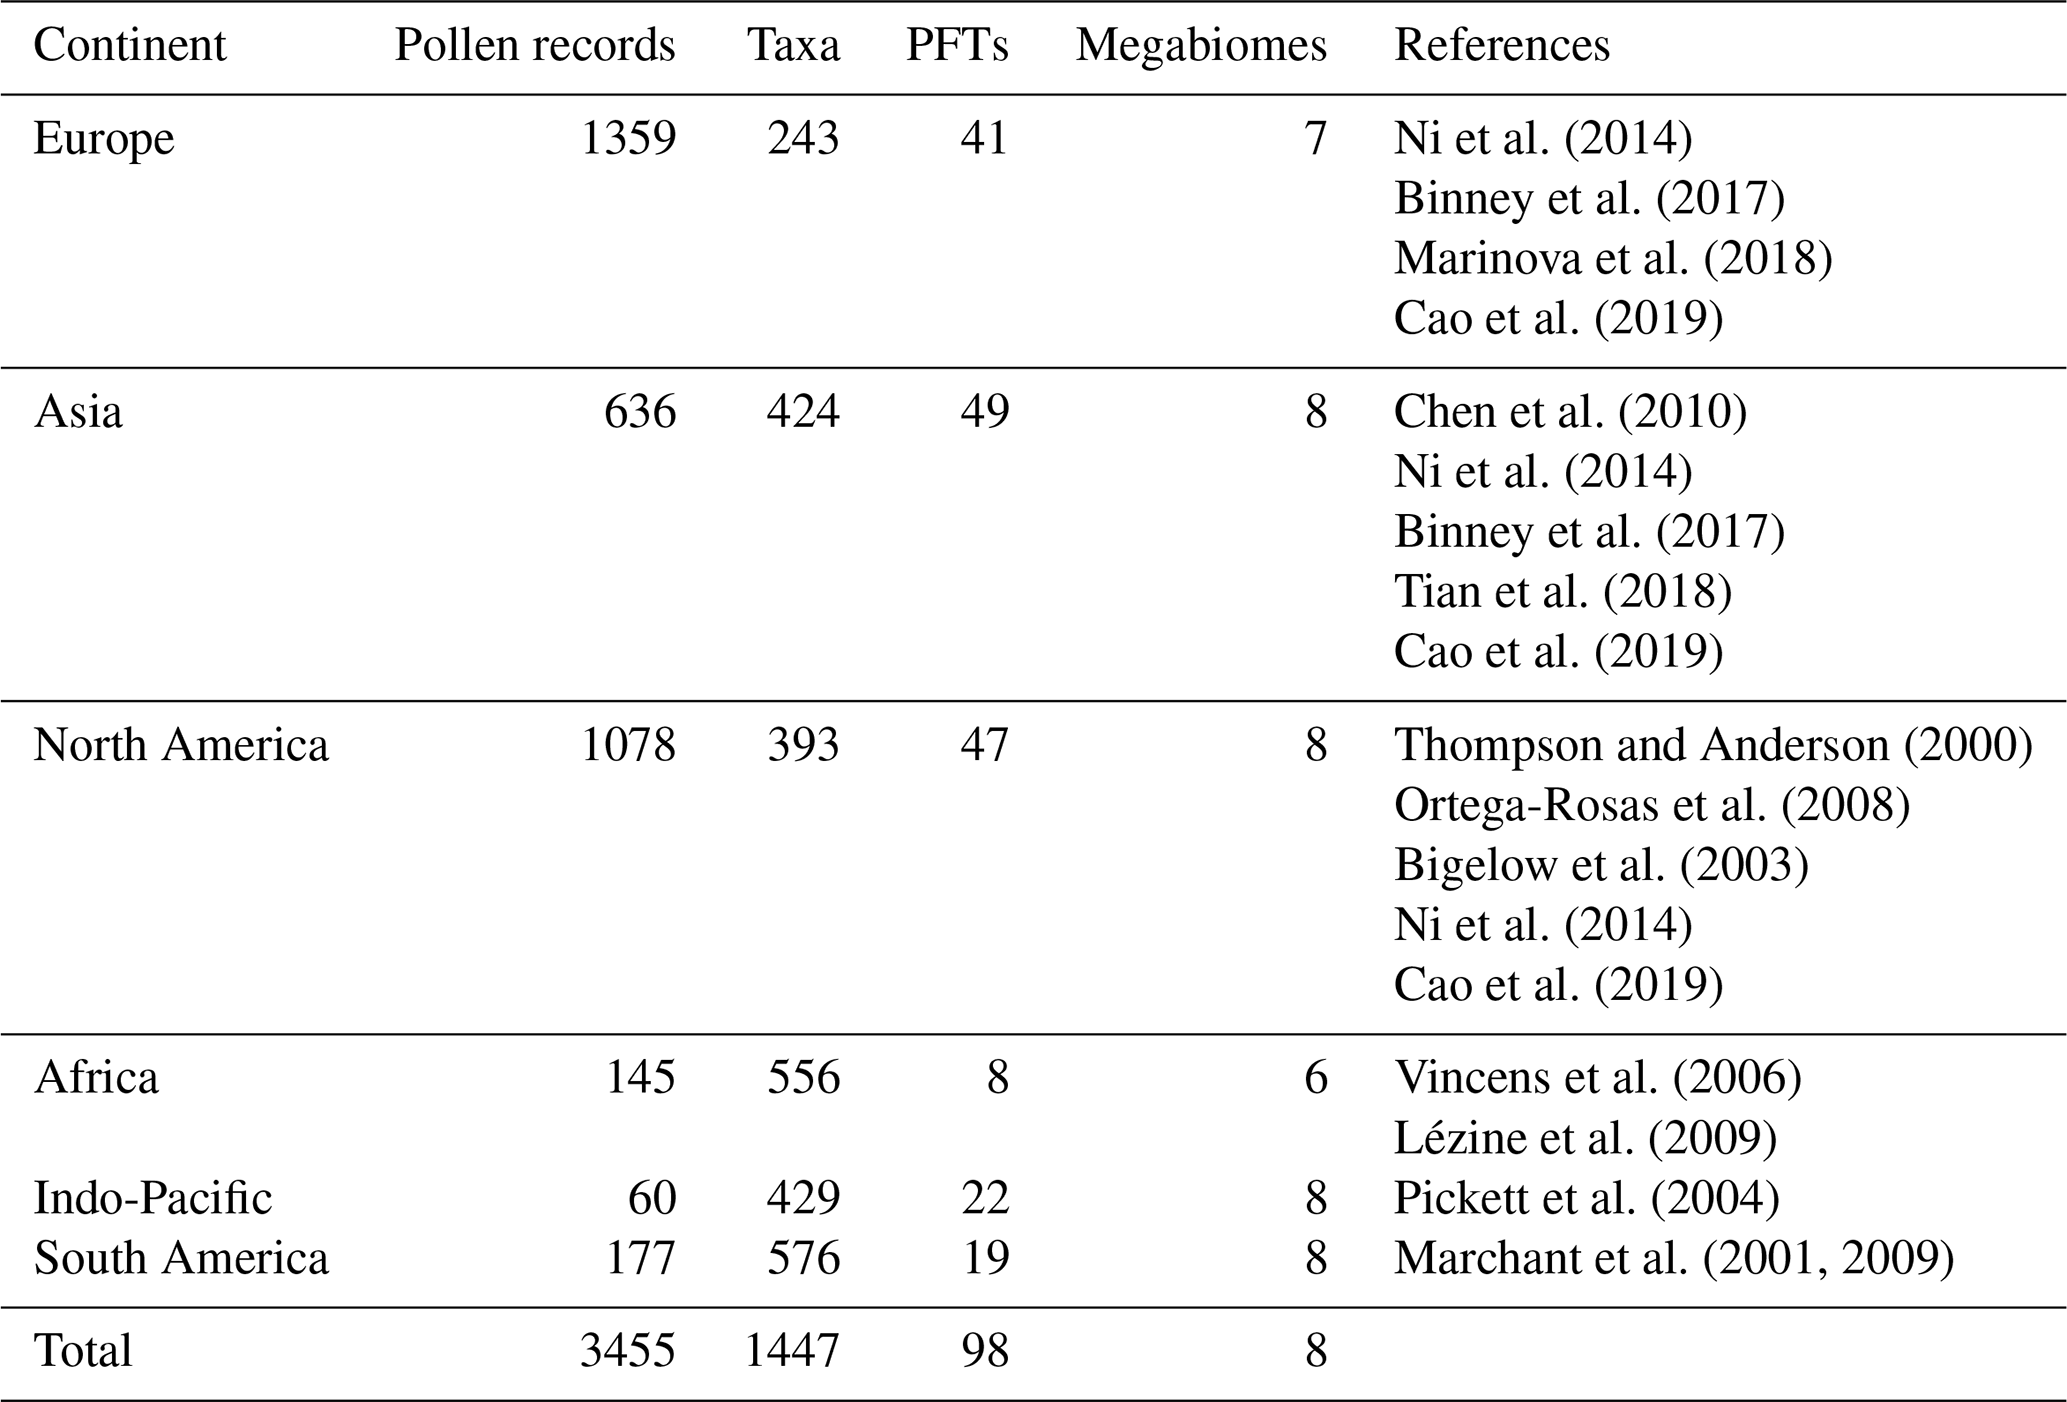
We assigned the 1447 harmonized pollen taxa from the 3455 records to 98 PFTs and then to 8 megabiomes. The pollen abundances of Larix and Pinus were multiplied by factors of 15 and 0.5 (following Bigelow et al., 2003, and Cao et al., 2019), respectively, to compensate to some extent for pollen-productivity-related representativeness issues, prior to calculating affinity scores in the applied biomization routine. When the affinity scores for each megabiome were calculated (see Prentice et al., 1996) for every pollen sample, pollen taxa with less than 0.5 % abundance were excluded to reduce noise resulting from occasional pollen grains derived from long-distance transport or contamination (Prentice et al., 1996; Chen et al., 2010). Finally, the megabiome with the highest affinity score was allocated to each pollen sample, subject to a criterion that the least PFT-rich megabiome takes precedence when the affinity values for two or more megabiomes are identical (following Chen et al., 2010). The biomization affinity scores were calculated using a biomization algorithm implemented in R (Cao and Tian, 2021). Furthermore, the assignment of pollen taxa to megabiomes and biomization routines were performed independently for each continent (Table 1; Files S2 and S3).
Table 1Overview of the number of pollen records, pollen taxa, plant functional types (PFTs), and megabiomes used in the biomization procedures, along with references to used biomization schemes by continents. The lists of taxa–PFT and PFT–megabiome assignments are available in Files S2 and S3.
2.3 Transient ESM-based simulations with dynamic vegetation
We use six transient simulations for the last 21 000 years performed with Earth system models with fully coupled dynamic vegetation. Among these are two simulations conducted with the Max Planck Institute Earth System Model (MPI-ESM; Mauritsen et al., 2019), further referred to as MPI-ESM_GLAC1D (Dallmeyer et al., 2022) and MPI-ESM_ICE6G (Ice6G_P2 in Kapsch et al., 2022, and Mikolajewicz et al., 2023). Besides differences in the model version and tuning, these simulations differ in particular with respect to the prescribed ice-sheet history, using either the GLAC-1D (Tarasov et al., 2012) or ICE-6G (Peltier et al., 2015) reconstruction. Both simulations ran at the spatial resolution T31 (∼ 3.75° × 3.75° on a Gaussian grid) for the atmosphere and land model. Orbital forcing was prescribed from Berger (1978), and greenhouse gas (GHG) forcings were prescribed from Köhler et al. (2017). Bathymetry, topography, and river routing were continuously updated in 10-year intervals. The meltwater flux from the Laurentide ice sheet was modified in the period of 15.2–11.8 cal ka BP (calibrated 1000 years before present, where “present” is 1950 CE) in the simulation MPI-ESM-GLAC1D, mimicking the meltwater storage and release from proglacial lakes and thus more realistically simulate the Younger Dryas event (see Dallmeyer et al., 2022).
In addition, the set of simulations includes the full-forcing TRACE-21K-I (see Liu et al., 2009) and TRACE-21K-II (see He and Clark, 2022) simulations performed with the Community Climate Model version 3 (CCSM3; Collins et al., 2006) forced with variations in insolation (Berger, 1978), GHG concentration (Joos and Spahni, 2008), and continental ice sheets from the ICE5G reconstructions (Peltier, 2004). TRACE-21K-II was based on the protocol of prescribing the reconstructed Atlantic meridional overturning circulation (AMOC) for the Bølling–Allerød interstadial (∼ 14.7–12.9 cal ka BP) and the Holocene instead of the reconstructed freshwater forcing, while, in TRACE-21K-I, the AMOC was forced by the meltwater flux to the North Atlantic and the Gulf of Mexico during the entire simulation. Similarly to the MPI-ESM simulations, the TRACE-21K simulations ran at a spatial resolution of T31 (∼ 3.75° × 3.75° on a Gaussian grid).
The set of simulations contains two simulations performed with the fast Earth System model CLIMBER-X (Willeit and Ganopolski, 2016; Willeit et al., 2022, 2023) at a spatial resolution of 5° × 5°. These simulations were both performed in an identical setup (similar to Masoum et al., 2024) but with different ice-sheet and surface topography forcings (GLAC-1D or ICE-6G reconstructions; Peltier et al., 2015; Tarasov et al., 2012). GHG and insolation were prescribed from Köhler et al. (2017) and Laskar et al. (2004), respectively.
All paleoclimate simulations have been aggregated to time series of 100-year monthly climatological means. The first time slice at 21 cal ka BP is an average of the years 21 099–21 000 years before present (where “present” is 1950 CE), and the last time slice at 0 cal ka BP is an average of the years 99–0 years before present.
The dynamic vegetation in all models is represented by different sets of plant functional types (PFTs) that can coexist in the grid cells. The occurrence of each PFT is constrained by fixed temperature thresholds, and the dynamics of PFT cover fraction depend, for instance, on the moisture availability and plant requirements. Disturbances such as fire, which are already coupled in the dynamic vegetation modules, regularly reduce the coverage of tree and shrub PFTs while promoting the expansion of herbaceous PFTs (Burton et al., 2019; Reick et al., 2021; Dallmeyer et al., 2022). Land use is not included in any of these simulations.
The PFT distributions are converted into the same eight megabiomes used in the reconstructions by applying the tool of Dallmeyer et al. (2019). This tool converts the simulated PFT distributions based on assumptions of the minimum PFT cover fractions that are needed for the assignment of steppe/tundra or forest biomes and bioclimatic constraints derived from 2 m surface temperature distributions to distinguish different forest biomes (for a detailed description, see Dallmeyer et al., 2019). These constraints largely adhere to the limitation rules used in the classical biome models such as BIOME4 (Kaplan et al., 2003).
We assigned the simulated megabiome data taken from the grid cells where the records are located to each record, and we only considered locations and time slices for which reconstructions are available (Files S4–S6). As representatives of the simulation ensemble, we choose the megabiome that occurs most frequently in the set of simulations for each record and time slice, further referred to as the ESM-representative megabiome. When the highest-frequency megabiomes were not unique, we applied the criterion used in pollen-based reconstructions, giving precedence to the highest-frequency megabiome with the fewest PFTs and taxa.
2.4 Evaluation with modern climate and potential natural vegetation
Modern observational climate data provide a crucial foundation for the assessment of climate simulations. The Climatic Research Unit gridded Time Series (CRU TS hereafter), version 4.08, is a widely used modern observational climate dataset covering all land domains of the world except Antarctica (spatial resolution: ∼ 0.5° × 0.5° on a Gaussian grid; Harris et al., 2020). The CRU TS dataset is interpolated from extensive networks of weather station observations and provides monthly temperature and precipitation data from 1901–2023 CE. However, the early records (i.e.,< 1930 CE) of this dataset may have high uncertainty due to sparser observation networks (Duan et al., 2024), and the late records (i.e., > 1970 CE) are strongly influenced by anthropogenic CO2 increases (Cheng et al., 2022). We therefore selected monthly climatological means from 1931–1970 to generate more biologically meaningful bioclimatic variables for evaluating climate simulations at 0 cal ka BP (O'Donnell and Ignizio, 2012; File S7). These bioclimatic variables represent extreme or limiting environmental factors, namely mean temperature of the warmest quarter (Tcold), mean temperature of the coldest quarter (Tcold), precipitation of the warmest quarter (Pwarm), and precipitation of the coldest quarter (Pcold). Temperature is given in degrees Celsius (°C), precipitation is given in millimeters (mm), and a quarter is a period of 3 consecutive months (one-quarter of the year).
Modern vegetation distributions are required to validate the performance of pollen-based megabiome reconstructions and ESM-based megabiome simulations. However, the simulations used here only determine potential natural vegetation in a quasi-equilibrium with climate, whereas the pollen-based reconstruction of modern vegetation also incorporates anthropogenic disturbances. Therefore, the modern potential natural vegetation distributions are used for validation, allowing us to evaluate not only the level of modern anthropogenic disturbance to natural vegetation in the pollen-based reconstructions but also simulation biases. For this purpose, we employed the modern potential natural vegetation distribution (spatial resolution: 5 arcmin) provided by Ramankutty et al. (2010). It represents the world's vegetation cover that would have most likely existed for 1986–1995 CE in equilibrium with present-day climate and natural disturbances in the absence of human activities (Ramankutty and Foley, 1999). To allow direct comparisons between reconstructions and simulations and among simulations at the hemispheric or continental scales, we aggregated the modern potential natural vegetation types into modern potential megabiomes (Fig. 1) following Dallmeyer et al. (2019).
To assess the accuracy of the pollen-based reconstructions and ESM-based simulations, we calculated the proportion of records where reconstructed or simulated megabiomes at time slice 0 cal ka BP match these modern potential megabiomes. For each record, the simulated (most representative) megabiome at time slice 0 cal ka BP and the modern potential megabiome were extracted from the grid cells in which the record is located.
2.5 Methods for comparison of the simulated and reconstructed megabiome datasets
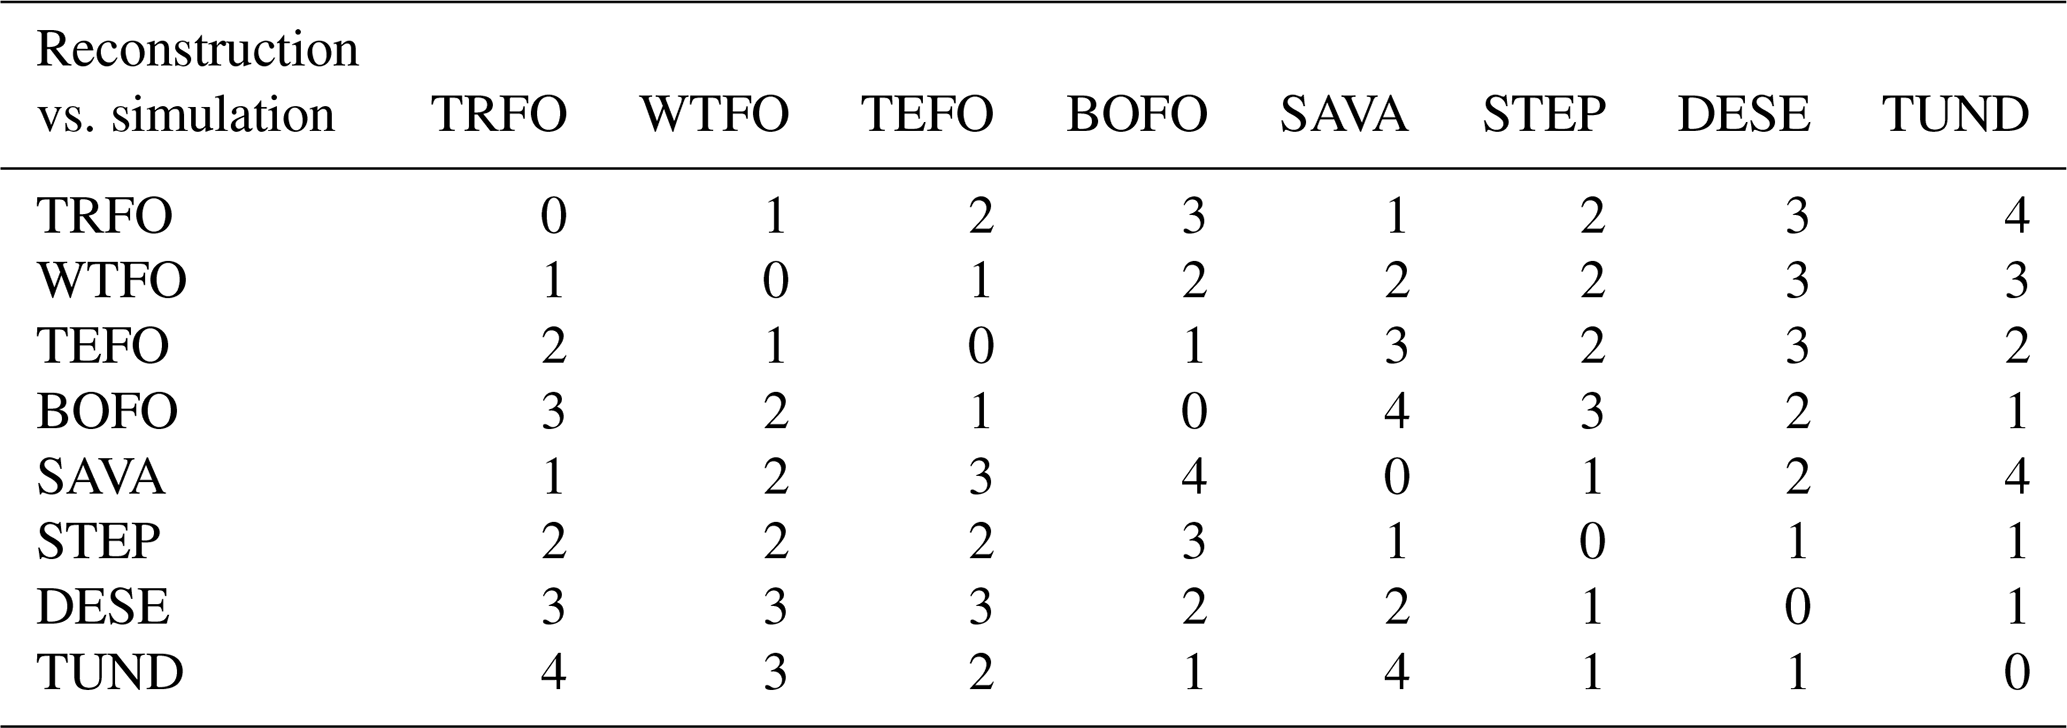
The Earth mover's distance (EMD), which takes into account the uncertainties of the biomized data and case-specific weighted distances (Chevalier et al., 2023b), was applied to quantify the mismatch between the pollen-based reconstructions and the ESM-based simulation ensemble at each record. Specifically, the EMD calculates the distance between the reconstruction and the simulation ensemble by considering the entire range of megabiome affinity scores. This means that the details of the underlying vegetation structure are part of the comparison, in contrast to commonly used methods that solely compare the megabiome with the highest affinity score estimated from the reconstructions or simulations. To match the distribution of megabiome scores obtained from biomization algorithms, we translated the frequencies of the six simulated megabiomes into a simulated megabiome affinity score set. For example, for an ensemble of simulations with two boreal forests and four temperate forests in its six simulations, the affinity scores for the boreal and temperate forests would be 2/6 and 4/6, respectively, while the affinity scores for the remaining megabiomes would be zero. In addition, we adapted the ecological and climatic distance-based (Allen et al., 2020) EMD weighting scheme from Chevalier et al. (2023b) to penalize mismatches between the reconstructions and the simulation ensemble in terms of differences in vegetation structure (i.e., forest megabiomes, non-forest megabiomes, and deserts) and climate zone preferences (i.e., tropical, subtropical, temperate, boreal, and polar regions) (Table 2). Following this approach, we assume that the basal distance between two different megabiomes with the same vegetation structure and climate zone is set to 1. Each difference in vegetation structure or climate zone adds an extra weight of 1. For example, the reconstructed tropical forest has a distance weight of 2 from the simulated temperate forest and 3 from the simulated boreal forest. The EMD routines were implemented by using the paleotools R package (version 0.1.0; Chevalier, 2023a).
Table 2Earth mover's distance (EMD) weighting scheme for ecological and climatic distances between the pollen-based reconstructed and simulated megabiomes used in this study. Higher values in the table indicate a greater ecological or climatic distance between the reconstructed and simulated megabiomes. The megabiome code is as follows. TRFO: tropical forest; WTFO: subtropical forest; TEFO: temperate forest; BOFO: boreal forest; SAVA: (warm) savanna and dry woodland; STEP: grassland and dry shrubland; DESE: (warm) desert; TUND: tundra and polar desert. Of these, TRFO, WTFO, TEFO, and BOFO are forest megabiomes, whereas the others are non-forest megabiomes.
We aggregated the records into regular longitude–latitude grid cells of size 3.75° × 3.75° to reduce the sampling bias from the non-uniform spatial distribution of records and to facilitate a more direct model–data comparison. At each time slice, the reconstructed or simulated megabiome assigned to a grid cell was determined based on the most frequently occurring megabiome among the available records in that grid cell. When multiple megabiomes had the same highest frequency, we applied the same criterion used in pollen-based reconstructions, prioritizing the highest-frequency megabiome with the fewest PFTs and taxa. Similarly, the data–model EMDs for each grid cell were derived as the median EMDs of the available records within that grid cell.
To cluster the regions, we performed the dynamic time warping with the time series of the data–model EMDs of all grid cells on each continent, allowing time series to be grouped based on their patterns or shapes (Müller et al., 2007). The number of clusters was determined using the elbow method (Syakur et al., 2018) and adjusted based on the sample availability. The global data–model EMD time series, representing the global mean dynamics, was then synthesized from the median EMDs for each clustered region. The dynamic time warping algorithm was implemented by using the TSclust R package (version 1.3.1; Montero and Vilar, 2015).
3.1 Evaluation of megabiome reconstructions and simulations for the present day
3.1.1 Pollen-based reconstructions
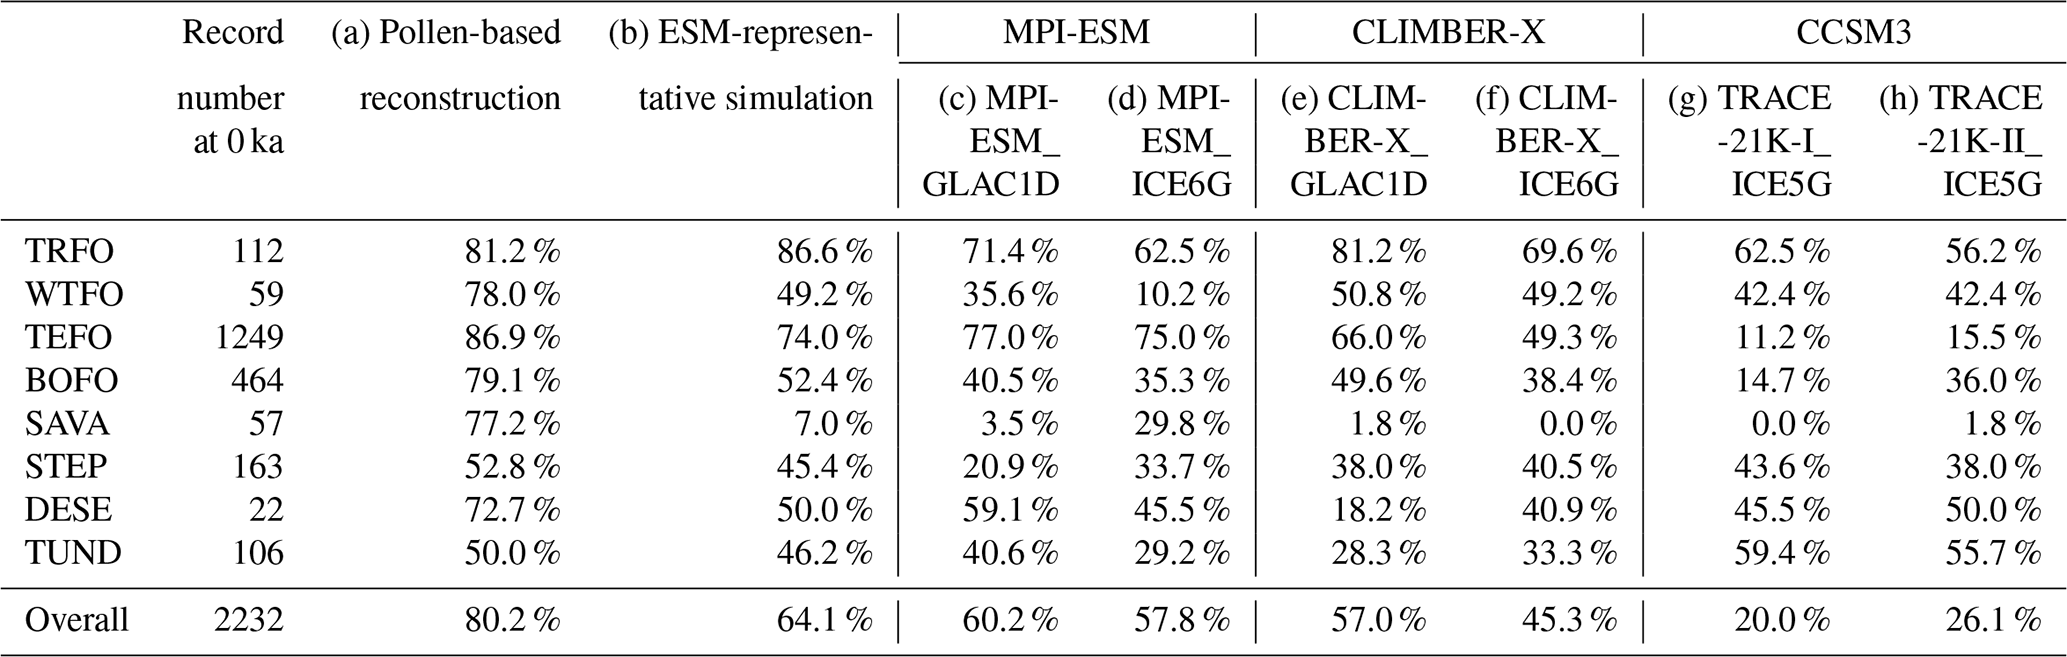
We consider global-scale, pollen-based megabiome reconstructions to be reliable, as record-by-record comparisons of reconstructed megabiomes at time slice 0 cal ka BP from 2232 available records with modern potential megabiomes indicate an 80.2 % agreement (Table 3). This consistency exceeds that reported in previous large-scale biomization studies validated against modern biome distributions, such as the 53 % agreement at Arctic high latitudes (> 55° N) by Bigelow et al. (2003). We attribute this high agreement not only to the high quality of the pollen dataset, particularly in terms of taxonomic and temporal harmonization, but also to the biomization method that employs updated and harmonized schemes assigning pollen taxa to plant functional types to megabiomes. Additionally, our reconstruction was conducted at the megabiome level, a coarser classification than typical biomes, which somewhat reduces mismatches between geographically adjacent biomes. For instance, the biomes of temperate deciduous forest and cool mixed forest are often intermingled in Binney et al. (2017), whereas, at the megabiome level, both are classified as temperate forests, eliminating this discrepancy. Although some regional-scale biomization studies achieve even higher agreement with modern biome distributions, such as the 97.5 % accuracy in the Congo Basin reported by Lebamba et al. (2009), these studies typically rely on more localized datasets with tailored taxa–PFT–biome schemes. Moreover, not all megabiomes were reconstructed with the same level of accuracy in our study; for example, TUND and STEP exhibit only ∼ 50 % agreement (Table 3), which is similar to previous biomization studies. Overall, we argue that both the data quality and the higher spatial and temporal coverage compared to previous biomization studies (Bigelow et al., 2003; Marinova et al., 2018) make our pollen-based megabiome reconstruction a robust dataset for various applications, such as global-scale evaluation of paleo-simulations from Earth system models (ESMs).
Table 3Agreement of modern potential megabiomes, aggregated from modern potential natural vegetation, with (a) pollen-based reconstructions and (b–h) simulations at 0 cal ka BP. We use a set of six transient simulations that have been run in an Earth system model: (c–d) MPI-ESM (MPI-ESM_GLAC1D, MPI-ESM_ICE6G), (e–f) CLIMBER-X (CLIMBER-X_GLAC1D, CLIMBER-X_ICE6G), and (g–h) CCSM3 (TRACE-21K-I_ICE5G, TRACE-21K-II_ICE5G), as well as (b) the ESM-representative megabiomes that occur most frequently in the set of simulations. The megabiome codes are given in Table 2.
Several factors may contribute to the incorrect reconstruction of modern potential megabiomes in our study (Fig. 1). (a) The different pollen representation (including production, dispersion, and preservation) of plant taxa is the principal reason for inadequate separation of forest and open landscape ecotones. For example, the high pollen productivity of key taxa (such as Artemisia; Xu et al., 2014) results in an overestimation of grasslands and dry shrublands (STEP) in the East Asian summer monsoon northern marginal zone and the Great Plains of North America. Studies on pollen productivity and dispersal ability to date are mostly limited to a few taxa in northern central Europe and China (Wieczorek and Herzschuh, 2020), which limits large-scale calibration of pollen representation. (b) The low taxonomic resolution could also cause mismatches between neighboring forest megabiomes and between tundra (TUND) and grassland (STEP). Woody taxa have been harmonized to the genus level rather than the species level, while herbaceous taxa are generally harmonized to the family level, except for common taxa like Artemisia, Thalictrum, and Rumex. This reduces the ecological information available for PFT assignment (Chen et al., 2010). For instance, different species within Pinus, Alnus, Fagus, and Betula (Tian et al., 2018) have different bioclimatic controls, phenology, and life forms, but identification at the genus level results in them being shared by key PFTs in different forest megabiomes (e.g., WTFO vs. TEFO, TEFO vs. BOFO) when assigning taxa to PFTs. One of the typical areas in which this problem occurs is southern Scandinavia. Pollen grains from Betula pendula in temperate forests and Betula pubescens in boreal forests (Beck et al., 2016) in this region can only be identified to genus level, resulting in these two key species not being good indicators of temperate and boreal forests. Similarly, TUND may have been misrepresented as STEP on the Tibetan Plateau. This misrepresentation can be attributed to their share of dominant characteristic taxa within Poaceae and Cyperaceae. However, STEP is defined by fewer PFTs and is therefore preferentially allocated to samples. In contrast, woody PFTs are generally not defined in STEP, leading to a potential misallocation to TUND rather than STEP in cases of woody pollen grain occurrences (from long-distance transportation or local existence) in open-landscape samples (Marinova et al., 2018; Chen et al., 2010), such as mismatches in southern Europe. (c) Anthropogenic modification of pollen assemblages has, to some extent, contributed to mismatches in forested areas. For example, incorrectly reconstructed grasslands and dry shrublands (STEP) in northern China may reflect intensive land use (e.g., deforestation). However, the modern anthropogenic megabiomes are not well reconstructed at a broad spatial scale here, as with previous studies (Ni et al., 2014; Cao et al., 2022). We suggest that this may be related to the absence of anthropogenic PFTs and megabiomes in our taxa–PFT–megabiome assignment schemes, the difficulty in distinguishing between anthropogenic and non-anthropogenic pollen when using genus or family levels (e.g., Poaceae, Rosaceae), and pollen samples generally being collected from records with less human disturbance.
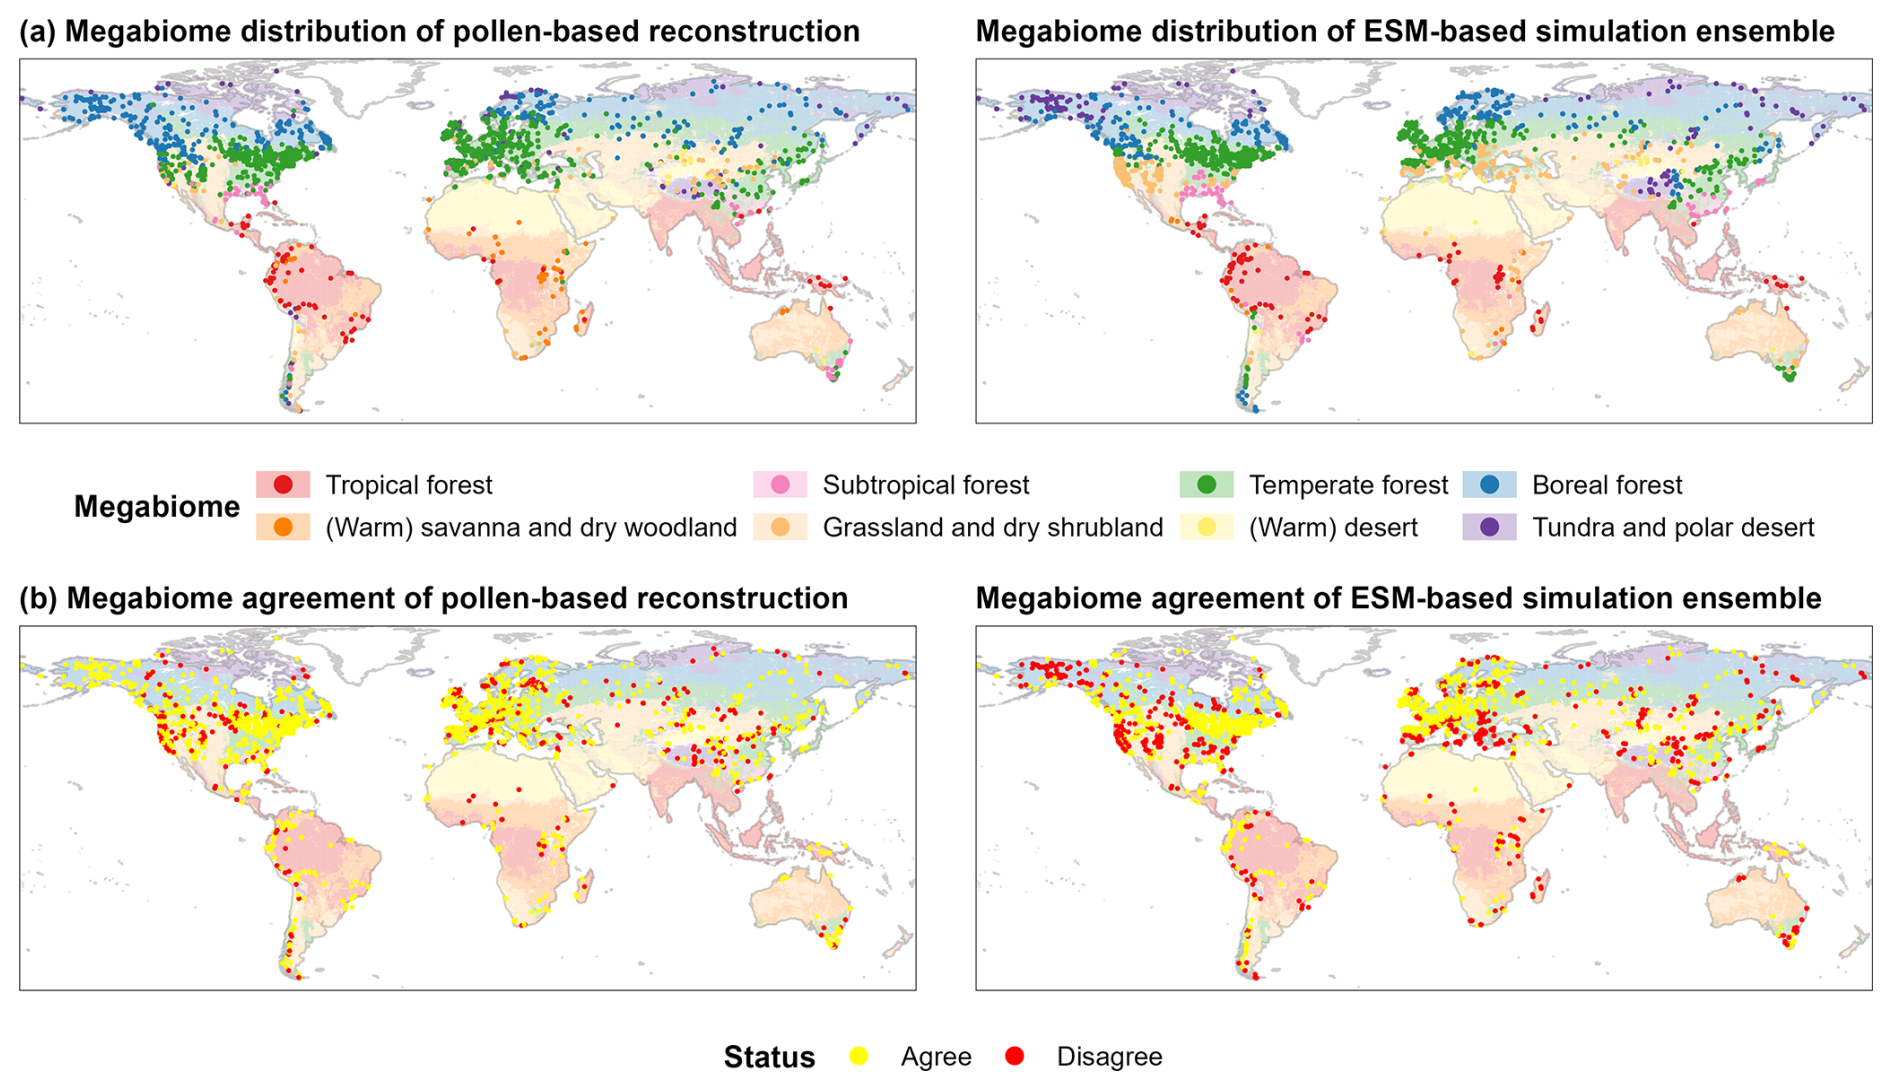
Figure 1Spatial patterns of megabiome distributions at 0 cal ka BP (a) and their agreement with modern potential natural megabiomes (b) for each record derived from the pollen-based reconstruction and the ESM-based simulation ensemble. Shown here are the ESM-representative megabiomes that occur most frequently in the set of simulations. The background depicts modern potential megabiomes (Dallmeyer et al., 2019) aggregated from modern potential natural vegetation (spatial resolution: 5 arcmin; Ramankutty and Foley, 1999; Ramankutty et al., 2010), representing the world's vegetation cover that most likely existed for 1986–1995 CE in equilibrium with present-day climate and natural disturbance in the absence of human activities.
3.1.2 ESM-based simulations
The agreement between modern potential megabiomes and simulated megabiomes at time slice 0 cal ka BP is higher for the ESM-representative megabiome (see Sect. 2.3) than for individual ESM-based simulations (64.1 % vs. 20.0 %–60.2 %; Table 3). As a result, the ESM-representative megabiome depicts more reliable patterns of megabiome dynamics and distribution than individual simulations, with higher agreement especially in Alaska, the Iberian Peninsula, the Alps, the Atlantic Coastal Plain of North America, and the southeastern United States (Figs. 1 and A2). However, there are still certain regions with low agreement, probably due to climatic biases. These include nearly all highlands (such as the central southern Rocky Mountains, the central Andes, and the Tibetan Plateau) for which an overestimation of the temperature can be expected in the models due to a much lower orography than in reality caused by the smoothing in the coarse spatial resolution (3.75° × 3.75° and 5° × 5°) of the model grids (Fig. A3a–b). All models simulate non-forest megabiomes instead of forest in the Mediterranean region, which can be attributed to the models simulating a climate that is too seasonally dry, with, for example, summers that are too warm and winters that are too dry (Fig. A3a, d). Both the TRACE-21K simulation and the MPI-ESM simulations fail to reproduce the boreal forest (BOFO) in Alaska, which is then also reflected in the ESM-representative megabiomes. This failure is likely due to the simulated climate being too cold in this region, preventing the establishment of boreal forests under modeled conditions (Fig. A3a, d). Similarly to the reconstructions, the transition zones between temperate forest (TEFO) and non-forest megabiomes, such as the East Asian summer monsoon margin, are regions with lower simulated megabiome agreement to the modern potential megabiome distribution. In northern Africa, the models also tend to underestimate the northern extension of the grassland and dry shrubland (STEP) and incorrectly assign (warm) savanna and dry woodland (SAVA) records to tropical forest (TRFO). This is related to the biomization procedure for the model results that only relies on simulated vegetation cover fractions and simulated climate, whereas savannas are additionally determined by other ecological processes such as fire intensity and frequency (Dallmeyer et al., 2019) or grazing (van Langevelde et al., 2019).
3.2 Global megabiome dynamics and distributions over the last 21 000 years
We present a global assessment of megabiome dynamics and distributions derived from pollen-based reconstructions and ESM-based simulations over the last 21 000 years, with a temporal resolution of 500 years. Overall, there has been a global shift from open glacial non-forest megabiomes to Holocene forest megabiomes since the LGM (Fig. 2), in line with the general climate warming trend and continental ice-sheet retreat (Fig. 3):
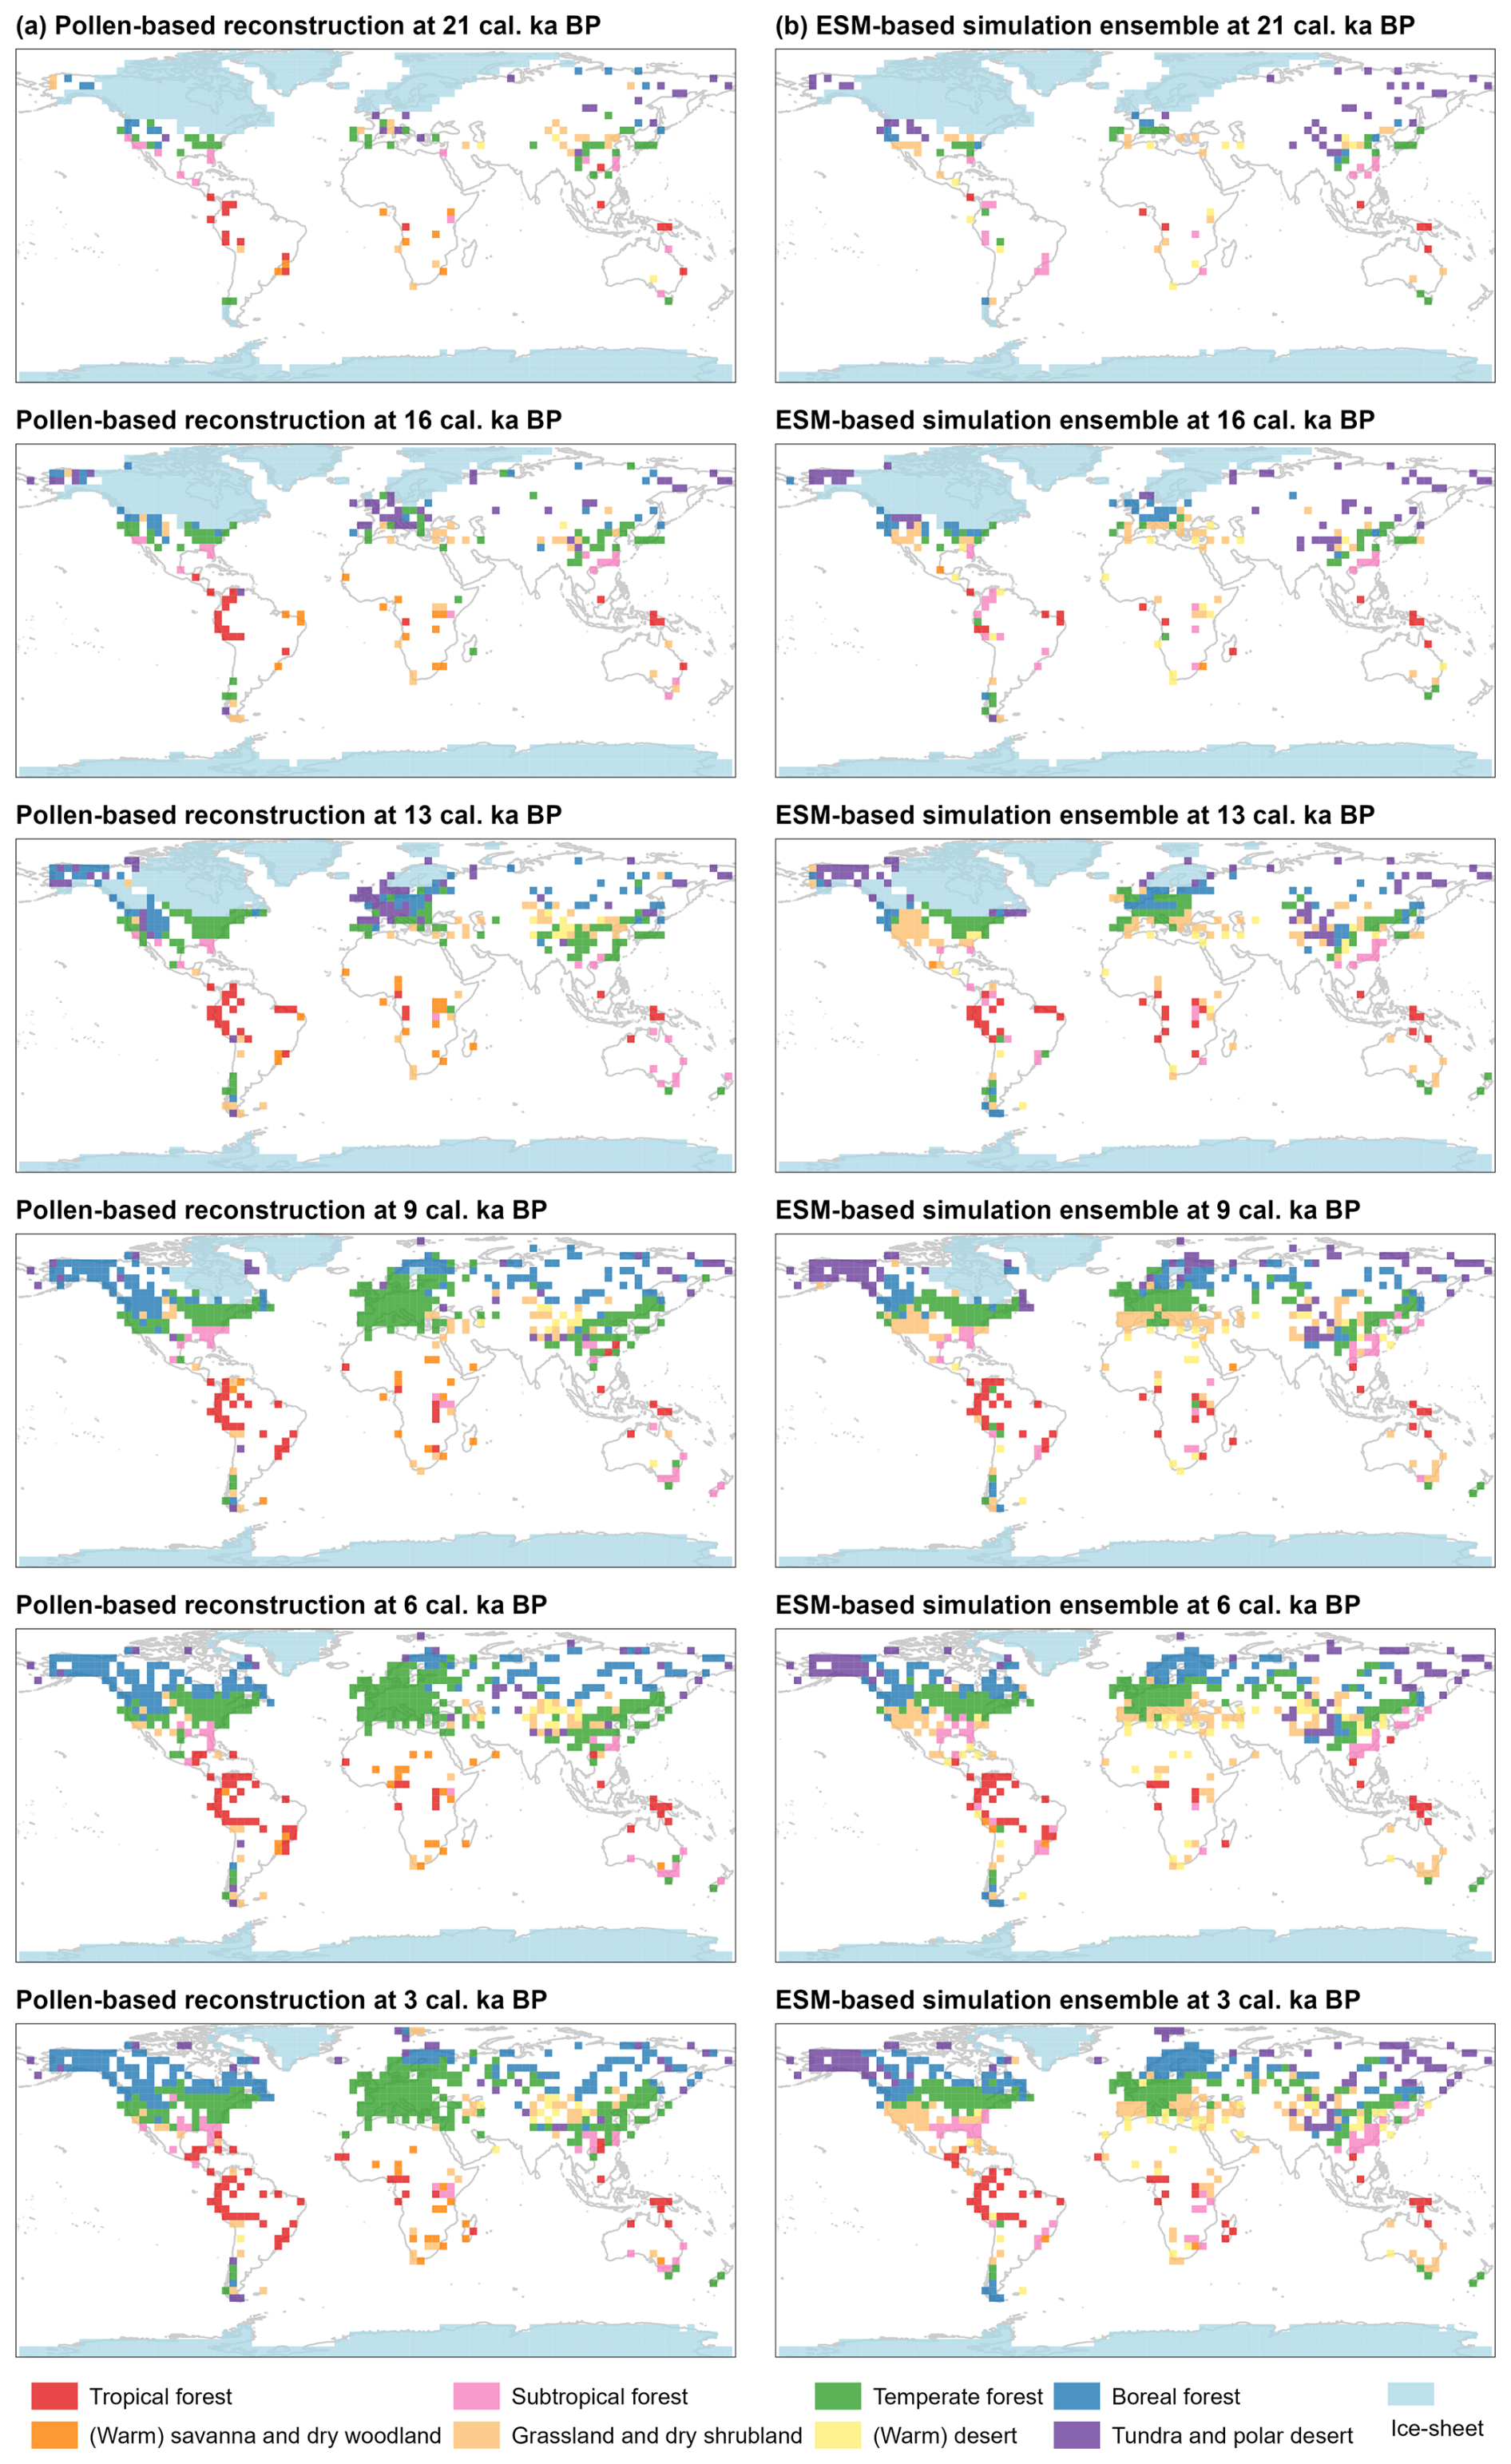
Figure 2Spatial distributions of megabiomes, derived from (a) the pollen-based reconstruction and (b) the ESM-based simulation ensemble, as well as the ice-sheet ensemble, at 21, 16, 13, 9, 6, and 3 cal ka BP based on grid cells of 3.75° × 3.75°. Shown here are the ESM-representative megabiomes that occur most frequently in the set of simulations. The ice sheets are shown at their maximum extent at time slices synthesized for the ICE-5G (Peltier, 2004), ICE-6G (Peltier et al., 2015), and GLAC-1D (Tarasov et al., 2012) reconstructions.
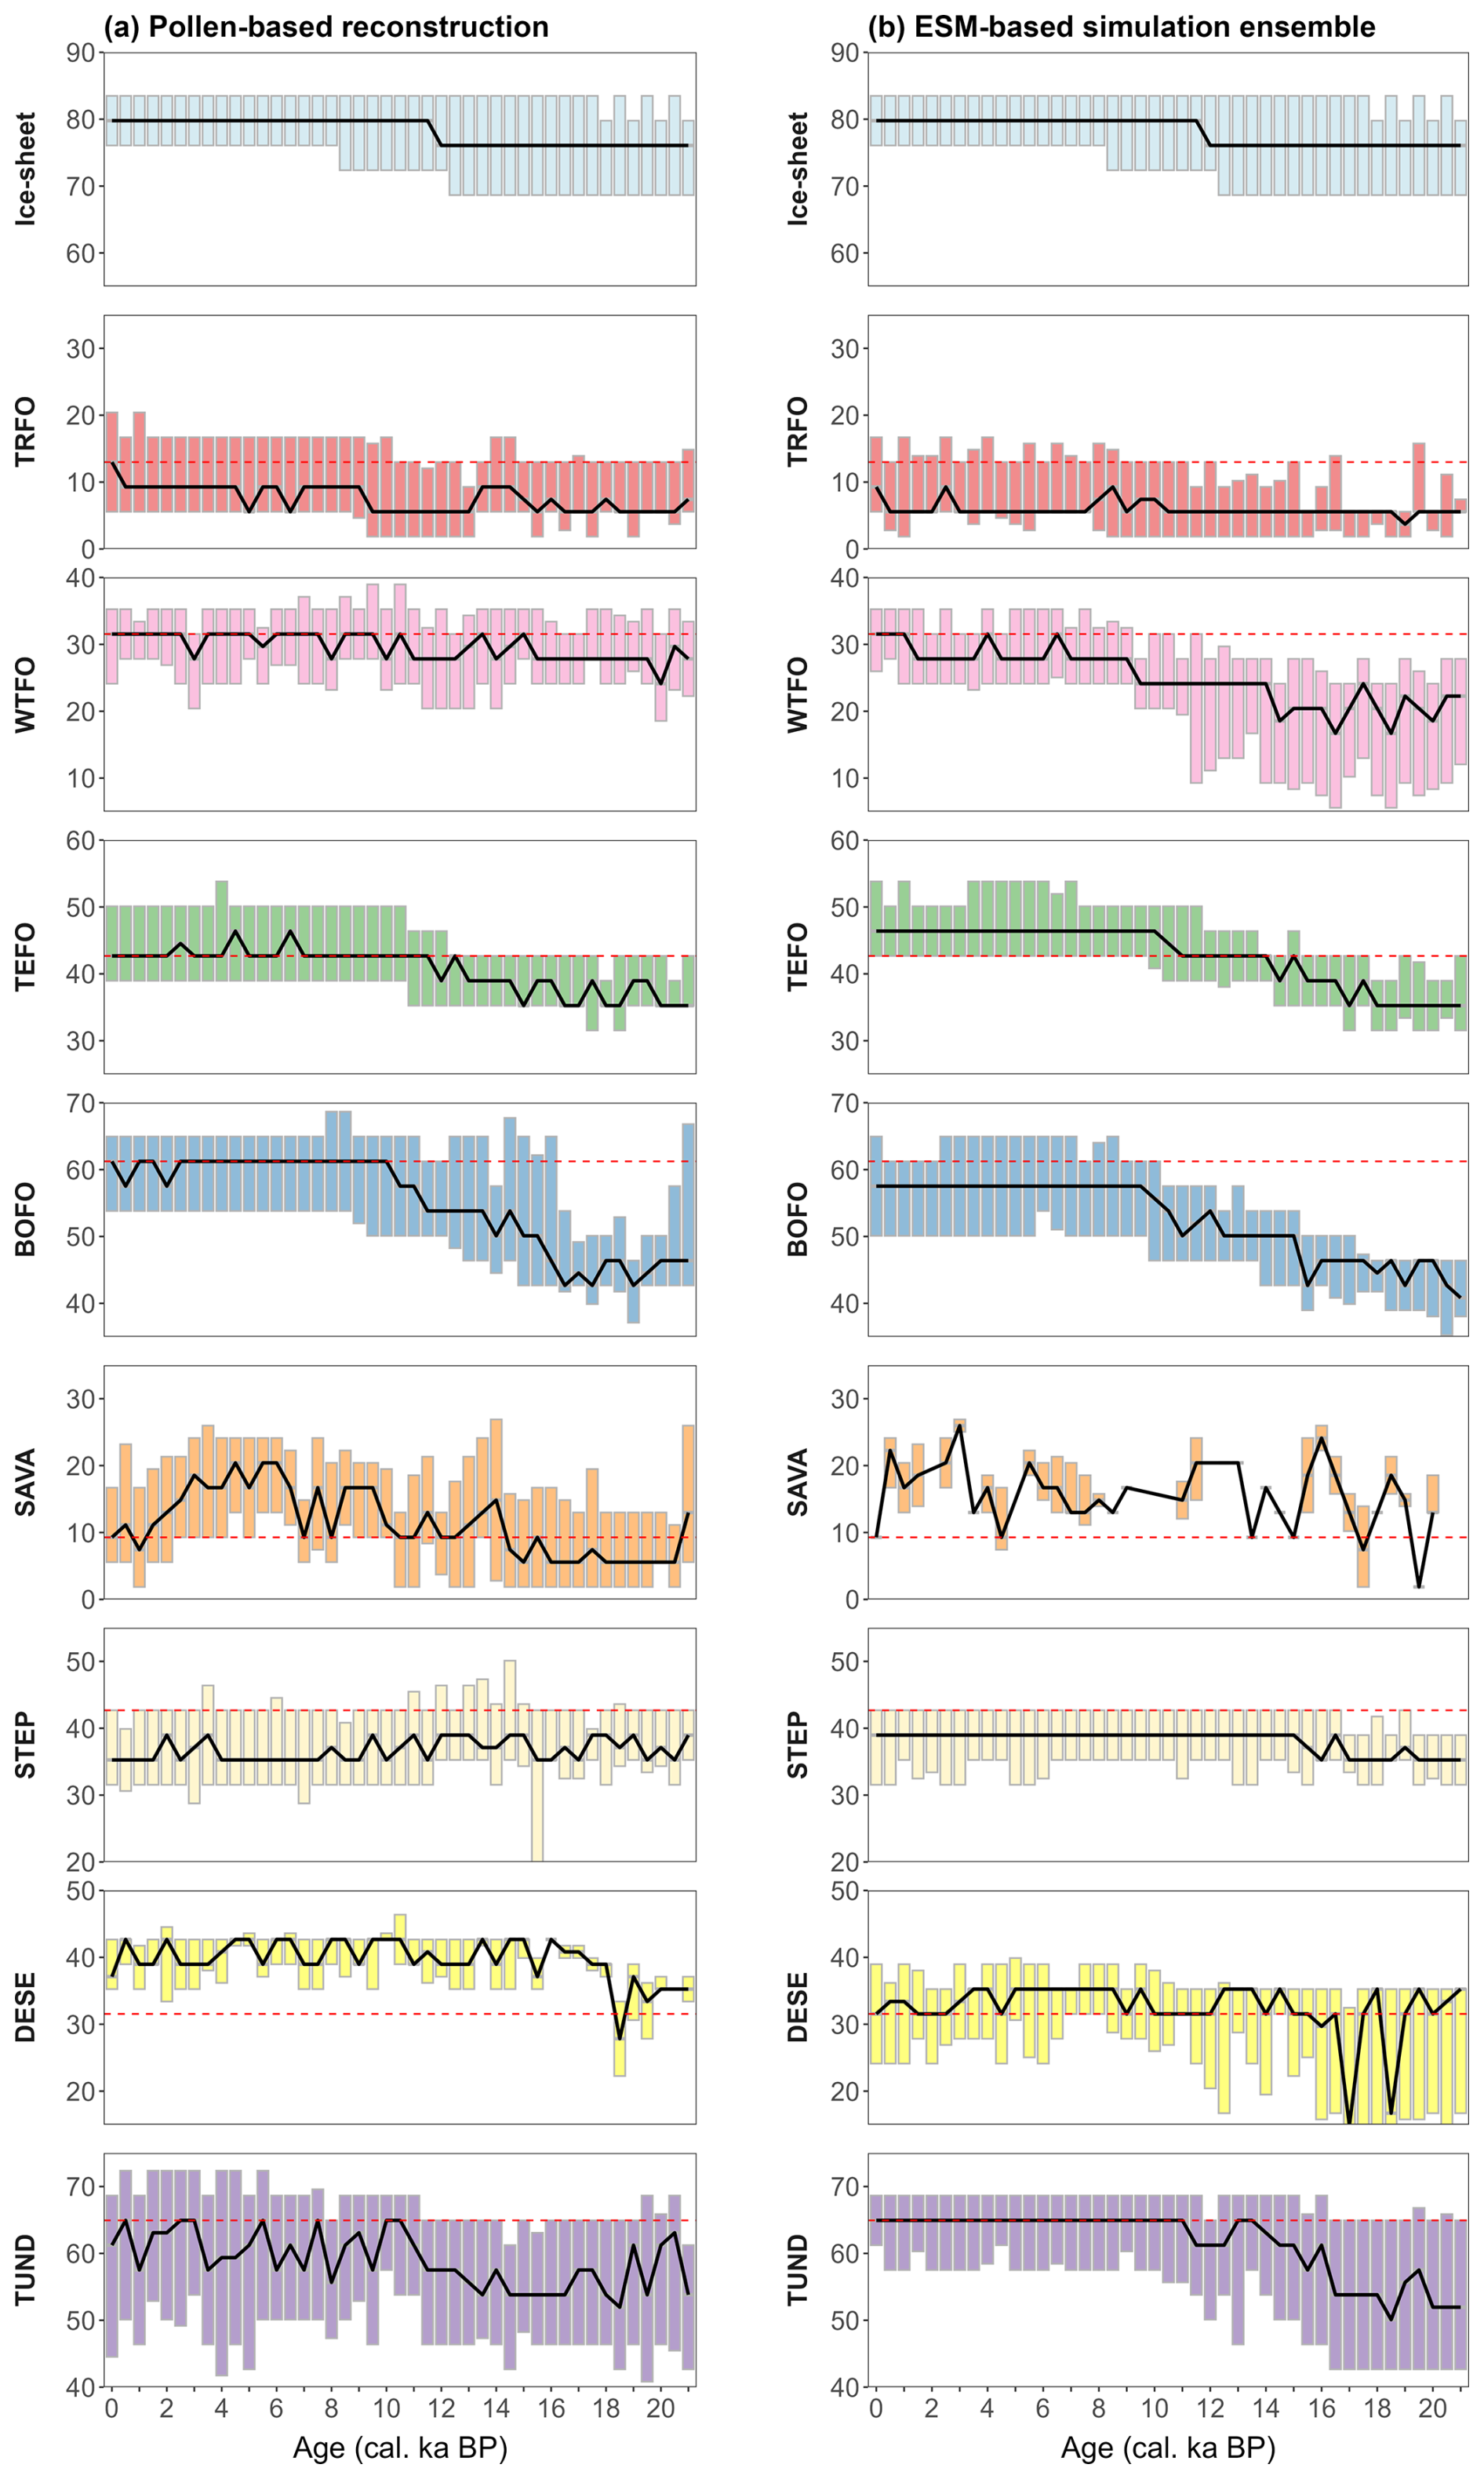
Figure 3Temporal changes in the latitudinal location (°) of each megabiome, derived from (a) the pollen-based reconstruction and (b) the ESM-based simulation ensemble, as well as the ice-sheet ensemble, based on grid cells of 3.75° × 3.75° over the last 21 000 years globally. The dashed red lines are the median latitudinal location of the corresponding modern potential megabiomes, derived from grid cells including pollen samples at 0 cal ka BP. The solid black line represents the median latitude for each time slice, while the top and lower boundaries of each box represent the upper and lower quartiles of latitude distribution for that time slice. The megabiome code is as follows. TRFO: tropical forest; WTFO: subtropical forest; TEFO: temperate forest; BOFO: boreal forest; SAVA: (warm) savanna and dry woodland; STEP: grassland and dry shrubland; DESE: (warm) desert; TUND: tundra and polar desert.
-
LGM (represented by the time slice 21 cal ka BP). TUND and BOFO dominate the high latitudes and periglacial areas (similar to Prentice et al., 2000), whereas the relatively warm forest megabiomes (e.g., WTFO and TEFO) are distributed at lower latitudes than in the present day, in response to cold and dry climates (Nolan et al., 2018). However, the ESM-representative megabiome (simulations hereafter in this subsection) reveals more non-forest megabiomes (such as TUND and STEP) in periglacial areas of North America (e.g., Alaska and the Rocky Mountains) and northern Asia (e.g., northeastern Siberia) and in the Mediterranean regions as compared to the reconstructions. Although previous pollen-based biomization studies with different biomization schemes have reported ESM-like results (such as Binney et al., 2017, and Cao et al., 2019, in periglacial areas and Elenga et al., 2000, and Prentice et al., 2000, in the Mediterranean regions), assessments of modern megabiome distributions suggest that these studies overestimated the occurrence of non-forest megabiomes in these regions. A recent pollen-based forest cover reconstruction by Davis et al. (2024) indicates more forest than previously suggested by biome reconstructions in these regions during the LGM, which aligns with our results. Furthermore, STEP occurred in central Asia in the reconstructions rather than TUND in the simulations, and TRFO and SAVA appeared in tropical South America and Africa in the reconstructions rather than WTFO in the simulations.
-
Deglaciation (represented by the time slices 16 and 13 cal ka BP). Compared with the LGM, the extratropical megabiomes experienced a remarkable expansion to higher latitudes that coincided with the retreat of the continental ice sheets (Fig. 3). In particular, BOFO, TUND, and TEFO underwent a more extensive expansion compared to the other megabiomes in both our reconstructions and simulations; a result similar to previous biomization studies (such as Binney et al., 2017, and Cao et al., 2019) north of 30° N. However, in contrast to the expansion of forest megabiomes (mostly TEFO and BOFO) in the reconstructions of the Rocky Mountains, northeastern Siberia, and the Mediterranean regions, more non-forest megabiomes (mostly STEP and TUND) occurred in the simulations. TRFO and SAVA expanded in the reconstructions of tropical South America and Africa, whereas the simulations show a shift from WTFO to TRFO since the LGM. In Australia, the Great Dividing Range region was dominated by WTFO in the reconstructions and by STEP in the simulations.
-
Early Holocene (represented by the time slice 9 cal ka BP). By this time, the global spatial patterns of megabiome distributions shifted to closely resemble those of the present day. That is, forest megabiomes replaced the glacial non-forest megabiomes during the early Holocene and expanded to similar distributional positions to those of today. For example, as the ice sheets receded in the Northern Hemisphere, BOFO continued to move northward and dominated the northern Rockies during the early Holocene, with distributions comparable to today, inferred from both reconstructions and simulations. Due to the extended and homogenized dataset used here, our study also challenges the previous regional-based views that similar distribution patterns of modern megabiomes (Binney et al., 2017) and maximum forest expansion occurred in the mid-Holocene (Ni et al., 2014; Tian et al., 2018). However, mismatches persist between our reconstructions and simulations. For example, Scandinavia was dominated by TEFO and BOFO in the reconstructions but by BOFO and TUND in the simulations; Alaska and the Mediterranean regions shifted to BOFO and TEFO, respectively, in the reconstructions, while TUND and STEP remained dominant in the simulations.
-
Mid-Holocene to late Holocene (represented by the time slices 6 and 3 cal ka BP). The spatial patterns of megabiome distributions during this period are only slightly different from those of the early Holocene. TRFO, for example, expanded in Mesoamerican reconstructions and simulations. It is also worth noting that the forest megabiomes have not obviously shifted since the late Holocene, as revealed by both reconstructions and simulations. Given that the simulated vegetation was in a quasi-equilibrium with the climate and unaffected by humans, this implies a relatively stable climate in that period. Therefore, we propose that enhanced anthropogenic disturbances over this time period did not promote forest degradation at a broad spatial scale and that biomization is robust regarding these disturbance (Prentice et al., 1996; Gotanda et al., 2008).
3.3 Comparison of pollen-based and ESM-based simulated megabiome reconstructions
To identify regions and periods with the largest deviations between pollen- and model-derived megabiome distributions, and to infer regional contributions to such deviations, we calculated their Earth mover's distances (EMDs; Chevalier et al., 2023b) at each available time slice and grid cell (Fig. 4a). Following that, we aggregated the EMD time series over all grid cells into 15 regional clusters (Fig. 4b) and synthesized the median EMDs over these regional clusters as representative of the global mean dynamic.
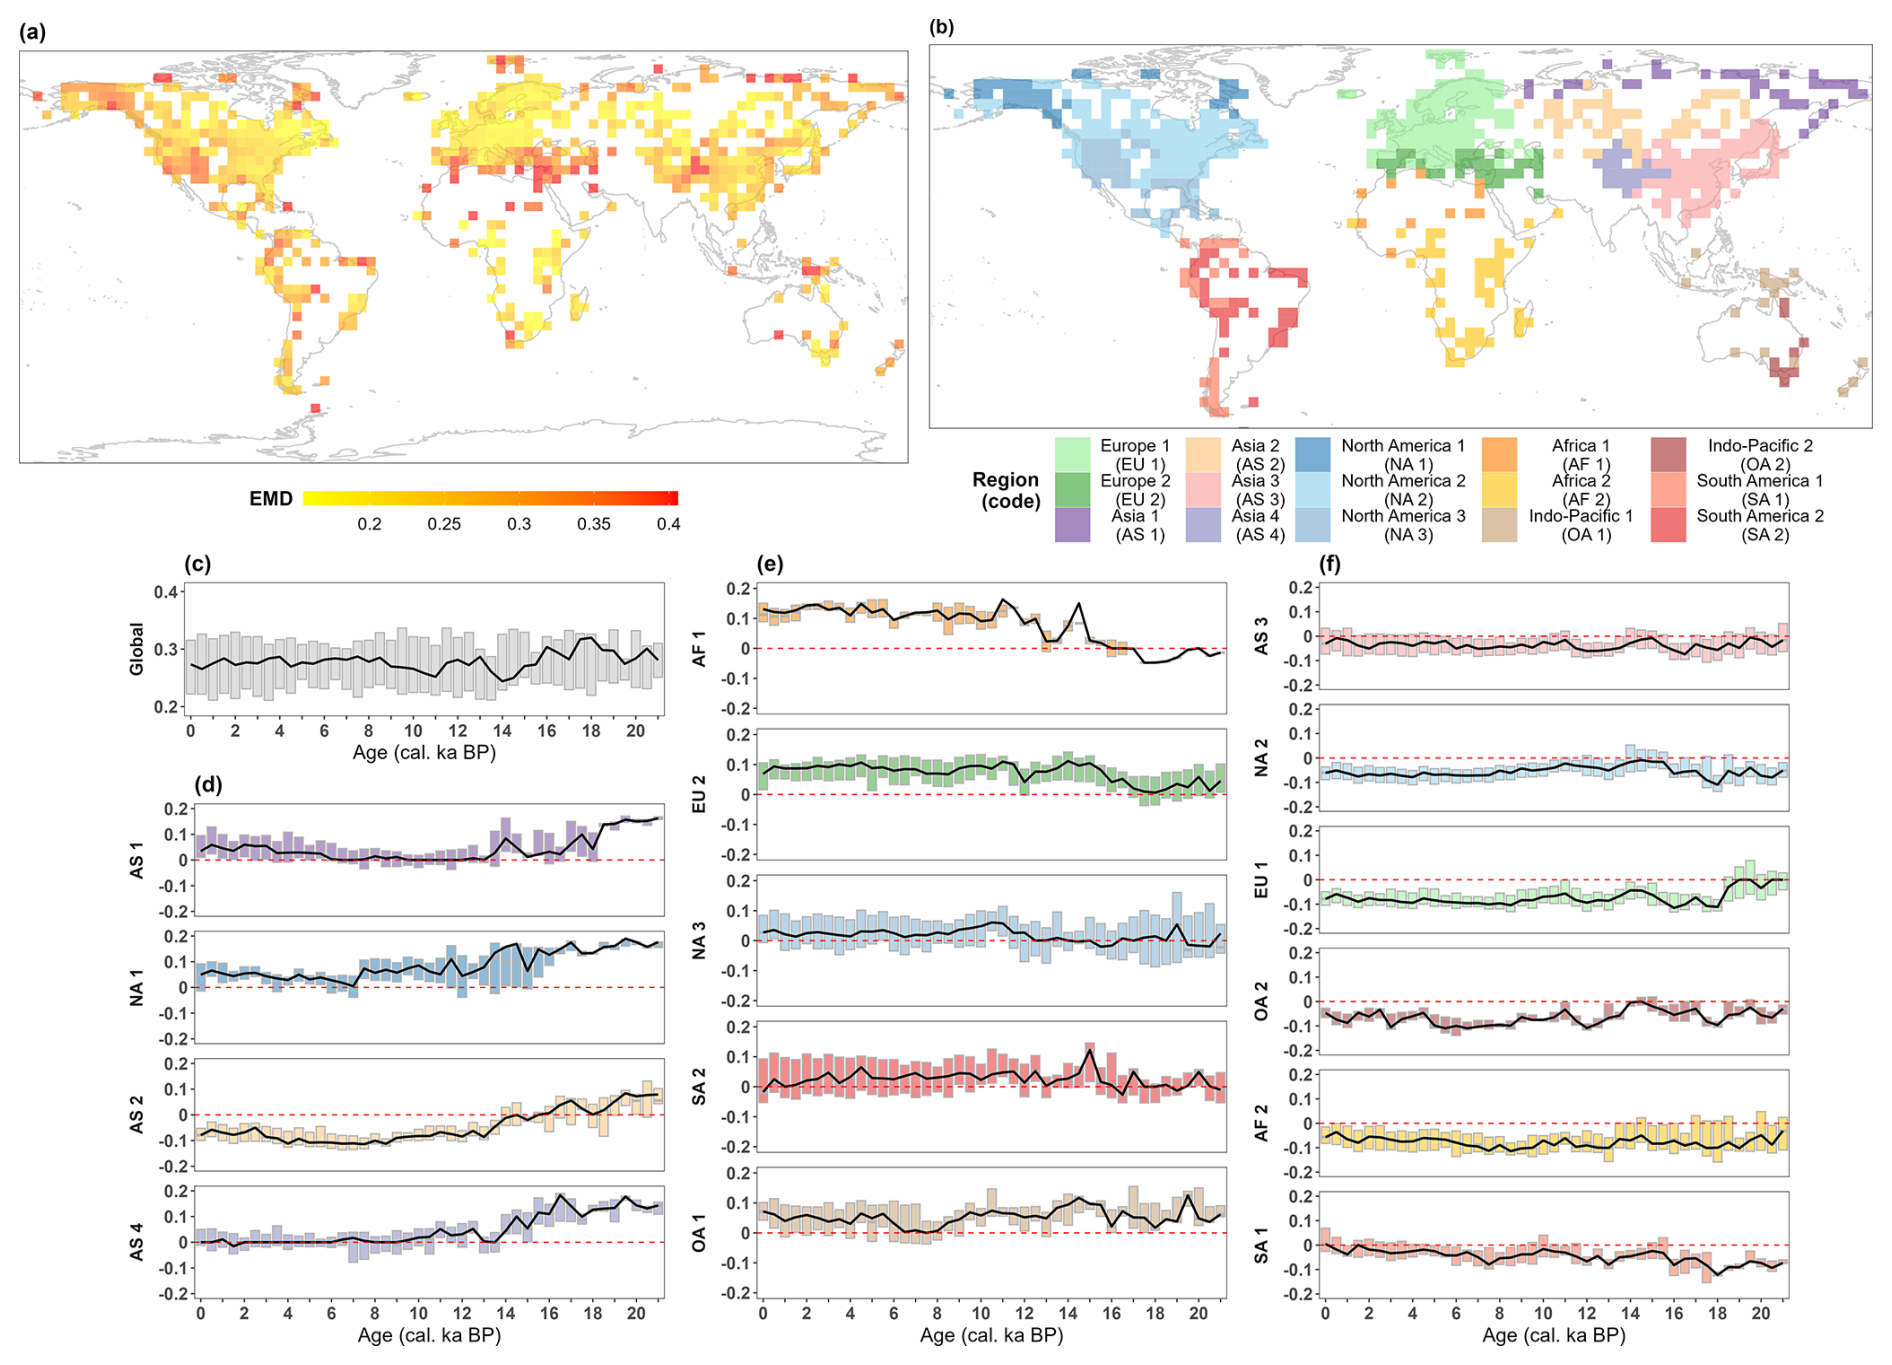
Figure 4Spatiotemporal patterns of Earth mover's distance (EMD) between the pollen-based reconstructions and the ESM-based simulation ensemble over the last 21 000 years, based on grid cells of 3.75° × 3.75°. (a) Spatial pattern of the median data–model EMD of available time slices over the last 21 000 years. The highest EMD values and consequently the largest data–model deviations occur especially in the Mediterranean, northern Africa, highlands (such as the Rocky Mountains), and circum-Arctic areas. Note that the map legend shows EMD values from the 5th to the 95th percentile, with values above the 95th percentile shown in the 95th percentile color and values below the 5th percentile shown in the 5th percentile color. (b) Regional clustering of the data–model EMD time series for grid cells using dynamic time warping by continent. (c) The global data–model EMD at each time slice, synthesized from the median EMDs of the clustered regions at that time slice. The solid black line represents the median EMD for each time slice, while the top and lower boundaries of each box represent the upper and lower quartiles of EMD distribution for that time slice. (d–f) The data–model EMD as an anomaly to the global median in clustered regions at each time slice. That is, regions with (d) the highest data–model EMD during the LGM and the early deglaciation, (e) the data–model EMD that increases with time during the Holocene, and (f) the lower data–model EMD than the global level. Colors and region codes in the boxplots correspond to the colors and region codes of the clusters displayed on the map. The dashed red line is the zero value of EMD.
The largest EMD-assessed deviations between pollen- and model-derived megabiome distributions on a global scale occur during the LGM and early deglaciation (∼ 21–16 cal ka BP; Fig. 4c). In contrast, the best data–model agreement occurs during the Bølling–Allerød interstadial (represented by the time slice 14 cal ka BP) and the early Holocene (represented by the time slice 11 cal ka BP). Furthermore, the global median EMD has stayed relatively constant at moderate values over the last 9000 years.
A closer look at the data–model EMD dynamics of the 15 regions (Fig. 4b) identified by the dynamic time warping reveals three sub-clusters: firstly, regions in which the data–model EMD is particularly high during the LGM and the early deglaciation (Fig. 4d), driving the strong global data–model mismatch during this period; secondly, regions in which the data–model EMD rather increases with time (Fig. 4e), contributing to the moderate global EMD values during the Holocene; thirdly, regions in which the data–model EMD is predominantly lower than the global median EMD (Fig. 4f), i.e., high data–model agreement. However, the reasons for the regional data–model mismatch are very different.
Different estimates of tundra in the circum-Arctic areas and the Tibetan Plateau are the primary sources of the strong global data–model deviations during the LGM and early deglaciation (Fig. 4d) at 21 and 16 cal ka BP (Fig. 3). We observe inconsistent estimates of tundra (TUND) and boreal forest (BOFO) from the pollen-based reconstructions and the ESM-based simulations in northern Siberia (AS1), Alaska (NA1), and the East Siberian Highlands (AS2). To some extent, this mismatch could be attributed to systematic model biases in the simulated climate, as climate models tend to underestimate summer temperature in the periglacial areas compared to proxy-based reconstructions, as previously indicated in studies with different models (Deplazes et al., 2013; Alley, 2000) for that period. The simulations used in this study, especially the MPI-ESM and TRACE-21K simulations, also share this rather common problem in modern times, i.e., a summer cold bias in boreal latitudes (Fig. A3a and Table A1), resulting in an overestimation of tundra in the simulations. However, CLIMBER-X simulations perform better in these regions because they overestimate summer temperatures and produce more boreal forests. Furthermore, the large data–model deviations on the Tibetan Plateau (AS4) result from different estimates of tundra and grasslands (STEP) in the simulations and reconstructions. Given that the simulated megabiome in the Tibetan Plateau area at time slice 0 cal ka BP closely resembles modern potential natural vegetation distributions when compared to the reconstructions (Figs. 1 and A2), we assume that tundra may have been misrepresented as grassland in the reconstructions.
Different estimates of non-forest megabiomes in relatively semi-arid zones, such as northern Africa and the Mediterranean, have contributed to moderate but increasing data–model deviations since the early deglaciation (Fig. 4e). As shown in Fig. 3, with the transition from the glacial to the Holocene, the Mediterranean–Black Sea–Caspian Corridor (EU2) and the Mediterranean coast of northern Africa have gradually been dominated by temperate forests (TEFO) in the reconstructions, rather than grasslands and dry shrublands (STEP) in the simulations. Since the reconstructions reproduce the region's modern potential natural vegetation better than the simulation (Table 3), we infer that the simulations likely underestimated the cover fraction of woody PFTs in the simulations throughout the Holocene. Given that anthropogenic disturbances (e.g., land use and deforestation) did not promote large-scale forest degradation in this region (see Sect. 3.2), this underrepresentation could be attributed to the systematic model biases of hotter summers and drier winters (García-Herrera and Barriopedro, 2018; Fig. A3a–b). In addition, data–model deviations in the Sahara (AF1) are primarily observed during the Holocene, resulting from a mismatch between simulated deserts (DESE) and reconstructed savanna (SAVA). In the simulations, the weakening of the North African Monsoon system led to desert expansion in response to seasonal insolation changes, a pattern supported by both proxy-based reconstructions (deMenocal et al., 2000; Shanahan et al., 2015) and climate simulations (Dallmeyer et al., 2021). However, in our reconstructions, the overrepresentation of woody taxa (e.g., Acacia and Arecaceae) resulted in the classification of some desert regions as savanna and dry woodlands (SAVA), potentially contributing to the increasing data–model deviations in the Sahara during the Holocene.
This study presents a global megabiome reconstruction for 43 time slices at 500-year intervals over the past 21 000 years, based on the most extensive taxonomically and temporally standardized fossil pollen dataset. The dataset's reliability is supported by a high agreement (∼ 80 %) with modern potential natural vegetation, and its general consistency with the simulated paleo-simulation ensemble further underscores its robustness for exploring past biome dynamics. With its high temporal and spatial coverage, it offers an unprecedented resource, not only for exploring long-term vegetation dynamics and their drivers but also for diverse research contexts, including paleoclimate, biodiversity, and land-use studies. Furthermore, the dataset supports the evaluation of ESM-based paleo-megabiome simulations and offers insights for identifying potential biases in climate and vegetation models. Its consistent structure and broad applicability allow us to advance our integrative understanding of past, present, and future Earth system dynamics.
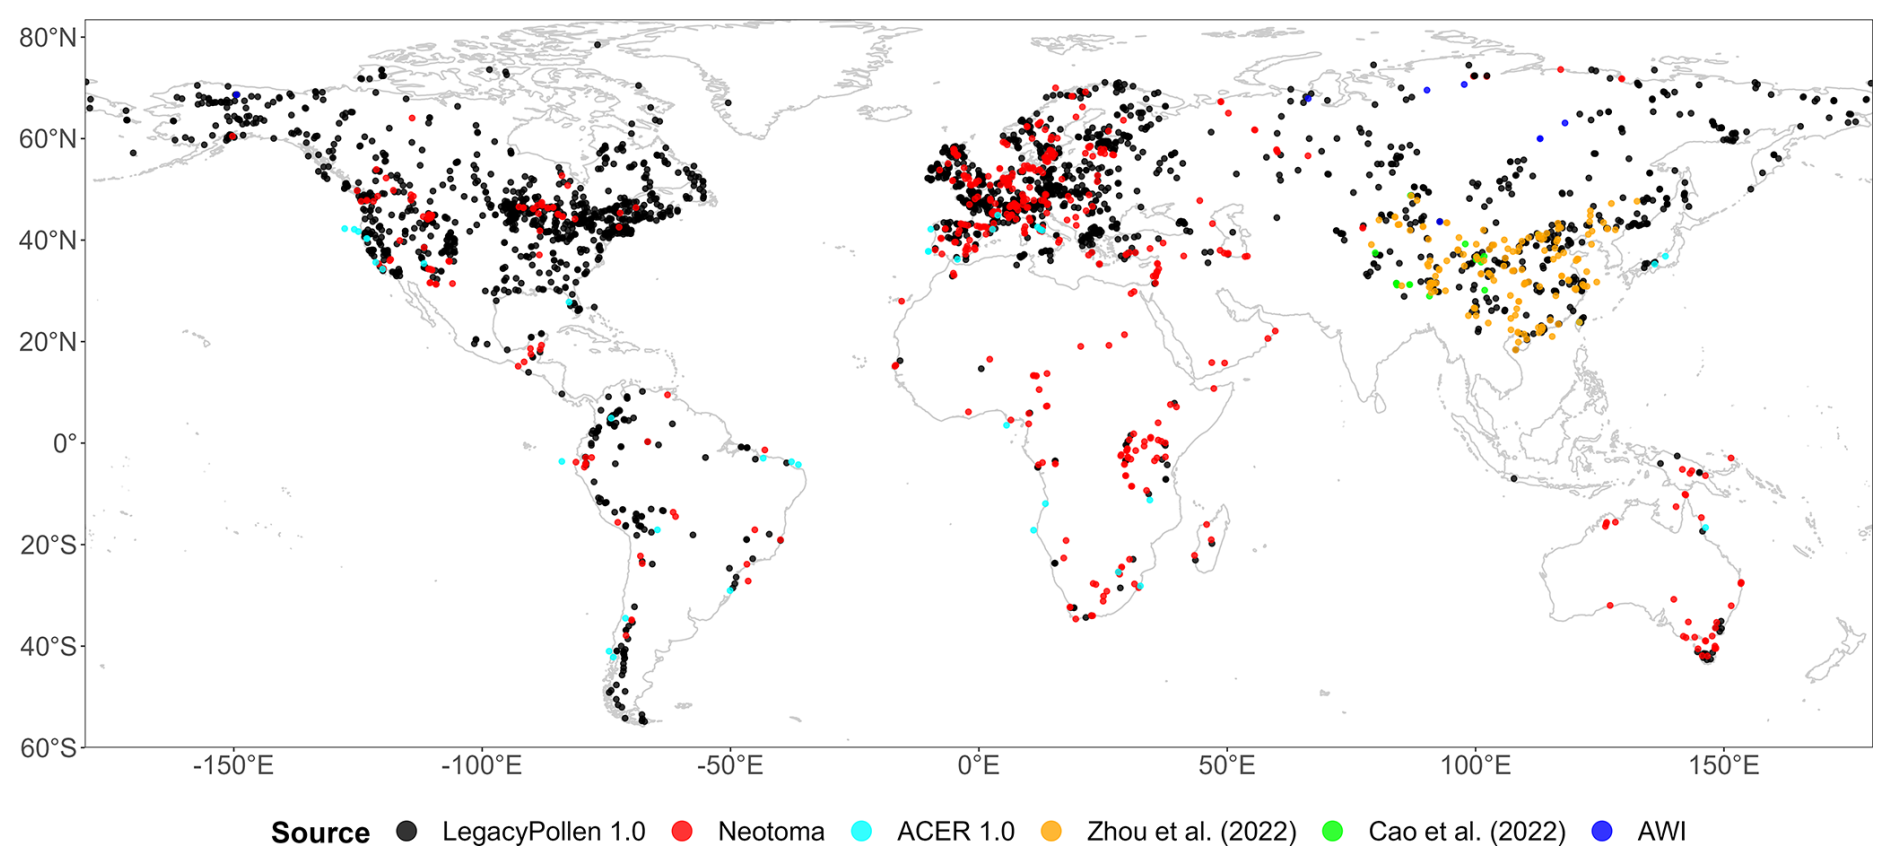
Figure A1Spatial distribution and sources of fossil pollen records in the LegacyPollen 2.0 dataset.
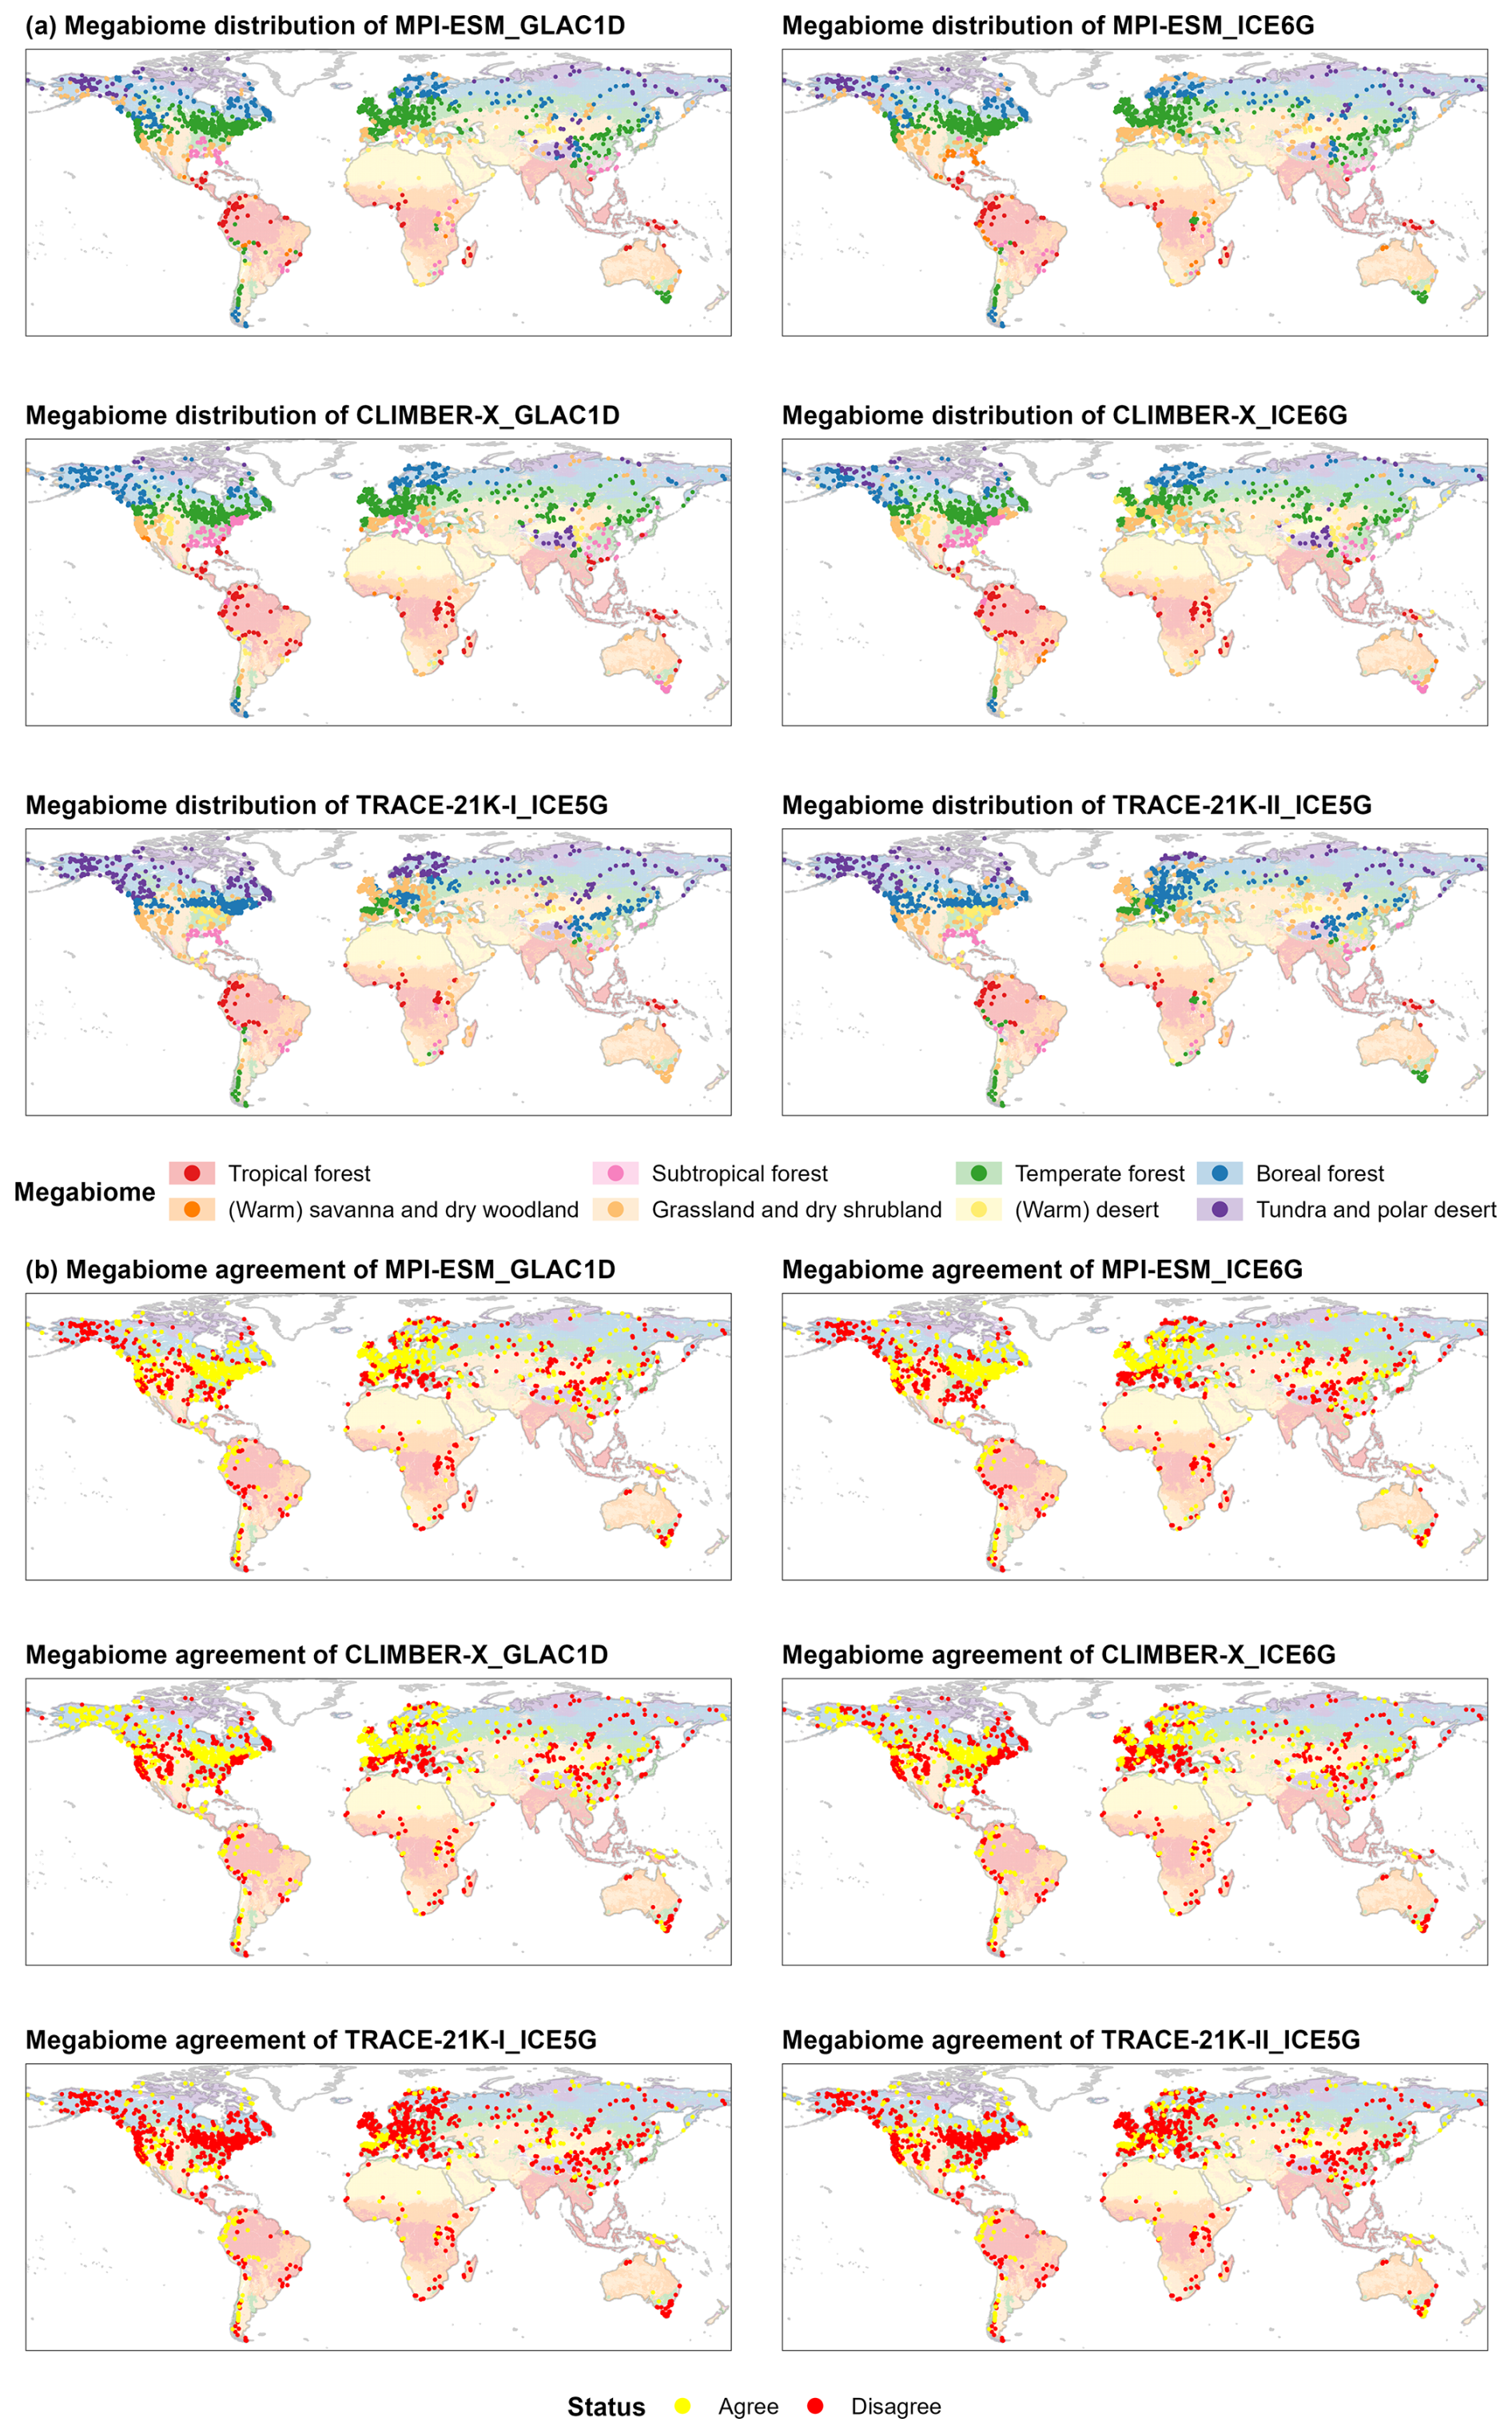
Figure A2Spatial patterns of megabiome distributions at 0 cal ka BP (a) and their agreement with modern potential natural megabiomes (b), derived from the ESM-based simulations of MPI-ESM, CLIMBER-X, and TRACE-21K. The map background depicts the distribution of modern potential natural megabiomes aggregated from modern potential natural vegetation (spatial resolution: 5 arcmin; Ramankutty et al., 2010; Dallmeyer et al., 2019).
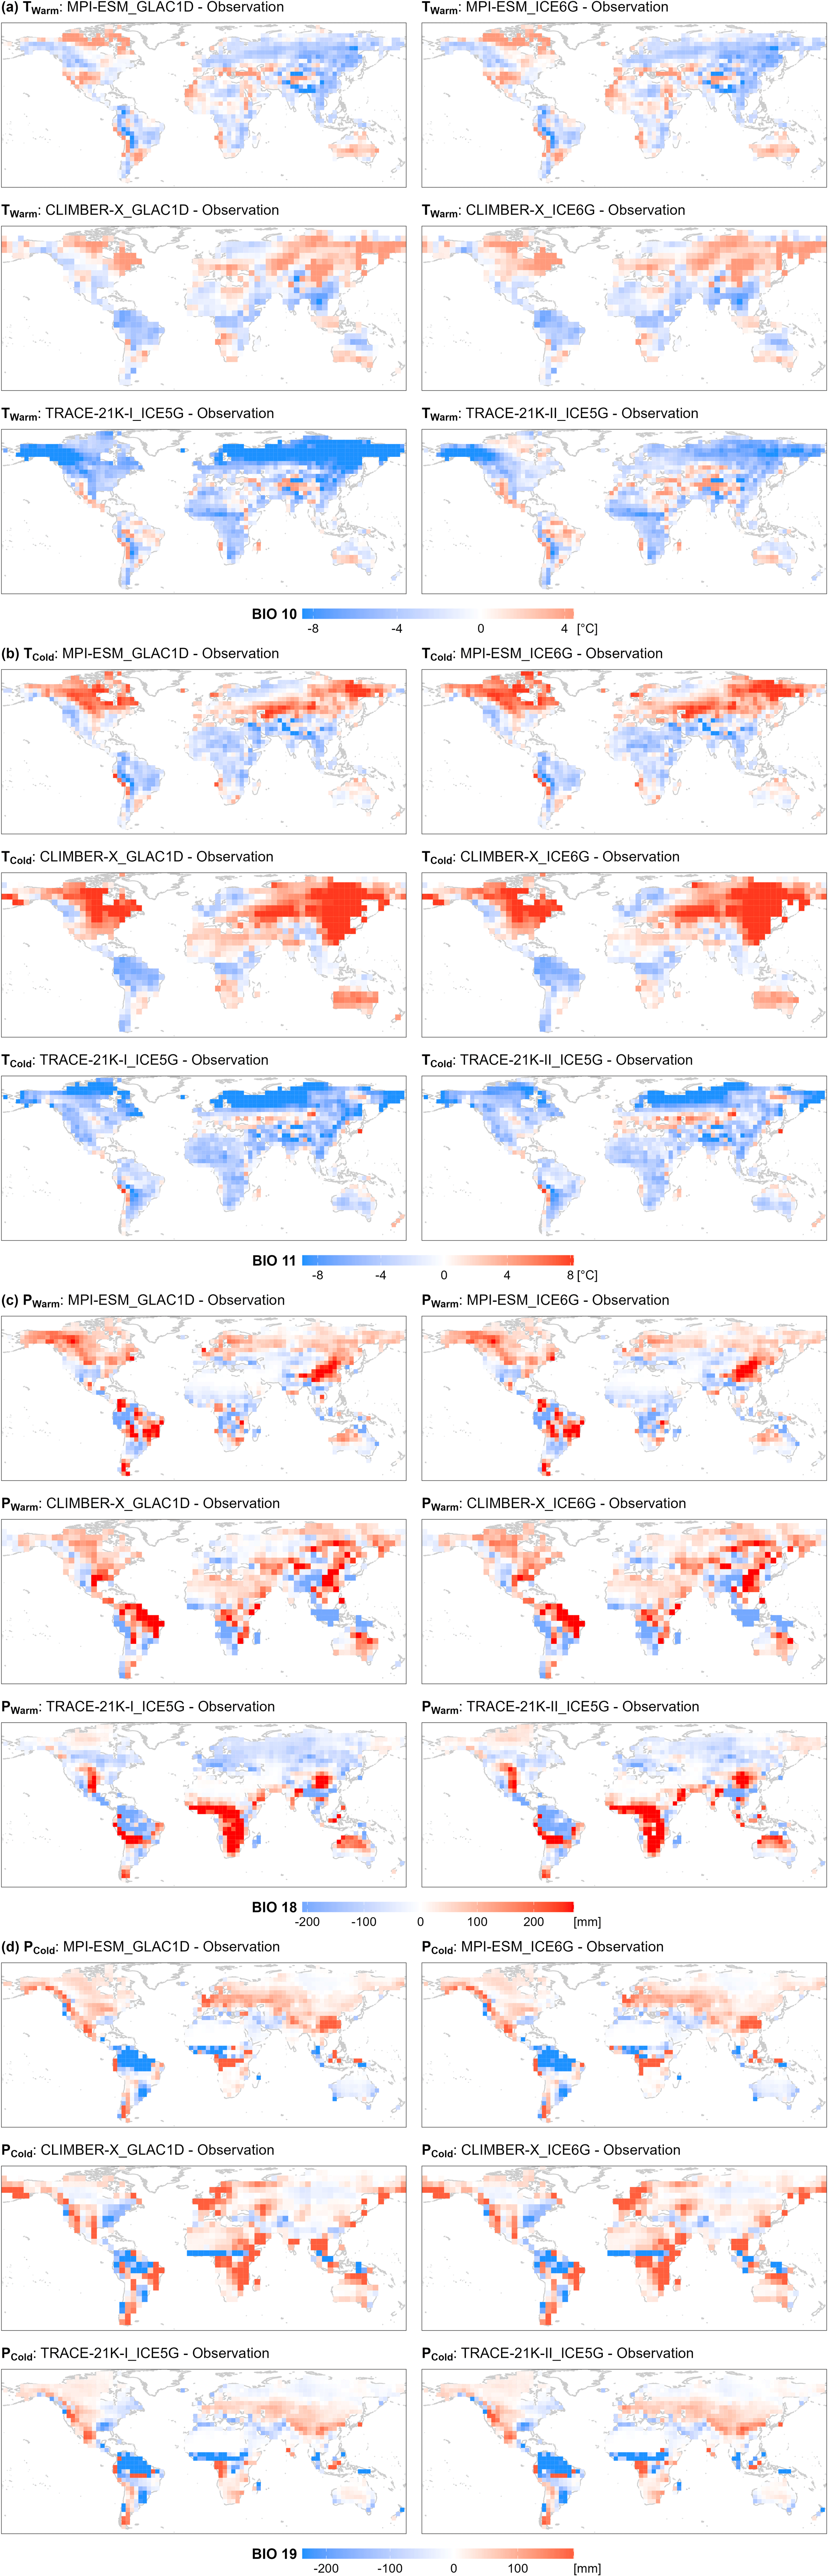
Figure A3Differences in bioclimatic variables between ESM-based simulations at 0 cal ka BP and observations. The bioclimatic variables include (a) mean temperature of the warmest quarter (Twarm), (b) mean temperature of the coldest quarter (Tcold), (c) precipitation of the warmest quarter (Pwarm), and (d) precipitation of the coldest quarter (Pcold). The spatial resolutions are 3.75° for the MPI-ESM and TRACE-21K models and 5° for the CLIMBER-X model. Note that the map legend shows bioclimatic variable values from the 5th to the 95th percentile, with values above the 95th percentile shown in the 95th percentile color and values below the 5th percentile shown in the 5th percentile color.
Table A1The median difference in bioclimatic variables between ESM-based simulations at 0 cal ka BP and observations by regions. The regional clustering is shown in Fig. 4b. Bioclimatic variables are as follows. Twarm: mean temperature of the warmest quarter; Tcold: mean temperature of the coldest quarter; Pwarm: precipitation of the warmest quarter; and Pcold: precipitation of coldest quarter. A positive sign in the simulation ensemble difference indicates that the number of simulations that overestimate the bioclimatic variable is greater than the number that underestimate it among the six simulations, while a negative sign indicates the opposite, and positive/negative signs indicate that they are equivalent.
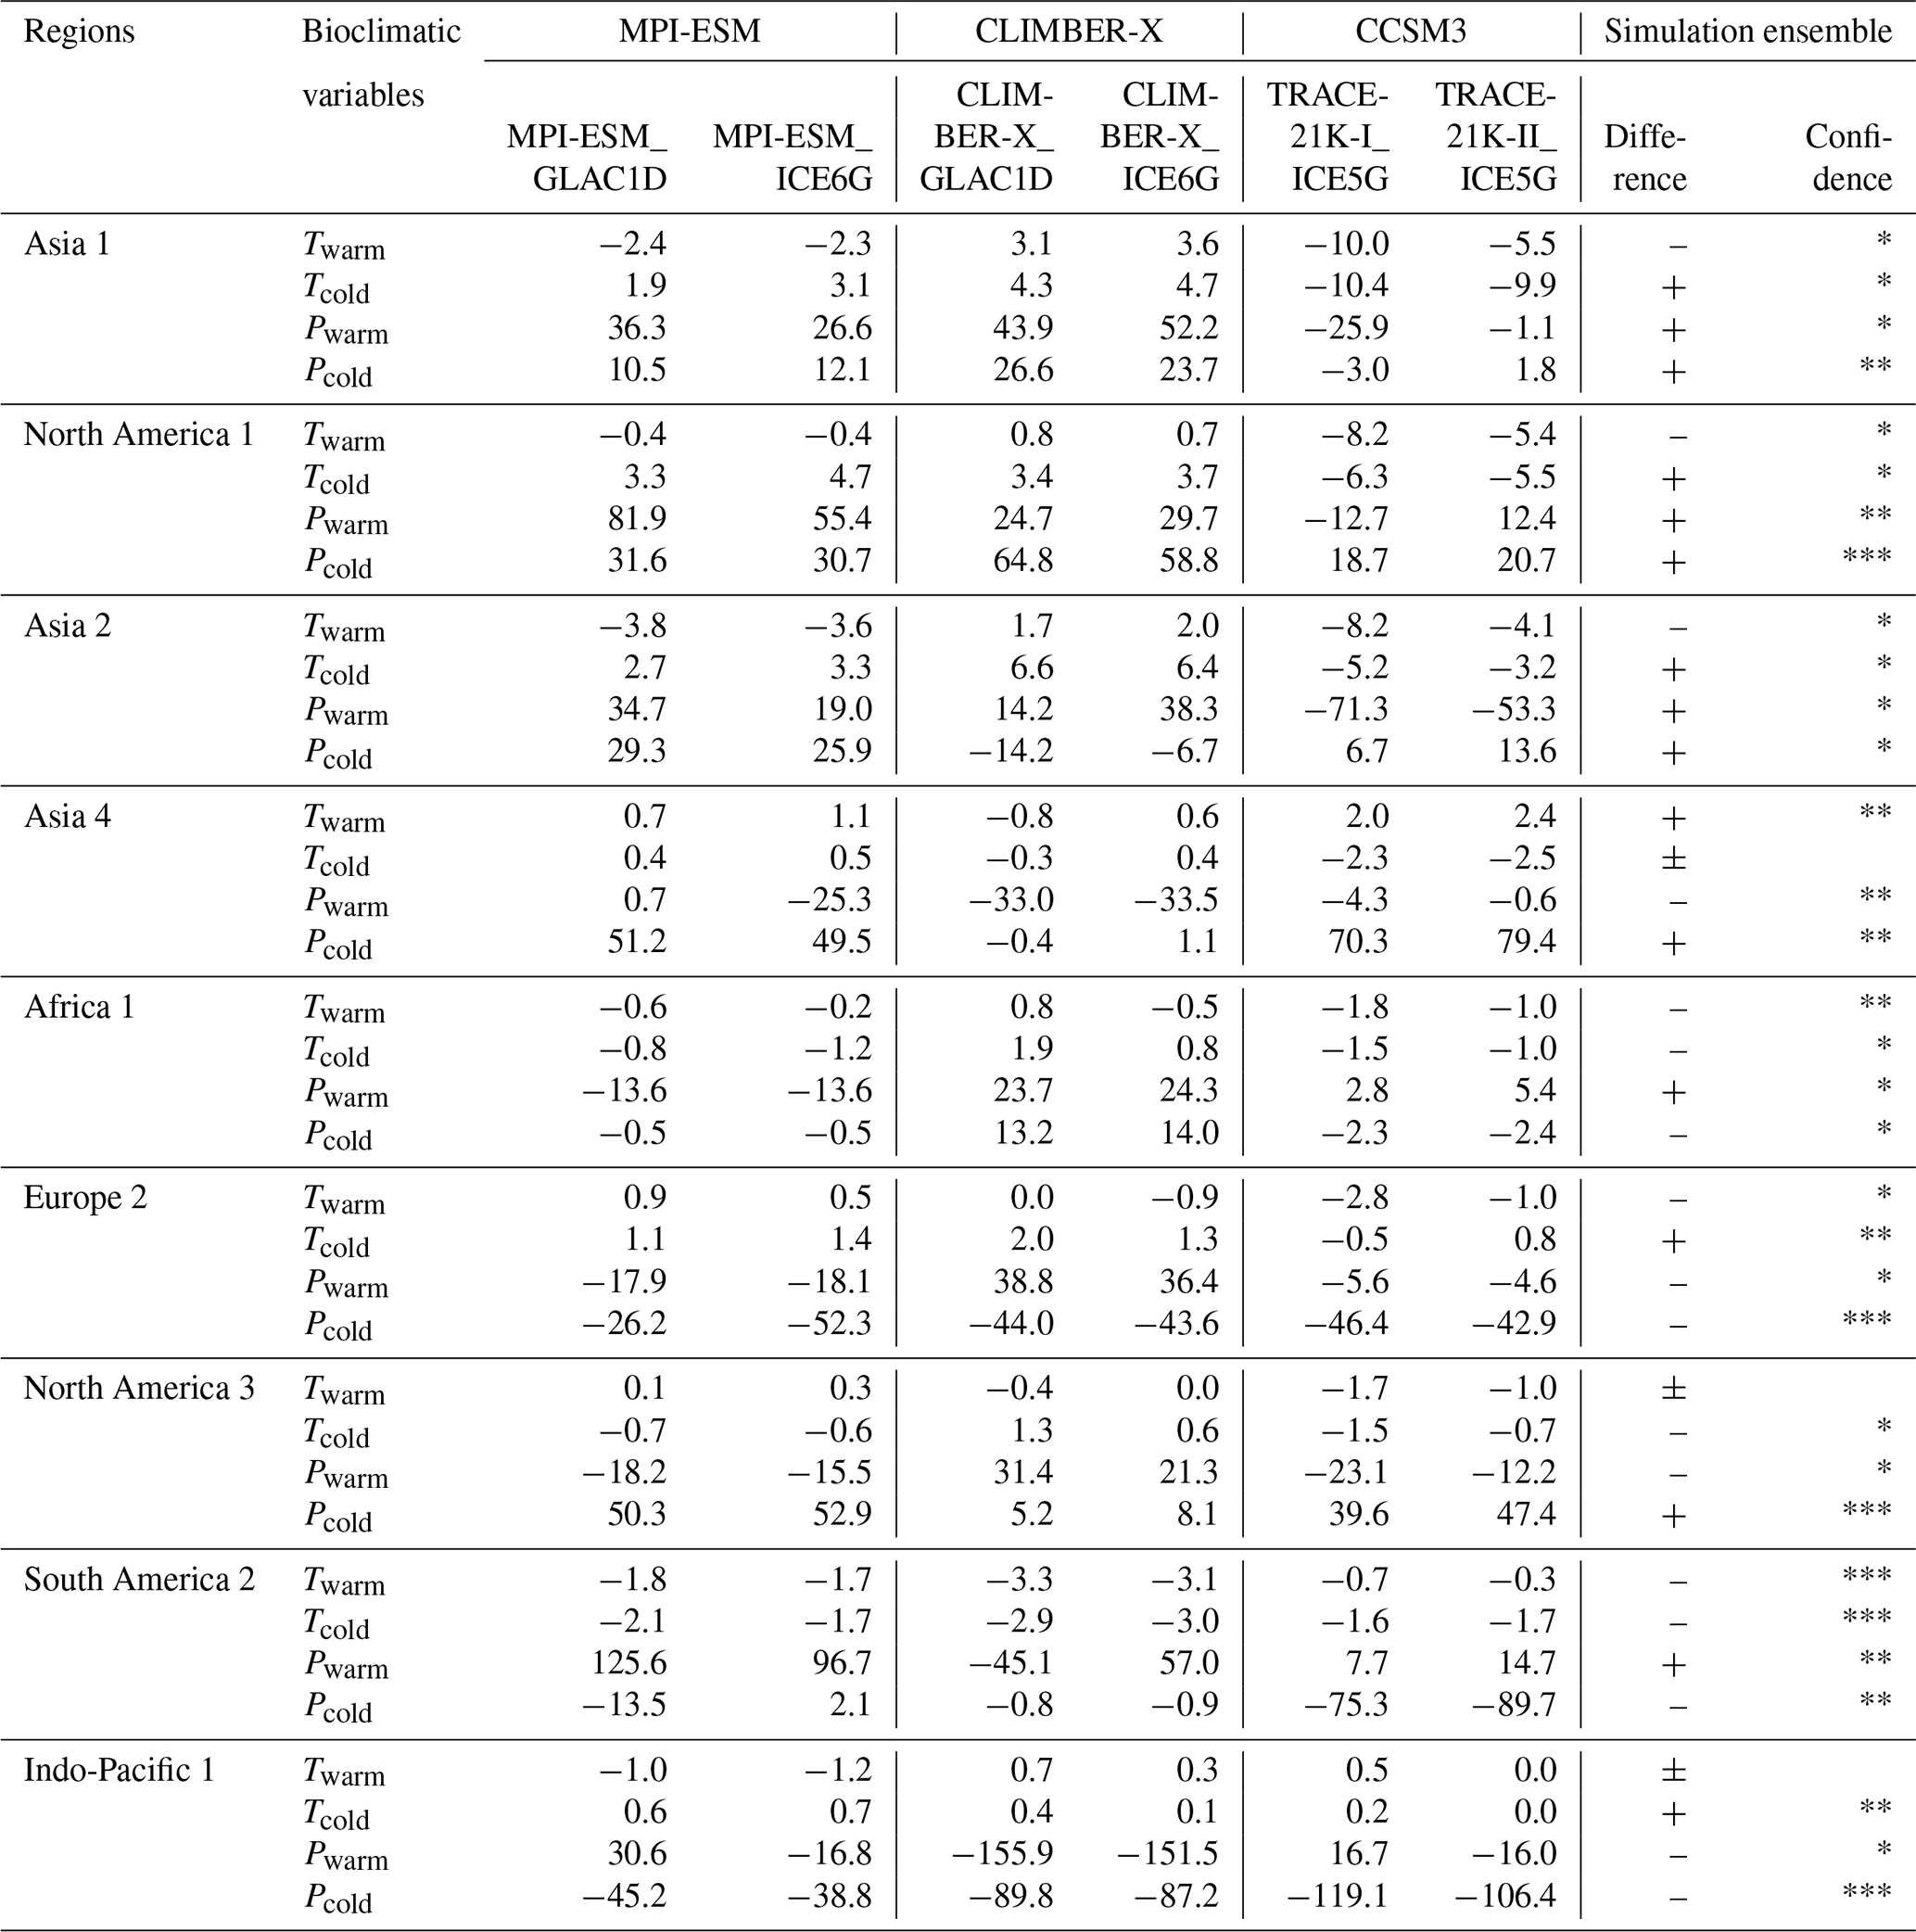
Confidence among the six simulations is indicated by one, two, and three asterisks for four, five, and six simulations sharing the same sign, respectively.
We performed all statistical analyses and visualization in this study in the R software environment, and the R scripts have been deposited in the Zenodo repository (https://doi.org/10.5281/zenodo.15518530; Li, 2025). The pollen-based biomization algorithm in R and the tool for the biomization of simulated PFT cover fractions are available from Zenodo (https://doi.org/10.5281/zenodo.7523423; Cao and Tian, 2021) and the MPG.PuRe repository (https://hdl.handle.net/21.11116/0000-0001-B800-F, last access: 16 May 2024; Dallmeyer et al., 2019), respectively. All packages (e.g., neotoma2, paleotools, and TSclust) mentioned throughout are software extensions to R (version 4.4.1; https://www.r-project.org/; R Core Team, 2023).
The LegacyPollen 2.0 dataset is open access at PANGAEA (https://doi.org/10.1594/PANGAEA.965907; Li et al., 2025) and provides both count and percentage pollen data. The dataset files in machine-readable data format (.csv) are published in separate data collections for easy access and use: western North America (west of 105° W; https://doi.org/10.1046/j.1365-2699.2000.00428.x; Williams et al., 2000), eastern North America, Europe, Asia, South America, Africa, and the Indo-Pacific. We have provided an overview table of record metadata and the taxa harmonization table in PANGAEA, as in the LegacyPollen 1.0 dataset, at https://doi.org/10.5194/essd-14-3213-2022 (Herzschuh et al., 2022) and https://doi.org/10.1594/PANGAEA.929773 (Herzschuh et al., 2021).
The simulation MPI-ESM_ICE6G and an equivalent simulation to MPI-ESM_GLAC1D for the biomization tool are available from the Word Data Center for Climate at https://doi.org/10.26050/WDCC/PMMXMCRTDIP122 (Mikolajewicz et al., 2023) and https://doi.org/10.26050/WDCC/PMMXMCHTD (Kleinen et al., 2023), respectively. The input data of TRACE-21k-I and TRACE-21k-II for the biomization tool can be downloaded at https://www.earthsystemgrid.org/project/trace.html (last access: 16 May 2024; Liu et al., 2009) and https://trace-21k.nelson.wisc.edu/portal.html (last access: 16 May 2024; He and Clark, 2022), respectively. The CLIMBER-X simulation is not published, but the input data for the biomization tool can be provided upon request.
The data of modern potential natural vegetation distributions estimated by Ramankutty et al. (2010) can be downloaded at https://doi.org/10.3334/ORNLDAAC/961. The climate dataset of the Climatic Research Unit gridded Time Series (CRU TS Version 4.08; https://doi.org/10.1038/s41597-020-0453-3; Harris et al., 2020) can be downloaded at https://crudata.uea.ac.uk/cru/data/hrg/cru_ts_4.08/cruts.2406270035.v4.08/ (last access: 22 December 2024; Harris et al., 2020). The ice-sheet data for ICE-5G (https://doi.org/10.1146/annurev.earth.32.082503.144359; Peltier, 2004) and ICE-6G (https://doi.org/10.1002/2014JB011176; Peltier et al., 2015) reconstructions can be downloaded at http://www.atmosp.physics.utoronto.ca/~peltier/data.php (last access: 16 May 2024; Peltier, 2004; Peltier et al., 2015). For GLAC-1D (https://doi.org/10.1016/j.epsl.2011.09.010; Tarasov et al., 2012), reconstructions can be downloaded at https://pmip4.lsce.ipsl.fr/doku.php/data:ice_glac_1d#download (last access: 16 May 2024; Tarasov et al., 2012).
The supplement related to this article is available online at https://doi.org/10.5194/cp-21-1001-2025-supplement.
UH, CL, and AD designed the study. CL and AD performed pollen-based reconstruction and model-based biomization, respectively. CL, JN, and AA revised and updated the taxa–PFT–megabiome assignment schemes in the biomization procedures under the supervision of UH. CL implemented the analysis under the supervision of UH and AD. MW provided the CLIMBER-X simulation. MC and LS contributed to the analytical methods. XC contributed an initial R script for biomization procedures. BH, together with MW, supported the PANGAEA data publication of the LegacyPollen 2.0 dataset. CL wrote the first draft of the article under the supervision of UH and AD. All co-authors discussed the results and contributed to the final article.
At least one of the (co-)authors is a guest member of the editorial board of Climate of the Past for the special issue “Past vegetation dynamics and their role in past climate changes”. The peer-review process was guided by an independent editor, and the authors also have no other competing interests to declare.
Publisher's note: Copernicus Publications remains neutral with regard to jurisdictional claims in published maps and institutional affiliations.
Copernicus Publications remains neutral with regard to jurisdictional claims made in the text, published maps, institutional affiliations, or any other geographical representation in this paper. While Copernicus Publications makes every effort to include appropriate place names, the final responsibility lies with the authors.
This article is part of the special issue “Past vegetation dynamics and their role in past climate changes”. It is not associated with a conference.
The majority of the fossil pollen data were obtained from the Neotoma Paleoecology Database (https://www.neotomadb.org/, last access: 31 August 2022) and its constituent databases (e.g., APD, EPD, ALPADABA, IPPD, LAPD, and NAPD). The work of data contributors, data stewards, and the Neotoma community is gratefully acknowledged. We would like to express our gratitude to all the palynologists and geologists who, either directly or indirectly, contributed pollen data and chronologies to the dataset. We thank John W. Williams and Thomas Giesecke from the Neotoma Paleoecology Database for their valuable comments (https://doi.org/10.5194/essd-2023-486-CC3 and https://doi.org/10.5194/essd-2023-486-RC2) on the compilation of the LegacyPollen 2.0 dataset.
We thank Thomas Böhmer for his support with the R script revision. We acknowledge Thomas Kleinen, Uwe Mikolajewicz, and Marie Kapsch from the Max Planck Institute for Meteorology and Feng He from the University of Wisconsin–Madison for providing MPI-ESM and TRACE-21K simulations, respectively. We also thank Cathy Jenks for language editing in a previous version of the paper.
This research has been supported by the European Research Council (ERC Glacial Legacy grant no. 772852 to Ulrike Herzschuh) and the PalMod Initiative (grant no. 01LP1510C to Ulrike Herzschuh). Anne Dallmeyer, Manuel Chevalier, and Matteo Willeit are supported by the German Federal Ministry of Education and Research (BMBF) as a Research for Sustainability initiative (FONA; https://www.fona.de/en/, last access: 10 March 2023) through the PalMod Phase II and Phase III projects (grant nos. 01LP1920A and 01LP2306A (AD); 01LP1926D and 01LP2308B (MC); and 01LP1920B, 01LP1917D, and 01LP2305B (MW)). Chenzhi Li holds a scholarship from the Chinese Scholarship Council (grant no. 201908130165).The article processing charges for this open-access publication were covered by the Alfred-Wegener-Institut Helmholtz-Zentrum für Polar- und Meeresforschung.
This paper was edited by Yoshi Maezumi and reviewed by Joel Guiot and one anonymous referee.
Allen, J. R. M., Forrest, M., Hickler, T., Singarayer, J. S., Valdes, P. J., and Huntley, B.: Global vegetation patterns of the past 140,000 years, J. Biogeogr., 47, 2073–2090, https://doi.org/10.1111/jbi.13930, 2020.
Alley, R. B.: The Younger Dryas cold interval as viewed from central Greenland, Quatermary Sci. Rev., 19, 213–226, https://doi.org/10.1016/S0277-3791(99)00062-1, 2000.
Beck, P., Caudullo, G., de Rigo, D., and Tinner, W.: Betula pendula, Betula pubescens and other birches in Europe: distribution, habitat, usage and threats, in: European Atlas of Forest Tree Species, edited by: San-Miguel-Ayanz, J., de Rigo, D., Caudullo, G., Houston Durrant, T., and Mauri, A., Publication Office of the European Union, Luxembourg, 70–73, https://doi.org/10.7892/boris.80789, 2016.
Berger, A.: Long-term variations of daily insolation and Quaternary climatic changes, J. Atmos. Sci., 35, 2362–2367, https://doi.org/10.1175/1520-0469(1978)035<2362:LTVODI>2.0.CO;2, 1978.
Bigelow, N. H., Brubaker, L. B., Edwards, M. E., Harrison, S. P., Prentice, I. C., Anderson, P. M., Andreev, A. A., Bartlein, P. J., Christensen, T. R., Cramer, W., Kaplan, J. O., Lozhkin, A. V., Matveyeva, N. V., Murray, D. F., McGuire, A. D., Razzhivin, V. Y., Ritchie, J. C., Smith, B., Walker, D. A., Gajewski, K., Wolf, V., Holmqvist, B. H., Igarashi, Y., Kremenetskii, K., Paus, A., Pisaric, M. F. J., and Volkova, V. S.: Climate change and Arctic ecosystems: 1. Vegetation changes north of 55° N between the last glacial maximum, mid-Holocene, and present, J. Geophys. Res.-Atmos., 108, D19, https://doi.org/10.1029/2002JD002558, 2003.
Binney, H., Edwards, M., Macias-Fauria, M., Lozhkin, A., Anderson, P., Kaplan, J. O., Andreev, A., Bezrukova, E., Blyakharchuk, T., Jankovska, V., Khazina, I., Krivonogov, S., Kremenetski, K., Nield, J., Novenko, E., Ryabogina, N., Solovieva, N., Willis, K., and Zernitskaya, V.: Vegetation of Eurasia from the last glacial maximum to present: Key biogeographic patterns, Quaternary Sci. Rev., 157, 80–97, https://doi.org/10.1016/j.quascirev.2016.11.022, 2017.
Blaauw, M. and Christen, J. A.: Flexible paleoclimate age-depth models using an autoregressive gamma process, Bayesian Anal., 6, 457–474, https://doi.org/10.1214/11-BA618, 2011.
Brierley, C. M., Zhao, A., Harrison, S. P., Braconnot, P., Williams, C. J. R., Thornalley, D. J. R., Shi, X., Peterschmitt, J.-Y., Ohgaito, R., Kaufman, D. S., Kageyama, M., Hargreaves, J. C., Erb, M. P., Emile-Geay, J., D'Agostino, R., Chandan, D., Carré, M., Bartlein, P. J., Zheng, W., Zhang, Z., Zhang, Q., Yang, H., Volodin, E. M., Tomas, R. A., Routson, C., Peltier, W. R., Otto-Bliesner, B., Morozova, P. A., McKay, N. P., Lohmann, G., Legrande, A. N., Guo, C., Cao, J., Brady, E., Annan, J. D., and Abe-Ouchi, A.: Large-scale features and evaluation of the PMIP4-CMIP6 midHolocene simulations, Clim. Past, 16, 1847–1872, https://doi.org/10.5194/cp-16-1847-2020, 2020.
Burton, C., Betts, R., Cardoso, M., Feldpausch, T. R., Harper, A., Jones, C. D., Kelley, D. I., Robertson, E., and Wiltshire, A.: Representation of fire, land-use change and vegetation dynamics in the Joint UK Land Environment Simulator vn4.9 (JULES), Geosci. Model Dev., 12, 179–193, https://doi.org/10.5194/gmd-12-179-2019, 2019.
Cao, X. and Tian, F.: Pollen-based biome reconstruction in R, Zenodo [code], https://doi.org/10.5281/zenodo.7523423, 2021.
Cao, X., Tian, F., Dallmeyer, A., and Herzschuh, U.: Northern Hemisphere biome changes (>30° N) since 40 cal ka BP and their driving factors inferred from model-data comparisons, Quaternary Sci. Rev., 220, 291–309, https://doi.org/10.1016/j.quascirev.2019.07.034, 2019.
Cao, X., Tian, F., Herzschuh, U., Ni, J., Xu, Q., Li, W., Zhang, Y., Luo, M., and Chen, F.: Human activities have reduced plant diversity in eastern China over the last two millennia, Glob. Change Biol., 28, 4962–4976, https://doi.org/10.1111/gcb.16274, 2022.
Chen, Y., Ni, J., and Herzschuh, U.: Quantifying modern biomes based on surface pollen data in China, Global Planet. Change, 74, 114–131, https://doi.org/10.1016/j.gloplacha.2010.09.002, 2010.
Cheng, W., Dan, L., Deng, X., Feng, J., Wang, Y., Peng, J., Tian, J., Qi, W., Liu, Z., Zheng, X., Zhou, D., Jiang, S., Zhao, H., and Wang, X.: Global monthly gridded atmospheric carbon dioxide concentrations under the historical and future scenarios, Sci. Data, 9, 83, https://doi.org/10.1038/s41597-022-01196-7, 2022.
Chevalier, M.: mchevalier2/paleotools: The version of the package used in the Climate of the Past EMD manuscript, Zenodo [code], https://doi.org/10.5281/zenodo.7889631, 2023a.
Chevalier, M., Dallmeyer, A., Weitzel, N., Li, C., Baudouin, J.-P., Herzschuh, U., Cao, X., and Hense, A.: Refining data–data and data–model vegetation comparisons using the Earth mover's distance (EMD), Clim. Past, 19, 1043–1060, https://doi.org/10.5194/cp-19-1043-2023, 2023b.
Collins, W. D., Bitz, C. M., Blackmon, M. L., Bonan, G. B., Bretherton, C. S., Carton, J. A., Chang, P., Doney, S. C., Hack, J. J., Henderson, T. B., Kiehl, J. T., Large, W. G., McKenna, D. S., Santer, B. D., and Smith, R. D.: The community climate system model version 3 (CCSM3), J. Climate, 19, 2122–2143, https://doi.org/10.1175/JCLI3761.1, 2006.
Dallmeyer, A., Claussen, M., and Brovkin, V.: Harmonising plant functional type distributions for evaluating Earth system models, Clim. Past, 15, 335–366, https://doi.org/10.5194/cp-15-335-2019, 2019.
Dallmeyer, A., Claussen, M., Lorenz, S. J., Sigl, M., Toohey, M., and Herzschuh, U.: Holocene vegetation transitions and their climatic drivers in MPI-ESM1.2, Clim. Past, 17, 2481–2513, https://doi.org/10.5194/cp-17-2481-2021, 2021.
Dallmeyer, A., Kleinen, T., Claussen, M., Weitzel, N., Cao, X., and Herzschuh, U.: The deglacial forest conundrum, Nat. Commun., 13, 6035, https://doi.org/10.1038/s41467-022-33646-6, 2022.
deMenocal, P., Ortiz, J., Guilderson, T., Adkins, J., Sarnthein, M., Baker, L., and Yarusinsky, M.: Abrupt onset and termination of the African Humid Period: rapid climate responses to gradual insolation forcing, Quaternary Sci. Rev., 19, 347–361, https://doi.org/10.1016/S0277-3791(99)00081-5, 2000.
Davis, B. A. S., Fasel, M., Kaplan, J. O., Russo, E., and Burke, A.: The climate and vegetation of Europe, northern Africa, and the Middle East during the Last Glacial Maximum (21 000 yr BP) based on pollen data, Clim. Past, 20, 1939–1988, https://doi.org/10.5194/cp-20-1939-2024, 2024.
Deplazes, G., Lückge, A., Peterson, L. C., Timmermann, A., Hamann, Y., Hughen, K. A., Röhl, U., Laj, C., Cane, M. A., Sigman, D. M., and Haug, G. H.: Links between tropical rainfall and North Atlantic climate during the last glacial period, Nat. Geosci., 6, 213–217, https://doi.org/10.1038/ngeo1712, 2013.
Elenga, H., Peyron, O., Bonnefille, R., Jolly, D., Cheddadi, R., Guiot, J., Andrieu, V., Bottema, S., Buchet, G., De Beaulieu, J, L., Hamilton, A. C., Maley, J., Marchant, R., Perez-Obiol, R., Reille, M., Riollet, G., Scott, L., Straka, H., Taylor, D., Van Campo, E., Vincens, A., Laarif, F., and Jonson, H.: Pollen-based biome reconstruction for southern Europe and Africa 18,000 yr BPbp, J. Biogeogr., 27, 621–634, https://doi.org/10.1046/j.1365-2699.2000.00430.x, 2000.
Duan, R., Huang, G., Wang, F., Tian, C., and Wu, X.: Observations over a century underscore an increasing likelihood of compound dry-hot events in China, Earth's Future, 12, e2024EF004546, https://doi.org/10.1029/2024EF004546, 2024.
Flantua, S. G. A., Hooghiemstra, H., Grimm, E. C., Behling, H., Bush, M. B., González-Arango, C., Gosling, W. D., Ledru, M., P., Lozano-García, S., Maldonado, A., Prieto, A. R., Rull, V., and Van Boxel, J. H.: Updated site compilation of the Latin American Pollen Database, Rev. Palaeobot. Palynol., 223, 104–115, https://doi.org/10.1016/j.revpalbo.2015.09.008, 2015.
Flantua, S. G. A., Mottl, O., Felde, V. A., Bhatta, K. P., Birks, H. H., Grytnes, J, A., Seddon, A. W. R., and Birks, H. J. B.: A guide to the processing and standardization of global palaeoecological data for large-scale syntheses using fossil pollen, Global Ecol. Biogeogr., 32, 1377–1394, https://doi.org/10.1111/geb.13693, 2023.
Fyfe, R. M., de Beaulieu, J., L., Binney, H., Bradshaw, R. H. W., Brewer, S., Le Flao, A., Finsinger, W., Gaillard, M., J., Giesecke, T., Gil-Romera, G., Grimm, E. C., Huntley, B., Kunes, P., Kühl, N., Leydet, M., Lotter, A. F., Tarasov, P. E., and Tonkov, S.: The European Pollen Database: past efforts and current activities, Veg. Hist. Archaeobot., 18, 417–424, https://doi.org/10.1007/s00334-009-0215-9, 2009.
García-Herrera, R. and Barriopedro, D.: Climate of the Mediterranean Region, in: Oxford Research Encyclopedia of Climate Science, https://doi.org/10.1093/acrefore/9780190228620.013.509, 2018.
Gotanda, K., Nakagawa, T., Tarasov, P. E., and Yasuda, Y.: Disturbed vegetation reconstruction using the biomization method from Japanese pollen data: Modern and Late Quaternary samples, Quaternary Int., 184, 56–74, https://doi.org/10.1016/j.quaint.2007.09.030, 2008.
Giesecke, T., Davis, B., Brewer, S., Finsinger, W., Wolters, S., Blaauw, M., de Beaulieu, J., L., Binney, H., Fyfe, R. M., Gaillard, M., J., Gil-Romera, G., van der Knaap, W. O., Kuneš, P., Kühl, N., van Leeuwen, J. F. N., Leydet, M., Lotter, A. F., Ortu, E., Semmler, M., and Bradshaw, R. H. W.: Towards mapping the late Quaternary vegetation change of Europe, Veg. Hist. Archaeobot., 23, 75–86, https://doi.org/10.1007/s00334-012-0390-y, 2014.
Harris, I., Osborn, T. J., Jones, P., and Lister, D.: Version 4 of the CRU TS monthly high-resolution gridded multivariate climate dataset, Sci. Data, 7, 109, https://doi.org/10.1038/s41597-020-0453-3, 2020.
Harrison, S.: BIOME 6000 DB classified plotfile version 1, University of Reading [data set], https://doi.org/10.17864/1947.99, 2017.
Harrison, S. P., Prentice, I. C., Barboni, D., Kohfeld, K. E., Ni, J., and Sutra, J. P.: Ecophysiological and bioclimatic foundations for a global plant functional classification, J. Veg. Sci., 21, 300–317, https://doi.org/10.1111/j.1654-1103.2009.01144.x, 2010.
He, F. and Clark, P. U.: Freshwater forcing of the Atlantic Meridional Overturning Circulation revisited, Nat. Clim. Change, 12, 449–454, https://doi.org/10.1038/s41558-022-01328-2, 2022.
Herzschuh, U., Böhmer, T., Li, C., Cao, X., Heim, B., and Wieczorek, M.: Global taxonomically harmonized pollen data set for Late Quaternary with revised chronologies (LegacyPollen 1.0) [dataset publication series], PANGAEA [data set], https://doi.org/10.1594/PANGAEA.929773, 2021.
Herzschuh, U., Li, C., Böhmer, T., Postl, A. K., Heim, B., Andreev, A. A., Cao, X., Wieczorek, M., and Ni, J.: LegacyPollen 1.0: a taxonomically harmonized global late Quaternary pollen dataset of 2831 records with standardized chronologies, Earth Syst. Sci. Data, 14, 3213–3227, https://doi.org/10.5194/essd-14-3213-2022, 2022.
Hoogakker, B. A. A., Smith, R. S., Singarayer, J. S., Marchant, R., Prentice, I. C., Allen, J. R. M., Anderson, R. S., Bhagwat, S. A., Behling, H., Borisova, O., Bush, M., Correa-Metrio, A., de Vernal, A., Finch, J. M., Fréchette, B., Lozano-Garcia, S., Gosling, W. D., Granoszewski, W., Grimm, E. C., Grüger, E., Hanselman, J., Harrison, S. P., Hill, T. R., Huntley, B., Jiménez-Moreno, G., Kershaw, P., Ledru, M.-P., Magri, D., McKenzie, M., Müller, U., Nakagawa, T., Novenko, E., Penny, D., Sadori, L., Scott, L., Stevenson, J., Valdes, P. J., Vandergoes, M., Velichko, A., Whitlock, C., and Tzedakis, C.: Terrestrial biosphere changes over the last 120 kyr, Clim. Past, 12, 51–73, https://doi.org/10.5194/cp-12-51-2016, 2016.
Joos, F. and Spahni, R.: Rates of change in natural and anthropogenic radiative forcing over the past 20,000 years, P. Natl. Acad. Sci. USA, 105, 1425–1430, https://doi.org/10.1073/pnas.0707386105, 2008.
Kaplan, J. O., Bigelow, N. H., Prentice, I. C., Harrison, S. P., Bartlein, P. J., Christensen, T. R., Cramer, W., Matveyeva, N. V., McGuire, A. D., Murray, D. F., and Razzhivin, V. Y.: Climate change and Arctic ecosystems: 2. Modeling, paleodata-model comparisons, and future projections. J. Geophys. Res.-Atmos, 108, D19, https://doi.org/10.1029/2002JD002559, 2003.
Kapsch, M. L., Mikolajewicz, U., Ziemen, F., and Schannwell, C.: Ocean response in transient simulations of the last deglaciation dominated by underlying ice-sheet reconstruction and method of meltwater distribution, Geophys. Res. Lett., 49, e2021GL096767, https://doi.org/10.1029/2021GL096767, 2022.
Kleinen, T., Gromov, S., Steil, B., and Brovkin, V.: PalMod2 MPI-M MPI-ESM1-2-CR-CH4 transient-deglaciation-prescribed-glac1d-methane, World Data Center for Climate (WDCC) at DKRZ [data set], https://doi.org/10.26050/WDCC/PMMXMCHTD, 2023.
Köhler, P., Nehrbass-Ahles, C., Schmitt, J., Stocker, T. F., and Fischer, H.: A 156 kyr smoothed history of the atmospheric greenhouse gases CO2, CH4, and N2O and their radiative forcing, Earth Syst. Sci. Data, 9, 363–387, https://doi.org/10.5194/essd-9-363-2017, 2017.
Laskar, J., Robutel, P., Joutel, F., Gastineau, M., Correia, A. C. M., and Levrard, B.: A long-term numerical solution for the insolation quantities of the Earth, Astron. Astrophys., 428, 261–285, https://doi.org/10.1051/0004-6361:20041335, 2004.
Lebamba, J., Ngomanda, A., Vincens, A., Jolly, D., Favier, C., Elenga, H., and Bentaleb, I.: Central African biomes and forest succession stages derived from modern pollen data and plant functional types, Clim. Past, 5, 403–429, https://doi.org/10.5194/cp-5-403-2009, 2009.
Lézine, A. M., Watrin, J., Vincens, A., and Hély, C.: Are modern pollen data representative of west African vegetation?, Rev. Palaeobot. Palynol., 156, 265–276, https://doi.org/10.1016/j.revpalbo.2009.02.001, 2009.
Lézine, A. M., Ivory, S. J., Gosling, W. D., and Scott, L.: The African Pollen Database (APD) and tracing environmental change: State of the Art, in: Quaternary Vegetation Dynamics, edited by: Runge, J., Gosling, W., Lézine, A. M., and Scott, L., CRC Press, London, United Kingdom, 8, https://doi.org/10.1201/9781003162766-2, 2021.
Li, C., Postl, A. K., Böhmer, T., Cao, X., Dolman, A. M., and Herzschuh, U.: Harmonized chronologies of a global late Quaternary pollen dataset (LegacyAge 1.0), Earth Syst. Sci. Data, 14, 1331–1343, https://doi.org/10.5194/essd-14-1331-2022, 2022.
Li, C.: R scripts for “Global biome changes over the last 21,000 years inferred from model–data comparisons”, Zenodo, https://doi.org/10.5281/zenodo.15518530, 2025.
Li, C., Ni, J., Böhmer, T., Cao, X., Zhou, B., Liao, M., Li, K., Schild, L., Wieczorek, M., Heim, B., and Herzschuh, U.: LegacyPollen2.0: an updated global taxonomically and temporally standardized fossil pollen dataset of 3680 palynological records, PANGAEA [data set bundled publication], https://doi.org/10.1594/PANGAEA.965907, 2025.
Liu, Z., Otto-Bliesner, B. L., He, F., Brady, E. C., Tomas, R., Clark, P. U., Carlson, A. E., Lynch-Stieglitz, J., Curry, W., Brook, E., Erickson, D., Jacob, R., Kutzbach, J., and Cheng, J.: Transient simulation of last deglaciation with a new mechanism for Bølling-Allerød warming, Science, 325, 310–314, https://doi.org/10.1126/science.1171041, 2009.
Marchant, R., Berrio, J. C., Cleef, A., Duivenvoorden, J., Helmens, K., Hooghiemstra, H., Kuhry, P., Melief, B., Schreve-Brinkman, E., Van Geel, B., Van Reenen, G., and Van der Hammen, T.: A reconstruction of Colombian biomes derived from modern pollen data along an altitude gradient, Rev. Palaeobot. Palynol., 117, 79–92, https://doi.org/10.1016/S0034-6667(01)00078-1, 2001.
Marchant, R., Cleef, A., Harrison, S. P., Hooghiemstra, H., Markgraf, V., van Boxel, J., Ager, T., Almeida, L., Anderson, R., Baied, C., Behling, H., Berrio, J. C., Burbridge, R., Björck, S., Byrne, R., Bush, M., Duivenvoorden, J., Flenley, J., De Oliveira, P., van Geel, B., Graf, K., Gosling, W. D., Harbele, S., van der Hammen, T., Hansen, B., Horn, S., Kuhry, P., Ledru, M.-P., Mayle, F., Leyden, B., Lozano-García, S., Melief, A. M., Moreno, P., Moar, N. T., Prieto, A., van Reenen, G., Salgado-Labouriau, M., Schäbitz, F., Schreve-Brinkman, E. J., and Wille, M.: Pollen-based biome reconstructions for Latin America at 0, 6000 and 18 000 radiocarbon years ago, Clim. Past, 5, 725–767, https://doi.org/10.5194/cp-5-725-2009, 2009.
Marinova, E., Harrison, S. P., Bragg, F., Connor, S., de Laet, V., Leroy, S. A. G., Mudie, P., Atanassova, J., Bozilova, E., Caner, H., Cordova, C., Djamali, M., Filipova-Marinova, M., Gerasimenko, N., Jahns, S., Kouli, K., Kotthoff, U., Kvavadze, E., Lazarova, M., Novenko, E., Ramezani, E., Röpke, A., Shumilovskikh, L., Tanţau, I., and Tonkov, S.: Pollen-derived biomes in the Eastern Mediterranean–Black Sea–Caspian-Corridor, J. Biogeogr., 45, 484–499, https://doi.org/10.1111/jbi.13128, 2018.
Masoum, A., Nerger, L., Willeit, M., Ganopolski, A., and Lohmann, G.: Paleoclimate data assimilation with CLIMBER-X: An ensemble Kalman filter for the last deglaciation, PLoS One, 19, e0300138, https://doi.org/10.1371/journal.pone.0300138, 2024.
Mauritsen, T., Bader, J., Becker, T., Behrens, J., Bittner, M., Brokopf, R., Brovkin, V., Claussen, M., Crueger, T., Esch, M., Fast, I., Fiedler, S., Fläschner, D., Gayler, V., Giorgetta, M., Goll, D. S., Haak, H., Hagemann, S., Hedemann, C., Hohenegger, C., Ilyina, T., Jahns, T., Jimenéz-de-la-Cuesta, D., Jungclaus, J., Kleinen, T., Kloster, S., Kracher, D., Kinne, S., Kleberg, D., Lasslop, G., Kornblueh, L., Marotzke, J., Matei, D., Meraner, K., Mikolajewicz, U., Modali, K., Möbis, B., Müller, W. A., Nabel, J. E. M. S., Nam, C. C. W., Notz, D., Nyawira, S, S., Paulsen, H., Peters, K., Pincus, R., Pohlmann, H., Pongratz, J., Popp, M., Raddatz, T. J., Rast, S., Redler, R., Reick, C. H., Rohrschneider, T., Schemann, V., Schmidt, H., Schnur, R., Schulzweida, U., Six, K. D., Stein, L., Stemmler, I., Stevens, B., von Storch, J, S., Tian, F., Voigt, A., Vrese, P., Wieners, K, H., Wilkenskjeld, S., Winkler, A., and Roeckner, E.: Developments in the MPI-M Earth System Model version 1.2 (MPI-ESM1.2) and its response to increasing CO2, J. Adv. Model. Earth Syst., 11, 998–1038, https://doi.org/10.1029/2018MS001400, 2019.
Mikolajewicz, U., Kapsch, M., L., Gayler, V., Meccia, V. L., Riddick, T., Ziemen, F. A., and Schannwell, C.: PalMod2 MPI-M MPI-ESM1-2-CR Transient Simulations of the Last Deglaciation with prescribed ice sheets from ICE-6G reconstructions (r1i1p2f2), World Data Center for Climate (WDCC) at DKRZ [data set], https://doi.org/10.26050/WDCC/PMMXMCRTDIP122, 2023.
Montero, P. and Vilar, J. A.: TSclust: An R package for time series clustering, J. Stat. Softw., 62, 1–43, https://doi.org/10.18637/jss.v062.i01, 2015.
Müller, M.: Dynamic time warpingTime Warping, in: Information Retrieval for Music and Motion, edited by: Müller, M., Springer, Berlin, Heidelberg, Germany, 69–84, https://doi.org/10.1007/978-3-540-74048-3_4, 2007.
Ni, J., Cao, X., Jeltsch, F., and Herzschuh, U.: Biome distribution over the last 22,000 yr in China, Palaeogeogr. Palaeoclimatol. Palaeoecol., 409, 33–47, https://doi.org/10.1016/j.palaeo.2014.04.023, 2014.
Nolan, C., Overpeck, J. T., Allen, J. R. M., Anderson, P. M., Betancourt, J. L., Binney, H. A., Brewer, S., Bush, M. B., Chase, B. M., Cheddadi, R., Djamali, M., Dodson, J., Edwards, M. E., Gosling, W. D., Haberle, S., Hotchkiss, S. C., Huntley, B., Ivory, S. J., Kershaw, A. P., Kim, S., H., Latorre, C., Leydet, M., Lézine, A. M., Liu, K. B., Liu, Y., Lozhkin, A. V., McGlone, M. S., Marchant, R. A., Momohara, A., Moreno, P. I., Müller, S., Otto-Bliesner, B. L., Shen, C., Stevenson, J., Takahara, H., Tarasov, P. E., Tipton, J., Vincens, A., Weng, C., Xu, Q., Zheng, Z., and Jackson, S. T.: Past and future global transformation of terrestrial ecosystems under climate change, Science, 361, 920–923, https://doi.org/10.1126/science.aan5360, 2018.
O'Donnell, M. S. and Ignizio, D. A.: Bioclimatic predictors for supporting ecological applications in the conterminous United States, U.S. Geological Survey Data Series, 691, 1–10, 2012.
Ortega-Rosas, C. I., Guiot, J., Peñalba, M. C., and Ortiz-Acosta, M. E.: Biomization and quantitative climate reconstruction techniques in northwestern Mexico – With an application to four Holocene pollen sequences, Global Planet. Change, 61, 242–266, https://doi.org/10.1016/j.gloplacha.2007.10.006, 2008.
Peltier, W. R.: Global glacial isostasy and the surface of the ice-age Earth: the ICE-5G (VM2) model and GRACE, Annu. Rev. Earth Planet. Sci., 32, 111–149, https://doi.org/10.1146/annurev.earth.32.082503.144359, 2004.
Peltier, W. R., Argus, D. F., and Drummond, R.: Space geodesy constrains ice age terminal deglaciation: The global ICE-6G_C (VM5a) model, Geophys. Res.-Atmos., 120, 450–487, https://doi.org/10.1002/2014JB011176, 2015.
Pickett, E. J., Harrison, S. P., Hope, G., Harle, K., Dodson, J. R., Peter Kershaw, A. P.,., Colin Prentice, I. C., Backhouse, J., Colhoun, E. A., D'Costa, D., Flenley, J., Grindrod, J., Haberle, S., Hassell, C., Kenyon, C., Macphail, M., Martin, H., Martin, A. H., McKenzie, M., Newsome, J. C., Penny, D., Powell, J., Ian Raine, I. J., Southern, W., Stevenson, J., Sutra, J, P., Thomas, I., van der Kaars, S., and Ward, J.: Pollen-based reconstructions of biome distributions for Australia, Southeast Asia and the Pacific (SEAPAC region) at 0, 6000 and 18,000 14C yr BP, J. Biogeogr., 31, 1381–1444, https://doi.org/10.1111/j.1365-2699.2004.01001.x, 2004.
Prentice, C., Guiot, J., Huntley, B., Jolly, D., and Cheddadi, R.: Reconstructing biomes from palaeoecological data: a general method and its application to European pollen data at 0 and 6 ka, Clim. Dynam., 12, 185–194, https://doi.org/10.1007/BF00211617, 1996.
Prentice, I. C., Jolly, D., and Biome 6000 Participants: Mid-Holocene and glacial-maximum vegetation geography of the northern continents and Africa, J. Biogeogr., 27, 507–519, https://doi.org/10.1046/j.1365-2699.2000.00425.x, 2000.
Prentice, I. C. and Webb III, T.: BIOME 6000: reconstructing global mid-Holocene vegetation patterns from palaeoecological records, J. Biogeogr., 25, 997–1005, https://doi.org/10.1046/j.1365-2699.1998.00235.x, 1998.
R Core Team: R: A language and environment for statistical computing, R Foundation for Statistical Computing [code], Vienna, Austria, https://www.r-project.org/ (last access: 15 June 2024), 2023.
Ramankutty, N. and Foley, J. A.: Estimating historical changes in global land cover: Croplands from 1700 to 1992, Global Biogeochem. Cy., 13, 997–1027, https://doi.org/10.1029/1999GB900046, 1999.
Ramankutty, N., Foley, J. A., Hall, F. G., Collatz, G. J., Meeson, B. W., Los, S. O., Brown De Colstoun, E., and Landis, D. R.: ISLSCP II Potential Natural Vegetation Cover, ORNL DAAC [data set], https://doi.org/10.3334/ORNLDAAC/961, 2010.
Reick, C. H., Gayler, V., Goll, D., Hagemann, S., Heidkamp, M., Nabel, J. E. M. S., Raddatz, T., Roeckner, E., Schnur, R., and Wilkenskjeld, S.: JSBACH 3 – The land component of the MPI Earth System Model: documentation of version 3.2, Berichte zur Erdsystemforschung, MPI für Meteorologie, Hamburg, Germany, https://doi.org/10.17617/2.3279802, 2021.
Sánchez Goñi, M. F., Desprat, S., Daniau, A.-L., Bassinot, F. C., Polanco-Martínez, J. M., Harrison, S. P., Allen, J. R. M., Anderson, R. S., Behling, H., Bonnefille, R., Burjachs, F., Carrión, J. S., Cheddadi, R., Clark, J. S., Combourieu-Nebout, N., Mustaphi, Colin. J. Courtney, Debusk, G. H., Dupont, L. M., Finch, J. M., Fletcher, W. J., Giardini, M., González, C., Gosling, W. D., Grigg, L. D., Grimm, E. C., Hayashi, R., Helmens, K., Heusser, L. E., Hill, T., Hope, G., Huntley, B., Igarashi, Y., Irino, T., Jacobs, B., Jiménez-Moreno, G., Kawai, S., Kershaw, A. P., Kumon, F., Lawson, I. T., Ledru, M.-P., Lézine, A.-M., Liew, P. M., Magri, D., Marchant, R., Margari, V., Mayle, F. E., McKenzie, G. M., Moss, P., Müller, S., Müller, U. C., Naughton, F., Newnham, R. M., Oba, T., Pérez-Obiol, R., Pini, R., Ravazzi, C., Roucoux, K. H., Rucina, S. M., Scott, L., Takahara, H., Tzedakis, P. C., Urrego, D. H., van Geel, B., Valencia, B. G., Vandergoes, M. J., Vincens, A., Whitlock, C. L., Willard, D. A., and Yamamoto, M.: The ACER pollen and charcoal database: a global resource to document vegetation and fire response to abrupt climate changes during the last glacial period, Earth Syst. Sci. Data, 9, 679–695, https://doi.org/10.5194/essd-9-679-2017, 2017a.
Sánchez Goñi, M. F., Desprat, S., Daniau, A.-L., Bassinot, F. C., Polanco-Martínez, J. M., Harrison, S. P., Allen, J. R. M., Anderson, R. S., Behling, H., Bonnefille, R., Burjachs, F., Carrión, J. S., Cheddadi, R., Clark, J. S., Combourieu-Nebout, N., Courtney-Mustaphi, C. J., DeBusk, G. H., Dupont, L. M., Finch, J. M., Fletcher, W. J., Giardini, M., González, C., Gosling, W. D., Grigg, L. D., Grimm, E. C., Hayashi, R., Helmens, K. F., Heusser, L. E., Hill, T. R., Hope, G., Huntley, B., Igarashi, Y., Irino, T., Jacobs, B. F., Jiménez-Moreno, G., Kawai, S., Kershaw, A. P., Kumon, F., Lawson, I. T., Ledru, M.-P., Lézine, A.-M., Liew, P.-M., Magri, D., Marchant, R., Margari, V., Mayle, F. E., McKenzie, G. M., Moss, P. T., Müller, S., Müller, U. C., Naughton, F., Newnham, R. M., Oba, T., Pérez-Obiol, R. P., Pini, R., Ravazzi, C., Roucoux, K. H., Rucina, S. M., Scott, L., Takahara, H., Tzedakis, P. C., Urrego, D. H., van Geel, B., Valencia, B. G., Vandergoes, M. J., Vincens, A., Whitlock, C. L., Willard, D. A., and Yamamoto, M.: The ACER pollen and charcoal database [dataset publication series], PANGAEA, https://doi.org/10.1594/PANGAEA.870867, 2017b.
Shanahan, T. M., McKay, N. P., Hughen, K. A., Overpeck, J. T., Otto-Bliesner, B., Heil, C. W., King, J., Scholz, C. A., and Peck, J.: The time-transgressive termination of the African Humid Period, Nat. Geosci., 8, 140–144, https://doi.org/10.1038/ngeo2329, 2015.
Socorro, D. V. and Goring, S.: neotoma2: Working with the Neotoma Paleoecology Database, R package version 1.0.3 [code], https://github.com/NeotomaDB/neotoma2 (last access: 10 June 2024), 2024.
Song, X., Wang, D. Y., Li, F., and Zeng, X. D.: Evaluating the performance of CMIP6 Earth system models in simulating global vegetation structure and distribution, Adv. Clim. Change Res., 12, 584–595, https://doi.org/10.1016/j.accre.2021.06.008, 2021.
Syakur, M. A., Khotimah, B. K., Rochman, E. M. S., and Satoto, B. D.: Integration k-means clustering method and elbow method for identification of the best customer profile cluster, IOP Conf. Ser. Mater. Sci. Eng., 336, 012017, https://doi.org/10.1088/1757-899X/336/1/012017, 2018.
Tarasov, L., Dyke, A. S., Neal, R. M., and Peltier, W. R.: A data-calibrated distribution of deglacial chronologies for the North American ice complex from glaciological modeling, Earth Planet. Sci. Lett., 315–316, 30–40, https://doi.org/10.1016/j.epsl.2011.09.010, 2012.
Thompson, R. S. and Anderson, K. H.: Biomes of western North America at 18,000, 6000 and 0 14C yr BPbp reconstructed from pollen and packrat midden data, J. Biogeogr., 27, 555–584, https://doi.org/10.1046/j.1365-2699.2000.00427.x, 2000.
Tian, F., Cao, X., Dallmeyer, A., Lohmann, G., Zhang, X., Ni, J., Andreev, A., Anderson, P. M., Lozhkin, A. V., Bezrukova, E., Rudaya, N., Xu, Q., and Herzschuh, U.: Biome changes and their inferred climatic drivers in northern and eastern continental Asia at selected times since 40 cal ka BPbp, Veg. Hist. Archaeobot., 27, 365–379, https://doi.org/10.1007/s00334-017-0653-8, 2018.
van Langevelde, F., van de Vijver, C. A. D. M., Prins, H. H. T., and Groen, T. A.: Effects of grazing and browsing on tropical savanna vegetation, in: The Ecology of Browsing and Grazing II, edited by: Gordon, I. J. and Prins, H. H. T., Springer International Publishing, Cham, Switzerland, 237–257, https://doi.org/10.1007/978-3-030-25865-8_10, 2019.
Vincens, A., Bremond, L., Brewer, S., Buchet, G., and Dussouillez, P.: Modern pollen-based biome reconstructions in East Africa expanded to southern Tanzania, Rev. Palaeobot. Palynol., 140, 187–212, https://doi.org/10.1016/j.revpalbo.2006.04.003, 2006.
Wieczorek, M. and Herzschuh, U.: Compilation of relative pollen productivity (RPP) estimates and taxonomically harmonised RPP datasets for single continents and Northern Hemisphere extratropics, Earth Syst. Sci. Data, 12, 3515–3528, https://doi.org/10.5194/essd-12-3515-2020, 2020.
Willeit, M. and Ganopolski, A.: PALADYN v1.0, a comprehensive land surface–vegetation–carbon cycle model of intermediate complexity, Geosci. Model Dev., 9, 3817–3857, https://doi.org/10.5194/gmd-9-3817-2016, 2016.
Willeit, M., Ganopolski, A., Robinson, A., and Edwards, N. R.: The Earth system model CLIMBER-X v1.0 – Part 1: Climate model de scription and validation, Geosci. Model Dev., 15, 5905–5948, https://doi.org/10.5194/gmd-15-5905-2022, 2022.
Willeit, M., Ilyina, T., Liu, B., Heinze, C., Perrette, M., Heinemann, M., Dalmonech, D., Brovkin, V., Munhoven, G., Börker, J., Hartmann, J., Romero-Mujalli, G., and Ganopolski, A.: The Earth system model CLIMBER-X v1.0 – Part 2: The global carbon cycle, Geosci. Model Dev., 16, 3501–3534, https://doi.org/10.5194/gmd-16-3501-2023, 2023.
Williams, J. W., Webb III, T., Richard, P. H., and Newby, P.: Late Quaternary biomes of Canada and the eastern United States, J. Biogeogr., 27, 585–607, https://doi.org/10.1046/j.1365-2699.2000.00428.x, 2000.
Williams, J. W., Grimm, E. C., Blois, J. L., Charles, D. F., Davis, E. B., Goring, S. J., Graham, R. W., Smith, A. J., Anderson, M., Arroyo-Cabrales, J., Ashworth, A. C., Betancourt, J. L., Bills, B. W., Booth, R. K., Buckland, P. I., Curry, B. B., Giesecke, T., Jackson, S. T., Latorre, C., Nichols, J., Purdum, T., Roth, R. E., Stryker, M., and Takahara, H.: The Neotoma Paleoecology Database, a multiproxy, international, community-curated data resource, Quaternary Res., 89, 156–177, https://doi.org/10.1017/qua.2017.105, 2018.
Xu, Q., Cao, X., Tian, F., Zhang, S., Li, Y., Li, M., Li, J., Liu, Y., and Liang, J.: Relative pollen productivities of typical steppe species in northern China and their potential in past vegetation reconstruction, Sci. China Earth Sci., 57, 1254–1266, https://doi.org/10.1007/s11430-013-4738-7, 2014.
Zhou, B., Liao, M., Li, K., Xu, D., Chen, H., Ni, J., Cao, X., Kong, Z., Xu, Q., Zhang, Y., Herzschuh, U., Cai, Y., Chen, B., Chen, J., Chen, L., Cheng, B., Gao, Y., Huang, C., Huang, X., Li, S., Li, W., Liao, G., Liu, G., Liu, P., Liu, X., Ma, C., Song, C., Sun, X., Tang, L., Wang, M., Wang, Y., Xia, Y., Xu, J., Yan, S., Yang, X., Yao., Y., Ye, C., Zhang, Z., Zhao, Z., Zheng, Z., and Zhu, C.: A fossil pollen dataset of China, Chin. J. Plant Ecol., 47, 1453–1463, https://doi.org/10.17521/cjpe.2022.0316, 2023 (in Chinese).