the Creative Commons Attribution 4.0 License.
the Creative Commons Attribution 4.0 License.
Simultaneous seasonal dry/wet signals in eastern and central Asia since the Last Glacial Maximum
Simin Peng
Yu Li
Zhansen Zhang
Mingjun Gao
Xiaowen Chen
Junjie Duan
Yaxin Xue
The East Asian monsoon region with the summer precipitation regime and the Mediterranean climate region with the winter precipitation regime show opposite dry/wet changes since the Last Glacial Maximum (LGM). Therefore, different precipitation regimes bring about the opposing changes in dry/wet states between eastern and central Asia (EA and CA). Based on a comprehensive study of modern observational datasets, ensemble simulations of eight climate models from the Paleoclimate Modeling Intercomparison Project phase 3 (PMIP3), and a compilation of 42 proxy records from EA and CA, here we assess the relationship of seasonal precipitation signals involving rain and heat periods and the difference and linkage in dry/wet states from EA and CA. At short-term timescales, empirical orthogonal function (EOF) analysis results of mean annual precipitation show the spatial diversity of overall precipitation patterns in EA and CA. However, EOF results of summer and winter precipitation indicate a similarity between EA and the east of CA, suggesting that seasonal signals of precipitation affected by the Asian monsoon, westerlies, ENSO, the North Atlantic Oscillation (NAO), and the Pacific Decadal Oscillation (PDO) are the primary factors causing the linkage in dry/wet states.
At long-term timescales, reconstructed dry/wet states from proxy records since the LGM reveal a parallel evolution in EA and the east of CA as well. A visual inspection from PMIP3 multi-model simulations in summer and winter shows that the insolation in different seasons controls the intensity of westerlies and summer monsoon and further influences the summer and winter precipitation in EA and CA since the LGM. Overall, we suggest, in addition to the traditional difference caused by different precipitation regimes, that dry/wet states in EA and CA universally have inter-regional connections affected by seasonal signals of precipitation at multiple timescales.
- Article
(8566 KB) - Full-text XML
-
Supplement
(588 KB) - BibTeX
- EndNote
As typical midlatitude climatic regions, eastern and central Asia (EA and CA) commonly feature vigorous circulations and are dominated by two atmospheric systems, namely midlatitude westerlies and Asian monsoon (Li, 1990; Zhang and Lin, 1992; Chen et al., 2008; Nagashima et al., 2011). These two regions are generally characterized by opposite climate and environment changes, embodied in water resources, vegetation cover, and ecosystems, which gives rise to their different responses to climate change (Sorg et al., 2012; Zhang and Feng, 2018). CA, where precipitation is scarce throughout the year, is the largest arid region in the midlatitudes dominated by westerlies (Chen et al., 2009; Huang et al., 2015a). On the contrary, affected by the Asian summer monsoon that carries water vapor from the Pacific and Indian oceans, the monsoon-dominated EA receives more precipitation (Wang et al., 2017). These contrasting climate regimes have attracted much research interest.
Over the past few years, there have been many comparative studies for dry/wet changes in EA and CA on a range of timescales, e.g., orbital, millennial, interdecadal, and annual timescales. Early works suggested that the climate change mode of “cold–wet” or “warm–dry” occurred in northwestern China during the last glacial/interglacial cycle, which is different from the “cold–dry” or “warm–wet” modes of the monsoon climate (Li, 1990; Han and Qu, 1992; Han et al., 1993). In monsoonal EA, a strengthened summer monsoon and humid climate usually occurred in the early and mid-Holocene, and a weakened summer monsoon and drier climate prevailed during the late Holocene (Dykoski et al., 2005; Chen et al., 2015). Based on the integration of paleoclimate records, modern meteorological observation data, and paleoclimate simulations, Chen et al. (2008, 2009, 2019) revealed that the westerlies-dominated climatic regime in arid CA presents a dry early Holocene, a wetter mid-Holocene, and a moderately wet late Holocene, which is out of phase or anti-phased with dry/wet states in the monsoon-dominated regions. However, paleoclimate records in some regions of CA indicate an asynchronous climate history, in contradiction with dry/wet changes caused by the westerlies (An et al., 2006; Zhao et al., 2015; Wang et al., 2018). More recent studies proposed that the persistent weakening of the East Asian summer monsoon since 1958 has caused an increasing contribution of the monsoonal water vapor transport, thereby enhancing summer precipitation in arid CA on the annual timescale (C. Chen et al., 2021; F. Chen et al., 2021). Therefore, further research is needed to explain dry/wet changes in different regions and explore the difference and linkage in climate change modes from EA and CA at multiple timescales.
The seasonal signals of precipitation, derived from the simultaneity of rain and heat periods, is an important climate phenomenon on seasonal to orbital timescales. It involves enhanced precipitation at a seasonal scale during Northern Hemisphere summer and during warm periods on long-term timescales. Reduced precipitation occurs during Northern Hemisphere winter and during long-term cold periods. This study aims to focus on the transitional zone in the arid and semi-arid region of eastern CA where the westerlies and the monsoon interact with the summer precipitation regime in a similar way to the monsoon-dominated EA. Utilizing modern observations, paleoclimate proxies, and model simulations, we conducted a comprehensive analysis of changes in dry/wet states in EA and CA on annual to millennial timescales based on seasonal signals of precipitation.
2.1 Study area
In this study, we divide the boundaries of CA and EA mainly according to the modern Asian summer monsoon limit defined by Chen et al. (2008, 2019). CA is the largest arid and semi-arid area in the midlatitude hinterland of the Eurasian continent, extending from the Caspian Sea in the west to the western Hexi Corridor in the east, comprising the central Asian countries, NW China, and the southern Mongolian Plateau (Fig. 1). Considering that the strength and trajectory of monsoon circulation is a major control of moisture in EA, the regional scope of EA for this study is defined as the Chinese monsoon region in the east and south of the modern Asian summer monsoon limit in China (Fig. 1). We calculated the precipitation difference between the summer (April to September) and winter (October to March) half-year between 1971 and 2020 and defined the region greater than 0 mm as an area of simultaneous rain and heat periods. Therefore, we define the simultaneous region of rain and heat periods in CA as the east of CA (Fig. 1). The seasonality perspective implies that different precipitation regimes could affect the difference and linkage in climate change modes from EA and CA at multiple timescales. Taking seasonal signals as the dividing criteria, the core region of CA is characterized by a wet cold-season climate, whereas EA and the east of CA are characterized by a wet warm-season climate (Fig. 1).
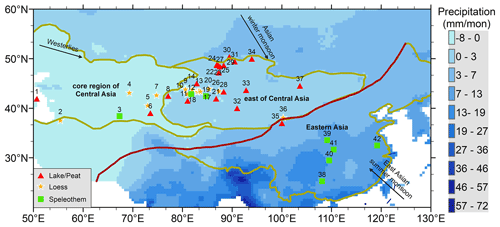
Figure 1Overview map showing the paleoclimate record sites selected in this study from EA and CA, the difference between summer and winter precipitation from 1965–2014 (shade), and the dominant circulation systems, including the westerlies, the Asian winter monsoon, and the East Asian summer monsoon. The modern Asian summer monsoon limit (solid red line) is summarized by Chen et al. (2008, 2019). The solid brown line represents the ranges of the core region of CA, the east of CA, and EA as defined in this study.
2.2 Modern observation and analytical methods
The monthly high-resolution (0.5° × 0.5°) land precipitation data (referred to as CRU TS4.06) are selected from a Climatic Research Unit (CRU) updated gridded climate dataset from the University of East Anglia (van der Schrier et al., 2013; Harris et al., 2014; Barichivich et al., 2021). The CRU monthly climate archives are obtained from the auspices of the World Meteorological Organization (WMO) and the US National Oceanographic and Atmospheric Administration (NOAA; via its National Climatic Data Center, NCDC). The Global Reanalysis 1 datasets include monthly mean geopotential height, zonal wind, and meridional wind and are collected from the National Centers for Environmental Prediction/National Center for Atmospheric Research (NCEP/NCAR) (Kalnay et al., 1996). The reanalysis datasets have a horizontal resolution of 2.5° in latitude and longitude and a vertical resolution of 17 pressure levels from 1000 to 10 hPa. The high-resolution monthly averaged data for the vertical integral water vapor from the European Centre for Medium-Range Weather Forecasts (ECMWF; reanalysis v5 (ERA5)), intended to be used as a meteorological forcing dataset for land surface and hydrological models, is used in this study. This dataset covers the period from 1979 to the present with a spatial resolution of 0.25° in latitude and longitude and a single level integrated from the surface to the top of the atmosphere (Hersbach et al., 2020).
We used the National Center for Environmental Information (NCEI) Pacific Decadal Oscillation (PDO) index based on NOAA's extended reconstruction of SSTs (ERSST Version 5) to analyze the long-lived El Niño-like pattern of Pacific climate variability (Mantua and Hare, 2002). The data can be obtained at https://www.ncei.noaa.gov/pub/data/cmb/ersst/v5/index/ersst.v5.pdo.dat. The Niño 3.4 index is the most commonly used index to define El Niño and La Niña events. We selected the Niño 3.4 of area-averaged SST from 5° S–5° N and 170–120° W using the HadISST1 dataset (Rayner et al., 2003). The data can be obtained at https://psl.noaa.gov/gcos_wgsp/Timeseries/Nino34/. Positive values of the North Atlantic Oscillation (NAO) index are typically associated with stronger midlatitude westerlies and increased water vapor content from the North Atlantic. We used the Hurrell NAO index (station-based) to investigate the impact of the NAO on midlatitude westerlies (Hurrell, 1995; Hurrell and Deser, 2009). The data can be obtained at https://climatedataguide.ucar.edu/sites/default/files/2022-10/nao_station_monthly.txt (last access: 27 October 2024).
Empirical orthogonal function (EOF) is a powerful method for dimensionality reduction and pattern extraction. EOF can decompose multidimensional climate data from different locations into spatial (EOF modes) and temporal (principal components) functions. Therefore, to investigate the spatiotemporal variations of precipitation at the interannual timescale over EA and CA, an EOF analysis was applied to the CRU TS4.06 gridded precipitation data and ERA5 vertical integral water vapor. We focused on the first two leading modes that objectively account for the majority of dry/wet changes in EA and CA (Lorenz, 1956).
2.3 Calculation of monsoon and westerly wind indices
The East Asian summer monsoon index (EASMI) is defined as the 850 hPa average summer meridional wind speed from June to August over 27–37° N, 110–120° E, encompassing the East Asian summer monsoon domain (Liu et al., 2014). The equation is as follows:
The westerly wind index (WWI) is defined as the zonal difference of the 500 hPa averaged geopotential height over 35–50° N, 70–110° E (Li et al., 2008). The equation is as follows:
where H is the 500 hPa average height geopotential and γ is the number of longitudes taken along the latitude circle with a spacing of 2.5°.
The East Asian winter monsoon index (EAWMI) is defined as the difference between the 300 hPa averaged zonal wind speed from December to February over 27.5–37.5° N, 110°–170° E and 50–60° N, 80–140° E (Jhun and Lee, 2004). The equation is as follows:
The calculation of EASMI, WWI, and EAWMI all rely on the NCEP Reanalysis 1 dataset.
2.4 Regional paleoclimatic proxy data
Here we compiled various paleoclimate records to reconstruct long-term climate variability and primarily paid close attention to paleo-precipitation and moisture changes since the Last Glacial Maximum (LGM). We set three criteria to collect all the published proxy records from EA and CA in our study. Firstly, the records should be located primarily in the intersection encompassing the simultaneous region of rain and heat periods in EA and CA, which is in favor of investigating the difference and linkage in climate change modes from EA and CA. Accordingly, some typical records climatologically influenced by the midlatitude westerlies and the East Asian summer monsoon in core regions of CA and EA were selected for comparative analysis. Secondly, the proxies should be clearly indicative of changes in effective moisture or precipitation which have been confirmed by the original investigators. Thirdly, the record length should cover most of the period since the LGM without documented depositional hiatuses. Fourthly, the fluctuation and variation in proxy records should be predominantly forced by climate change, rather than human activities (Manoj et al., 2020; S. Chen et al., 2021, 2022). Following the above criteria, a total of 42 proxy records from lakes, peats, loess, and stalagmites reaching back to the LGM were compiled for EA and CA (Fig. 1), enabling us to comprehensively review the LGM moisture evolution of the region. To avoid the effect of chronological anomalies, this study usually selects paleoclimate records with at least five chronological markers. In light of seasonal signals of precipitation, 35 records are from the summer precipitation region, and 7 records are from the winter precipitation region. Differences in geographic location, hydrological setting, depositional proxies used, and sensitivities prevented linear comparisons between individual records (Chen et al., 2008), so ordered humidity classes are specified to investigate dry/wet states in this study. We divided the LGM into four time points: LGM (22–19 cal ka), early Holocene (EH; 11.7-8.2 cal ka), mid-Holocene (MH; 8.2–4.2 cal ka), and late Holocene (LH; 4.2–0 cal ka). Dry/wet conditions were coded on the basis of effective moisture in the original literature: wet, dry, moderately wet, and moderately dry, respectively, which indicates the period of wetter, dryer, and moderate status at that particular site during the LGM (Fig. 4). Detailed information about these selected proxy records is presented in Table S1 of the Supplement.
2.5 Paleoclimatic simulations
The Paleoclimate Modeling Intercomparison Project (PMIP) was launched to coordinate and encourage the systematic study of general circulation models (GCMs) and to understand the mechanisms of climate change and the role of climate feedback (Joussaume et al., 1999) (Table 1). Eight coupled GCMs covering the LGM or MH from the PMIP3 database were selected to analyze the mechanisms of climate change in this study (Table 2), including bcc-csm1-1, CNRM-CM5, CCSM4, CSIRO-Mk3-6-0, GISS-E2-R, MIROC-ESM, FGOALS-s2, and MRI-CGCM3. The output data of the PMIP3 in the LGM and MH are available at https://esgf-node.llnl.gov/search/esgf-llnl/ (last access: 27 October 2024). By interpolating various climate variables on the common 1° × 1° grid and then sorting the values of model simulations from minimum to maximum, we extracted the median value of all PMIP3 models used in this paper to evaluate the PMIP3 model simulations and acquire the scientific model simulation value.
Table 2Basic information about climate models from PMIP3–CMIP5 used in this study.
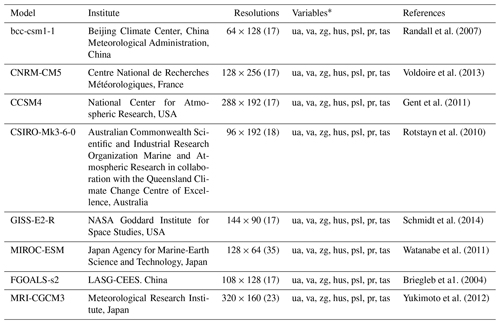
* ua means eastward_wind, va means northward wind, zg means geopotential height, hus means near-surface relative humidity, psl means sea surface pressure, pr means precipitation, and tas means near-surface temperature.
3.1 Seasonal signals at short-term timescales
To obtain the spatial distribution characteristics of the precipitation anomalies in EA and CA in the context of seasonal signals, we conducted an EOF analysis on the precipitation standardized anomaly field from 1971–2020. Figure S1a-d shows the spatial distribution and time series of EOF decomposition of mean annual precipitation. The center of negative values is in the core region of CA, mainly belonging to the winter precipitation regime, while the positive values are in the south and north of EA located in summer precipitation regions (Fig. S1a in the Supplement). This opposite distribution indicates that a difference in the mean annual precipitation exists between EA and CA. Additionally, the first mode exhibits interdecadal and interannual changes according to the PC1 (Fig. S1b). The second mode indicates that the center of positive values is in the north of EA and that the center of negative values is in the north of CA, also displaying the spatial diversity of mean annual precipitation in EA and CA (Fig. S1c).
In order to further explore the contribution of seasonal signals of precipitation to dry/wet conditions in EA and CA, we conducted EOF analysis on spring, summer, fall, and winter precipitation data. The variance contribution rate of the first mode of precipitation of four seasons is shown in Fig. 2. The first mode of spring and fall precipitation does not show obvious distribution characteristics, and the contribution rate is relatively uniform, indicating that spring and fall precipitation have no special precipitation contribution to EA and CA (Fig. 2a and c). In relation to summer precipitation, centers of positive values are mainly distributed in the north of EA and the east of CA, while the negative values are mainly distributed in the core regions of CA and in central EA (Fig. 2b). However, similar EOF results between CA and the south of EA do not exist in winter precipitation. This spatial distribution indicates that summer precipitation mainly affects dry/wet conditions in the north of EA and the east of CA belonging to the regions of simultaneous rain and heat periods, which is in contrast to the core region of CA. In relation to winter precipitation, the center of the positive value is located in the core region of CA and the north of EA, showing the significant contribution of winter precipitation to CA (Fig. 2d). It is worth noting that a certain degree of similarity exists in both summer and winter precipitation of EA and CA, indicating the impact of seasonal precipitation on the linkage of dry/wet conditions in EA and CA at short-term timescales.
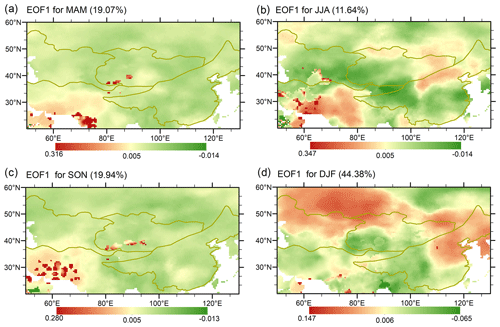
Figure 2The first EOF modes of precipitation in spring (March, April, and May; MAM) (a), summer (June, July, and August; JJA) (b), fall (September, October, and November; SON) (c), and winter (December, January, and February; DJF) (d) in EA and CA from 1971–2020.
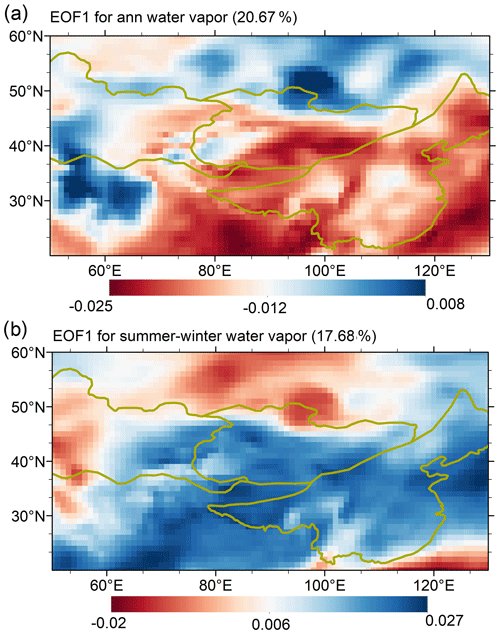
Existing studies emphasized the role of water vapor sources in affecting interannual to interdecadal variability in precipitation (Chen and Huang, 2012; Huang et al., 2015a; Peng and Zhou, 2017; Wei et al., 2017). Therefore, by analyzing the EOF results of water vapor content in the whole layer, this study investigates the general characteristics of the spatial distribution of water vapor in EA and CA and discusses the mechanisms controlling seasonal signals in dry/wet conditions in EA and CA at short-term timescales. The EOF1 of the mean annual water vapor shows that the core region of CA is dominated by positive values, while both EA and the east of CA have negative values (Fig. 3a). The same spatial distribution mode is also reflected in the EOF1 of water vapor difference between summer and winter. To summarize, the water vapor in EA and CA shows a dipole out-of-phase pattern between the simultaneous region of rain and heat periods and the non-simultaneous region of rain and heat periods (Fig. 3b). This implies that the content and source of water vapor are the important reasons why dry/wet states in the east of CA are linked to those in EA by seasonal signals of precipitation.
3.2 Spatiotemporal variation in dry/wet status and seasonal signals at long-term timescales
In the last decade, many paleoclimate records with a relatively high resolution, reliable chronology, and robust proxies have been published to discuss the long-term timescale climate evolution in EA and CA. Moisture records from 42 individual sites are used to illustrate the spatiotemporal pattern of dry/wet conditions during the LGM, EH, MH, and LH in EA and CA (Fig. 4). During the LGM, most regions in EA and CA have moderately dry conditions (Fig. 4a). However, moderately wet and wet conditions partly exist in the east of CA. According to the model simulation, Yu et al. (2000) concluded that the low temperature in the cold period causes decreasing evaporation, with the enhanced westerlies driven by expanding land ice sheets, forming the high lake levels in western China and the low lake levels in eastern China during the LGM. During the early Holocene (EH), CA was dominated by a dry climate, while EA was moderately wet (Fig. 4b). At the same time, there were many records in the east of CA showing similar dry/wet changes to EA. During the MH, wet conditions mainly occur in the core region of CA, gradually turning into moderately wet and even dry conditions in the east of CA, while EA remains moderately wet (Fig. 4c). By the late Holocene (LH), EA is characterized by dry conditions, while CA is wet (Fig. 4d). In particular, the dry conditions during the LGM and the wet climate during the EH and MH also reflect another meaning of seasonal signals derived from the simultaneity of rain and heat periods at long-term timescales, namely the “dry–cold” pattern and the “wet–warm” pattern.
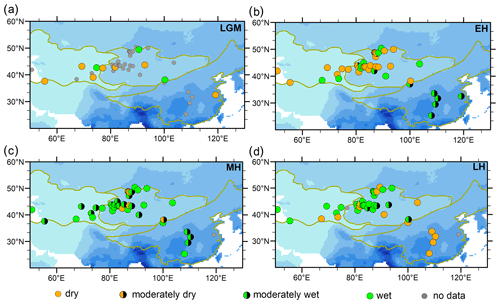
Figure 4Spatiotemporal characteristics of dry/wet conditions from 42 records since the LGM, based on the confirmation of original investigators, during the LGM, the early Holocene (EH), the mid-Holocene (MH), and the late Holocene (LH). Records with an incomplete stage are shown by a gray dot. There are four summarized levels of dry/wet conditions: wet, moderately wet, moderately dry, and dry.
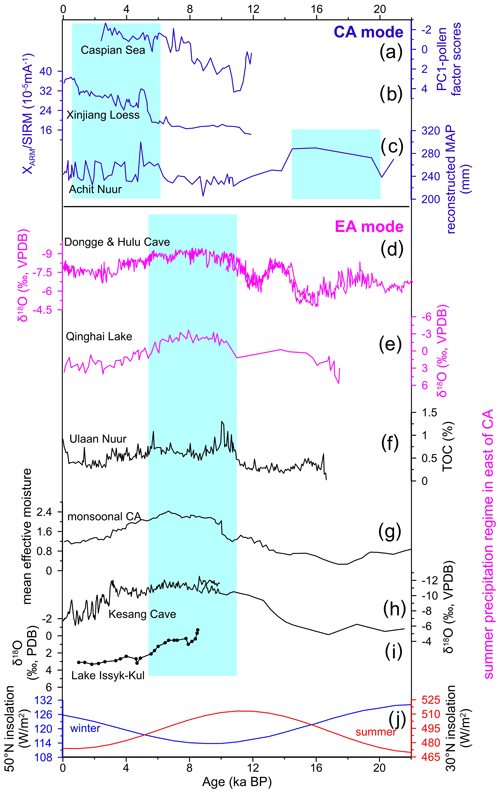
Figure 5A comparison of proxy variability recorded in EA and CA. (a) Pollen record from the Caspian Sea (Leroy et al., 2014). (b) XARM SIRM in the LJW10 section of the Xinjiang loess (Chen et al., 2016). (c) Reconstructed mean annual precipitation (MAP) from Achit Lake (Sun et al., 2013). (d) Speleothem δ18O value records from Dongge Cave and Hulu Cave (Yuan et al., 2004; Wang et al., 2001). (e) δ18O of ostracod shells from Qinghai Lake (Liu et al., 2007). (f) Total organic carbon (TOC) from Ulaan Lake (Lee et al., 2013). (g) Mean effective moisture from monsoonal central Asia (Herzschuh, 2006). (h) δ18O from Kesang Cave (Cheng et al., 2016). (i) δ18O from Issyk-Kul (Ricketts et al., 2001). (j) Summer (red line) insolation at 30° N and winter (blue line) insolation at 50° N (Berger, 1978). Blue shadows indicate the wet period of paleoclimate proxies.
In detail, we further performed a comparative analysis of the time series of typical proxy records in EA and CA (Fig. 5). The reconstructed precipitation records covering the past 22 600 years from Achit Lake suggest wet conditions prevailing from 22 600 to 13 200 cal BP (Fig. 5c). Pollen data from the Caspian Sea, controlled by the westerlies, suggest that the terrestrial vegetation around the Caspian Sea changed from desert/desert steppe to dry shrubland/forest over the last ∼ 12 000 years during the Holocene, revealing the continuous wetting process since the EH and the wettest LH (Fig. 5a). Meanwhile, results of climatically sensitive magnetic properties from the Xinjiang loess record demonstrate that the relatively wet conditions are generally formed after ∼ 6000 cal BP, with the wettest climate occurring during the LH (Fig. 5b) (Chen et al., 2016). However, there are inconsistencies related to dry/wet changes at long-term timescales in the east of CA, which are different from core regions of CA but similar to EA. Herzschuh (2006) analyzed 75 paleoclimatic records in CA and revealed that wet conditions occurred during the EH and MH, while the LGM was characterized by the dry climate (Fig. 5h), indicating the similarity to the monsoon climate represented by the speleothem δ18O records from Dongge Cave and Hulu Cave (Fig. 5d). High precipitation in the EH and MH, indicated by δ18O records of ostracod shells from Qinghai Lake, shows that the climate at Qinghai Lake since the Late Glacial reflects the monsoon-dominated characteristic (Fig. 5e). The climate at Ulaan Lake is wettest during the EH, humid during the MH, and dry in the LH, embodying a typical characteristic of the East Asian summer monsoon (Fig. 5f). Based on the sediment cores from Karakul Lake and Issyk-Kul, the EH and MH are characterized by wetter conditions in the region, and the lake level remained low during the LGM (Fig. 5g and j). Furthermore, the regional climate in western China, inferred from the speleothem oxygen–carbon isotope data from Kesang Cave, suggests a close coupling with the Asian summer monsoon (Fig. 5i). The lake level and climate reconstructed results also showed that the “dry–cold” pattern triggered a substantial lowering of lake level in most of arid western China, challenging the view of the “wet–cold” pattern and high lake levels during the LGM (Zhao et al., 2015).
4.1 Possible dynamics of seasonal signals at short-term timescales
EOF analysis of precipitation and water vapor consistently indicates that a connection between EA and the east of CA exists under the traditional differentiation between EA and the core region of CA. Considering that the east of CA is controlled by the summer precipitation regime, we propose that seasonal signals of precipitation contribute to the connection between EA and the east of CA.
Generally, atmospheric circulation has important effects on the spatial distribution and the transportation of water vapor. In order to explore the influence of the modern air–sea circulation on the summer and winter precipitation, we analyzed the time series of the precipitation PC1, WWI, EAWMI, EASMI, NAO, PDO, and ENSO from 1971 to 2020 (Figs. 6 and 7). Comparing the winter precipitation PC1 with WWI and EAWMI (Fig. 6), the weakening of the westerlies and winter monsoons is usually accompanied by an increase in winter precipitation. However, there is not a significant relationship between PC1 of summer precipitation and EASMI. As shown in Fig. 7, summer PDO and ENSO are basically similar to winter PDO and ENSO. However, the marked discrepancy exists in the evolution of winter NAO and summer NAO. The NAO and ENSO indices represent interannual variation, whereas the PDO index has an interdecadal cycle. The NAO index and the winter precipitation PC1 have a positive correlation, suggesting that the North Atlantic may have certain effects on the winter precipitation through the air–sea interaction. Positive values of the NAO index are usually accompanied by stronger midlatitude westerlies and increased water vapor content from the North Atlantic. The ENSO changes, however, were related to the summer precipitation PC1. Winter and summer precipitation before the 1980s showed a gradually increasing trend, while PDO values showed a gradually decreasing trend. On the contrary, PDO showed a positive phase when winter and summer precipitation enhanced at interdecadal timescales from 1980–2000. Since the 2000s, the development of winter and summer precipitation has not been connected with PDO.
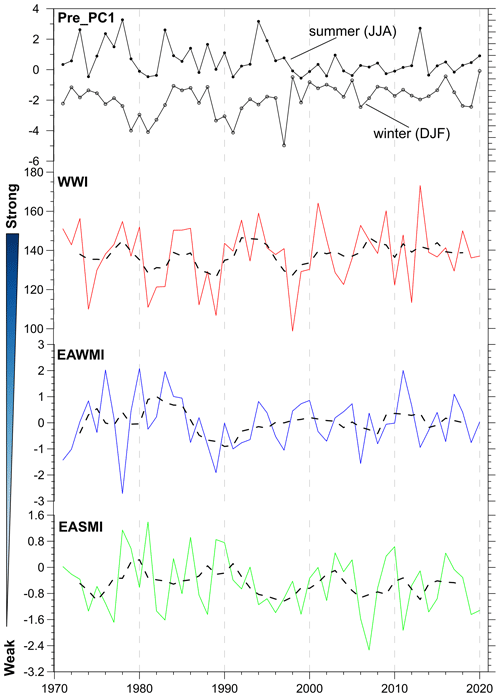
Figure 6The time series of the precipitation PC1 in summer, winter, WWI, EAWMI, and EASMI from 1971–2020.
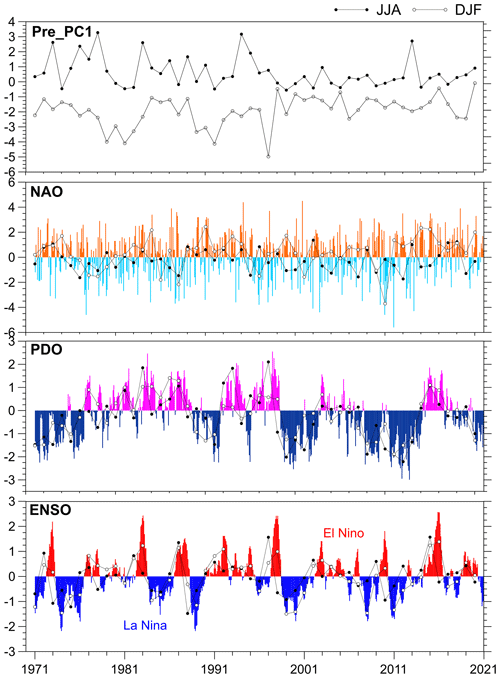
Figure 7The time series of the precipitation PC1 in summer and winter; the annual mean; and NAO, PDO, and ENSO from 1971–2020.
A majority of relevant studies suggest that precipitation variations in CA are controlled by water vapor transported by the midlatitude westerlies, where the monsoonal water vapor source is hard to reach (Huang et al., 2015a; Guan et al., 2019). Abundant moisture is carried from the polar air mass, the North Atlantic, and the eastern Mediterranean Sea to CA and continues to diffuse eastward to reach the arid region of northwestern China (Lioubimtseva, 2014). Meanwhile, several studies in recent years found that the anti-phase pattern between the East Asian summer monsoon and the westerlies causes the seesaw phenomenon of precipitation variation in northwestern China (the east of CA in this study) (Zhang et al., 2019; Wu et al., 2019). However, Chen et al. (2021a) proposed that the East Asian summer monsoon plays an important role in the interdecadal variability in summer precipitation in CA through the transportation of summer water vapor from the Indian and Pacific oceans to the east of CA. Additionally, Huang et al. (2015b) stated that increased summer precipitation in the Tarim Basin, which belongs to the east of CA, is mainly related to a weakened Indian summer monsoon. In addition, the large-scale topography, such as the Qinghai–Tibet Plateau, causes the westerlies to flow around the plateau rather than over it, which in turn influences the local transport of water vapor and results in local precipitation changes (Xie et al., 2014). Therefore, the atmospheric circulation and topographic factors bear on the transportation and content of water vapor at short-term timescales, which differentiate summer precipitation in the east of CA from that in the core region of CA by linking it to EA.
4.2 Possible dynamics of seasonal signals at long-term timescales
Model simulations are a valid means to visually study mechanisms of paleoclimate change in EA and CA during the LGM and the MH. The results of paleoclimate simulations in this work may help to explain the differences and similarities in dry/wet conditions between EA and CA under the framework of seasonal signals at long-term timescales. During the LGM, lower summer insolation greatly increases the meridional temperature difference and sea level pressure in the summer (Figs. 5j, 8a and c), leading to the strengthening of the westerlies (Fig. 9a) and further increasing precipitation in CA (Fig. 8e). However, summer precipitation in EA was weaker than in the MH during the LGM (Fig. 8e) due to the weakening of the summer monsoon (Fig. 9c) under the influence of reduced summer insolation (Fig. 5j), which is consistent with dry/wet conditions reconstructed by paleoclimate records in EA (Fig. 5). Besides, although the westerlies weaken during LGM winters (Fig. 9b), the higher winter insolation contributes to the general warming in midlatitudes (Figs. 5k, 8b), resulting in lower relative humidity in CA (Fig. 8d). According to climatological theory (Barry and Richard, 2009), a decrease in relative humidity suggests an increase in saturated water vapor pressure, which ultimately leads to increasing precipitation. Therefore, winter precipitation during the LGM in CA is generally higher than during the MH (Fig. 8f). This relationship may help explain the asynchrony of long-term dry/wet changes in EA and CA controlled by variations at a seasonal scale.
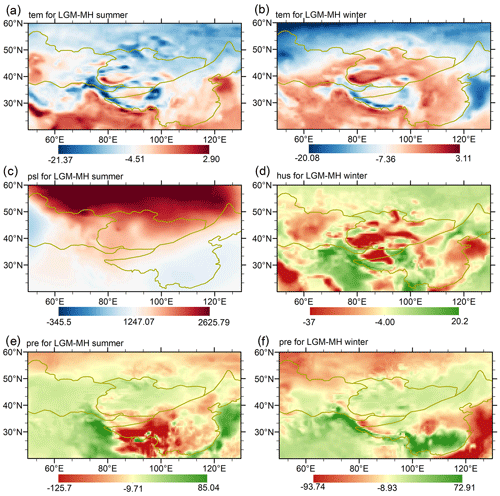
Figure 8Summer differences in temperature (tem) (a), sea level pressure (psl) (c), and precipitation (pre) (e) for LGM-MH and winter differences in temperature (b), relative humidity (hus) (d), and precipitation (f) for LGM-MH in EA and CA based on the PMIP3–CMIP5 multi-model ensemble.
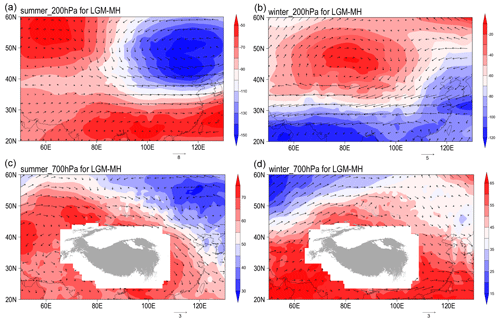
Figure 9Summer differences in 200 hPa wind field (a) and 700 hPa wind field (c) for LGM-MH and winter differences in 200 hPa wind field (b) and 700 hPa wind field (d) for LGM-MH in EA and CA based on the PMIP3–CMIP5 multi-model ensemble.
Investigating the past climate is key to informing future climate change (Tierney et al., 2020). From the perspective of paleoclimatology, monsoons and westerlies vary greatly between the LGM and MH, modulated by primary forces such as orbital insolation, greenhouse gas, and ice sheets (Oster et al., 2015; Bereiter et al., 2015; Sime et al., 2016). Paleoclimate records indicate wet conditions during the LGM and LH in CA and the MH wet in EA (Fig. 5). Specifically, dry/wet conditions in CA, affected by the westerlies and characterized by wet climate states during the LGM and mid- and late-Holocene, are opposite to those in monsoon-dominated EA. However, the proxy records in CA similar to the monsoon evolution are located in the modern summer precipitation region (Fig. 5f–i). From the perspective of precipitation seasonality, there are two different precipitation regimes within CA. The core region of CA has a Mediterranean climate (winter precipitation regime), with a dry summer and seasonal precipitation from early winter to late spring (Fig. 1), whereas, in the east of CA, including northwestern China and western and southern Mongolia, the summer precipitation contributes more (summer precipitation regime; Fig. 1). Therefore, the summer precipitation regime may be a potential forcing factor for the linkage of paleoclimate reconstructions between EA and the east of CA, and the difference in precipitation regime may result in a divergent moisture history in EA and in the core region of CA.
In summary, our results support the notion that seasonal signals of precipitation derived from simultaneous rain and heat periods govern the difference and linkage of dry/wet changes in EA and CA on seasonal to orbital timescales. With global warming and continued increase in winter solar radiation, we suggest that the core region of CA could face a persistent reduction in precipitation in the future. Meanwhile, the decrease in summer solar radiation could lead to a strengthening and southward shift of the summer westerly jet stream over CA, potentially increasing summer precipitation in the east of CA, which is characterized by summer precipitation regimes. However, more quantitative analyses are required to understand how future interannual variations in atmospheric and oceanic circulation might control the seasonal precipitation signals that influence dry/wet changes in the east of CA. Some recent work also points out increasing summer precipitation in arid CA (C. Chen et al., 2021; Ren et al., 2021). Meanwhile, the phenomenon of warmer and wetter climates coincides with the simultaneity of rain and heat periods (Hu and Han, 2022). Future work should focus on the fusion of multiple datasets and high-precision climate simulation designed to evaluate the mechanisms of climate change in the region.
The summer precipitation regime in EA and the east of CA and the winter precipitation regime in the core region of CA reveal seasonal signals of precipitation. Using the EOF method, this study analyzes the spatiotemporal variations in precipitation in EA and CA. Results reveal that seasonal signals derived from the simultaneity of rain and heat periods are important factors linking climate change modes in EA and CA at short timescales. A compilation of 42 proxy records with reliable chronologies enables us to reassess the long-term dry/wet changes in EA and CA since the LGM. In core regions of CA, the dry/wet status is usually characterized by dry EH and wet LH. However, parts of records in the east of CA with simultaneous rain and heat periods show the same dry/wet conditions as in EA, i.e., the dry conditions during the LGM and the wet climate during the EH and MH. This also reflects another meaning of seasonal signals at long-term timescales, namely the “dry–cold” pattern and the “wet–warm” pattern. Concurrently, paleoclimate records reflect seasonal signals triggered by the insolation at long timescales. The multi-model ensemble simulations of multiple climatic elements may help to explain the climate mechanism of differences and linkage in dry/wet status from EA and CA since the LGM. Results show that summer insolation influences the meridional temperature gradient and sea level pressure in the summer, changing the intensity of the westerly winds and summer monsoon and further controlling the summer precipitation in EA and in the east of CA. Meanwhile, winter insolation contributes to the general warming in EA and the core region of CA and in turn results in lower relative humidity, which ultimately increases winter precipitation during the LGM.
In general, the seasonal signals of precipitation derived from the simultaneity and non-simultaneity of rain and heat periods on short-term timescales can also affect the dry/wet status on long-term timescales, but their influencing factors are different. Due to the influence of seasonal precipitation signals at multiple timescales, CA and EA controlled by the winter precipitation regime and the summer precipitation regime, respectively, show an anti-phase evolution of dry/wet changes. However, it is worth noting that, in the east of CA with simultaneous rain and heat events, there is the same dry/wet evolution as in EA. Therefore, we believe that seasonal signals can provide important insight for analyzing the differences and linkages in climate change between CA and EA at multiple timescales.
The TraCE-21ka dataset comes from the Climate Data Gateway National Center for Atmospheric Research (NCAR) website at https://www.earthsystemgrid.org/dataset/ucar.cgd.ccsm.trace.html (NCAR, 2024a). PMIP3–CMIP5 simulations are available on the Earth System Grid Federation (ESGF) Peer-to-Peer (P2P) enterprise system website at https://esgf-node.llnl.gov/projects/esgf-llnl/ (Lawrence Livermore national Laboratory, 2024a). The PDO data can be obtained at https://www.ncei.noaa.gov/pub/data/cmb/ersst/v5/index/ersst.v5.pdo.dat (Physical Sciences Laboratory, 2024a). The Niño 3.4 data can be obtained at https://psl.noaa.gov/gcos_wgsp/Timeseries/Nino34/ (Physical Sciences Laboratory, 2024b). The NAO data can be obtained at https://climatedataguide.ucar.edu/sites/default/files/2022-10/nao_station_monthly.txt (NCAR, 2024b).
The supplement related to this article is available online at: https://doi.org/10.5194/cp-20-2415-2024-supplement.
YL initiated the work. YL and SP conceived the article. SP finished the data sorting, the statistical and geospatial data analysis, visualizations of the work, the original draft preparation, and the editing and revising of this article. ZZ, MG, XC, JD, and YX revised the article.
The contact author has declared that none of the authors has any competing interests.
Publisher’s note: Copernicus Publications remains neutral with regard to jurisdictional claims made in the text, published maps, institutional affiliations, or any other geographical representation in this paper. While Copernicus Publications makes every effort to include appropriate place names, the final responsibility lies with the authors.
This article is part of the special issue “Paleoclimate, from observing modern processes to reconstructing the past: a tribute to Dick (Dirk) Kroon”. It is not associated with a conference.
We acknowledge Simon Jung and one anonymous referee for constructive comments.
This work has been supported by the National Natural Science Foundation of China (grant nos. 42371159 and 42077415) and the Second Tibetan Plateau Scientific Expedition and Research Program (STEP) (grant no. 2019QZKK0202).
This paper was edited by Simon Jung and reviewed by Ignacio Jara and one anonymous referee.
An, C., Feng, Z., and Barton, L.: Dry or humid? Mid-Holocene humidity changes in arid and semi-arid China, Quaternary Sci. Rev., 25, 351–361, https://doi.org/10.1016/j.quascirev.2005.03.013, 2006.
Barichivich, J., Osborn, T. J., Harris, I., van der Schrier, G., and Jones, P. D. Monitoring global drought using the self-calibrating Palmer Drought Severity Index [in “State of the Climate in 2020”], B. Am. Meteorol. Soc., 101, S51–S52, 2021.
Barry, R. G. and Richard, J. C.: Atmosphere, weather and climate, Routledge, https://doi.org/10.4324/9780203871027, 2009.
Bereiter, B., Eggleston, S., Schmitt, J., Nehrbass-Ahles, C., Stocker, T. F., Fischer, H., Kipfstuhl, S., and Chappellaz, J.: Revision of the EPICA Dome C CO2 record from 800 to 600 kyr before present, Geophys. Res. Lett., 42, 542–549, https://doi.org/10.1002/2014GL061957, 2015.
Berger, A. L.: Long-term variations of caloric insolation resulting from the Earth’s orbital elements, Quatern. Res., 9, 139–167, https://doi.org/10.1016/0033-5894(78)90064-9, 1978
Briegleb, B. P., Bitz, C. M., Hunke, E. C., Lioscomb, W. H., Holland, M. M., Schramm, J. L., and Moritz, A. R.: Scientific description of the sea ice component in the community climate system model, Version 3, University Corporation for Atmospheric Research, 70, https://doi.org/10.5065/D6HH6H1P, 2004.
Chen, C., Zhang, X., Lu, H., Jin, L., Du, Y., and Chen, F.: Increasing summer precipitation in arid central Asia linked to the weakening of the East Asian summer monsoon in the recent decades, Int. J. Climatol., 41, 1024–1038, https://doi.org/10.1002/joc.6727, 2021.
Chen, F., Yu, Z., Yang, M., Ito, E., Wang, S., David, B. M., Huang, X., Zhao, Y., Sato, T., Birks, H. J. B., Boomer, I., Chen, J., An, C., and Wünnemann, B.: Holocene moisture evolution in arid Central Asia and its out-of-phase relationship with Asian monsoon history, Quaternary Sci. Rev., 27, 351–364, https://doi.org/10.1016/j.quascirev.2007.10.017, 2008.
Chen, F., Chen, J., and Huang, W.: A discussion on the westerly-dominated climate model in mid-latitude Asia during the modern interglacial period, Earth Sci. Front., 16, 23–32, 2009 (in Chinese with English abstract).
Chen, F., Xu, Q., Chen, J., Birks, H. J. B., Liu, J., Zhang, S., Jin, L., An, C., Telford, R. J., Cao, X., Wang, Z., Zahng, X., Selvaraj, K., Lü, H., Li, Y., Zheng, Z., Wang, H., Zhou, A., Dong, G., Zhang, J., Huang, X., Bloemendal, J., and Rao, Z.: East Asian summer monsoon precipitation variability since the last deglaciation, Sci. Rep., 5, 11186, https://doi.org/10.1038/srep11186, 2015.
Chen, F., Jia, J., Chen, J., Li, G., Zhang, X., Xie, H., Xia, D., Huang, W., and An, C.: A persistent Holocene wetting trend in arid central Asia, with wettest conditions in the late Holocene, revealed by multi-proxy analyses of loess-paleosol sequences in Xinjiang, China, Quaternary Sci. Rev., 146, 134–146, https://doi.org/10.1016/j.quascirev.2016.06.002, 2016.
Chen, F., Chen, J., Huang, W., Chen, S., Huang, X., Jin, L., Jia, J., Zhang, X., An, C., Zhang, J., and Zhao, Y.: Westerlies Asia and monsoonal Asia: spatiotemporal differences in climate change and possible mechanisms on decadal to suborbital timescales, Earth Sci. Rev., 192, 337–354, https://doi.org/10.1016/j.earscirev.2019.03.005, 2019.
Chen, F., Chen, J., and Huang, W.: Weakened East Asian summer monsoon triggers increased precipitation in Northwest China, Sci. China Earth Sci., 64, 835–837, https://doi.org/10.1007/s11430-020-9731-7, 2021.
Chen, G. and Huang, R.: Excitation mechanisms of the tele-connection patterns affecting the July precipitation in North-west China, J. Climate, 25, 7834–7851, 2012.
Chen, S., Liu, J., Wang, X., Zhao, S., Chen, J., Qiang, M., Liu, B., Xu, Q., Xia, D., and Chen, F.: Holocene dust storm variations over northern China: transition from a natural forcing to an anthropogenic forcing, Sci. Bull., 66, 2516–2527, https://doi.org/10.1016/j.scib.2021.08.008, 2021.
Chen, S., Chen, J., Lv, F., Liu, X., Huang, W., Wang, T., Liu, J., Hou, J., and Chen, F.: Holocene moisture variations in arid central Asia: Reassessment and reconciliation, Quaternary Sci. Rev., 297, 107821, https://doi.org/10.1016/j.quascirev.2022.107821, 2022.
Cheng, H., Zhang, P., Spötl, C., Edwards, R. L., Cai, Y., Zhang, D., Sang, W., Tan, M., and An, Z.: The climatic cyclicity in semiarid-arid central Asia over the past 500,000 years, Geophys. Res. Lett., 39, L01705, https://doi.org/10.1029/2011gl050202, 2012.
Dykoski, C. A., Edwards, R. L., Cheng, H., Yuan, D., Cai, Y., Zhang, M., Lin, Y., Qing, J., An, Z., and Revenaugh, J.: A high-resolution, absolute-dated Holocene and deglacial Asian monsoon record from Dongge Cave, China, Earth Planet. Sc. Lett., 233, 71–86, https://doi.org/10.1016/j.epsl.2005.01.036, 2005.
Gent, P. R., Danabasoglu, G., Donner, L. J., Holland, M. M., Hunke, E. C., Jayne, S. R., Lawrence, D. M., Neale, R. B., Rasch, P. J., and Vertenstein, M.: The community climate system model version 4, J. Climate, 24, 4973–4991, https://doi.org/10.1175/2011jcli4083.1, 2011.
Guan, X., Yang, L., Zhang, Y., and Li, J.: Spatial distribution, temporal variation, and transport characteristics of atmospheric water vapor over Central Asia and the arid region of China, Global Planet. Change, 172, 159–178, https://doi.org/10.1016/j.gloplacha.2018.06.007, 2019.
Han, S. and Qu, Z.: Inland Holocene climatic features recorded in Balikun lake, northern Xinjiang, Science in China Ser. B, 11, 1201–1209, 1992 (in Chinese with English abstract).
Han, S., Wu, N., and Li, Z.: Inland climate changes in Dzungaria during the late Pleistocene Epoch, Geog. Res., 12, 47–54, 1993 (in Chinese with English abstract).
Harris, I., Jones, P. D., Osborn, T. J., and Lister, D. H.: Updated high-resolution grids of monthly climatic observations-the CRU TS3.10 Dataset, Int. J. Climatol., 34, 623–642, 2014.
Hersbach, H., Bell, B., Berrisford, P., Hirahara, S., Horányi, A., Muñoz-Sabater, J., Nicolas, J., Peubey, C., Radu, R., Schepers, D., Simmons, A., Soci, C., Abdalla, S., Abellan, X., Balsamo, G., Bechtold, P., Biavati, G., Bidlot, J., Bonavita, M., De Chiara, G., Dahlgren, P., Dee, D., Diamantakis, M., Dragani, R., Flemming, J., Forbes, R., Fuentes, M., Geer, A., Haimberger, L., Healy, S., Hogan, J. R., Holm, E., Janiskova, M., Keeley, S., Laloyaux, P., Lopez, P., Lupu, C., Radnoti, G., de Rosnay, P., Rozum, I., Vamborg, F., Villaume, S., and Thepaut, J.: The ERA5 global reanalysis, Q. J. Roy. Meteor. Soc., 146, 1999–2049, https://doi.org/10.1002/qj.3803, 2020.
Herzschuh, U.: Palaeo-moisture evolution in monsoonal central Asia during the last 50,000 years, Quaternary Sci. Rev., 25, 163–178, https://doi.org/10.1016/j.quascirev.2005.02.006, 2006.
Hu, Q. and Han, Z.: Northward Expansion of Desert Climate in Central Asia in Recent Decades, Geophys. Res. Lett., 49, e2022GL098895, https://doi.org/10.1029/2022gl098895, 2022.
Huang, W., Chen, J., Zhang, X., Feng, S., and Chen, F.: Definition of the core zone of the “westerlies-dominated climatic regime”, and its controlling factors during the instrumental period, Sci. China Earth Sci., 58, 676–684, https://doi.org/10.1007/s11430-015-5057-y, 2015a.
Huang, W., Feng, S., Chen, J., and Chen, F.: Physical mechanisms of summer precipitation variations in the Tarim basin in northwestern China, J. Climate, 28, 3579–3591, https://doi.org/10.1175/jcli-d-14-00395.1, 2015b.
Hurrell, J. W.: Decadal Trends in the North Atlantic Oscillation: Regional Temperatures and Precipitation, Science, 269, 676–679, https://doi.org/10.1126/science.269.5224.676, 1995.
Hurrell, J. W. and Deser, C.: North Atlantic climate variability: The role of the North Atlantic Oscillation, J. Marine Syst., 78, 28–41, https://doi.org/10.1016/j.jmarsys.2008.11.026, 2009.
Jhun, J. G. and Lee, E. J.: A new East Asian winter monsoon index and associated characteristics of the winter monsoon, J. Climate, 17, 711–726, https://doi.org/10.1175/1520-0442(2004)017<0711:ANEAWM>2.0.CO;2, 2004.
Joussaume, S., Taylor, K. E., Braconnot, P. J. F. B., Mitchell, J. F. B., Kutzbach, J. E., Harrison, S. P., Prentice, I. C., Broccoli, A. J., Abe-Ouchi, A., Bartlein, P. J., and Bonfils, C.: Monsoon changes for 6000 years ago: results of 18 simulations from the paleoclimate modeling intercomparison project (PMIP), Geophys. Res. Lett., 26, 859–862, https://doi.org/10.1029/1999gl900126, 1999.
Kalnay, E., Kanamitsu, M., Kistler, R., Collins, W., Deaven, D., Gandin, L., Iredell, M., Saha, S., White, G., Wollen, J., Zhu, Y., Chelliah, M., Ebisuzaki, W., Higgins, W., Janowiak, J., Mo, K. C., Ropelewski, C., Wang, J., Leetmaa, A., Reynolds, R., Jenne, R., and Joseph, D.: The NCEP/NCAR 40-year reanalysis project, B. Am. Meteorol. Soc, 77, 437–472, https://doi.org/10.1175/1520-0477(1996)077<0437:TNYRP>2.0.CO;2, 1996.
Lawrence Livermore National Laboratory: PMIP3-CMIP5 dataset, ESGF [data set], https://esgf-node.llnl.gov/projects/esgf-llnl/, last access: 27 October 2024a.
Lee, M. K., Lee, Y. I., Lim, H. S., Lee, J. I., and Yoon, H. I.: Late Pleistocene-H olocene records from Lake Ulaan, southern Mongolia: implications for east Asian palaeomonsoonal climate changes, J. Quaternary Sci., 28, 370–378, https://doi.org/10.1002/jqs.2626, 2013.
Leroy, S. A. G., López-Merino, L., Tudryn, A., Chalié, F., and Gasse, F.: Late Pleistocene and Holocene palaeoenvironments in and around the middle Caspian basin as reconstructed from a deep-sea core, Quaternary Sci. Rev., 101, 91–110, https://doi.org/10.1016/j.quascirev.2014.07.011, 2014.
Li, J.: The patterns of environmental changes since last Pleistoc ene in northwestern China, Quat. Sci., 3, 197–204, 1990 (in Chinese with English abstract).
Li, W., Wang, K., Fu, S., and Jiang, H.: The interrelationship between regional westerly index and the water vapor budget in northwest China, Journal of Glaciology and Geocryology, 30, 28–34, 2008.
Lioubimtseva, E.: Impact of Climate Change on the Aral Sea and its Basin. The Devastation and Partial Rehabilitation of a Great Lake, The Aral Sea, 405–427, https://doi.org/10.1007/978-3-642-02356-9_17, 2014.
Liu, X., Shen, J., Wang, S., Wang, Y., and Liu, W.: Southwest monsoon changes indicated by oxygen isotope of ostracode shells from sediments in Qinghai lake since the late glacial, Chinese Sci. Bull., 4, 109–114, https://doi.org/10.1007/s11434-007-0086-3, 2007.
Liu, Z., Wen, X., Brady, E. C., Otto-Bliesner, B., Yu, G., Lu, H., Cheng, H., Wang, Y., Zheng, W., Ding, Y., Edwards, R. L., Cheng, J., Liu, W., and Yang, H.: Chinese cave records and the East Asia Summer Monsoon, Quaternary Sci. Rev., 83, 115–128, https://doi.org/10.1016/j.quascirev.2013.10.021, 2014.
Lorenz, E. N.: Empirical orthogonal function and statistical weather prediction. Scientific Report No. 1 Statist Forecasting Project, Department of Meteorology, Massachusetts Institute of Technology, https://babel.hathitrust.org/cgi/pt?id=uc1.31822012030698&seq=1 (last access: 27 October 2024), 1956.
Manoj, M. C., Srivastava, J., Uddandam, P. R., and Thakur, B.: A 2000 year multiproxy evidence of natural/anthropogenic influence on climate from the southwest coast of India, J. Earth Sci., 31, 1029–1044, https://doi.org/10.1007/s12583-020-1336-4, 2020.
Mantua, N. J. and Hare, S. R.: The Pacific Decadal Oscillation, J. Oceanogr., 58, 35–44, https://doi.org/10.1023/A:1015820616384, 2002.
Nagashima, K., Tada, R., Tani, A., Sun, Y., Isozaki, Y., Toyoda, S., and Hasegawa, H.: Millennial-scale oscillations of the westerly jet path during the last glacial period, J. Asian Earth Sci., 40, 1214–1220, https://doi.org/10.1016/j.jseaes.2010.08.010, 2011.
NCAR: TraCE-21ka dataset, NCAR Climate Data Gateway [data set], https://www.earthsystemgrid.org/dataset/ucar.cgd.ccsm.trace.html, last access: 27 October 2024a.
NCAR: NAO dataset, NCAR Climate Data Guide [data set], https://climatedataguide.ucar.edu/sites/default/files/2022-10/nao_station_monthly.txt, last access: 27 October 2024b.
Oster, J. L., Ibarra, D. E., Winnick, M. J., and Maher, K.: Steering of westerly storms over western North America at the Last Glacial Maximum, Nat. Geosci., 8, 201–205, https://doi.org/10.1038/ngeo2365, 2015.
Physical Sciences Laboratory: PDO dataset, NOAA [data set], https://www.ncei.noaa.gov/pub/data/cmb/ersst/v5/index/ersst.v5.pdo.dat, last access: 28 October 2024a.
Physical Sciences Laboratory: Niño 3.4 dataset, NOAA [data set], https://psl.noaa.gov/gcos_wgsp/Timeseries/Nino34/, last access: 27 October 2024b.
Peltier, W. R.: Global glacial isostasy and the surface of the ice-age Earth: The ICE-5G (VM2) model and GRACE, Annu. Rev. Earth Planet. Sci., 32, 111–149, https://doi.org/10.1146/annurev.earth.32.082503.144359, 2004.
Peng, D. and Zhou, T.: Why was the arid and semiarid North-west China getting wetter in the recent decades, J. Geophys. Res.-Atmos., 122, 9060–9075, https://doi.org/10.1002/2016JD026424, 2017.
Randall, D. A., Wood, R. A., Bony, S., Colman, R., and Taylor, K. E.: Climate models and their evaluation, in: Climate change 2007: The physical science basis. Contribution of Working Group I to the Fourth Assessment Report of the IPCC (FAR), 589–662, Cambridge University Press, https://www.ipcc.ch/site/assets/uploads/2018/02/ar4-wg1-chapter8-1.pdf (last access: 27 October 2024), 2007.
Rayner, N. A. A., Parker, D. E., Horton, E. B., Folland, C. K., Alexander, L. V., Rowell, D. P., and Kent, E. C.: Global analyses of sea surface temperature, sea ice, and night marine air temperature since the late nineteenth century, J. Geophys. Res.-Atmos., 108, 4407, https://doi.org/10.1029/2002jd002670, 2003.
Ren, Y., Yu, H., Liu, C., He, Y., Huang, J., Zhang, L., Hu, H., Zhang, Q., Chen, S., Liu, X., Zhang, M., Wei, Y., Yang, Y., Fan, W., and Zhou, J.: Attribution of Dry and Wet Climatic Changes over Central Asia, J. Climate, 35, 1399–1421, https://doi.org/10.1175/jcli-d-21-0329.1, 2021.
Ricketts, R. D., Johnson, T. C., Brown, E. T., Rasmussen, K. A., and Romanovsky, V. V.: The Holocene paleolimnology of Lake Issyk-Kul, Kyrgyzstan: trace element and stable isotope composition of ostracodes, Palaeogeogr. Palaeocl., 176, 207–227, https://doi.org/10.1016/s0031-0182(01)00339-x, 2001.
Rotstayn, L., Collier, M., Dix, M., Feng, Y., Gordon, H., O'Farrell, S., Smith, I., and Syktus, J.: Improved simulation of Australian climate and ENSO-related climate variability in a GCM with an interactive aerosol treatment, Int. J. Climatol., 30, 1067–1088, https://doi.org/10.1002/joc.1952, 2010.
Schmidt, G. A., Kelley, M., Nazarenko, L., Ruedy, R., Russell, G. L., Aleinov, I., Bauer, M., Bauer, S. E., Bhat, M. K., Bleck, R., Canuto, V., Chen, Y., Cheng, Y., Clune, T. L., Del Genio, A., de Fainchtein, R., Faluvegi, G., Hansen, J. E., Healy, R. J., Kiang, N. Y., Koch, D., Lacis, A., LeGrande, A. N., Lerner, J., Lo, K. K., Matthews, E. E., Menon, S., Miller, R. L., Oinas, V., Oloso, A. O., Perlwitz, J. P., Puma, M. J., Putman, W. M., Rind, D., Romanou, A., Sato, M., Shindell, D., Sun, S., Syed, R. A., Tausnev, N., Tsigaridis, K., Unger, N., Voulgarakis, A., Yao, M., and Zhang, J.: Configuration and assessment of the GISS ModelE2 contributions to the CMIP5 archive, J. Adv. Model. Earth Sy., 6, 141–184, https://doi.org/10.1002/2013MS000265, 2014.
Sime, L. C., Hodgson, D., Bracegirdle, T. J., Allen, C., Perren, B., Roberts, S., and de Boer, A. M.: Sea ice led to poleward-shifted winds at the Last Glacial Maximum: the influence of state dependency on CMIP5 and PMIP3 models, Clim. Past, 12, 2241–2253, https://doi.org/10.5194/cp-12-2241-2016, 2016.
Sorg, A., Bolch, T., Stoffel, M., Solomina, O., and Beniston, M.: Climate change impacts on glaciers and runoff in Tien Shan (Central Asia), Nat. Clim. Change, 2, 725–731, https://doi.org/10.1038/nclimate1592, 2012.
Sun, A., Feng, Z., Ran, M., and Zhang, C.: Pollen-recorded bioclimatic variations of the last ∼ 22,600 years retrieved from Achit Nuur core in the western Mongolian Plateau, Quatern. Int., 311, 36–43, https://doi.org/10.1016/j.quaint.2013.07.002, 2013.
Tierney, J. E., Poulsen, C. J., Montañez, I. P., Bhattacharya, T., Feng, R., Ford, H. L., Hönisch, B., Inglis, G. N., Petersen, S. V., Sagoo, N., Tabor, C. R., Thirumalai, K., Zhu, J., Burls, N. J., Foster, G. L., Goddéris, Y., Huber, B. T., Ivany, L. C., Kirtland, Turner, S., Lunt, D. J., McElwain, J. C., Mills, B. J. W., Otto-Bliesner, B. L., Ridgwell, A., and Zhang, Y.: Past climates inform our future, Science, 370, eaay3701, https://doi.org/10.1126/science.aay3701, 2020.
van der Schrier, G., Barichivich, J., Briffa, K. R., and Jones, P. D.: A scPDSI‐based global data set of dry and wet spells for 1901–2009, J. Geophys. Res.-Atmos., 118, 4025–4048, https://doi.org/10.1002/jgrd.50355, 2013
Voldoire, A., Sanchez-Gomez, E., Mélia, D. S. Y, Decharme, B., Cassou, C., Sénési, S., Valcke, S., Beau, I., Alias, A., Chevallier, M., Déqué, M., Deshayes, J., Douville, H., Fernandez, E., Madec, G., Maisonnave, E., Moine, M. P., Planton, S., Saint-Martin, D., Szopa, S., Tyteca, S., Alkama, R., Belamari, S., Braun, A., Coquart, L., and Chauvin, F.: The CNRM-CM5.1 global climate model: description and basic evaluation, Clim. Dynam., 40, 2091–2121, https://doi.org/10.1007/s00382-011-1259-y, 2013.
Wang, L., Jia, J., Xia, D, Liu, H., Gao, F., Duan, Y., Wang, Q., Xie, H., and Chen, F.: Climate change in arid central Asia since MIS 2 revealed from a loess sequence in Yili Basin, Xinjiang, China, Quatern. Int., 502, 258–266, https://doi.org/10.1016/j.quaint.2018.02.032, 2018.
Wang, P., Wang, B., Cheng, H., Fasullo, J., Guo, Z., Kiefer, T., and Liu, Z.: The global monsoon across time scales: Mechanisms and outstanding issues, Earth Sci. Rev., 174, 84–121, https://doi.org/10.1016/j.earscirev.2017.07.006, 2017.
Wang, Y., Cheng, H., Edwards, R. L., An, Z., Wu, J., Shen, C., and Dorale, J. A.: A high-resolution absolute-dated late Pleistocene monsoon record from Hulu cave, China, Science, 294, 2345–2348, https://doi.org/10.1126/science.1064618, 2001.
Watanabe, S., Hajima, T., Sudo, K., Nagashima, T., Takemura, T., Okajima, H., Nozawa, T., Kawase, H., Abe, M., Yokohata, T., Ise, T., Sato, H., Kato, E., Takata, K., Emori, S., and Kawamiya, M.: MIROC-ESM 2010: model description and basic results of CMIP5-20c3m experiments, Geosci. Model Dev., 4, 845–872, https://doi.org/10.5194/gmd-4-845-2011, 2011.
Wei, W., Zhang, R., Wen, M., Yang, S.: Relationshipbetween the Asian westerly jet stream and summer rainfall over Central Asia and North China: roles of the Indian mon-soon and the south Asian high, J. Climate, 30, 537–552, https://doi.org/10.1175/JCLI-D-15-0814.1, 2017.
Wu, P., Ding, Y., Liu, Y., and Li, X.: The characteristics of moisture recycling and its impact on regional precipitation against the background of climate warming over Northwest China, Int. J. Climatol., 39, 5241–5255, https://doi.org/10.1002/joc.6136, 2019.
Xie, C., Li, M., and Zhang, X.: Characteristics of summer atmospheric water resources and its causes over the Tibetan plateau in recent 30 years, J. Nat. Resour., 29, 979–989, 2014 (in Chinese with English abstract).
Yu, G., Xue, B., Wang, S., and Liu, J.: Chinese lakes records and the climate significance during Last Glacial Maximum, Chinese Sci. Bull., 45, 250–255, https://doi.org/10.3321/j.issn:0023-074X.2000.03.003, 2000 (in Chinese with English abstract).
Yuan, D., Cheng, H., Edwards, R. L., Dykoski, C. A., Kelly, M. J., Zhang, M., Qing, J., Lin, Y., Wang, Y., Wu, J., and Dorale, J. A.: Timing, duration, and transitions of the last interglacial Asian monsoon, Science, 304, 575–578, https://doi.org/10.1126/science.1091220, 2004.
Yukimoto, S., Adachi, Y., Hosaka, M., Sakami, T., Yoshimura, H., Hirabara, M., Tanaka, T. Y., Shindo, E., Tsujino, H., and Deushi, M. A new global climate model of the Meteorological Research Institute: MRI-CGCM3: Model description and basic performance, J. Meteorol. Soc. Jpn., 90, 23–64, https://doi.org/10.2151/jmsj.2012-a02, 2012.
Zhang, J. and Lin, Z.: Climate of China, Wiley, New York, https://www.osti.gov/biblio/6193922 (last access: 27 October 2024), 1992.
Zhang, D. and Feng, Z.: Holocene climate variations in the Altai Mountains and the surrounding areas: a synthesis of pollen records, Earth Sci. Rev., 185, 847–869, https://doi.org/10.1016/j.earscirev.2018.08.007, 2018.
Zhang, Q., Lin, J., Liu, W., and Han, L.: Precipitation seesaw phenomenon and its formation mechanism in the eastern and western parts of Northwest China during the flood season, Sci. China Earth Sci., 62, 2083–2098, https://doi.org/10.1007/s11430-018-9357-y, 2019.
Zhao, Y., An, C., Mao, L., Zhao, J., Tang, L., Zhou, A., Li, H., Dong, W., Duan, F., and Chen, F.: Vegetation and climate history in arid western China during MIS2: New insights from pollen and grain-size data of the Balikun Lake, eastern Tien Shan, Quaternary Sci. Rev., 126, 112–125, https://doi.org/10.1016/j.quascirev.2015.08.027, 2015.


