the Creative Commons Attribution 4.0 License.
the Creative Commons Attribution 4.0 License.
 | 26 Sep 2024
The Laurentide Ice Sheet in southern New England and New York during and at the end of the Last Glacial Maximum: a cosmogenic-nuclide chronology
Allie Balter-Kennedy
Joerg M. Schaefer
Greg Balco
Meredith A. Kelly
Michael R. Kaplan
Roseanne Schwartz
Bryan Oakley
Nicolás E. Young
Jean Hanley
Arianna M. Varuolo-Clarke
We present 40 new 10Be exposure ages of moraines and other glacial deposits left behind by the southeastern sector of the Laurentide Ice Sheet (LIS) in southern New England and New York, summarize the regional moraine record, and interpret the dataset in the context of previously published deglaciation chronologies. The regional moraine record spans the Last Glacial Maximum (LGM), with the outermost ridge of the terminal complex dating to ∼ 26–25 ka, the innermost ridge of the terminal complex dating to ∼ 22 ka, and a series of smaller recessional limits within ∼ 50 km of the terminal complex dating to ∼ 21–20.5 ka. The chronology generally agrees with independent age constraints from radiocarbon and glacial varves. A few inconsistencies between ages from cosmogenic-nuclide measurements and those from other dating methods are explained by geological scatter, where several bedrock samples and boulders from the outer terminal moraine exhibit nuclide inheritance, while some exposure ages of large moraines are likely affected by postdepositional disturbance. The exposure age chronology places the southeastern sector of the LIS at or near its maximum extent, from ∼ 26 to 21 ka, which is broadly consistent with the LGM sea-level lowstand, local and regional temperature indicators, and local summer insolation. The net change in LIS extent, represented by this chronology, occurred more slowly (< 5 to 25 m yr−1) than the subsequent retreat through the rest of New England, consistent with a slow general rise in insolation and modeled summer temperature. We conclude that the major pulse of LIS deglaciation and accelerated recession, recorded by dated glacial deposits north of the moraines discussed here, did not begin until after atmospheric CO2 increased around 18 ka, marking the onset of Termination I.
- Article
(5418 KB) - Full-text XML
-
Supplement
(8019 KB) - BibTeX
- EndNote


We describe new cosmogenic-nuclide exposure ages of moraines and other glacial-margin deposits in southern New England and New York that track the timing and position of the margin of the southeastern sector of the Laurentide Ice Sheet (LIS) during the Last Glacial Maximum (LGM; 26.5–19 ka) and Termination I (18–11 ka), the most recent glacial–interglacial transition. The LIS had a volume of ∼ 50–80 m sea-level equivalent at its greatest extent during the LGM (Clark et al., 2009, 1996; Denton and Hughes, 1981; Stokes, 2017; Stokes et al., 2012), making it the largest ice sheet of the Last Glacial Period. It then deglaciated as temperatures and CO2 returned to interglacial values during Termination I (Broecker and Donk, 1970; Cuffey et al., 2016; Dalton et al., 2020; Denton et al., 2010; Dyke, 2004; Marcott et al., 2014). LIS topography, albedo, and meltwater exerted major forcing on large-scale atmospheric dynamics (Löfverström et al., 2014; Ullman et al., 2014), ocean circulation (Clark et al., 2001; Denton et al., 2010; McManus et al., 2004), and sea level (Clark et al., 2009; Lambeck et al., 2014; Stokes, 2017) during the LGM and subsequent deglaciation. We focus on the southeastern sector of the LIS, which is important in part because of its proximity to the North Atlantic Ocean, meaning that meltwater from this sector had the potential to suppress the Atlantic Meridional Overturning Circulation (AMOC), inducing global-scale climate feedbacks (Barker et al., 2009; Barker and Knorr, 2021; Buizert et al., 2014; Denton et al., 2010; McManus et al., 2004). Improving LIS chronologies thus enhances our understanding of regional and hemispheric paleoenvironmental and paleoclimatic changes.
Cosmogenic-nuclide and radiocarbon dating have been used to show that the LIS fluctuated at or near its full LGM extent until ∼ 22 ka, with terminal moraines dating to ∼ 23–22 ka in the midwestern United States (Curry and Petras, 2011; Glover et al., 2011; Heath et al., 2018; Ullman et al., 2015) and to ∼ 26–24 ka in the northeastern United States (Balco et al., 2002; Balco and Schaefer, 2006; Corbett et al., 2017; Stanford et al., 2021). Margin retreat potentially accelerated across the LIS by ∼ 20.5 ka (Balco and Schaefer, 2006; Ullman et al., 2015). Therefore, the initial retreat of the LIS margin from its LGM limits coincided with a steady rise in boreal-summer insolation that began around 24 ka (Clark et al., 2009; Denton et al., 2010; Hays et al., 1976; Milankovitch, 1941; Ullman et al., 2015) and began several thousand years before the deglacial rise in CO2 observed in the Antarctic ice core record (Marcott et al., 2014). The LIS might have been sensitive to this relatively weak orbital forcing in its full glacial configuration, although orbital forcing alone was likely insufficient to force the return to full interglacial conditions (Barker and Knorr, 2021; Denton et al., 2010; Imbrie et al., 1993; Raymo, 1997; Tzedakis et al., 2018). The increase in atmospheric CO2 beginning around 18 ka likely played a key role in the full deglaciation of the LIS (Gregoire et al., 2015; Marcott et al., 2014; Shakun et al., 2015).
Prominent moraines in northern New Jersey, coastal New York, and New England, along with a series of smaller recessional moraines, mark the LIS extent during the LGM and provide an opportunity to constrain the timing of the LGM and initial deglaciation during Termination I. These moraines are morphostratigraphically correlated across the region, and bracketing radiocarbon ages from a few locations have been used to estimate ages for the entire moraine sequence (Stone and Borns, 1986; Stone et al., 2005). Several of the moraine segments have now also been dated using cosmogenic nuclides (Balco et al., 2009, 2002; Balco and Schaefer, 2006; Corbett et al., 2017). Our 40 new 10Be ages from Rhode Island, Long Island, New York City, and the lower Hudson Valley complement existing moraine chronologies for the LIS margin, and, together, these chronologies provide information on net changes in LIS extent as well as retreat rate estimates for this climatically important sector.
1.1 Existing LIS chronologies in southern New England, New York, and northern New Jersey
1.1.1 Regional moraine stratigraphy
Regional LIS margin positions have been inferred across the northeastern United States using various glacial deposits, including moraines, glacial lake sediments, ice-contact deltas, and morphosequences of contemporaneous ice-marginal to ice-distal landforms and sediment facies (e.g., Cadwell, 1989; Fuller, 1914; Koteff and Pessl, 1981; McMaster, 1960; Stone and Borns, 1986; Stone et al., 2005; Woodworth and Wigglesworth, 1934). Importantly, these deposits mark the most recent extension of the ice margin to a given position because each advance of the ice sheet removes evidence of previous ice margin fluctuations. The most prominent of these features is a terminal-moraine complex that defines the modern coastline of New England and New York. This complex is composed of two massive end moraine systems, which formed during the most extensive LGM advances of the Hudson, Connecticut, Narragansett Bay, and Buzzards Bay lobes. These large moraines (50–100 m tall and 2–10 km wide) are characterized by imbricated thrust sheets of outwash deposits and dislocated preglacial sediments, displaced during ice margin advances, and are overlain by till in many places (Fuller, 1914; Kaye, 1972, 1964a, b; Mills and Wells, 1974; Oldale and O'Hara, 1984; Sirkin, 1982; Boothroyd and Sirkin, 2002). Crosscutting relationships among segments within the moraine systems, combined with the glaciotectonic nature of the deposits and the presence of overlying till, suggest that the moraines were formed during phases of ice margin advance as the LIS fluctuated at or near its southernmost extent during the last glaciation (Oldale and O'Hara, 1984; Sirkin, 1976; Boothroyd and Sirkin, 2002). The outermost component of the terminal complex can be traced from the Budd Lake moraine in northern New Jersey to the Harbor Hill and Ronkonkoma moraines on Long Island, New York, and across Block Island Sound to Martha's Vineyard and Nantucket (Fig. 1; Stone and Borns, 1986). About 10–30 km north of the outer terminal limit, the innermost element of the terminal-moraine complex records the last major LGM ice advance in the region and is correlated across Long Island's north shore to Fishers Island, New York; the Charlestown moraine in Rhode Island; and the Buzzards Bay moraine in Cape Cod (Fig. 1; Sirkin, 1976, 1982; Stone and Borns, 1986).
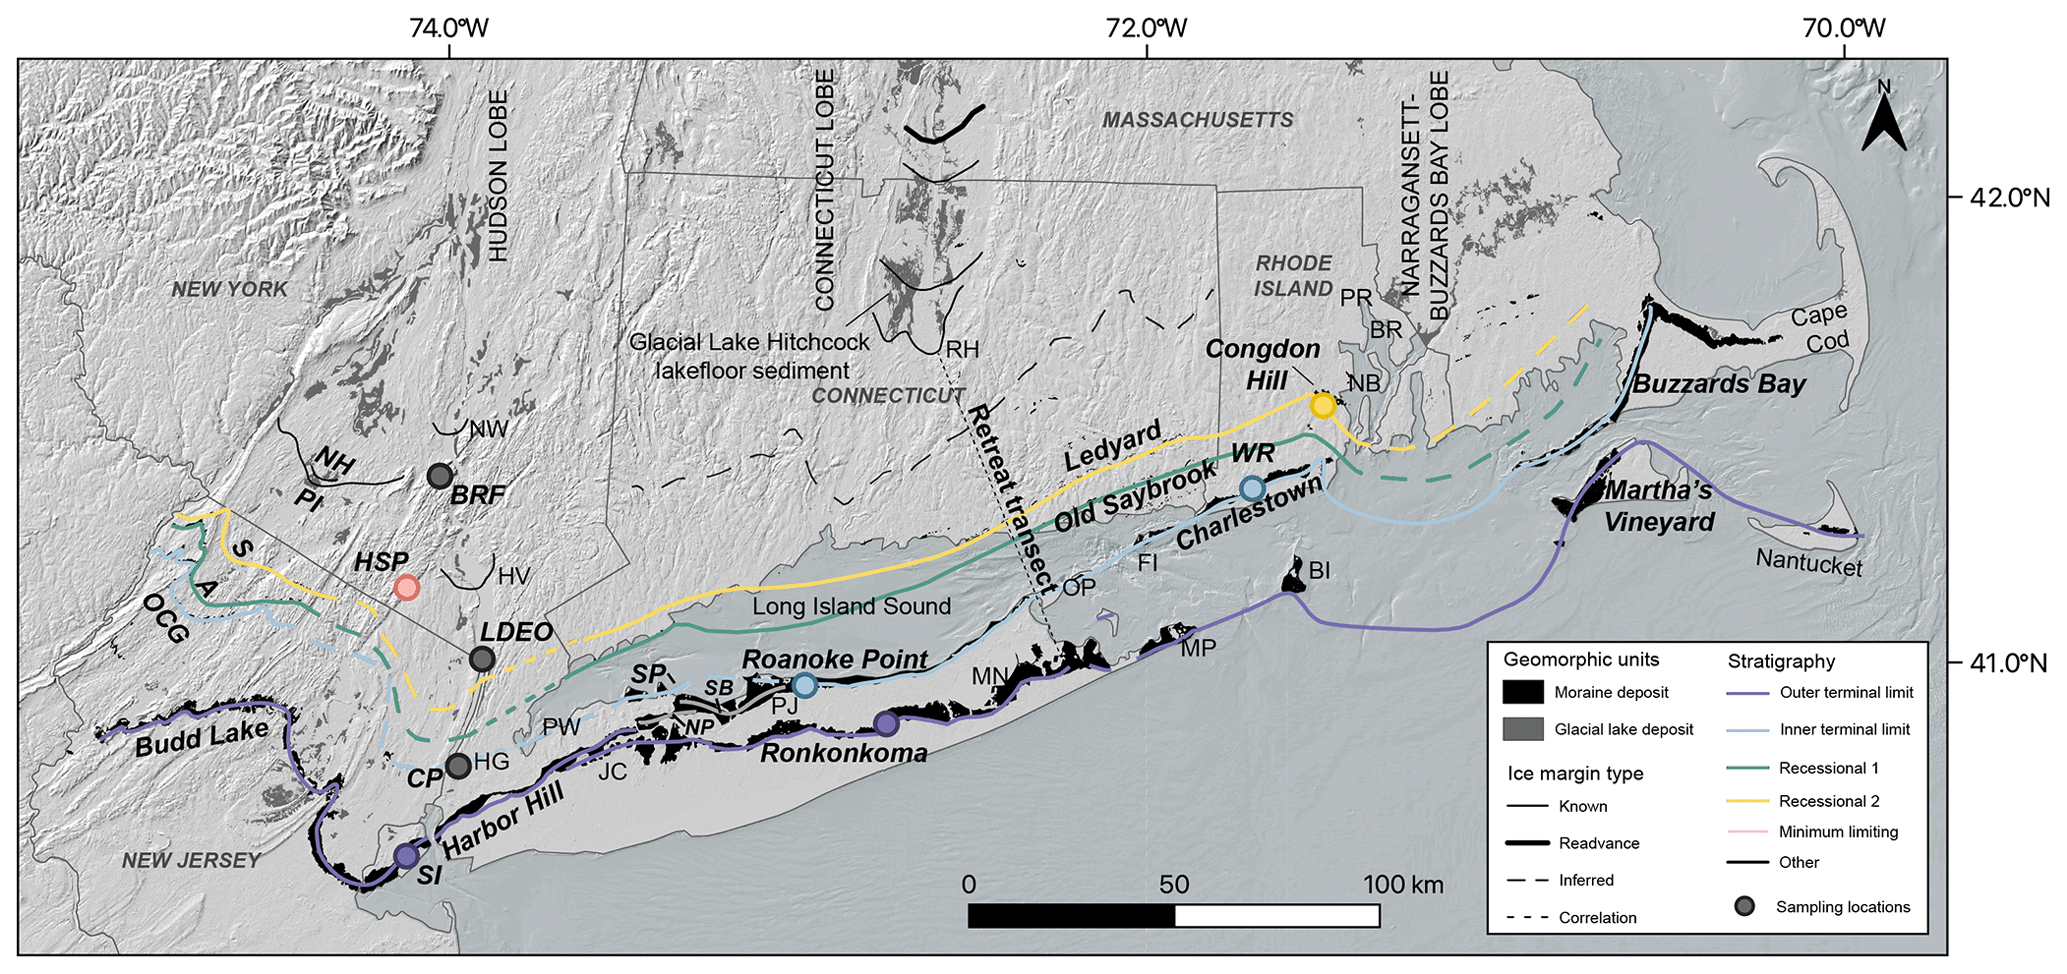
Figure 1Regional map of New England and New York depicting ice-marginal positions and glacial geomorphology. Hillshade topography is derived from the NASA Shuttle Radar Topography Mission (2013). Bathymetry is sourced from the BlueTopo product from the NOAA's Office of Coast Survey (tinted a darker blue-gray color to indicate ocean). Glacial geology is based on the surficial geological maps of Massachusetts (Stone et al., 2018), Rhode Island (Boothroyd et al., 2003), Connecticut (Stone et al., 2005), New York (Cadwell et al., 1989), and New Jersey (Stone et al., 2002). Ice-marginal positions and correlations are adapted from Sirkin (1982), Stone and Borns (1986), Boothroyd et al. (1998), Stone et al. (2005), Ridge (2004), Ridge et al. (2012), and Stanford et al. (2021). The retreat rates presented in Sect. 5.1.3 are calculated using the distance along the retreat transect. Moraine segment names discussed in the text are labeled in bold italics, and other locations of relevance are labeled in non-bold roman font. Sample locations associated with specific ice margin positions discussed in the text are color-coded according to their stratigraphy, as defined in the legend. A: Augusta moraine. BI: Block Island. BR: Barrington, Rhode Island. BRF: Black Rock Forest. CP: Central Park. FI: Fishers Island. HG: Hell Gate. HSP: Harriman State Park. HV: Haverstraw, New York. JC: Jericho, New York. LDEO: Lamont-Doherty Earth Observatory. MP: Montauk Point. MN: Manorville, New York. NB: Narragansett Bay. NW: Newburgh, New York. NH: New Hampton moraine. NP: Northport moraine. OCG: Ogdensburg–Culvers Gap moraine. OP: Orient Point. PI: Pellets Island moraine. PJ: Port Jefferson, New York. PR: Providence River. PW: Port Washington, New York. RH: Rocky Hill, Connecticut. S: Sussex moraine. SB: Stony Brook moraine. SI: Staten Island. SP: Sands Point moraine. WR: Wolf Rocks moraine.
A series of ice-contact deltas has been used to correlate the ice margin position along Long Island's north shore, which extends across New York City to the Ogdensburg–Culvers Gap moraine in northern New Jersey (Fig. 1; Stanford, 1993; Stanford et al., 2021; Stone et al., 1995, 2005). The easternmost of these deltas, located in lower Manhattan, is associated with glacial Lake Bayonne, indicating that the ice margin was located at or south of the Sands Point moraine on Long Island, blocking a spillway at Hell Gate (Fig. 1; Stanford et al., 2021; Stanford and Harper, 1991; Stone et al., 2005). The large coastal moraines dammed lakes fed by LIS meltwater as the ice margin retreated northward, and the associated lake floor deposits are now found throughout northern New Jersey (Stanford et al., 2021) and underlie much of what is now Long Island Sound (Stone et al., 2005), Narragansett Bay (Oakley, 2012), Block Island Sound, and Rhode Island Sound (Needell et al., 1983; Frankel and Thomas, 1966).
Ice margin positions north of the terminal complex are marked by smaller moraines and other ice-marginal landforms that are different in character compared to the large coastal moraines. Several discontinuous, boulder-rich moraines (with individual segments up to 3 km in length) are interpreted as records of brief readvances or standstills as the Connecticut, Narragansett Bay, and Buzzards Bay lobes retreated northward from the coastal zone (Stone et al., 2005). These include the Old Saybrook and Ledyard moraines in Connecticut, which are correlated with the Wolf Rocks and Congdon Hill moraines in Rhode Island, respectively (Fig. 1; Boothroyd et al., 1998; Stone et al., 2005). The boulder-lag nature of these moraines indicates that they were affected by meltwater near the ice margin (Stone et al., 2005). Based on their morphostratigraphy, the Connecticut moraines are also tentatively correlated with the Augusta and Sussex recessional moraines in northern New Jersey (Stone and Borns, 1986; Stone et al., 2005; Fig. 1). Ice-marginal positions without moraines are marked by the collapsed ice-contact slopes of individual morphosequences deposited during deglaciation. These features mark the retreat of the ice margin in southern New England, and, while they cannot be correlated across valleys with respect to more regional ice positions, they depict the systematic retreat of an active ice margin (Koteff and Pessl, 1981; Stone et al., 2005).
To summarize, two large end moraine systems comprise a terminal complex that formed during ice margin advances as the LIS fluctuated near its maximum extent. The outermost ridges of this complex, from northern New Jersey to Nantucket, mark the southernmost extent of the LIS, and the innermost ridges of the terminal complex are mapped from the north shore of Long Island to Cape Cod and may be correlated with the Ogdensburg–Culvers Gap moraine in northern New Jersey. Recessional limits in Connecticut and Rhode Island are marked by smaller, discontinuous moraine segments that are starkly different in nature from the moraines of the terminal complex and may correlate with recessional moraines north of the Ogdensburg–Culvers Gap moraine in New Jersey.
1.1.2 Existing chronological constraints
Numerous studies have used cosmogenic exposure dating, radiocarbon dating, optically-stimulated-luminescence (OSL) dating, and records of glacial lake sediment to develop deglacial histories for the LIS in southern New England, New York, and New Jersey (e.g., Dalton et al., 2020; Gorokhovich et al., 2018; Halsted et al., 2022; Peteet et al., 2012; Ridge, 2004; Ridge et al., 2012; Stone and Borns, 1986). The timing of moraine deposition is constrained by bracketing radiocarbon (14C) ages in pre- and postglacial sediment (e.g., Stanford et al., 2021; Stone and Borns, 1986; Stone et al., 2005), which we have recalibrated to calendar years before present (BP) using the IntCal20 database and CALIB 8.2 (Fig. 2; Reimer et al., 2020). Moraines and other ice-marginal deposits dammed lakes fed by glacial melt throughout the region, including Lake Albany, which occupied what is now the Hudson Valley; Lake Hitchcock, which occupied what is now the Connecticut River Valley; and Lake Narragansett in Narragansett Bay, Rhode Island (e.g., Antevs, 1928, 1922; Oakley and Boothroyd, 2013; Ridge, 2004; Ridge et al., 2012). Annually layered, or varved, sediment throughout the northeast can be aligned across sites to form long varve sequences because the character and thickness of varves deposited in a single year are related to climatic conditions (Antevs, 1928, 1922). These sequences yield a precise chronology of ice margin retreat due the fact that (i) the presence of varves indicates ice-free conditions at a given location and that (ii) a single varve can, in some cases, be traced across sections to its northernmost occurrence, providing a maximum ice margin position for that varve year. The North American Varve Chronology (NAVC) provides a record of 5659 years of sediment deposition in glacial lakes in New York and New England, including Lake Hitchcock and Lake Albany, making it the most precise and continuous terrestrial record of LIS retreat throughout the northeastern United States (Ridge et al., 2012). Varve sequences within LIS moraines also provide minimum-limiting ages for said moraines. Data from the NAVC are reported in “North American varve years”, numbered 2701–8459, which are calibrated to calendar years through the radiocarbon dating of plant macrofossils and other organic material from 54 individual varves throughout the chronology (Ridge et al., 2012). We report NAVC ages in years BP using the Greenland ice core timescale (GICC05; Andersen et al., 2006), applying an offset of 20 925 years (where “varve year 0” corresponds to 20 925 years BP), as reported in Balco et al. (2021).
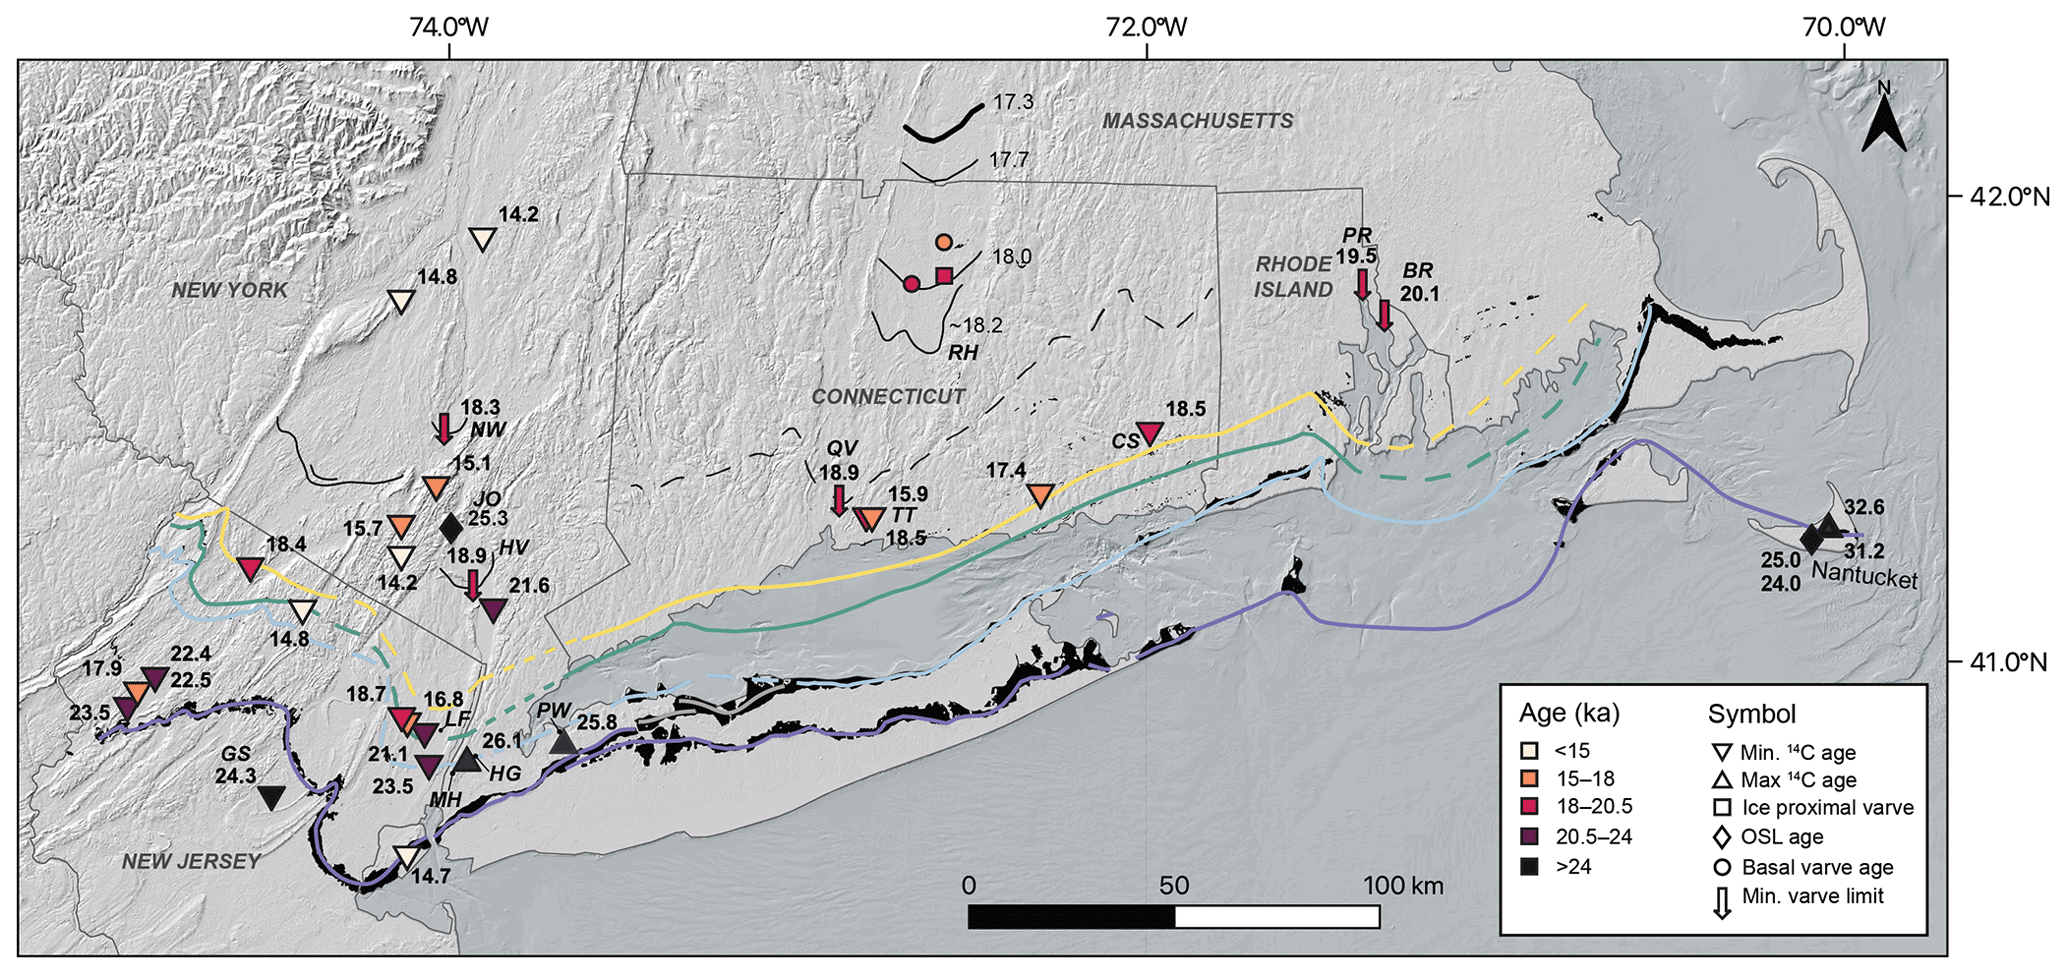
Figure 2Previously published chronological constraints based on radiocarbon and glacial varves. Background and ice margin limits are the same as those in Fig. 1. Hillshade topography is derived from the NASA Shuttle Radar Topography Mission (2013). Bathymetry is sourced from the BlueTopo product from the NOAA’s Office of Coast Survey (tinted a darker blue-gray color to indicate ocean). Ages are discussed and cited in the text. Radiocarbon ages are calibrated to cal kyr BP. BR: Barrington, Rhode Island. CS: Cedar Swamp Pond. GS: Great Swamp. HG: Hell Gate. HV: Haverstraw, New York. JO: Jones Point. LF: Little Ferry varve sequence. MH: Manhattan, New York City. NW: Newburgh, New York. PW: Port Washington. PR: Providence River. QV: Quinnipiac, Connecticut. RH: Rocky Hill. TT: Totoket.
Absolute ages have been assigned to some of the moraines using cosmogenic exposure dating (Fig. 3; Balco et al., 2002; Balco and Schaefer, 2006; Corbett et al., 2017). To integrate the latest developments in cosmogenic-nuclide dating and maintain consistency with our new results in this paper, we recalculate published exposure ages using version 3 of the online calculator described by Balco et al. (2008), the primary production rate calibration datasets from Borchers et al. (2016), and the scaling method of Lifton et al. (2014; see the Methods section for further discussion of production rate and scaling-method selection). The ages recalculated here therefore differ slightly from the originally reported exposure ages for the same samples as many of the original publications predate these updated production rate calibration and scaling methods. Finally, we note that while radiocarbon ages and varve years are referenced to 1950 CE, the exposure ages are referenced to the time of sample collection (1995–2019 CE). This difference in reference year, however, is negligible for the exposure ages discussed here, which are > 18 ka.
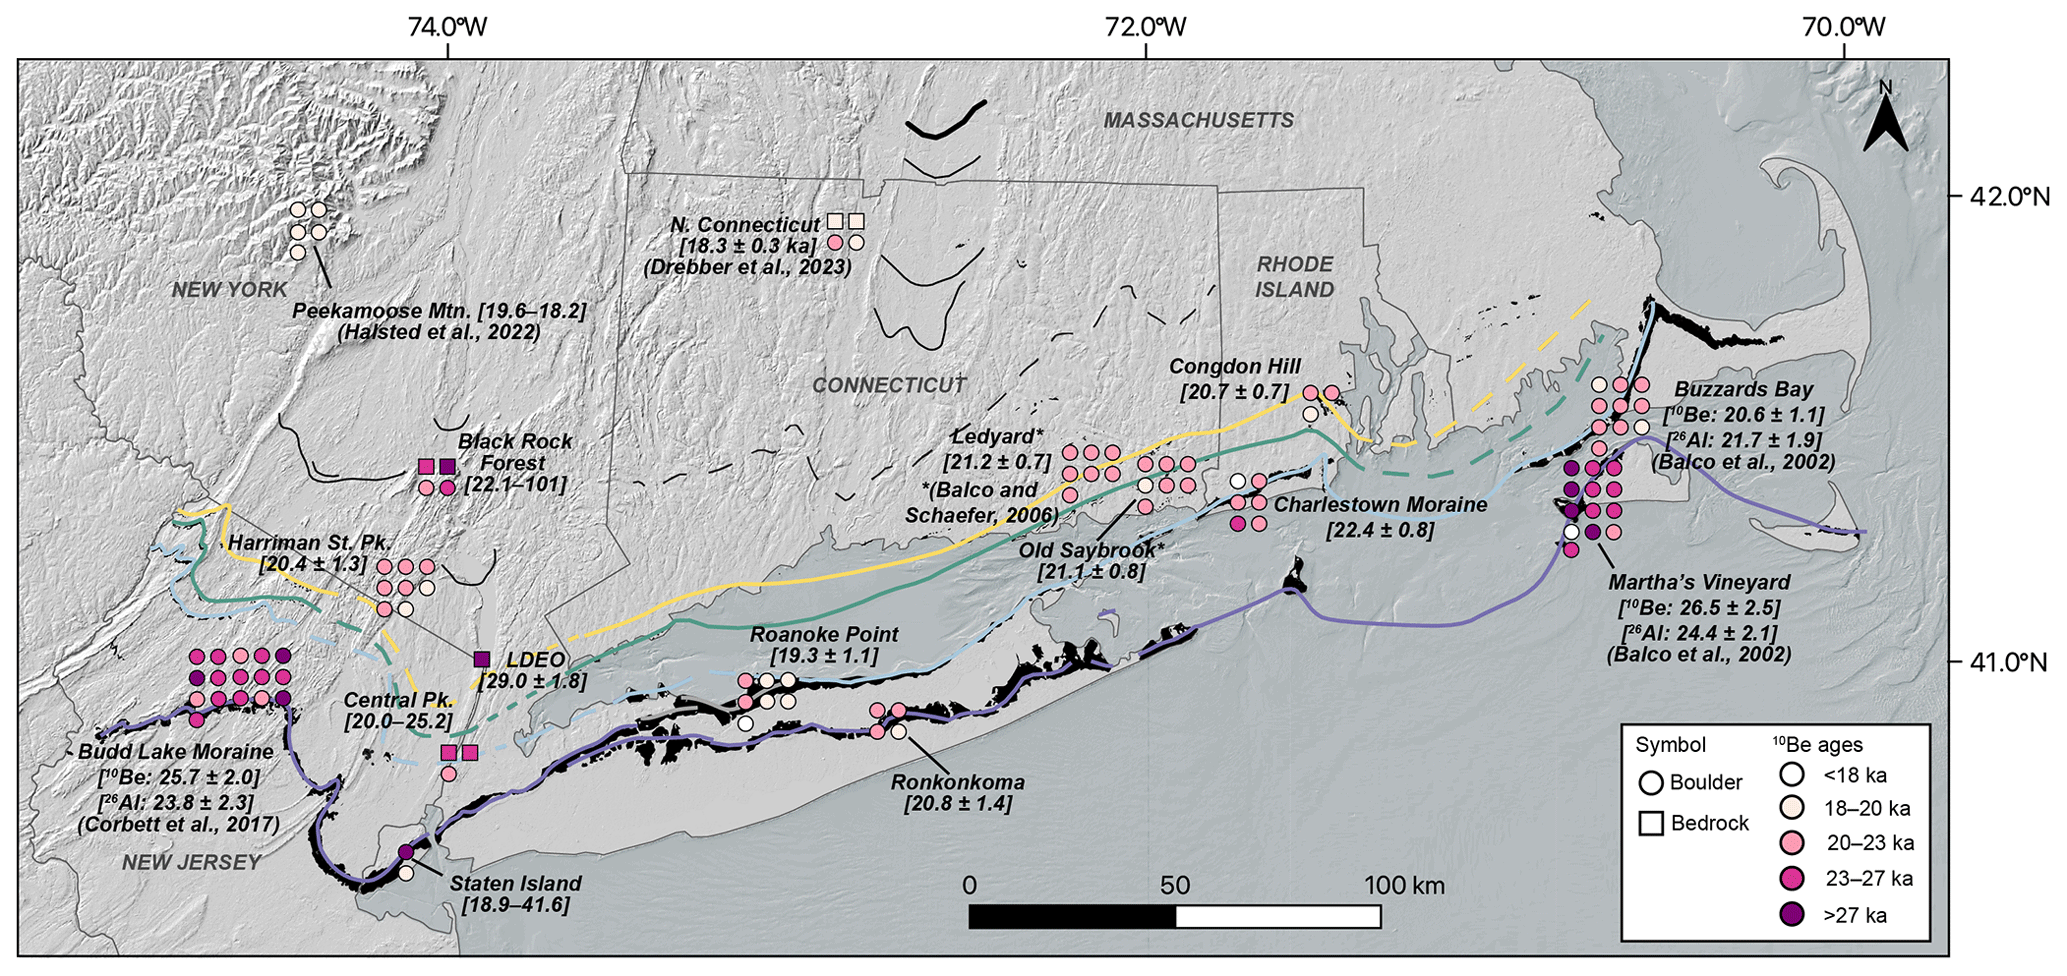
Figure 3New and previously published 10Be exposure ages for boulder and bedrock surfaces. Background and ice margin limits are the same as those in Fig. 1. Hillshade topography is derived from the NASA Shuttle Radar Topography Mission (2013). Bathymetry is sourced from the BlueTopo product from the NOAA’s Office of Coast Survey (tinted a darker blue-gray color to indicate ocean). Previously published ages are listed with their references. All ages are 10Be ages, except where both 10Be and 26Al ages are specified. On the Martha's Vineyard and Buzzards Bay moraines, samples with both 10Be and 26Al measurements are color-coded according to the average of the 10Be and 26Al ages (Balco et al., 2002). Although the Budd Lake moraine samples have both 10Be and 26Al measurements, the symbols are only color-coded according to 10Be age; this is because Corbett et al. (2017) state that many of the 27Al concentrations may be underestimated and therefore exclude the 26Al ages from their discussion. The average of the 26Al ages for the Budd Lake moraine is listed for completeness. Where all samples come from the same deposit, the age is listed as mean ± standard deviation, and where samples at a site are not from the same deposit, an age range is listed. A full list of sample ages is give in Table 1, and moraine ages are presented in Table 2. Peekamoose Mtn.: Peekamoose Mountain. Harriman St. Pk.: Harriman State Park. Central Pk.: Central Park.
Connecticut, Narragansett Bay, and Buzzards Bay lobes
Previously published radiocarbon and exposure ages constrain the occupation of the outer terminal limit for the Connecticut, Buzzards Bay, and Narragansett Bay lobes to ∼ 27–25 ka. Maximum-limiting radiocarbon ages in preglacial deposits near Boston and in Nantucket suggest that the LIS achieved its LGM extent in the east by 32–25 ka (29–21 14C kyr BP; n= 3; Fig. 2; Oldale, 1982; Schafer and Hartshorn, 1965; Tucholke and Hollister, 1973), which agrees with optically-stimulated-luminescence (OSL) ages from Nantucket of 24.0 ± 0.9 ka for the oldest moraine and 25.0 ± 0.9 ka for the outboard outwash plain (Stone and Stone, 2019; Rittenour et al., 2012).
Moreover, 10Be and 26Al ages for the Martha's Vineyard moraine range from 17.5 to 63.5 ka (n= 12) and from 17.5 to 60.5 ka (n= 13), respectively (Fig. 3; Balco et al., 2002). Some of these exposure ages, especially those older than the main age population (> 30 ka), likely contain 10Be and 26Al inherited from a previous exposure period (Balco et al., 2002). Production of 10Be and 26Al attenuates exponentially with rock depth (Lal, 1991), meaning subglacial erosion of a few meters during glacial periods can strip the surface of cosmogenic nuclides that accumulated during prior exposure periods (Harbor et al., 2006). Inherited cosmogenic nuclides therefore persist in places where subglacial erosion is insufficient to remove the signature of prior exposure due to minimally erosive (e.g., cold-based) ice, short ice-cover durations, or both (e.g., Briner et al., 2006; Stone et al., 2003; Young et al., 2016). Furthermore, the LIS likely remobilized boulders with significant cosmogenic-nuclide inventories at or near the terminal position as it advanced towards its LGM extent, so it is not surprising that some of the exposure ages of the terminal moraine are older than the moraine's true emplacement age. Large end moraines with kame and kettle topography, such as the Martha's Vineyard moraine, also experience permafrost disturbance, which may expose boulders that were previously embedded in the moraine and shielded from the cosmic-ray flux for some time after deposition (Applegate et al., 2010). Alternatively, they shift or rotate boulders, meaning original top surfaces (formed upon deposition) were not sampled. Exposure ages of exhumed or disturbed boulders (e.g., boulders disturbed by agricultural practices and other human activities) are therefore younger than the true emplacement age of the moraine. Excluding exposure ages likely affected by nuclide inheritance or postdepositional disturbance (n= 4), 10Be ages for the Martha's Vineyard moraine average 26.5 ± 2.5 ka (n= 8; mean ± standard deviation), and 26Al ages average 24.4 ± 2.1 ka (n= 9; Fig. 3; Balco et al., 2002; Balco, 2011) and are generally consistent with the maximum-limiting radiocarbon ages in the region and the OSL ages in Nantucket.
Moreover, 10Be exposure ages for the Buzzards Bay moraine average 20.6 ± 1.1 ka (n= 10), and 26Al ages average 21.7 ± 1.9 (n= 10; Balco et al., 2002). The Old Saybrook and Ledyard moraines in Connecticut have 10Be exposure ages of 21.1 ± 0.8 (n= 7) and 21.2 ± 0.7 ka (n= 7), respectively (Fig. 3; Balco and Schaefer, 2006). Thus, although the moraines represent a recessional sequence and were not deposited simultaneously, their ages are indistinguishable within 1σ uncertainty. Postglacial sediment containing tundra vegetation in Cedar Swamp Pond, immediately north of the Ledyard moraine, provides a minimum-limiting age for the recessional-moraine sequence of 18.5 ± 0.7 ka (mean age ± 2σ uncertainty; 15.2 ± 0.3 14C kyr BP; McWeeney, 1995; Stone et al., 2005). A radiocarbon age of 18.5 ± 0.3 ka (15.1 ± 0.2 14C kyr) for Totoket, near New Haven, Connecticut, also provides a minimum-limiting age for the Ledyard moraine (Fig. 2; Davis et al., 1980; Deevey, 1958).
Varve sequences in the region also place minimum-age constraints on the recessional-moraine sequence. The NAVC for the Connecticut River Valley begins a few kilometers north of Rocky Hill, the spillway for Lake Hitchcock (Figs. 1 and 2; Antevs, 1928; Ridge et al., 2012). The Rocky Hill sequence overlaps with a varve section in Newburgh, New York, implying that the ice margin had retreated to Newburgh and Rocky Hill by ∼ 18.2 ka (varve year 2701; Fig. 2; Antevs, 1928, 1922; Balco et al., 2021; Ridge, 2004; Ridge et al., 2012). Several varve sections south of Rocky Hill and Newburgh cannot be correlated with the NAVC and are therefore presumed older, providing minimum estimates for LIS retreat. A ∼ 500-year varve sequence in Quinnipiac, near New Haven, Connecticut, is correlated with a 700-year sequence in Haverstraw, New York, placing a minimum age for ice-free conditions in Quinnipiac and Haverstraw of > 18.9 ka (varve year 2000; Fig. 2; Antevs, 1928; Balco and Schaefer, 2006; Ridge et al., 2012). Farther east, in the Providence River, Rhode Island, a 600-year varve sequence cannot be correlated with the NAVC. Combining the Providence River sequence with several varve sequences in Connecticut and southern Massachusetts found between the base of the NAVC and Providence (including the Quinnipiac and Haverstraw varves) suggests that the ice margin must have retreated past Barrington, Rhode Island, by ∼ 20.1 ka and north of Providence by ∼ 19.5 ka (Figs. 1 and 2; Oakley and Boothroyd, 2013). Three cosmogenic exposure ages ∼ 30 km, observed north of the Rocky Hill dam, average 18.3 ± 0.3 ka, corroborating the deglaciation timings in northern Connecticut (Drebber et al., 2023).
The NAVC reveals systematic net ice retreat through New England at 50–300 m yr−1 (Ridge et al., 2012), interrupted by relatively minor advances or stillstands, at least in the White Mountains and Maine, as documented by comprehensive 14C-based chronologies and 10Be dating (e.g., Borns et al., 2004; Bromley et al., 2015, 2020; Davis et al., 2015; Dorion et al., 2001; Hall et al., 2017; Kaplan, 2007; Koester et al., 2017; Thompson et al., 2017). The position of the retreating ice margin is also marked by annual De Geer moraines spaced 100 to 300 m apart in northern New England (Sinclair et al., 2018; Todd et al., 2007; Wrobleski and Hooke, 2020). The LIS margin had retreated north of New England by 13.6 ka (Ridge et al., 2012), although there may have been slightly later retreats or pockets of smaller residual glaciers lasting briefly longer in areas of northern Maine (Borns et al., 2004).
Hudson lobe
Bulk radiocarbon ages of preglacial deposits in Port Washington, New York, and Manhattan, New York, date to 25.8 ± 1.6 ka (21.8 ± 0.8 14C kyr BP) and 26.1 ± 0.3 ka (21.7 ± 0.1 14C kyr BP), respectively, providing maximum-limiting ages for the Hudson lobe terminal moraine (Fig. 2; Schuldenrein and Aiuvalasit, 2011; Sirkin and Stuckenrath, 1980). This agrees with an OSL age of 25.3 ± 7.4 ka for proglacial deposits in Jones Point, New York, associated with the advance of the Hudson lobe (Gorokhovich et al., 2018). A bulk radiocarbon age of 24.3 ± 1.1 ka (20.2 ± 0.5 14C kyr BP) from an LGM varve sequence in Great Swamp, New Jersey, provides a minimum-limiting age for the Budd Lake moraine in New Jersey (Fig. 2; Reimer, 1984; Stanford et al., 2021). Boulders a few kilometers within the Budd Lake moraine have 10Be ages of 25.7 ± 2.0 ka (n= 16) and 26Al ages of 23.8 ± 2.3 ka (n= 16), although the original publication excludes the 26Al ages from discussion due to evidence that the 27Al concentrations were underestimated (Fig. 3; Corbett et al., 2017). Together, the existing chronological constraints suggest that the Hudson lobe of the LIS reached its southernmost extent by ∼ 25–26 ka and abandoned this limit by ∼ 24 ka (Corbett et al., 2017; Stanford et al., 2021).
The varves in Haverstraw, New York, provide a minimum-limiting age of 18.9 ka for the Ogdensburg–Culvers Gap moraine and the Augusta and Sussex recessional moraines in northern New Jersey (Ridge et al., 2012). A floating varve sequence in Little Ferry (Teterboro, New Jersey) comprises 1100 glacial varves that must be older than the Haverstraw sequence and 1430 postglacial varves that may overlap with the Haverstraw varves (Antevs, 1928; Stanford et al., 2012). The Little Ferry varves therefore place a minimum limit of ∼ 20 ka at the Augusta moraine position (18.9 + 1.1 kyr; Fig. 2). A recent compilation of chronological constraints in northern New Jersey dates the base of the Little Ferry varve sequence to ∼ 23.5 ka, based on a nearby bulk radiocarbon age (Stanford et al., 2021). Considering these varve sequences alongside additional radiocarbon ages for northern New Jersey, Stanford et al. (2021) hypothesized that the Hudson lobe abandoned the terminal moraine at ∼ 24 ka and retreated to the position of the Sussex moraine, the innermost of the northern New Jersey recessional moraines, by ∼ 23.5 ka. Based on their revised chronology, Stanford et al. (2021) suggested that the Connecticut recessional moraines (i.e., the Ledyard and Old Saybrook moraines) may correlate with the New Hampton and Pellets Island moraines in New York, rather than with the northern New Jersey recessional sequence.
The youngest postglacial radiocarbon ages of plant macrofossils in lake and bog sediments throughout the region correspond to ∼ 14–18.5 ka (Fig. 2; Davis et al., 1980; Deevey, 1958; McWeeney, 1995; Stone et al., 2005; Peteet et al., 2012). These dates provide further minimum-limiting ages for the moraine sequences discussed here. The abundance of macrofossils dating to ∼ 14–16 ka, combined with the fact that most ages older than 16 ka are due to bulk sediments (which are more likely to contain old carbon), has been used to argue that the LIS abandoned its LGM limit around 14–16 ka (Peteet et al., 2012), which is ∼ 8–10 kyr later than indicated by the exposure age and radiocarbon datasets presented and compiled here.
The Connecticut, Narragansett Bay, and Buzzards Bay lobes exhibit exceptionally well preserved moraines, providing an opportunity to constrain the regional timing of the LGM and its culmination. Below, we describe the geomorphic settings and sample locations for 40 new exposure ages from the Connecticut, Narragansett Bay, and Buzzards Bay lobes on Long Island, New York, and in Rhode Island, as well as from the Hudson lobe to the west.
2.1 Connecticut and Narragansett Bay lobes
2.1.1 Long Island, New York
Long Island is a large (∼ 200 km long and 35 km wide), densely populated island in the New York metropolitan area that extends from Brooklyn, New York City, to its eastern points at Montauk Point and Orient Point (Fig. 1). The island features tills and outwash plains associated with the southernmost extent of the LIS at the LGM, and its topography is defined by several prominent moraine ridges (> 60 m relief at some points), including the Ronkonkoma, Harbor Hill, and Roanoke Point moraines (Fig. 1; Fuller, 1914; Sirkin, 1982; Sirkin and Stuckenrath, 1980). The Ronkonkoma moraine is the stratigraphically oldest (southernmost) moraine associated with the Connecticut lobe of the LIS and extends from E–W, from the hamlet of Jericho in west-central Long Island to Montauk, forming the South Fork of Long Island. The moraine ridge comprises discontinuous kame deposits and thrust sheets overlain by thin, sandy till and bisected by outwash-filled valleys (Cadwell, 1989; Sirkin, 1982). The easternmost point of the Ronkonkoma moraine at Montauk Point is correlated with the positions of the outer terminal moraine on Block Island, in Martha's Vineyard, and in Nantucket (Stone and Borns, 1986; Sirkin, 1976). Although boulders ideal for surface exposure dating were difficult to locate on the Ronkonkoma moraine, we sampled four medium-sized (∼ 1 m height) granitoid boulders near Manorville, New York (Fig. S1 in the Supplement).
The Harbor Hill moraine was originally correlated with the New Jersey terminal position, mapped as extending from Staten Island and across the north shore of Long Island, crosscutting the Ronkonkoma moraine near Jericho, New York (Fuller, 1914; Fig. 1). Yet, updated models of Long Island glaciation demonstrate that the classical Harbor Hill moraine comprises several segments that may have been deposited asynchronously (Sirkin, 1982; Stone and Borns, 1986). Here, the term Harbor Hill moraine refers to the segment extending from its confluence with the Ronkonkoma moraine through to Staten Island, which represents the terminal limit of the Hudson lobe in western Long Island (Fig. 1), while the Northport and Stony Brook moraine segments northeast of the confluence with the Ronkonkoma moraine are considered to have younger positions (Sirkin, 1982; Stone and Borns, 1986). A stratigraphic section in Port Washington, New York, reveals that the Harbor Hill moraine is characterized by an ablation till up to 10 m thick, which overlies thrust sheets of stratified drift containing dislocated preglacial deposits, suggesting that it formed during a readvance (Mills and Wells, 1974; Oldale and O'Hara, 1984). Several additional moraine segments, mapped north of the Ronkonkoma ice margin position in eastern Long Island (Sirkin 1982, 1998), are not discussed further here.
The Roanoke Point landform is the innermost Connecticut lobe moraine on Long Island. It appears to crosscut the Stony Brook moraine segment near Port Jefferson, New York, extending east to Orient Point, forming the North Fork of Long Island (Fig. 1; Cadwell, 1989; Sirkin, 1982). The moraine consists of till overlying deformed outwash (Sirkin, 1982). Glaciotectonic structures within the moraine stratigraphy, such as imbricated thrust sheets and dislocated strata, indicate that the moraine was likely deposited during a readvance of the ice margin, rather than during a standstill (Oldale and O'Hara, 1984; Boothroyd and Sirkin, 2002). The Roanoke Point moraine is correlated with the Sands Point moraine to the west, deposited by the Hudson lobe, and tentatively correlated with the Ogdensburg–Culvers Gap moraine in northwestern New Jersey (Fig. 1; Sect. 1.1.1; Stanford, 2010, 1993; Stanford et al., 2021; Stanford and Harper, 1991; Stone et al., 2002, 1995). We sampled seven large erratic boulders (> 1 m tall, with some as tall as 4 m) on or near the Roanoke Point moraine in the vicinity of Port Jefferson, New York, and Stony Brook University (Fig. 4; Fig. S1).

Figure 4Representative sampling locations for surface exposure dating. LI-3 refers to a large boulder sampled in an urban setting on the Roanoke Point moraine on Long Island. The sizable boulder is located slightly off the moraine crest (visible in the background); it is not located on a local high point and may have experienced postdepositional disturbance. GB2002-CH-4 refers to a stable boulder on the Charlestown moraine. The Ledyard moraine, Connecticut, comprises interlocked boulders. In Harriman State Park, interlocked boulders form an ice-marginal boulder deposit.
Mapping and sampling of the Long Island moraines were conducted as part of the Lamont Summer Intern Program for undergraduates between 2002–2006. Original field observations from 2006 note that one sample, LI-9, was located in a topographic depression and may have been exhumed or toppled after deposition. Upon further inspection in 2023, many of the samples collected from the Roanoke Point moraine were found in topographic low points, and only LI-1 and LI-8 were taken from local high points, where boulders were less likely to have been affected by postdepositional processes (Fig. S1).
2.1.2 Rhode Island
Three ice-marginal positions in southern Rhode Island are marked by the Charlestown, Wolf Rocks, and Congdon Hill moraines. The stratigraphically oldest of these is the Charlestown moraine, which is part of the combined Roanoke Point, Fishers Island, Charlestown, and Buzzards Bay limit (Fig. 1; Kaye, 1960; Upham, 1879). The moraine is ∼ 30 km long and 0.5–3 km wide, rising up to 30 m above the surrounding topography (Kaye, 1960). It is composed of a mixture of diamict and glaciotectonically displaced stratified deposits (sand and gravel), indicating that it formed during a readvance, with numerous large boulders present at the surface (Boothroyd et al., 1998; Boothroyd et al., 2002; Oldale and O'Hara, 1984; Schafer, 1965). The Wolf Rocks boulder moraine, which we did not sample, is located within the Charlestown moraine and is correlated with the Old Saybrook recessional moraine in Connecticut (Stone et al., 2005). The Congdon Hill moraine is the innermost recessional moraine in Rhode Island and is correlated with the Ledyard recessional moraine, located to the west in Connecticut (Boothroyd and Sirkin, 2002; Stone et al., 2005). This hummocky moraine ridge is 6 km long and 3–20 m tall and comprises boulders and sandy till, with numerous large boulders found near the moraine crest (Stone, 2014).
We collected six samples from the Charlestown moraine and three samples from the Congdon Hill moraine, all of which were taken from large (> 1 m) boulders (Figs. 4 and S2). Field observations noted that sample GB2002-CH-1 (from the Charlestown moraine) was collected from a boulder that had collapsed into a gravel pit. Although it appeared that its original position could be reconstructed from weathering characteristics and other evidence, this could not be verified.
2.2 Hudson lobe
The Hudson lobe of the LIS deposited a NE–SW-trending moraine on Staten Island, which correlates with the terminal moraines on Long Island to the east (Fig. 1; Cadwell, 1989) and in northern New Jersey to the west (Stone, 2002). The hummocky moraine is 0.5–4 km wide and 20 km long and primarily comprises reddish-brown, clayey tills that are up to ∼ 45 m thick (Soren, 1988). Boulders are scarce on the moraine crest (Soren, 1988), but we found two granite boulders suitable for sampling (Fig. S3 in the Supplement).
We also present new exposure ages for several locations in the lower Hudson Valley: Central Park in New York City, the Lamont-Doherty Earth Observatory (LDEO), Harriman State Park, and Black Rock Forest (Fig. 1). In Central Park, New York City, glacially molded outcrops consisting of Manhattan schist, located 25 km north of the terminal moraine, are sparsely covered by erratic boulders sourced from pegmatitic granites that outcrop ∼ 15 km north of Central Park, near the Bronx Zoo (Brock and Brock, 2001; Jaret et al., 2021; Taterka, 1987). We sampled two quartz veins found within Manhattan schist: one from Umpire Rock, located in the southwestern corner of Central Park, and one from the northwestern corner of the park. We also sampled a quartz-bearing boulder from the southeastern corner of Sheep Meadow (Collins, 2005). At the LDEO, ∼ 50 km north of the terminal limit, we collected a single sample from the Palisades diabase for surface exposure dating. In Harriman State Park, ∼ 70 km north of the terminal moraine, we sampled eight large (generally > 2 m tall) gneiss or granitoid boulders from an area with a large concentration of erratics, representing a local ice-marginal deposit, located near two large boulders called the “Grandma and Grandpa Rocks” (Fig. 4). The erratics are perched on bedrock or on top of thin till veneer. Finally, in Black Rock Forest, ∼ 90 km north of the outer terminal limit, we collected three samples from glacially eroded gneissic bedrock and two samples from large (> 2 m tall) granite boulders.
Samples for surface exposure dating from the upper surfaces of bedrock and erratic boulders were collected between 2002 and 2006 using the drill-and-blast method from Kelly (2003) and/or a hammer and chisel. We collected one replicate sample from Black Rock Forest (BRF-19-01) in 2019. At each site, we measured topographic shielding using a clinometer and recorded the sample location and elevation using a handheld GPS. However, this was not the case for the samples from Rhode Island, for which elevations were measured relative to the nearest USGS benchmark using a barometer-traverse method. Samples were processed at the Lamont-Doherty Earth Observatory's cosmogenic-dating laboratory, following established procedures for isolating quartz and extracting beryllium (e.g., Schaefer et al., 2009). Furthermore, Be ratios were measured at the Center for Accelerator Mass Spectrometry (CAMS) at Lawrence Livermore National Laboratory (LLNL) between August 2005 and July 2007, with one additional measurement obtained in July 2019. Prior to 2007, samples were measured relative to the KNSTD standard, which has a Be ratio of 3.11 × 10⁻¹² (Nishiizumi, 2002). Measurements conducted in 2007 or later were made relative to the 07KNSTD standard, which has a Be ratio of 2.85 × 10⁻¹² (Nishiizumi et al., 2007) and is accounted for in our 10Be age calculations (Balco et al., 2008). Moreover, 10Be concentrations ranged from 5.61 × 10⁴ to 6.17 × 10⁵, with an analytical uncertainty of 2 %–9 %. Blank corrections, calculated by subtracting the average number of 10Be atoms from blanks processed in each sample batch, ranged from < 0.5 %–12%, with the majority of blank corrections being < 2 % (Table S1). Reported uncertainties in 10Be concentrations include analytical errors, blank errors, and uncertainties related to 9Be concentration (1.5 %) that are propagated in quadrature.
Apparent 10Be exposure ages were calculated using version 3 of the online exposure calculator described by Balco et al. (2008) and subsequently updated. All information needed to calculate exposure ages is available at https://version2.ice-d.org/laurentide/publication/1187/ (last access: 30 July 2024). Here, “apparent” exposure ages refer to calculated surface ages assuming a single period of exposure with no erosion or burial. We note that including the effects of subaerial rock erosion or snow cover would make the ages presented here slightly older. Since the publication of the first exposure age chronologies in southern New England, efforts have been made to better estimate cosmogenic-nuclide production rates at sites with independent age control (e.g., Balco et al., 2009; Kaplan et al., 2011; Putnam et al., 2019; Young et al., 2013). Here, it should be noted that Balco et al. (2009) established a regional 10Be production rate calibration dataset for northeastern North America (NENA) using 10Be measurements from independently dated sites in New England, most of which are part of the NAVC, and on Baffin Island, Canada. In an effort to synthesize several new and existing production rate datasets, Borchers et al. (2016) described “primary” production rate datasets for 10Be and 26Al (among other nuclides), which include sites that range in latitude and elevation but do not include calibration sites from NENA. As of this writing, the 10Be reference production rates calculated using the NENA and Borchers et al. (2016) datasets differ by only ∼ 1.5 %; the reference production rates were calculated using the online production rate calculator described by Balco et al. (2008) and subsequently updated (http://hess.ess.washington.edu/math/v3/v3_cal_in.html, last access: 26 January 2023). Given the similarity of these two production-rate datasets, we here employ the 10Be and 26Al production rates from Borchers et al. (2016) to avoid circularity when discussing the agreement of the exposure age chronology with the NAVC. In addition, time-dependent production-rate-based scaling frameworks, which account for changes in the geomagnetic field (and therefore also account for cosmic-ray flux to the Earth's surface), have been more widely adopted. The LGM moraines discussed here have exposure ages older than those at the production rate calibration sites (Balco et al., 2009; Borchers et al., 2016); thus, employing time-dependent scaling methods may produce more accurate exposure ages. Therefore, we discuss exposure ages calculated using the primary production rate calibration dataset from Borchers et al. (2016) and the time-dependent “LSDn” production-rate-based scaling method from Lifton et al. (2014), although we also provide ages calculated using the NENA production rate calibration dataset from Balco et al. (2009; NENA) and non-time-dependent “St” scaling (Lal, 1991; Stone, 2000), as described in Tables S2 and S3. We recognize that the choice of scaling method affects the absolute exposure ages of the moraines by up to ∼ 5 % (Table 2), but we emphasize that this is within the uncertainty of many moraine ages and does not affect either the calculated rates of net retreat between moraines or our conclusions.
Exposure ages from Long Island, New York, and Rhode Island, which are presented in Table 1 and Fig. 3, are relevant to the glacial history of the Connecticut, Narragansett Bay, and Buzzards Bay lobes of the LIS. Ages for the Ronkonkoma moraine range from 19.1 to 22.4 ka, with an average of 20.8 ± 1.4 ka (average ± SD; n= 4). Boulders on the Roanoke Point moraine range in age from 18.2 to 20.9 ka, with an average age of 19.3 ± 1.1 ka (n = 6) and one outlier with an age of 14.2 ± 0.6 ka. In Rhode Island, six boulders on the Charlestown moraine have exposure ages that range from 21.8 to 23.7 ka. Here, one outlier (GB2002-CH-1), excluded because field observations indicated that the boulder may not have been in its original position (Sect. 2.1.2), has an exposure age of 17.4 ± 1.6 ka, which is younger than the main population of ages for this moraine. The average age of the Charlestown moraine is 22.4 ± 0.8 ka (n= 5). Boulders on the Congdon Hill moraine range in age from 20.0 to 21.3 ka, with an average age of 20.7 ± 0.7 ka (n= 3).
Table 1New 10Be exposure ages for southern New England and New York. All ages were calculated using the primary production rate dataset from Borchers et al. (2016). N/a: not applicable.
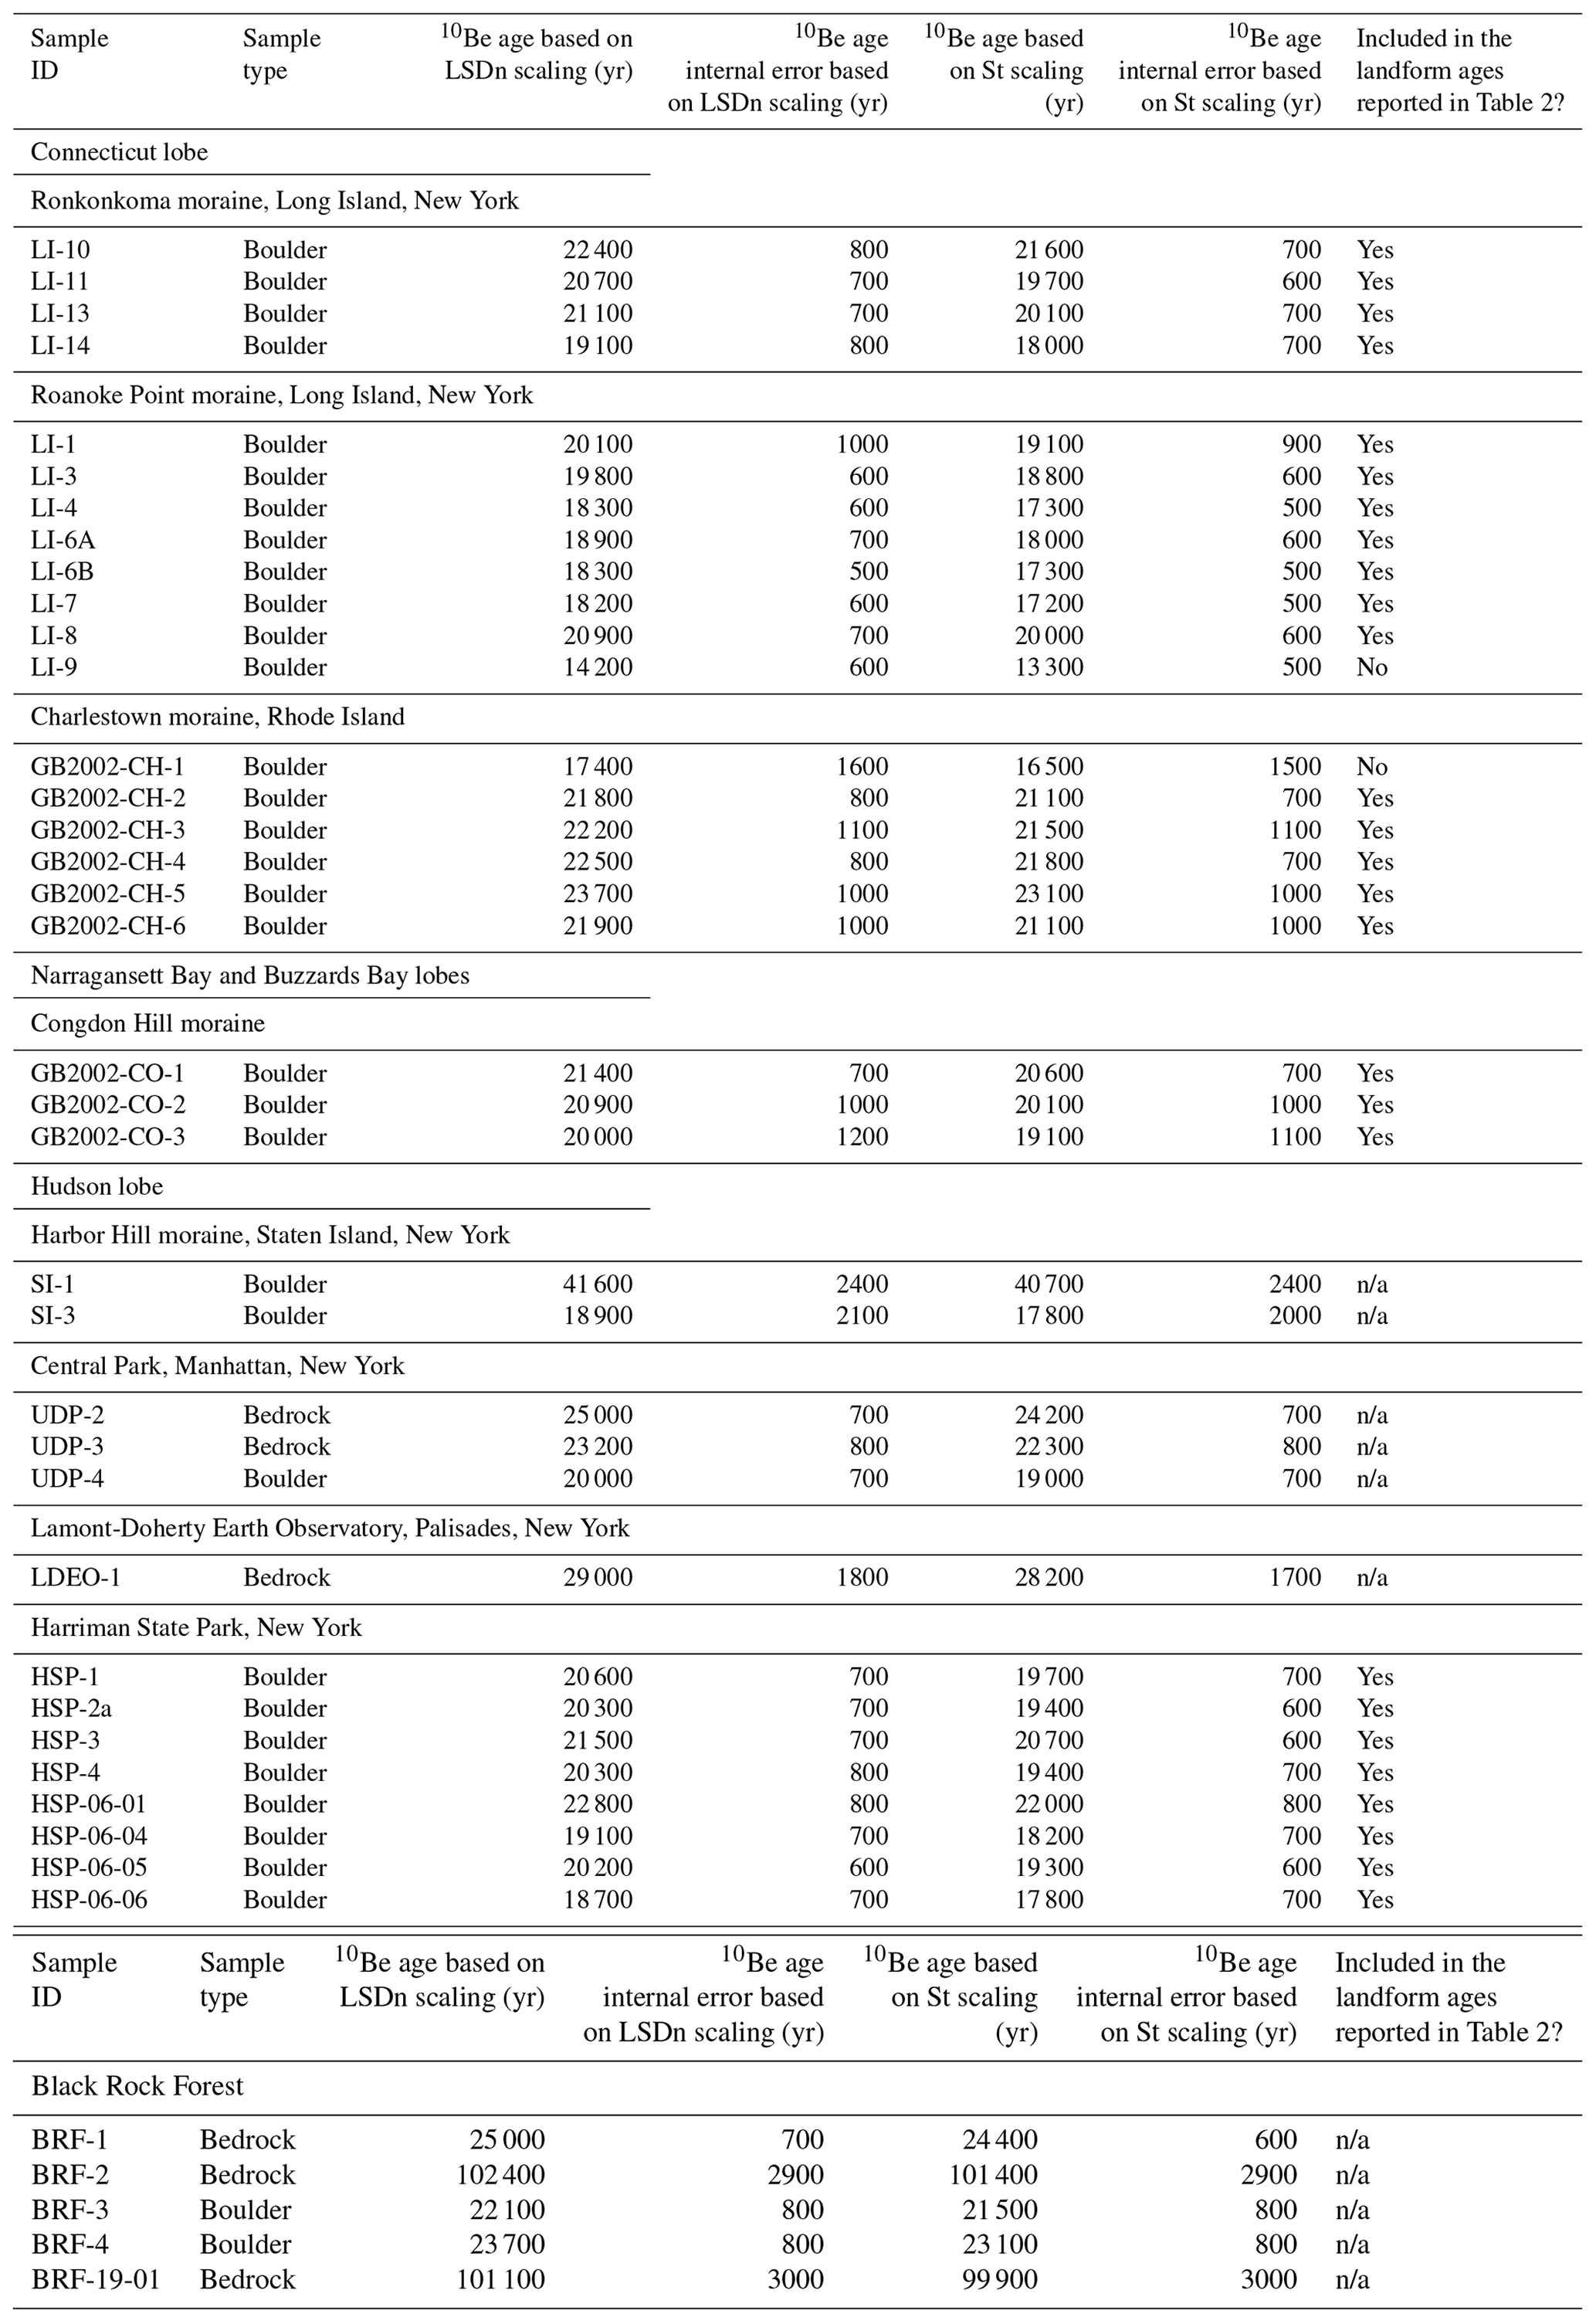
Additional exposure ages west of Long Island, in southern New York, pertain to the Hudson lobe of the LIS (Fig. 3). On Staten Island, two boulders yield 10Be ages of 41.6 ± 2.4 and 18.9 ± 2.1 ka. In Central Park, Manhattan, two 10Be ages from bedrock samples are 25.0 ± 0.7 and 23.2 ± 0.8, and an erratic boulder from Sheep Meadow yields an age of 20.0 ± 0.7 ka. A single 10Be age for bedrock at the Lamont-Doherty Earth Observatory is 29.0 ± 1.8 ka. Samples from the ice-marginal deposit in Harriman State Park range in age from 18.7 to 22.8 ka, with an average of 20.4 ± 1.3 ka (n= 8). Finally, three bedrock samples from Black Rock Forest date to 25.0 ± 0.7, 102 ± 3, and 101 ± 3 ka (the latter two bedrock samples are from the same outcrop), and two boulder samples date to 23.7 ± 0.8 and 22.1 ± 0.8 ka.
The dataset of new and previously reported exposure ages spans the LGM (∼ 26–19 ka), providing insight into the timing of the LIS maximum extent, the LGM duration, and implications for the onset of initial retreat in southern New England and New York. We assess the exposure age chronology in more detail to establish an age for each ice limit, present estimates for average retreat rates through the study area, and place the moraine chronology in a climatic context.
5.1 Moraine ages
5.1.1 Connecticut, Narragansett Bay, and Buzzards Bay lobes
The cosmogenic-nuclide chronology for the Connecticut, Narragansett Bay, and Buzzards Bay lobes agrees with limiting age constraints from radiocarbon and glacial lake varves in the region (Figs. 2 and 5), including those for the timing of the LGM and the onset of ice recession. The 10Be age (26.5 ± 2.5 ka) and 26Al age (24.4 ± 2.1 ka) for the Martha's Vineyard moraine agree within uncertainty with the maximum-limiting radiocarbon ages for Port Washington, New York; Nantucket, Massachusetts; and near Boston, Massachusetts, as well as with OSL ages for Nantucket. These data collectively suggest that the southeastern LIS reached its maximum LGM extent by ∼ 32.4–25.6 ka (Sect. 1.1.2; Balco et al., 2002; Oldale, 1982; Rittenour et al., 2012; Schafer and Hartshorn, 1965; Stone and Stone, 2019; Tucholke and Hollister, 1973). The Ledyard moraine (21.2 ± 0.7 ka; Balco and Schaefer, 2006) and Congdon Hill moraine (20.7 ± 0.7 ka), the innermost recessional moraines discussed here, are slightly older than the minimum-limiting ages for these moraines, based on varve sequences from Quinnipiac (18.9 ka; Ridge et al., 2012) and the Providence River (20.1 ka; Oakley and Boothroyd, 2013; Sect. 1.1.2).
Average exposure ages for the Connecticut, Narragansett Bay, and Buzzards Bay moraines are generally in stratigraphic order for each moraine, with the terminal limit dating to ∼ 24.5–26.5 ka; the combined Roanoke Point, Charlestown, and Buzzards Bay limit dating to ∼ 19.5–22.5 ka; and the inner limits in Connecticut and Rhode Island dating to ∼ 20.5–21 ka (Table 2; Fig. 6). Upon closer inspection, however, the average exposure ages for the Ronkonkoma moraine (20.8 ± 1.4), Roanoke Point moraine (19.3 ± 1.1 ka), and Buzzards Bay moraine (21.2 ± 1.6 ka; Balco et al., 2002) are slightly younger than those of stratigraphically equivalent moraines (e.g., the Charlestown moraine) and/or inboard moraines (e.g., the Old Saybrook, Ledyard, and Congdon Hill moraines; Fig. 6), although the age distributions for equivalent ice margin limits overlap (Table 3; Fig. 7). It is not necessary for stratigraphically equivalent moraine segments to be exactly the same age as it is possible that the timing of moraine emplacement was spatially variable across the region due to long occupation times and/or asynchronous abandonment of the large moraine belts. Yet, it is expected that outboard moraines are older than inboard moraines. Thus, the apparent discrepancy between the average moraine age and the stratigraphic order can be explained if (i) the average ages of the Connecticut and Rhode Island moraines are erroneously old due to nuclide inheritance and/or (ii) the average ages of the Ronkonkoma, Roanoke Point, and Buzzards Bay moraines are spuriously young due to postdepositional disturbance affecting at least some boulders.
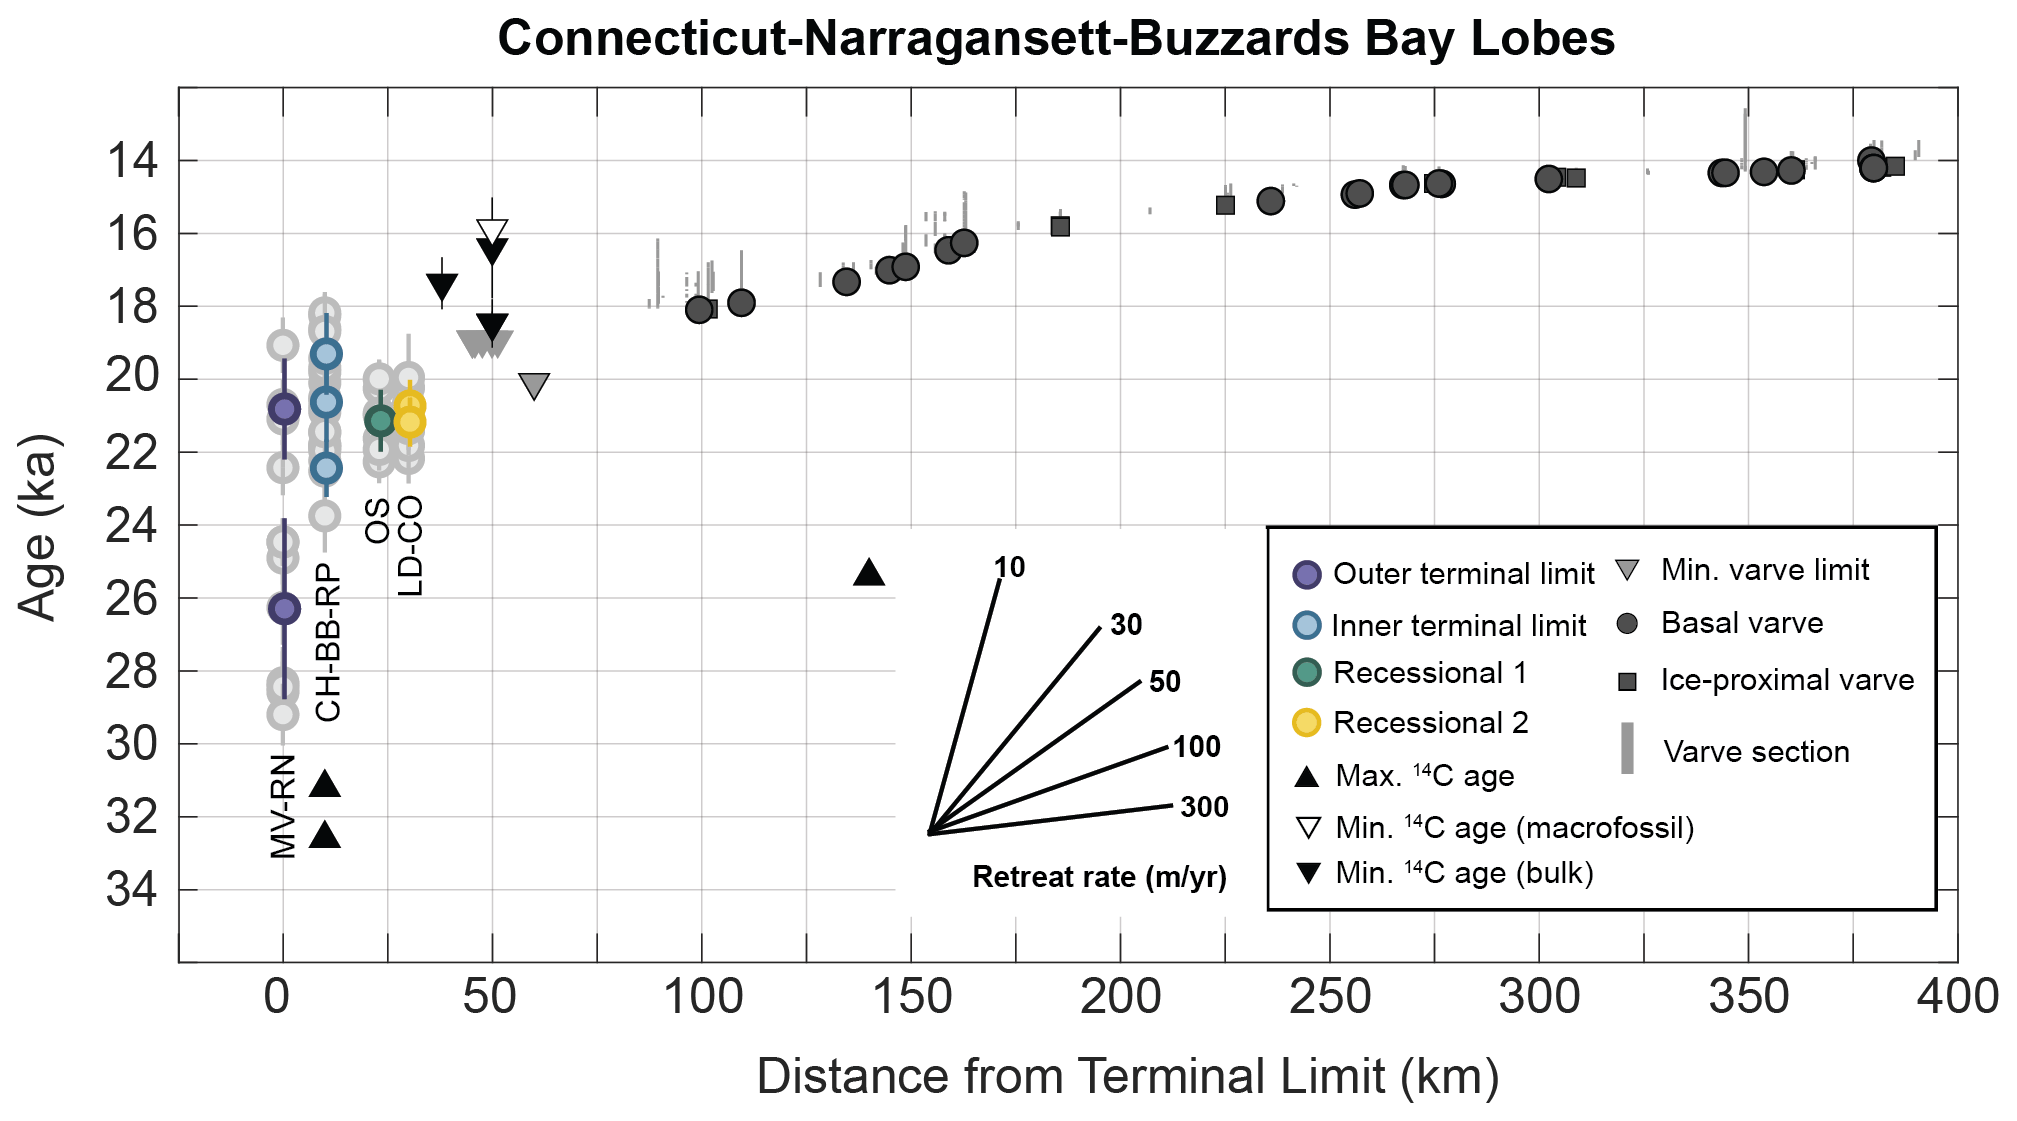
Figure 5Time–distance diagram for the Connecticut, Narragansett Bay, and Buzzards Bay lobes of the LIS, based on exposure age, radiocarbon, and varve chronologies. Only 10Be ages are shown for simplicity. Individual boulder ages are indicated by light-gray circles, and average moraine ages are color-coded in the same way as in Fig. 1. Moraine names are listed below each limit in order from oldest to youngest. MV: Martha's Vineyard moraine. RN: Ronkonkoma moraine. CH: Charlestown moraine. BB: Buzzard's Bay moraine. RP: Roanoke Point moraine. OS: Old Saybrook moraine. LD: Ledyard moraine. CO: Congdon Hill moraine. The inset shows the slopes associated with various retreat rates.

Figure 6Camel plots for moraine exposure ages, categorized by LIS lobe. Colors are the same as those in Fig. 1. Filled camel plots show the relative probability distribution for the 10Be ages of the moraines, and unfilled camel plots show the probability distributions for the 26Al ages. Note how the normal age distributions for the Ledyard, Old Saybrook, Charlestown, and Harriman State Park moraine boulders compare to the age distribution for the Martha's Vineyard moraine, which likely reflects both postdepositional disturbance (young outliers) and inheritance (old outliers). See Tables 1 and S2 for details on outlier identification.
We find it unlikely that the boulders on the Charlestown, Old Saybrook, Ledyard, and Congdon Hill moraines contain significant inherited 10Be. Indeed, 10Be, like most cosmogenic nuclides, is produced through neutron spallation and muon interactions. Spallation dominates production at the Earth's surface and decreases rapidly with depth at an attenuation length of ∼ 160 g cm−2 at mid-latitudes. Muon interactions account for ∼ 2 % of cosmogenic-nuclide production at the Earth's surface but continue to depths of tens of meters in rock, thereby comprising the majority of 10Be production below ∼ 2 m depth (Lal, 1991; Balco, 2017). Cosmogenic-nuclide inheritance is most often observed in places where subglacial erosion is low, such as regions with cold-based ice, and is generally more prevalent on bedrock surfaces than on boulders that have been entrained in ice (e.g., Stone et al., 2003; Young et al., 2016). The distribution of boulder exposure ages for moraines on which some boulders exhibit inheritance tends to skew toward older ages (Applegate et al., 2010), as is the case for the Martha's Vineyard moraine. The distributions of exposure ages for the Connecticut and Rhode Island moraines, however, are normal (Table 2; Fig. 6), making the presence of inherited spallation-produced 10Be highly unlikely in the sampled boulders. Although muon-produced 10Be accumulates slowly (< 0.1 atom g−1 yr−1), 10Be builds up to measurable concentrations even at several meters of depth, where rock is exposed for the majority of a glacial cycle, as is the case for landscapes peripheral to the LGM ice sheets. Recent work demonstrates that moraine and erratic boulders near the LGM limit may therefore contain several thousand years' worth of muon-produced 10Be beyond the deposition age, even if the samples are plucked from rock ∼ 2–6 m below the formerly exposed surface (Briner et al., 2016; Halsted et al., 2023). Yet, it is unlikely that all boulders on these moraines, which include an abundance of large boulders (1–2 m; Fig. 4), originated from the same depth in rock. If some boulders came from above this zone (∼ 2–6 m), we would expect to see more scatter in the exposure age datasets, and if some boulders were sourced below these depths, inherited muon-produced 10Be in the corresponding samples would be negligible. However, when combined with boulders sourced from above or within this zone, the age distribution would still be skewed toward older ages (Briner et al., 2016). The morphology of the moraines, along with the uniform age distributions and lack of scatter, suggests that the exposure ages of these moraines represent the moraines' true deposition ages within uncertainties (Table 2).
Table 2Moraine ages and statistics.
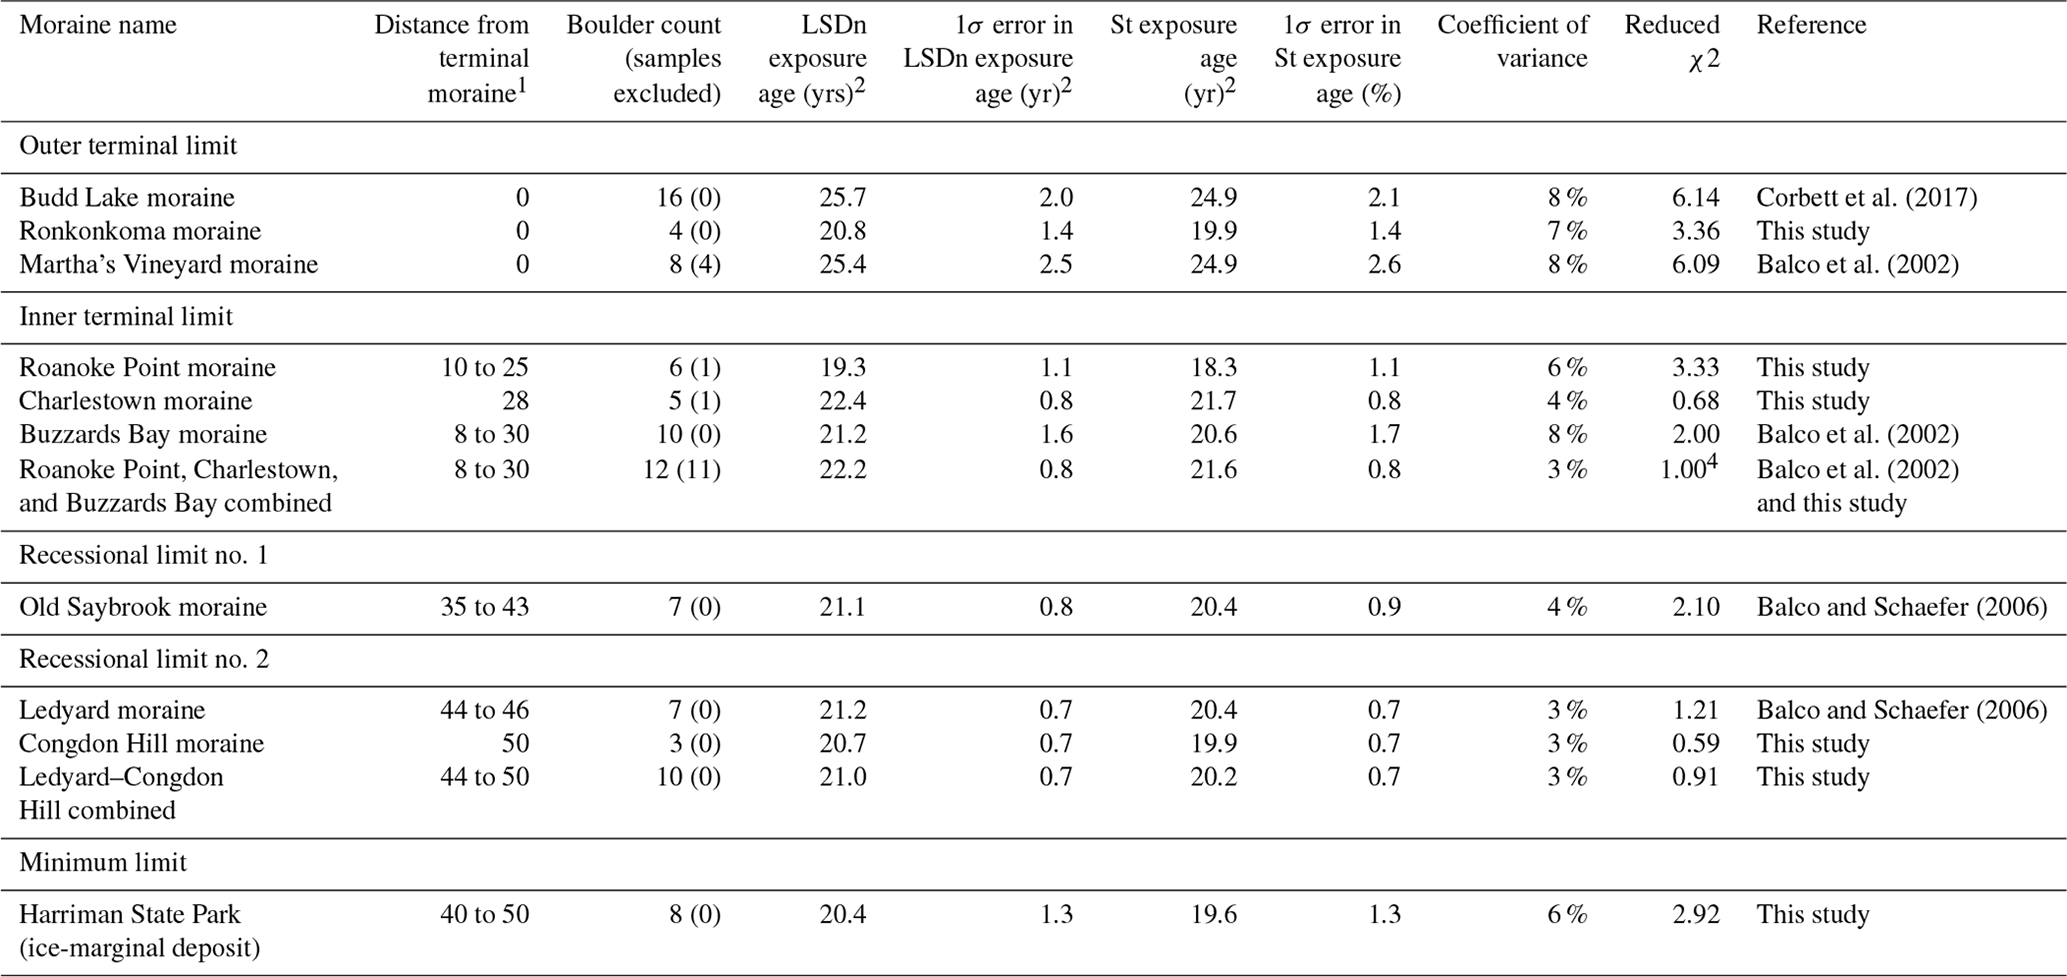
1 Measured parallel to the transect in Fig. 1.
2 All ages were calculated using the primary production rate dataset of Borchers et al. (2016). Ages calculated using the NENA production rate dataset of Balco et al. (2009) are shown in Table S3. All ages are for 10Be, except for those pertaining to the Martha's Vineyard and Buzzards Bay moraines, for which 26Al and 10Be measurements are reported and discussed in the original publication (Balco et al., 2002). Moreover, 26Al measurements are also reported for the Budd Lake moraine, but Corbett et al. (2017) do not discuss them because the 27Al concentrations may have been underestimated for at least several samples. Thus, the 26Al exposure ages are not included in the moraine age calculation here.
3 To calculate this moraine ages and statistics, we include the oldest boulder on the Roanoke Point moraine (LI-8); exclude the youngest four boulders on the Buzzards Bay moraine, including sample GB2002-BB2-29-1 (as its inclusion raises the reduced χ2 value to ∼ 40); and exclude the youngest boulder on the Charlestown moraine. Including sample GB2002-BB2-29-1 in the average does not change the rounded exposure age reported here.
4 Sample GB2002-BB2-29-1 is excluded from the average because its inclusion raises the reduced χ2 value to ∼ 40. Including this sample does not affect the rounded exposure age reported here.
The preponderance of boulders with ages that may be slightly younger than the true emplacement ages for the Ronkonkoma, Roanoke Point, and Buzzards Bay moraines is most likely explained by a small degree of postdepositional disturbance. These large end moraines have relatively flat, broad crests, which consist of a complex of moraine ridges with kettle and kame topography, indicating that the moraines were almost certainly ice-cored after the LIS abandoned these positions and underwent post-emplacement settling. In addition, agricultural disturbances or other human-induced environmental modifications may have contributed to the movement or exhumation of boulders on these moraines. Balco (2011) recognized that the Buzzards Bay 10Be and 26Al measurements, based on independent analyses that should be uncorrelated if scatter in the dataset were solely due to measurement error, were in fact correlated unless the four youngest ages were discarded, indicating the presence of geological scatter. A moderate relationship between boulder height and exposure age (r2= 0.36) suggests that sediment or snow cover is a likely source of this scatter (Balco, 2011). Discarding the four youngest ages gives an average age of 22.1 ± 0.6 ka for the Buzzard's Bay moraine. The geomorphic setting of the boulders on the Ronkonkoma and Roanoke Point moraines that were sampled indicates that postdepositional disturbance may have played a role similar to that observed for the Buzzards Bay moraine. Boulders suitable for exposure age dating were difficult to locate on the Ronkonkoma moraine as the moraine mostly comprises sandy outwash till, which may have been affected by LIS meltwater when it occupied a more northern position (Sect. 2.1.1). Samples from the Roanoke Point moraine generally came from large boulders (> 1 m) situated in local depressions and/or within the moraine crest (Sect. 2.1.1; Fig. S1), meaning they may have been subjected to hillslope processes and/or encased in stagnant ice (even after initial moraine abandonment). It is also possible that these boulders were affected by human modification of the environment. In contrast, the two oldest boulders on the Roanoke Point moraine (LI-1 (20.1 ± 1.0 ka) and LI-8 (20.9 ± 0.7 ka)), though located slightly within the moraine crest, rest on local highs, where they are likely more stable (Fig. S1).
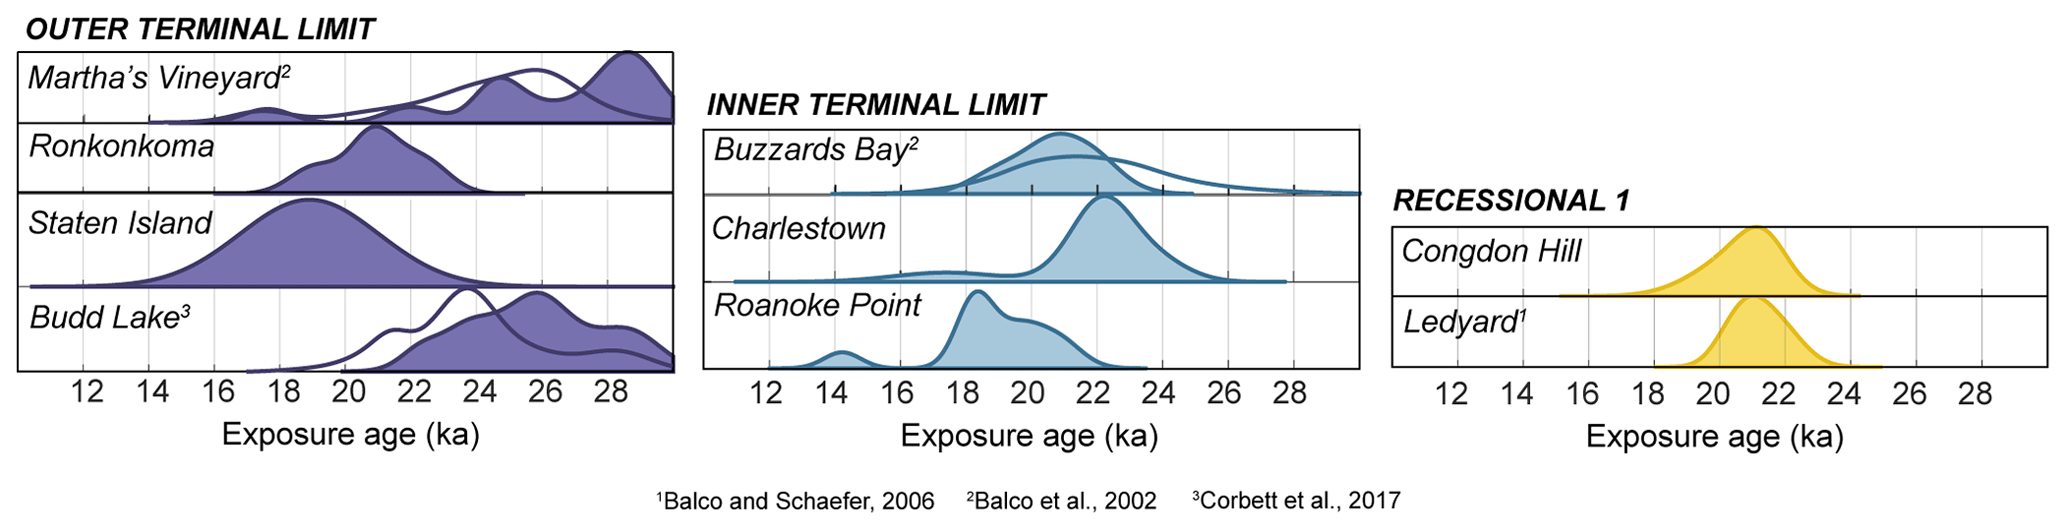
Figure 7Camel plots for moraine exposure ages, categorized by ice margin limit. Colors are the same as those in Fig. 1, and only ice margin limits with more than one moraine are shown. Filled camel plots show the probability distributions for the 10Be ages of the moraines, and unfilled camel plots show the probability distributions for the 26Al ages. Given the geomorphic context of the Ronkonkoma, Roanoke Point, and Buzzards Bay samples, averaging the exposure ages of all boulders from these moraines may slightly underestimate the true emplacement ages. On the other hand, the oldest exposure ages from the Ronkonkoma, Roanoke Point, and Buzzards Bay moraines generally overlap with the age distributions of stratigraphically equivalent or inboard moraines (Figs. 6 and 7), suggesting that the oldest ages in the main population provide a better estimate of the emplacement ages than the average ages. The wide age distribution for the Martha's Vineyard moraine, which includes younger ages (∼ 17 ka), is also consistent with the interpretation that parts of the large, hummocky end moraines are affected by postdepositional disturbance (Figs. 6 and 7; Balco et al., 2002). The Martha's Vineyard age distribution also includes older ages indicative of inheritance, which is given that the first advance of the LIS to its terminal position likely remobilized boulders that were exposed during the preceding interglacial period and prior to the expansion of the LIS to its southernmost limits.
Guided by these arguments, we present emplacement ages for the moraines deposited by the Connecticut, Narragansett Bay, and Buzzards Bay lobes of the LIS, recognizing that they were differentially affected by postdepositional disturbance and nuclide inheritance. For the Martha's Vineyard moraine, we take the average of the 10Be and 26Al ages from the main population, which yields an age of 25.4 ± 2.5 ka (Balco et al., 2002). The oldest age for the Ronkonkoma moraine (22.4 ± 0.8 ka) is probably closer to the true deposition age than the average (20.8 ± 1.4 ka), although these ages overlap within uncertainty. For the combined Roanoke Point, Charlestown, and Buzzards Bay limit, we take the average age of the Buzzards Bay boulders, excluding the four youngest ages (Balco, 2011), the oldest boulder age for the Roanoke Point moraine, and the main age population for the Charlestown moraine, which gives an age of 22.2 ± 0.8 ka for this limit (Table 2). We consider the average age of the Old Saybrook moraine to represent the moraine's true deposition age (21.1 ± 0.8 ka; Balco and Schaefer, 2006). The Ledyard (Balco and Schaefer, 2006) and Congdon Hill moraines are stratigraphically correlated, and their exposure ages agree within a given measurement uncertainty (with a reduced χ2 value of 1 for the combined population), so we combine their exposure ages to represent the true age of the limit (21.0 ± 0.8 ka; Table 2).
5.1.2 Hudson lobe
The exposure age, radiocarbon, and OSL chronologies for the LIS retreat in the Hudson Valley are generally consistent, although some conflicts remain (Figs. 2 and 3). As described in detail in previous studies, the cosmogenic exposure ages for the Budd Lake moraine (25.7 ± 2.0 ka; Corbett et al., 2017) agree within uncertainty with the maximum-limiting radiocarbon ages pertaining to Long Island and Manhattan (26.1–25.8 ka; Schuldenrein and Aiuvalasit, 2011; Sirkin and Stuckenrath, 1980), the maximum-limiting OSL ages from Jones Point, New York (25.3 ± 7.4 ka; Gorokhovich et al., 2018), and a minimum-limiting radiocarbon age of 24.2 ± 1.1 ka for a concretion of postglacial lake sediment found just south of the terminal moraine (Stanford et al., 2021). The Budd Lake moraine exposure ages also overlap with the age distribution for the Martha's Vineyard moraine (Sect. 5.1.1; Balco et al., 2002; Corbett et al., 2017). Two boulders on the Harbor Hill moraine on Staten Island, New York, show disparate ages (18.9 and 41.6 ka; Table 1), similar to the distribution of ages for Martha's Vineyard, which is affected by inheritance and postdepositional disturbance (Fig. S3). Therefore, we cannot disprove the hypothesis that the moraine on Staten Island was deposited at the same time as the Budd Lake, Ronkonkoma, and Martha's Vineyard moraines, as suggested by the stratigraphic correlation.
Exposure ages for bedrock surfaces in New York City and the lower Hudson Valley are consistently older than those of co-located boulders. Two bedrock exposure ages (25.0 ± 0.7 and 23.2 ± 0.8 ka) pertaining to Central Park, New York, are older than that of a nearby boulder (20.0 ± 0.7 ka). A single bedrock sample from the Lamont-Doherty Earth Observatory dates to 29.0 ± 1.8 ka, and three bedrock ages for Black Rock Forest (one instance of 25.0 ± 0.7 ka and two instances of ∼ 100 ± 3 ka) are significantly older than those of two boulder samples from the same location (22.1 ± 0.8 and 23.7 ± 0.8 ka; Fig. 3). Furthermore, the bedrock ages for the LDEO and Black Rock Forest are older than nearby radiocarbon ages, which suggests that the ice margin did not retreat north of the LDEO until ∼ 22.5 ka and did not retreat north of Black Rock Forest until ∼ 20–19 ka (Stanford et al., 2021). The fact that bedrock exposure ages significantly predate nearby boulder and radiocarbon ages indicates cosmogenic-nuclide inheritance, implying that erosion beneath the LIS at these sampling locations was not extensive enough to reduce 10Be to background levels in bedrock, possibly due to thin and slow-flowing ice, short ice-cover durations, or both. The three erratic boulder ages pertaining to our Hudson Valley transect do not exhibit a clear trend with regard to distance from the terminal moraine. For example, the age for Central Park (20.0 ka) is significantly younger than the two ages for Black Rock Forest (22.1 and 23.7 ka), located ∼ 80 km to the north. Given the presence of inheritance in the bedrock ages and the lack of a spatial trend in the boulder ages in the Hudson Valley, we exclude these ages from further discussion here and suggest the additional collection of bedrock and boulder samples in this region as a potential direction for future work.
The average age of the ice-marginal deposit in Harriman State Park (20.4 ± 1.3 ka; Figs. 3 and 6) is consistent with the minimum-limiting age of the varve sequence for Haverstraw, New York (18.9 ka; Ridge et al., 2012), which is situated at a similar distance from the terminal moraine, and is older than the youngest boulder age of a former nunatak on Peekamoose Mountain (18.6 ka), located ∼ 80 km to the north (Halsted et al., 2022). Finally, the average 10Be age of the Harriman State Park boulders, at 20.4 ± 1.3 ka, is slightly younger than the Ledyard moraine exposure age (21.2 ± 0.7 ka), although the ages overlap within 1σ uncertainty, supporting the correlation of the limits of the Augusta and Sussex moraines, located in northern New Jersey, with the Connecticut moraines (Sect. 1.1.1; Stone et al., 2005). This interpretation, however, remains in disagreement with recent work that suggests that all three moraines in northern New Jersey date to ∼ 23.5 ka and that the Connecticut moraines may instead correlate with the Pellets Island and New Hampton moraines, located to the north (Fig. 1; Stanford et al., 2021). Nevertheless, the age of the Harriman State Park ice-marginal deposit agrees with the majority of bulk radiocarbon ages pertaining to northern New Jersey, as summarized by Stanford et al. (2021; Fig. 2).
5.1.3 Summary of the regional deglaciation chronology
To summarize the exposure age chronology, the southeastern LIS occupied the terminal complex from ∼ 26 to 22 ka, with the outermost moraine ridges dating to 25.4 ± 2.5 ka in Martha's Vineyard (Balco et al., 2002) and 25.7 ± 2.0 ka at Budd Lake, New Jersey (Corbett et al., 2017). The inner terminal limit at Roanoke Point, Charlestown, and Buzzards Bay, located 10–30 km north of the outer terminal ridge, dates to 22.2 ± 0.8 ka. The fact that the innermost portion of the terminal complex is nearly 4 kyr younger than the outermost ridges could reflect the slow, secular retreat of the ice margin during this period. Alternatively, the positions of the moraines may reflect fluctuations in the ice margin that occurred during the LGM, with the culmination of readvances occurring within the terminal-moraine belt. We prefer the latter interpretation, given that the geomorphology and sedimentology of these moraines indicate that they were formed by an advancing LIS, and note that it is unknown how far ice retreated between the readvances (Boothroyd et al., 1998; Oldale and O'Hara, 1984; Sects. 1.1.1 and 2.2.1).
Irreversible deglaciation began with the abandonment of the inner terminal moraine at ∼ 22 ka, after which the ice margin did not reoccupy the terminal complex. Ice margin positions in southern Connecticut and Rhode Island are marked by smaller, discontinuous, boulder-rich moraines, interpreted as recessional limits deposited during brief readvances or standstills (Stone et al., 2005). The Old Saybrook moraine, located ∼ 40 km within the outer terminal limit, dates to 21.1 ± 0.8 ka (Balco and Schaefer, 2006), and the Ledyard–Congdon Hill limit, about 45–50 km north of the outer terminal ridge, dates to 21.0 ± 0.8 ka. The ice-marginal deposit in Harriman State Park, which is morphostratigraphically positioned within the Ledyard–Congdon Hill limit, dates to 20.4 ± 1.3 ka. Therefore, the exposure age chronology presented here covers ∼ 25.5–20.5 ka. The LIS then retreated to the spillway for Lake Hitchcock (Rocky Hill, Connecticut), about ∼ 90–100 km north of the outer terminal moraine, by ∼ 18.2 ka (Ridge et al., 2012). A lack of extensive end moraine deposits between the Ledyard–Congdon Hill limit and Rocky Hill, Connecticut, signals a shift to more continuous retreat north of our study area.
The positions of the moraines represent net changes in LIS extent, from which we estimate average retreat rates, calculated by dividing the maximum and minimum distances between moraine ridges, measured parallel to the transect shown in Fig. 1, by the difference in age established for each limit (Table 2; Fig. 8). Although these rates represent the overall northward movement of the ice margin position (i.e., retreat), they integrate periods of retreat, advance, and minimal change as the moraines themselves were formed during readvances or standstills. In this context, the terminal-moraine belt reflects several ice margin fluctuations, with the rate of change in ice margin position from the outer terminal limit to the inner terminal limit averaging < 5–10 m yr−1. Ice then retreated from the inner terminal position to the Ledyard–Congdon Hill limit at an average rate of ∼ 10–20 m yr−1. Further retreat through southern Connecticut and Rhode Island was interrupted by several standstills or readvances, during which additional recessional moraines, including the Old Saybrook moraine, were deposited. After abandoning the Old Saybrook moraine, the LIS withdrew to Rocky Hill, Connecticut, at an average rate of ∼ 15–25 m yr−1 (Ridge et al., 2012). North of our study area, the NAVC reveals moderate retreat rates of ∼ 30–100 m yr−1 during Heinrich Stadial 1 (HS1; ∼ 18–15 ka), with an abrupt increase in retreat rate to > 300 m yr−1 at the onset of the Bølling–Allerød interstadial around 15 ka (Fig. 8; Ridge et al., 2012). A prominent set of moraines along coastal Maine also may suggest slow but steady net retreat during the latter part of Heinrich Stadial 1 (Borns et al., 2004; Kaplan, 1999; Hall et al., 2017). Similar retreat rates (100–300 m yr−1) are indicated by De Geer moraines, which are thought to mark the annual retreat of the ice margin in southern New Hampshire, Maine, and Atlantic Canada around 15 ka (Sinclair et al., 2018; Todd et al., 2007; Wrobleski, 2020). Cosmogenic exposure ages from former nunataks, which serve as “dipsticks” for LIS thickness, also show moderate thinning through HS1, followed by rapid LIS thinning at the onset of the Bølling–Allerød interstadial (Halsted et al., 2022).
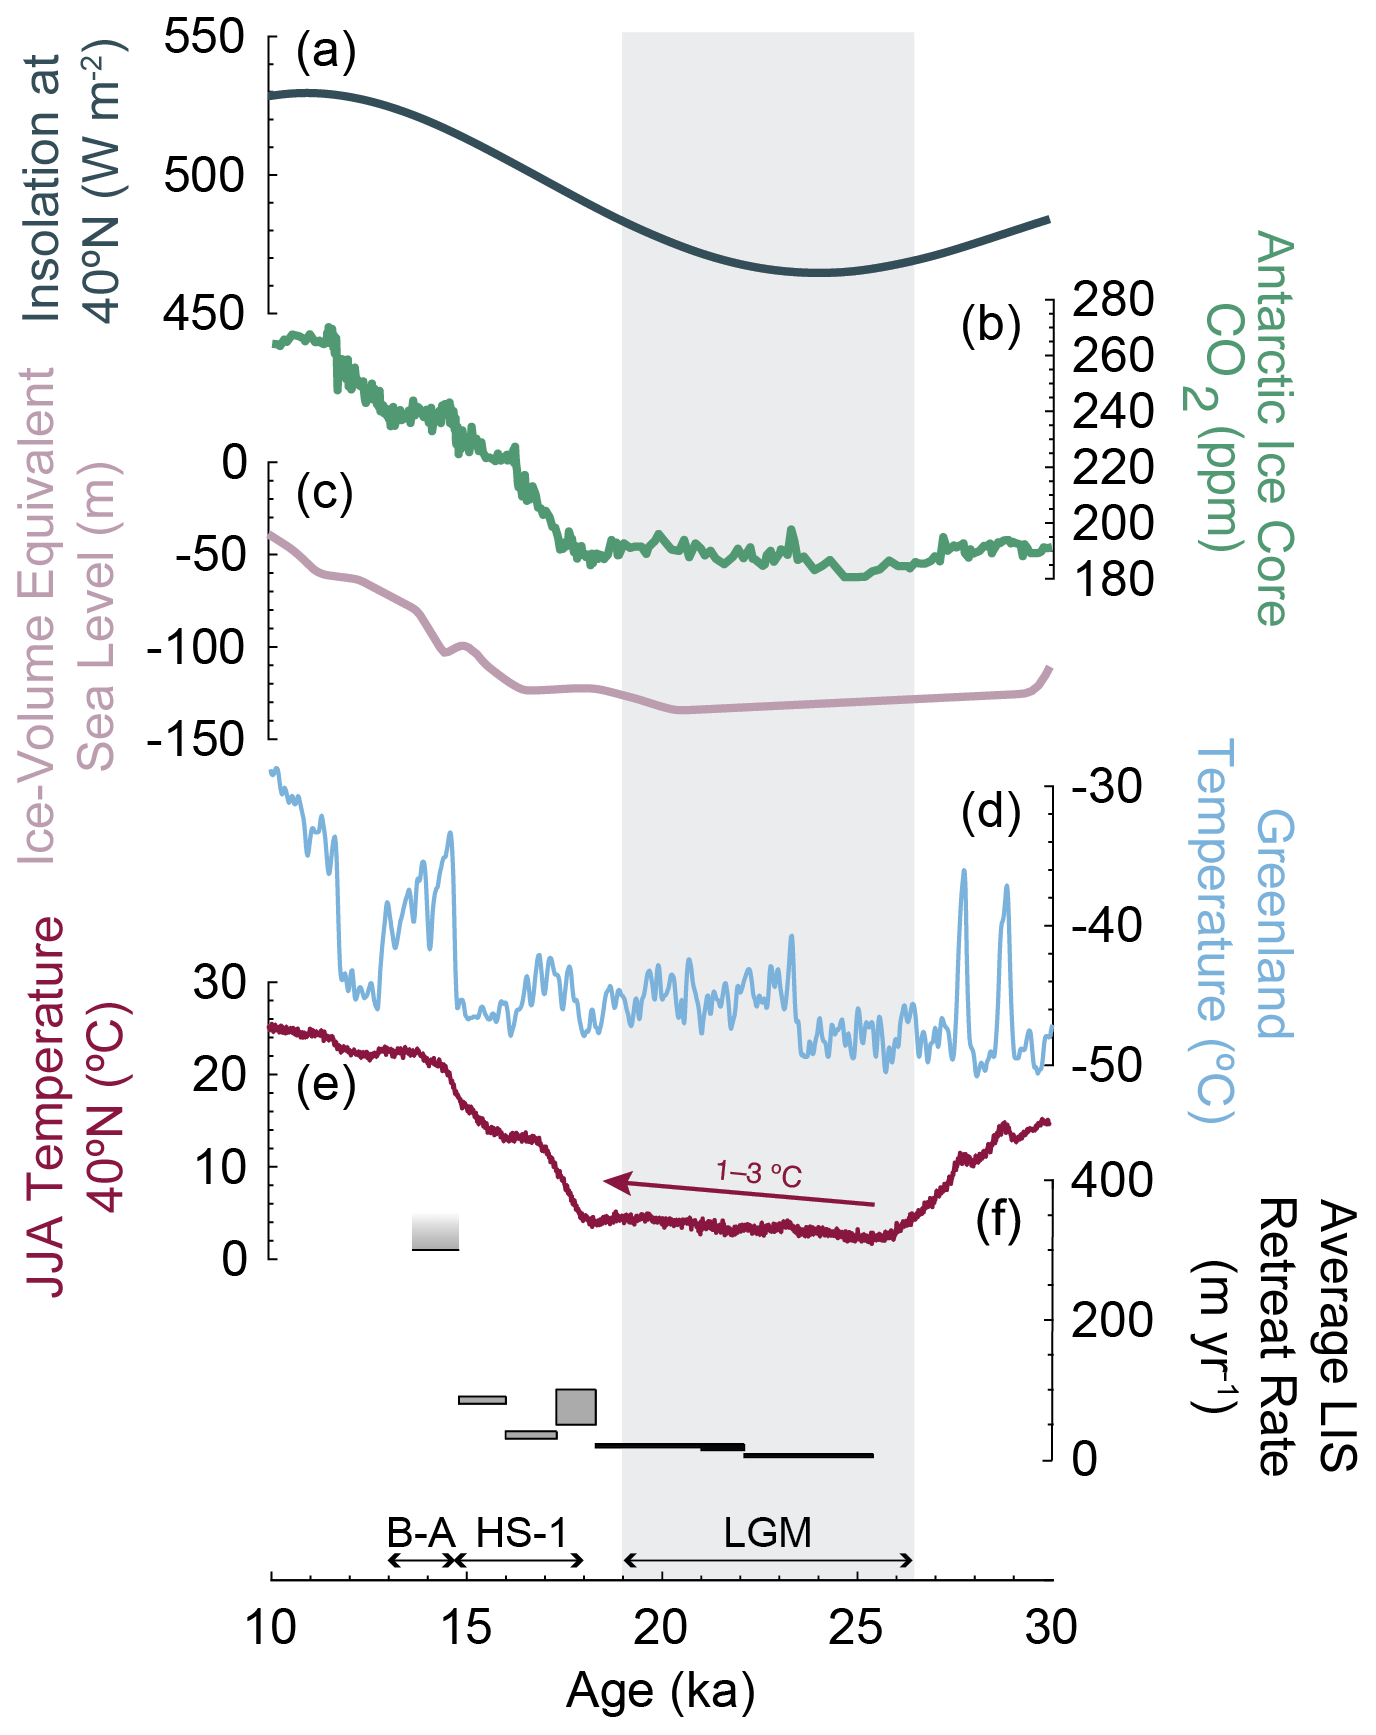
Figure 8LIS ice margin chronology and average retreat rates compared to other climate parameters and records. (a) Insolation on 21 June at 40° N (Laskar et al., 2004). (b) Compilation of atmospheric CO2 measurements from Antarctic ice cores (Bereiter et al., 2015; Monnin et al., 2001, 2004; Marcott et al., 2014; Ahn et al., 2014). (c) Global ice-volume-equivalent sea level (Lambeck et al., 2014). (d) Mean annual temperature reconstruction for Greenland based on ∂15N–N2 from the North Greenland Ice Core Project (NGRIP) ice core (Kindler et al., 2014). (e) Time series of summer (June, July, and August; JJA) surface temperatures, modeled using the HadCM3B-M2.1 coupled general circulation model, which incorporates Dansgaard–Oeschger and Heinrich events (Armstrong et al., 2019). The time series shown here is for 40° N, 75.5° W, approximately 50 km south of the LGM limit, which corresponds to a part of northern New Jersey that was not covered by ice during the LGM. (f) Average LIS retreat rates. Rates shown in black are from this study, and those shown in gray are from Ridge et al. (2012), with the faded-gray bar indicating a minimum retreat rate of 300 m yr−1. The range of average retreat rates is calculated by dividing the maximum and minimum distances between moraine ridges, measured parallel to the transect shown in Fig. 1, by the difference in age established for each limit (Table 2). The vertical gray bar in the background denotes the LGM timing from 26.5–19 ka (Clark et al., 2009). Heinrich Stadial 1 (HS1; ∼ 18–15 ka) and the Bølling–Allerød (B–A) interstadial (∼ 15–13 ka) are periods of abrupt climate change discussed in the text.
The regional moraine chronology is remarkably consistent with the varve chronologies, the OSL ages, and many of the radiocarbon ages found throughout the region, as discussed above (Fig. 5). Yet, the absence of radiocarbon ages of plant macrofossils between ∼ 26 and 16 ka remains unresolved (Peteet et al., 2012; Figs. 2, 3, and 5). This absence could potentially be explained by (i) the poor preservation of macrofossils from this time period; (ii) landscape instability and/or sparse vegetation in the study area during the LGM and early deglaciation; (iii) a delay in widespread organic-sediment deposition (only resolved once beaver colonies expanded into the region), damming lakes, and wetlands (Kaye, 1962); (iv) the predominance of seepage ponds in permeable sand and other coarse ice-proximal deposits on end moraines that are susceptible to periodic drainage; (v) difficulties with respect to coring down to the till contact and/or stratigraphic disturbance in lake sediment affected by postglacial permafrost (Prince et al., 2024); and/or (vi) persistent lake ice during HS1 (∼ 18–15 ka) springs or summers that precluded organic lake sedimentation. Further discussion of the ∼ 10 kyr gap between the moraine emplacement age indicated by the exposure age chronology and the widespread occurrence of radiocarbon-dated organic material dating to 16 ka is beyond the scope of this paper.
5.2 Climatic context for the initial LIS retreat
The exposure-age-derived moraine chronology suggests that the LIS occupied the terminal-moraine complex between ∼ 26 and 22 ka and remained within 50 km of its southernmost position until ∼ 21 ka (Balco et al., 2002; Balco and Schaefer, 2006; Corbett et al., 2017). The moraines discussed here therefore span the canonical LGM and global sea-level lowstand (26.5–19.0 ka; Lambeck et al., 2014; Clark et al., 2009) and coincide with a local insolation minimum at ∼ 24 ka (Fig. 8; Laskar et al., 2004). Furthermore, the timing of terminal-moraine occupation from ∼ 26 to 22 ka is similar to that of other LIS sectors to the west and other ice sheets fringing the North Atlantic (Balco et al., 2002; Corbett et al., 2017; Sect. 5.1.3). For example, exposure and radiocarbon ages indicate that the glacial maximum had occurred in Wisconsin and Illinois by ∼ 24–23 ka (Ullman et al., 2015; Currey and Petras, 2011), and a minimum-limiting radiocarbon age for the terminal moraine of the Miami–Scioto lobe in Indiana and Ohio indicates that retreat began sometime before 22.4 ka (Glover et al., 2011). Parts of the British–Irish Ice Sheet began to retreat by ∼ 30–26 ka (Clark et al., 2022) and the Scandinavian Ice Sheet across Andøya, Norway, fluctuated near its maximum extent from ∼ 26–22 ka (Vorren et al., 2015). Retreat from the terminal-moraine complex at ∼ 22 ka is consistent with ice sheet mass balance modeling, which indicates that the moderate increase in local summer insolation from ∼ 24 ka may have driven initial LIS margin retreat from its southernmost position (Ullman et al., 2015). We emphasize, however, that the ∼ 50 km of net change in ice margin position from the outer terminal moraine to the Ledyard–Congdon Hill limit is modest in the context of the entire ice sheet. This distance represents < 2 % of the total LIS margin change, given that the former LIS is now restricted to the Barnes and Penny ice caps on the central Baffin plateau, located ∼ 3000 km to the north (Dalton et al., 2020; Dyke, 2004; Hooke, 1976; Hooke and Clausen, 1982; Refsnider et al., 2014), and likely represents significantly less when expressed volumetrically since the LIS would have been thinner at its margin than nearer the center of the ice sheet (e.g., Stokes et al., 2012).
The chronology supports the hypothesis that initial LIS retreat, while slow (< 5–25 m yr−1; Sect. 5.1.3), began when cold mean annual temperatures persisted in the Arctic (Kindler et al., 2014) and atmospheric CO2 concentrations remained at glacial values (Fig. 8; Denton et al., 2010; Marcott et al., 2014; Raymo, 1997; Ullman et al., 2015; Fig. 8). Yet, insight into local summer conditions may provide additional context for the relatively modest LIS retreat during the LGM. Ridge et al. (2012) established a strong relationship, especially for the period after ∼ 15 ka, between LIS retreat rates; the Greenland temperature record; and local summer conditions recorded by varve thickness, which is largely controlled by LIS meltwater production. In the absence of varve thickness as a proxy for summer climate conditions prior to ∼ 18 ka, we use output from a recent model reconstruction of Northern Hemisphere land surface air temperatures over the last 60 kyr to estimate changes in summer temperature coincident with the moraine chronology discussed here (Fig. 8; Armstrong et al., 2019). Modeled terrestrial summer temperature at 40° N, 75.5° W – i.e., ∼ 50 km south of the LGM limit in northern New Jersey – exhibits a slow but steady increase of ∼ 1–3 °C from 26–19 ka, followed by a sharp rise beginning at ∼ 18 ka (Fig. 8; Armstrong et al., 2019). The pattern of modeled summer temperature change bears a striking resemblance to the slow net LIS retreat (< 5–25 m yr−1) from ∼ 26–21 ka, as indicated by the moraine record, and the acceleration of ice margin retreat after ∼ 18 ka (from 30 to 300 m yr−1), as observed in the NAVC (Ridge et al., 2012). We therefore suggest that the relationship between LIS behavior, including relative ice margin positions, and summer conditions observed by Ridge et al. (2012) extends to the LGM. Altogether, the moraine record for southern New England and New York reflects LIS fluctuations and modest retreat that occurred throughout the LGM, consistent with a slight increase in modeled summer temperature during said interval, with deglaciation accelerating after 18 ka alongside the rise in atmospheric CO2 and the onset of Termination I.
-
The exposure age chronology for southern New England and New York agrees with established regional stratigraphic relationships and independent age constraints from radiocarbon and glacial lake varves.
-
The few inconsistencies in the regional exposure age dataset can be explained by systematic geological scatter, where (i) bedrock samples are affected by nuclide inheritance, (ii) the outermost LGM moraine exhibits inheritance on some boulders, and (iii) some exposure ages of large, unconsolidated landforms that may have experienced extended permafrost conditions are affected by postdepositional disturbance, while those of more stable landforms are not. Also, we cannot rule out that the boulders with the youngest exposure ages may have been affected by agricultural practices and other human activities.
-
Considering the impact of this geological scatter, we conclude that the LIS occupied the terminal complex from ∼ 26 to ∼ 22 ka (Balco, 2011; Balco et al., 2002). We date several inboard moraines and other recessional deposits to ∼ 21–20.5 ka (Balco and Schaefer, 2006).
-
The moraine chronology for the southeastern LIS covers ∼ 26–21 ka, which is consistent with the canonical LGM and sea-level lowstand, as well as full glacial conditions in Greenland, and broadly coincides with a minimum in local summer insolation.
-
Average LIS retreat rates from ∼ 26–18 ka (< 5 to 25 m yr−1) are consistent with a slight warming (1–3 °C) in modeled local summer temperature throughout the LGM but are slower than rates observed at any point during Termination I (> 30 to > 300 m yr−1; Ridge et al., 2012). However, this does not account for any distance covered by readvances or stillstands, if significant. Hence, we conclude that the major pulse of deglaciation and marked recession did not begin until after ∼ 18 ka, when a dramatic rise in atmospheric CO2 signaled the onset of Termination I.
All analytical information associated with new cosmogenic-nuclide measurements is available in the tables and Supplement. Analytical information, along with additional sample documentation and photographs, is available in the ICE-D Laurentide online database (https://version2.ice-d.org/laurentide/publication/1187/; Balco, 2024).
The supplement related to this article is available online at: https://doi.org/10.5194/cp-20-2167-2024-supplement.
JMS, GB, MAK, and MRK conceptualized the project. JMS, GB, MAK, MRK, RS, BO, JH, NEY, and ABK contributed to the fieldwork. RS, GB, MAK, MRK, and JH performed the lab work. ABK, GB, and AMVC curated the external datasets. ABK led the data analysis and visualization and prepared the original draft of the paper. All authors reviewed and edited the paper.
The contact author has declared that none of the authors has any competing interests.
Publisher’s note: Copernicus Publications remains neutral with regard to jurisdictional claims made in the text, published maps, institutional affiliations, or any other geographical representation in this paper. While Copernicus Publications makes every effort to include appropriate place names, the final responsibility lies with the authors.
We thank the many people who supported this work in the lab and field, including Sidney Hemming, as well as Mikah McCabe and Rebecca Steinberg, who helped collect and process samples as interns in the Lamont Summer Intern Program. We are immensely grateful to the late Jon Boothroyd of the University of Rhode Island and the late Gil Hanson of Stony Brook University for sharing their expertise in regional stratigraphy and geomorphology.
This work was supported in part by the National Science Foundation Graduate Research Fellowship Program (grant no. DGE 2036197), awarded to Allie Balter-Kennedy. Joerg Schaefer received support from the G. Unger Vetlesen Foundation and the LDEO Climate Center.
This paper was edited by Alberto Reyes and reviewed by Christopher Halsted and Alberto Reyes.
Ahn, J. and Brook, E. J.: Siple Dome ice reveals two modes of millennial CO2 change during the last ice age, Nat. Commun., 5, 3723, https://doi.org/10.1038/ncomms4723, 2014.
Andersen, K. K., Svensson, A., Johnsen, S. J., Rasmussen, S. O., Bigler, M., Röthlisberger, R., Ruth, U., Siggaard-Andersen, M.-L., Steffensen, J. P., Dahl-Jensen, D., Vinther, B. M., and Clausen, H. B.: The Greenland Ice Core Chronology 2005, 15–42 ka. Part 1: constructing the time scale, Quaternary Sci. Rev., 25, 3246–3257, https://doi.org/10.1016/j.quascirev.2006.08.002, 2006.
Antevs, E.: The recession of the last ice sheet in New England, American Geographical Society Research Series 11 (with a preface and contributions by Goldthwait, J. W.), 120, https://doi.org/10.5962/bhl.title.61917, 1922.
Antevs, E.: The last glaciation, with special reference to the ice sheet in northeastern North America, American Geographical Society Research Series, 292, 1928.
Applegate, P. J., Urban, N. M., Laabs, B. J. C., Keller, K., and Alley, R. B.: Modeling the statistical distributions of cosmogenic exposure dates from moraines, Geosci. Model Dev., 3, 293–307, https://doi.org/10.5194/gmd-3-293-2010, 2010.
Armstrong, E., Hopcroft, P. O., and Valdes, P. J.: A simulated Northern Hemisphere terrestrial climate dataset for the past 60,000 years, Sci. Data, 6, 265, https://doi.org/10.1038/s41597-019-0277-1, 2019.
Balco, G.: Contributions and unrealized potential contributions of cosmogenic-nuclide exposure dating to glacier chronology, 1990–2010, Quaternary Sci. Rev., 30, 3–27, https://doi.org/10.1016/j.quascirev.2010.11.003, 2011.
Balco, G.: Production rate calculations for cosmic-ray-muon-produced 10Be and 26Al benchmarked against geological calibration data, Quat. Geochronol., 39, 150–173, https://doi.org/10.1016/j.quageo.2017.02.001, 2017.
Balco, G.: ICE-D:LAURENTIDE, ICE-D [data set], https://version2.ice-d.org/laurentide/publication/1187/, last access: 11 July 2024.
Balco, G. and Schaefer, J. M.: Cosmogenic-nuclide and varve chronologies for the deglaciation of southern New England, Quat. Geochronol., 1, 15–28, https://doi.org/10.1016/j.quageo.2006.06.014, 2006.
Balco, G., Stone, J. O. H., Porter, S. C., and Caffee, M. W.: Cosmogenic-nuclide ages for New England coastal moraines, Martha's Vineyard and Cape Cod, Massachusetts, USA, Quaternary Sci. Rev., 21, 2127–2135, https://doi.org/10.1016/s0277-3791(02)00085-9, 2002.
Balco, G., Stone, J. O., Lifton, N. A., and Dunai, T. J.: A complete and easily accessible means of calculating surface exposure ages or erosion rates from 10Be and 26Al measurements, Quat. Geochronol., 3, 174–195, https://doi.org/10.1016/j.quageo.2007.12.001, 2008.
Balco, G., Briner, J., Finkel, R. C., Rayburn, J. A., Ridge, J. C., and Schaefer, J. M.: Regional beryllium-10 production rate calibration for late-glacial northeastern North America, Quat. Geochronol., 4, 93–107, https://doi.org/10.1016/j.quageo.2008.09.001, 2009.
Balco, G., DeJong, B. D., Ridge, J. C., Bierman, P. R., and Rood, D. H.: Atmospherically produced beryllium-10 in annually laminated late-glacial sediments of the North American Varve Chronology, Geochronology, 3, 1–33, https://doi.org/10.5194/gchron-3-1-2021, 2021.
Barker, S. and Knorr, G.: Millennial scale feedbacks determine the shape and rapidity of glacial termination, Nat. Commun., 12, 2273, https://doi.org/10.1038/s41467-021-22388-6, 2021.
Barker, S., Diz, P., Vautravers, M. J., Pike, J., Knorr, G., Hall, I. R., and Broecker, W. S.: Interhemispheric Atlantic seesaw response during the last deglaciation, Nature, 457, 1097–1102, https://doi.org/10.1038/nature07770, 2009.
Bereiter, B., Eggleston, S., Schmitt, J., Nehrbass-Ahles, C., Stocker, T. F., Fischer, H., Kipfstuhl, S., and Chappellaz, J.: Revision of the EPICA Dome C CO2 record from 800 to 600 kyr before present, Geophys. Res. Lett., 42, 542–549, https://doi.org/10.1002/2014gl061957, 2015.
Boothroyd, J. C. and Sirkin, L.: The Quaternary geology of Block Island and adjacent regions, in: The Ecology of Block Island: Proceedings of the Rhode Island Natural History Survey Conference, October 28, 2000, edited by: Paton, P., Gould, L. I., August, P. V., and Frost, A. O., Rhode Island, Kingston, Rhode Island Natural History Survey, 13–27, 2002.
Boothroyd, J. C., Freedman, J. H., Brenner, H. B., and Stone, J. R: The Glacial Geology of Southern and Central Rhode Island, in: Guidebook to Field Trips in Rhode Island and Adjacent Regions of Connecticut and Massachusetts, edited by: Murray, D. P., New England Intercollegiate Geological Conference: 90th Annual Meeting, Kingston, Rhode Island, 9–11 October 1998, 1998.
Boothroyd, J. C., McCandless, S. J., and Dowling, M. J.: Quaternary Geologic Map of Rhode Island: Rhode Island Geological Survey STATEMAP Program, scale scale: , http://geothermal.isgs.illinois.edu/aasggeothermal/rigs/map/RI_Quaternary_Geology_100K.zip (last access: 11 July 2024), 2003.
Borchers, B., Marrero, S., Balco, G., Caffee, M., Goehring, B., Lifton, N., Nishiizumi, K., Phillips, F., Schaefer, J., and Stone, J.: Geological calibration of spallation production rates in the CRONUS-Earth project, Quat. Geochronol., 31, 188–198, https://doi.org/10.1016/j.quageo.2015.01.009, 2016.
Borns, H. W., Doner, L. A., Dorion, C. C., Jacobson, G. L., Kaplan, M. R., Kreutz, K. J., Lowell, T. V., Thompson, W. B., and Weddle, T. K.: The deglaciation of Maine, U.S.A., Dev. Quat. Sci., 2, 89–109, https://doi.org/10.1016/s1571-0866(04)80190-8, 2004.
Briner, J. P., Miller, G. H., Davis, P. T., and Finkel, R. C.: Cosmogenic radionuclides from fiord landscapes support differential erosion by overriding ice sheets, GSA Bull., 118, 406–420, https://doi.org/10.1130/b25716.1, 2006.
Briner, J. P., Goehring, B. M., Mangerud, J., and Svendsen, J. I.: The deep accumulation of 10Be at Utsira, southwestern Norway: Implications for cosmogenic nuclide exposure dating in peripheral ice sheet landscapes, Geophys. Res. Lett., 43, 9121–9129, https://doi.org/10.1002/2016gl070100, 2016.
Brock, P. C. and Brock, P. W. G.: Bedrock Geology of New York City: More than 600 m.y. of geologic history, in: Field Guide for Long Island Geologists Field Trip, 27 October 2001, 2001.
Broecker, W. S. and van Donk, J.: Insolation changes, ice volumes, and the O18 record in deep-sea cores, Rev. Geophys., 8, 169–198, https://doi.org/10.1029/rg008i001p00169, 1970.
Bromley, G. R. M., Hall, B. L., Thompson, W. B., Kaplan, M. R., Garcia, J. L., and Schaefer, J. M.: Late glacial fluctuations of the Laurentide Ice Sheet in the White Mountains of Maine and New Hampshire, U.S.A., Quat. Res., 83, 522–530, https://doi.org/10.1016/j.yqres.2015.02.004, 2015.
Bromley, G. R. M., Hall, B. L., Thompson, W. B., and Lowell, T. V.: Age of the Berlin moraine complex, New Hampshire, USA, and implications for ice sheet dynamics and climate during Termination 1, Quaternary Res., 94, 80–93, https://doi.org/10.1017/qua.2019.66, 2020.
Buizert, C., Gkinis, V., Severinghaus, J. P., He, F., Lecavalier, B. S., Kindler, P., Leuenberger, M., Carlson, A. E., Vinther, B., Masson-Delmotte, V., White, J. W. C., Liu, Z., Otto-Bliesner, B., and Brook, E. J.: Greenland temperature response to climate forcing during the last deglaciation, Science, 345, 1177–1180, https://doi.org/10.1126/science.1254961, 2014.
Cadwell, D. H.: Surficial Geologic Map of New York: Lower Hudson Sheet. New York State Museum Map and Chart Series, The University of the State of New York, Albany, NY, https://www.nysm.nysed.gov/sites/default/files/surf_lowerhudson.jpg (last access: 11 July 2024), 1989.
Clark, P. U., Licciardi, J. M., MacAyeal, D. R., and Jenson, J. W.: Numerical reconstruction of a soft-bedded Laurentide Ice Sheet during the last glacial maximum, Geology, 24, 679–682, 1996.
Clark, P. U., Marshall, S. J., Clarke, G. K. C., Hostetler, S. W., Licciardi, J. M., and Teller, J. T.: Freshwater Forcing of Abrupt Climate Change During the Last Glaciation, Science, 293, 283–287, https://doi.org/10.1126/science.1062517, 2001.
Clark, P. U., Dyke, A. S., Shakun, J. D., Carlson, A. E., Clark, J., Wohlfarth, B., Mitrovica, J. X., Hostetler, S. W., and McCabe, A. M.: The Last Glacial Maximum, Science, 325, 710–714, https://doi.org/10.1126/science.1172873, 2009.
Collins, G.: The Very Cold Case of the Glacier, The New York Times, https://www.nytimes.com/2005/09/14/nyregion/the-very-cold-case-of-the-glacier.html (last access: 11 July 2024), 2005.
Corbett, L. B., Bierman, P. R., Stone, B. D., Caffee, M. W., and Larsen, P. L.: Cosmogenic nuclide age estimate for Laurentide Ice Sheet recession from the terminal moraine, New Jersey, USA, and constraints on latest Pleistocene ice sheet history, Quaternary Res., 87, 482–498, https://doi.org/10.1017/qua.2017.11, 2017.
Cuffey, K. M., Clow, G. D., Steig, E. J., Buizert, C., Fudge, T. J., Koutnik, M., Waddington, E. D., Alley, R. B., and Severinghaus, J. P.: Deglacial temperature history of West Antarctica, P. Natl. Acad. Sci. USA, 113, 14249–14254, https://doi.org/10.1073/pnas.1609132113, 2016.
Curry, B. and Petras, J.: Chronological framework for the deglaciation of the Lake Michigan lobe of the Laurentide Ice Sheet from ice-walled lake deposits, J. Quaternary Sci., 26, 402–410, https://doi.org/10.1002/jqs.1466, 2011.
Dalton, A. S., Margold, M., Stokes, C. R., Tarasov, L., Dyke, A. S., Adams, R. S., Allard, S., Arends, H. E., Atkinson, N., Attig, J. W., Barnett, P. J., Barnett, R. L., Batterson, M., Bernatchez, P., Borns, H. W., Breckenridge, A., Briner, J. P., Brouard, E., Campbell, J. E., Carlson, A. E., Clague, J. J., Curry, B. B., Daigneault, R.-A., Dubé-Loubert, H., Easterbrook, D. J., Franzi, D. A., Friedrich, H. G., Funder, S., Gauthier, M. S., Gowan, A. S., Harris, K. L., Hétu, B., Hooyer, T. S., Jennings, C. E., Johnson, M. D., Kehew, A. E., Kelley, S. E., Kerr, D., King, E. L., Kjeldsen, K. K., Knaeble, A. R., Lajeunesse, P., Lakeman, T. R., Lamothe, M., Larson, P., Lavoie, M., Loope, H. M., Lowell, T. V., Lusardi, B. A., Manz, L., McMartin, I., Nixon, F. C., Occhietti, S., Parkhill, M. A., Piper, D. J. W., Pronk, A. G., Richard, P. J. H., Ridge, J. C., Ross, M., Roy, M., Seaman, A., Shaw, J., Stea, R. R., Teller, J. T., Thompson, W. B., Thorleifson, L. H., Utting, D. J., Veillette, J. J., Ward, B. C., Weddle, T. K., and Wright, H. E.: An updated radiocarbon-based ice margin chronology for the last deglaciation of the North American Ice Sheet Complex, Quaternary Sci. Rev., 234, 106223, https://doi.org/10.1016/j.quascirev.2020.106223, 2020.
Davis, M. B., Spear, R. W., and Shane, L. C. K.: Holocene climate of New England, Quaternary Res., 14, 240–250, https://doi.org/10.1016/0033-5894(80)90051-4, 1980.
Davis, P. T., Bierman, P. R., Corbett, L. B., and Finkel, R. C.: Cosmogenic exposure age evidence for rapid Laurentide deglaciation of the Katahdin area, west-central Maine, USA, 16 to 15 ka, Quaternary Sci. Rev., 116, 95–105, https://doi.org/10.1016/j.quascirev.2015.03.021, 2015.
Deevey, E. S.: Radiocarbon-dated pollen sequences in eastern North America, Veroffentilichungen des Geobotanischen Institutes Rubel in Zurich, 34, 30–37, 1958.
Denton, G. H. and Hughes, T. J.: The Last Great Ice Sheets, Wiley-Interscience, New York, 464 pp., ISBN 978-0471060062, 1981.
Denton, G. H., Anderson, R. F., Toggweiler, J. R., Edwards, R. L., Schaefer, J. M., and Putnam, A. E.: The Last Glacial Termination, Science, 328, 1652–1656, https://doi.org/10.1126/science.1184119, 2010.
Dorion, C. C., Balco, G. A., Kaplan, M. R., Kreutz, K. J., Wright, Ames D., Wright, J. D., and Borns, H. W.: Stratigraphy, paleoceanography, chronology, and environment during deglaciation of eastern Maine, in: Special papers Geological Society of America, vol. 351, edited by: Weddle, T. K. and Retelle, M. J., 215, https://doi.org/10.1130/0-8137-2351-5.215, 2001.
Drebber, J. S., Halsted, C. T., Corbett, L. B., Bierman, P. R., and Caffee, M. W.: In Situ Cosmogenic 10Be Dating of Laurentide Ice Sheet Retreat from Central New England, USA, Geosciences, 13, 213, https://doi.org/10.3390/geosciences13070213, 2023.
Dyke, A. S.: An outline of North American deglaciation with emphasis on central and northern Canada, Dev. Quat. Sci., 2, 373–424, https://doi.org/10.1016/s1571-0866(04)80209-4, 2004.
Frankel, L. and Thomas, H. F.: Evidence of freshwater lake deposits in Block Island Sound, J. Geol., 74, 240–242, 1966.
Fuller, M. L.: The Geology of Long Island New York, US Geological Survey, USGS Professional Paper 82, https://doi.org/10.3133/pp82, 1914.
Glover, K. C., Lowell, T. V., Wiles, G. C., Pair, D., Applegate, P., and Hajdas, I.: Deglaciation, basin formation and post-glacial climate change from a regional network of sediment core sites in Ohio and eastern Indiana, Quaternary Res., 76, 401–410, https://doi.org/10.1016/j.yqres.2011.06.004, 2011.
Gorokhovich, Y., Nelson, M., Eaton, T., Wolk-Stanley, J., and Sen, G.: Geochronology and geomorphology of the Jones Point glacial landform in Lower Hudson Valley (New York): Insight into deglaciation processes since the Last Glacial Maximum, Geomorphology, 321, 87–102, https://doi.org/10.1016/j.geomorph.2018.08.013, 2018.
Gregoire, L. J., Valdes, P. J., and Payne, A. J.: The relative contribution of orbital forcing and greenhouse gases to the North American deglaciation, Geophys. Res. Lett., 42, 9970–9979, https://doi.org/10.1002/2015gl066005, 2015.
Hall, B. L., Borns, H. W., Bromley, G. R. M., and Lowell, T. V.: Age of the Pineo Ridge System: Implications for behavior of the Laurentide Ice Sheet in eastern Maine, U.S.A., during the last deglaciation, Quaternary Sci. Rev., 169, 344–356, https://doi.org/10.1016/j.quascirev.2017.06.011, 2017.
Halsted, C. T., Bierman, P. R., Shakun, J. D., Davis, P. T., Corbett, L. B., Caffee, M. W., Hodgdon, T. S., and Licciardi, J. M.: Rapid southeastern Laurentide Ice Sheet thinning during the last deglaciation revealed by elevation profiles of in situ cosmogenic 10Be, GSA Bulletin, 47, 2075–2087, https://doi.org/10.1130/b36463.1, 2022.
Halsted, C. T., Bierman, P. R., Shakun, J. D., Davis, P. T., Corbett, L. B., Drebber, J. S., and Ridge, J. C.: A critical re-analysis of constraints on the timing and rate of Laurentide Ice Sheet recession in the northeastern United States, J. Quaternary Sci., 39, 54–69, https://doi.org/10.1002/jqs.3563, 2023.
Harbor, J., Stroeven, A. P., Fabel, D., Clarhäll, A., Kleman, J., Li, Y., Elmore, D., and Fink, D.: Cosmogenic nuclide evidence for minimal erosion across two subglacial sliding boundaries of the late glacial Fennoscandian ice sheet, Geomorphology, 75, 90–99, https://doi.org/10.1016/j.geomorph.2004.09.036, 2006.
Hays, J. D., Imbrie, J., and Shackleton, N. J.: Variations in the Earth's Orbit: Pacemaker of the Ice Ages, Science, 194, 1121–1132, https://doi.org/10.1126/science.194.4270.1121, 1976.
Heath, S. L., Loope, H. M., Curry, B. B., and Lowell, T. V.: Pattern of southern Laurentide Ice Sheet margin position changes during Heinrich Stadials 2 and 1, Quaternary Sci. Rev., 201, 362–379, https://doi.org/10.1016/j.quascirev.2018.10.019, 2018.
Hooke, R. L.: Pleistocene ice and the base of the Barnes Ice Cap, Canada, J. Glaciol., 17, 49–60, 1976.
Hooke, R. L. and H. B. Clausen: Wisconsin and holocene δ18O variations, Barnes Ice Cap, Canada, Geol. Soc. Am. Bull., 93, 784–789, 1982.
Imbrie, J., Berger, A., Boyle, E. A., Clemens, S. C., Duffy, A., Howard, W. R., Kukla, G., Kutzbach, J., Martinson, D. G., McIntyre, A., Mix, A. C., Molfino, B., Morley, J. J., Peterson, L. C., Pisias, N. G., Prell, W. L., Raymo, M. E., Shackleton, N. J., and Toggweiler, J. R.: On the structure and origin of major glaciation cycles 2. The 100,000-year cycle, Paleoceanography, 8, 699–735, https://doi.org/10.1029/93pa02751, 1993.
Jaret, S. J., Tailby, N. D., Hammond, K. G., Rasbury, E. T., Wooton, K., Ebel, D. S., DiPadova, E., Smith, R., Yuan, V., Jaffe, N., Smith, L. M., and Spaeth, L.: Geology of Central Park, Manhattan, New York City, USA: New geochemical insights, The Geological Society of America Field Guide 61, 1–14, https://doi.org/10.1130/2020.0061(02), 2021.
Kaplan, M. R.: Retreat of a tidewater margin of the Laurentide ice sheet in eastern coastal Maine between ca. 14 000 and 13 000 14C yr B.P., GSA Bull., 111, 620–632, https://doi.org/10.1130/0016-7606(1999)111<0620:roatmo>2.3.co;2, 1999.
Kaplan, M. R.: Major ice sheet response in eastern New England to a cold North Atlantic region, ca. 16–15 cal ka BP, Quat. Res., 68, 280–283, https://doi.org/10.1016/j.yqres.2007.06.003, 2007.
Kaplan, M. R., Strelin, J. A., Schaefer, J. M., Denton, G. H., Finkel, R. C., Schwartz, R., Putnam, A. E., Vandergoes, M. J., Goehring, B. M., and Travis, S. G.: In-situ cosmogenic 10Be production rate at Lago Argentino, Patagonia: Implications for late-glacial climate chronology, Earth Planet. Sc. Lett., 309, 21–32, https://doi.org/10.1016/j.epsl.2011.06.018, 2011.
Kaye, C. A.: Geology of the Kingston Quadrangle, Rhode Island, Geological Survey Bulletin 1071-1, 15, 193–194, 1960.
Kaye, C. A.: Early Postglacial Beavers in Southeastern New England, Science, 138, 906–907, https://doi.org/10.1126/science.138.3543.906, 1962.
Kaye, C. A.: Illinoian and early Wisconsinan moraines of Martha's Vineyard, Massachusetts, US Geological Survey Professional Paper 501-C, C140–C143, https://doi.org/10.3133/pp501C, 1964a.
Kaye, C. A.: Outline of Pleistocene geology of Martha's Vineyard, Massachusetts, US Geological Survey Professional Paper 501-C, C134–C139, https://doi.org/10.3133/pp501C, 1964b.
Kaye, C. A.: Preliminary surficial map of Martha's Vineyard, Nomans Land, and parts of Naushon and Pasque Islands, Massachusetts, US Geological Survey Open-File Report 72-205, https://doi.org/10.3133/ofr72205, 1972.
Kelly, M. A.: The Late Würmian Age in the Western Swiss Alps: Last Glacial Maximum (LGM) Ice-surface Reconstruction and 10Be Dating of Late-glacial Features, PhD thesis, 2003.
Kindler, P., Guillevic, M., Baumgartner, M., Schwander, J., Landais, A., and Leuenberger, M.: Temperature reconstruction from 10 to 120 kyr b2k from the NGRIP ice core, Clim. Past, 10, 887–902, https://doi.org/10.5194/cp-10-887-2014, 2014.
Koester, A. J., Shakun, J. D., Bierman, P. R., Davis, P. T., Corbett, L. B., Braun, D., and Zimmerman, S. R.: Rapid thinning of the Laurentide Ice Sheet in coastal Maine, USA, during late Heinrich Stadial 1, Quaternary Sci. Rev., 163, 180–192, https://doi.org/10.1016/j.quascirev.2017.03.005, 2017.
Koteff, C. and Pessl Jr., F.: Systematic Ice Retreat in New England, in: Geological Survey Professional Paper 1179, United States Government Printing Office, Washington, https://doi.org/10.3133/pp1179, 1981.
Lal, D.: Cosmic ray labeling of erosion surfaces: in situ nuclide production rates and erosion models, Earth Planet. Sc. Lett., 104, 424–439, https://doi.org/10.1016/0012-821x(91)90220-c, 1991.
Lambeck, K., Rouby, H., Purcell, A., Sun, Y., and Sambridge, M.: Sea level and global ice volumes from the Last Glacial Maximum to the Holocene, P. Natl. Acad. Sci. USA, 111, 15296–15303, https://doi.org/10.1073/pnas.1411762111, 2014.
Laskar, J., Robutel, P., Joutel, F., Gastineau, M., Correia, A. C. M., and Levrard, B.: A long-term numerical solution for the insolation quantities of the Earth, Astron. Astrophys., 428, 261–285, https://doi.org/10.1051/0004-6361:20041335, 2004.
Lifton, N., Sato, T., and Dunai, T. J.: Scaling in situ cosmogenic nuclide production rates using analytical approximations to atmospheric cosmic-ray fluxes, Earth Planet. Sc. Lett., 386, 149–160, https://doi.org/10.1016/j.epsl.2013.10.052, 2014.
Löfverström, M., Caballero, R., Nilsson, J., and Kleman, J.: Evolution of the large-scale atmospheric circulation in response to changing ice sheets over the last glacial cycle, Clim. Past, 10, 1453–1471, https://doi.org/10.5194/cp-10-1453-2014, 2014.
Marcott, S. A., Bauska, T. K., Buizert, C., Steig, E. J., Rosen, J. L., Cuffey, K. M., Fudge, T. J., Severinghaus, J. P., Ahn, J., Kalk, M. L., McConnell, J. R., Sowers, T., Taylor, K. C., White, J. W. C., and Brook, E. J.: Centennial-scale changes in the global carbon cycle during the last deglaciation, Nature, 514, 616–619, https://doi.org/10.1038/nature13799, 2014.
McManus, J. F., Francois, R., Gherardi, J.-M., Keigwin, L. D., and Brown-Leger, S.: Collapse and rapid resumption of Atlantic meridional circulation linked to deglacial climate changes, Nature, 428, 834–837, https://doi.org/10.1038/nature02494, 2004.
McMaster, R. L.: Sediments of Narragansett Bay system and Rhode Island Sound, Rhode Island, J. Sediment. Res., 30, 249–274, https://doi.org/10.1306/74d70a15-2b21-11d7-8648000102c1865d, 1960.
McWeeney, L. J.: Revised vegetation history for the post-glacial period (15 200–10 000 14C years B.P.) in southern New England, in: Geological Society of America Abstracts with Programs 27, 68, , 1995.
Milankovitch, M.: Kanon der Erdbestrahlung und Seine Andwendung auf das Eiszeitenproblem, Special Publication, Royal Serbian Academy, 33, 132, 1941.
Mills, H. C. and Wells, P. D.: Ice-Shove Deformation and Glacial Stratigraphy of Port Washington, Long Island, New York, Gsa Bulletin, 85, 357–364, https://doi.org/10.1130/0016-7606(1974)85<357:idagso>2.0.co;2, 1974.
Monnin, E., Indermühle, A., Dällenbach, A., Flückiger, J., Stauffer, B., Stocker, T. F., Raynaud, D., and Barnola, J.-M.: Atmospheric CO2 Concentrations over the Last Glacial Termination, Science, 291, 112–114, https://doi.org/10.1126/science.291.5501.112, 2001.
Monnin, E., Steig, E. J., Siegenthaler, U., Kawamura, K., Schwander, J., Stauffer, B., Stocker, T. F., Morse, D. L., Barnola, J.-M., Bellier, B., Raynaud, D., and Fischer, H.: Evidence for substantial accumulation rate variability in Antarctica during the Holocene, through synchronization of CO2 in the Taylor Dome, Dome C and DML ice cores, Earth Planet. Sc. Lett., 224, 45–54, https://doi.org/10.1016/j.epsl.2004.05.007, 2004.
NASA Shuttle Radar Topography Mission (SRTM): Shuttle Radar Topography Mission (SRTM) Global, OpenTopography, https://doi.org/10.5069/G9445JDF, 2013.
Needell, S. W., O'Hara, C. J., and Knebel, H. J.: Quaternary geology of the Rhode Island inner shelf, Mar. Geol., 53, 41–53, 1983.
Nishiizumi, K.: 10Be, 26Al, 36Cl, and 41Ca AMS standards, in: Abstracts of the 9th Conference on Accelerator Mass Spectrometry, Nagoya, Japan, 9–13 September 2002, p. 130, O16-1, 2002.
Nishiizumi, K., Imamura, M., Caffee, M. W., Southon, J. R., Finkel, R. C., and McAninch, J.: Absolute calibration of 10Be AMS standards, Nucl. Instrum. Meth. B, 258, 403–413, https://doi.org/10.1016/j.nimb.2007.01.297, 2007.
Oakley, B. A.: Late Quaternary Depositional Environments, Timing and Recent Deposition: Narragansett Bay, Rhode Island and Massachusetts, Doctoral thesis, University of Rhode Island, https://doi.org/10.23860/diss-oakley-bryan-2012, 2012.
Oakley, B. A. and Boothroyd, J. C.: Constrained age of Glacial Lake Narragansett and the deglacial chronology of the Laurentide Ice Sheet in southeastern New England, J. Paleolimnol., 50, 305–317, https://doi.org/10.1007/s10933-013-9725-7, 2013.
Oldale, R. N.: Pleistocene stratigraphy of Nantucket, Martha's Vineyard, the Elizabeth Islands, and Cape Cod, Massachusetts, in: Late Wisconsinan Glaciation of New England: Proceedings of the Symposium, edited by: Larson, G. J. and Stone, B. D., Kendall/Hunt, Dubuque, IA, 34 pp., ISBN 9780840326058, 1982.
Oldale, R. N. and O'Hara, C. J.: Glaciotectonic origin of the Massachusetts coastal end moraines and a fluctuating late Wisconsinan ice margin, GSA Bulletin, 95, 61–74, https://doi.org/10.1130/0016-7606(1984)95<61:gootmc>2.0.co;2, 1984.
Peteet, D. M., Beh, M., Orr, C., Kurdyla, D., Nichols, J., and Guilderson, T.: Delayed deglaciation or extreme Arctic conditions 21–16 cal. kyr at southeastern Laurentide Ice Sheet margin?, Geophys. Res. Lett., 39, L11706, https://doi.org/10.1029/2012gl051884, 2012.
Prince, K. K., Briner, J. P., Walcott, C. K., Chase, B. M., Kozlowski, A. L., Rittenour, T. M., and Yang, E. P.: New age constraints reveal moraine stabilization thousands of years after deposition during the last deglaciation of western New York, USA, Geochronology, 6, 409–427, https://doi.org/10.5194/gchron-6-409-2024, 2024.
Putnam, A. E., Bromley, G. R. M., Rademaker, K., and Schaefer, J. M.: In situ 10Be production-rate calibration from a 14C-dated late-glacial moraine belt in Rannoch Moor, central Scottish Highlands, Quat. Geochronol., 50, 109–125, https://doi.org/10.1016/j.quageo.2018.11.006, 2019.
Raymo, M. E.: The timing of major climate terminations, Paleoceanography, 12, 577–585, https://doi.org/10.1029/97pa01169, 1997.
Refsnider, K. A., Miller, G. H., Fogel, M. L., Fréchette, B., Bowden, R., Andrews, J. T., and Farmer, G. L.: Subglacially precipitated carbonates record geochemical interactions and pollen preservation at the base of the Laurentide Ice Sheet on central Baffin Island, eastern Canadian Arctic, Quaternary Res., 81, 94–105, https://doi.org/10.1016/j.yqres.2013.10.014, 2014.
Reimer, G. E.: The Sedimentology and Stratigraphy of the Southern Basin of Glacial Lake Passaic, New Jersey, Master's thesis, Rutgers University, New Brunswick, New Jersey, 1984.
Reimer, P. J., Austin, W. E. N., Bard, E., Bayliss, A., Blackwell, P. G., Ramsey, C. B., Butzin, M., Cheng, H., Edwards, R. L., Friedrich, M., Grootes, P. M., Guilderson, T. P., Hajdas, I., Heaton, T. J., Hogg, A. G., Hughen, K. A., Kromer, B., Manning, S. W., Muscheler, R., Palmer, J. G., Pearson, C., Plicht, J. van der, Reimer, R. W., Richards, D. A., Scott, E. M., Southon, J. R., Turney, C. S. M., Wacker, L., Adolphi, F., Büntgen, U., Capano, M., Fahrni, S. M., Fogtmann-Schulz, A., Friedrich, R., Köhler, P., Kudsk, S., Miyake, F., Olsen, J., Reinig, F., Sakamoto, M., Sookdeo, A., and Talamo, S.: The IntCal20 Northern Hemisphere Radiocarbon Age Calibration Curve (0–55 cal kBP), Radiocarbon, 62, 725–757, https://doi.org/10.1017/rdc.2020.41, 2020.
Ridge, J. C.: The Quaternary glaciation of western New England with correlations to surrounding areas, Dev. Quat. Sci., 2, 169–199, https://doi.org/10.1016/s1571-0866(04)80196-9, 2004.
Ridge, J. C., Balco, G., Bayless, R. L., Beck, C. C., Carter, L. B., Dean, J. L., Voytek, E. B., and Wei, J. H.: The new North American Varve Chronology: A precise record of southeastern Laurentide Ice Sheet deglaciation and climate, 18.2-12.5 kyr BP, and correlations with Greenland ice core records, Am. J. Sci., 312, 685–722, https://doi.org/10.2475/07.2012.01, 2012.
Rittenour, T.M., Stone, B.D., and Mahan, S.: Application of OSL dating to glacial deposits in southern Massachusetts: Refining the chronology and addressing questions related to solar resetting in glacial environments, Geological Society of America Abstracts with Programs, 44, p. 86, https://gsa.confex.com/gsa/2012NE/webprogram/Paper199570.html (last access: 11 July 2024), 2012.
Schaefer, J. M., Denton, G. H., Kaplan, M., Putnam, A., Finkel, R. C., Barrell, D. J. A., Andersen, B. G., Schwartz, R., Mackintosh, A., Chinn, T., and Schlüchter, C.: High-Frequency Holocene Glacier Fluctuations in New Zealand Differ from the Northern Signature, Science, 324, 622–625, https://doi.org/10.1126/science.1169312, 2009.
Schafer, J. P.: Surficial Geologic Map of the Watch Hill quadrangle, Rhode Island-Connecticut, scale 1:24 000, https://doi.org/10.3133/gq410, 1965.
Schafer, J. P. and Hartshorn, J. H.: The Quaternary of New England, in: The Quaternary of the United States, edited by: Wright, H. E. and Frey, D. G., Princeton University Press, Princeton, NJ, 113–127, https://doi.org/10.1515/9781400876525-009, 1965.
Schuldenrein, J. and Aiuvalasit, M.: Urban geoarchaeology and sustainability: A case study from Manhattan Island, New York City, USA, in: Geoarchaeology, Climate Change, and Sustainability: Geological Society of America Special Paper 476, edited by: Brown, A. G., Basell, L. S., and Butzer, K. W., https://doi.org/10.1130/2011.2476(12), 2011.
Shakun, J. D., Clark, P. U., He, F., Lifton, N. A., Liu, Z., and Otto-Bliesner, B. L.: Regional and global forcing of glacier retreat during the last deglaciation, Nat. Commun., 6, 8059, https://doi.org/10.1038/ncomms9059, 2015.
Sinclair, S. N., Licciardi, J. M., Campbell, S. W., and Madore, B. M.: Character and origin of De Geer moraines in the Seacoast region of New Hampshire, USA, J. Quaternary Sci., 33, 225–237, 2018.
Sirkin, L.: Block Island, Rhode Island: Evidence of fluctuation of the late Pleistocene ice margin, GSA Bulletin, 87, 574–580, https://doi.org/10.1130/0016-7606(1976)87<574:birieo>2.0.co;2, 1976.
Sirkin, L.: The Late Wisconsinan lobate ice margin of Long Island, Fifth Conference on the Geology of Long Island and Metropolitan New York, https://dspace.sunyconnect.suny.edu/server/api/core/bitstreams/9f52dd8e-9fdb-4c8e-9120-b34e35ecc484/content (last access: 11 July 2024), 1998.
Sirkin, L.: Late Wisconsinan glaciation of Long Island, New York, to Block Island, Rhode Island, Proceedings of the Symposium, edited by: Larson, G. J. and Stone, B. D., Kendall/Hunt, Dubuque, IA, 35–59, 1982.
Sirkin, L. and Stuckenrath, R.: The Portwashingtonian warm interval in the northern Atlantic coastal plain, GSA Bulletin, 91, 332–336, https://doi.org/10.1130/0016-7606(1980)91<332:tpwiit>2.0.co;2, 1980.
Soren, J.: Geologic and geohydrologic reconnaissance of Staten Island, New York, U.S Geological Survey, Water-Resources Investigations Report 87-4048, https://doi.org/10.3133/wri874048, 1988.
Stanford, S. D.: Late Wisconsinan glacial geology of the New Jersey Highlands, Northeastern Geology, 15, 210–223, 1993.
Stanford, S. D.: Onshore record of Hudson River drainage to the continental shelf from the late Miocene through the late Wisconsinan deglaciation, U.S.A.: synthesis and revision, Boreas, 39, 1–17, https://doi.org/10.1111/j.1502-3885.2009.00106.x, 2010.
Stanford, S. D. and Harper, D.: Glacial lakes of the lower Passaic, Hackensack, and lower Hudson valleys, New Jersey and New York, Northeastern Geology, 13, 271–286, 1991.
Stanford, S. D., Stone, B. D., Ridge, J. C., Witte, R. W., Pardi, R. R., and Reimer, G. E.: Chronology of Laurentide glaciation in New Jersey and the New York City area, United States, Quaternary Res, 99, 142–167, https://doi.org/10.1017/qua.2020.71, 2021.
Stokes, C. R.: Deglaciation of the Laurentide Ice Sheet from the Last Glacial Maximum, Cuadern. Investig., 43, 377–428, https://doi.org/10.18172/cig.3237, 2017.
Stokes, C. R., Tarasov, L., and Dyke, A. S.: Dynamics of the North American Ice Sheet Complex during its inception and build-up to the Last Glacial Maximum, Quaternary Sci. Rev., 50, 86–104, https://doi.org/10.1016/j.quascirev.2012.07.009, 2012.
Stone, B. D. and Borns, H. W. Jr.: Pleistocene glacial and interglacial stratigraphy of New England, Long Island, and adjacent Georges Bank and Gulf of Maine, Quaternary Sci. Rev., 5, 39–52, https://doi.org/10.1016/0277-3791(86)90172-1, 1986.
Stone, B. D. and Stone, J. R.: Geologic Origins of Cape Cod, Massachusetts; Guidebook for the Northeast Friends of the Pleistocene, 82nd Annual Fieldtrip, 31 May–2 June 2019: Massachusetts Geological Survey Open-file Report 19-01, 63 pp., https://www2.newpaltz.edu/fop/pdf/FOP2019Guide.pdf (last access: 11 July 2024), 2019.
Stone, B. D., Stanford, S. D., and Witte, R. W.: Surficial Geologic Map of the Northern Sheet, New Jersey, US Geological Survey, U.S. Geological Survey Open File Map 95-543B, https://doi.org/10.3133/ofr95543B, 1995.
Stone, B. D., Stanford, S. D., and Witte, R. W.: Surficial Geologic Map of Northern New Jersey, Miscellaneous Investigations Series Map I-2540-C, U.S. Geological Survey, Reston, VA, https://doi.org/10.3133/i2540C, 2002.
Stone, J. O.: Air pressure and cosmogenic isotope production, J. Geophys. Res.-Sol. Ea., 105, 23753–23759, https://doi.org/10.1029/2000jb900181, 2000.
Stone, J. O., Balco, G. A., Sugden, D. E., Caffee, M. W., III, L. C. S., Cowdery, S. G., and Siddoway, C.: Holocene Deglaciation of Marie Byrd Land, West Antarctica, Science, 299, 99–102, https://doi.org/10.1126/science.1077998, 2003.
Stone, J. R.: Surficial Materials Map of the Chipuxet River and Chickasheen Brook Basins, in: Areas contributing recharge to production wells and effects of climate change on the groundwater system in the Chipuxet River and Chickasheen Brook Basins, edited by: Friesz, P. J. and Stone, J. R., Rhode Island: U.S. Geological Survey Scientific Investigations Report 2014–5216, plate 1, https://doi.org/10.3133/sir20145216, 2014.
Stone, J. R., Shafer, J. P., London, E. H., DiGiacomo-Cohen, M., Lewis, R. S., and Thompson, W. B.: Quaternary Geologic Map of Connecticut and Long Island Sound Basin, U.S. Geological Survey Geologic Investigations Series Map I-2784, scale , 2 sheets and pamphlet, 72 pp., https://doi.org/10.3133/sim2784, 2005.
Stone, J. R., Stone, B. D., DiGiacomo-Cohen, M. L., and Mabee, S. B.: Surficial Materials of Massachusetts – A 1:24 000-Scale Geologic Map Database, USGS Scientific Investigations Map 3402, https://doi.org/10.3133/sim3402, 2018.
Taterka, B. D.: Bedrock geology of Central Park, New York City, MS Thesis University of Massachusetts Department of Geology and Geography, Contribution 61, https://www.geo.umass.edu/research/Geosciences%20Publications/vol%2061,%20Taterka,%201987.pdf (last access: 11 July 2024), 1987.
Thompson, W. B., Dorion, C. C., Ridge, J. C., Balco, G., Fowler, B. K., and Svendsen, K. M.: Deglaciation and late-glacial climate change in the White Mountains, New Hampshire, USA, Quat. Res., 87, 96–120, https://doi.org/10.1017/qua.2016.4, 2017.
Todd, B. J., Valentine, P. C., Longva, O., and Shaw, J.: Glacial landforms on German Bank, Scotian Shelf: evidence for Late Wisconsinan ice-sheet dynamics and implications for the formation of De Geer moraines, Boreas, 36, 148–169, 2007.
Tucholke and Hollister, B. E.: Late Wisconsin glaciation of the southwestern Gulf of Maine: new evidence from the marine environment, GSA Bulletin, 84, 279–3296, 1973.
Tzedakis, P. C., Drysdale, R. N., Margari, V., Skinner, L. C., Menviel, L., Rhodes, R. H., Taschetto, A. S., Hodell, D. A., Crowhurst, S. J., Hellstrom, J. C., Fallick, A. E., Grimalt, J. O., McManus, J. F., Martrat, B., Mokeddem, Z., Parrenin, F., Regattieri, E., Roe, K., and Zanchetta, G.: Enhanced climate instability in the North Atlantic and southern Europe during the Last Interglacial, Nat. Commun., 9, 4235, https://doi.org/10.1038/s41467-018-06683-3, 2018.
Ullman, D. J., LeGrande, A. N., Carlson, A. E., Anslow, F. S., and Licciardi, J. M.: Assessing the impact of Laurentide Ice Sheet topography on glacial climate, Clim. Past, 10, 487–507, https://doi.org/10.5194/cp-10-487-2014, 2014.
Ullman, D. J., Carlson, A. E., LeGrande, A. N., Anslow, F. S., Moore, A. K., Caffee, M., Syverson, K. M., and Licciardi, J. M.: Southern Laurentide ice-sheet retreat synchronous with rising boreal summer insolation, Geology, 43, 23–26, https://doi.org/10.1130/g36179.1, 2015.
Upham, W.: Terminal moraines of the North American ice sheet, Am. J. Sci., s3–18, 197, https://doi.org/10.2475/ajs.s3-18.105.197, 1879.
Vorren, T. O., Rydningen, T. A., Baeten, N. J., and Laberg, J. S.: Chronology and extent of the Lofoten–Vesterålen sector of the Scandinavian Ice Sheet from 26 to 16 cal. ka BP, Boreas, 44, 445–458, https://doi.org/10.1111/bor.12118, 2015.
Woodworth, J. B. and Wigglesworth, E.: Geography and geology of the region including Cape Cod, the Elizabeth islands, Nantucket, Marthas Vineyard, No Mans Land and Block Island, Memoirs of the Museum of Comparative Zoölogy at Harvard College, Vol. 52, Cambridge, Mass, https://doi.org/10.5962/bhl.title.49347, 1934.
Wrobleski, E. A. and Hooke, R. L.: Deglaciation of Penobscot Bay, Maine, USA, Atl. Geol., 56, 147–161, 2020.
Young, N. E., Schaefer, J. M., Briner, J. P., and Goehring, B. M.: A 10Be production-rate calibration for the Arctic, J. Quaternary Sci., 28, 515–526, https://doi.org/10.1002/jqs.2642, 2013.
Young, N. E., Briner, J. P., Maurer, J., and Schaefer, J. M.: 10Be measurements in bedrock constrain erosion beneath the Greenland Ice Sheet margin, Geophys. Res. Lett., 43, 11708–11719, https://doi.org/10.1002/2016gl070258, 2016.