the Creative Commons Attribution 4.0 License.
the Creative Commons Attribution 4.0 License.
 | 26 Sep 2024
North Atlantic Oscillation polarity during the past 3000 years derived from sediments of a large lowland lake, Schweriner See, in NE Germany
Marie-Luise Adolph
Sambor Czerwiński
Mirko Dreßler
Paul Strobel
Marcel Bliedtner
Sebastian Lorenz
Maxime Debret
Torsten Haberzettl
Based on a multi-dating and multi-proxy approach, we reconstruct Late Holocene environmental changes derived from sediments of Schweriner See, a large lowland lake in NE Germany, covering the past 3070 years cal BP. We infer variations in large-scale atmospheric circulation systems by combining in-lake productivity indicators obtained from traditional and high-resolution techniques (e.g. LOI550, TOC, inc coh), diatom assemblages, and compound-specific hydrogen isotopes (δ2H). Before 105+95/−75 cal BP (∼1850 CE), changes in productivity and the occurrence or disappearance of the diatom species Stephanocostis chantaicus reflect winter temperature variability, while variations in the compound-specific hydrogen isotopes suggest changes in the moisture source region. We observe distinct variations between (i) milder winter temperatures with a moisture source region in the southern–central North Atlantic and (ii) colder winter temperatures with a moisture source in the northern North Atlantic and/or Arctic regions. Such distinct variations in winter temperature and moisture source region are mainly modulated by the North Atlantic Oscillation (NAO). This affects, among others, westerly wind strength and pathways and, thereby, winter temperature and moisture source region for northern central Europe. Besides these long-term shifts in atmospheric conditions, short-term variations in titanium can be linked to lake-level variability, most likely influenced by changes in precipitation and/or evaporation, and after the 12th century to anthropogenic impacts. Since 105 cal BP (∼1850 CE), productivity has been driven predominantly by nutrient availability related to anthropogenic activities masking the hydroclimatic signal.
- Article
(6181 KB) - Full-text XML
-
Supplement
(2760 KB) - BibTeX
- EndNote


In recent decades, hydroclimatic conditions in western and central Europe have been characterized by drought events, which have been increasing in frequency and severity (Spinoni et al., 2018) and resulted in severe socio-economic and ecological consequences. Similarly, future climate scenarios for western and central Europe predict increasing temperatures; more frequent, longer, and/or more intense heat waves as well as warm spells; and an increase in dryness with short-term droughts (IPCC, 2021). Such changes will affect the hydrological cycle and, therefore, all aquatic (eco)systems. Some areas in western and central Europe, e.g. NE Germany, have already been affected by lowering lake and groundwater levels (Germer et al., 2010). However, to understand the drivers, magnitude, and direction of climatic and environmental changes and to assess future developments, longer time series than those provided by monitoring efforts are needed (IPCC, 2021).
Late Holocene hydroclimatic variability in western and central Europe has been related to changes in ocean circulation (e.g. Trouet et al., 2012; Bond et al., 2001), solar cycles (e.g. Martin-Puertas et al., 2012; Mellström et al., 2015), and atmospheric circulation systems such as the North Atlantic Oscillation (NAO) (e.g. Faust et al., 2016; Baker et al., 2015). The NAO is one of the leading atmospheric circulation systems influencing weather and climate conditions in the Northern Hemisphere, i.e. surface air temperature, precipitation, wind, and storminess, including westerly wind strength, direction, and storm tracks (Bliedtner et al., 2023; Hurrell and Deser, 2009; Hu et al., 2022). It is more active in the cold season (October–April), with larger amplitudes and a strong influence on winter temperature and precipitation (Hurrell et al., 2003). The NAO refers to changes in the atmospheric mass balance, namely, the air pressure difference between the subpolar low-pressure (Iceland) and subtropical high-pressure (Azores) systems. The NAO index is defined as two modes which depend on the barometric difference between the pressure systems. A positive NAO (NAO+) is associated with a stronger gradient between the pressure systems causing zonal circulation and increased intensity of cyclones as well as stronger westerlies (Hurrell and Deser, 2009). This results in generally milder winter temperatures and moist (maritime) winter conditions with isotopically enriched precipitation from a moisture source region in the southern–central North Atlantic (e.g. Breitenbach et al., 2019; Hurrell, 1995; McDermott et al., 2011; Baldini et al., 2008; Comas-Bru et al., 2016; Fig. 1a). In contrast, a negative NAO (NAO−) has a weaker pressure gradient causing a more meridional circulation with weaker westerlies (Fig. 1a). This causes a more frequent atmospheric blocking and consequently colder, drier air masses from the northern North Atlantic and/or Arctic regions with isotopically depleted precipitation flows towards central Europe (e.g. Breitenbach et al., 2019; Hurrell, 1995; McDermott et al., 2011; Baldini et al., 2008; Comas-Bru et al., 2016). Recently, it has been suggested that winter conditions in the North Atlantic region can be linked to the combined effects of the NAO and the eastern Atlantic (EA) pattern (e.g. Comas-Bru and McDermott, 2014; Mellado-Cano et al., 2019). The EA pattern is defined as a sea level pressure monopole between Iceland and Ireland (e.g. Comas-Bru and McDermott, 2014; Moore et al., 2013) modulating the location and intensities of the Icelandic Low and Azores High (e.g. Moore et al., 2011) and, consequently, the position of the North Atlantic storm tracks and jet stream (Woollings et al., 2010; Seierstad et al., 2007; Moore and Renfrew, 2012).
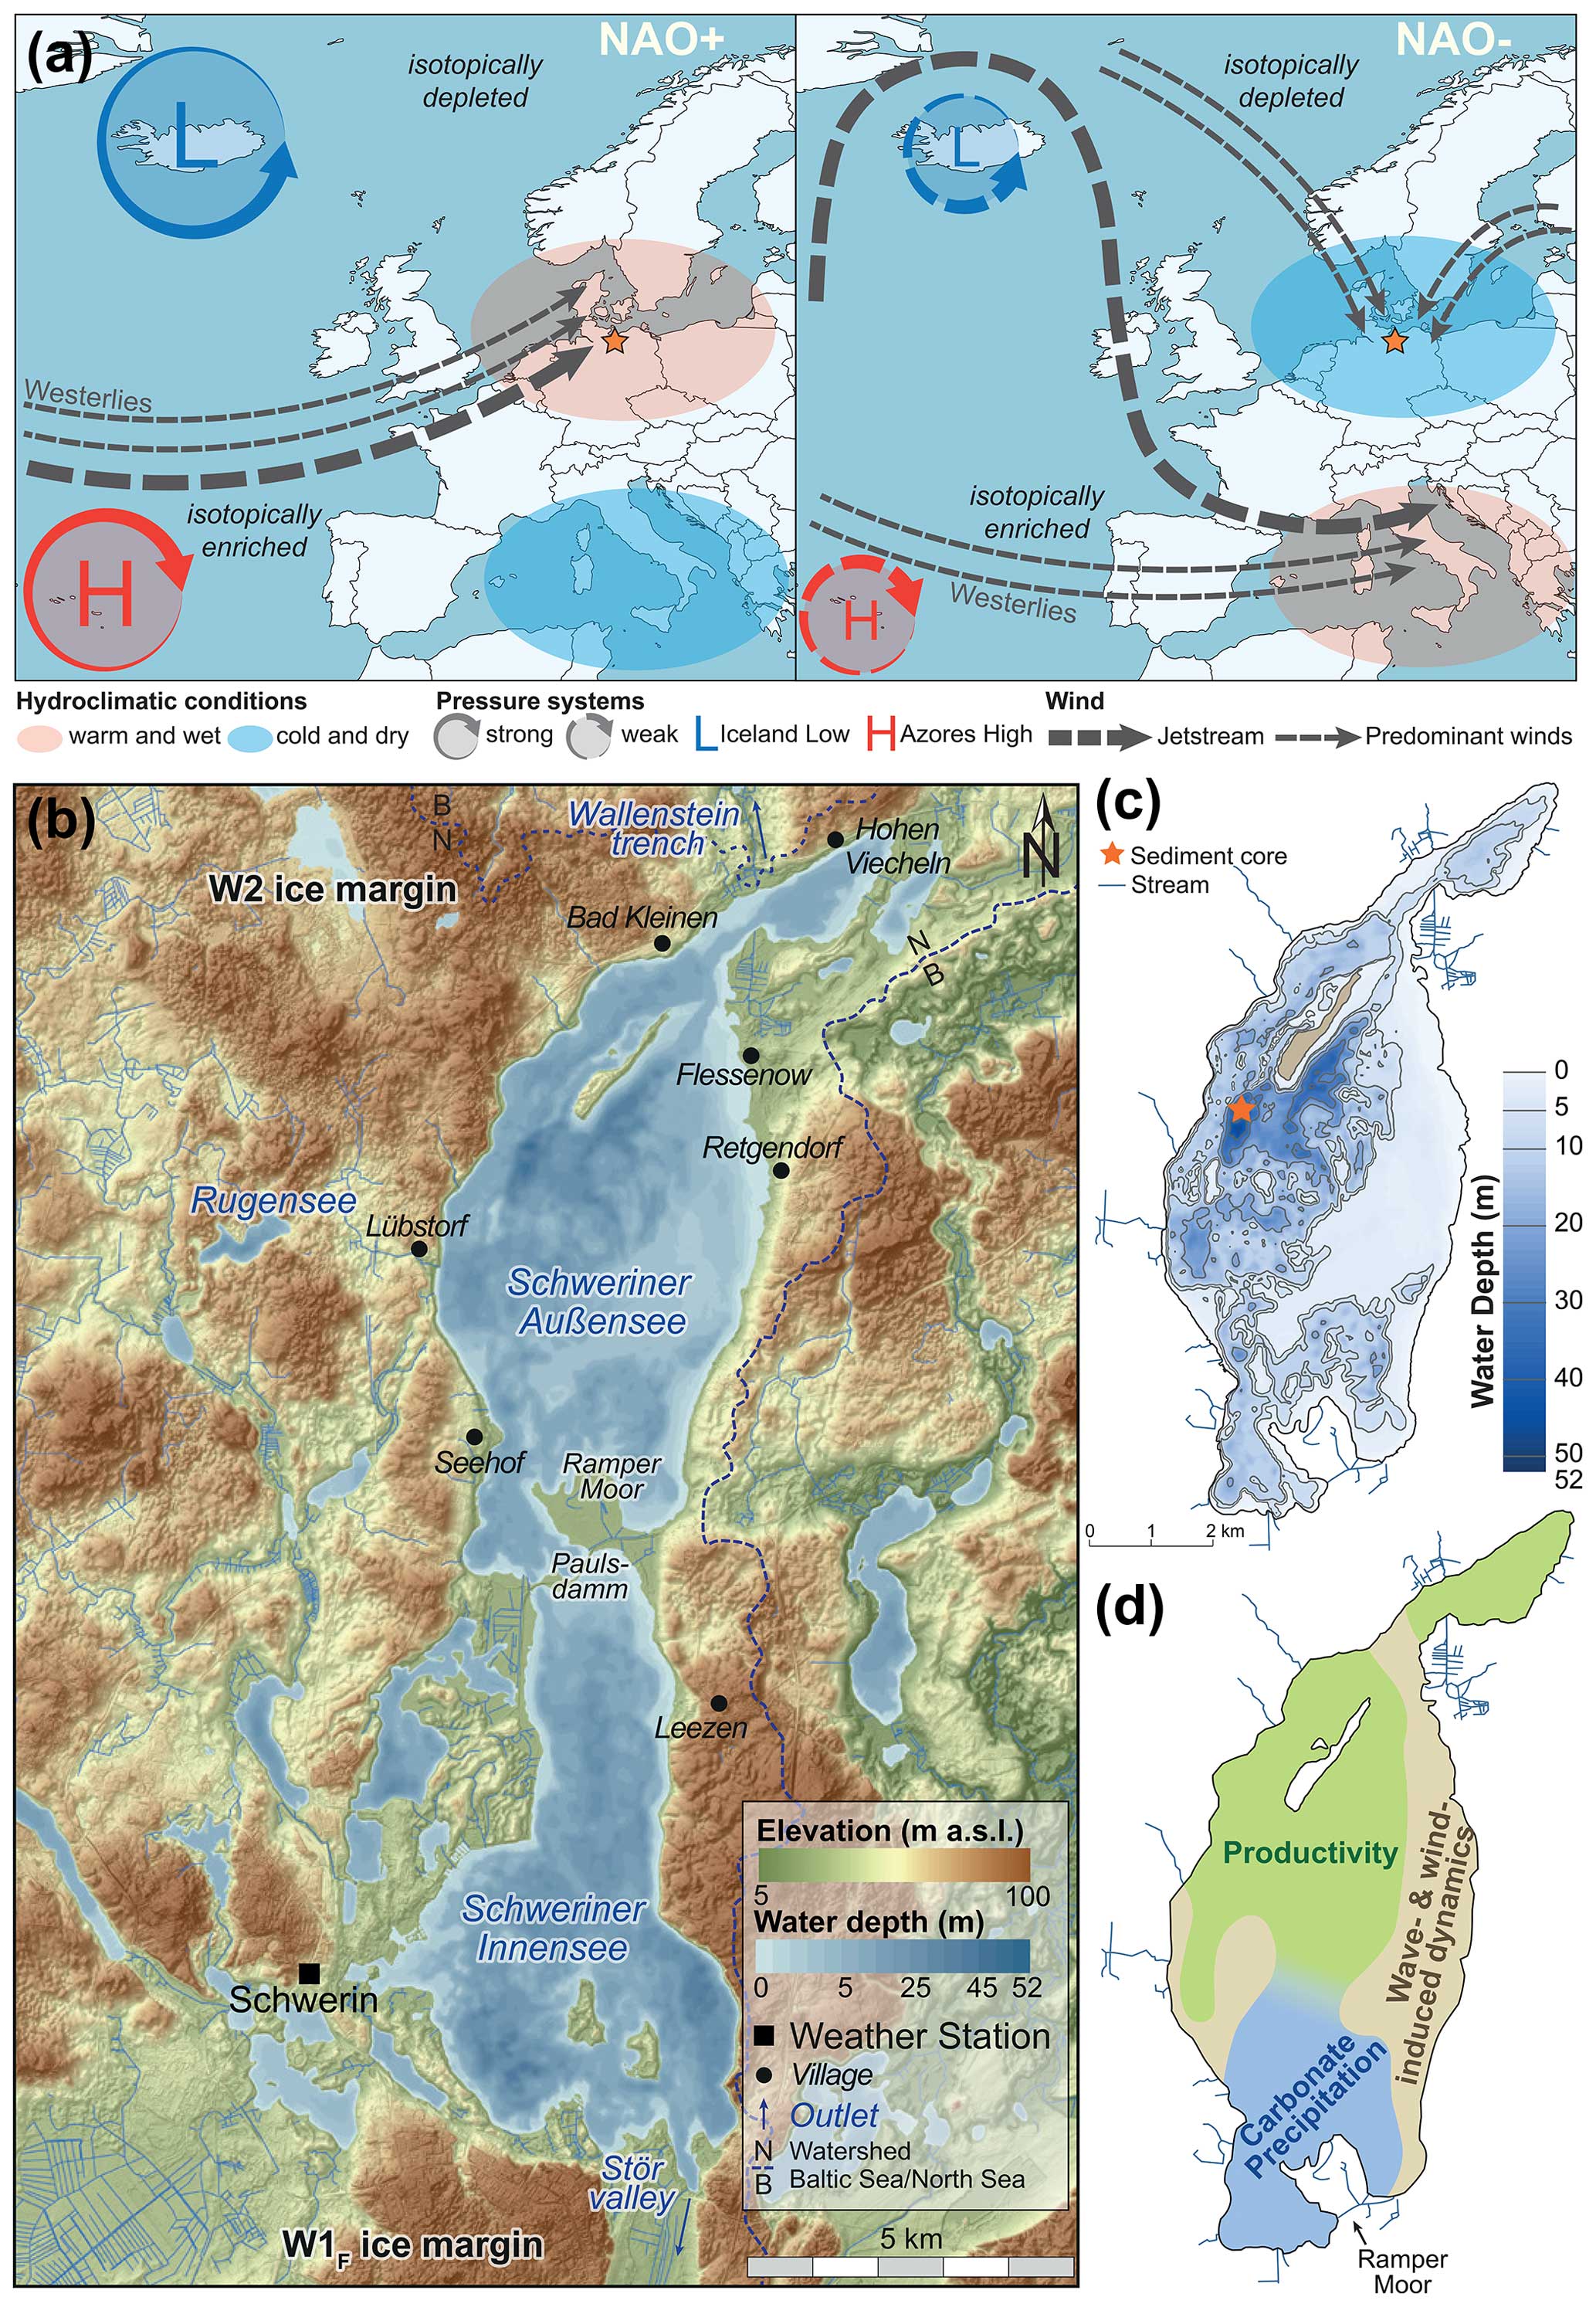
Figure 1(a) Conceptual overview of the North Atlantic Oscillation (NAO) illustrating the sea level surface pressure during positive (NAO+, left panel) and negative (NAO−, right panel) phases and how these changes affect westerlies and predominant winds at the study site of Schweriner See (orange star). (b) Digital elevation model of the area surrounding Schweriner See including bathymetry and Weichselian moraines (W1F and W2) surrounding Schweriner See in the north and south. The outlets Wallensteingraben and Stör are indicated in the north and south. The semi-artificial Paulsdamm separates Schweriner See into two basins similar in size, Schweriner Außensee (north) and Schweriner Innensee (south). Although separated, water exchange is still possible (Wöbbecke et al., 2003). Also indicated is the Baltic Sea (B) and North Sea (N) watershed along the eastern and northern shoreline. (c) Detailed bathymetric map of Schweriner Außensee including the coring position (orange star). (d) Generalized classification of Schweriner Außensee based on previous investigations of surface sediment samples by Adolph et al. (2023). The eastern shallow-water area is characterized by wave- and wind-induced dynamics (beige). The southern and northern parts are dominated by carbonate precipitation due to increased carbonate-rich groundwater inflow (blue) and productivity (green).
Existing paleoenvironmental studies from northern Germany point to considerable environmental variability during the Holocene (e.g. Dietze et al., 2016; Theuerkauf et al., 2022; Kaiser et al., 2012) but have rarely been linked to NAO variability (e.g. Zahrer et al., 2013) even though coastal areas surrounding the Baltic Sea were identified as ideal for collecting proxy information on large-scale North Atlantic atmospheric patterns (e.g. NAO) (Comas-Bru et al., 2016). Currently, an in-depth understanding of the Holocene hydroclimatic variability of northern Germany is still limited because northern Germany has a spatial climatic gradient with an eastward increasing continentality (decrease in temperature and precipitation) and the majority of studies have been carried out in areas affected by a more continental climate (e.g. Dietze et al., 2016; Lampe et al., 2009; Lorenz, 2007; Theuerkauf et al., 2022). Studies from the transition zone between more maritime and more continental climate conditions are rare (e.g. Lorenz, 2007). Moreover, many studies have been carried out on small lacustrine systems (e.g. Dreßler et al., 2011), in which anthropogenic impacts may overprint natural climate variations (Haberzettl et al., 2019). These biases culminate in sometimes contradicting results, e.g. in reconstructed lake-level curves, which have been used as key tools for hydroclimatic reconstructions so far (Kaiser et al., 2012). Apart from that, some studies from that area stress that not all observed lake-level variations are induced by climatic variations but rather by (anthropogenic) land cover changes influencing evapotranspiration and, consequently, groundwater recharge (e.g. Theuerkauf et al., 2022; Dietze et al., 2016).
In this study, we hypothesize that Schweriner See, a large hard-water lake located approximately 20 km south of the Baltic Sea and close to the boundary between a more maritime to more continental climate, is a suitable archive to reconstruct impacts of large-scale atmospheric circulation systems on the northern German lowlands. As Schweriner See is a large lake with a relatively small catchment compared to its size (Wöbbecke et al., 2003), we hypothesize that the lake is less susceptible to anthropogenic biases that may be experienced when investigating small lacustrine systems and that sediments from Schweriner See reflect (supra)regional hydroclimatic variations.
Schweriner See (53°43.256′ N, 11°27.544′ E; 37.8 m a.s.l.) is located in the northern German lowlands in the westernmost part of the Mecklenburg Lake District (Fig. 1). The lake has a surface area of 61.54 km2, extends over 24.8 km in the N–S direction, and is up to 6 km wide in the E–W direction. The overall catchment area is 414 km2, but the northern basin, the so-called Schweriner Außensee (SAS), comprises only 85 km2. The catchment is mainly composed of farmland (47.5 %), water surfaces (20.9 %), forests (12.8 %), populated areas (10.9 %), grassland (7.6 %), and others (0.3 %) (Wöbbecke et al., 2003). The lake is mainly fed by groundwater (∼70 %; Michael Lückstädt, Staatliches Amt für Landwirtschaft und Umwelt Westmecklenburg, personal communication, 2023) and precipitation but has only few small inflowing streams (Fig. 1c). Schweriner See is situated between ice-marginal positions (IMPs) of the Weichselian glaciation at the southern and northern end (Krienke and Obst, 2011). At the southern end, the river Stör naturally drains Schweriner See through a valley formed by glacial meltwaters that broke through the southern IMP towards the North Sea. In the 16th century, the artificial Wallenstein trench as another outflow was built at the northern end to connect Schwerin with the Baltic Sea (Fig. 1). The lake water has a residence time of 11 years (Nixdorf et al., 2004).
The climate at Schweriner See, as shown by data from the closest weather station in Schwerin for the period 1991–2020, is warm–temperate with a mean annual temperature of 9.5 °C, the coldest and warmest month being January (1.6 °C) and July (18.1 °C). Mean annual precipitation is 631 mm (DWD Climate Data Center, 2022b, c) and mean annual water balance is around 60 mm (1971–2000, DWD Climate Data Center, 2020).
Schweriner Außensee is characterized by a large shallow-water area (<5 m water depth) at the eastern littoral area, which is susceptible to wave- and wind-induced dynamics caused by the main wind direction from W–SSW (1967–2022, DWD Climate Data Center, 2022a) resulting in a fetch of 6–8 km (Fig. 1d; Adolph et al., 2023). Additionally, this widespread shallow-water area divides Schweriner Außensee into two subbasins in the north and south. Depositional processes of both subbasins are mainly influenced by productivity in the northern part and carbonate precipitation in the southern part (Fig. 1d; Adolph et al., 2023). In particular, the area in the south, close to the so-called Ramper Moor, is characterized by strong carbonate-rich groundwater inflow resulting in increased carbonate precipitation (Fig. 1d; Adolph et al., 2023; Umweltministerium Mecklenburg-Vorpommern, 2003).
3.1 Coring and composite profile
Two parallel sediment cores, SAS21-11 (13.56 m length) and SAS21-12 (15.51 m length), were obtained in September 2021 from the deepest part of Schweriner See (52 m water depth; Fig. 1c) using a 90 mm inner diameter UWITEC piston corer. Additionally, a short sediment surface core (SAS22-2, 77.5 cm length) was retrieved in July 2022 using a 60 mm inner diameter UWITEC gravity corer to guarantee an intact surface. All sediment cores were transported to the Physical Geography Laboratory of the University of Greifswald and stored under dark and cool (∼4 °C) conditions before further processing. Sediment cores were split and photographed, and sedimentological properties were described according to standard protocols of the Physical Geography Laboratory of the University of Greifswald. SAS22-2, SAS21-11, and SAS21-12 were spliced together using lithological marker layers, resulting in composite sequence SAS21 of 17.76 m length.
3.2 Chronology
The chronology is based on 13 radiocarbon ages (Poznań Radiocarbon Laboratory) from terrestrial plant macrofossils and 18 ages in the uppermost part of the composite profile. dating was carried out at the Environmental Radioactivity Research Centre of the University of Liverpool. Freeze-dried sediment samples from sediment core SAS22-2 were analysed for 210Pb, 226Ra, and 137Cs by direct gamma assay in the Liverpool University Environmental Radioactivity Laboratory using Ortec HPGe GWL series well-type coaxial low-background intrinsic germanium detectors (Appleby et al., 1986). 210Pb was determined via its gamma emissions at 46.5 keV and 226Ra by the 295 keV and 352 keV γ rays emitted by its decay product 214Pb following 3 weeks in storage in sealed containers to allow radioactive equilibration. 137Cs was measured by its emissions at 662 keV. The absolute efficiencies of the detectors were determined using calibrated sources and sediment samples of known activity. Corrections were made for the effect of self-absorption of low-energy γ rays within the sample (Appleby et al., 1992). Unsupported (fallout) 210Pb was calculated by subtracting 226Ra concentrations from the total 210Pb activities (Tables S1–S3 in the Supplement). The age–depth model does not include the lowermost age, as only the upper 61 cm of sediment core SAS22-2 is part of the composite profile.
Except for this one age, all ages were used for age–depth modelling using the R package “rbacon” (v2.5.8, Blaauw and Christen, 2011) with the IntCal20 calibration dataset (Reimer et al., 2020) for calibration of radiocarbon data (Tables S3 and S4). In the following, ages are reported as rbacon-derived mean ages and the uncertainty is based on the upper and lower limits of the 95 % confidence interval (Fig. 2). The sedimentation rate was calculated based on this age–depth model. For this study, only the upper 897.5 cm was investigated in detail as this depth marks the lowermost 14C age and we refrained from extrapolating the age–depth model.
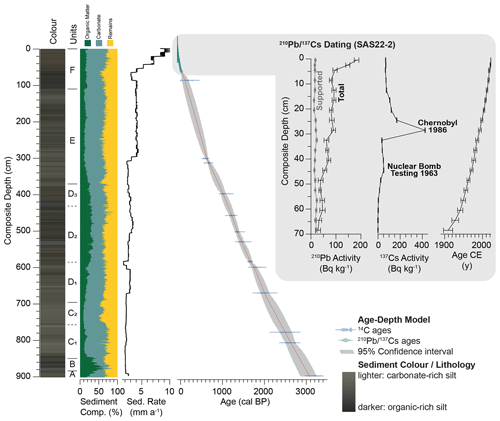
Figure 2Lithology and sediment colour of the composite record SAS21 (left). A higher organic content causes a darker colour, while a lighter colour is caused by increased carbonate precipitation. The sediment composition is shown as organic matter (LOI550; green), carbonates (determined by the Scheibler method; blue), and remains (yellow). The age–depth model is based on 14C (probability density function of the 2σ distribution, blue) and ages (teal). The mean age and the 95 % confidence interval are shown (centre). results show a distinct peak for the Chernobyl accident of 1986 (right).
3.3 Scanning techniques
Visible reflectance spectroscopy (VIS-RS) was carried out directly on the cling-wrap-covered freshly opened sediment core surface using a Konica Minolta CM-2600d spectrophotometer (8 mm spot, D65 at 10 nm steps from 360–740 nm wavelength) in a 5 mm resolution (equivalent to a 0.5–3-year temporal resolution). RGB sediment colour was calculated from values provided by the SpectraMagic NX software (Konica Minolta) using the R package “farver” (v2.1.1.9, Pedersen et al., 2022) and displayed on an age scale using Grapher (v20, Golden Software).
Hyperspectral imaging was carried out at the Université Rouen Normandie on U-channels previously extracted from the sediment cores in Greifswald. We used a VNIR-PDF hyperspectral camera (SPECIM). Data were processed as described by Jacq et al. (2021) and van Exem et al. (2022). Images have a spatial resolution between 46×46 and ×84 µm2. Normalization was carried out using the ENVI/IDL 5.5/8.2 software. Following van Exem et al. (2022), the spectral index Area600–760 was normalized with the Rmean to account for changes in average reflectance induced by changes in carbonate content.
XRF scanning was carried out at GEOPOLAR (Geomorphology and Polar Research) at the University of Bremen with an XRF core scanner (ITRAX, Cox Analytics) at 2 mm step size (equivalent to a 0.2–1.2-year temporal resolution) with a Mo tube (30 kV, 50 mA, 5 s exposure time). Scanning XRF-derived elemental variations might be influenced by sample geometry, physical properties (e.g. water content, surface roughness, grain size variations), or scanner settings (Croudace and Rothwell, 2010; Weltje and Tjallingii, 2008). To reduce such effects, only elements with less than 5 % zero values (Si, K, Ca, Ti, Mn, Fe, Ni, Cu, Zn, Sr) were centre-log-ratio-transformed (clr) (Aitchison, 1982) using the PAST 4 software (Hammer, 2022).
3.4 Sedimentological and geochemical analyses
Discrete samples were taken at a 1 cm resolution (equivalent to a 1–6-year temporal resolution) using LL channels (Nakagawa, 2014). Loss on ignition (LOI) was determined on freeze-dried samples by heating the sediment to 550 °C for 3 h in a muffle furnace. Residues were used for grain size analysis. For grain size analysis, carbonates were removed with 5 mL HCl (10 %) and samples were dispersed overnight in an overhead shaker with 5 mL sodium pyrophosphate. Measurements were carried out using a laser particle sizer (Fritsch ANALYSETTE 22 MicroTec plus). The first reproducible run of nine subsequent runs was used for interpretation. Grain size statistics were calculated using the GRADISTAT 9.1 software (Blott and Pye, 2001).
Carbonate content was determined on ground and homogenized samples by the Scheibler method on 0.17 to 0.55 g of sample material. Subtracting carbonate content and LOI550 from the total sample weight, the percentage of siliciclastics, which includes a share of silicious algae as revealed by qualitative microscopic analyses on the LOI ash residues, was calculated.
Dried and homogenized sediment samples of 1.8 to 11.3 mg were used to analyse total carbon (TC) and total nitrogen (TN). Concentrations were obtained using a Euro EA CNS analyser. TIC was determined with the IC Kit of the same device and total organic carbon (TOC) was calculated as TOC = TC − TIC. Measurements were calibrated against certified reference materials. Error estimates are based on triple measurements of 18 samples. The precision is 0.77 %–5.25 % for TN, 0.24 %–0.89 % for TC, and 0.68 %–19.19 % for TIC. The molar ratio was calculated based on molecular weights.
3.5 Leaf wax analyses
Leaf wax analyses were carried out at the Physical Geography Department of the Friedrich Schiller University Jena. For this, 1 cm thick samples were taken and pooled with 0.5 cm of sediment above and below the sampling depth. Sample depths were based on significant changes observed in the XRF scanning results. This resulted in a sampling distance of 6 to 63.5 cm (equivalent to a 29–195-year temporal sampling resolution, with samples covering 5–10 years). Total lipids of the sediment samples (2.5 to 9.1 g of dry sediment) were extracted with 40 mL dichloromethane (DCM) and methanol (MeOH) (, ) using an ultrasonic bath over three 15 min cycles. The total lipid extract was separated by solid-phase extraction using aminopropyl silica gel (Supelco, 45 µm) as the stationary phase. The n-alkanes were eluted with 4 mL hexane and further purified using silver nitrate (AgNO3−; Supelco, 60–200 mesh). An Agilent 7890 gas chromatograph equipped with an Agilent HP5MS column (30 m, 320 µm, 0.25 µm film thickness) and a flame ionization detector (GC-FID) was used for identification and quantification of the n-alkanes relative to external n-alkane standards (n-alkane mix n-C21–n-C40; Supelco).
Compound-specific stable hydrogen isotope analyses were carried out for the n-alkanes C23 to C31 using an IsoPrime vision IRMS coupled to an Agilent 7890A GC via a GC5 interface operating in pyrolysis mode with a MaxChrome and silver-wool-packed reactor at 1050 °C. The GC was equipped with a 30 m fused silica column (HP5-MS, 0.32 mm, 0.25 µm). Samples were injected splitless with a split–splitless injector and each sample was analysed in triplicate. δ2Hn-alkane was measured against calibrated H2 reference gas and all values are reported in per mille against VSMOW. The precision was checked by co-analysing a standard alkane mixture (n-C27, n-C29, n-C33) with known isotope composition (Arndt Schimmelmann, Indiana University), injected in duplicate every nine runs. All measurements were corrected for drift relative to the standard values in each sequence. n-C23 to n-C31 were abundant in sufficient amounts for compound-specific hydrogen analyses, but we will focus on δ2H in the following. Triplicates for the δ2H had a standard deviation of <3.3 ‰, and the analytical error for the standard duplicates was <1.1 ‰ (n=9). The H factor was checked every 2 d and stayed stable at 3.59±0.08 (n=3) during the measurements.
3.6 Pollen analyses
Altogether, 89 samples (1 cm thickness, 1–2 cm3) were taken in a 4 to 16 cm sampling distance (equivalent to an 11–80-year temporal sampling resolution between samples, with 1 cm thick samples covering 1–6 years). Samples were treated with 10 % hydrochloric acid (HCl) to dissolve carbonates, heated in 10 % potassium hydroxide (KOH) to remove humic compounds, and finally soaked in 40 % hydrofluoric acid (HF) for at least 24 h to remove the mineral fraction. Preparation was followed by acetolysis (Berglund and Ralska-Jasiewiczowa, 1986). Sample slides were analysed using an ECLIPSE 50i upright microscope and counted to at least 500 AP (arboreal pollen) grains. Pollen taxa were identified using atlases (Beug, 2004; Moore et al., 1991) and the reference grains owned by the Institute of Geoecology and Geoinformation, Adam Mickiewicz University, Poznań. Pollen percentages were calculated according to the following formula: taxon percentage = (number of taxon grains / TPS) × 100 %, where TPS indicates the total pollen sum including the AP and non-arboreal pollen (NAP) taxa and excluding the local and spore-producing plants.
3.7 Diatom analyses
For diatom analysis, 91 samples (1 cm thickness, 1–2 cm3) were taken at the same sampling resolution as the pollen analyses (4 to 16 cm sampling distance, equivalent to an 11–80-year temporal sampling resolution between samples, with 1 cm samples covering 1–6 years). Approximately 1 g of sediment was treated with HCl, H2O2, H2SO4, and KMnO4 as described by Kalbe and Werner (1974). Residues were mounted on slides with Naphrax® to study them with a light microscope (Zeiss Axio Scope, oil-immersion plan-apochromatic objective, magnification 1000×, numerical aperture 1.4). At least 450 diatom valves were counted for each sample. Diatom species identification and classification as eutraphentic diatoms followed Krammer and Lange-Bertalot (1986, 1988, 1991a, b), Krammer (1997a, b, 2000, 2002, 2003), Lange-Bertalot (2001), and Lange-Bertalot et al. (2011, 2017). The abundance of eutraphentic diatoms was calculated as proposed by Adolph et al. (2023).
3.8 Statistics
Similar sedimentological and geochemical composition intervals were established using a stratigraphically constrained cluster analysis on clr-transformed XRF data and sedimentological parameters. XRF data were scaled to a 1 cm resolution by calculating the mean for each centimetre to account for differences in resolution and noise between XRF scans and sedimentological data. Calculations were carried out using the R package “rioja” (v. 1.0.5) (Juggins, 2022). As the cluster analysis did not cover some changes or would have resulted in too many clusters, we included additional unit boundaries based on visual inspection (units C1 to C2 as well as D1, D2, and D3). Pearson's r values were calculated with the R package “Hmisc” (v. 5.0-1; Harrell, 2023) (Fig. S1 in the Supplement). Values with p<0.001 were considered significant and are mentioned in the text.
4.1 Lithology, chronology, and sedimentation rate
Based on the hierarchical constrained cluster analysis, the 897.5 cm long sediment sequence was divided into six major lithological units (A–F; Fig. 2). Unit C was subdivided into C1 and C2 based on changes in Ticlr (Fig. 3) and D into three subunits (D1–D3) based on variations in the organic matter content (Fig. 2). Generally, boundaries between units are mainly characterized by colour changes (Fig. 2), with lighter colours representing an increased carbonate content and darker colours an increased organic matter content (Fig. 2). Organic-rich sediment occurs from 878.5–844.5 cm sediment depth (30 %–65.5 % organic matter, unit B) and is similar in unit D2 (20.3 %–38.8 % organic matter; Fig. 2). In contrast, carbonate content is highest in unit C (69.8 %). Otherwise, the sediment is composed of siliciclastic material, which includes a share of diatoms and other silicious algae and is somewhat increased above 752.5 cm sediment depth marking the boundary between unit C1 and C2 (Fig. 2).
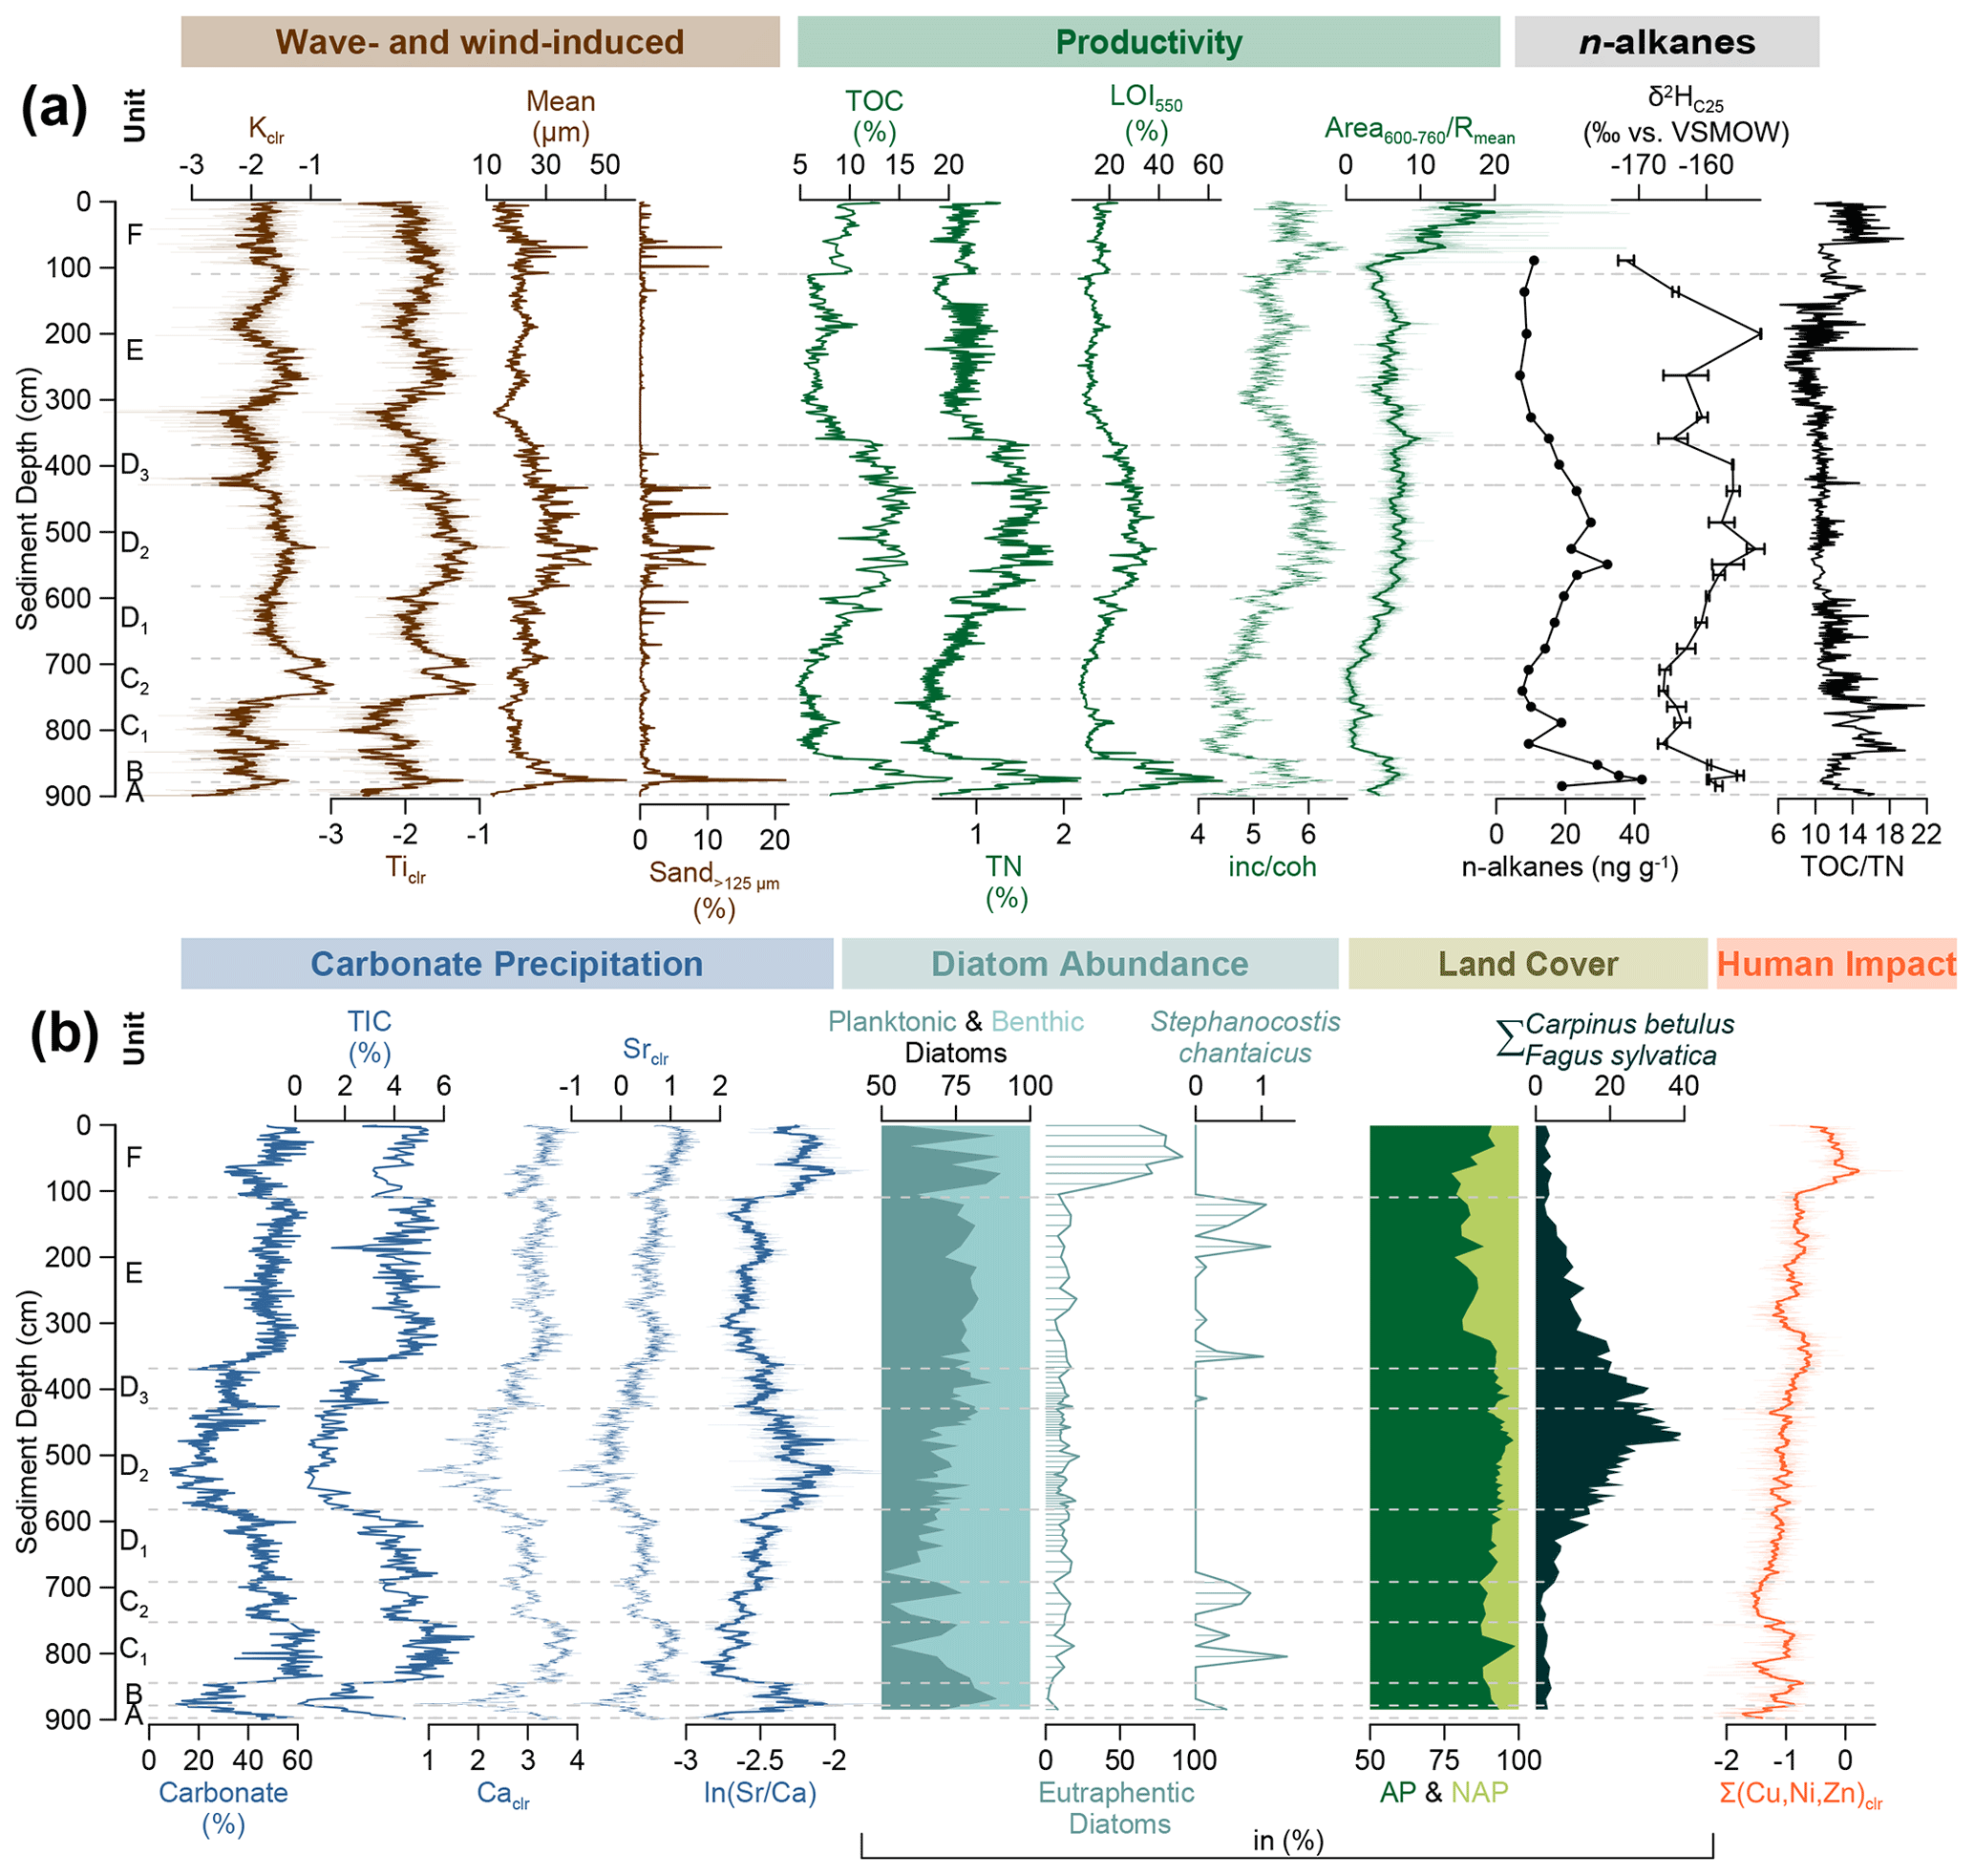
Figure 3Sedimentological, geochemical, spectral, and micropaleontological characteristics of sediment sequence SAS21. (a) Wave- and wind-induced processes (brown lines) are represented by potassium (Kclr), titanium (Ticlr), grain size mean, and sand fraction > 125 µm (Sand>125 µm). Productivity (green lines) is shown by total organic carbon (TOC), total nitrogen (TN), loss on ignition 550 °C (LOI550), the inc coh ratio, and chlorophyll a and its derivates (area, 101-point running average). The n-alkanes and their isotopic signatures are exemplary (δ2H of nC25). (b) Carbonate precipitation (blue lines) is represented by the carbonate content, total inorganic carbon (TIC), calcium (Caclr), strontium (Srclr), and the ratio. Diatom abundance is represented by the percentage of planktonic (teal area) and benthic (light blue area) diatoms, the abundance of eutraphentic diatoms indicating eutrophication, and the under-ice blooming diatom Stephanocostis chantaicus. Land cover changes are indicated by palynological investigations represented by the arboreal pollen (AP) and non-arboreal pollen (NAP) (dark green vs. lime green area) as well as summed Carpinus betulus and Fagus sylvatica (very dark green area) percentages. Human impact is represented by ∑ (Cu, Ni, Zn) (orange line). XRF data (Ti, K, inc coh, Ca, Sr, and ∑ (Cu, Ni, Zn)) are shown at a 2 mm resolution and as a 9-point running average.
Bayesian age–depth modelling gave a basal mean age of 3070 cal BP for the bottommost sample considered for interpretation in this contribution (897.5 cm). All ages are in stratigraphic order and overlap with the 95 % confidence interval of the age–depth model (Fig. 2). The topmost age is determined by the recovery of the short sediment surface core taken in July 2022. Total 210Pb activity reached values close to equilibrium at 65 cm sediment depth. The concentration of the artificial radionuclide 137Cs has a well-defined peak at 29–28 cm, suggesting that this peak records fallout from the 1986 Chernobyl accident (Fig. 2). As the peak is well-resolved, it suggests relatively little sediment mixing within this core. A smaller and less distinct peak at 45–44 cm may record the fallout peak in the early 1960s from the atmospheric testing of nuclear weapons. The sedimentation rate is 2–3 mm a−1 between 897.5 cm (3070 cal BP) and 298 cm (620 cal BP) (Fig. 2) and increases to 4 mm a−1 at 56 cm (7 cal BP). Above 56 cm (7 cal BP) the record yields a much higher sedimentation rate of 5–10 mm a−1.
4.2 Sediment composition
Ticlr and Kclr show a significant positive correlation (r=0.79; Figs. 3 and S1). Ticlr is partly in agreement with grain size means (r=0.54), which is mostly related to variations in sand content (r=0.94). However, not all Ticlr maxima are reflected in grain size mean. Grain size means range from 11.56–56.98 µm with maximum values at the transition from unit A to B and in units D2 and F (Fig. 3). Maximum grain size mean is characterized by Sand>125 µm up to 21.5 % (Fig. 3).
Parameters for organic matter content, LOI550, TOC, TN, and inc coh, are significantly correlated (r>0.70; Fig. S1), ranging from 8.1 % to 65.5 %, 4.6 % to 20.3 %, and 0.07 % to 2.2 %, respectively. All agree visually well with in situ chloropigments (Area600–760; Fig. 3). Additionally, is significantly correlated with e.g. inc coh (r=0.80) or LOI550 (r=0.62; Fig. S1). Organic matter parameters are highest in units B and D2 and minimal in units C and E (Fig. 3). is mostly <12, ranging 6.2–21.6 with higher values in units C1 and F. Minimum values are observed in unit E (Fig. 3). The individual and summed (C21–C35) n-alkane concentrations correlate with the organic matter parameters of Schweriner See (r>0.80; Figs. S1 and S2). The n-alkane concentration ranges from 6.9 to 42.1 ng g−1, with maximum values in units B and D2 and minimum values in units C2 and E (Fig. 3). δ2H shows a similar pattern as δ2H and ranges from ‰ to ‰, being minimal in units C and F and having maxima in units B, D2, and E (Figs. S2 and 3). Ca, Sr, and TIC are significantly correlated with each other but are negatively correlated with LOI550, TOC, TN, and inc coh (). Consequently, values are lowest in units B and D2 and highest in units C and E with TIC and carbonate values ranging from 0.1 % to 7.2 % and 8.4 % to 69.8 %, respectively (Fig. 3).
Diatom abundance is characterized by planktonic diatoms between 50.6 % and 90.1 %, with maximum values in units B and F and minimum values between units B and C (Fig. 3). Eutraphentic diatoms range from 1.4 % to 22.5 % in units A–E. Above, they increase up to 92.1 % in unit F (Fig. 3). ∑ (Cu,Ni,Zn)clr is correlated with eutraphentic diatoms (r=0.63; Fig. S1). The diatoms species S. chantaicus Genkal & Kuzmina occurs only in units C and E concurrently with minima in the organic matter content (Fig. 3). Pollen composition is characterized by a dominance of arboreal pollen (AP) between 77.37 % and 98.91 %, with maxima in units C1 and D2 and minima in units E and F. ∑ (Carpinus betulus, Fagus sylvatica) ranges between 1.3 % and 39 % with a maximum in unit D2 and minimum values in units A–C2 and F (Fig. 3).
5.1 Organic matter and δ2H as indicators for NAO-related hydroclimatic variability
5.1.1 Organic matter as an indicator for winter temperature variability
Traditionally parameters for organic matter content in lake sediments (e.g. LOI550, TOC, TN, and inc coh) are interpreted as indicators of changes in organic matter preservation and/or in-lake productivity (e.g. Dräger et al., 2017; Hodell and Schelske, 1998). LOI550, TOC, TN, and inc coh are significantly correlated with each other but significantly negatively correlated with parameters indicating carbonate precipitation (Ca, Sr, and TIC; Haberzettl et al., 2005, 2009, 2019). This suggests that one suite of parameters dilutes the other. Organic matter parameters agree visually well with in situ chloropigments (Area600–760; Fig. 3), which are indicative of past primary productivity (van Exem et al., 2022). Additionally, is mostly <12, which suggests a dominance of nonvascular aquatic plants with only a small contribution of vascular plants (Meyers and Ishiwatari, 1993). Therefore, we consider the organic matter content to be an indicator for in-lake productivity. This is supported by the significant correlations between the ratio and organic matter parameters. The ratio suggests changes in the carbonate precipitation mechanism between biogenic calcite precipitation (higher ) and inorganic calcite precipitation (lower ) because biogenically precipitated calcite has higher Sr contents than inorganically precipitated calcite (Hodell et al., 2008). These phases of increased biogenic calcite precipitation coincide with phases of higher organic matter content, which supports our conclusion that organic matter content is driven by in-lake productivity rather than being a preservation signal (Fig. 3). Moreover, this suggests that inorganic carbonate precipitation might be the background sedimentation at the coring location, which is diluted by changes in productivity. However, biogenically induced calcite precipitation during high-productivity periods may have additionally enhanced the organic matter preservation (Hodell and Schelske, 1998).
Often, changes in in-lake productivity are related to changes in temperature and/or nutrient availability (Kasper et al., 2013; Günther et al., 2016; Doberschütz et al., 2014). At Schweriner See, the abundance of eutraphentic diatoms is indicative of increased nutrient availability and correlates with ∑ (Cu,Ni,Zn)clr, which both suggest an anthropogenic forcing, namely eutrophication and contamination (Adolph et al., 2023). However, since the abundance of eutraphentic diatoms (Fig. 4) suggests increased nutrient availability only after 105 cal BP (unit F; Fig. 4), we consider a major anthropogenic forcing on the in-lake productivity to have been negligible before. We rather suggest that productivity was driven by temperature variability (units A–E). The influence of temperature variations on in-lake productivity is supported by the repeated occurrence of the diatom species S. chantaicus during low-productivity phases (Fig. 4). S. chantaicus grows underneath the ice cover and is associated with long-lasting ice cover duration until the spring months (Scheffler and Padisák, 2000). Such long-lasting ice cover under colder winter conditions may substantially affect the seasonal heat budget, timing, and length of stratification but also the productivity of aquatic ecosystems (e.g. Bonsal et al., 2006) because long-lasting ice cover delays the onset of the growing season and/or reduces water temperatures. This results in reduced productivity of the lake system. In contrast, during milder winter temperatures the growing season may start earlier and surface water temperatures may already be increased, which prolongs the growing season and results in higher productivity of the lake system. Based on the sample thickness for diatom analysis of 1 cm, which covers 1–6 years depending on the sedimentation rate, it is not possible to distinguish between individual years. However, the regular occurrence of S. chantaicus suggests that it is not triggered by single events but rather by long-lasting changes in environmental conditions. This is also supported by long-lasting phases of lower in-lake productivity during which S. chantaicus occurs (units C and E; Fig. 4).
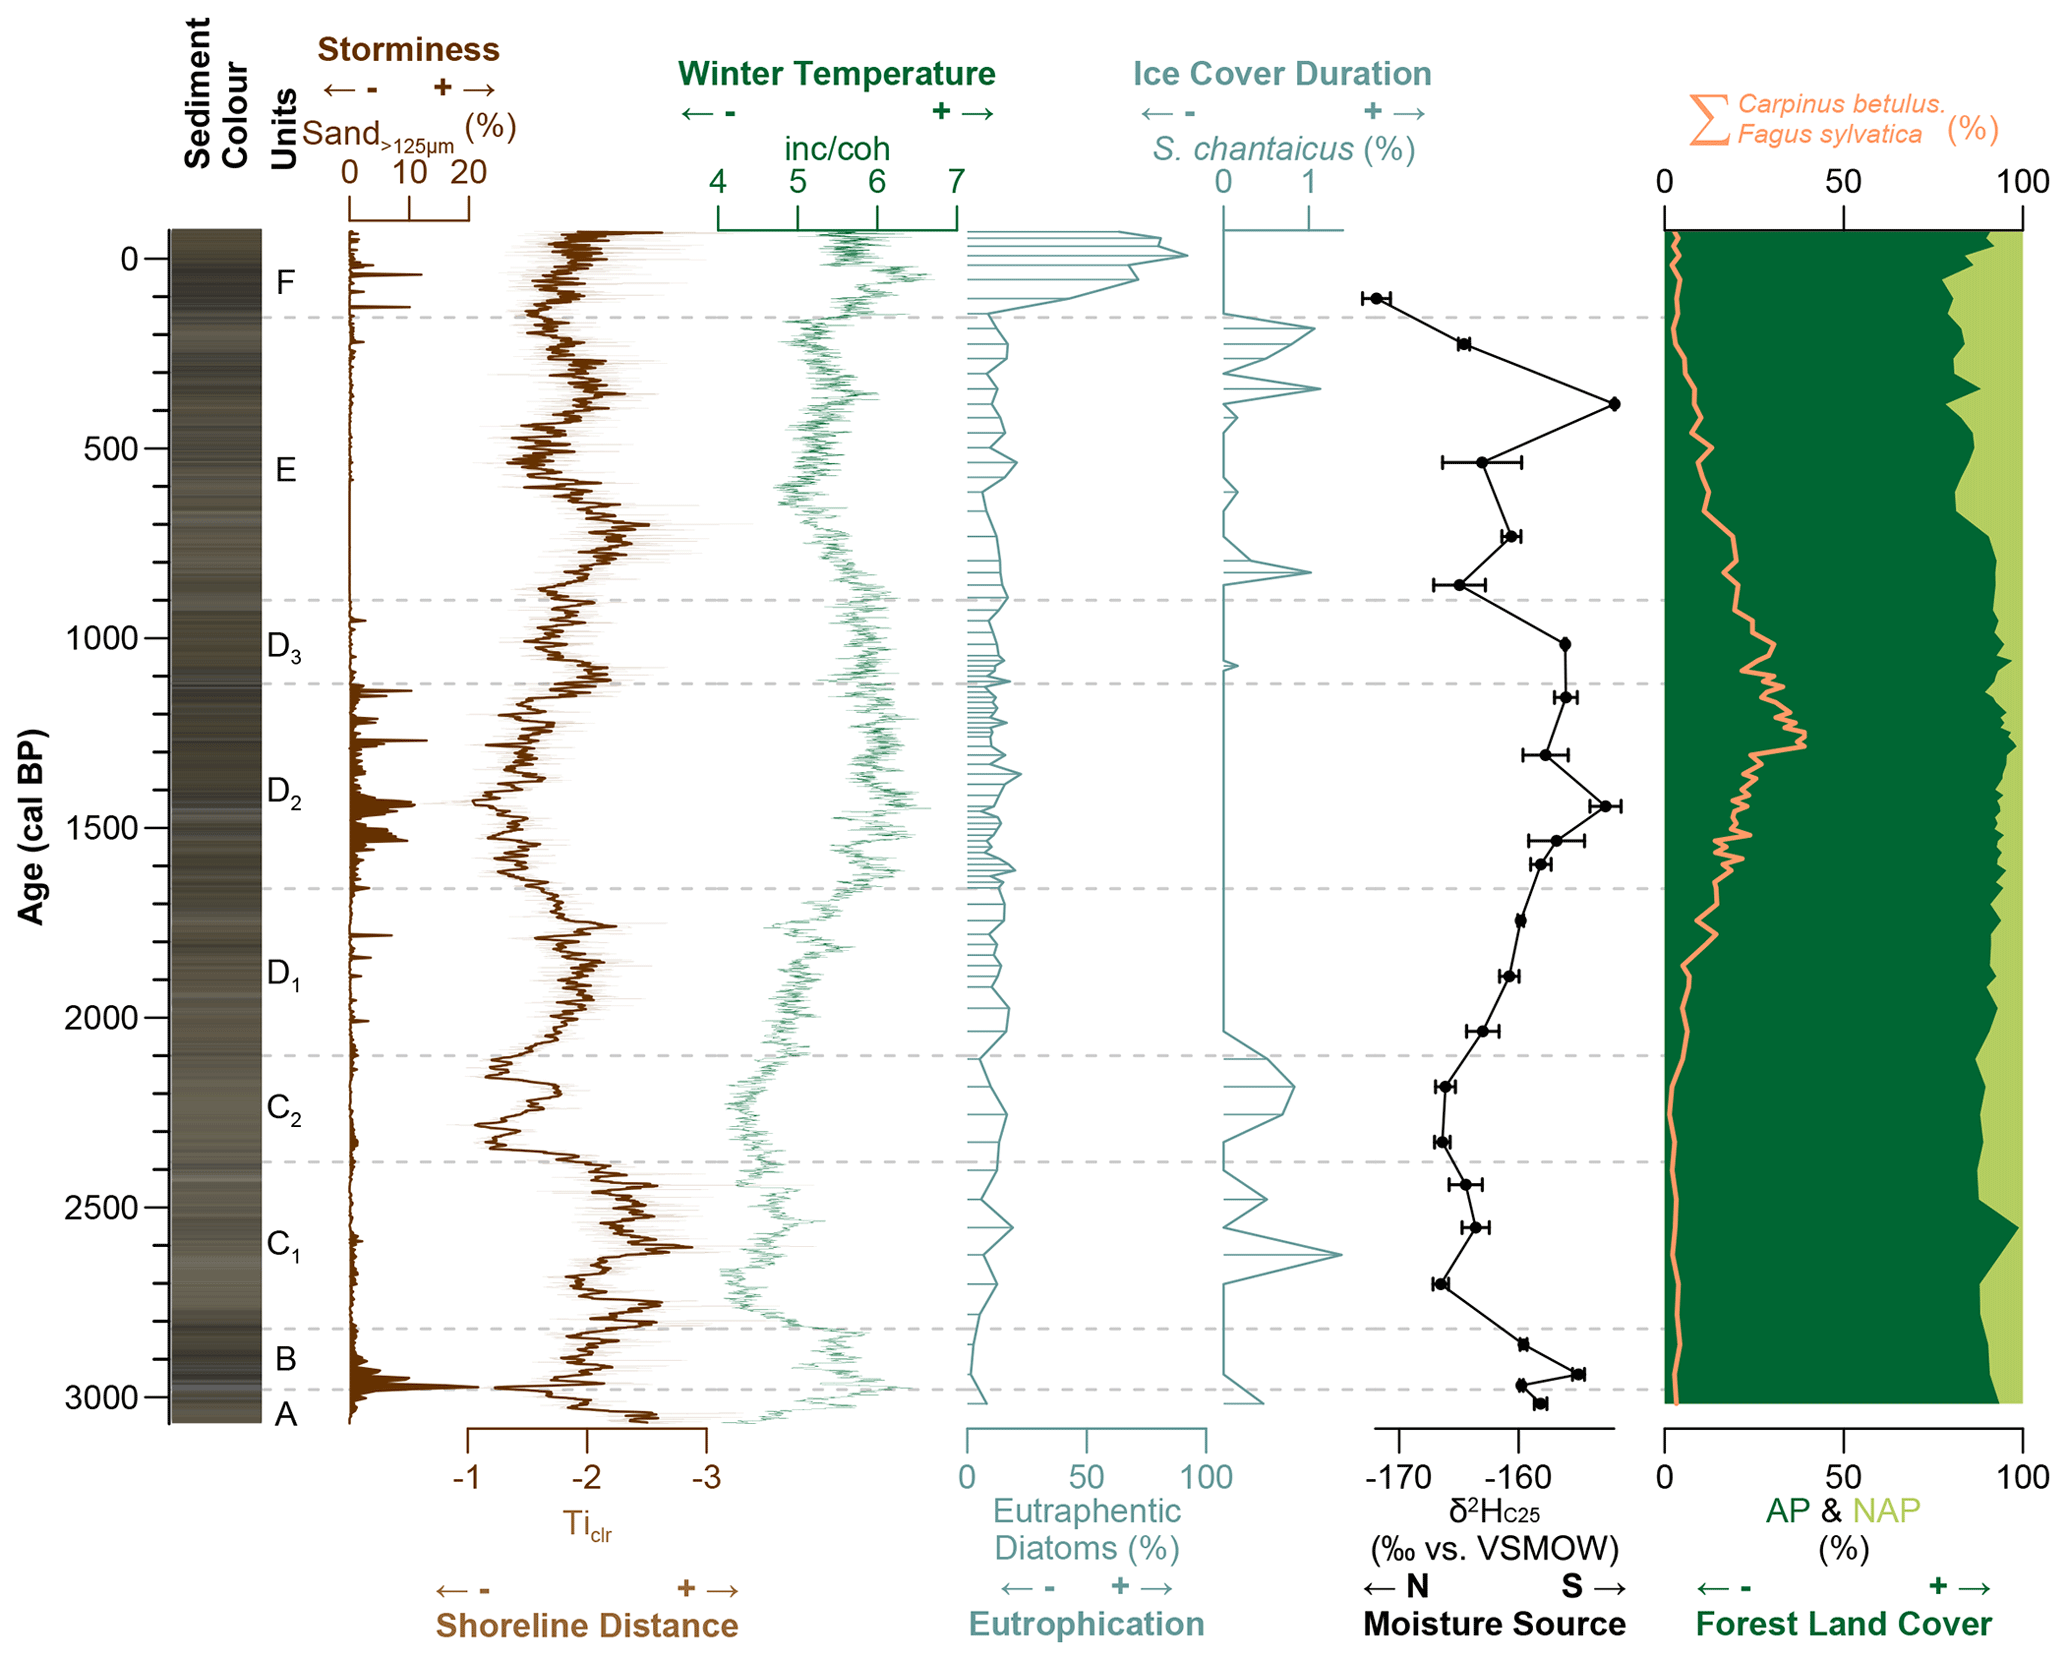
Figure 4Stratigraphic diagram of the past 3070 cal BP of SAS21 plotted on an age scale showing sediment colour as an indicator for lithological changes. Sand>125 µm indicates changes in wave energy and, thus, storminess. Ticlr (9-point running average, brown line) indicates paleo-shoreline distance and inc coh (green line) productivity, which is influenced by winter temperature variability. Eutraphentic diatoms represent the trophic state based on nutrient supply to Schweriner See, which only increases after 105 cal BP (unit F). The diatom species Stephanocostis chantaicus (teal line) is strictly associated with ice cover duration (Scheffler and Padisák, 2000) and occurs in phases of low productivity. δ2H indicates changes in the moisture source region. Land cover is shown by the relation between the arboreal pollen (AP) and non-arboreal pollen (NAP) (dark green vs. light green area). Additionally, changes in the forest composition are represented by the sum of Carpinus betulus and Fagus sylvatica (orange line) indicating milder and moister conditions.
Therefore, we suggest that before 105 cal BP in-lake productivity was mainly driven by winter temperature variability modulating ice cover duration and, consequently, heat budget and growing season length (e.g. Schmidt et al., 2019; Bonsal et al., 2006; Blenckner et al., 2007). In the following, inc coh as an organic matter indicator is used as a winter temperature signal because this parameter has the highest temporal resolution (Fig. 4).
5.1.2 δ2H as indicators for moisture source changes and/or evaporative enrichment
Lacustrine sediments generally contain a mixed signal from terrestrial and aquatic sources, which can be distinguished by the n-alkane chain-length distribution (e.g. Strobel et al., 2021; Ficken et al., 2000). Classically, long-chain n-alkanes (e.g. C27–C31) are suggested to be produced as leaf waxes by higher terrestrial plants and primarily incorporate the local growing season precipitation as their primary source water for photosynthesis (e.g. Sachse et al., 2012; Strobel et al., 2020, 2022a). However, the δ2H signal of precipitation mainly depends on the atmospheric moisture source of the precipitation in the mid-latitudes (Strobel et al., 2020, 2022b; Bliedtner et al., 2020; Wirth and Sessions, 2016). Additional fractionation processes can occur at the plant–soil interface, with the evaporation of soil water and transpiration of leaf water being prominent factors (Feakins and Sessions, 2010; Kahmen et al., 2013; Zech et al., 2015). In contrast, short-chain n-alkanes are produced by aquatic macrophytes and algae (e.g. C21–C25) and incorporate the δ2H signal of the lake's water, which integrates the δ2H precipitation signal throughout the year. Depending on the morphometric and hydrological parameters of the lake itself, lake water can be strongly modulated by evaporative lake water enrichment (e.g. Aichner et al., 2022; Mügler et al., 2008; Sachse et al., 2004; Strobel et al., 2022a). Notably, this classic n-alkane source attribution (terrestrial vs. aquatic) is not always trivial because, for example, aquatic emergent plants can also synthesize distinct quantities of long-chain n-alkanes (≥ C27). These also incorporate the δ2H signal of the lake's water, challenging the interpretation of the δ2H signal (Ficken et al., 2000; Yang and Bowen, 2022).
The correlations between individual and summed (C21–C35) n-alkane concentrations with the organic matter parameters of Schweriner See indicate a predominance of in situ aquatically derived n-alkanes (e.g. Strobel et al., 2022b; Sachse et al., 2004). This is supported by the ratio mostly being <12 and therefore indicating the dominance of nonvascular aquatic plants with only a small contribution of vascular plants (Meyers and Ishiwatari, 1993). The comparable pattern of compound-specific isotopic hydrogen signatures (δ2H) of the n-alkanes C23 to C31 (Fig. S2) further indicates a predominant aquatic origin of the n-alkanes (e.g. Strobel et al., 2022b; Sachse et al., 2004). We therefore suggest that the majority of the n-alkanes are of aquatic origin. Although the compound-specific δ2H of all detectable n-alkanes shows a comparable pattern, mixing can complicate the interpretation of the longer-chained n-alkanes. Therefore, we will focus on δ2H of C25 (δ2H) in the following because C25 and its δ2H signal provide the most robust aquatic end-member.
δ2H is more enriched during periods of milder winter temperatures (units A–B and D) and more depleted during periods of colder winter temperatures (units C and E; Fig. 4), which can be explained by the following two factors: (i) since the aquatically derived δ2H primarily reflects δ2H of the lake's water and year-round precipitation, Schweriner See's position in the mid-latitudes suggests that δ2H is mostly related to moisture source changes in the North Atlantic region. More enriched δ2H values may therefore correspond to isotopically enriched southern–central North Atlantic moisture sources (Fig. 1a). In contrast, more depleted δ2H values originate from isotopically depleted moisture sources from the northern North Atlantic and/or Arctic region (e.g. Baldini et al., 2008). Still, (ii) enriched δ2H could also result from temperature-driven evaporative lake water enrichment, as frequently reported from semi-arid regions (Mügler et al., 2008; Strobel et al., 2022a), with a higher evaporative lake water enrichment during warmer temperatures and a lower evaporative lake water enrichment during colder temperatures.
5.1.3 NAO variability during the past 3000 years on an interregional scale
Distinct variations in winter temperatures, moisture source region, and/or evaporative lake water enrichment (Fig. 5) are mainly modulated by the North Atlantic Oscillation (NAO) in the North Atlantic region (Hurrell and Deser, 2009). We observe four distinct time slices at Schweriner See: (i) from 3030 to 2820 cal BP (unit A–B; Fig. 4) and 2110 to 830 cal BP (unit D; Fig. 4), milder winter temperatures, a southern moisture source region in the southern–central North Atlantic, and/or a higher evaporative lake water enrichment indicate NAO+ conditions. On the contrary, (ii) from 2820 to 2110 cal BP (unit C; Fig. 4) and 830 to 105 cal BP (unit E; Fig. 4) colder winter temperatures, a northern moisture source in the northern North Atlantic and/or Arctic regions, and/or lower evaporative lake water enrichment correspond to NAO− conditions. Rates of changes between positive and negative NAO conditions vary between the individual phases, e.g. with a rapid drop in winter temperature around 2820 cal BP but a gradual increase from 2110 to 1720 cal BP (Fig. 5).
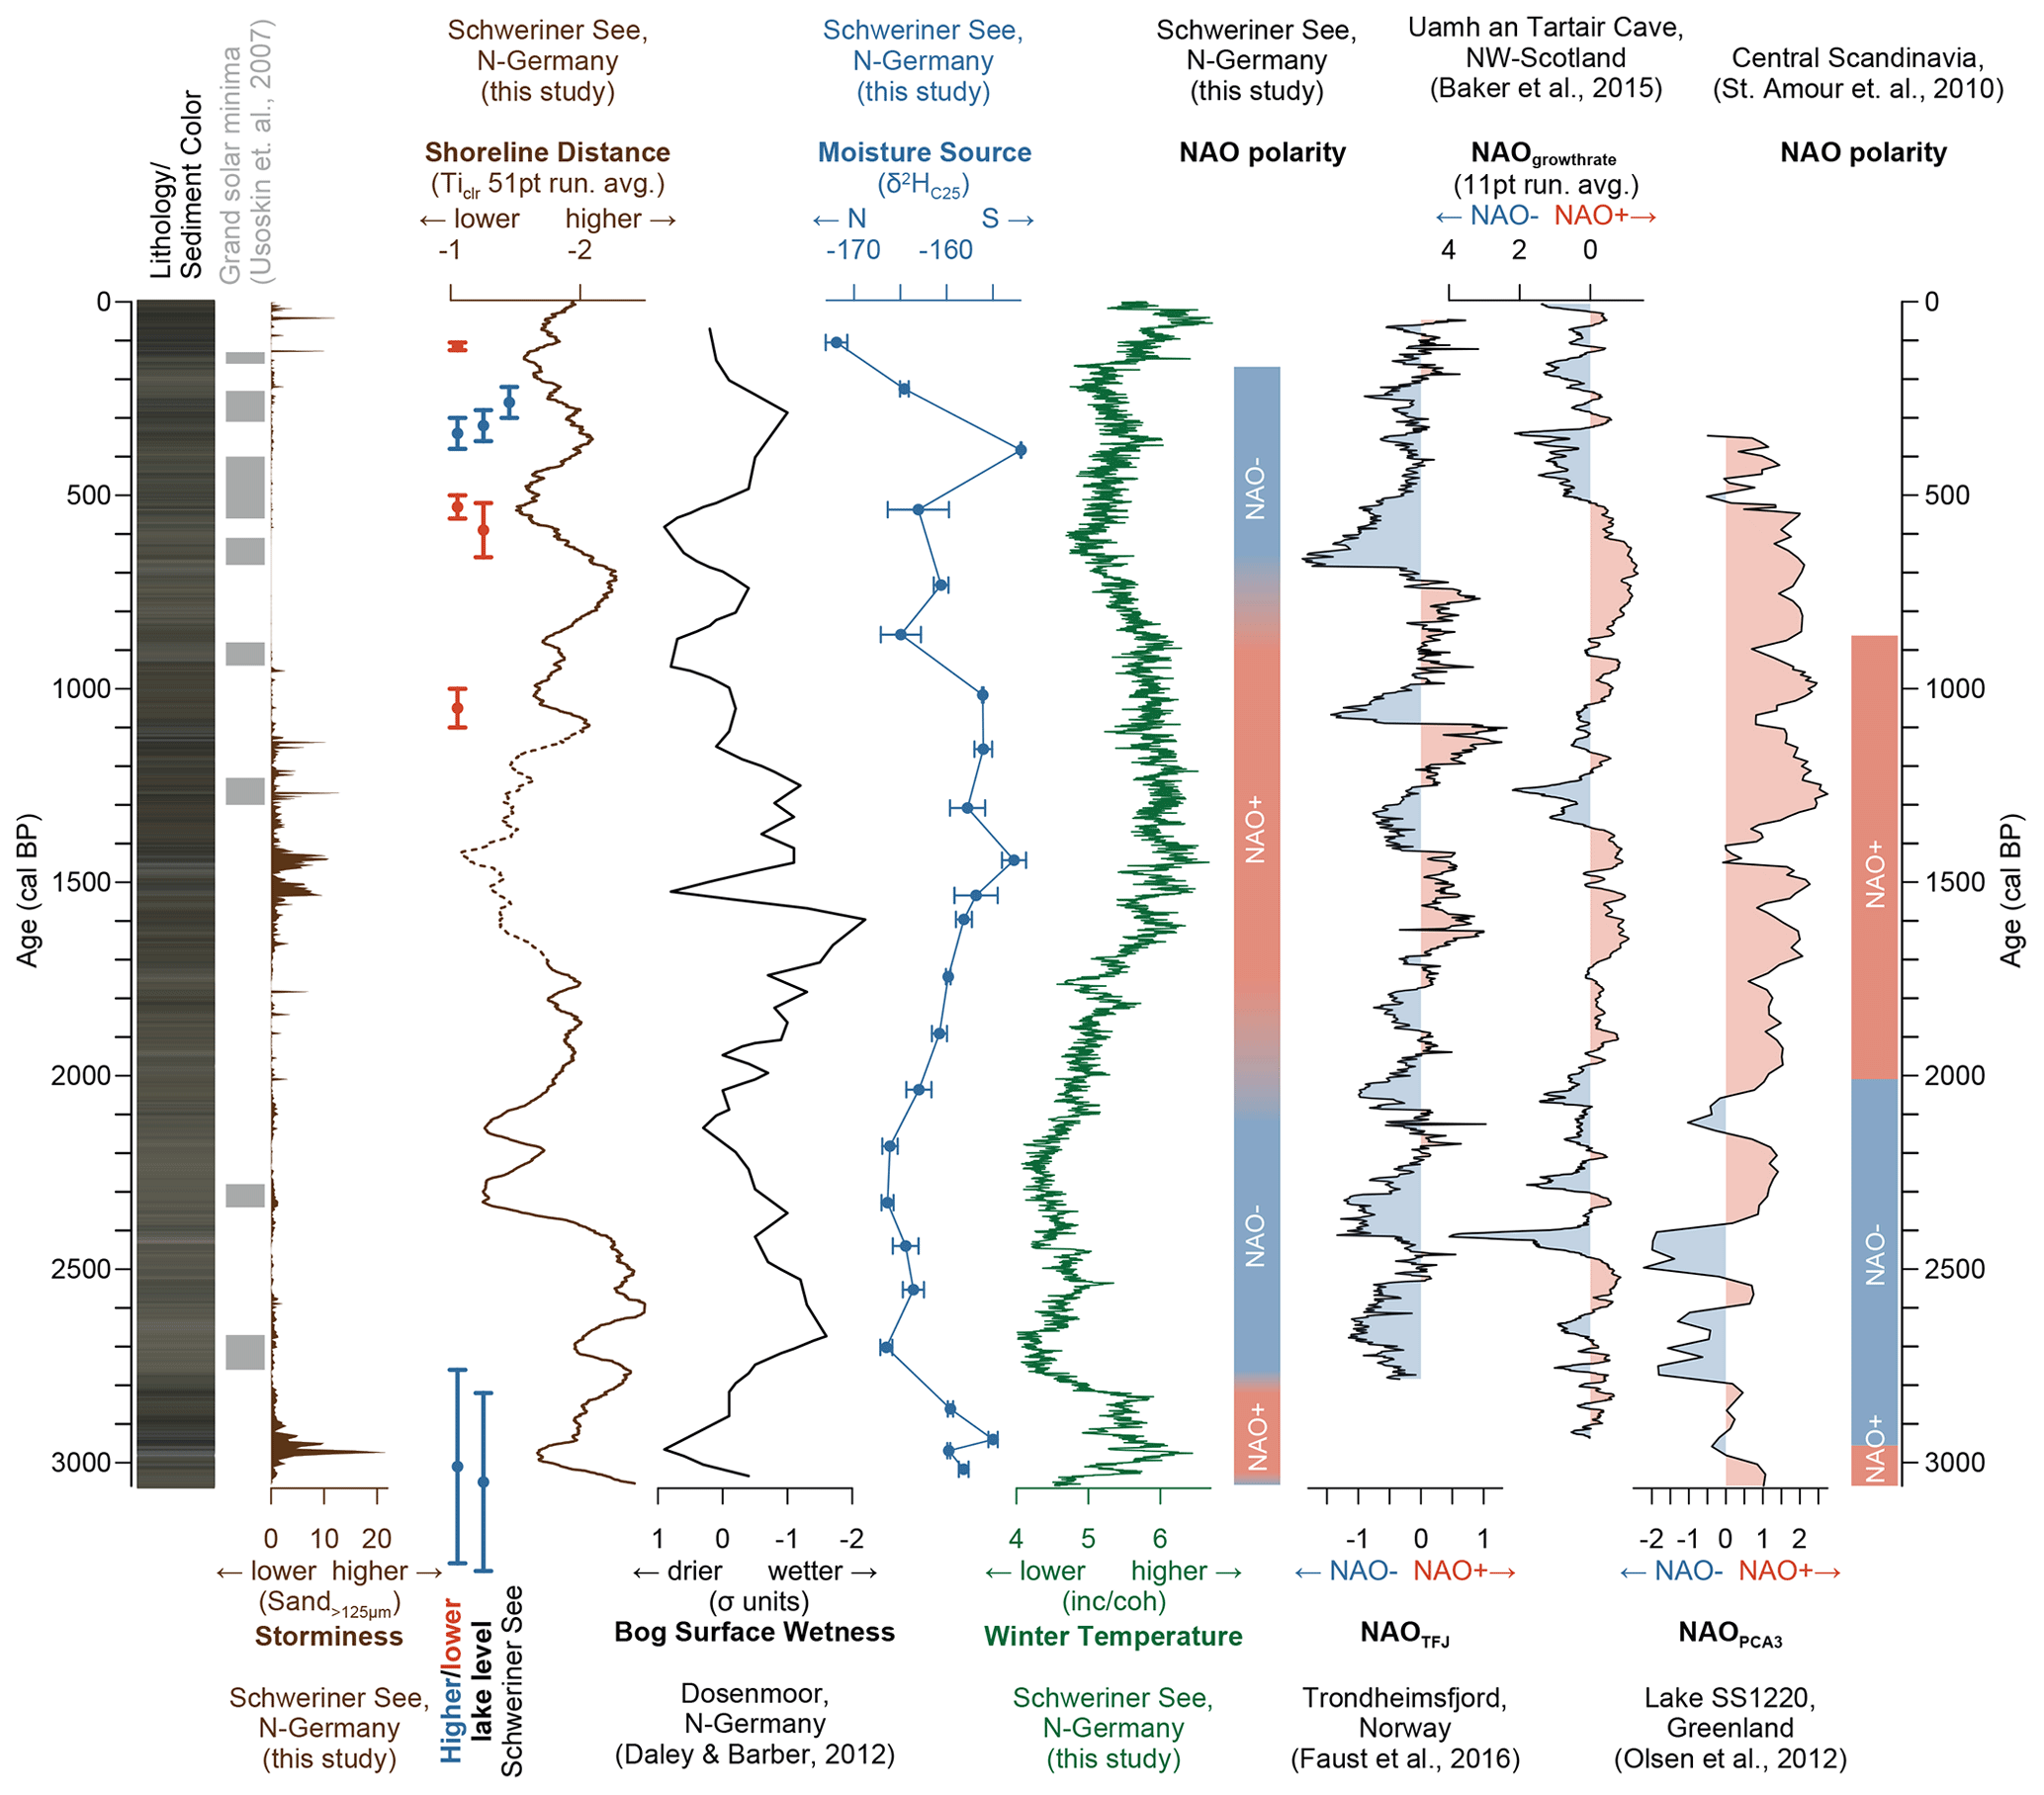
Figure 5Comparison of a (hydro)climatic reconstruction from Schweriner See with different archives, solar minima (Usoskin et al., 2007), and storminess. Phases of higher or lower lake levels of Schweriner See inferred from (paleo-)lacustrine landforms, archaeological findings, and historical documents are shown in blue and red (Adolph et al., 2022; Lorenz et al., 2017; Konze, 2017; Umweltministerium Mecklenburg-Vorpommern, 2003), which agree with changes in shoreline distance (brown line, 51-point average) inferred from Ticlr (this study) and hydroclimatic reconstructions from Dosenmoor (Daley and Barber, 2012) differentiating between drier and wetter conditions. Please note the reversed axis for both parameters. Moisture source region variations modulated by NAO variations are inferred from δ2H, with more depleted values suggesting a northwards displacement and/or a lower evaporative enrichment and, on the contrary, more enriched values suggesting a southwards displacement and/or higher evaporative enrichment. These variations coincide with variations in winter temperature as inferred from productivity (inc coh values, green line). NAO time slices were inferred from distinct changes in δ2H and inc coh. Hydroclimatic variations are compared to NAO reconstructions from Norway (Trondheimfjord: TJF; Faust et al., 2016), NW Scotland (stalagmite growth rate; Baker et al., 2015), Greenland (PCA3 of PCA; Olsen et al., 2012), and central Scandinavia (inferred lake water δ18O records of Lake Spåime and Lake Svartkalstjarn; St. Amour et al., 2010), showing a similar NAO variability over the last 3000 years.
Paleoenvironmental reconstructions from other NAO-sensitive records from Greenland (Olsen et al., 2012), Norway (Faust et al., 2016), Scotland (Baker et al., 2015), and Sweden (St. Amour et al., 2010) are in good agreement with signals from our record (Fig. 5). Similarly, NAO+ conditions were inferred from 3030 to 2820 cal BP for central Scandinavia (St. Amour et al., 2010) and Greenland (Olsen et al., 2012) (Fig. 5). Subsequent NAO− conditions from 2820–2110 cal BP corresponding to predominantly NAO− conditions were reconstructed in all NAO-sensitive records used for comparison (Fig. 5). Such NAO− conditions coincide with an overall shift to cooler and/or wetter and/or windier conditions around 2800 cal BP (2.8 ka event) in the North Atlantic region (e.g. Engels et al., 2016; Martin-Puertas et al., 2012; Rach et al., 2017; van Geel et al., 2000, 2014; Mellström et al., 2015; Harding et al., 2023; Martínez Cortizas et al., 2021). These climatic shifts are widely attributed to changes in solar activity, namely the Homeric Minimum (∼2800–2550 cal BP; Reimer et al., 2020), whose onset is within the error range of observed cooler conditions at Schweriner See (2820 cal BP). These changes in solar activity triggered rapid climate change and likely changes in atmospheric circulation patterns. Some studies associate solar minima with shifts to NAO− conditions (e.g. Shindell et al., 2001; Gray et al., 2016), as observed in this study at Schweriner See. Other studies suggest a weakening of the subpolar gyre, resulting in changes in the atmospheric circulation by more frequent and persistent atmospheric blocking (Moffa-Sánchez et al., 2014), which would mirror NAO− conditions. Sjolte et al. (2018) suggest a complex response to solar minima, which is not directly linked to the NAO but rather to the eastern Atlantic pattern with increased mid-Atlantic blocking and shifts to intensifying northerly winds. These changes resemble NAO− conditions. Such shifts in the eastern Atlantic pattern during solar minima are supported by Harding et al. (2023) for the North Sea region. Yet, at Schweriner See negative NAO conditions are inferred until 2110 cal BP and thus prevail beyond the Homeric Minimum. Contemporaneously, dominating northerly to easterly winds are reported from 2550 to 2050 BP as determined by optically stimulated luminescence (OSL) for the nearby Darss area (ca. 110 km northeast of Schweriner See; Lampe and Lampe, 2018), which are also commonly associated with NAO− conditions in NE Germany. Similarly, cooler conditions are observed at nearby Rugensee for 2800–1650 cal BP (Dreßler et al., 2011), both confirming extended NAO− conditions beyond the Homeric Minimum in NE Germany.
The shift to NAO+ conditions from 2110 to cal BP coincides with the Roman Warm Period (RWP, ca. 2150–1550 cal BP), which was a period of general warmth in Europe (Lamb, 2013). Similar shifts to NAO+ conditions were reconstructed from archives from Scotland (Baker et al., 2015), Norway (Faust et al., 2016), and central Scandinavia (St. Amour et al., 2010) (Fig. 5). Considering chronological uncertainties, this is also in agreement with NAO reconstructions from Greenland (Olsen et al., 2012) for which a predominantly stable NAO+ was suggested from 2000 to 550 cal BP.Contemporaneously we observe a shift in forest composition with an expansion of beech (Fagus sylvatica) and hornbeam (Carpinus betulus) at Schweriner See (Figs. 3 and 4). This was most likely induced by overall milder and moister winter conditions leading to optimal growing conditions (e.g. Bradshaw et al., 2010). However, anthropogenic activities, e.g. soil changes, cannot be excluded (Giesecke et al., 2017).
Predominantly NAO− conditions between 830 and 105 cal BP are contemporaneous with a long-term cooling trend associated with repeated phases of volcanic-solar downturns in Europe (PAGES 2k Consortium, 2013). Compared to the previous NAO− phase, this period shows a stable low winter temperature but repeated shifts to a northern moisture source region and/or low evaporative lake water enrichment, e.g. around 860 and 540 cal BP. Considering chronological uncertainties, both shifts might align with solar minima, i.e. the Oort (940–880 cal BP) and Spörer (560–400 cal BP) solar minima (Usoskin et al., 2007). From 800 to 500 BP (OSL), NAO− conditions are supported by frequent strong winds from the northern and eastern directions in the Darss area (Lampe and Lampe, 2018). After 105 cal BP, the temperature signal inferred from the organic matter is likely masked by eutrophication driving in-lake productivity (Adolph et al., 2023), which prevents us from linking our NAO reconstruction to recent monitoring data (e.g. ice cover duration) from Schweriner See.
5.2 Minerogenic input as an indicator for various interacting processes
5.2.1 Processes affecting minerogenic input at Schweriner See
The correlated minerogenic elements titanium and potassium are often regarded as a proxy for minerogenic input from the catchment (Haberzettl et el., 2005, 2019; Davies et al., 2015). Minerogenic input is associated with windier and/or wetter conditions (Davies et al., 2015). During times of increased windiness, one would expect increased minerogenic input because an additional aeolian component should be introduced to the lake (Haberzettl et al., 2009). However, the pollen composition suggests a closed-canopy forest (AP pollen; Fig. 4), which inhibits aeolian erosion and transport. During times of wetter conditions, increased surface run-off should bring more allochthonous material into the lake (Haberzettl et al., 2007). However, Schweriner See has hardly any aboveground inflows and is mainly fed by groundwater (Wöbbecke et al., 2003), which has no impact on particulate minerogenic matter transport. Therefore, wetter conditions may result in a higher lake level but without an increased minerogenic matter supply to the coring location. As aeolian input and aboveground inflow are of minor importance for Schweriner Außensee, we suggest that minerogenic input is mainly modulated by the unique morphometry of the lake basin, in particular the broad shallow-water area in front of the eastern shoreline (Fig. 1c). This area is most likely the main source for minerogenic material because surface sediment sampling revealed the highest values for minerogenic elements there (e.g. Ti, K; Adolph et al., 2023). During higher (lower) lake levels, the shallow-water area would be further away from (closer to) the coring site, which results in a reduced (higher) transport of wave-eroded minerogenic material towards the coring site.
Our interpretation of minerogenic matter supply as a shoreline distance indicator is supported by previous investigations of (paleo-)lacustrine landforms (e.g. beach ridges, nearshore bar) on the northeastern shoreline of Schweriner See (Adolph et al., 2022). These landforms indicate higher lake levels during reduced minerogenic input at our coring site at 3020±260, 330±50, and 260±40 BP (OSL; Fig. 5). In contrast, lower lake levels are implied for 1050 to 950 BP (archaeological findings, Konze, 2017; Lorenz et al., 2017), 585±75 BP (OSL; Fig. 5; Adolph et al., 2022), and 120 to 100 BP (historical documents, Umweltministerium Mecklenburg-Vorpommern, 2003) which coincide with a higher minerogenic matter supply to our coring site (Fig. 5). The interpretation of Ticlr as a shoreline distance indicator is supported by the partial correlation between minerogenic elements K and Ti with the grain size mean. Both grain size means and medians have been used in large lakes as paleo-shoreline distance indicators; e.g. Kasper et al. (2012) and Haberzettl et al. (2024) argue that during episodes of higher lake levels – and therefore a larger shoreline distance to the coring location – coarser grains do not reach the coring location. Similarly, Bonk et al. (2023) suggest for Lake Lubińskie that during lower lake levels, shorelines are exposed and more susceptible to erosion. Consequently, Ti is increased at the coring location during lower water levels there as well.
To reliably assign lake-level variations at Schweriner See, wind speed and wind direction changes have to be considered as well. Due to a fetch of 6–8 km, the eastern shoreline of Schweriner See is highly susceptible to wind-induced wave action, which might have affected the sensitivity of Ticlr as a lake-level indicator. Therefore, minerogenic matter supply may additionally be influenced by (i) wind speed changes and increased storminess and/or (ii) wind directional changes. Wind speed changes and increased storminess control the wave energy and, consequently, the amount of eroded and transported material. Such changes should be reflected in the grain size mean because during periods of intensified wind coarser grains are reworked. These additional processes may explain why the minerogenic elements and the grain size mean are only partly correlated.
Compared to other phases with a similarly high Ti content, the grain size mean is particularly increased at the transition from units A to B at 3020 to 2940 cal BP and in unit D2 from 1660 to 1120 cal BP (Fig. 5). Concurrently with the first interval, a nearshore bar (3020±260 BP; OSL) was deposited at the northeastern shoreline. Despite the high Ti content, this indicates a higher lake level as it was deposited up to 1.2 m above today's lake level (Adolph et al., 2022). Secondly, within this nearshore bar sediment sequence several layers of very coarse grains (>2 mm) were deposited, which is only possible under high wave energy driven by increased wind speed. This is in agreement with a higher percentage of sand at the distal coring location of SAS21 (Fig. 5). Such increased storminess is also reconstructed from records from the Danish North Sea coast between 3300 and 2800 BP (Goslin et al., 2018) and SW Sweden from 3050 to 2850 BP (Björck and Clemmensen, 2004). In the second interval between 1660 and 120 cal BP, the Ti signal is also likely related to strongly increased wind-induced wave energy which increased the minerogenic supply to the coring location and masked the shoreline distance signal. This agrees with similar observations from NW Europe from 1700 to 1100 cal BP (Pouzet et al., 2018) and 1900 to 1050 cal BP (Sorrel et al., 2012) as well as from SW Sweden around 1500 cal BP (de Jong et al., 2006, 2007). Both phases are consistent with NAO+ conditions (Fig. 5), which are associated with stronger westerlies and increased storminess, supporting the interpretation of the coarser grain sizes. Consequently, sections with high Ti content in combination with coarser grain sizes do not necessarily correspond to a lower lake level but may also be triggered by increased wind-induced wave action. To reliably infer changes in shoreline distance, Ti has to be evaluated against the grain size mean and Sand>125 µm as indicators for wind speed changes, which may sometimes dominate the signal, particularly under NAO+ conditions.
5.2.2 Lake-level variability of Schweriner See
To test the reliability of Ticlr as a proxy for lake-level variations, we compare it to bog surface wetness reconstructions from peat bog Dosenmoor (ca. 105 km northwest of Schweriner See; Fig. 5; Barber et al., 2004; Daley and Barber, 2012). Bog surface wetness is assumed to reflect the summer moisture deficits mainly driven by precipitation but reinforced by temperature (Charman et al., 2009). Similar processes drive recent lake-level variations at Schweriner See. For example, a summer moisture deficit due to the 2018 European drought resulted in a severe lake-level drop (Landesamt für Umwelt, Naturschutz und Geologie Mecklenburg-Vorpommern, 2018), which could not be completely compensated for by winter precipitation. Therefore, we suggest that bog surface wetness is a suitable proxy for comparison. Generally, lake-level variations from Schweriner See align well with reconstructed wetter and drier conditions at Dosenmoor (Fig. 5; Barber et al., 2004). However, two instances deviate: (i) despite Ticlr at Schweriner See at 3020 to 2940 cal BP being similar to Dosenmoor (Fig. 5; Barber et al., 2004; Daley and Barber, 2012), we inferred a higher lake level supported by the deposition of a nearshore bar for this period. This inconsistency could be resolved if a lake-level drop concurrent with stormier conditions is assumed. Such a drop may result in the deposition and preservation of the nearshore bar and a higher Ti supply due to both processes, i.e. windier conditions and a subsequent lower lake level (Fig. 5). This is supported by the sediment succession in the nearshore bar, which suggests rapid continuous sedimentation with no evidence of post-depositional erosion (Adolph et al., 2022). (ii) From 1660 to 1120 cal BP our Ticlr shoreline distance signal indicates dry conditions. However, this period was masked by increased storminess and therefore differs from the reconstruction from Dosenmoor. Considering that wetter conditions were widely reconstructed for several European records (Magny, 2004; Büntgen et al., 2021; Starkel et al., 2013; Fig. 6), it is likely that the lake level was higher at Schweriner See as well.
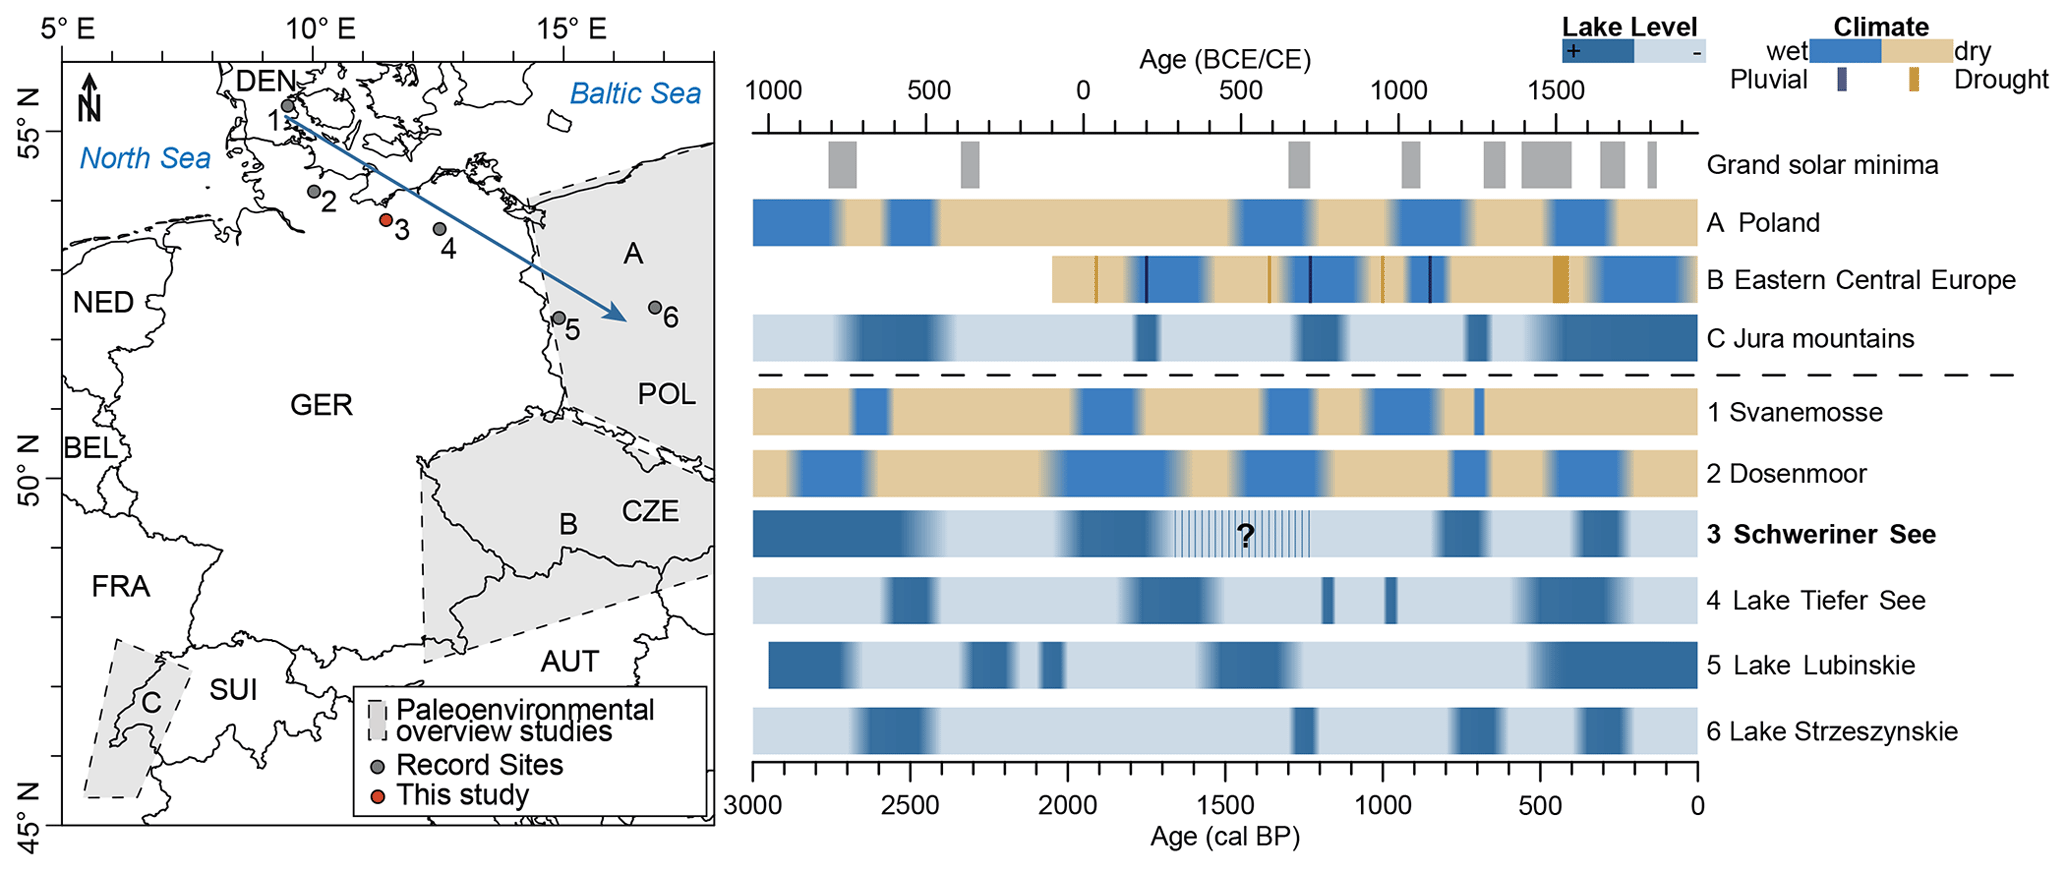
Figure 6Comparison of hydroclimate records covering the past 3000 years. Left: map of the location of the records. Grey areas indicate the spatial extent of paleoenvironmental overview studies (A–C). The blue arrow indicates the NW–SE direction where the compared records are arranged. DEN: Denmark, POL: Poland, CZE: Czechia, AUT: Austria, SUI: Switzerland, FRA: France, BEL: Belgium, NED: Netherlands, GER: Germany. Right: individual records are shown below the dashed line and hydroclimatic overview studies are above. Summarized records are from (A) Poland (Starkel et al., 2013), (B) eastern central Europe (Büntgen et al., 2021), and (C) the Jura Mountains (Magny, 2004). Hydroclimate reconstructions, which show wetter (blue bar) and drier (beige bar) conditions, are compared to lake-level variations and bog surface wetness reflecting hydroclimatic conditions differentiating between lower (light blue bars) and higher (dark blue bars) lake levels from (1) Svanemosse (Barber et al., 2004), (2) Dosenmoor (Daley and Barber, 2012; Barber et al., 2004), (3) Schweriner See (this study), (4) Tiefer See (Theuerkauf et al., 2022), (5) Lake Lubińskie (Bonk et al., 2023), and (6) Lake Strzeszyńskie (Pleskot et al., 2018). Grand solar minima are shown as suggested by Usoskin et al. (2007). The question marks and shaded area in the Schweriner See lake-level variations mark the period, masked by increased storminess. The lake level during the period was most likely higher.
In summary, we infer the following lake-level history for Schweriner See: a higher lake level than today between 3070 and 2380 cal BP was followed by a lower lake level from 2380 to 2050 cal BP and, again, a higher lake level until 1660 cal BP. Despite the contradicting signals discussed above between 1660 and 1120 cal BP, the lake level was likely higher than today. Afterwards, a lower lake level occurred between 1050+90/−70 and 850 cal BP, which aligns with a suggested lake level at least 2 m below the modern one based on archaeological findings at Schweriner See (Konze, 2017; Lorenz et al., 2017). This phase is followed by a higher lake level from 850 to 650 cal BP and a lower lake level from 650 to 410 cal BP, which coincides with peat deposits below today's lake level deposited around 530 cal BP (Fig. 5; Adolph et al., 2022). A higher lake level is indicated from 410 to 210 cal BP (Fig. 5; OSL; Adolph et al., 2022). The subsequent lake-level decline concurs with the construction of the Wallensteingraben in the 16th century (Fig. 1) because by establishing this second outflow, the major natural watershed divide between the Baltic Sea and the North Sea was cut through. The second outflow has changed discharge characteristics and resulted in a lake-level decline (Carmer, 2006; Adolph et al., 2022). The other outflow, the Stör waterway, likely had no significant influence on the lake level because, for example, around 1830 CE, the river was so shallow that it was difficult to navigate the Stör even with boats with shallow drafts (Ruchhöft, 2017). Only the expansion of the Stör waterway around 1848 CE forced a lower lake level (Fellner, 2007; Umweltministerium Mecklenburg-Vorpommern, 2003), which might align with increased Ti at the coring site (Fig. 5). This resulted in the division of the two previously openly connected lake basins of Schweriner See into the two separated ones we see today (Fig. 1) (von Wiebeking, 1960). Additionally, this lake-level decline enabled the construction of a partially artificial dam (Paulsdamm; Fig. 1b; Kasten and Rost, 2005) which connects the western and eastern shorelines. The period after 1850 CE marked an overall change in the sedimentation from calcareous to organogenic sediments (Adolph et al., 2023), which likely masked the signal of the Paulsdamm construction.
5.2.3 Driving mechanisms for lake-level variations
In general, lake-level variations observed at Schweriner See agree with patterns observed in different archives (e.g. lacustrine sediments, peat bogs, tree rings) which reflect lake-level variations and hydroclimatic conditions in Denmark (Barber et al., 2004), NE Germany (Daley and Barber, 2012; Theuerkauf et al., 2022), and western Poland (Pleskot et al., 2018; Bonk et al., 2023; Starkel et al., 2013) but also eastern central Europe (Büntgen et al., 2021) and the Jura Mountains (Magny, 2004) (Fig. 6). Offsets might occur due to chronological uncertainties, proxy sensitivity, and/or additional local to regional influences. For example, some studies argue for more local to regional influences on the lake level during the Late Holocene by identifying (anthropogenic) land cover changes and forest structures as partly responsible (e.g. Theuerkauf et al., 2022; Bonk et al., 2023; Dietze et al., 2016). In particular, an anthropogenically induced change between forested and open vegetation landscapes is linked to altered groundwater recharge and, consequently, higher lake levels under more open vegetation for Tiefer See (∼75 ha, ca. 70 km east of Schweriner See; Theuerkauf et al., 2022). Such local to regional influences may result in varying onsets of lake-level high stands, particularly for smaller lake systems, which are more susceptible to local and regional (anthropogenic) influences. For example, at the small Lake Lubińskie (22.7 ha, ca. 275 km southeast of Schweriner See), lake-level variations are mainly related to anthropogenic activity within the catchment (Bonk et al., 2023), which may explain the difference to the large Schweriner See. Additional influences, which may lead to different onsets, are the hydro(geo)logical network or different climatic settings such as increasing continentality from west to east (Bonk et al., 2023). For Schweriner See's lake level, we suggest that (i) (anthropogenically) induced land cover changes have a minor influence because the pollen composition suggests a closed-canopy forest cover until 665 cal BP (Fig. 4) and (ii) additional local effects were dampened by the lake's size.
As hydroclimatic conditions at Schweriner See are generally influenced by NAO variability, large-scale changes in atmospheric circulation systems most likely at least partially drive regional lake-level variations. This is supported by modelling approaches by Vassiljev (1998) suggesting that lakes in temperate humid areas are more sensitive to changes in winter precipitation (i.e. due to NAO variability) compared to summer precipitation. At Schweriner See lower lake levels tend to coincide with NAO− conditions, which are associated with drier winter conditions (Fig. 5). The influence of large-scale atmospheric changes on lake-level variability during the past 3000 years explains the similar lake-level variations and hydroclimatic conditions in different archives (Fig. 6). Discrepancies between winter temperature and moisture source region changes, which are NAO-related, and the lake-level variations at Schweriner See (Fig. 5) may occur due to sometimes independent forcing mechanisms. While NAO mostly influences winter hydroclimate, lake-level variability is additionally influenced by summer moisture deficits, e.g. due to drier summer conditions. This may result in lake-level declines that cannot be compensated for even by rainy winter conditions. Such conditions were observed recently after dry summer conditions in 2018 and 2022 (Adolph, 2024). Normally, such summer moisture deficits should be reflected in δ2H if the isotopic lake water composition is driven by evaporative lake water enrichment. δ2H would then show a similar pattern as shoreline distance and bog surface wetness from Dosenmoor (Fig. 5; Daley and Barber, 2012), as both are related to changes in precipitation and evapotranspiration. Such an influence of evaporative lake water enrichment has been observed e.g. for several smaller lakes in NE Germany (Aichner et al., 2022). However, these study sites are located ca. 120 km southeast of Schweriner See and are affected by more continental climate conditions compared to Schweriner See. Furthermore, these areas differ, among others, by their mean annual water balance, which is slightly positive at Schweriner See but becomes negative further east (Adolph, 2024), suggesting increased evaporative lake water enrichment eastwards. Moreover, lake water evaporation in these lakes shows spatially varying amplitudes and seems to depend on the lake's morphological parameters and hydrological features (Aichner et al., 2022). Lakes similar to Schweriner See, i.e. deep lakes with high water residence times and an absence of river connections, show low evaporative lake water enrichment (Aichner et al., 2022). Such low evaporative lake water enrichment for Schweriner See is supported by the correlation between δ2H and winter temperature changes instead of a correlation with lake-level variations (Fig. 5). Therefore, we suggest that δ2H predominantly depends on moisture source changes in the North Atlantic region. This potentially explains the differences between the reconstructed NAO conditions and lake-level variations. Still, an additional influence of evaporative lake water enrichment on δ2H cannot be completely excluded.
Additional (supra)regional drivers may have affected lake-level variability. For example, changes in solar activity have been suggested to be one key driver for Holocene hydroclimatic variability in the Jura Mountains, where higher lake levels were linked to lower solar activity (Magny, 2004). However, this explanation can only partly be applied to Schweriner See (Fig. 5) and other compared records (Fig. 6). We rather observe temporal offsets between low solar activity and higher lake levels when comparing records from e.g. Lake Lubińskie (Bonk et al., 2023), Lake Strzeszyńskie (Pleskot et al., 2018), and Tiefer See (Theuerkauf et al., 2022), which might be a result of complex spatial ocean–land interactions as a response to solar activity as suggested by Swindles et al. (2007) or additional anthropogenic forcing. For Schweriner See only a few periods of a higher lake level align with solar minima, e.g. the Homeric Minimum (2800–2550 cal BP; Figs. 5 and 6). After the 12th century, anthropogenic interferences, e.g. weirs, the building of mills, or the construction of the Wallenstein trench, may have influenced the lake level beyond natural variations.
Sediments obtained from Schweriner See are a valuable archive for studying Late Holocene environmental variability. Due to its size, local (anthropogenic) effects are dampened and proxies reflect large-scale climatic variations, which align well with interregional paleoclimatic reconstructions for the past 3000 years. Before 105 cal BP (∼1850 CE), in-lake productivity in Schweriner See was mainly driven by winter temperature variability, which modulates ice cover duration and growing season length, resulting in lower productivity during colder periods and higher productivity during milder periods. These changes in winter temperature covary with changes in moisture source region (δ2H): (i) milder winter temperatures coincide with a southern moisture source region and (ii) colder winter temperatures with a northern moisture source region. These distinct variations enable the reconstruction of large-scale atmospheric processes, suggesting NAO polarity as a driver. Positive NAO conditions from 3030 to 2820 cal BP and 2110 to 830 cal BP are characterized by milder winter temperatures and a southern moisture source region due to stronger westerlies bringing warm, moist air towards northwest Europe. In contrast, negative NAO conditions from 2820 to 2110 cal BP and 830 to 105 cal BP are associated with colder winter temperatures and a northern moisture source region. Rates of changes between positive and negative conditions vary between the individual phases, e.g. with a rapid drop in winter temperature around 2820 cal BP but a gradual increase from 2110 to 1720 cal BP. Only after 105 cal BP was the hydroclimatic signal masked by anthropogenic impacts, mainly eutrophication, on Schweriner See, which changed the in-lake productivity from temperature- to nutrient-driven.
In addition to these long-term shifts in atmospheric circulation systems, short-term hydroclimatic variations can be reconstructed. In this context, Ti mainly reflects lake-level variations linked to precipitation and evaporation variability with additional influences of wind speed resulting in increased wave action. This mode of minerogenic matter supply contradicts traditional interpretations and highlights the importance of carefully considering lake morphology, catchment, and environmental conditions for proxy interpretation.
The original data from this study are available upon request.
The supplement related to this article is available online at: https://doi.org/10.5194/cp-20-2143-2024-supplement.
MLA – conceptualization, methodology, formal analysis, investigation, visualization, writing (original draft preparation; review and editing). SC – investigation, writing (review and editing). MiD – investigation, writing (review and editing). PS – investigation, writing (review and editing). MB – investigation, writing (review and editing). SL – conceptualization, funding acquisition, writing (review and editing). MaD – methodology, resources. TH – conceptualization, methodology, funding acquisition, writing (review and editing), supervision.
The contact author has declared that none of the authors has any competing interests.
Publisher's note: Copernicus Publications remains neutral with regard to jurisdictional claims made in the text, published maps, institutional affiliations, or any other geographical representation in this paper. While Copernicus Publications makes every effort to include appropriate place names, the final responsibility lies with the authors.
We want to acknowledge Jürgen Becker and M. Steinich for their support of the field campaign and Mike Steinich and Ulrich Dolgner for CNS and TIC analyses. Moreover, we want to thank Kaja Müller, Antonia Kühn, and Rafael Tüllinghoff for their support during sampling and laboratory analyses. We would also like to thank Peter Appleby for carrying out the 137Cs and 210Pb dating and Christian Ohlendorf and Rafael Stiens for XRF scanning. We want to thank Roland Zech for discussions as well as laboratory and instrument access at the Physical Geography Department of Friedrich Schiller University Jena. Moreover, we thank Kevin Jacq for his support during hyperspectral imaging.
This project was funded by the German Research Foundation (HA5089/14-1) and was carried out in close cooperation with the Ministry for Climate Protection, Agriculture, Rural Areas and Environment Mecklenburg-Vorpommern. Marie-Luise Adolph received a graduate scholarship (Landesgraduiertenstipendium) from the Federal State of Mecklenburg-Western Pomerania to conduct this research.
This paper was edited by Natalia Piotrowska and reviewed by two anonymous referees.
Adolph, M.-L.: Late Holocene environmental variability derived from lacustrine sediments of large lowland lake Schweriner See, NE-Germany, PhD Thesis, Universität Greifswald, Greifswald, 2024.
Adolph, M.-L., Lampe, R., Lorenz, S., and Haberzettl, T.: Characterization of (paleo)lacustrine landforms using sedimentological and portable OSL investigations at Schweriner See, north-eastern Germany, Earth Surf. Proc. Land., 42, 422–435, https://doi.org/10.1002/esp.5258, 2022.
Adolph, M.-L., Dreßler, M., Troelstra, V., Wrozyna, C., and Haberzettl, T.: Eutrophication and contamination dynamics of Schweriner See, NE-Germany, during the past 670 years – A multi-proxy approach on lacustrine surface sediments and sediment cores, Sci. Total Environ., 877, 162745, https://doi.org/10.1016/j.scitotenv.2023.162745, 2023.
Aichner, B., Dubbert, D., Kiel, C., Kohnert, K., Ogashawara, I., Jechow, A., Harpenslager, S.-F., Hölker, F., Nejstgaard, J. C., Grossart, H.-P., Singer, G., Wollrab, S., and Berger, S. A.: Spatial and seasonal patterns of water isotopes in northeastern German lakes, Earth Syst. Sci. Data, 14, 1857–1867, https://doi.org/10.5194/essd-14-1857-2022, 2022.
Aitchison, J.: The Statistical Analysis of Compositional Data, J. Roy. Stat. Soc. Ser. B, 44, 139–160, https://doi.org/10.1111/j.2517-6161.1982.tb01195.x, 1982.
Appleby, P. G., Richardson, N., and Nolan, P. J.: Self-absorption corrections for well-type germanium detectors, Nucl. Instrum. Meth. Phys. Res. Sect. B, 71, 228–233, https://doi.org/10.1016/0168-583X(92)95328-O, 1992.
Appleby, P. G., Nolan, P. J., Gifford, D. W., Godfrey, M. J., Oldfield, F., Anderson, N. J., and Battarbee, R. W.: 210Pb dating by low background gamma counting, Hydrobiologia, 143, 21–27, https://doi.org/10.1007/BF00026640, 1986.
Baker, A., C Hellstrom, J., Kelly, B. F. J., Mariethoz, G., and Trouet, V.: A composite annual-resolution stalagmite record of North Atlantic climate over the last three millennia, Sci. Rep., 5, 10307, https://doi.org/10.1038/srep10307, 2015.
Baldini, L. M., McDermott, F., Foley, A. M., and Baldini, J. U. L.: Spatial variability in the European winter precipitation δ18O-NAO relationship: Implications for reconstructing NAO-mode climate variability in the Holocene, Geophys. Res. Lett., 35, L04709, https://doi.org/10.1029/2007GL032027, 2008.
Barber, K., Chambers, F., and Maddy, D.: Late Holocene climatic history of northern Germany and Denmark: peat macrofossil investigations at Dosenmoor, Schleswig-Holstein, and Svanemose, Jutland, Boreas, 33, 132–144, https://doi.org/10.1111/j.1502-3885.2004.tb01135.x, 2004.
Berglund, B. and Ralska-Jasiewiczowa, M.: Pollen analysis and pollen diagrams, in: Handbook of Holocene Palaeoecology and Palaeohydrology, edited by: Berglund, B., John Wiley & Sons, Chichester, 455–484, 1986.
Beug, H. J.: Leitfaden der Pollenbestimmung für Mitteleuropa und angrenzende Gebiete, Verlag Friedrich Pfeil, München, ISBN 9783899370430, 2004.
Björck, S. and Clemmensen, L. B.: Aeolian sediment in raised bog deposits, Halland, SW Sweden: a new proxy record of Holocene winter storminess variation in southern Scandinavia?, Holocene, 14, 677–688, https://doi.org/10.1191/0959683604hl746rp, 2004.
Blaauw, M. and Christen, J. A.: Flexible paleoclimate age-depth models using an autoregressive gamma process, Bayesian Anal., 6, 457–474, https://doi.org/10.1214/ba/1339616472, 2011.
Blenckner, T., Adrian, R., Livingstone, D. M., Jennings, E., Weyhenmeyer, G. A., George, D. G., Jankowski, T., Järvinen, M., Aonghusa, C., Nõges, T., Straile, D., and Teubner, K.: Large-scale climatic signatures in lakes across Europe: a meta-analysis, Global Change Biol., 13, 1314–1326, https://doi.org/10.1111/j.1365-2486.2007.01364.x, 2007.
Bliedtner, M., Zech, R., Zech, J., Schäfer, I., and Suchodoletz, H.: A first Holocene leaf wax isotope-based paleoclimate record from the semi-humid to semi-arid south-eastern Caucasian lowlands, J. Quaternary Sci, 35, 625–633, https://doi.org/10.1002/jqs.3210, 2020.
Bliedtner, M., Strobel, P., Struck, J., Prochnow, M., Bazarradnaa, E., and Zech, R.: Mid to Late Holocene moisture evolution of semi-arid Mongolia and its anti-phase relationship with monsoonal Asia, Quaternary Sci. Rev., 313, 108201, https://doi.org/10.1016/j.quascirev.2023.108201, 2023.
Blott, S. J. and Pye, K.: GRADISTAT: a grain size distribution and statistics package for the analysis of unconsolidated sediments, Earth Surf. Proc. Land., 26, 1237–1248, https://doi.org/10.1002/esp.261, 2001.
Bond, G., Kromer, B., Beer, J., Muscheler, R., Evans, M. N., Showers, W., Hoffmann, S., Lotti-Bond, R., Hajdas, I., and Bonani, G.: Persistent solar influence on North Atlantic climate during the Holocene, Science, 294, 2130–2136, https://doi.org/10.1126/science.1065680, 2001.
Bonk, A., Piotrowska, N., Żarczyński, M., Enters, D., Makohonienko, M., Rzodkiewicz, M., and Tylmann, W.: Limnological responses to environmental changes during the last 3,000 years revealed from a varved sequence of Lake Lubińskie (western Poland), Catena, 226, 107053, https://doi.org/10.1016/j.catena.2023.107053, 2023.
Bonsal, B. R., Prowse, T. D., Duguay, C. R., and Lacroix, M. P.: Impacts of large-scale teleconnections on freshwater-ice break/freeze-up dates over Canada, J. Hydrol., 330, 340–353, https://doi.org/10.1016/j.jhydrol.2006.03.022, 2006.
Bradshaw, R., Kito, N., and Giesecke, T.: Factors influencing the Holocene history of Fagus, Forest Ecol. Manage., 259, 2204–2212, https://doi.org/10.1016/j.foreco.2009.11.035, 2010.
Breitenbach, S. F., Plessen, B., Waltgenbach, S., Tjallingii, R., Leonhardt, J., Jochum, K. P., Meyer, H., Goswami, B., Marwan, N., and Scholz, D.: Holocene interaction of maritime and continental climate in Central Europe: New speleothem evidence from Central Germany, Global Planet. Change, 176, 144–161, https://doi.org/10.1016/j.gloplacha.2019.03.007, 2019.
Büntgen, U., Urban, O., Krusic, P. J., Rybníček, M., Kolář, T., Kyncl, T., Ač, A., Koňasová, E., Čáslavský, J., Esper, J., Wagner, S., Saurer, M., Tegel, W., Dobrovolný, P., Cherubini, P., Reinig, F., and Trnka, M.: Recent European drought extremes beyond Common Era background variability, Nat. Geosci., 14, 190–196, https://doi.org/10.1038/s41561-021-00698-0, 2021.
Carmer, C. F. von: Gewässerkulturlandschaften – Die historische Dimension kleiner Fließgewässer am Beispiel des Wallensteingrabens, Wasserwirtschaft, 7–8, 28–32, 2006.
Charman, D. J., Barber, K. E., Blaauw, M., Langdon, P. G., Mauquoy, D., Daley, T. J., Hughes, P. D., and Karofeld, E.: Climate drivers for peatland palaeoclimate records, Quaternary Sci. Rev., 28, 1811–1819, https://doi.org/10.1016/j.quascirev.2009.05.013, 2009.
Comas-Bru, L. and McDermott, F.: Impacts of the EA and SCA patterns on the European twentieth century NAO-winter climate relationship, Q. J. Roy. Meteorol. Soc., 140, 354–363, https://doi.org/10.1002/qj.2158, 2014.
Comas-Bru, L., McDermott, F., and Werner, M.: The effect of the East Atlantic pattern on the precipitation δ18O–NAO relationship in Europe, Clim. Dynam., 47, 2059–2069, https://doi.org/10.1007/s00382-015-2950-1, 2016.
Croudace, I. W. and Rothwell, G.: Micro-XRF sediment core scanners: important new tools for the environmental and earth sciences, Spectrosc. Europe, 3, 6–13, 2010.
Daley, T. J. and Barber, K. E.: Multi-proxy Holocene palaeoclimate records from Walton Moss, northern England and Dosenmoor, northern Germany, assessed using three statistical approaches, Quatern. Int., 268, 111–127, https://doi.org/10.1016/j.quaint.2011.10.026, 2012.
Davies, S. J., Lamb, H. F., and Roberts, S. J.: Micro-XRF Core Scanning in Palaeolimnology: Recent Developments, in: Micro-XRF Studies of Sediment Cores: Applications of a non-destructive tool for the environmental sciences, edited by: Croudace, I. W. and Rothwell, R. G., Springer Netherlands, Dordrecht, 189–226, ISBN 9789401798488, 2015.
de Jong, R., Björck, S., Björkman, L., and Clemmensen, L. B.: Storminess variation during the last 6500 years as reconstructed from an ombrotrophic peat bog in Halland, southwest Sweden, J. Quaternary Sci., 21, 905–919, https://doi.org/10.1002/jqs.1011, 2006.
de Jong, R., Schoning, K., and Björck, S.: Increased aeolian activity during humidity shifts as recorded in a raised bog in south-west Sweden during the past 1700 years, Clim. Past, 3, 411–422, https://doi.org/10.5194/cp-3-411-2007, 2007.
Dietze, E., Słowiński, M., Zawiska, I., Veh, G., and Brauer, A.: Multiple drivers of Holocene lake level changes at a lowland lake in northeastern Germany, Boreas, 45, 828–845, https://doi.org/10.1111/bor.12190, 2016.
Doberschütz, S., Frenzel, P., Haberzettl, T., Kasper, T., Wang, J., Zhu, L., Daut, G., Schwalb, A., and Mäusbacher, R.: Monsoonal forcing of Holocene paleoenvironmental change on the central Tibetan Plateau inferred using a sediment record from Lake Nam Co (Xizang, China), J. Paleolimnol., 51, 253–266, https://doi.org/10.1007/s10933-013-9702-1, 2014.
Dräger, N., Theuerkauf, M., Szeroczyńska, K., Wulf, S., Tjallingii, R., Plessen, B., Kienel, U., and Brauer, A.: Varve microfacies and varve preservation record of climate change and human impact for the last 6000 years at Lake Tiefer See (NE Germany), Holocene, 27, 450–464, https://doi.org/10.1177/0959683616660173, 2017.
Dreßler, M., Schwarz, A., Hübener, T., Adler, S., and Scharf, B. W.: Use of sedimentary diatoms from multiple lakes to distinguish between past changes in trophic state and climate: evidence for climate change in northern Germany during the past 5,000 years, J. Paleolimnol., 45, 223–241, https://doi.org/10.1007/s10933-010-9494-5, 2011.
DWD Climate Data Center: Multi-annual grids of water balance over Germany 1971–2000, Deutscher Wetterdienst, https://opendata.dwd.de/climate_environment/CDC/grids_germany/multi_annual/water_balance/ (last access: 19 September 2024), 2020.
DWD Climate Data Center: Hourly mean of station observations of wind direction ca. 10 m above ground in degree for Germany: Weather Station Schwerin, Deutscher Wetterdienst, https://cdc.dwd.de/portal/ (last access: 23 September 2024), 2022a.
DWD Climate Data Center: Monthly mean of station observations of air temperature at 2 m above ground in °C for Schwerin, Deutscher Wetterdienst, https://cdc.dwd.de/portal/ (last access: 23 September 2024), 2022b.
DWD Climate Data Center: Monthly station observations of precipitation in mm for Schwerin, Deutscher Wetterdienst, https://cdc.dwd.de/portal/ (last access: 23 September 2024), 2022c.
Engels, S., Bakker, M. A., Bohncke, S. J., Cerli, C., Hoek, W. Z., Jansen, B., Peters, T., Renssen, H., Sachse, D., van Aken, J. M., van den Bos, V., van Geel, B., van Oostrom, R., Winkels, T., and Wolma, M.: Centennial-scale lake-level lowstand at Lake Uddelermeer (The Netherlands) indicates changes in moisture source region prior to the 2.8-kyr event, Holocene, 26, 1075–1091, https://doi.org/10.1177/0959683616632890, 2016.
Faust, J. C., Fabian, K., Milzer, G., Giraudeau, J., and Knies, J.: Norwegian fjord sediments reveal NAO related winter temperature and precipitation changes of the past 2800 years, Earth Planet. Sc. Lett., 435, 84–93, https://doi.org/10.1016/j.epsl.2015.12.003, 2016.
Feakins, S. J. and Sessions, A. L.: Controls on the D/H ratios of plant leaf waxes in an arid ecosystem, Geochim. Cosmochim. Ac., 74, 2128–2141, https://doi.org/10.1016/j.gca.2010.01.016, 2010.
Fellner, B.: Faszination Lewitz: Ein Naturparadies in Mecklenburg, in: 2nd Edn., Fellner, Neustadt-Glewe, 144 pp., ISBN 978-3981133806, 2007.
Ficken, K., Li, B., Swain, D., and Eglinton, G.: An n-alkane proxy for the sedimentary input of submerged/floating freshwater aquatic macrophytes, Org. Geochem., 31, 745–749, https://doi.org/10.1016/S0146-6380(00)00081-4, 2000.
Germer, S., Kaiser, K., Mauersberger, R., Stüve, P., Timmermann, T., Bens, O., and Hüttl, R. F.: Sinkende Seespiegel in Nordostdeutschland: Vielzahl hydrologischer Sepzialfälle oder Gruppen von ähnlichen Seesystemen?, in: Aktuelle Probleme im Wasserhaushalt von Nordostdeutschland: Trends, Ursachen, Lösungen, edited by: Kaiser, K., Libra, J., Merz, B., Bens, O., and Hüttl, R. F., Deutsches GeoForschungsZentrum GFZ, Potsdam, 40–48, https://gfzpublic.gfz-potsdam.de/rest/items/item_242668_2/component/file_242667/content (last access: 25 September 2024), 2010.
Giesecke, T., Brewer, S., Finsinger, W., Leydet, M., and Bradshaw, R. H.: Patterns and dynamics of European vegetation change over the last 15,000 years, J. Biogeogr., 44, 1441–1456, https://doi.org/10.1111/jbi.12974, 2017.
Goslin, J., Fruergaard, M., Sander, L., Gałka, M., Menviel, L., Monkenbusch, J., Thibault, N., and Clemmensen, L. B.: Holocene centennial to millennial shifts in North-Atlantic storminess and ocean dynamics, Sci. Rep., 8, 12778, https://doi.org/10.1038/s41598-018-29949-8, 2018.
Gray, L. J., Woollings, T. J., Andrews, M., and Knight, J.: Eleven-year solar cycle signal in the NAO and Atlantic/European blocking, Q. J. Roy. Meteorol. Soc., 142, 1890–1903, https://doi.org/10.1002/qj.2782, 2016.
Günther, F., Thiele, A., Biskop, S., Mäusbacher, R., Haberzettl, T., Yao, T., and Gleixner, G.: Late quaternary hydrological changes at Tangra Yumco, Tibetan Plateau: a compound-specific isotope-based quantification of lake level changes, J. Paleolimnol., 55, 369–382, https://doi.org/10.1007/s10933-016-9887-1, 2016.
Haberzettl, T., Fey, M., Lücke, A., Maidana, N., Mayr, C., Ohlendorf, C., Schäbitz, F., Schleser, G. H., Wille, M., and Zolitschka, B.: Climatically induced lake level changes during the last two millennia as reflected in sediments of Laguna Potrok Aike, southern Patagonia (Santa Cruz, Argentina), J. Paleolimnol., 33, 283–302, https://doi.org/10.1007/s10933-004-5331-z, 2005.
Haberzettl, T., Corbella, H., Fey, M., Janssen, S., Lücke, A., Mayr, C., Ohlendorf, C., Schäbitz, F., Schleser, G. H., Wille, M., Wulf, S., and Zolitschka, B.: Lateglacial and Holocene wet–dry cycles in southern Patagonia: chronology, sedimentology and geochemistry of a lacustrine record from Laguna Potrok Aike, Argentina, Holocene, 17, 297–310, https://doi.org/10.1177/0959683607076437, 2007.
Haberzettl, T., Anselmetti, F. S., Bowen, S. W., Fey, M., Mayr, C., Zolitschka, B., Ariztegui, D., Mauz, B., Ohlendorf, C., Kastner, S., Lücke, A., Schäbitz, F., and Wille, M.: Late Pleistocene dust deposition in the Patagonian steppe – extending and refining the paleoenvironmental and tephrochronological record from Laguna Potrok Aike back to 55 ka, Quaternary Sci. Rev., 28, 2927–2939, https://doi.org/10.1016/j.quascirev.2009.07.021, 2009.
Haberzettl, T., Kirsten, K. L., Kasper, T., Franz, S., Reinwarth, B., Baade, J., Daut, G., Meadows, M. E., Su, Y., and Mäusbacher, R.: Using 210Pb-data and paleomagnetic secular variations to date anthropogenic impact on a lake system in the Western Cape, South Africa, Quatern. Geochronol., 51, 53–63, https://doi.org/10.1016/j.quageo.2018.12.004, 2019.
Haberzettl, T., Adolph, M.-L., Grigoryan, T., Hovakimyan, H., Kasper, T., Nowaczyk, N., Zeeden, C., and Sahakyan, L.: Causes and consequences of natural and anthropogenically induced late Holocene hydrological variations on the largest freshwater system in the Lesser Caucasus (Lake Sevan, Armenia), Quaternary Sci. Rev., 344, 108945, https://doi.org/10.1016/j.quascirev.2024.108945, 2024.
Hammer, O.: PAST. PAleontological STatistics, Version 4.17 Reference Manual, https://www.nhm.uio.no/english/research/resources/past/downloads/past4manual.pdf (last access: 19 Seprember 2024), 2022.
Harding, P., Martin-Puertas, C., Sjolte, J., Walsh, A. A., Tjallingii, R., Langdon, C., Blockley, S. P. E., Brauer, A., Langdon, P., Milner, A. M., Muscheler, R., and Perez, M.: Wind regime changes in the Euro-Atlantic region driven by Late-Holocene Grand Solar Minima, Clim. Dynam., 60, 1947–1961, https://doi.org/10.1007/s00382-022-06388-w, 2023.
Harrell Jr., F. E.: Hmisc: Harrell Miscellaneous: R-package, https://hbiostat.org/r/hmisc/ (last access: 19 September 2024), 2023.
Hodell, D. A. and Schelske, C. L.: Production, sedimentation, and isotopic composition of organic matter in Lake Ontario, Limnol. Oceanogr., 43, 200–214, https://doi.org/10.4319/lo.1998.43.2.0200, 1998.
Hodell, D. A., Channell, J. E. T., Curtis, J. H., Romero, O. E., and Röhl, U.: Onset of “Hudson Strait” Heinrich events in the eastern North Atlantic at the end of the middle Pleistocene transition (∼640 ka)?, Paleoceanography, 23, 1–16, https://doi.org/10.1029/2008PA001591, 2008.
Hu, H.-M., Trouet, V., Spötl, C., Tsai, H.-C., Chien, W.-Y., Sung, W.-H., Michel, V., Yu, J.-Y., Valensi, P., Jiang, X., Duan, F., Wang, Y., Mii, H.-S., Chou, Y.-M., Lone, M. A., Wu, C.-C., Starnini, E., Zunino, M., Watanabe, T. K., Watanabe, T., Hsu, H.-H., Moore, G. W. K., Zanchetta, G., Pérez-Mejías, C., Lee, S.-Y., and Shen, C.-C.: Tracking westerly wind directions over Europe since the middle Holocene, Nat. Commun., 13, 7866, https://doi.org/10.1038/s41467-022-34952-9, 2022.
Hurrell, J. W.: Decadal Trends in the North Atlantic Oscillation: Regional Temperatures and Precipitation, Science, 269, 676–679, https://doi.org/10.1126/science.269.5224.676, 1995.
Hurrell, J. W. and Deser, C.: North Atlantic climate variability: The role of the North Atlantic Oscillation, J. Mar. Syst., 78, 28–41, https://doi.org/10.1016/j.jmarsys.2008.11.026, 2009.
Hurrell, J. W., Kushnir, Y., Ottersen, G., and Visbeck, M.: An overview of the North Atlantic Oscillation, in: The North Atlantic oscillation: Climatic significance and environmental impact, Geophysical Monograph Series, 134, edited by: Hurrell, J. W., American Geophysical Union, Washington, D.C., 1–35, https://doi.org/10.1029/GM134, 2003.
IPCC: Climate Change 2021: The Physical Science Basis: Contribution of Working Group I to the Sixth Assessment Report of the Intergovernmental Panel on Climate Change, Cambridge University Press, Cambridge, New York, 2409 pp., https://doi.org/10.1017/9781009157896, 2021.
Jacq, K., Auboiron, J., Humbert, K., Martinez-Lamas, R., van Exem, A., and Debret, M.: Hyperspectral core-logger image acquisition v.2, Berkeley, CA, USA, https://www.protocols.io/view/hyperspectral-core-logger-image-acquisition-kqdg35zppv25/v2 (last access: 19 September 2024), 2021.
Juggins, S.: rioja: Analysis of Quaternary Science Data, R package, https://cran.r-project.org/web/packages/rioja/index.html (last access: 19 September 2024), 2022.
Kahmen, A., Hoffmann, B., Schefuß, E., Arndt, S. K., Cernusak, L. A., West, J. B., and Sachse, D.: Leaf water deuterium enrichment shapes leaf wax n-alkane δD values of angiosperm plants II: Observational evidence and global implications, Geochim. Cosmoch. Ac., 111, 50–63, https://doi.org/10.1016/j.gca.2012.09.004, 2013.
Kaiser, K., Lorenz, S., Germer, S., Juschus, O., Küster, M., Libra, J., Bens, O., and Hüttl, R. F.: Late Quaternary evolution of rivers, lakes and peatlands in northeast Germany reflecting past climatic and human impact – an overview, E&G Quaternary Sci. J., 61, 103–132, https://doi.org/10.3285/eg.61.2.01, 2012.
Kalbe, L. and Werner, H.: Das Sediment des Kummerower Sees. Untersuchungen des Chemismus und der Diatomeenflora, Int. Revue ges. Hydrobiol. Hydrogr., 59, 755–782, https://doi.org/10.1002/iroh.19740590603, 1974.
Kasper, T., Haberzettl, T., Doberschütz, S., Daut, G., Wang, J., Zhu, L., Nowaczyk, N., and Mäusbacher, R.: Indian Ocean Summer Monsoon (IOSM)-dynamics within the past 4 ka recorded in the sediments of Lake Nam Co, central Tibetan Plateau (China), Quaternary Sci. Rev., 39, 73–85, https://doi.org/10.1016/j.quascirev.2012.02.011, 2012.
Kasper, T., Frenzel, P., Haberzettl, T., Schwarz, A., Daut, G., Meschner, S., Wang, J., Zhu, L., and Mäusbacher, R.: Interplay between redox conditions and hydrological changes in sediments from Lake Nam Co (Tibetan Plateau) during the past 4000 cal BP inferred from geochemical and micropaleontological analyses, Palaeogeogr. Palaeocl. Palaeoecol., 392, 261–271, https://doi.org/10.1016/j.palaeo.2013.09.027, 2013.
Kasten, B. and Rost, J.-U.: Schwerin: Geschichte der Stadt, Helms, Schwerin, 400 pp., ISBN 3-935749-38-4, 2005.
Konze, M.: Bergung und Dokumentation von Teilen des Bodendenkmals “Schloss Schwerin” (Fpl. 17) im Rahmen des Projektes “Schloss Schwerin, Ver- und Entsorgungsleitungen im Innenhof” (3544-4098-HS), Landesamt für Kultur und Denkmalpflege Mecklenburg-Vorpommern, Schwerin, 2017.
Krammer, K.: Die cymbelloiden Diatomeen: Eine Monographie der weltweit bekannten Taxa, Bibliotheca diatomologica, 36, Cramer, Berlin, 382 pp., ISBN 978-3-443-57027-9, 1997a.
Krammer, K.: Die cymbelloiden Diatomeen: Eine Monographie der weltweit bekannten Taxa, Bibliotheca diatomologica, 37, Cramer, Berlin, 469 pp., ISBN 978-3-443-57028-6, 1997b.
Krammer, K.: A Third Sector in the Third Millennium?, Springer, https://doi.org/10.1023/A:1008914531485, 2000.
Krammer, K.: Cymbella, in: Diatoms of Europe, diatoms of the European inland waters and comparable habitats Vol. 3, edited by: Lange-Bertalot, H. and Ruggell, A. R. G., Gantner Verlag KG, 1–584, ISBN 978-3-904144-84-1, 2002.
Krammer, K.: Cymbopleura, Delicata, Navicymbula, Gomphocymbellopsis, Afrocymbella, Diatoms of Europe, 4, Gantner; Koeltz, Ruggell, Liechtenstein, Königstein, Germany, 530 pp., ISBN 9783904144995, 2003.
Krammer, K. and Lange-Bertalot, H.: Naviculaceae, Süßwasserflora von Mitteleuropa, 2.1, G. Fischer, Stuttgart, 876 pp., ISBN 9783437304033, 1986.
Krammer, K. and Lange-Bertalot, H.: Bacillariophyceae, Süßwasserflora von Mitteleuropa, 2.2, G. Fischer, Stuttgart, 596 pp., ISBN 9783437306648, 1988.
Krammer, K. and Lange-Bertalot, H.: Achnanthaceae, Kritische Ergänzungen zu Navicula (Lineolatae) und Gomphonema, Gesamtliteraturverzeichnis Teil 1–4: 88 Tafeln mit 2048 Figuren, Süßwasserflora von Mitteleuropa, 2.4, G. Fischer, Stuttgart, 437 pp., ISBN 9783437305412, 1991a.
Krammer, K. and Lange-Bertalot, H.: Centrales, Fragilariaceae, Eunotiaceae, Süßwasserflora von Mitteleuropa, 2.3, G. Fischer, Stuttgart, 576 pp., ISBN 9783827408273, 1991b.
Krienke, H.-D. and Obst, K.: Raben Steinfeld und die Eiszeit – Landschaftsentwicklung und geologische Sehenswürdigkeiten südöstlich von Schwerin, Brandenburgische geowissenschaftliche Beiträge, 18, 107–123, 2011.
Lamb, H. H.: Climate: Present, Past and Future: Volume 2: Climatic History and the Future, Routledge Revivals, Taylor and Francis, Hoboken, 879 pp., ISBN 978-0415682237, 2013.
Lampe, M. and Lampe, R.: Evolution of a large Baltic beach ridge plain (Neudarss, NE Germany): A continuous record of sea-level and wind-field variation since the Homeric Minimum, Earth Surf. Proc. Land., 43, 3042–3056, https://doi.org/10.1002/esp.4468, 2018.
Lampe, R., Lorenz, S., Janke, W., Meyer, H., Küster, M., Hübener, T., and Schwarz, A.: Zur Landschafts- und Gewässergeschichte der Müritz: Umweltgeschichtlich orientierte Bohrungen 2004–2006 zur Rekonstruktion der nacheiszeitlichen Entwicklung, 1. Aufl., Forschung und Monitoring, 2, Geozon Science Media, Greifswald, 93 pp., ISBN 978-3-941971-00-4, 2009.
Landesamt für Umwelt, Naturschutz und Geologie Mecklenburg-Vorpommern (Ed.): Hydrologisches Jahr 2018: Bericht zur hydrometeorologischen und hydrologischen Lage in Mecklenburg Vorpommern, 01.11.2017 bis 31.10.2018, Landesamt für Umwelt, Naturschutz und Geologie Mecklenburg-Vorpommern, Güstrow, 28 pp., https://www.lung.mv-regierung.de/static/LUNG/Dateien/fachinformationen/wasser/hydrologie/jahresbericht_2018_hymet_lage_final_20190204.pdf (last access: 19 September 2024), 2018.
Lange-Bertalot, H.: Navicula sensu stricto, 10 genera separated from Navicula sensu lato, Frustulia, Diatoms of Europe, Vol. 2, Gantner; Koeltz Gantner, Ruggell, Liechtenstein, Königstein, Germany, Ruggell, 526 pp., ISBN 9783904144780, 2001.
Lange-Bertalot, H., Ba?k, M., and Witkowski, A.: Eunotia and some related genera, Diatoms of Europe, Vol. 6, Gantner; Koeltz, Ruggell, Liechtenstein, Königstein, Germany, 747 pp., ISBN 9783906166889, 2011.
Lange-Bertalot, H., Cantonati, M., Kelly, M. G., Gabriele, H., and Marcus, W. (Eds.): Freshwater benthic diatoms of Central Europe: Over 800 common species used in ecological assessment, English edition with updated taxonomy and added species, Koeltz Botanical Books, Schmitten-Oberreifenberg, 942 pp., ISBN 978-3-946583-06-6, 2017.
Lorenz, S.: Die spätpleistozäne und holozäne Gewässernetzentwicklung im Bereich der Pommerschen Haupteisrandlage Mecklenburgs, Dissertation, Universität Greifswald, Greifswald, 351 pp., https://nbn-resolving.org/urn:nbn:de:gbv:9-000425-2 (last access: 19 September 2024), 2007.
Lorenz, S., Adolph, M.-L., Schult, M., Cerný, A., and Besler, C.: Der Schweriner See – ein Blick in die Landschaftsgeschichte, in: Zvarin – Schwerin: Von der Inselburg zur Residenz, edited by: Ruchhöft, F., Landesamt für Kultur und Denkmalpflege Mecklenburg-Vorpommern, Schwerin, 129–141, ISBN 9783935770521, 2017.
Magny, M.: Holocene climate variability as reflected by mid-European lake-level fluctuations and its probable impact on prehistoric human settlements, Quater. Int., 113, 65–79, https://doi.org/10.1016/s1040-6182(03)00080-6, 2004.
Martínez Cortizas, A., Sjöström, J. K., Ryberg, E. E., Kylander, M. E., Kaal, J., López-Costas, O., Álvarez Fernández, N., and Bindler, R.: 9000 years of changes in peat organic matter composition in Store Mosse (Sweden) traced using FTIR-ATR, Boreas, 50, 1161–1178, https://doi.org/10.1111/bor.12527, 2021.
Martin-Puertas, C., Matthes, K., Brauer, A., Muscheler, R., Hansen, F., Petrick, C., Aldahan, A., Possnert, G., and van Geel, B.: Regional atmospheric circulation shifts induced by a grand solar minimum, Nat. Geosci., 5, 397–401, https://doi.org/10.1038/ngeo1460, 2012.
McDermott, F., Atkinson, T. C., Fairchild, I. J., Baldini, L. M., and Mattey, D. P.: A first evaluation of the spatial gradients in δ18O recorded by European Holocene speleothems, Global Planet. Change, 79, 275–287, https://doi.org/10.1016/j.gloplacha.2011.01.005, 2011.
Mellado-Cano, J., Barriopedro, D., García-Herrera, R., Trigo, R. M., and Hernández, A.: Examining the North Atlantic Oscillation, East Atlantic Pattern, and Jet Variability since 1685, J. Climate, 32, 6285–6298, https://doi.org/10.1175/JCLI-D-19-0135.1, 2019.
Mellström, A., van der Putten, N., Muscheler, R., de Jong, R., and Björck, S.: A shift towards wetter and windier conditions in southern Sweden around the prominent solar minimum 2750 cal a BP, J. Quaternary Sci., 30, 235–244, https://doi.org/10.1002/jqs.2776, 2015.
Meyers, P. A. and Ishiwatari, R.: Lacustrine organic geochemistry – an overview of indicators of organic matter sources and diagenesis in lake sediments, Org. Geochem., 20, 867–900, https://doi.org/10.1016/0146-6380(93)90100-p, 1993.
Moffa-Sánchez, P., Born, A., Hall, I. R., Thornalley, D. J. R., and Barker, S.: Solar forcing of North Atlantic surface temperature and salinity over the past millennium, Nat. Geosci., 7, 275–278, https://doi.org/10.1038/ngeo2094, 2014.
Moore, G. W. K. and Renfrew, I. A.: Cold European winters: interplay between the NAO and the East Atlantic mode, Atmos. Sci. Lett., 13, 1–8, https://doi.org/10.1002/asl.356, 2012.
Moore, G. W. K., Pickart, R. S., and Renfrew, I. A.: Complexities in the climate of the subpolar North Atlantic: a case study from the winter of 2007, Q. J. Roy. Meteorol. Soc., 137, 757–767, https://doi.org/10.1002/qj.778, 2011.
Moore, G. W. K., Renfrew, I. A., and Pickart, R. S.: Multidecadal Mobility of the North Atlantic Oscillation, J. Climate, 26, 2453–2466, https://doi.org/10.1175/JCLI-D-12-00023.1, 2013.
Moore, P. D., Webb, J. A., and Collinson, M. E.: Pollen analysis, in: 2nd Edn., Blackwell Scientific Publications, Oxford, 216ṗp., ISBN 0632021764, 1991.
Mügler, I., Sachse, D., Werner, M., Xu, B., Wu, G., Yao, T., and Gleixner, G.: Effect of lake evaporation on δD values of lacustrine n-alkanes: A comparison of Nam Co (Tibetan Plateau) and Holzmaar (Germany), Org. Geochem., 39, 711–729, https://doi.org/10.1016/j.orggeochem.2008.02.008, 2008.
Nakagawa, T.: High-precision sampling of laminated sediments: Strategies from Lake Suigetsu, PAGES Mag., 22, 12–13, https://doi.org/10.22498/pages.22.1.12, 2014.
Nixdorf, B., Hemm, M., Hoffmann, A., and Richter, P.: Dokumentation von Zustand und Entwicklung der wichtigsten Seen Deutschlands: Teil 2 – Mecklenburg-Vorpommern, Brandenburgische Technische Universität Cottbus, Berlin, https://www-docs.b-tu.de/fg-gewaesserschutz/public/projekte/uba_2/02_meck_pom.pdf (last access: 19 September 2024), 2004.
Olsen, J., Anderson, N. J., and Knudsen, M. F.: Variability of the North Atlantic Oscillation over the past 5,200 years, Nat. Geosci., 5, 808–812, https://doi.org/10.1038/ngeo1589, 2012.
PAGES 2k Consortium: Continental-scale temperature variability during the past two millennia, Nat. Geosci., 6, 339–346, https://doi.org/10.1038/ngeo1797, 2013.
Pedersen, T. L., Nicolae, B., and Francios, R.: farver: High Performance Colour Space Manipulation, https://farver.data-imaginist.com/ (last access: 19 September 2024), 2022.
Pleskot, K., Tjallingii, R., Makohonienko, M., Nowaczyk, N., and Szczuciński, W.: Holocene paleohydrological reconstruction of Lake Strzeszyńskie (western Poland) and its implications for the central European climatic transition zone, J. Paleolimnol., 59, 443–459, https://doi.org/10.1007/s10933-017-9999-2, 2018.
Pouzet, P., Maanan, M., Piotrowska, N., Baltzer, A., Stéphan, P., and Robin, M.: Chronology of Holocene storm events along the European Atlantic coast, Prog. Phys. Geogr.t, 42, 431–450, https://doi.org/10.1177/0309133318776500, 2018.
Rach, O., Engels, S., Kahmen, A., Brauer, A., Martín-Puertas, C., van Geel, B., and Sachse, D.: Hydrological and ecological changes in western Europe between 3200 and 2000 years BP derived from lipid biomarker δD values in lake Meerfelder Maar sediments, Quaternary Sci. Rev., 172, 44–54, https://doi.org/10.1016/j.quascirev.2017.07.019, 2017.
Reimer, P. J., Austin, W. E. N., Bard, E., Bayliss, A., Blackwell, P. G., Bronk Ramsey, C., Butzin, M., Cheng, H., Edwards, R. L., Friedrich, M., Grootes, P. M., Guilderson, T. P., Hajdas, I., Heaton, T. J., Hogg, A. G., Hughen, K. A., Kromer, B., Manning, S. W., Muscheler, R., Palmer, J. G., Pearson, C., van der Plicht, J., Reimer, R. W., Richards, D. A., Scott, E. M., Southon, J. R., Turney, C. S. M., Wacker, L., Adolphi, F., Büntgen, U., Capano, M., Fahrni, S. M., Fogtmann-Schulz, A., Friedrich, R., Köhler, P., Kudsk, S., Miyake, F., Olsen, J., Reinig, F., Sakamoto, M., Sookdeo, A., and Talamo, S.: The IntCal20 Northern Hemisphere Radiocarbon Age Calibration Curve (0–55 cal kBP), Radiocarbon, 62, 725–757, https://doi.org/10.1017/RDC.2020.41, 2020.
Ruchhöft, F. (Ed.): Zvarin – Schwerin: Von der Inselburg zur Residenz, Landesamt für Kultur und Denkmalpflege Mecklenburg-Vorpommern, Schwerin, 428 pp., ISBN 9783935770521, 2017.
Sachse, D., Radke, J., and Gleixner, G.: Hydrogen isotope ratios of recent lacustrine sedimentary n-alkanes record modern climate variability, Geochim. Cosmochim. Ac., 68, 4877–4889, https://doi.org/10.1016/j.gca.2004.06.004, 2004.
Sachse, D., Billault, I., Bowen, G. J., Chikaraishi, Y., Dawson, T. E., Feakins, S. J., Freeman, K. H., Magill, C. R., McInerney, F. A., van der Meer, M. T., Polissar, P., Robins, R. J., Sachs, J. P., Schmidt, H.-L., Sessions, A. L., White, J. W., West, J. B., and Kahmen, A.: Molecular Paleohydrology: Interpreting the Hydrogen-Isotopic Composition of Lipid Biomarkers from Photosynthesizing Organisms, Annu. Rev. Earth Planet. Sci., 40, 221–249, https://doi.org/10.1146/annurev-earth-042711-105535, 2012.
Scheffler, W. and Padisák, J.: Stephanocostis chantaicus (Bacillariophyceae): morphology and population dynamics of a rare centric diatom growing in winter under ice in the oligotrophic Lake Stechlin, Germany, Algolog. Stud., 98, 49–69, 2000.
Schmidt, D. F., Grise, K. M., and Pace, M. L.: High-frequency climate oscillations drive ice-off variability for Northern Hemisphere lakes and rivers, Climatic Change, 152, 517–532, https://doi.org/10.1007/s10584-018-2361-5, 2019.
Seierstad, I. A., Stephenson, D. B., and Kvamstø, N. G.: How useful are teleconnection patterns for explaining variability in extratropical storminess?, Tellus A, 59, 170–181, https://doi.org/10.1111/j.1600-0870.2007.00226.x, 2007.
Shindell, D. T., Schmidt, G. A., Mann, M. E., Rind, D., and Waple, A.: Solar forcing of regional climate change during the Maunder Minimum, Science, 294, 2149–2152, https://doi.org/10.1126/science.1064363, 2001.
Sjolte, J., Sturm, C., Adolphi, F., Vinther, B. M., Werner, M., Lohmann, G., and Muscheler, R.: Solar and volcanic forcing of North Atlantic climate inferred from a process-based reconstruction, Clim. Past, 14, 1179–1194, https://doi.org/10.5194/cp-14-1179-2018, 2018.
Sorrel, P., Debret, M., Billeaud, I., Jaccard, S. L., McManus, J. F., and Tessier, B.: Persistent non-solar forcing of Holocene storm dynamics in coastal sedimentary archives, Nat. Geosci., 5, 892–896, https://doi.org/10.1038/ngeo1619, 2012.
Spinoni, J., Vogt, J. V., Naumann, G., Barbosa, P., and Dosio, A.: Will drought events become more frequent and severe in Europe?, Int. J. Climatol., 38, 1718–1736, https://doi.org/10.1002/joc.5291, 2018.
St. Amour, N. A., Hammerlund, D., Edwards, T., and Wolfe, B. B.: New insights into Holocene atmospheric circulation dynamics in central Scandinavia inferred from oxygen-isotope records of lake-sediment cellulose, Boreas, 39, 770–782, https://doi.org/10.1111/j.1502-3885.2010.00169.x, 2010.
Starkel, L., Michczyńska, D., Krąpiec, M., Margielewski, W., Nalepka, D., and Pazdur, A.: Progress in the Holocene chrono-climatostratigraphy of Polish territory, Geochronometria, 40, 1–21, https://doi.org/10.2478/s13386-012-0024-2, 2013.
Strobel, P., Haberzettl, T., Bliedtner, M., Struck, J., Glaser, B., Zech, M., and Zech, R.: The potential of δ2Hn-alkanes and δ18Osugar for paleoclimate reconstruction – A regional calibration study for South Africa, Sci. Total Environ., 716, 137045, https://doi.org/10.1016/j.scitotenv.2020.137045, 2020.
Strobel, P., Struck, J., Zech, R., and Bliedtner, M.: The spatial distribution of sedimentary compounds and their environmental implications in surface sediments of Lake Khar Nuur (Mongolian Altai), Earth Surf. Proc. Land., 46, 611–625, https://doi.org/10.1002/esp.5049, 2021.
Strobel, P., Bliedtner, M., Carr, A. S., Struck, J., Du Plessis, N., Glaser, B., Meadows, M. E., Quick, L. J., Zech, M., Zech, R., and Haberzettl, T.: Reconstructing Late Quaternary precipitation and its source on the southern Cape coast of South Africa: A multi-proxy paleoenvironmental record from Vankervelsvlei, Quaternary Sci. Rev., 284, 107467, https://doi.org/10.1016/j.quascirev.2022.107467, 2022a.
Strobel, P., Struck, J., Bazarradnaa, E., Zech, M., Zech, R., and Bliedtner, M.: Precipitation and Lake Water Evaporation Recorded by Terrestrial and Aquatic n-Alkane δ2H Isotopes in Lake Khar Nuur, Mongolia, Geochem. Geophy. Geosy., 23, 1–10, https://doi.org/10.1029/2021GC010234, 2022b.
Swindles, G. T., Plunkett, G., and Roe, H. M.: A delayed climatic response to solar forcing at 2800 cal. BP: multiproxy evidence from three Irish peatlands, Holocene, 17, 177–182, https://doi.org/10.1177/0959683607075830, 2007.
Theuerkauf, M., Blume, T., Brauer, A., Dräger, N., Feldens, P., Kaiser, K., Kappler, C., Kästner, F., Lorenz, S., Schmidt, J.-P., and Schult, M.: Holocene lake-level evolution of Lake Tiefer See, NE Germany, caused by climate and land cover changes, Boreas, 51, 299–316, https://doi.org/10.1111/bor.12561, 2022.
Trouet, V., Scourse, J. D., and Raible, C. C.: North Atlantic storminess and Atlantic Meridional Overturning Circulation during the last Millennium: Reconciling contradictory proxy records of NAO variability, Global Planet. Change, 84–85, 48–55, https://doi.org/10.1016/j.gloplacha.2011.10.003, 2012.
Umweltministerium Mecklenburg-Vorpommern (Ed.): Die Naturschutzgebiete in Mecklenburg-Vorpommern, Demmler, Schwerin, 713 pp., ISBN 978-3910150522, 2003.
Usoskin, I. G., Solanki, S. K., and Kovaltsov, G. A.: Grand minima and maxima of solar activity: new observational constraints, Astron. Astrophys., 471, 301–309, https://doi.org/10.1051/0004-6361:20077704, 2007.
van Exem, A., Debret, M., Copard, Y., Jacq, K., Verpoorter, C., Marcotte, S., Laignel, B., and Vannière, B.: Hyperspectral Core-Logging for Past Primary Productivity Assessment, Quaternary, 5, 53, https://doi.org/10.3390/quat5040053, 2022.
van Geel, B., Heusser, C. J., Renssen, H., and Schuurmans, C. J.: Climatic change in Chile at around 2700 BP and global evidence for solar forcing: a hypothesis, Holocene, 10, 659–664, https://doi.org/10.1191/09596830094908, 2000.
van Geel, B., Heijnis, H., Charman, D. J., Thompson, G., and Engels, S.: Bog burst in the eastern Netherlands triggered by the 2.8 kyr BP climate event, Holocene, 24, 1465–1477, https://doi.org/10.1177/0959683614544066, 2014.
Vassiljev, J.: The simulated response of lakes to changes in annual and seasonal precipitation: implication for Holocene lake-level changes in northern Europe, Clim. Dynam., 14, 791–801, 1998.
von Wiebeking, C. F.: Karte nach Wiebeking 1786, Originalmaßstab 1: 24 000, in: Historischer Atlas von Mecklenburg, Sonderreihe, Blatt 15 – Schweriner See, Blatt 21 – Schwerin, edited by: Engel, F., Böhlau, 1960.
Weltje, G. J. and Tjallingii, R.: Calibration of XRF core scanners for quantitative geochemical logging of sediment cores: Theory and application, Earth Planet. Sc. Lett., 274, 423–438, https://doi.org/10.1016/j.epsl.2008.07.054, 2008.
Wirth, S. B. and Sessions, A. L.: Plant-wax ratios in the southern European Alps record multiple aspects of climate variability, Quaternary Sci. Rev., 148, 176–191, https://doi.org/10.1016/j.quascirev.2016.07.020, 2016.
Wöbbecke, K., Klett, G., and Rechenberg, B.: Wasserbeschaffenheit der wichtigsten Seen in der Bundesrepublik Deutschland: Datensammlung 1981–2000, 36/2003, 153 pp., https://www.umweltbundesamt.de/sites/default/files/medien/publikation/long/2314.pdf (last access: 19 September 2024), 2003.
Woollings, T., Hannachi, A., and Hoskins, B.: Variability of the North Atlantic eddy-driven jet stream, Q. J. Roy. Meteorol. Soc., 136, 856–868, https://doi.org/10.1002/qj.625, 2010.
Yang, D. and Bowen, G. J.: Integrating plant wax abundance and isotopes for paleo-vegetation and paleoclimate reconstructions: a multi-source mixing model using a Bayesian framework, Clim. Past, 18, 2181–2210, https://doi.org/10.5194/cp-18-2181-2022, 2022.
Zahrer, J., Dreibrodt, S., and Brauer, A.: Evidence of the North Atlantic Oscillation in varve composition and diatom assemblages from recent, annually laminated sediments of Lake Belau, northern Germany, J. Paleolimnol., 50, 231–244, https://doi.org/10.1007/s10933-013-9717-7, 2013.
Zech, M., Zech, R., Rozanski, K., Gleixner, G., and Zech, W.: Do n-alkane biomarkers in soils/sediments reflect the δ2H isotopic composition of precipitation? A case study from Mt. Kilimanjaro and implications for paleoaltimetry and paleoclimate research, Isotop. Environ. Health Stud., 51, 508–524, https://doi.org/10.1080/10256016.2015.1058790, 2015.