the Creative Commons Attribution 4.0 License.
the Creative Commons Attribution 4.0 License.
 | 11 Sep 2024
The climate and vegetation of Europe, northern Africa, and the Middle East during the Last Glacial Maximum (21 000 yr BP) based on pollen data
Marc Fasel
Jed O. Kaplan
Emmanuele Russo
Ariane Burke
Pollen data represent one of the most widely available and spatially resolved sources of information about the past land cover and climate of the Last Glacial Maximum (LGM; 21 000 yr BP). Previous pollen data compilations for Europe, the Mediterranean, and the Middle East, however, have been limited by small numbers of sites and poor dating control. Here we present a new compilation of pollen data from the region that improves on both the number of sites (63) and the quality of the chronological control. Data were sourced from both public data archives and published (digitized) diagrams. The analysis is presented based on a standardized pollen taxonomy and sum, with maps shown for the major pollen taxa and biomes and the total arboreal pollen (AP), and on quantitative reconstructions of forest cover and of winter, summer, and annual temperatures and precipitation. The reconstructions are based on the modern analogue technique (MAT) adapted using plant functional type (PFT) scores and with a modern pollen dataset taken from the latest Eurasian Modern Pollen Database (EMPD) (∼8000 samples). A site-by-site comparison of the MAT and the inverse modelling method shows little or no significant difference between the methods for the LGM, indicating that the presence of low-CO2 conditions and no modern analogue during the LGM does not appear to have had a major effect on MAT transfer function performance. Previous pollen-based climate reconstructions using modern pollen datasets show a much colder and drier climate for the LGM than both inverse modelling and climate model simulations do, but our new results suggest much greater agreement. Differences between our latest MAT reconstruction and those in earlier studies can largely be attributed to bias in the small modern dataset previously used and to differences in the method itself (Brewer et al., 2008; Salonen et al., 2019). We also find that quantitative forest cover reconstructions show more forest than previously suggested by biome reconstructions but less forest than suggested by simply the percentage of arboreal pollen, although uncertainties remain large. Overall, we find that LGM climatic cooling and drying were significantly greater in winter than in summer but with large site-to-site variance that emphasizes the importance of topography and other local factors in controlling the climate and vegetation of the LGM.
- Article
(19106 KB) - Full-text XML
-
Supplement
(747 KB) - BibTeX
- EndNote


During the Last Glacial Maximum (LGM) ∼21 000 yr BP (Mix et al., 2001), the climate, vegetation, and landscape of Europe and its surrounding regions were very different than today. Scandinavia and a large part of the British Isles were covered by a single ice sheet, with separate ice sheets covering the Alps and the Pyrenees, while many smaller and lower mountainous areas were also glaciated (Ehlers et al., 2011). As a result of this global build-up of ice on land, sea levels were around 120 m lower than today, resulting in the retreat of Atlantic and Mediterranean coastlines and the emergence on land of the English Channel and the North Sea basin. Falling sea levels also led to the disconnection of the Black Sea from the Mediterranean and to a subsequent drop in Black Sea water levels as evaporation exceeded inflow (Arslanov et al., 2007). On land, permafrost and periglacial processes occurred immediately to the south of the Scandinavian ice sheet, while the massive discharge of glacial clays and sands provided material to be redeposited by the wind as belts of loess across northern France, Benelux, Germany, and central Europe (Lehmkuhl et al., 2021). Under these cooler and drier climatic conditions, forests are thought to have retreated to the relative shelter of southern Europe and the Mediterranean, while relatively unproductive steppe and tundra dominated the region north of the Alps (Grichuk, 1992).
This traditional view of the LGM has been established for many years, but many details concerning the climate and vegetation of the LGM are still debated. Much of this debate concerns information derived from the pollen record, which represents one of the most widely available and spatially resolved sources of information concerning LGM vegetation and climate, and the primary terrestrial proxy used to evaluate climate models in the Paleoclimate Modelling Intercomparison Project (PMIP) (Bartlein et al., 2011; Braconnot et al., 2012; Harrison et al., 2014).
For example, climate model simulations continue to indicate a climate that is less cold and more humid than pollen-based reconstructions (Jost et al., 2005). These results are similar to reconstructions based on glaciological modelling (Allen et al., 2008b). On the other hand, the pollen-based reconstructions that show the greatest disagreement with climate models have themselves been criticized for not considering the possible effect of low atmospheric CO2 on the physiological relationship between plants and climate (Ramstein et al., 2007). Methods that use modern pollen samples are based on the assumption that the relationship between vegetation and climate remains the same through time and that this is independent of change in CO2 concentration. Studies have shown, however, that plant growth processes and plant resilience are sensitive to CO2 concentration and particularly to water-use efficiency which would make plants more drought-sensitive in low-CO2 environments (Cowling and Sykes, 1999). Atmospheric CO2 during the LGM was around 190 ppm, some 100 ppm lower than the pre-industrial period and 200 ppm lower than the levels experienced in the last 50 years. Concerns about the effects of lower CO2 during the LGM have directly led to the development of pollen–climate reconstruction methods that can take account of CO2 effects, either through the use of a process-based vegetation model run in inverse mode (Guiot et al., 2000) or through the use of a correction algorithm (Prentice et al., 2017; Cleator et al., 2020). Pollen–climate reconstructions based on inverse modelling that account for these low-CO2 effects show less cooling and drying and consequently greater agreement with climate models (Ramstein et al., 2007; Wu et al., 2007, 2019; Izumi and Bartlein, 2016).
Further data–model discrepancies have also been highlighted concerning LGM vegetation cover. Earlier pollen synthesis studies, especially those that applied the biomization method (Elenga et al., 2000), give the impression that non-glaciated areas of LGM Europe were dominated by treeless steppe, while vegetation models driven by climate model simulations indicate large areas of forest and woodlands (Binney et al., 2017; Kaplan et al., 2016; Velasquez et al., 2021). The apparent data–model discrepancy associated with steppe has led to the suggestion that early humans, who are not included in vegetation models, could have reduced the forest cover with only a relatively moderate use of fire because of the cold climate and slow speed of vegetation recovery (Kaplan et al., 2016). This debate is important because of studies that have shown the sensitivity of the climate system to vegetation boundary conditions during the LGM (Ludwig et al., 2017; Velasquez et al., 2021). This suggests that accurate knowledge of the vegetation cover during the LGM is a necessary prerequisite to understanding the role of other influences on the climate system at this time.
More recent pollen and macrofossil studies from eastern central Europe have shown that, at least in this region, there existed areas of open boreal forest and woodland with some temperate broadleaf species (Kuneš et al., 2008; Willis and Van Andel, 2004). The evidence of forest, and particularly elements of temperate broadleaf forest, north of the Alps has come to represent a challenge to the traditional view that forest species only survived the LGM in sheltered refugia far to the south of the Fennoscandian ice sheet and close to the moderating influence of the Mediterranean Sea. The presence of micro-refugia north of the Alps is important because it would represent a very different baseline for understanding the later rate and route of plant migrations under the rapid warming that occurred during the Late Glacial to Holocene transition (Douda et al., 2014; Giesecke, 2016; Krebs et al., 2019; Nolan et al., 2018) and for understanding patterns of present-day genetic diversity (Normand et al., 2011; Svenning et al., 2008). Modelling studies have shown difficulty in supporting the very high rates of postglacial expansion that would be necessary for southern refugia (Feurdean et al., 2013; Nogués-Bravo et al., 2018).
Much of this debate has been informed by an increasing number of LGM pollen studies from an ever-broader geographical area and especially by an increasing number of studies north of the Alps. Nevertheless, the synthesis of these studies into a single narrative is made difficult by several factors, for instance, different taxonomic definitions, pollen percentages calculated from non-standardized pollen sums, and quantitative analyses such as climate reconstructions that are based on different training sets and methodologies. This has led to some modelling studies ignoring the pollen record completely, on the basis that data from the LGM are too scarce (Janská et al., 2017). Where standardized methods have been applied to multiple LGM pollen records, poor dating control has resulted in the inclusion of many records that may not actually be from the selected LGM time window. This is particularly important because the 21±2.0 ka time slice commonly used to represent the LGM period in PMIP data–model comparisons and other synthesis studies (MARGO members, 2009; Bartlein et al., 2011) occurs immediately after the glacial maxima in the Alps around 26–23 ka (Heiri et al., 2014; Spötl et al., 2021) and Heinrich Stadial 2 (HS2; 24.3–26.5) whilst also being closely followed by Heinrich Stadial 1 (HS1; 15.6–18.0 ka) (Sanchez-Goñi and Harrison, 2010). These closely associated time periods can therefore be expected to represent both a different vegetation and climate than the LGM itself.
For example, of the 18 European pollen records used in the PMIP benchmarking dataset (Bartlein et al., 2011), 10 fall into the worst class (“poor”) in the COHMAP chronological quality classification scheme if relative dating such as pollen correlation is excluded. More recent synthesis studies have also relied heavily on records from the European Pollen Database (EPD), which currently has 116 records with samples of LGM age (as of June 2022). Many of these records, however, are based on chronologies that are regarded as reliable for the Holocene (Giesecke et al., 2014) but have large uncertainties for the LGM as a result of (1) excessive extrapolation back in time from Holocene-age dates, (2) the use of pollen correlation or other relative dating despite poorly defined regional biostratigraphy, or (3) the inappropriate use of radiocarbon dates contaminated with old carbon. We found that 104 of these 116 EPD records (Williams et al., 2018) fall into the worst class (“poor”) in the COHMAP chronological quality classification.
Here we address these problems using a new synthesis of LGM pollen records from throughout Europe, the Mediterranean, and the Middle East (EurMedMidEst) based on rigorous quality-control criteria. Records were compiled from an extensive review of public databases and archives and of the scientific literature. Pollen records were selected according to the robustness of their chronological control around the PMIP LGM time window (21±2 ka) and combined into a single dataset based on a harmonized taxonomy and standardized pollen sum. The dataset was then analysed so that standardized maps could be produced to show the distribution of the major pollen taxa and biomes and the total arboreal pollen (AP) at the LGM. In addition, quantitative reconstructions of forest cover and of winter, summer, and annual temperatures and precipitation were undertaken using a modified version of the standard modern analogue technique (MAT) (Guiot et al., 1989) utilizing the latest Eurasian Modern Pollen Database (EMPD) v2 dataset. These climate reconstructions are compared and evaluated against previous LGM pollen–climate reconstructions and reconstructions based on other proxies. The dataset and results are fully documented, and the complete data files are provided in the Supplement.
2.1 Pollen data
LGM fossil pollen data from Europe and bordering regions including northern Africa and the Middle East were selected and collated into a single standardized project database. These data were sourced from the EPD/Neotoma database (Williams et al., 2018), the Pangaea data archive, publications in scientific journals, and the original authors. We selected LGM pollen sites and data according to strict quality-control criteria. Where possible, primary raw pollen counts were used when these were available. When the original electronic data were not available, the data were digitized from the published diagram. Overall we have included 63 records in our study, of which 35 were digitized and 28 consisted of the original pollen counts (Table 1).
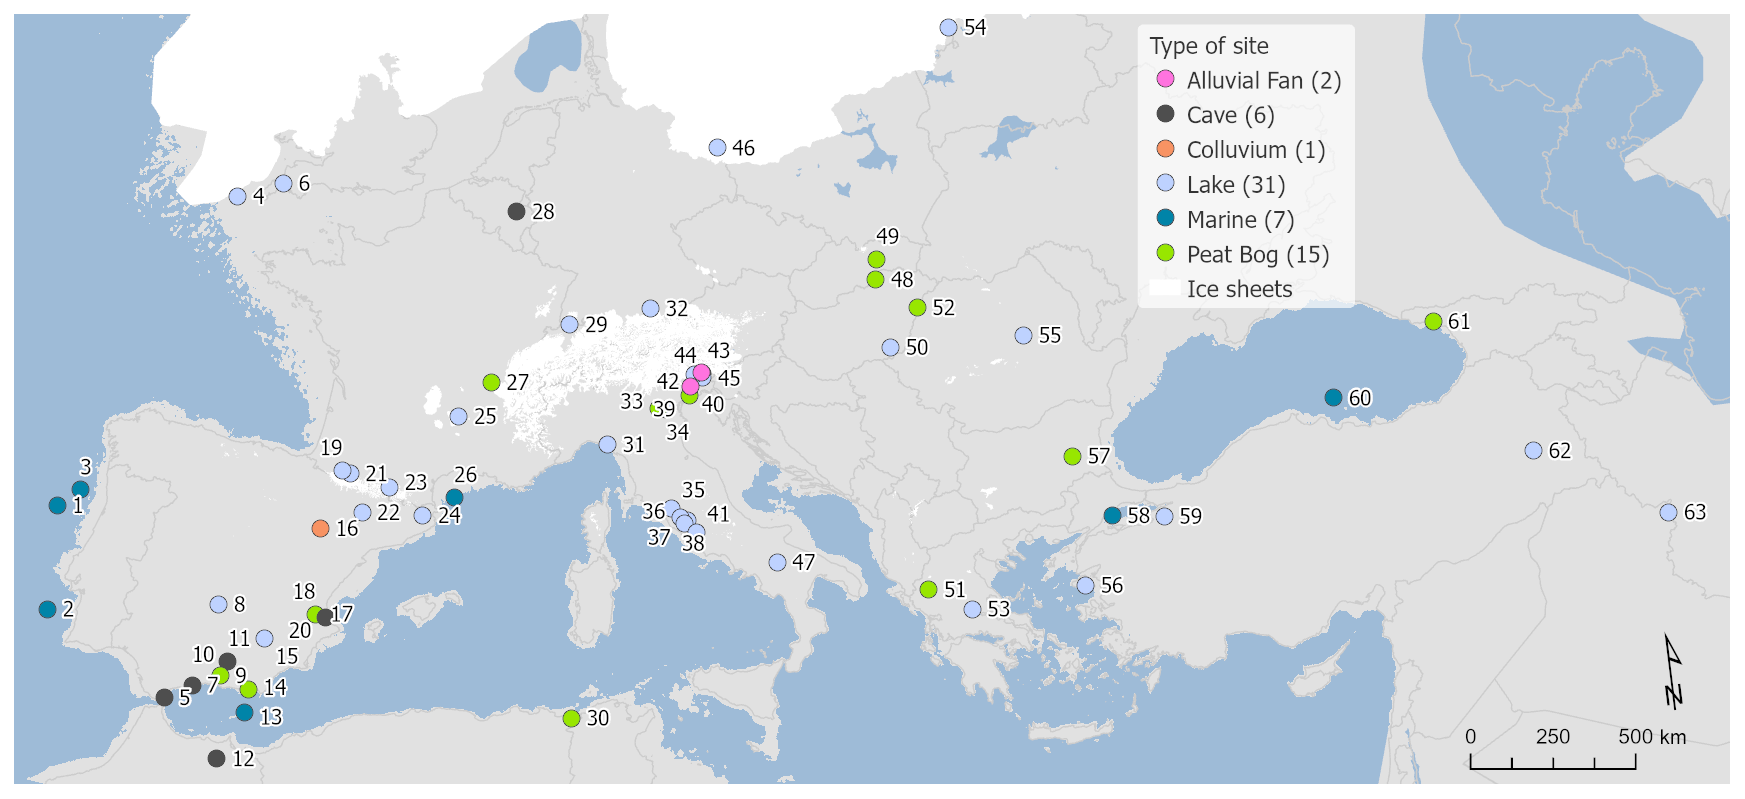
Figure 1Site locations and archives (site numbers are as shown in Table 1).
The distribution of the 63 sites reflects the distribution of suitable archives, with fewer records available from climatically or environmentally challenging regions (Fig. 1). High rates of erosion and a drier and colder climate during the LGM reduced the number of suitable anoxic sediment sinks for pollen preservation, especially in central Europe between the Scandinavian and Alpine ice sheets. Nevertheless, our dataset includes sites from this region and sites in northern Africa and eastern central Europe through to Iran, although most sites are located in an arc across eastern Spain, the Alps, and Italy. Lake sites comprise the most numerous archive and tend to be located in the more sheltered and topographically favourable regions of southern Europe and the Mediterranean. Peat is the next most important archive, followed by alluvial and colluvial sediments and by cave sites, the latter also often being known for their archaeological significance. Sites located at the ice margins that appear to be under the ice reflect uncertainties in the location of the ice margin both in time and space during the LGM and reflect the fact that the selected time window for this study (21±2 ka) is later than the maximum ice advance in some regions (Hughes and Gibbard, 2015). For completeness, we also include seven marine records which have the advantage of more continuous deposition and often better dating over the LGM period but which are prone to taphonomic biases compared to terrestrial records. These biases are discussed later in this section.
LGM pollen records were selected according to a number of quality-control criteria, but primary amongst these was the existence of sufficient independent chronological control points to accurately identify samples that would fall within the 21±2 ka BP time slice of interest. We have used all of the samples within this time frame where the samples have been available in electronic form, or else we have used the sample closest to the target time (21 ka BP). For records taken from the EPD, we have used the latest Bayesian age–depth models where these were available (Giesecke et al., 2014), otherwise we have used the dates and chronology proposed by the original authors. We classified chronologies according to the COHMAP chronological quality scheme for the LGM period (Anderson et al., 1988; Yu and Harrison, 1995), which classifies record quality from 1–6 depending on whether a date falls within 2000 14C years (or less) of the time being assessed or whether bracketing dates fall within 6000 and 8000 14C years (or less) of the time being assessed (Fig. A1). Chronologies based on dates that fall outside of these limits fall into COHMAP class 7 and are regarded as “poorly dated” with respect to the LGM. Importantly, we have only included radiometric and other absolute dates (such as varves) in this assessment and have excluded dates based on correlation with regional pollen records. These pollen-based stratigraphic dates have been widely used in previous LGM studies but do not include estimates of uncertainty and are generally regarded as unreliable at this time given the sparsity of well-dated pollen sites and samples on which to base any correlation (Giesecke et al., 2014).
All records that were classified as poorly dated (COHMAP class 7) were subsequently excluded from our analysis. This means that many of the pollen records used in previous studies were excluded, including 16 of the 26 LGM records used by PMIP and associated studies in Europe (Bartlein et al., 2011; Elenga et al., 2000; Tarasov et al., 2000; Jost et al., 2005; Peyron et al., 1998; Wu et al., 2007; Cleator et al., 2020). We also excluded 104 of the 116 records in the EPD with samples that fall within our LGM time window. Many of these EPD pollen records have been used in more recent studies, although the exact record (EPD entity number) is often not stated. We estimate that we have excluded 16 of the 17 European sites used by Binney et al. (2017) (this study only included sites above latitude 40° N), 5 of the 6 European sites used by Allen et al. (2010), 28 of the 33 sites used by Cao et al. (2019), and 27 of the 71 sites used by Kaplan et al. (2016).
Other quality-control criteria were also used in the selection of LGM pollen records. Published pollen diagrams that only included a small part of the terrestrial pollen assemblage or only presented summary taxa were excluded. Records were also excluded where the dating information was incomplete, for instance, where radiocarbon dating uncertainties were not published or where it was not possible to determine if the date shown was in calibrated or uncalibrated radiocarbon years.
The modern pollen data for the climate and tree-cover reconstructions were sourced from the latest version 2 of the Eurasian Modern Pollen Database (Davis et al., 2020), which is managed as part of the EPD. EMPD2 includes 8133 modern pollen samples from across the Palearctic biogeographic region from Europe to the far east of Asia. The taxa from both the fossil and modern pollen data were consolidated into 120 of the most commonly occurring terrestrial taxa types. This taxa list was designed to be compatible with the biomization scheme used in our study (Peyron et al., 1998; Tarasov et al., 2000) and that used in the Holocene mapping study of Brewer et al. (2017). The count of Larix was amplified by a factor of 10 due to its low pollen representation (Edwards et al., 2000; Bigelow et al., 2013; Tarasov et al., 1998, 2000, 2013; Binney et al., 2017).
2.2 Biomization
We converted pollen assemblages to biomes based on the European biomization scheme of Peyron et al. (1998), which in turn is based on Prentice et al. (1996). The method is described in detail in Collins et al. (2012). We expanded the number of taxa included in the biomization procedure proposed by Peyron et al. (1998) to include taxa from the northern Eurasian biomization procedure of Tarasov et al. (1998). The inclusion of additional northern Eurasian taxa reflects recent evidence that modern analogues of LGM vegetation occur in parts of Siberia (Magyari et al., 2014a). The biomization procedure (Prentice et al., 1996) assigns each taxon to a plant functional type (PFT) and calculates a score for each of these PFTs based on the sum of the square root of the percentage of each of the taxa included in that PFT. To reduce the influence of long-distance transport, taxa below 0.5 % are removed at the start of the procedure. Each biome is then assigned one or more PFTs, and a score for each biome is calculated as the sum of the associated PFT scores. The biome with the highest score is then viewed as the dominant biome. Where the highest score is the same for more than one biome, the dominant biome is decided based on a hierarchy of unique PFTs. Peyron et al. (1998) also included a procedure for distinguishing warm and cold steppe biomes based on re-assigning certain steppe PFTs according to the presence or lack of PFTs indicative of cold or warm conditions. Following the BIOME 6000 project (Elenga et al., 2000) and Allen et al. (2010), we did not apply this additional procedure, and we present only the merged steppe biome. In summary, the biomization procedure categorized 39 arboreal pollen taxa and 39 non-arboreal taxa into 22 plant functional types (PFTs), which were then combined into 12 biomes.
2.3 Quantitative climate reconstruction
We reconstructed climate from pollen data based on a modified modern analogue technique (MAT) (Guiot et al., 1989) that used PFT scores to match fossil samples with modern pollen samples (as used by Davis et al., 2003). Other methods using PFT scores and artificial neural network techniques have been developed to reconstruct the climate of Europe during the LGM from pollen data (Peyron et al., 1998; Jost et al., 2005). PFT scores have been used in previous large-scale European pollen-based climate reconstructions for the Holocene (Davis et al., 2003; Mauri et al., 2014, 2015), where performance was found to be better than the conventional approach based on individual taxa (e.g. Marsicek et al., 2018). A particular advantage of the PFT approach for the LGM is that it can help overcome problems associated with vegetation (pollen) assemblages that may have no modern analogue (Davis et al., 2003). This can be a problem during the LGM, when the climate and environment could be expected to be very different from today and when many taxa formed unusual vegetation assemblages as a result of their forced retreat to sheltered refugia locations. The problem of modern analogues is also addressed in our reconstruction by using the latest EMPD2 modern pollen dataset. EMPD2 provides a large number of potential modern analogues for many different LGM vegetation types and climates found today across the Palearctic region. PFT scores were calculated according to the methods already outlined in the Biomization section then normalized so that each sample was proportional to every other sample (Juggins and Birks, 2012).
The MAT method was applied using the rioja package for R (Juggins, 2020). The modern pollen data were taken from the latest version 2 of the EMPD (as detailed earlier). EMPD2 includes 8133 samples, which is considerably larger than the modern datasets used in previous LGM pollen-based reconstructions. For instance, Peyron et al. (1998) used a modern pollen dataset of 683 samples, which was updated by Jost et al. (2005) to include an additional 185 samples. These datasets were also mainly taken from the steppes of Kazakhstan and Mongolia, while EMPD2 covers a much wider area, spanning most of the Eurasian Palearctic region (Davis et al., 2020). The size and distribution of the modern training set in climate and vegetation space is important because, in order for the method to work effectively, it is necessary to have samples representative of the likely vegetation and climate space that could be occupied by the fossil assemblage (Turner et al., 2021; Chevalier et al., 2020; Salonen et al., 2012; Juggins, 2013).
A known problem with the MAT is the role of spatial auto-correlation in providing unrealistically low estimates of uncertainty (Chevalier et al., 2020; Telford and Birks, 2009). This results from the fact that closely analogous modern pollen samples can also be located closely in physical space and therefore in climate space. To reduce this problem, it is possible to exclude closely located samples from the analogue-matching process using a filter based on a set distance (h-block filter) (Telford and Birks, 2009). While this approach can help, there are also three main problems associated with it. The first is error substitution, since removing samples also reduces the number of potential analogues, creating a different source of error that is not easy to categorize. Secondly, multiple samples taken from the same location are actually a strength of pollen training sets, since they are more likely to capture the full range of the assemblage diversity associated with a given climate. Thirdly, current methods that limit spatial range, such as the h-block filter, only do so on the horizontal axis and do not consider the fact that samples can also be found at different elevations. In hilly or mountainous regions, samples can therefore be excluded because they are closely located in horizontal space, but in fact they actually occupy very different climates and vegetation associations, contradicting the logical premise of the h-block filter. It was therefore decided not to apply this filter.
Uncertainties for the pollen–climate reconstructions were calculated using a standard method for the MAT (Juggins, 2020) based on the spread of the climates associated with the best modern pollen analogues used for each fossil sample. The closer the climates of the best modern pollen analogues (six in the case of this study), the smaller the calculated uncertainties assigned to the reconstructed climate of the fossil pollen sample.
Climate reconstructions are presented as anomalies. These have been calculated with respect to modern climate (1970–2000 average) at each core site location using WorldClim 2 (Fick and Hijmans, 2017) (Table A1), which was also used to assign the modern climate for the modern pollen samples in the transfer function (Davis et al., 2020).
2.4 Marine pollen records
We have included marine pollen records in our analysis for reasons explained below, but it is important that these records be viewed with caution, particularly when used for biome and quantitative MAT reconstructions and when compared with terrestrial records from different archives. Biomization methods have been applied to individual marine pollen records (Combourieu Nebout et al., 2009) and to multi-site synthesis studies such as the ACER project (ACER project members et al., 2017). However, marine records were specifically excluded from the BIOME 6000 project (Elenga et al., 2000). Similarly, quantitative climate methods have been applied to individual marine pollen records (Combourieu Nebout et al., 2009; Fletcher et al., 2010) and to multi-site synthesis studies (Sánchez Goñi et al., 2005; Brewer et al., 2008; Salonen et al., 2021). However, marine records have also been specifically excluded from other major pollen–climate studies (Cheddadi et al., 1996; Davis et al., 2003; Marsicek et al., 2018) and from quantitative forest cover reconstructions (Zanon et al., 2018).
Discussions on the advantages and problems associated with marine records can be found elsewhere (Chevalier et al., 2020; Daniau et al., 2019) but are reviewed briefly here where relevant to the methodologies applied in this study. Marine sedimentary records provide continuous and well-dated pollen records for the LGM that are often lacking from many terrestrial regions, especially in arid areas with few alternative anaerobic sediment sinks. Conversely, pollen source areas for marine sites may be many hundreds of kilometres from the coring site and may be liable to change through time in response to changes in distance to the coastline, rates of river discharge, and ocean and atmospheric dynamics. This can theoretically give rise to changes in the vegetation shown in the pollen assemblage recorded at the marine site without any actual change in climate or other environmental pressure. The large and indeterminable source area of marine records also means that it is difficult to apply quantitative MAT reconstruction methods, not least because the mean climate or forest cover of the source area is almost impossible to determine. In addition, the fossil pollen record and the modern pollen dataset to which it is being compared are composed largely of terrestrial lakes and bog sites with much smaller and more homogeneous source areas. This creates a series of problems, the more obvious of which is the calculation of anomalies, since we cannot assume that the modern climate at the (marine) coring site location is representative of the (terrestrial) source area. In this study we have taken the closest point on land as the modern climate for the calculation of anomalies, but we provide the absolute values for all sites so that these can be recalculated if necessary (Table A1). The next problem is that the large source area may capture a combination of different vegetation types that is not going to be represented in a modern pollen dataset based on samples from terrestrial sites with much smaller source areas, for instance, a mixture of coastal and mountain vegetation or even vegetation from different continents (Magri and Parra, 2002). However, in our analysis we did not find any sample from a marine record (or terrestrial record) that did not have a reasonable modern analogue in our training set (chord distance < 0.3) (Huntley, 1990), even though we did not adjust the pollen assemblage for the over-representation of Pinus (and other Pinaceae) in the marine pollen samples.
Typically, the Pinaceae component is excluded from the terrestrial pollen sum when calculating percentages for marine pollen samples, and in some cases it has been excluded entirely from the samples used in marine pollen–climate reconstructions (Combourieu Nebout et al., 2009). The problem with excluding Pinus is twofold: Pinus often represents the main forest-forming tree in the Köppen Csb climate zone on the Atlantic coast where many marine sites are located (García-Amorena et al., 2007), and it also represents the most abundant tree taxa in Europe during the LGM (Fig. A11).
The effect of excluding Pinaceae on the biomization algorithm and MAT climate reconstruction process has not been widely investigated. We therefore decided to evaluate this problem for (1) biomization and (2) pollen–climate reconstruction. In Table A2 we show the biomization results for 8213 modern pollen samples taken from the EMPD2 modern pollen database. Using this as the control, we then artificially varied the number of Pinaceae (Pinus, Abies, and Picea) in the assemblage of each pollen sample and compiled the results (Table A2). This shows quite clearly that removing all of the Pinaceae has a much more profound effect on the biomization process than artificially inflating the number of Pinaceae does (as might be expected in a marine sample where Pinaceae can be over-represented). Even when the number of Pinaceae was artificially inflated by as much as 400 % of the original value, the biomes were changed in only 2348 samples, compared to 5860 samples if all the Pinaceae were removed entirely. In terms of the effects on individual biomes, removing the Pinaceae considerably increased the amount of cold deciduous forest (CLDE), steppe (STEP), and tundra (TUND) while greatly reducing the amount of xerophytic woodlands (XERO), almost eliminating the amount of taiga (TAIG), and completely eliminating the cool conifer forest (COCO) biome. In contrast, the effect of inflating the number of Pinaceae tended to be more evenly distributed between the biomes, with the biggest increase seen in TUND and the biggest decrease seen in STEP. This suggests that, even if the over-representation of Pinaceae was quite extreme in marine pollen samples, the effect on biome classification (and, by definition, the underlying PFT scores) is less than removing Pinaceae completely from the pollen assemblage.
In a second test, we compared the reconstruction of LGM climate from marine pollen samples when Pinaceae were included and excluded. The results are shown in Table A3 and indicate that reconstructed temperatures are generally 1–2 °C cooler and that precipitation is slightly higher when Pinaceae are excluded. The differences between the two methods, however, are small and generally less than half of the uncertainties, suggesting that differences are statistically indistinguishable when considered in the context of the overall uncertainties.
In summary, we find that including Pinaceae in the biomization process is less likely to lead to misassignment of the biome than excluding Pinaceae is, except in extreme cases of over-representation. Percentages of Pinaceae in the LGM marine samples range on average between 23 %–88 %, suggesting that, while the percentage of Pinaceae was high at some sites, it does not appear to completely overwhelm the assemblage as might be expected if over-representation were to be a significant problem. We also find that including Pinaceae in the pollen assemblage of the LGM marine pollen samples gives pollen–climate reconstructions that are statistically indistinguishable from those obtained by excluding Pinaceae from the assemblage. Including Pinaceae in marine samples also provides compatibility with terrestrial samples, particularly when calculating and plotting pollen taxa percentages. For these reasons we have included Pinaceae in the analysis of all marine pollen samples in this study, although it is important to recognize that Pinaceae in such samples can be subject to over-representation and that the results presented here from marine sites should consequently be viewed with caution.
2.5 Quantitative tree-cover reconstruction
It has long been recognized that the proportional representation of individual pollen taxa in a pollen assemblage does not necessarily reflect the proportion of land area covered by those taxa in the pollen source area surrounding the sample site (Davis, 1963; Gaillard et al., 2010; Zanon et al., 2018). These differences can be caused by variations in pollen productivity, differential transport, deposition and preservation of pollen grains, and even the ease or difficulty in identifying pollen grains themselves. This can make the interpretation of pollen taxa percentages difficult, even for relatively simple questions such as the proportion of forest to non-forest in the landscape.
There have been two main methods developed to account for this quantification problem, with one using a physical modelling technique (PMT) based on estimates of pollen production for individual taxa (Gaillard et al., 2010) and the other using a MAT very similar to that used in pollen–climate reconstructions (Williams and Jackson, 2003). Both approaches have been widely applied during the Holocene in Europe (Zanon et al., 2018), but we know of no previous study that has applied either of these approaches to the LGM. The LGM presents a number of challenges, not least the problem of potential missing vegetation analogues and of low atmospheric CO2, which has been shown to influence pollen productivity (Leroy and Arpe, 2007).
Here we use the MAT to provide quantitative estimates of forest cover, following the approach of Zanon et al. (2018), who applied this method to the Holocene pollen record of Europe. We apply the MAT in exactly the same way as for the climate reconstructions described earlier, including the use of PFT scores to match fossil and modern pollen samples. Instead of modern climate values, we assigned an estimate of modern forest cover to each of our modern pollen sites. To do this, we used a high-resolution (∼100 m) remote-sensing dataset derived from satellite observations (Hansen et al., 2013). Zanon et al. (2018) showed that the MAT calibrated in this way gives comparable results to the PMT approach in Europe, at least for the Holocene. One of the main differences, however, is that the PMT is designed to provide estimates of the proportions of different taxa, whereas the MAT (as applied here) is designed to provide estimates of the proportion of forest cover. Where the PMT can only reconstruct the proportion of forest-forming trees, irrespective of their size, the MAT (following Zanon et al., 2018) is calibrated specifically to reconstruct forest composed of trees over 5 m tall. This follows the FAO definition of forest as “land spanning more than 0.5 ha with trees higher than 5 m and a canopy cover of more than 10 %, or trees able to reach these thresholds in situ” (FAO Terms and definitions 2020, http://www.fao.org/3/I8661EN/i8661en.pdf, last access: 24 July 2024).
2.6 Maps
We present our results in the form of maps that include the main physiographic features of the LGM in the study area. The maps are based on the WGS84 projection. Coastlines reflect LGM sea level at 120 m below present, while ice sheets are based on Ehlers et al. (2011). Modern national country boundaries are also included for reference.
3.1 Vegetation and biomes
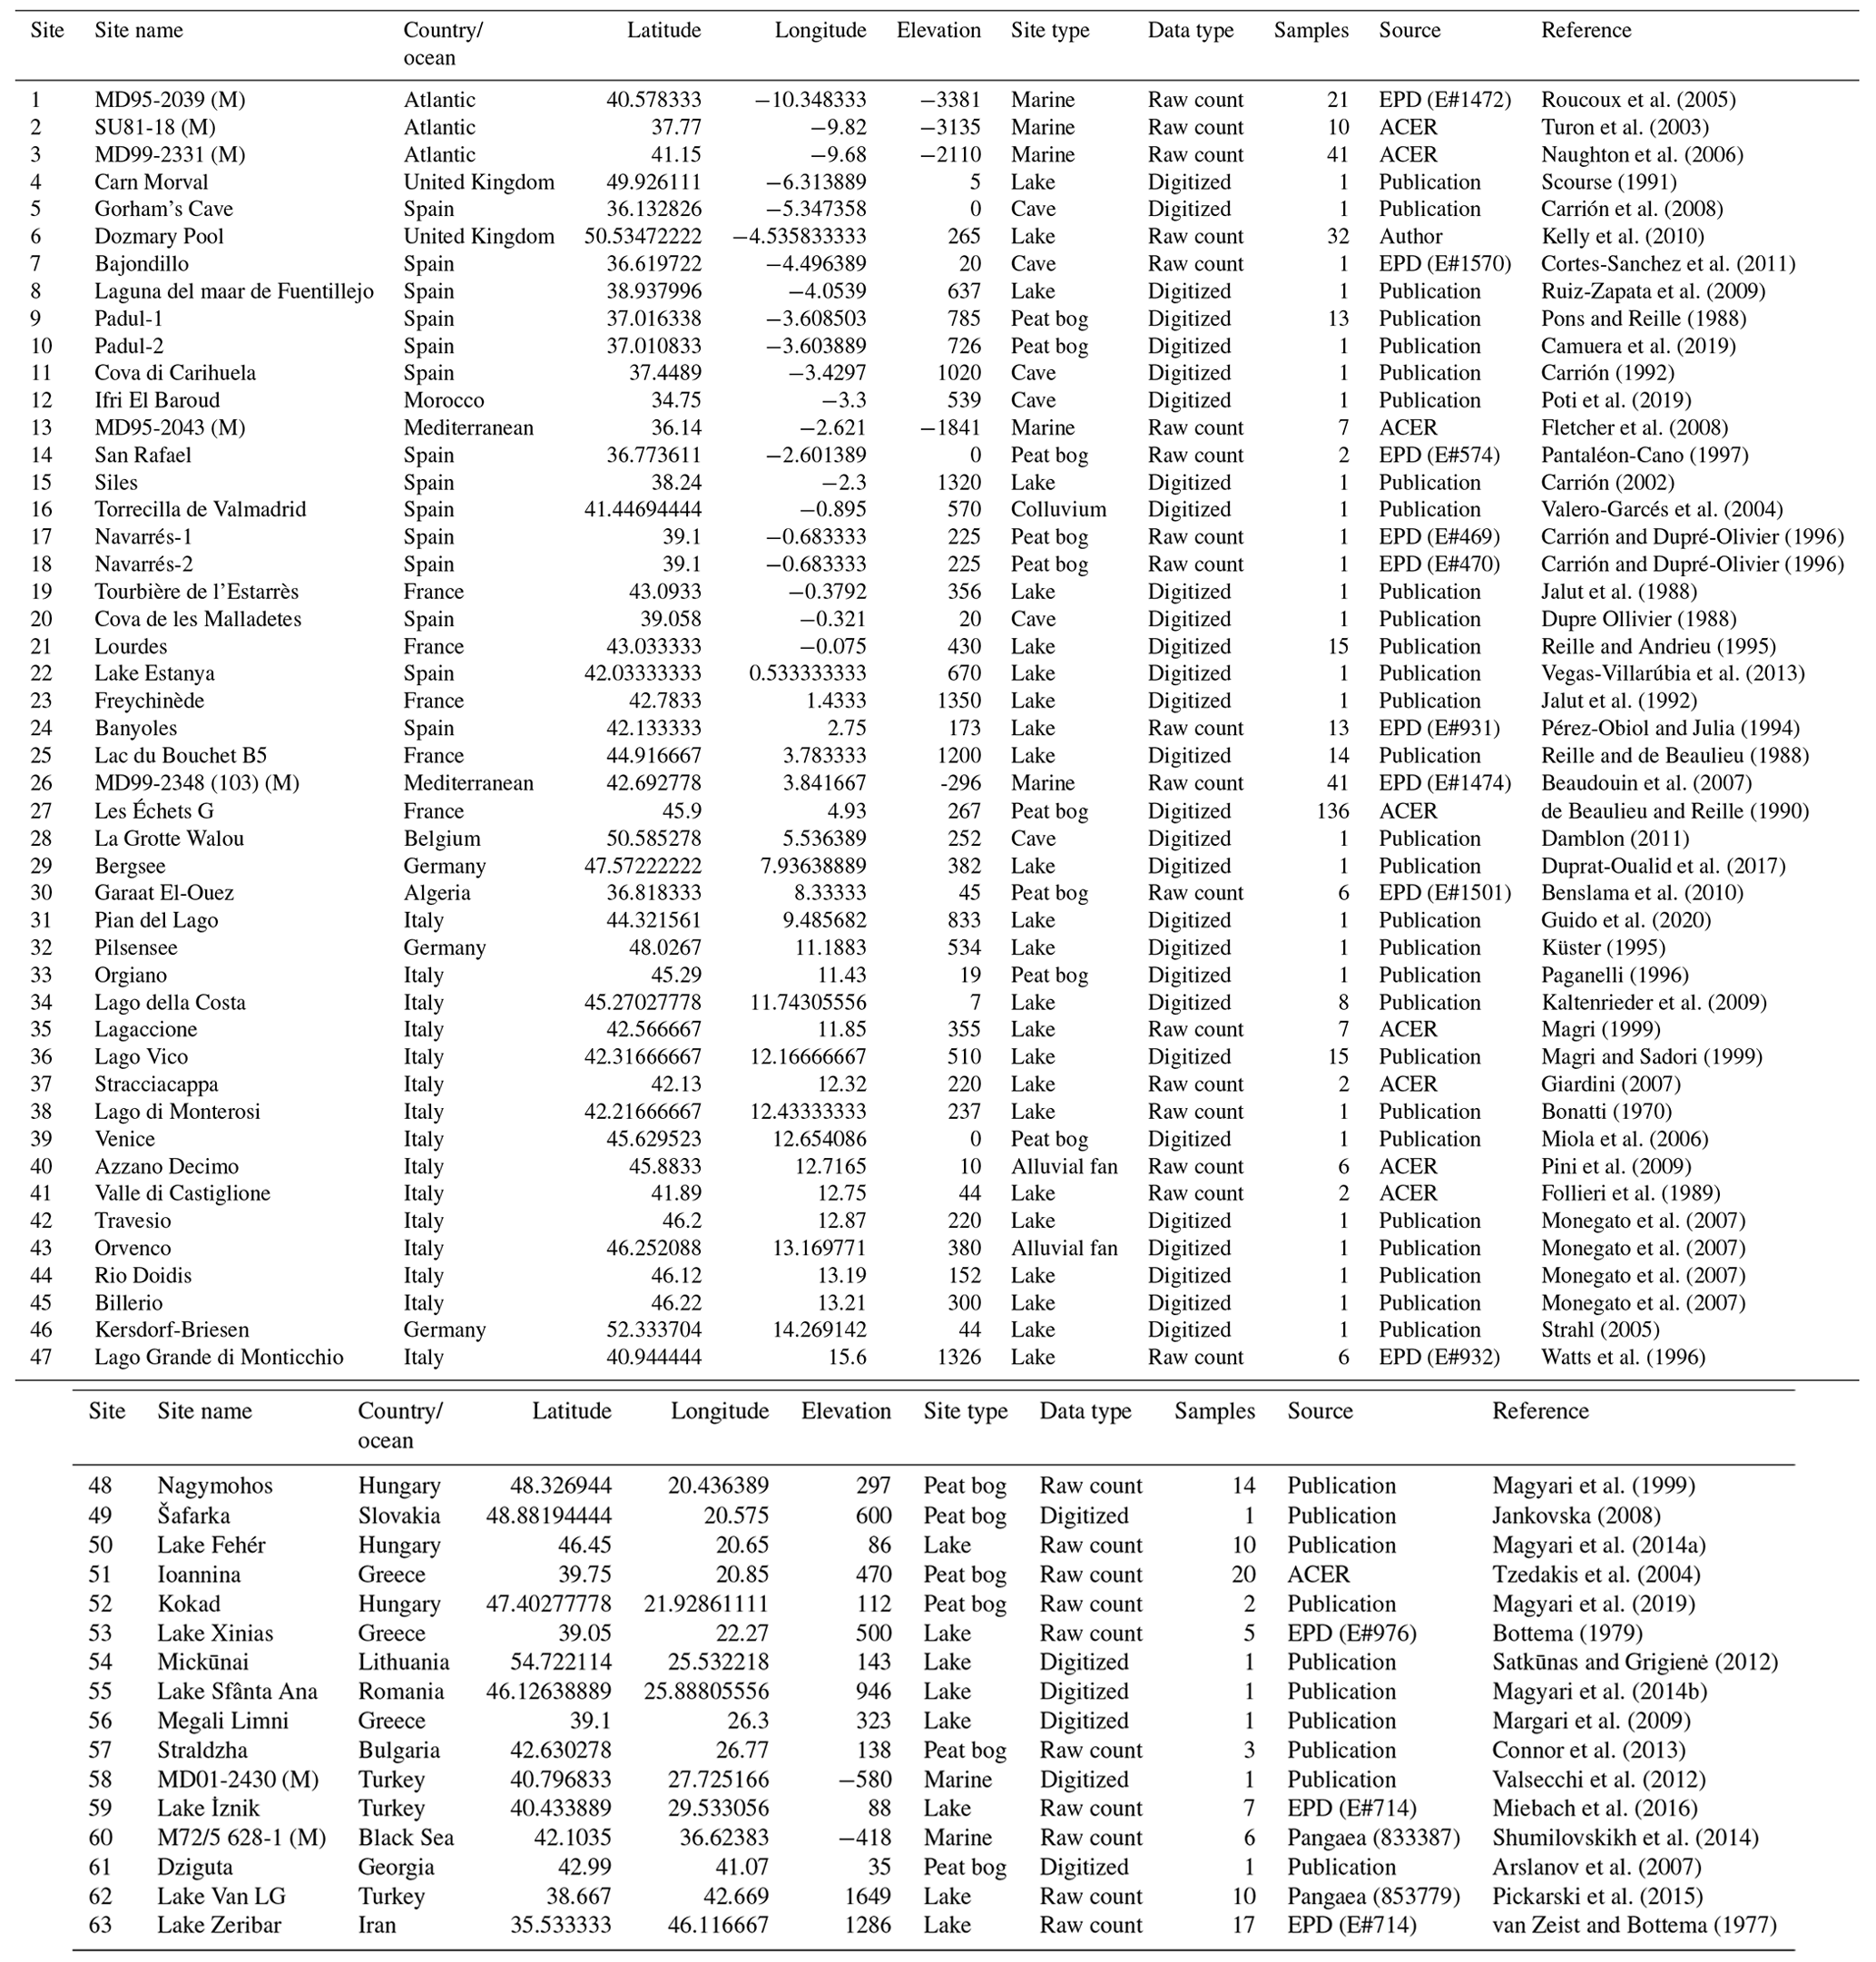
Results of the biomization analysis show that steppe (STEP) was the most common biome at the LGM across the study area, occurring at 36 out of 63 sites, indicating that the landscape was largely dominated by cool temperate grasslands across much of western central Europe, the central and eastern Mediterranean, and northern Africa and the Middle East (Fig. 2). However, at the same time, we also find that there were a significant number of sites where woody and forest biomes occurred, more particularly in southern and eastern Iberia, northern Italy, and central eastern Europe. The most dominant of these forest and woody biomes are taiga (TAIG) in the north and cool mixed forest (COMX) and xerophytic woodlands (XERO) in the south.
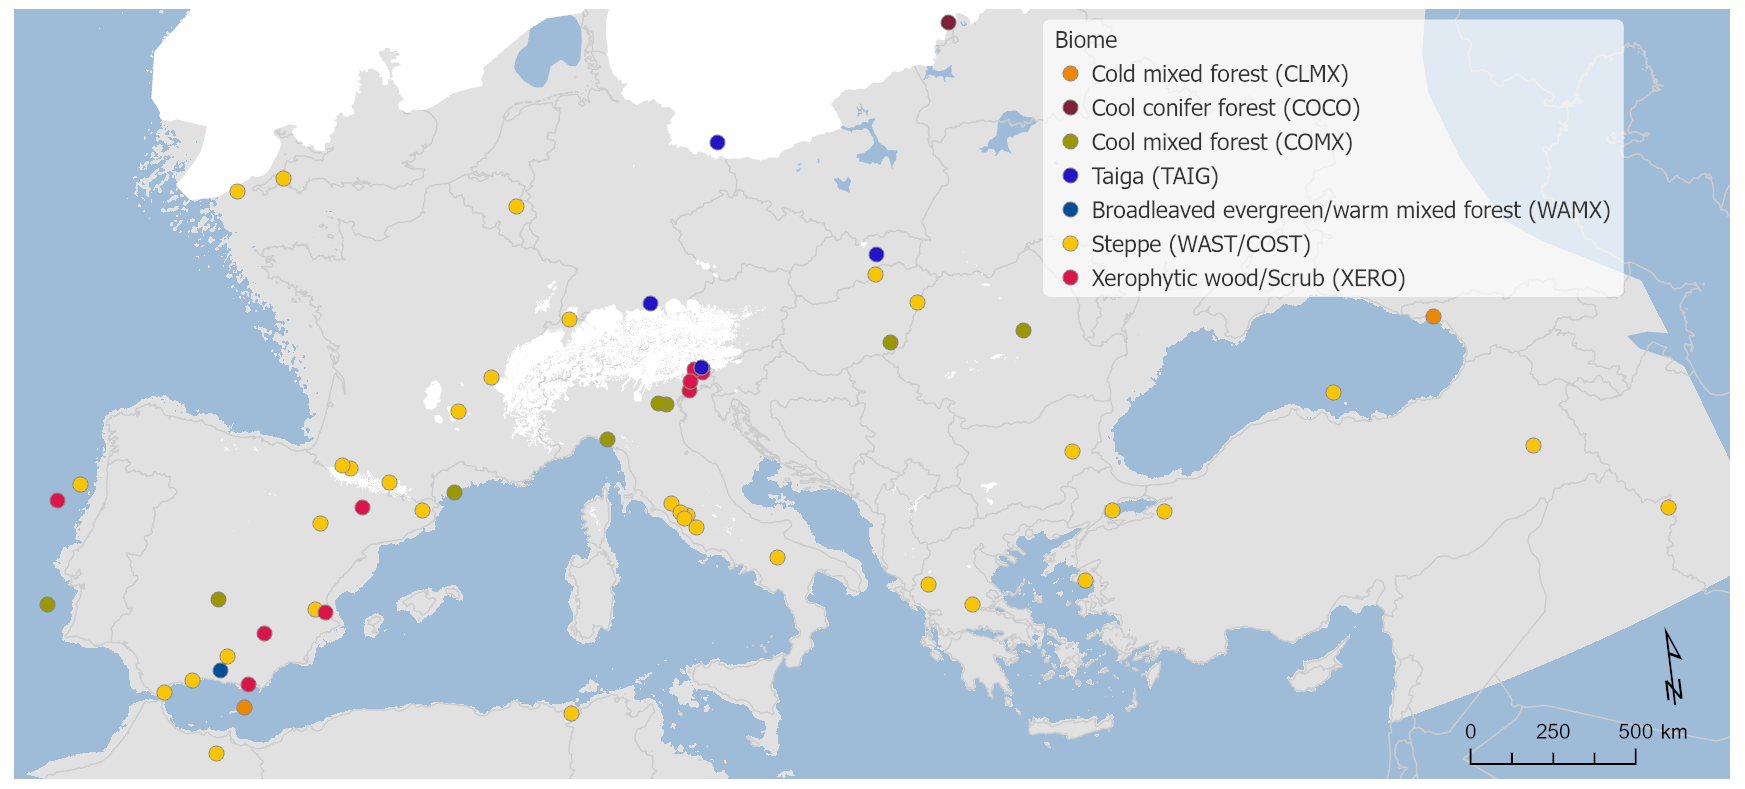
Figure 2Pollen biomes.
As would be expected, the dominance of STEP biomes is generally reflected in low arboreal pollen percentages across the same areas/sites (Figs. 3 and 4). Exceptions to this rule can be found at marine sites such as MD99-2331 site no. 3 and MD01-2430 site no. 58, where STEP is reconstructed despite arboreal pollen percentages of 71 % and 80 % respectively. This apparent contradiction illustrates some of the idiosyncrasies of the biomization method, especially when applying the method to marine pollen samples. In this case it is important to remember that the AP percentage is calculated from the sum of the percentages of each relevant taxon, but the score for each biome is the sum of the square root of the percentages of each of its constituent taxa. This results in biomes with taxa with large percentage values scoring proportionally lower and biomes with taxa with small percentage values scoring proportionally higher. For example, a single taxon at 50 % has a square root of 7.07, but the sum of the square roots of 10 taxa each at 5 % is 22.36 even though the sum of the percentages is the same 50 %. This effect can be particularly pronounced in marine pollen samples because they are usually dominated by a single taxon (Pinus) that forms a high percentage of the total assemblage. Since there are often more non-arboreal taxa than arboreal taxa in a pollen assemblage, the non-arboreal taxa can dominate in the biomization process even if collectively their percentage of the assemblage is a lot less than the arboreal taxa, resulting in a non-arboreal biome such as STEP having the highest biome score.
Figure 3Percentage of arboreal pollen (AP) forest cover.
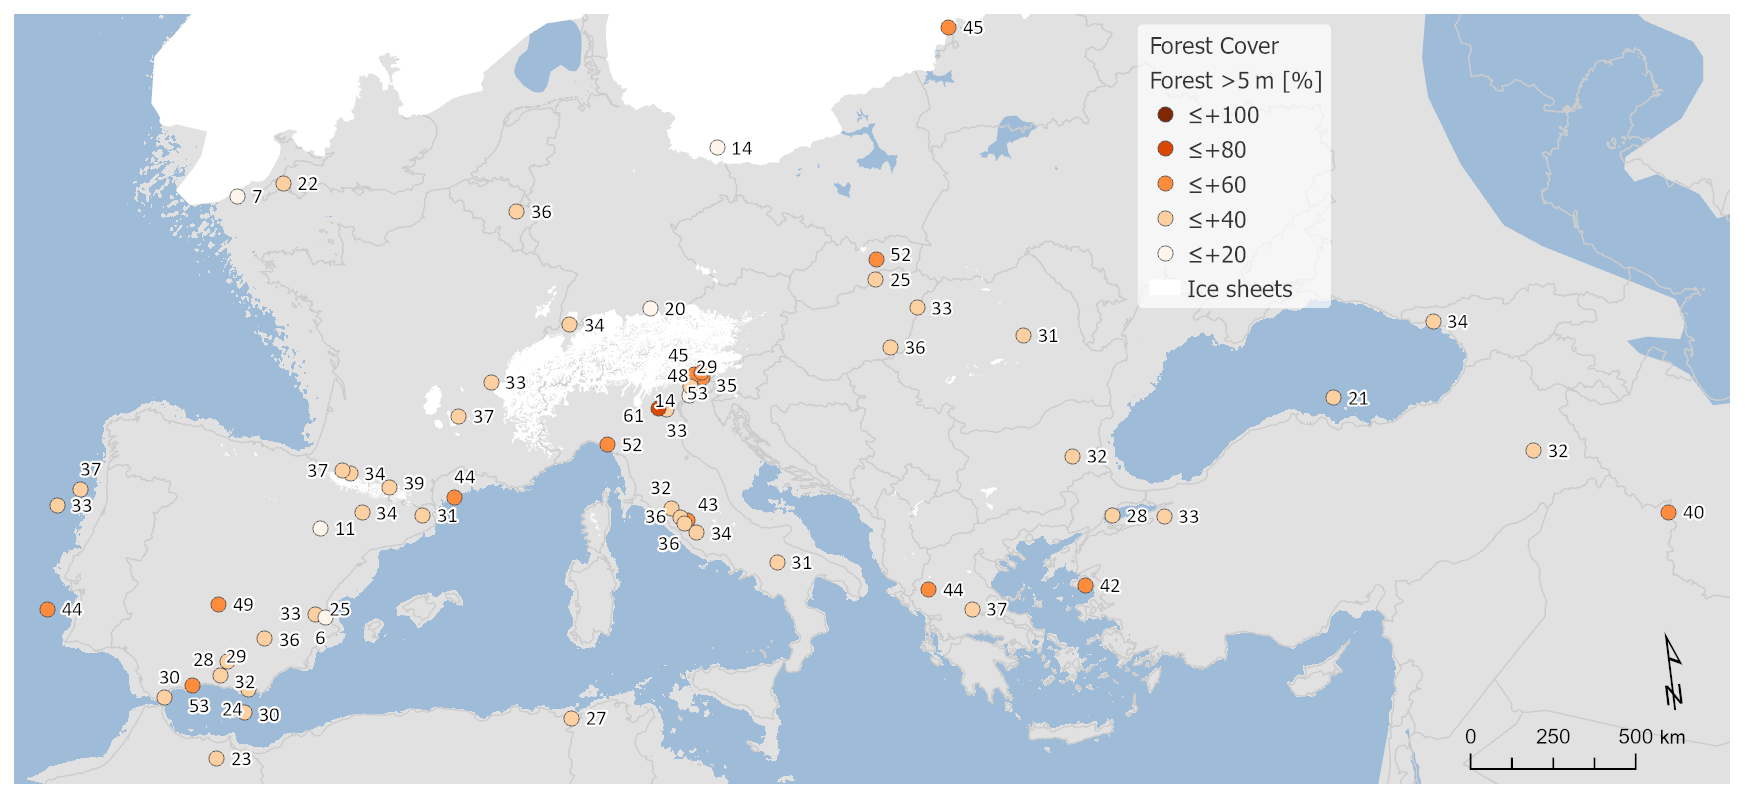
Figure 4Percentage of modern analogue technique (MAT) forest cover.
Of the main arboreal biomes, taiga (TAIG) is the dominant biome at eight sites at the eastern end of the Alpine ice sheet and at a site just to the north in northern Germany and a site in Slovakia, while cool conifer forest (COCO) is found at one site close to the Scandinavian ice sheet in Lithuania. Cool mixed forest (COMX) is found much more widely at eight sites south of the Alps from southwestern Iberia to Romania, with xerophytic woodlands (XERO) occurring at eight sites with a similar distribution but not as far east or west. Cold mixed forest (CLMX) occurs at just two sites in Georgia and in the Alboran Sea at the far east and west of the study area, while warm mixed forest (WAMX) is the dominant biome at just one site in southern Spain. We do not record temperate deciduous forest (TEDE), tundra (TUND), or desert (DESE) as the dominant biome at any site at the LGM, although they do occur as sub-dominant biomes.
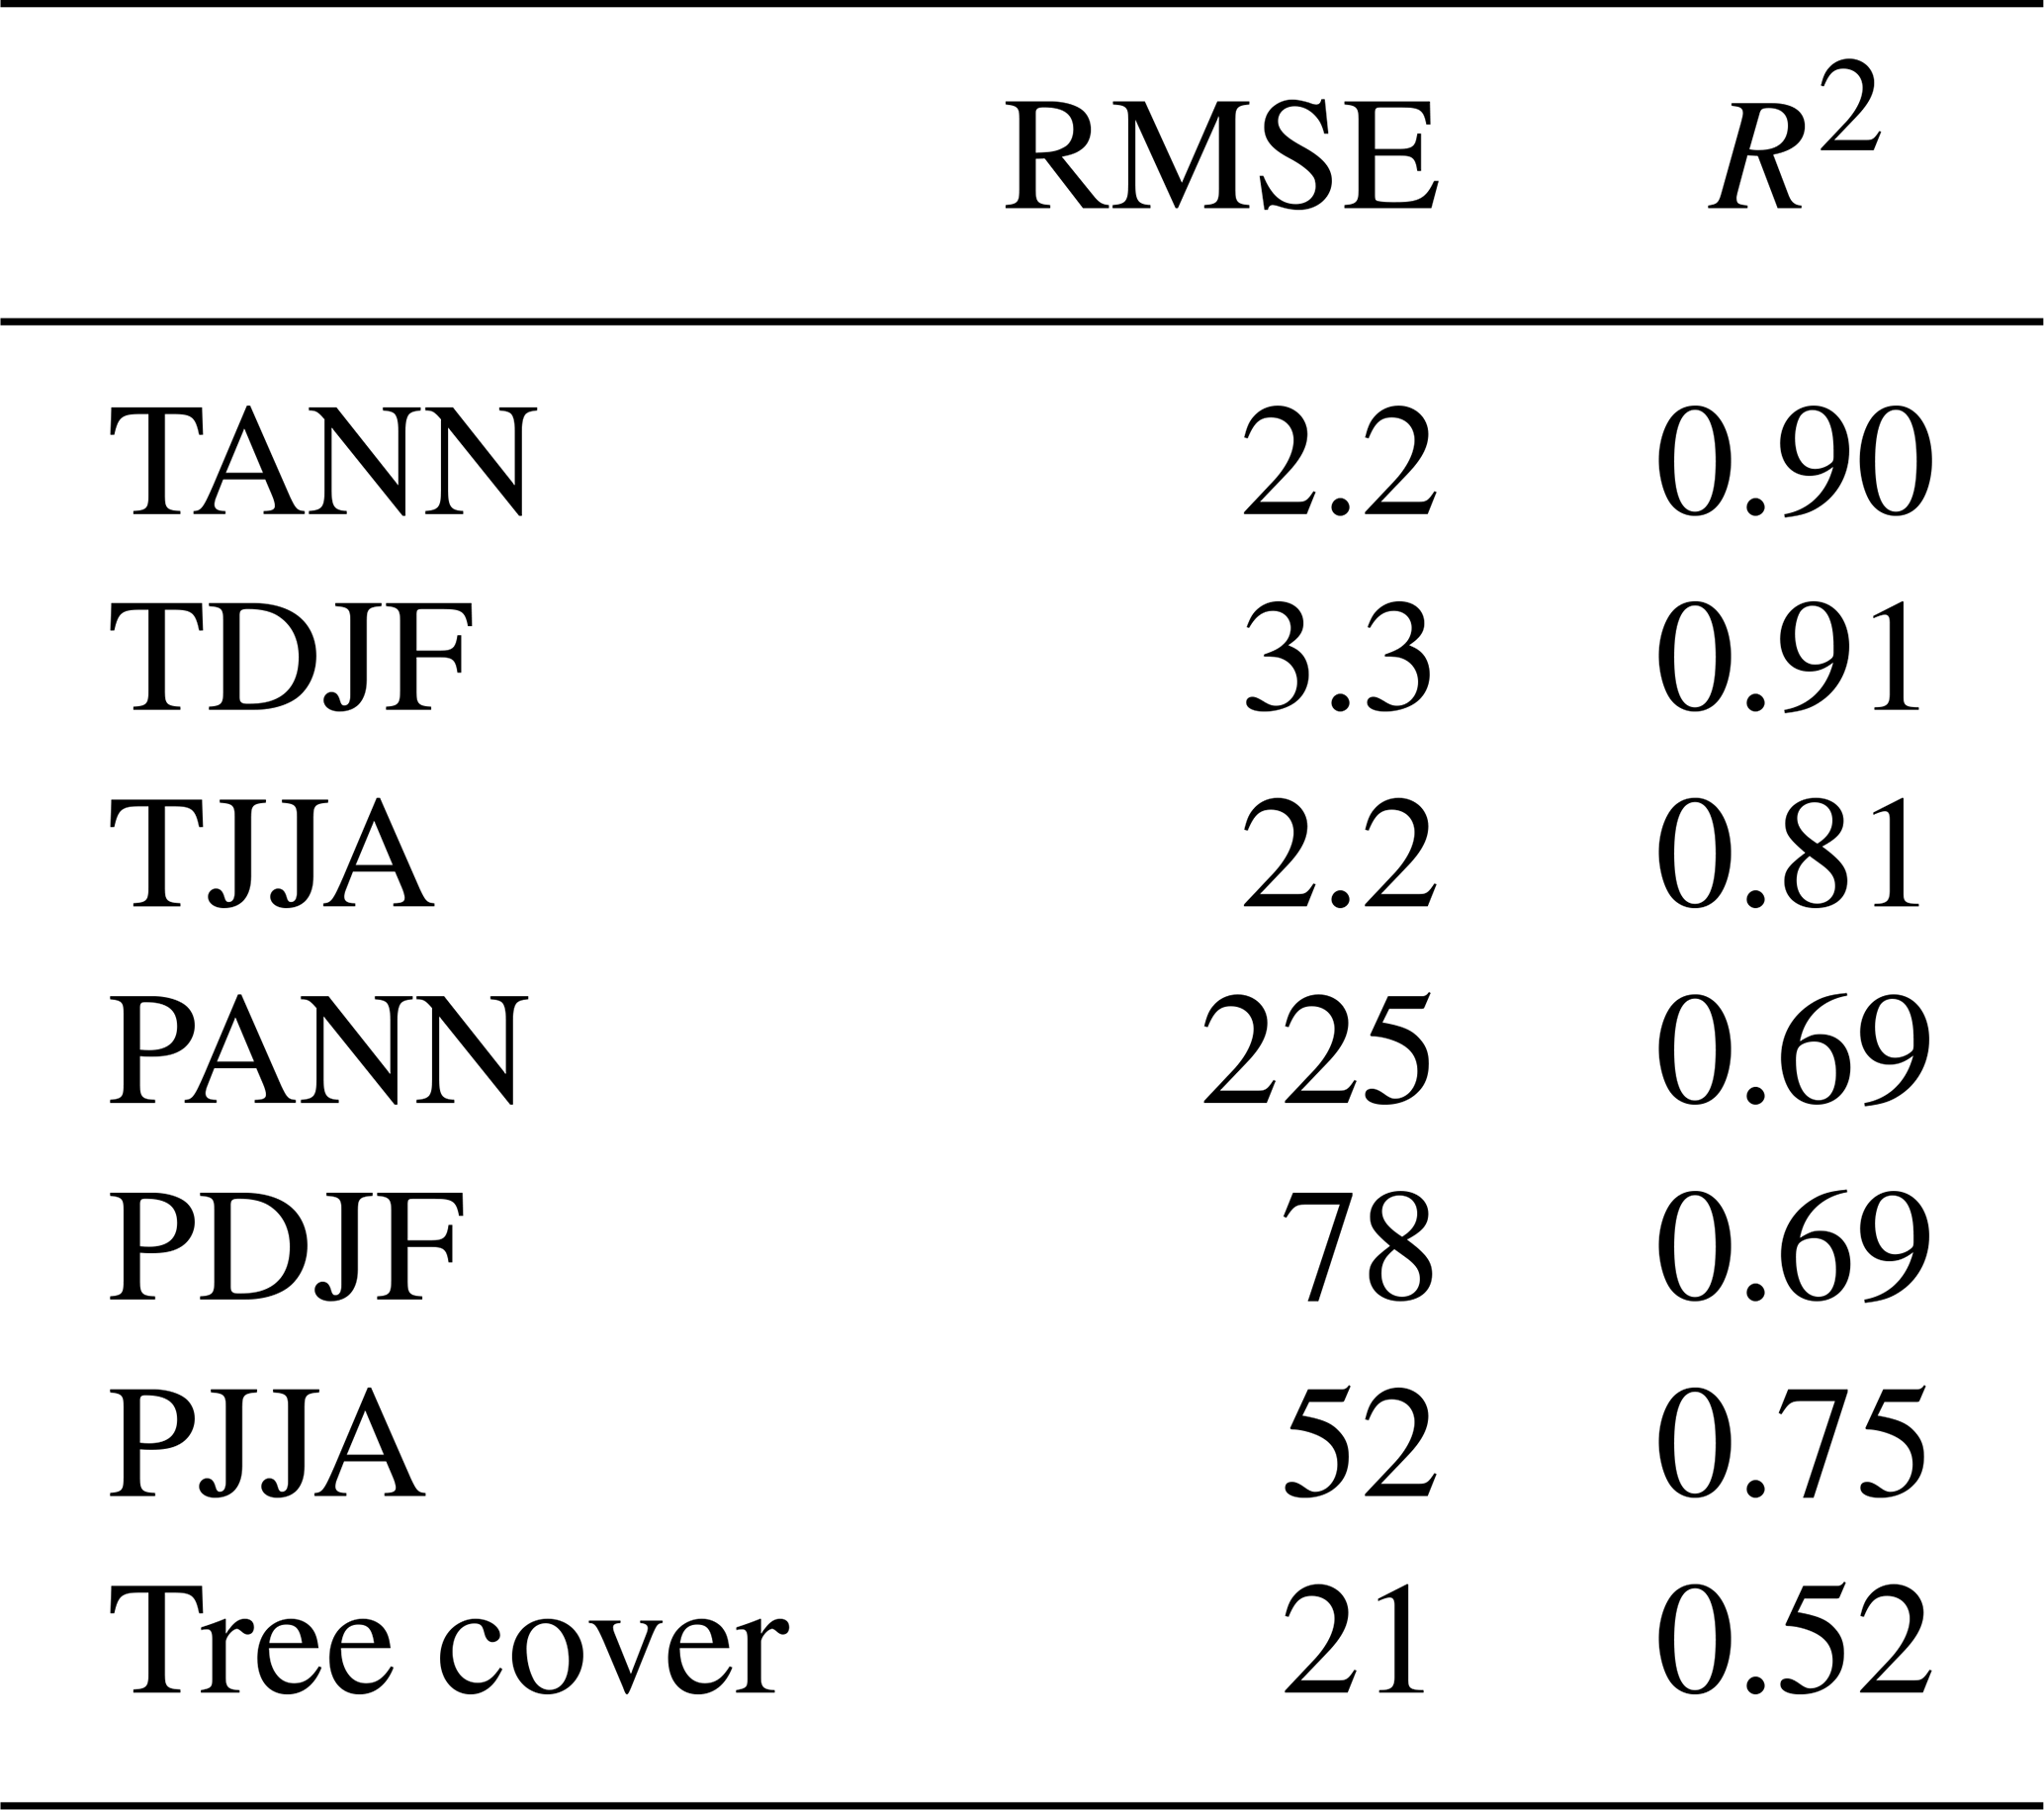
An alternative picture of LGM tree cover is provided by the MAT reconstructions (Fig. 4). MAT performance statistics for tree cover are shown in Table 2, based on an evaluation using the modern training set. This shows a relatively large root-mean-square error (RMSE) of 21.03 and an R2 of 0.52 that is not as good as for the MAT climate analysis, but overall the results are comparable with previous MAT tree-cover studies (Zanon et al., 2018). In general, the MAT values (site average 34 %) show forest cover around 16 % less than that suggested from the AP percentage (site average 50 %; Fig. A2), although sites with very low AP percentage also show higher values based on the MAT. These differences are consistent with comparisons between the MAT and AP percentages in Zanon et al. (2018), although it should be noted that uncertainties related to the MAT reconstructions are large (±23 %). Zanon et al. (2018) found that the differences between the MAT and AP percentages were greatest over northern Europe and in Arctic and sub-Arctic climate regions that are likely to be comparable to many areas of Europe during the LGM. Today, these regions are associated with tree-forming taxa such as birch that fail to grow to a height of 5 m or more, developing only as shrubs or krummholz forms.
Table 2MAT performance statistics based on the modern pollen sample training set. This includes mean annual temperature and precipitation (TANN and PANN), mean winter temperature and precipitation (TDJF and PDJF), and mean summer temperature and precipitation (TJJA and PJJA).
Pollen taxa percentages are shown in Fig. A3, and distribution maps of the 33 most common taxa are shown in Figs. A4–A9. Of the 21 arboreal taxa, Pinus generally has the highest values and is the most widespread, being present at all 63 sites. Other acicular arboreal taxa include Juniperus, which also has a wide distribution across EurMedMidEst, although at lower values. The rest of the acicular arboreal taxa have more regional distributions. Picea is found mainly to the north of the study region, away from the Mediterranean, whilst Abies is generally found more to the south. Larix occurs only in the central European area, including the northern edge of the Po plain just south of the Alps, whilst Cedrus is found mainly across southern and western Europe in locations much further north than its Holocene and modern distributions, which are confined mainly to Morocco and Lebanon (Collins et al., 2012). Temperate broadleaf arboreal taxa, which also include cold-tolerant species such as Betula and Salix, are relatively widely spread across the EurMedMidEst during the LGM, while taxa that are less drought-tolerant, such as Alnus, Carpinus, and Corylus, are found more to the southwest through to the northeast. Other temperate broadleaf arboreal taxa such as Quercus (deciduous) and Ulmus have a much more southern distribution, with Fraxinus, Olea, and Quercus (evergreen) being more prevalent in the southwest. In contrast, Fagus occurs more in the centre and in the east, while Tilia is found even in more northern locations of central Europe. The remaining arboreal taxa are more shrubby and drought-adapted, with Ephedra and particularly Ephedra fragilis having a southern distribution, whilst the more cold-adapted Hippophae are found even in the north of central Europe (similar to Tilia).
The main non-arboreal taxa generally indicate cool, dry, and environmentally disturbed conditions across much of the EurMedMidEst. The most widely distributed taxon is Poaceae, which, like Pinus, is found in all records. Other non-arboreal taxa with a widespread distribution include Rubiaceae, Apiaceae, and Asteraceae (Asteroideae), while Plantago, Caryophyllaceae, Brassicaceae, and Asteraceae (Cichorioideae) have a more southern and western distribution. Thalictrum can be found mostly at sites in the centre of the EurMedMidEst along with Helianthemum, which also extends to sites in the southwest. Other taxa such as Chenopodiaceae and Artemisia have a more southern distribution, reflecting their preference for climates that are drier and less cold.
3.2 Climate reconstruction evaluation
Evaluation of transfer function performance based on the modern training set is presented in Table 2. This shows that root-mean-square error of prediction (RMSEP) values were smallest for summer temperatures (2.21 °C) and largest for winter temperatures (3.35 °C), with mean annual temperatures in between (2.28 °C). The weaker performance for winter temperatures largely reflects the much greater range of winter temperatures in the training set. In turn, this contributes to a better R2 performance for winter temperatures (0.91) than annual temperatures (0.9) and summer temperatures (0.81). Overall R2 performance for precipitation is weaker than for temperature, which is typical because of the higher spatial variability in precipitation compared to temperature. Summer precipitation has the strongest R2 performance (0.75) compared to winter and annual precipitation (both 0.69) and has smaller RMSE values (52 mm) than winter does (78 mm).
Given the widespread occurrence of steppe during the LGM, we also undertook a separate evaluation of transfer function performance in this type of environment. For this we used a subset of 1588 pollen samples from EMPD2 that are classified with the steppe pollen biome (Davis et al., 2020). The results indicate (Table A4) little difference in performance compared to the full dataset, with a small decrease in performance in annual and summer seasons in both precipitation and temperature and a slight increase in performance in winter.
The results indicate good transfer function performance overall, especially for temperature, and are comparable with those found in other continental-scale pollen–climate studies (Bartlein et al., 2011). It is important to remember, though, that comparisons between studies can only be made with caution because results are often heavily dependent on the nature of the modern pollen dataset used as the training set (Juggins, 2013) and on the method used (Salonen et al., 2019; Brewer et al., 2008; Peyron et al., 2013).
3.3 Climate reconstruction
Reconstructed LGM temperatures indicate an overall mean annual cooling of °C, with a greater cooling of around °C in winter and °C in summer (Fig. 5). All sites apart from Lake Van (site no. 62) in eastern Turkey show cooler temperatures at the LGM compared to in modern times (Fig. 6), and, even at this site, cooler conditions fall within the uncertainties. With greater cooling in winter compared to summer, the difference in temperature between winter and summer also increased (shown by positive anomalies) at most (but not all) sites (Fig. 6). This increase in continentality was around +4.2 °C on average across all sites (Fig. 5).
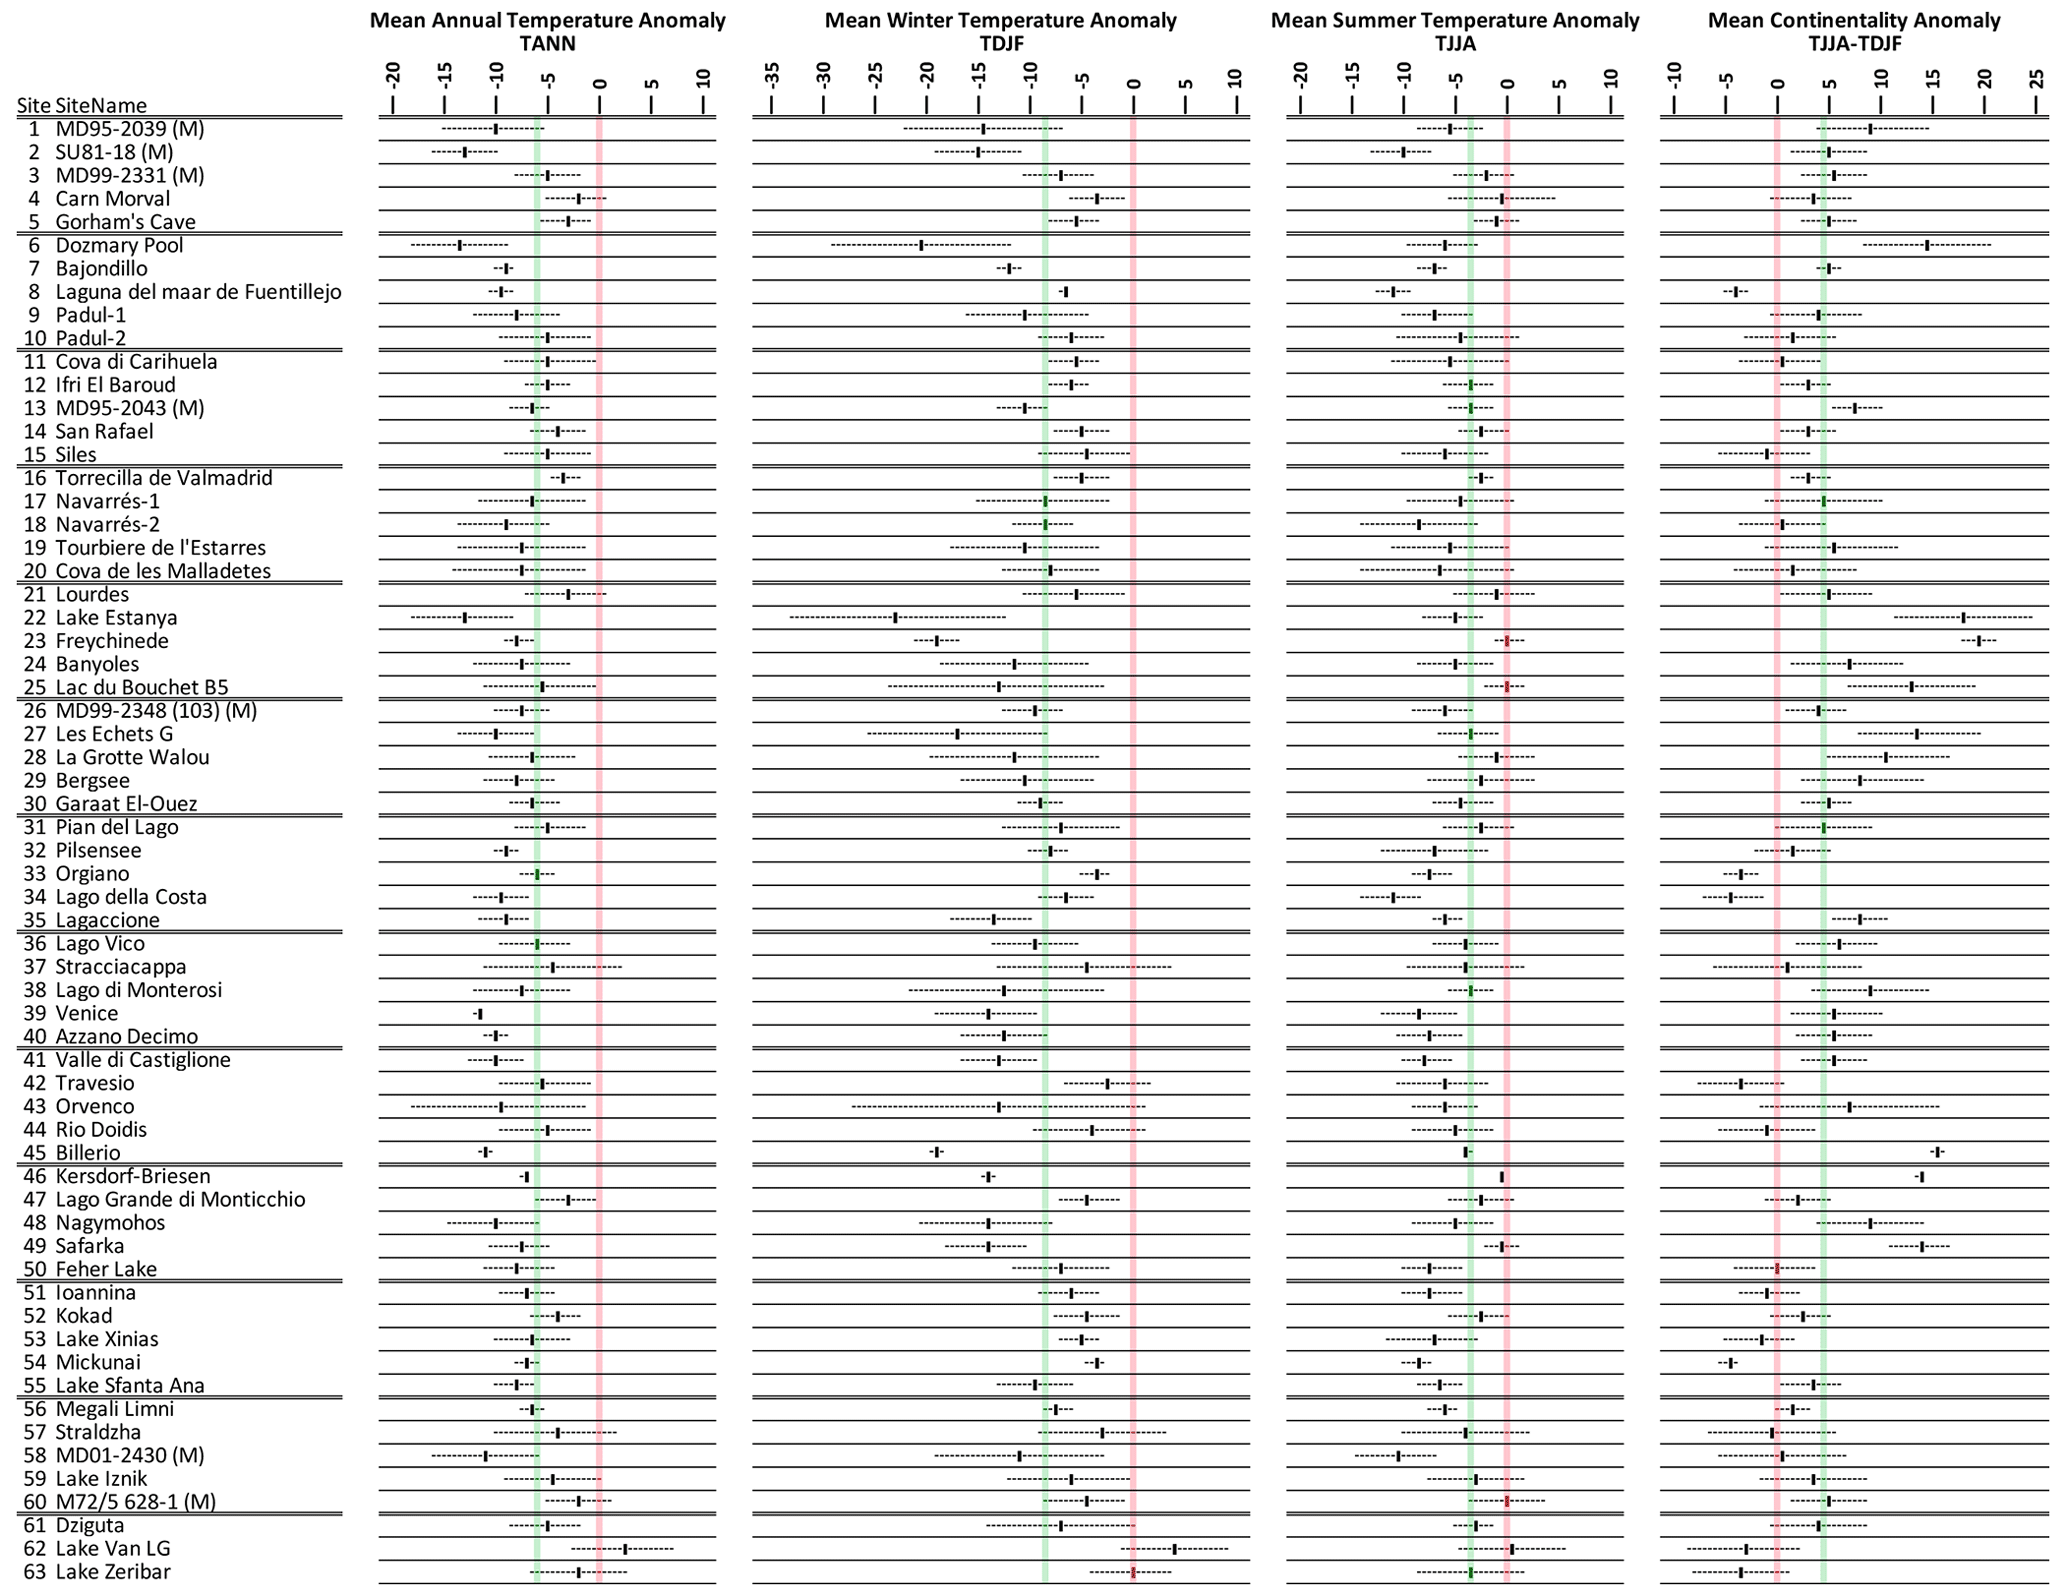
Figure 5Pollen-based MAT reconstructions for LGM annual, winter, and summer temperature anomalies (uncertainties represent 1 standard deviation). Continentality represents the difference in temperature between summer and winter, with positive anomalies indicating an increase in the temperature difference between summer and winter. All values are expressed as anomalies compared with the present day. The green line indicates the mean for all the sites.
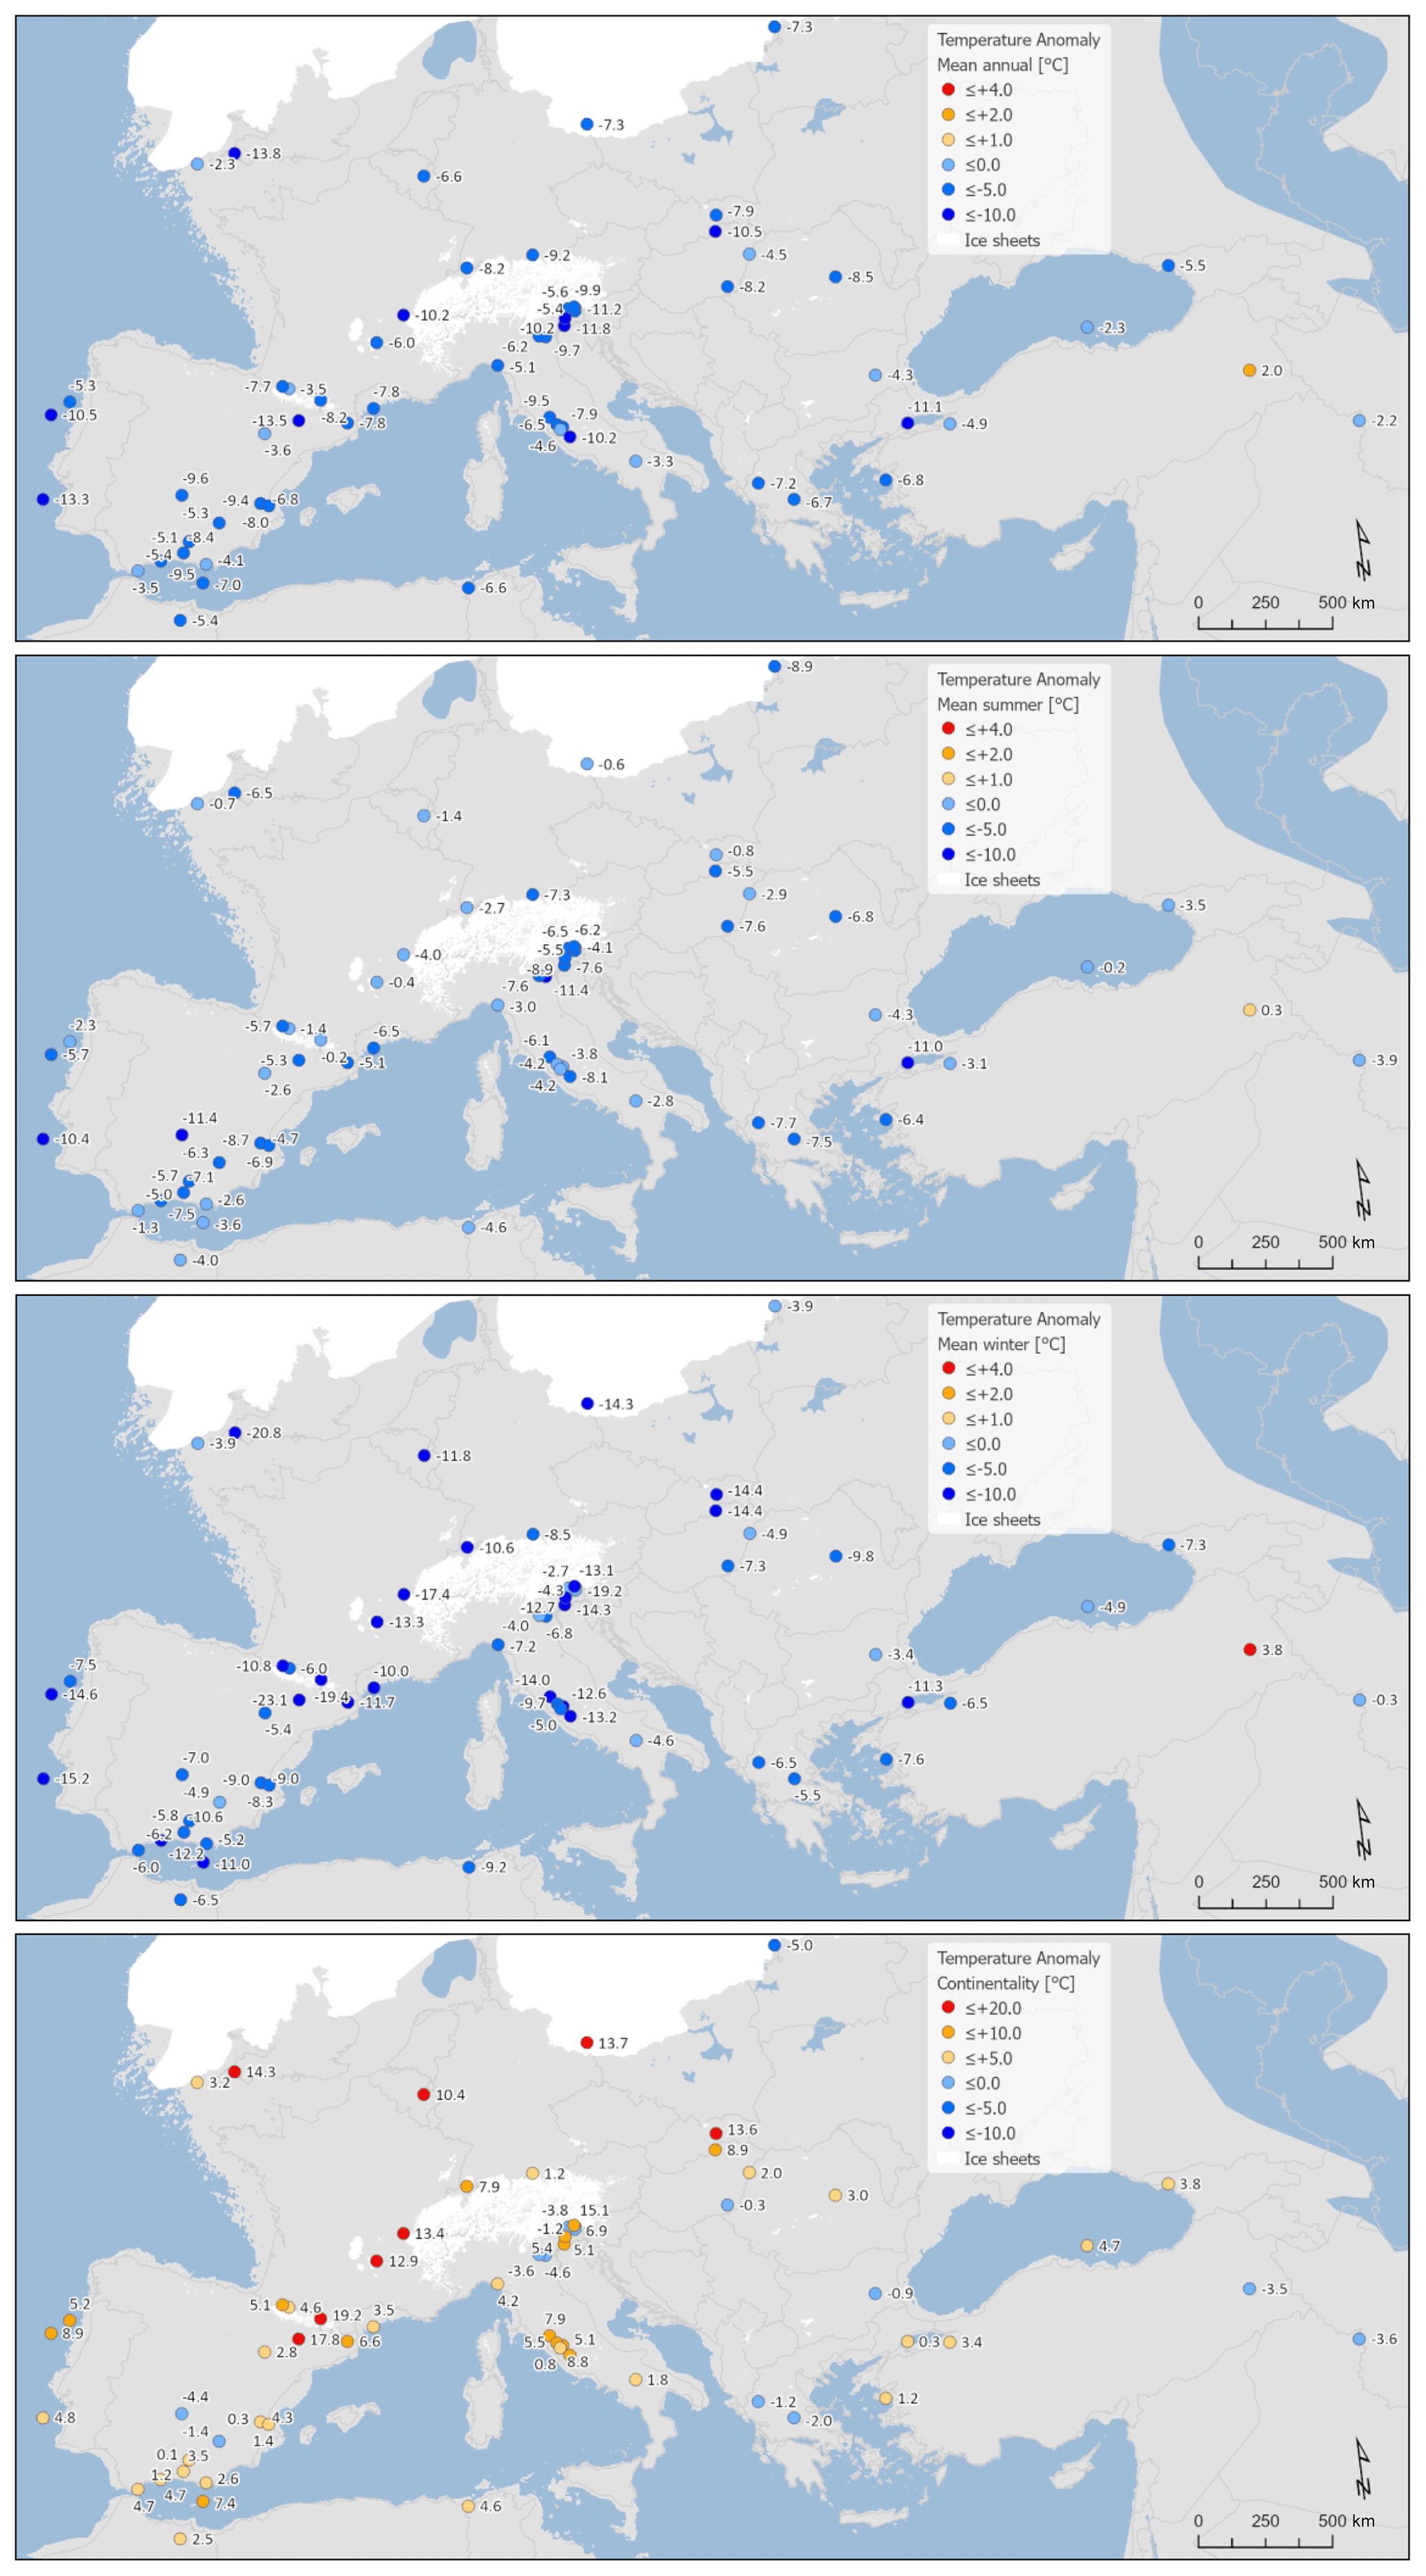
Figure 6Maps of pollen-based MAT reconstructions for LGM annual, winter, and summer temperature anomalies (as shown in Fig. 9). Continentality represents the difference in temperature between summer and winter, with positive anomalies indicating an increase in the temperature difference between summer and winter. All values are expressed as anomalies compared with the present day.
We reconstruct an overall decline in mean annual precipitation of around mm (−13 %) at the LGM. Most of this decline is in winter ( mm) (−21 %), while in summer a small increase is shown (10±57 mm) (6 %), although uncertainties are large (Fig. 7). Compared to temperature, there is significant seasonal and spatial variability in positive and negative precipitation anomalies (Fig. 8). Positive anomalies appear more predominant in eastern and southern Spain and in central eastern Europe in both summer and winter, while positive anomalies are found more generally in summer across sites in southern Europe and the Mediterranean. These more positive summer anomalies also reflect a relative shift from winter to summer in the seasonality of precipitation in this region.
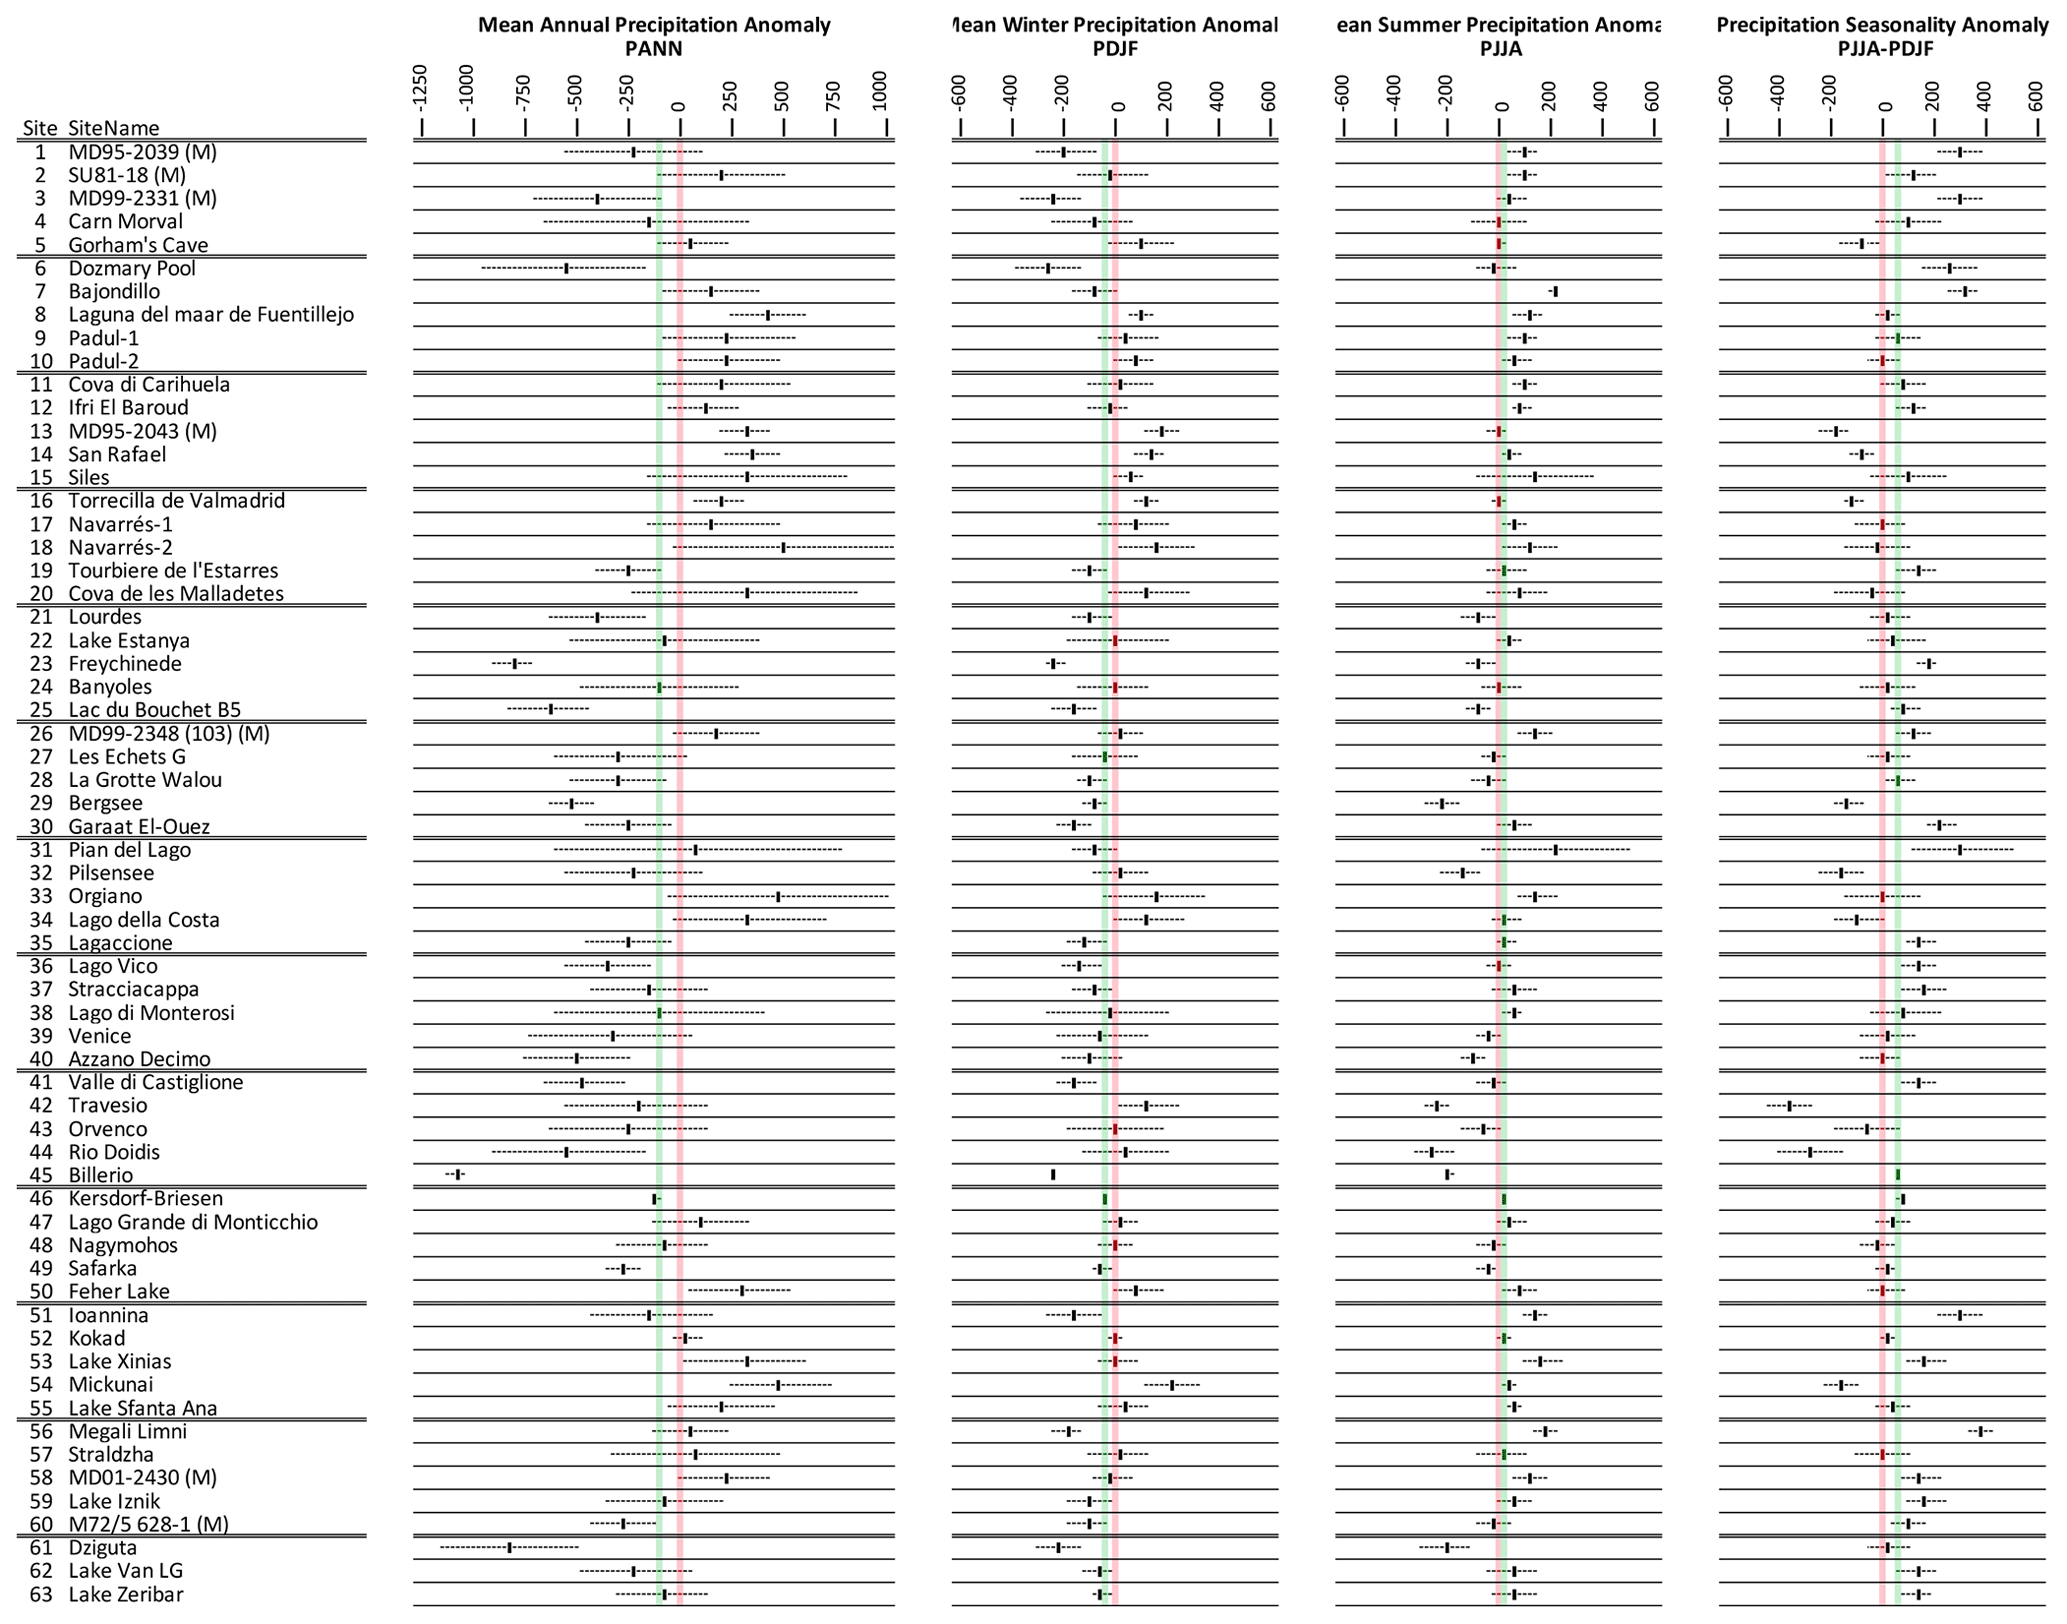
Figure 7Pollen-based MAT reconstructions for LGM annual, winter, and summer precipitation anomalies (uncertainties represent 1 standard deviation). Seasonality represents the difference in precipitation between summer and winter, with positive anomalies indicating an increase in summer precipitation compared to winter. All values are expressed as anomalies compared with the present day. The green line indicates the mean for all the sites.
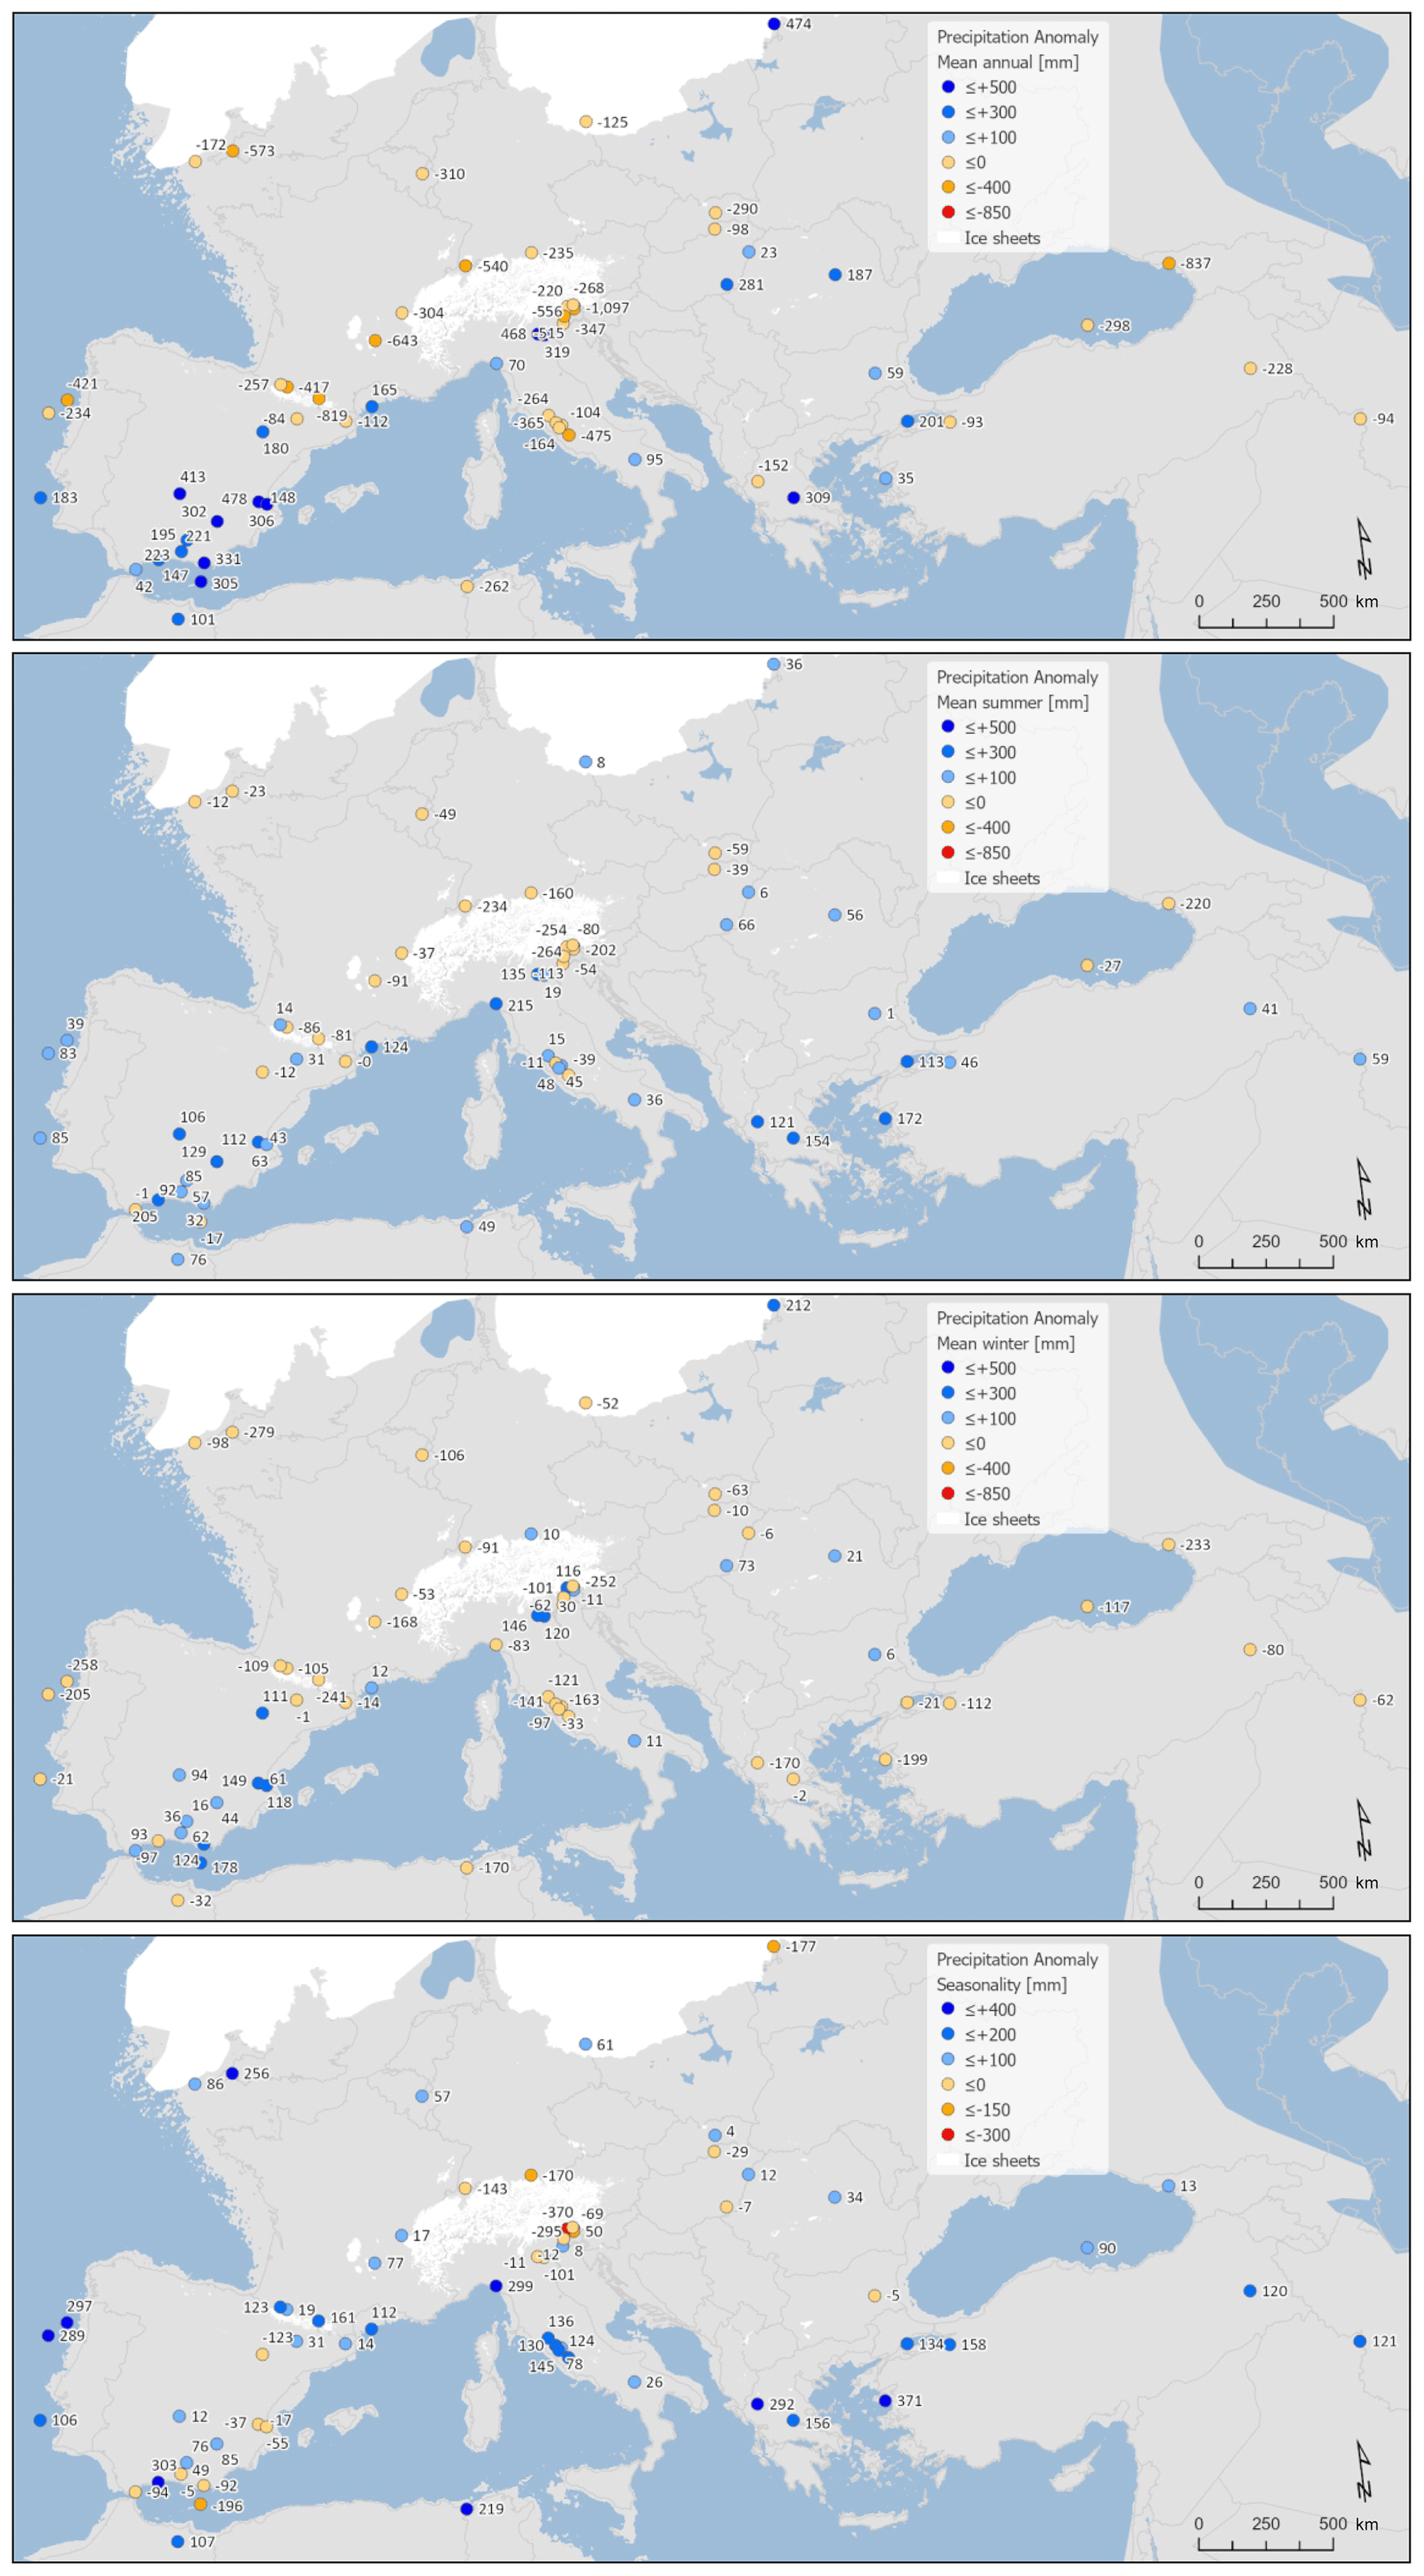
Figure 8Maps of pollen-based MAT reconstructions for LGM annual, winter, and summer precipitation anomalies (as shown in Fig. 11). Seasonality represents the difference in precipitation between summer and winter, with positive anomalies indicating an increase in summer precipitation compared to winter. All values are expressed as anomalies compared with the present day.
Before we consider the results of our analysis, it is important to provide some context in terms of European LGM geography and environment, which was very different from today (Fig. 1). Major ice sheets covered Scandinavia and much of the UK, the Alps, and the Pyrenees. The sea level was 120 m lower, resulting in much of the North Sea and English Channel becoming dry land and in the European coastline extending over 100 km out into the Atlantic and Mediterranean, especially around the Bay of Biscay and the Adriatic Sea. The Black Sea was no longer connected to the Mediterranean, and it was smaller, with a water level around 100 m lower than today (Genov, 2016). These changes in sea- or water level had two main consequences, the first being that the marine sites were closer to land and therefore closer to (low-lying) terrestrial vegetation and (pollen-carrying) river discharge points than they are today. The second consequence of lower sea levels is that terrestrial pollen sites were located further from the moderating effect of the ocean than they are today, resulting in a localized modification of the climate experienced by the site irrespective of regional or global changes (Geiger, 1960).
The maps used in our analysis show the maximum ice sheet at 21k±2k (Ehlers et al., 2011). The precise geographical location of the ice sheet is difficult to resolve at a fine spatial scale, however, which explains why some sites close to the ice margin appear to be actually located under the ice (for example, Kersdorf-Briesen site no. 46 and Mickūnai site no. 54). The resolution of the map also shows the occurrence of permanent ice not only to the north and over the Alps but also on many subsidiary areas of high ground across central and southern Europe, including areas such as the Pyrenees, Massif Central, and the Vosges and Carpathian mountains. While global ice volume may have peaked ∼21 ka, individual ice sheets in Europe and other areas are known to have reached their maximum extent at different times (Hughes et al., 2016). The larger ice sheets are likely to have had a significant influence on regional climate and environmental conditions across Europe, but the smaller ice sheets had similar if more localized impacts as well. Surrounding each ice sheet would have been an unglaciated area of active periglacial processes and newly created and unstable ground. This would include outwash plains, impounded lakes and recently drained lake beds, seasonally and sporadically flooded areas, moraines, kettle holes, and other glaciological and periglacial features. Soils in these areas would have been non-existent or skeletal, and vegetation would have found it difficult to obtain nutrients and water for survival, irrespective of the prevailing climatic conditions. Outside of these areas, permafrost is also likely to have been present, particularly north of the Alps (Vandenberghe et al., 2014), which would also have acted as an impediment to vegetation growth.
In terms of regional climate, the major ice sheets would have provided significant barriers to westerly atmospheric circulation or even north–south circulation in the case of the Alps and the Pyrenees. As well as representing a physical obstruction, the thermodynamic response of the atmosphere to these high, cold obstructions would have been to encourage the formation of areas of semi-permanent high pressure, similar to those found today, for instance, over the Greenland ice sheet. In addition, the Laurentide ice sheet located over North America would have generated downstream effects over Europe (COHMAP, 1988). These physical and thermodynamic effects would have affected the direction of storm tracks and more local climatic effects commonly associated with ice sheets such as strong katabatic winds (Kageyama et al., 2021; Velasquez et al., 2021; Luetscher et al., 2015; Lefort et al., 2019)
4.1 Vegetation cover
The nature and extent of forest cover during the LGM remains a matter of considerable debate. Vegetation models driven by LGM climate model simulations generally indicate extensive areas of boreal forest north of the Alps and a mix of temperate and warm-temperate woodland to the south across southern Europe and much of the Mediterranean. Treeless areas such as steppe are mainly confined to those areas where it is also found today, namely inland Iberia, Ukraine, southern Russia, and Turkey, while tundra is found to the north close to the Scandinavian Ice Sheet (Allen et al., 2010; Cao et al., 2019; Prentice et al., 2011; Velasquez et al., 2021).
The evaluation of these vegetation model simulations against data has been largely based on comparisons with compilations of pollen biome reconstructions (Prentice et al., 2011; Allen et al., 2010; Cao et al., 2019; Velasquez et al., 2021). Early studies were based on only a limited number of sites in southern Europe and showed steppe at all sites in contradiction with model simulations (Elenga et al., 2000). More recent pollen compilations have included more sites, especially to the north, that have revealed a more mixed picture of vegetation cover, with forest biomes at some sites both south and north of the Alps that appear more consistent with model simulations (Binney et al., 2017; Cao et al., 2019). However, many of the pollen sites used in these studies were assigned an LGM age based on poor or incorrect dating control and likely date to MIS3, the Late Glacial, or even the Holocene. Nevertheless, based on our compilation of more securely dated LGM pollen sites, we also show a wider distribution of forest biomes particularly in Iberia, northern Italy, and central Europe, although with greater areas of steppe over the remaining regions than suggested by the models.
However, the interpretation of biome reconstructions requires care, since the forest cover and vegetation composition may not be as clear as the dominant biome suggests. For instance, we find that steppe is still reconstructed as the dominant biome at some sites despite arboreal pollen forming 70 %–80 % of the pollen assemblage. In addition, it is important to remember that pollen biomes are based only on the proportion of taxa that can form forest and woodland, while these taxa may in fact exist only as shrubs or stunted krummholz forms in the challenging climate and environment of the LGM. Alternatively, similar conditions may favour low-lying non-arboreal taxa forms with poor pollen dispersion or even insect-pollinated taxa forms that may be poorly represented in the pollen assemblage, giving greater prominence to arboreal taxa whose pollen may be the result of long-distance transport, particularly Pinus. However, there also appear to be plenty of samples with low or even very low (<20 %) arboreal percentages, so not all sites in open areas may be affected by long-distance transport of Pinus in the same way.
Quantitative MAT-based reconstructions of forest cover can overcome some of these problems, where they can be detected, based on the composition of the pollen assemblage when compared with the modern land cover. Chord distance measurements of the match between fossil and modern pollen assemblages indicate that good LGM analogues exist in our large Eurasian modern pollen dataset. The results of the MAT forest cover reconstruction indicate that forest cover was low but not entirely devoid of woodland in most areas, similar to the modern boreal forests of Siberia and consistent with a steppe–tundra–woodland mosaic proposed by many authors (e.g. Birks and Willis, 2008; Willis and Van Andel, 2004). This is confirmed in an analysis of the most commonly found modern analogue ecoregions for LGM pollen samples at each site (Table A5). Uncertainties are large, but for comparison the MAT site average of 33 % forest cover is slightly less than the average today over the Boreal region of Europe (43 %) and slightly more than the average today over the Mediterranean region (27 %) (Zanon et al., 2018).
By calculating the percentage of each of the taxa in each LGM pollen sample using a standardized pollen sum, we are able to make direct comparisons between different LGM pollen records and their taxa percentages (Figs. A3 and A4). The results show a preponderance of boreal forest taxa to the north of the Alps, consistent with biome results mentioned earlier. Pinus is the most common forest-forming taxa in this boreal zone, together with Picea, and including Larix to the east and Abies to the west. The occurrence of Betula and Juniperus also suggests shrubby elements consistent with arctic shrub tundra, although high Poaceae and other herbaceous taxa such as Artemisia and Chenopodiaceae indicate more steppe than tundra. Other deciduous taxa found north of the Alps include cold-tolerant generalists, such as Corylus and Alnus, and low percentages of relatively thermophilous taxa in the east, such as Carpinus and Tilia.
These results are consistent with charcoal (Magyari et al., 2014a; Willis and Van Andel, 2004), malacology (Juřičková et al., 2014), biomarkers (Zech et al., 2010), and genetic evidence (Stivrins et al., 2016; Willis and Van Andel, 2004) that the main forest region north of the Alps was in the eastern region of central Europe around the Carpathian Basin. This was also an area where cold- and moisture-sensitive deciduous taxa were also able to survive (Magyari et al., 2014b), although evidence of temperate taxa found in the pollen record has yet to be supported by charcoal and macrofossil records (Feurdean et al., 2014). Our pollen evidence indicates an open taiga or cool mixed forest that extended in central and eastern Europe to areas close to the Scandinavian and Alpine ice caps, as proposed by Willis and Van Andel (2004) and Huntley and Allen (2003), although whether this represents isolated pockets of forest or an extended open steppe forest is difficult to determine (Kuneš et al., 2008). Even steppe or tundra areas in western Europe show a low but significant presence of the pollen of tree taxa at sites close to the ice sheets that are unlikely to be solely the result of long-distance transport or reworking (Kelly et al., 2010). The presence of woodland in these areas is also supported by mammalian remains, for instance, at Kents Cavern in SW England (Stewart and Lister, 2001).
Overall, however, our results clearly show a much greater predominance of thermophilous and moisture-sensitive deciduous taxa south of the Alps, particularly in Iberia and northern Italy, where temperate broadleaf forests survived in sheltered refugia (Kaltenrieder et al., 2009). Most of these appear to be in hilly areas with the ability to generate orographic rainfall (Monegato et al., 2015) on south-facing slopes to make the most of the sun's radiant energy and are located above the valley floor to escape frost and flooding. We might also expect these areas to be sheltered from cold northerly winds and benefit from relatively mild and moisture-laden winds coming from the Mediterranean Sea. For instance, the presence of woodland and low glacier altitudes along the southern slopes of the Alps around the Po Valley and the Trentino region is consistent with strong orographic rains generated by southerly and easterly winds that today can be generated by low pressure located south of the Alps in the Gulf of Genoa and is consistent with a southerly storm track around the Alps (Kehrwald et al., 2010; Luetscher et al., 2015). Generally, as might be expected, areas of forest reconstruct similar or increased precipitation compared to today, and areas of steppe indicate decreased precipitation (see next section).
Independent evidence of LGM vegetation is provided by archaeozoological data. These data support the palynological evidence for the existence of forest and woodland refugia across the ice-free areas of Europe at latitudes north of the Alps. For instance, large vertebrates in these areas show patterns of extirpation and extinction in response to shifts in climate and vegetation cover that is different for different species, indicating a variety of environments and niches (Lister and Stuart, 2008; Stewart and Lister, 2001). As with the pollen record, the presence of temperate-adapted large-vertebrate taxa within the glacial landscape of western Europe also suggests the existence of temperate “micro-refugia” (Stewart and Lister, 2001), consistent with suggestions that temperate arboreal taxa were not entirely extirpated from the region during the LGM (Magri, 2010). Further east, mammal assemblages indicate generalized loss of forest components in the East European Plain (Demay et al., 2021; Puzachenko et al., 2021), which is consistent with our data indicating low forest cover in this region. In other areas, evidence of the prevailing land cover at the LGM comes from studies of small-vertebrate communities, which have a closer affinity to the prevailing environment than large vertebrates (López-García and Blain, 2020) that have the propensity to migrate large distances, often on a seasonal basis. These studies of small-vertebrate assemblages also support the existence of temperate “micro-refugia” in France (Royer et al., 2016) and the existence of woodland components in many regions across southern Europe, including parts of Iberia (Bañuls-Cardona et al., 2014) Italy (Berto et al., 2019), and the Balkan Peninsula (Mauch Lenardić et al., 2018).
Other palaeobotanical evidence also supports our land-cover reconstruction. Schäfer et al. (2016) suggest that leaf wax patterns from palaeosols in Spain may indicate the presence of drought-intolerant deciduous trees and more humid conditions during the LGM. Significantly, none of the pollen sites indicate that temperate broadleaf forests were dominant, and broadleaf temperate taxa always appear as part of a mixed woodland together with cold- or aridity-adapted evergreen and needleleaf taxa, including typical Mediterranean taxa. This type of mixed vegetation probably extended to the Balkans, where the hilly terrain and proximity to the Mediterranean would appear to have provided favourable climatic conditions, although we still lack LGM sites from this region. At sites in central and southern Italy and east through Greece and Turkey to the Middle East (and including northern Africa), the vegetation appears drier with a greater prevalence of steppe. Only a site in Georgia at the edge of the Caucasus Mountains indicates the presence of significant amounts of forest (mainly Pinus), a result that was also found by Tarasov et al. (2000) and is probably linked to favourable orographic precipitation and proximity to the Black Sea.
Comparisons with LGM land cover from vegetation modelling studies driven by climate model simulations indicate a much wider presence of forest than that shown by the pollen data (Kaplan et al., 2016). Data–model agreement appears to be closest over eastern central Europe, where pollen indicates the presence of open boreal forest, and over southwestern Europe with the presence of cool mixed temperate forest, including broadleaf deciduous and thermophilous elements (Prentice et al., 2011; Allen et al., 2010; Cao et al., 2019; Velasquez et al., 2021). Nevertheless, agreement still appears to be weak over western central Europe and southern and eastern Europe through to the Middle East, where pollen data continue to indicate widespread steppe. One proposed explanation for this data–model discrepancy is the role of fire (including man-made fire) in maintaining forest openness, a factor influencing forest cover that is not included in most vegetation models (Kaplan et al., 2016). In the Carpathian Basin, Magyari et al. (2014a) noted that charcoal increased as forest cover declined, suggesting that wildfires played a role in decreasing forest cover during the LGM. Other studies have noted low levels of charcoal and therefore fires during the LGM, although these tend to be from steppe areas with low biomass and fuel availability (Connor et al., 2013; Kaltenrieder et al., 2009). Recent LGM vegetation simulations that include fire indicate much lower values of forest cover than those without fire over western central Europe, while forest remains in central eastern Europe (Velasquez et al., 2021). This appears closer to the data, but the values are perhaps too low compared with our MAT reconstructions here (Fig. 4).
4.2 Climate
4.2.1 Comparison with previous pollen-based reconstructions
The climate of the LGM is generally regarded as having been cooler and drier than today, but data–model comparisons continue to highlight important discrepancies, not only in the degree of cooling and drying but also in their seasonal and spatial distribution. Data–model comparisons over Europe have mainly used pollen-based climate reconstructions, especially the Paleoclimate Modelling Intercomparison Project (PMIP/CMIP) (Kageyama et al., 2006, 2021; Bartlein et al., 2011; Harrison et al., 2015; Braconnot et al., 2012; Cleator et al., 2020). The most commonly used reconstructions are based on two main methods, the artificial neural network (ANN) methodology of Peyron et al. (1998) and Jost et al. (2005) and an inverse modelling (INV) approach applied by Wu et al. (2007). The ANN method uses modern pollen samples and does not include any correction for CO2 effects, being similar in these respects to the MAT method used in this study. In contrast, the INV method does not use modern pollen samples but instead uses a process-based vegetation model run in inverse mode (Guiot et al., 2000). Ordinarily, a vegetation model will use climate as an input to generate a type of vegetation as an output, but in inverse mode the model is reconfigured so that the input climate (and CO2) can be varied iteratively until the closest match is found between the vegetation simulated by the model (represented by PFT scores) and the fossil pollen assemblage (also represented by PFT scores). One of the advantages of the INV method is that CO2 can also be varied as an input, and therefore the effect of changes in CO2 on the vegetation, and therefore reconstructed climate, can be investigated. Comparisons of these ANN and INV reconstructions have shown important differences, with the INV reconstruction generally not as cold as and somewhat drier than ANN (Wu et al., 2007). These differences between pollen–climate methods have often been attributed to CO2 effects (Wu et al., 2007) but this is not clear, since there may be other factors, such as the size and location of the training set used in the ANN reconstruction.
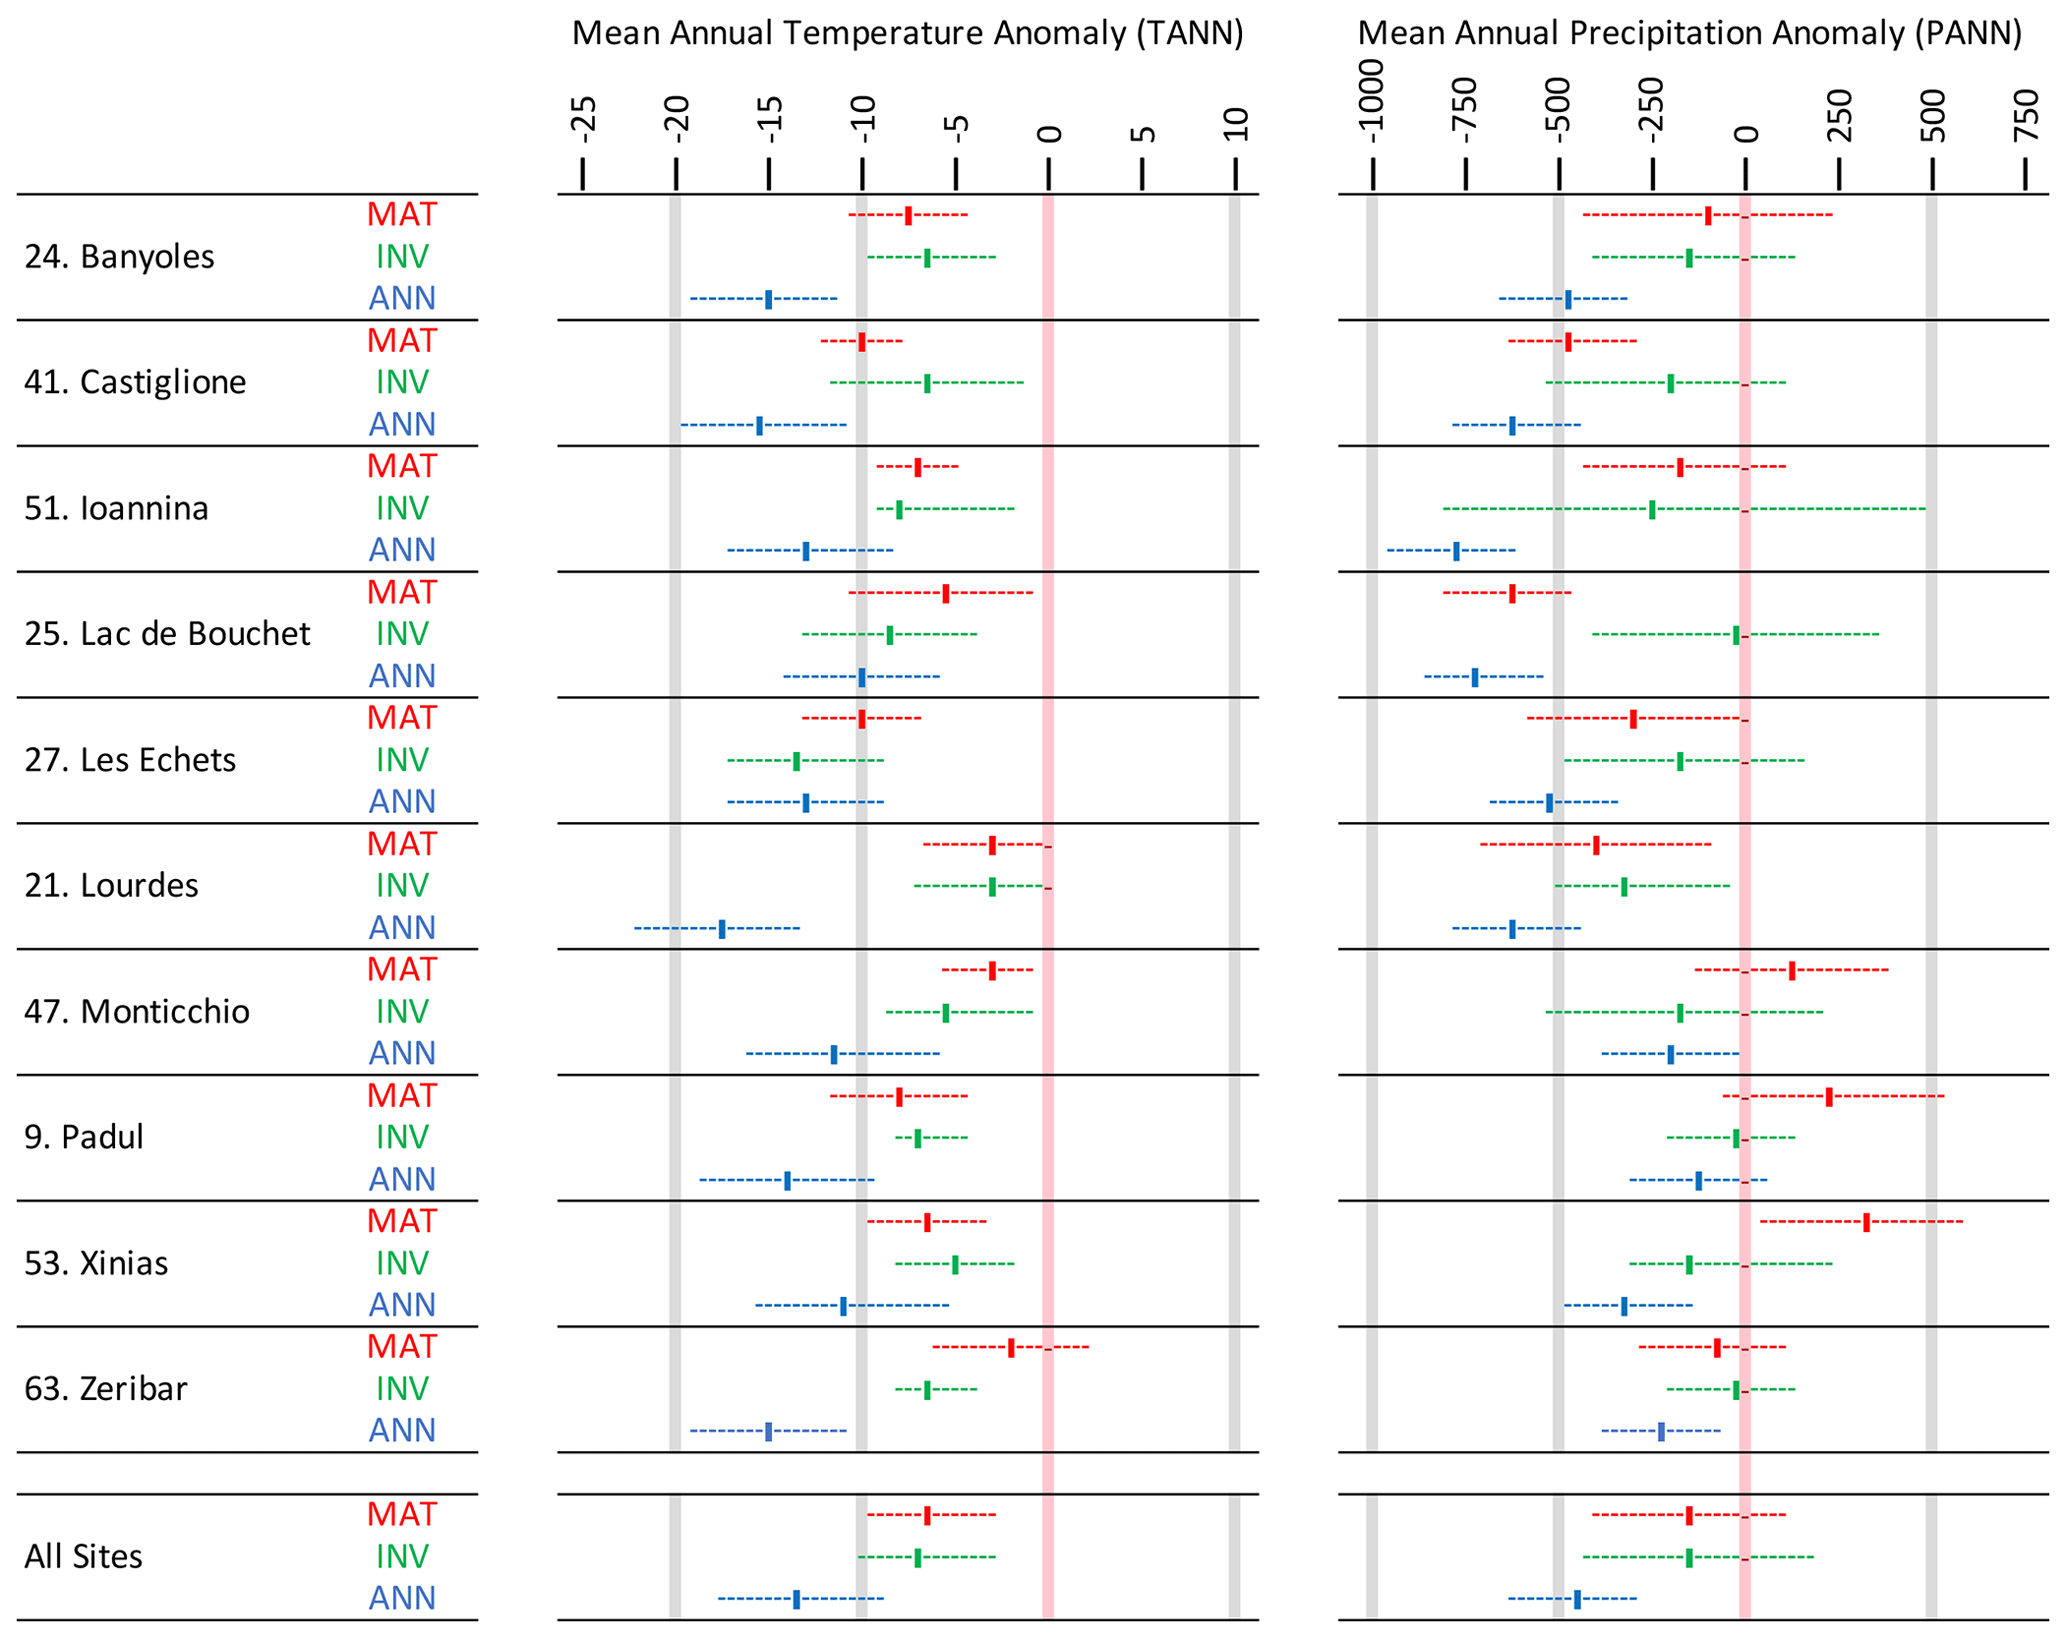
Figure 9A site-by-site comparison between LGM pollen–climate reconstructions based on the modern analogue technique (MAT; this study), artificial neural networks (ANNs; Peyron et al., 1998), and inverse modelling (INV; Wu et al., 2007). The results show that MAT and INV give similar climate reconstructions but that ANN is significantly cooler and drier.
We make a comparison with these earlier reconstructions based on 10 sites/records in our dataset which we identified as also being included in these earlier studies (Fig. 9). While we were able to identify the site and data source and the time window, we were unable to establish if the the data represented a single sample or the mean of multiple samples within a time window, the exact depth of those samples, or the actual sediment core in the case of multiple cores from the same site. While these aspects are unknown, it seems likely that the pollen data we used in our analysis were very similar, if not identical, in most cases and that reconstructed biomes for these sites from our pollen dataset are identical to the biomes reconstructed using the earlier pollen dataset (Elenga et al., 2000).
We compare our MAT with the ANN and INV reconstructions in Fig. 9. On average across all 10 records, the MAT and INV methods give almost identical results for anomalies of both mean annual temperature (MAT −6.6 °C, INV −7.2 °C) and precipitation (MAT 158 mm, INV 165 mm). Uncertainties are also similar for both methods. In contrast, the ANN method gives much cooler mean annual temperature anomalies (ANN −13.9 °C) and drier precipitation anomalies (ANN −474 mm). On a site-by-site basis, the MAT and INV methods show closer agreement for temperatures than precipitation, although precipitation has proportionally larger uncertainties. The reconstructions based on these two methods are close enough that the uncertainties overlap at all sites for both temperature and precipitation, except the precipitation reconstruction at Lac de Bouchet (site no. 25). The reason for this is not clear, but there could easily be minor differences with the pollen data analysed by Wu et al. (2007) in their INV reconstruction, since the pollen record (Reille and de Beaulieu, 1988) includes multiple cores, each with many different samples covering the LGM period.
This comparison shows that our MAT reconstructions are very similar to the INV method but are not as cold or dry as the ANN method. This has two main implications. The first is that our reconstructions indicate greater agreement with the results of climate model simulations, since climate models indicate temperatures closer to the INV reconstructions (Latombe et al., 2018) than to the ANN reconstructions (Jost et al., 2005; Kageyama et al., 2006). The difference between our MAT and earlier ANN reconstructions is likely the result of the modern pollen datasets used, since the ANN reconstruction was based on a considerably smaller number of samples taken mainly from the cold dry steppes of Kazakhstan and Mongolia.
The second implication is that the MAT method may not be significantly impacted by the effects of lower CO2 (Cowling and Sykes, 1999; Prentice and Harrison, 2009; Williams et al., 2000) or indeed insolation changes during the LGM, since the MAT results are similar to those based on the INV method, which specifically takes account of these non-climatic factors (Wu et al., 2007). This would suggest that the MAT could also work well for pollen-based climate reconstructions on longer glacial–interglacial timescales where insolation and CO2 vary significantly from their modern values. This is consistent with the findings of Pini et al. (2022), who applied a correction algorithm developed by Prentice et al. (2017) and Cleator et al. (2020) to a MAT reconstruction of mean annual precipitation at Lake Fimon in northern Italy. This shows a very small correction of 0 to 30 mm for samples across the LGM time window, which indicates that CO2 is not a very significant factor in influencing this type of reconstruction, at least compared to the overall uncertainties (±200 mm) of the reconstruction itself. The uncertainties associated with the correction algorithm are not discussed, but, given that inputs include estimates of both LGM temperature and cloud cover, it seems likely that these could be significant. Importantly, both Pini et al. (2022) and Cleator et al. (2020) specifically exclude the necessity of applying a correction algorithm to temperature reconstructions, since they only regard hydrological variables as being affected by changes in atmospheric CO2.
4.2.2 Comparison with climate reconstructions based on other proxies
Temperature
Proxies that are not based on plants should remain unaffected by the CO2 problem during the LGM and provide an alternative basis for evaluating pollen-based reconstructions. Samartin et al. (2016) reconstructed LGM summer temperatures based on chironomid remains from Lago della Costa (site no. 34) in northern Italy. They also undertook pollen analysis on the same samples down the core, allowing us to make a sample-by-sample comparison between the chironomid temperature record and our MAT reconstruction (Fig. 10). Our pollen–climate reconstruction is for JJA mean temperature, while the chironomid reconstruction is for July mean temperature, with the anomalies based on the modern equivalent JJA and July mean temperatures respectively. The average anomaly values for all eight samples reconstructed by the pollen–climate MAT are °C and are °C for the chironomids. This indicates that pollen and chironomid average summer temperature reconstructions are very similar on average, taking into account the overlapping uncertainties, while also showing a strong similarity on a sample-by-sample basis throughout the time series.
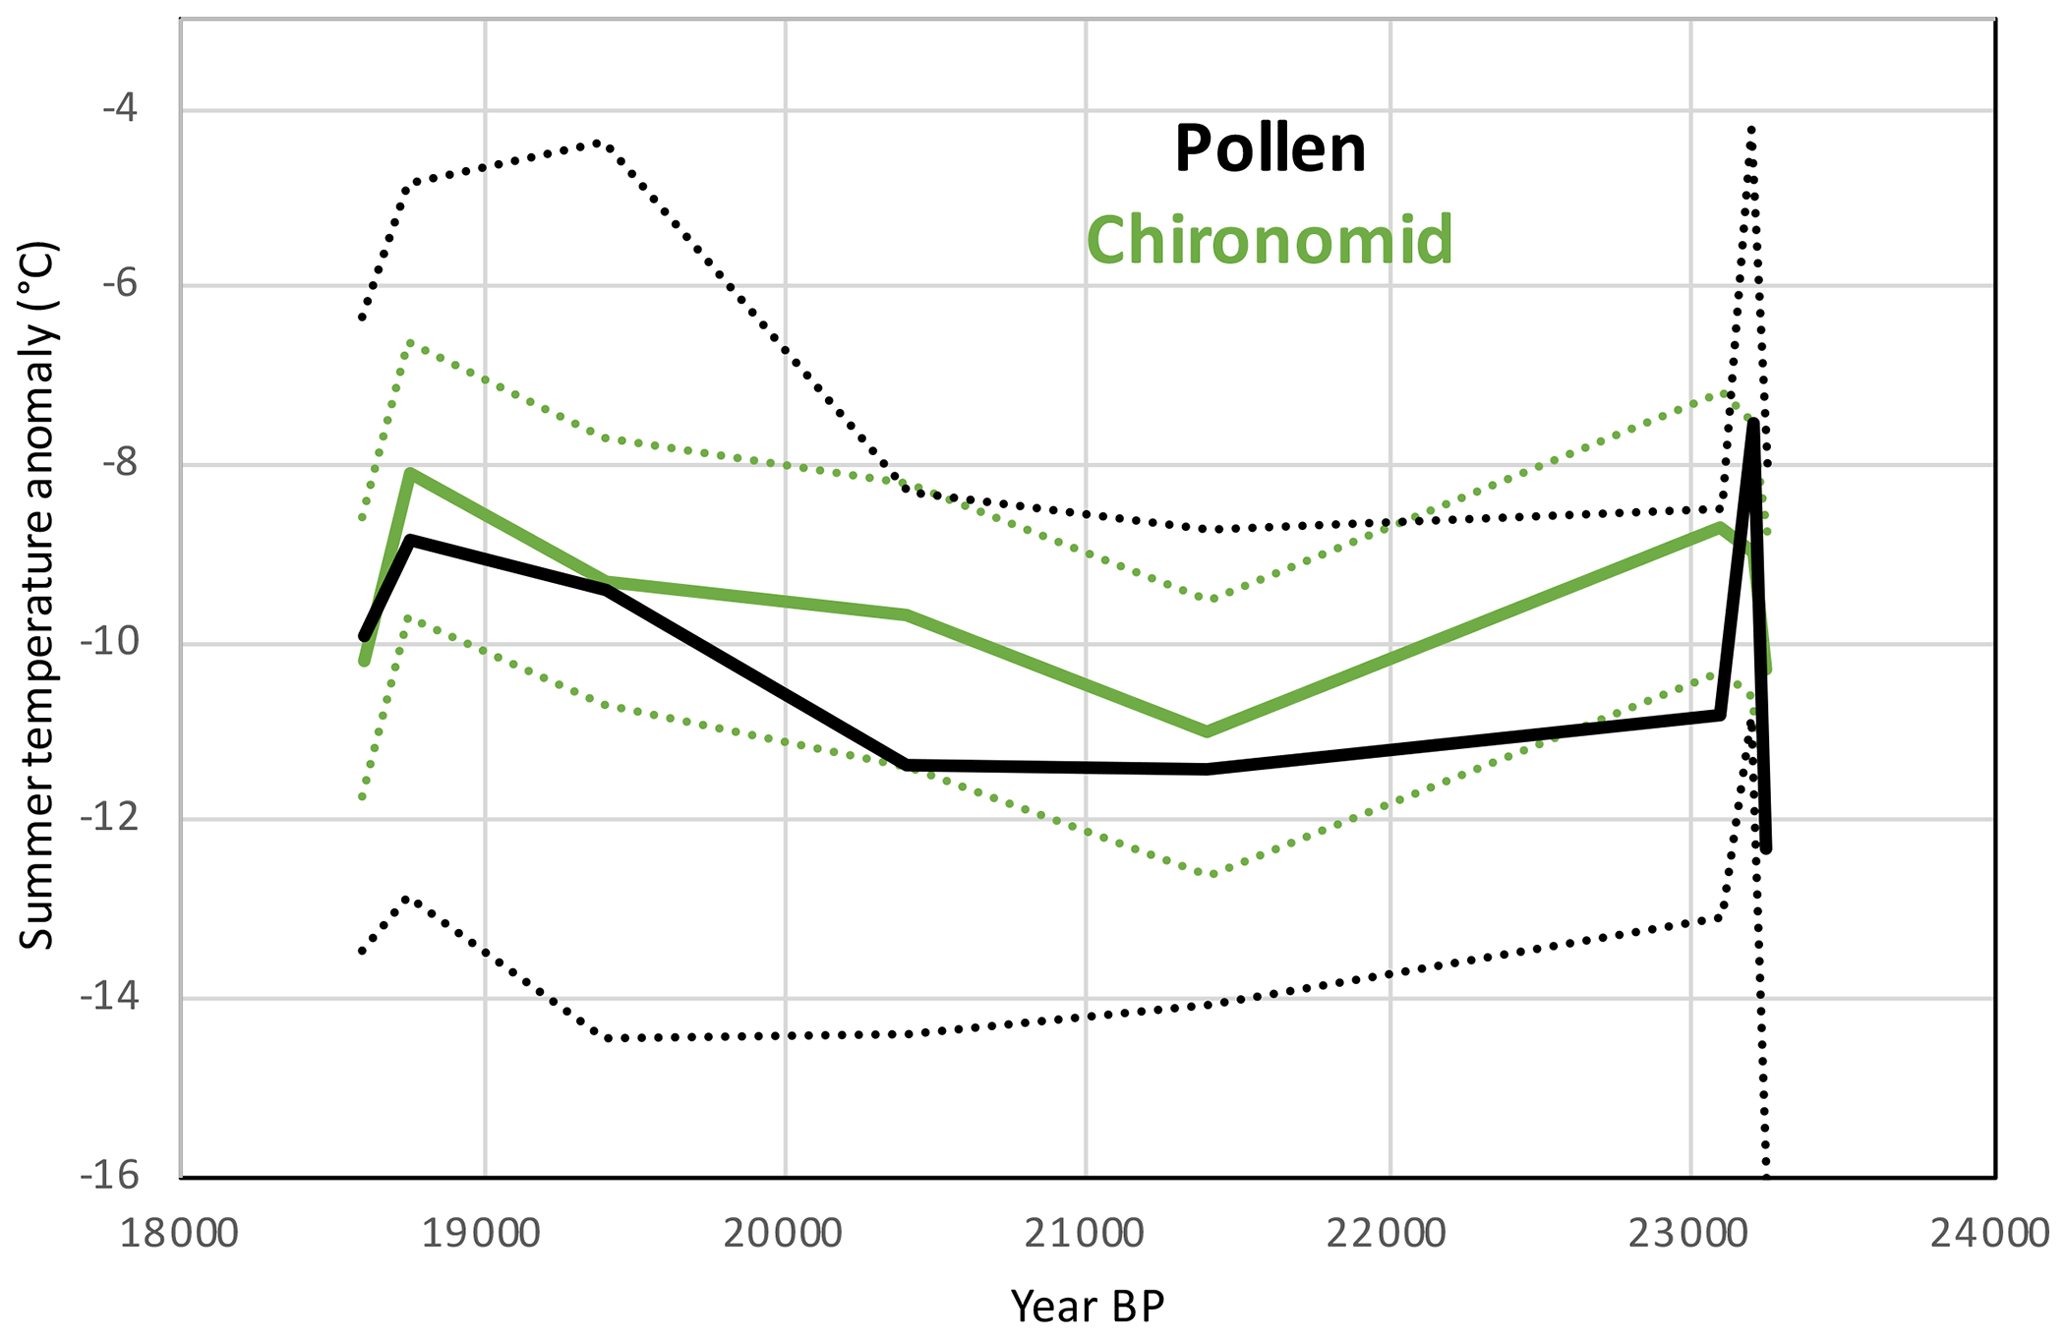
Figure 10Comparison between the LGM pollen–climate MAT and chironomid summer temperature reconstructions at Lago della Costa, Italy (chironomid reconstruction and pollen data from Samartin et al., 2016). Dashed lines show uncertainties.
Other reconstructions based on other proxies provide a basis for more general regional comparisons (Figs. A6 and A10). We reconstruct both summer and winter temperatures and show that cooling in winter was greater than in summer at most sites, associated with an increase in continentality (increased temperature difference between summer and winter). A similar seasonal pattern of temperature change has also been shown in other studies that reconstruct both summer and winter LGM temperatures, including Prud'homme et al. (2016) using δ18O analysis of earthworm calcite granules at Nußloch near the French–German border; Bañuls-Cardona et al. (2014) using faunal remains of small mammals at four locations in western Spain; and Ferguson et al. (2011), who examined seasonal temperature change using δ18O and Mg–Ca analysis of limpet shells at Gibraltar in southern Spain. The increase in continentality at Nußloch (Prud'homme et al., 2016) was reconstructed at between 11.6 to 15.6 °C, comparable at the lower end with nearby pollen sites: La Grotte Walou, site no. 28, with an increase of 10.4±5.8 °C and Bergsee, site no. 29, with an increase of 7.9±5.7 °C. The faunal sites in western Spain studied by Bañuls-Cardona et al. (2014) gave much reduced increases in continentality that were nevertheless similar to nearby pollen sites. They include the following: Valdavara, 5.1 °C (similar to MD99-2331, site no. 3, 5.2±3.1 °C); El Mirón, 1.2 °C (similar to Tourbière de l'Estarrès, site no. 19, 5.1±6.2 °C); El Portalón, 0.9 °C (similar to Torrecilla de Valmadrid, site no. 16, 2.8 ±1.8 °C); and Cueva de Maltravieso, 6.1 °C (similar to SU81-18, site no. 2, 4.8±3.4 °C). Further south at Gibraltar, the limpet-based study of Ferguson et al. (2011) also shows a relatively small increase of 2 °C. The nearest pollen site (Gorham's Cave, site no. 5), however, shows a larger increase of 4.7±2.3 °C, although differences could be expected given the different temporal resolution of annual laminae on mollusc shells compared to pollen assemblages that reflect much slower changes in trees and other long-lived flora.
Summer temperatures were warm enough during the LGM over the Alpine areas that Swiss lakes were largely ice-free in summer, while glacier equilibrium-line altitude (ELAs). around the time of the LGM suggest summers were −6.5 to −7.7 °C cooler compared to the Little Ice Age (LIA) (Heiri et al., 2014). This cooling was similar to that found at Nußloch some 200 km north of the Swiss border by Prud'homme et al. (2016), who reconstructed anomalies of −6 to °C from δ18O analysis of earthworm calcite granules, representing warm-season temperatures (May–September). Slightly less cooling was found close by at the nearby site of Achenheim, where the analysis of mollusc assemblages gave summer (August) cooling estimates of −3.5 to −6.5 °C based on the MAT (Rousseau, 1991) and −5.5 to −9.5 °C based on the mutual climatic range method (Moine et al., 2002). These reconstructions appear somewhat cooler than nearby pollen sites (La Grotte Walou, site no. 28, at °C and Bergsee, site no. 29, at °C) although comparable with the pollen site Pilsensee, site no. 32 ( °C), 200 km further east. Similar differences also occur at the site of Les Échets on the western edge of the Alps, where a diatom-based reconstruction of summer (July) temperatures (Ampel et al., 2010) indicated a greater cooling (−10.5 to −11.5 °C) than our pollen reconstruction at Les Échets G, site no. 27 ( °C). However, the authors caution that the results were based on poor analogues and rare taxa and on a small training set of only 90 lakes in Switzerland.
South of the Alps, other proxies show the opposite relationship with the pollen reconstructions. For instance, at Lago della Costa in the Po Valley, a summer (July) temperature chironomid reconstruction by Samartin et al. (2016) is around 1–2 °C less cool than the pollen reconstruction (JJA) for the same site, Lago della Costa, site no. 34 ( °C), although both reconstructions fall within their respective uncertainty ranges (Fig. 8). In the Pindus mountain range in Greece, Hughes et al. (2006) estimated LGM summer temperature anomalies of −7 °C based on glacier modelling, which is comparable with those reconstructed at the nearest pollen site, Ioannina, site no. 51 ( °C). In Spain, the analysis of small-mammal remains by Bañuls-Cardona et al. (2014) shows similarly less cooling in summer or even warmer conditions than present positive anomalies compared to the nearest pollen sites, such as Valdavara, 1.4 °C (similar to MD99-2331, site no. 3, °C); El Mirón, −2.3 °C (similar to Tourbière de l'Estarrès, site no. 19, °C); El Portalón, 0.8 °C (similar to Torrecilla de Valmadrid, site no. 16, °C); and Cueva de Maltravieso, −1.1 °C (similar to SU81-18, site no. 2, °C). Further south at Gibraltar, the limpet-based study of Ferguson et al. (2011) suggests an anomaly of around −7 °C, which is a greater cooling than the pollen reconstruction from this location (Gorham's Cave, site no. 5, °C), although it is comparable with other pollen sites slightly further east.
Winter temperature reconstructions from non-pollen proxies show a similar pattern to summer temperatures in relation to pollen reconstructions. North of the Alps at Achenheim, Prud'homme et al. (2016) use δ18O in earthworm remains to reconstruct particularly cold winter anomalies of −17.6 to −23.6 °C compared to nearby pollen sites (La Grotte Walou, site no. 28, with anomalies of °C and Bergsee, site no. 29, with anomalies of °C). South of the Alps in Spain, the analysis by Bañuls-Cardona et al. (2014) based on the remains of small mammals shows less cooling in winter compared to the nearest pollen sites, in particular, Valdavara, −3.7 °C (similar to MD99-2331, site no. 3, °C); El Mirón, −3.5 °C (similar to Tourbière de l'Estarrès, site no. 19, °C); El Portalón, −0.1 °C (similar to Torrecilla de Valmadrid, site no. 16, °C); and Cueva de Maltravieso, −7.2 °C (similar to SU81-18, site no. 2, °C). And, again, in southern Spain at Gibraltar, the analysis of limpet shells by Ferguson et al. (2011) suggests winter cooling of around −9 °C, while the pollen reconstruction suggests °C for Gorham's Cave, site no. 5, although sites further east indicate cooler conditions.
A number of additional proxies have also been used to reconstruct LGM mean annual temperature. Heyman et al. (2013) applied glacier mass balance modelling at sites located in the smaller mountain regions north of the Alps. These are generally slightly cooler than our pollen-based reconstructions at sites close to the Vosges Mountains, °C, and the Black Forest, °C (similar to Bergsee, site no. 29, °C); the Bavarian Forest, °C (similar to Pilsensee, site no. 32, °C); and the Giant Mountains, °C (similar to Kersdorf-Briesen, site no. 46, °C). These values obtained by Heyman et al. (2013) are warmer than those obtained by Prud'homme et al. (2016), who estimated annual mean temperature anomalies of −15.1 to −19.1 °C based on δ18O of earthworm calcite at the Nußloch site just north of the Vosges mountains and the Black Forest. The annual temperatures reconstructed by Heyman et al. (2013) are also around 2 °C warmer than those reconstructed by Allen et al. (2008a), who applied a similar, although simpler, method to over 29 different mountainous regions across Europe that were glaciated during the LGM. Since glacier mass balance is a function of both snowfall and temperature, these estimated temperatures vary according to estimated changes in precipitation. For instance, mean annual temperature estimates by Allen et al. (2008a) are much cooler than those reconstructed by pollen, with an average anomaly of −13.2 °C for the 29 sites assuming a 40 % reduction in precipitation, but this is reduced to −11.8 °C assuming the same precipitation as during the modern day. These average anomalies across all sites calculated by Allen et al (2008a) compare with an average temperature anomaly of −7.2 °C across all 63 of our pollen sites. The glacier mass balance modelling by Allen et al. (2008a) assumes a seasonal distribution of precipitation that is similar to the present day, and it does not consider increases in winter precipitation or mean annual precipitation above present-day levels. Both of these are suggested by the pollen data in some regions, and both could explain glacier extent found during the LGM based on less-extreme temperature anomalies more comparable with the pollen data. Mean annual temperatures have also been reconstructed from the Paris Basin area in eastern France by Bekaert et al. (2023) using the noble gas proxy. The authors suggest an LGM temperature anomaly of °C, although this is actually dated to 25.6±0.5k, which is earlier than our 21k±2.0k time window that we adopt here. The sample closest to 21 k is at 21.9±0.5k and suggests slightly warmer temperatures at −7.77 °C, which compares well with our pollen reconstructions nearby at Bergsee, site no. 29 ( °C), and La Grotte Walou, site no. 28 ( °C).
To the east of the Alps in the Pannonian Basin, mean annual temperature anomaly estimates have been made from noble gas measurements on groundwater ranging from −2 to −4 °C (Stute and Deak, 1990) up to −9 °C (Varsányi et al., 2011). These are similar to estimates ranging from −2 to −9 °C from oxygen isotope ratios from mammoth tooth enamel (Kovács et al., 2012) and are comparable with nearby pollen sites: Lake Fehér, site no. 50 ( °C), and Kokad, site no. 52 ( °C). On a broader scale, Sanchi et al. (2014) estimated LGM cooling in the Danube and Dnieper basins based on lipid biomarkers in a core from the Black Sea and came up with similar mean annual temperature anomalies between −6 to −10 °C, which again are comparable with pollen sites from the region that range from Nagymohos, site no. 48 ( °C), to Straldzha, site no. 57 ( °C).
Further south and west, García-Amorena et al. (2007) reported mean annual temperature anomalies of −2.0 to −11.3 °C at LGM sites along the Portuguese coast, based on an indicator species method using plant macrofossils. This is similar to the closest marine pollen sites off the coast, which recorded values of °C at MD95-2039, site no. 1, and °C at MD99-2331, site no. 3. Meanwhile, in the far east of the study area, Zaarur et al. (2016) estimated a mean annual temperature anomaly of around −3 °C based on a clumped isotope analysis of Melanopsis shells from LGM sediments in the Sea of Galilee. This limited cooling appears similar to the nearest pollen site (Lake Zeribar, site no. 63), where we reconstruct a cooling of °C.
Reconstructions of LGM sea surface temperatures (SSTs) provide yet another source of comparison with our terrestrial pollen-based reconstructions, although many of the physical processes controlling sea surface temperatures, such as upwelling, surface mixing, surface currents, stratification, and thermal inertia through the seasonal cycle, represent quite different processes to those controlling surface temperatures over land, particularly at the sub-regional scale. Nevertheless, the Atlantic coastal waters of Iberia and the waters throughout the Mediterranean Sea include many SST sites that lie in relative proximity to our terrestrial pollen sites, allowing us to make a comparison at the largest scale. Within this area, the MARGO database (MARGO Project Members, 2009) includes 13 alkenone-, 2 Mg–Ca-, and 41 foraminifera-based SST records of mean annual temperature, with the foraminifera records also providing an additional 41 winter (JFM) and summer (JAS) SST estimates. We compare the SST records with the 36 closest terrestrial pollen records which fall within a box of −11 to 35° longitude and 32 to 43° latitude containing all of the SST records. A simple site average indicates a mean annual SST anomaly of °C, which is relatively close to the value of °C obtained from the terrestrial pollen sites (site nos. 1–4, 5, 7–24, 25, 26, 30, 35–38, 41, 47, 51, 53, and 56–59). Interestingly the inter-site variance (standard deviation of the reconstructed temperatures across all sites) is almost identical for the two datasets, 2.57 °C for the SST sites and 2.63 °C for the pollen sites, despite representing very different environments, proxies, and uncertainties. However, when we look at the seasonal temperature anomalies, we find very different results. Site-averaged winter SST anomalies are °C compared to °C for winter temperatures from terrestrial pollen sites, while in summer the values are reversed ( °C compared to °C respectively). This suggests that SSTs experienced greater cooling in summer compared to winter, which is the opposite to what is generally found in terrestrial seasonal temperature reconstructions throughout the region, although this is consistent with model simulations (Mikolajewicz, 2011).
Precipitation
Few proxies apart from pollen provide quantitative reconstructions of precipitation during the LGM. Glacier mass balance modelling includes assumptions about precipitation in order to derive temperatures (Allen et al., 2008a), but neither is independent of the other. Hughes et al. (2006) estimate from glacier modelling that the mean annual precipitation during the LGM at sites in the Pindus mountains in Greece was around 2300±200 mm, which they regard as similar to the present day (>2000 mm). A small change in precipitation compared to modern values is also indicated by the nearest pollen site, which is around 47 km to the south (Ioannina, site no. 51), and indicates a mean annual precipitation anomaly of mm, representing just 15 % of the modern value. A larger reduction in mean annual precipitation of −45 % (maximum) is reconstructed by García-Amorena et al. (2007) based on plant macrofossil remains from sites on the Portuguese coast. In comparison, the closest pollen sites record values which are a little lower, ranging from −22 % at MD95-2039, site no. 1, to −34 % at MD99-2331 site no. 3. Further north, in southwestern Germany, Prud'homme et al. (2018) reconstructed mean annual precipitation from the δ13C of earthworm calcite granules at Nußloch. They estimated a field site average of 333 (159–574) mm yr−1 at the LGM, which represents an anomaly of −503 mm yr−1 (−60 %) relative to the modern precipitation of 836 mm yr−1. This is comparable with the closest pollen site (Bergsee, site no. 29) with an anomaly of −540 mm yr−1.
As with glaciers, lake levels reflect changes in moisture balance that include the effects of both temperature (via evapotranspiration) and precipitation rather than just precipitation. They also represent semi-quantitative data at best, with changes often described relative to the modern or other baseline. There are few lake-level records available north of the Alps, but, to the south, many records indicate high lake levels in areas such as Spain (Lacey et al., 2016; Moreno et al., 2012; Vegas et al., 2010), Italy (Belis et al., 1999; Giraudi, 2017), Greece and Turkey (Harrison et al., 1996; Reimer et al., 2009), and the Middle East (Kolodny et al., 2005; Lev et al., 2019). These lake records are also supported by the evidence of higher river levels in Morocco (El Amrani et al., 2008). The cause of the higher lake levels has been the subject of some debate, since many pollen records (and especially early biome reconstructions) show steppe vegetation that would suggest aridity that appears incompatible with higher lake levels. Prentice et al. (1992) proposed that the co-existence of steppe vegetation and high lake levels could be possible if precipitation increased outside of the summer growing season, while summers themselves were drier and cooler with decreased evaporation. However, the results of our analysis tend to indicate the opposite in regions with higher lake levels, with increased summer rainfall and decreased winter rainfall. In addition, the increase in summer precipitation was enough to compensate for the decrease in winter rainfall, leading to an overall increase in mean annual precipitation at many pollen sites in Spain and Greece, for instance. This, together with depressed temperatures and consequently decreased evaporation, could explain the higher lake levels whilst also limiting the growth of trees as a result of cooler temperatures and prolonged aridity outside of the summer season. Davis and Stevenson (2007) also note a differential hydrological response between summer and winter rainfall in the Mediterranean during the Holocene that may also provide an explanation. In this case, sporadic summer storms may result in high rates of runoff that may fill runoff-fed lakes, but they may also result in low rates of soil moisture recharge that fail to benefit vegetation in the same way winter rainfall does.
Overall, we reconstruct only a small reduction in precipitation during the LGM of around 91 mm (13 %) averaged over all sites, which is less than the ∼200 mm reduction based on the sites in the pollen–climate compilation used by PMIP (Bartlein et al., 2011). Since our precipitation reconstruction on average matches that of the INV reconstruction by Wu et al. (2007), we can attribute much of the difference to the greater aridity shown in the ANN reconstruction by Peyron et al. (1998) and Jost et al. (2005) (see Fig. 9). As with temperature, this is probably a reflection of the modern training set used in the ANN reconstruction, which is much smaller than our training set and is largely taken from the arid steppes of Kazakhstan and Mongolia. However, it is also important to recognize the significant spatial variability in precipitation, which means that a simple average of different sets of sites from different regions may not accurately reflect the change in LGM precipitation at the European scale. Nevertheless, one of the most consistent signals in our dataset is for an increase in summer precipitation over many areas of southern Europe and the Mediterranean. This is also found in climate models, where it has been attributed to an increase in convection-driven precipitation, although the amount of precipitation generated by this mechanism varies significantly between models (Beghin et al., 2016). It may seem counter-intuitive to see an increase in reconstructed precipitation in the same regions where we also find a preponderance of steppe or xerophytic biomes and taxa, including Artemisia and Chenopodiaceae. This is attributable to the fact that climate can change quite markedly, necessarily invoking a major change in vegetation and especially in the pollen biome. For instance, a semi-arid climate ranges from 250–500 mm of rainfall a year, so we could expect semi-arid vegetation to be dominant even if the rainfall increases by 250 mm (100 %).
A more consistent response in models is for an increase in winter precipitation across southern Europe and the Mediterranean related to a stronger and more southerly displaced jet stream, with winter precipitation also accounting for much of the change in mean annual precipitation (Beghin et al., 2016). Our reconstruction of winter precipitation, however, shows less support for this scenario, with a more general decrease in winter precipitation apart from in southern and eastern Iberia and with summer precipitation generally more important in those sites that show an overall increase in mean annual precipitation. This may not necessarily contradict the models in terms of the strength and position of the winter jet stream, but it may instead indicate that models overestimate the amount of moisture being carried westward from the cold North Atlantic along the storm track, especially across the far northern Mediterranean. The increase in winter precipitation across southern and eastern Iberia is, however, entirely consistent with a strengthened and more southerly jet stream, which also brings increased winter precipitation to the region today as a result of blocking over northern Europe and the Atlantic and a negative North Atlantic Oscillation (NAO) (Vicente-Serrano et al., 2011).
Other areas that show an increase in winter precipitation include pollen sites around the eastern end of the Alps. This is consistent with a recent study by Spötl et al. (2021), who argued, on the basis of cryogenic carbonates preserved in a cave in Austria, that heavy winter (and autumn) precipitation was a significant factor in driving LGM glaciation in the region. The seasonally specific nature of this precipitation is also supported by the same pollen sites, which do not show any increase in summer precipitation at this time.
We have reconstructed the climate and vegetation cover across Europe, northern Africa, and the Middle East at the time of the LGM based on 63 pollen records. These records were selected using strict quality-control criteria, with particular attention paid to dating control, which led to the exclusion of many records that have been used in previous studies. This fully documented dataset represents the most chronologically precise and spatially resolved view of LGM climate and vegetation during the PMIP benchmarking time window at 21±2 ka. Nevertheless, it is important to recognize that there are still significant spatial gaps in pollen sites, especially north of the Alps, the Balkans, Turkey, and the Middle East, and we continue to have only a partial understanding of the LGM over these areas.
One of the key questions concerning the vegetation landscape of the LGM in Europe has been the extent to which forest rather than steppe covered the continent and to what extent temperate elements could be found north of the classical refugia areas of southern Europe and the Mediterranean. Our results show that, although steppe and tundra were extensive at the time of the LGM, areas of open forest also occurred in many regions, particularly (but not exclusively) in Iberia, northern Italy, and central Europe. These forest or woodland stands are likely to have been located in environmentally favourable areas, with good soils, elevated rainfall, and shelter from cold, desiccating winds. In those areas where woodland existed, boreal taxa generally dominated north and east of the Alps, while temperate and thermophilous (mainly drought-adapted) taxa were generally confined to areas south of the Alps and around the Mediterranean. The temperate deciduous forests that compose the climax community in many areas of Europe today were displaced to the south and reduced to a partnership role with boreal elements. Overall, our new reconstruction indicates greater agreement with model land-cover simulations, but models still appear to overestimate the amount of forest and woodland over areas such as France, the Benelux, Greece, Turkey, and the Far East.
Another key question about the LGM concerns the ability of climate models to simulate the climate of this period and whether pollen-based climate reconstructions which show disagreement with models have been biased by the effects of low CO2 on plant physiology. We find that our new pollen–climate reconstruction shows much closer agreement with climate models than previous reconstructions that did not take account of low-CO2 effects. We also find close agreement with previous reconstructions that did take account of CO2 effects. Since our MAT method itself does not specifically take account of low-CO2 effects, this would suggest that this problem is not a significant hindrance to MAT performance at the time of the LGM, at least not compared to other uncertainties. Instead, we suggest that the main factor in the performance of pollen–climate transfer functions that use modern analogue methods is the provision of a large enough modern pollen dataset with suitable LGM analogues.
This conclusion is supported by comparison with climate reconstructions based on other proxies. We found little difference between our MAT reconstruction and a chironomid-based summer temperature record based on a downcore sample-by-sample comparison and on comparisons with records from a variety of other proxies at a regional scale. However, it is notable that some studies using glacier mass balance modelling methods indicate LGM temperatures that are much cooler than our pollen-based reconstruction. The reasons behind this are not clear, but our pollen-based results indicate higher-than-present precipitation in some areas that could potentially explain low-elevation glacier ELAs without the need for such cold temperatures.
We also find that, although our pollen-based reconstruction and reconstructions of SSTs generally agree in terms of mean annual temperatures, SSTs indicate greater cooling in summer compared to winter, while terrestrial records indicate greater cooling in winter compared to summer. These seasonal differences are also reproduced in climate models and probably reflect the different processes driving seasonal temperature change in the terrestrial and marine domains.
Our reconstructions of precipitation show large spatial and seasonal variability but generally indicate less overall aridity than previously suggested from smaller-scale studies which sampled less of the spatial domain. We find that, in some regions of southern Europe, precipitation may actually have been greater than at present, especially in summer but also in winter in southern and eastern Iberia and around the southern slopes of the Alps. This may have important implications in understanding the development of LGM glaciation, which may be less a function of temperature than previously supposed. This could also help better explain the observed asynchronous nature of glaciation, even within relatively small regions such as Europe, as a result of more localized controls on ice sheet development such as precipitation.
We hope that this new continental-scale dataset of climate and vegetation reconstructions will provide an improved baseline for data–model comparisons and other studies that will allow us to better understand the complex LGM environment.
Table A1Modern climate values for each site used in the calculation of anomalies (taken from WorldClim 2, Fick and Hijmans, 2017).
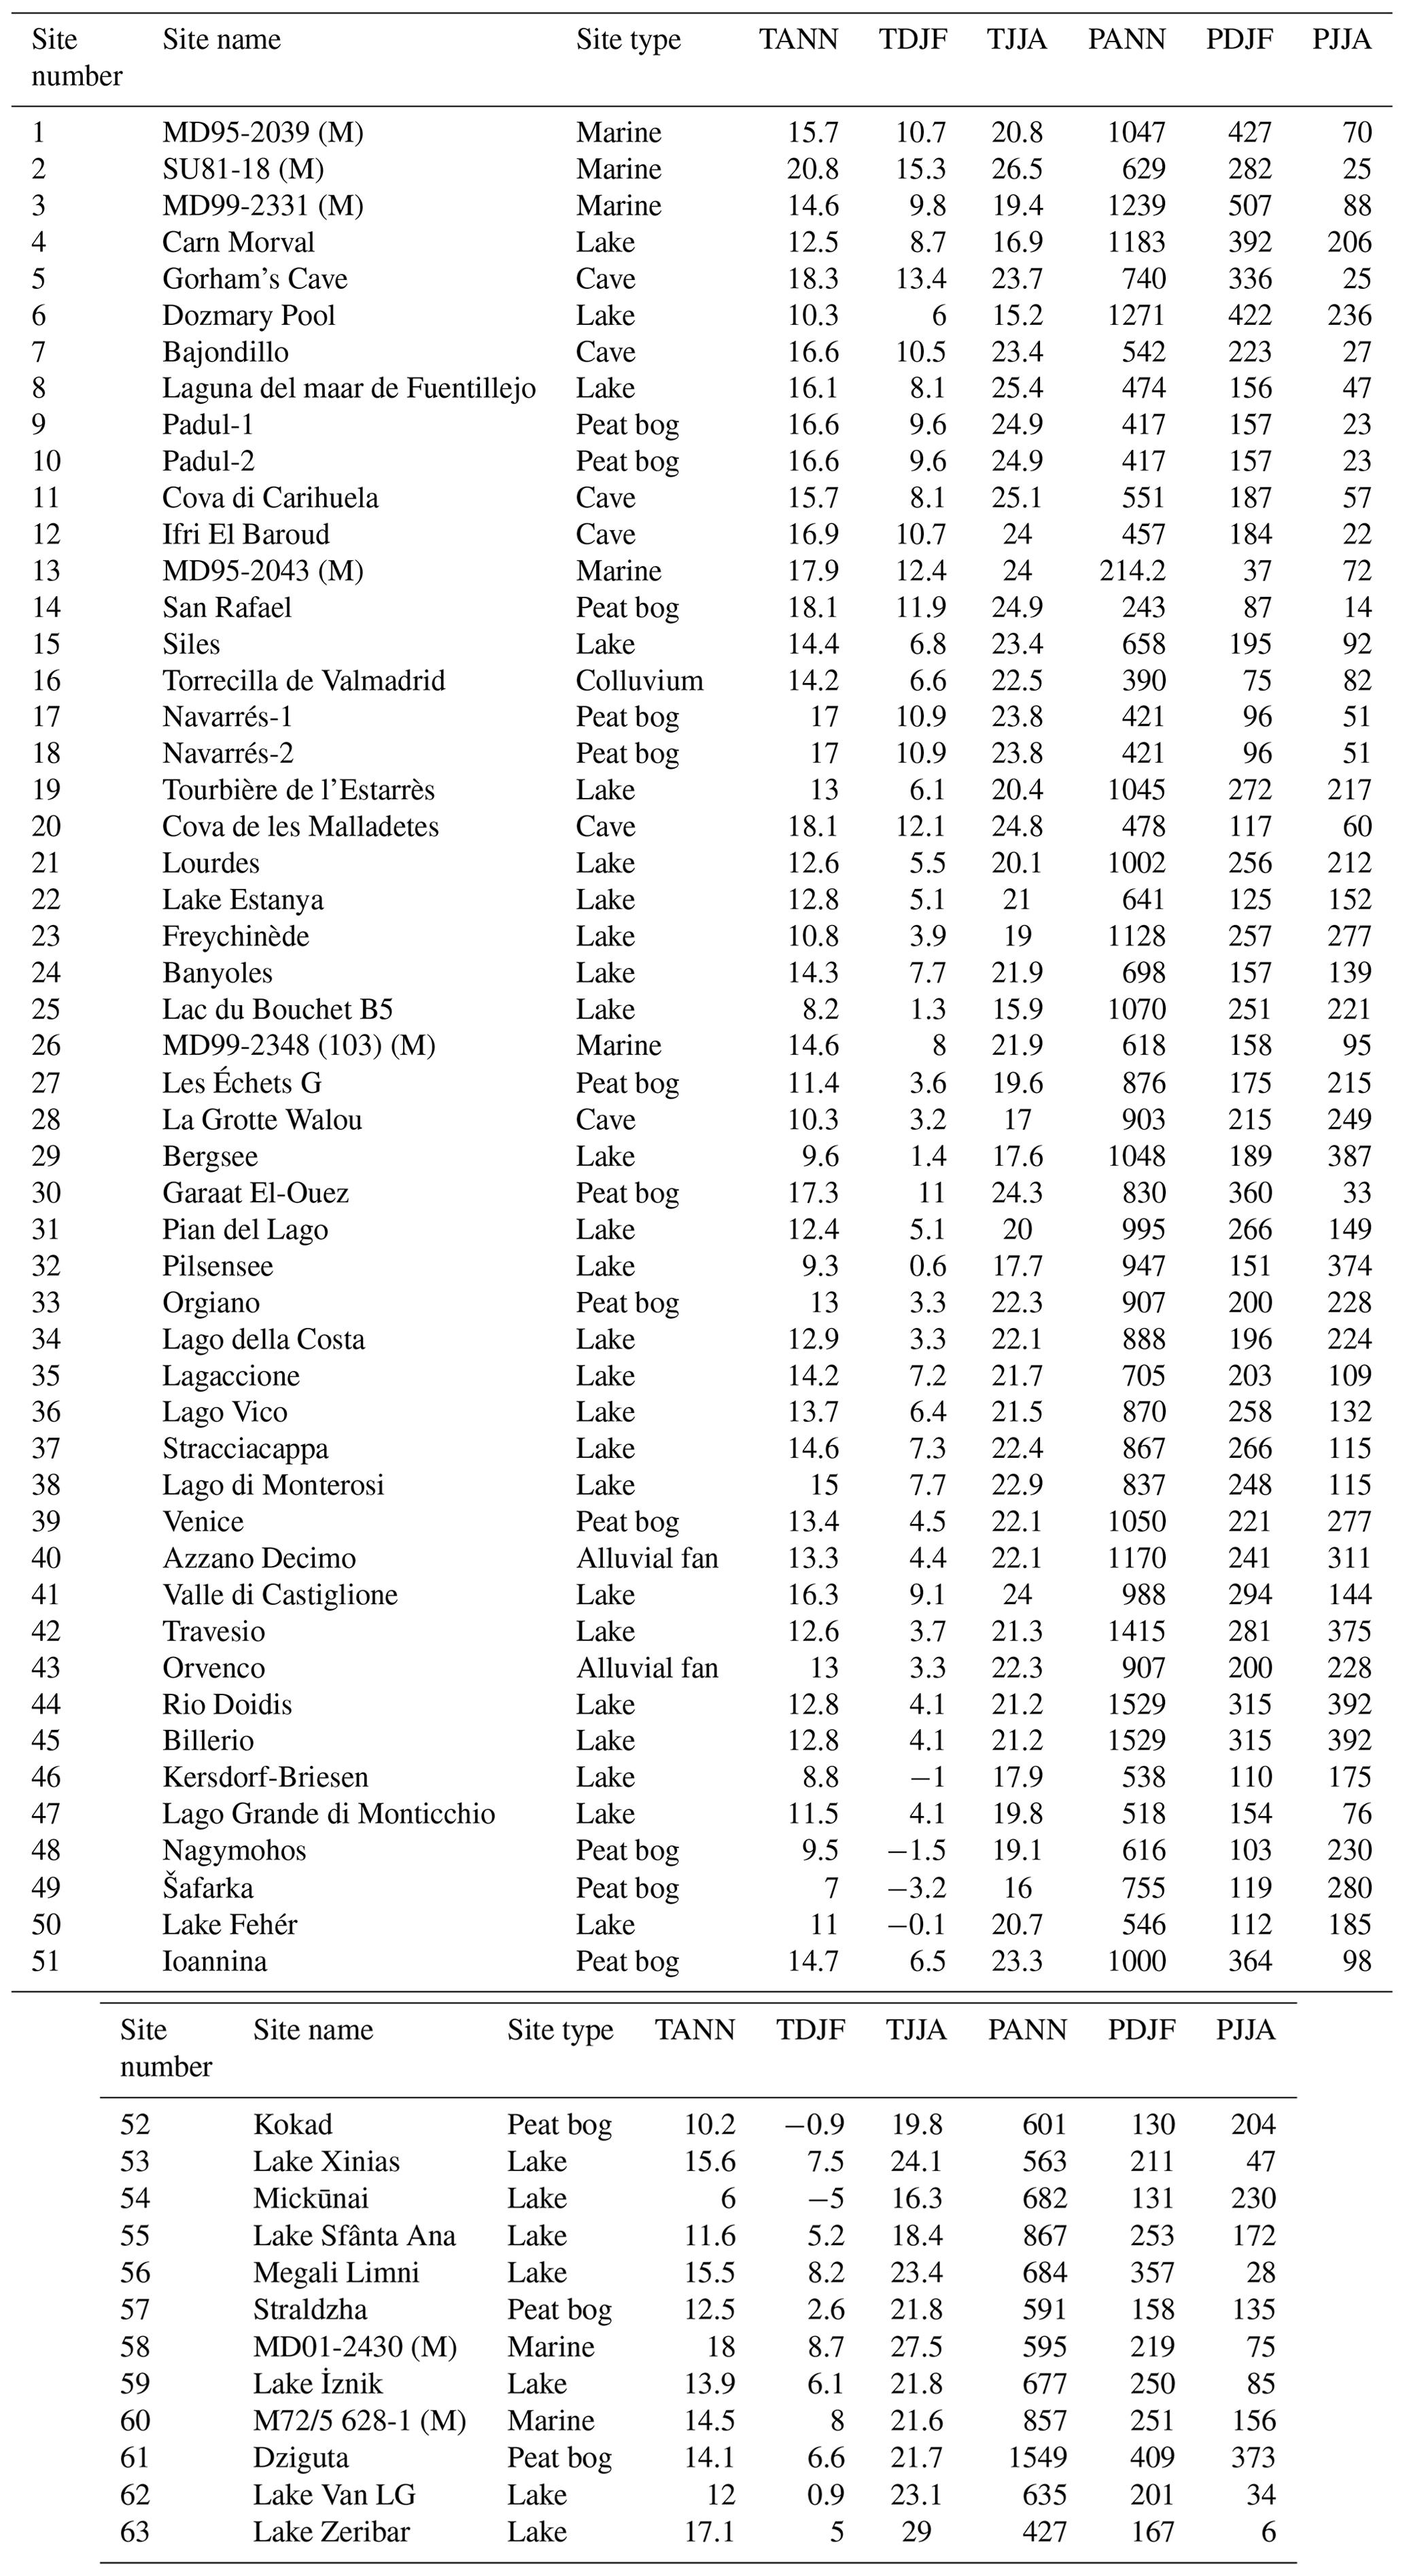
Table A2This shows the results of the experiment to test the sensitivity of pollen biomes to changes in the number of Pinaceae in the pollen assemblage using 8213 modern pollen samples from EMPD2. Pinaceae can be over-represented in marine samples, and it has been proposed that removing all Pinaceae from these samples is better than leaving the Pinaceae in the pollen assemblage. The “Control” column on the left shows the number of samples that were classified for each biome without changing the number of Pinaceae (i.e. using the original pollen assemblage). The other eight columns to the right show the number of samples where the biome changed relative to the number shown in the control column as a result of either the removal of all Pinaceae (“0 Pinaceae”) or by artificially increasing the number of Pinaceae from 5 % to 400 % of the original count (“+5 % Pinaceae” to “+400 % Pinaceae”). For instance, for the CLDE (cold deciduous) biome, 25 pollen samples were classified as CLDE without any change in Pinaceae (“Control”), but 454 more samples were classified as CLDE when all Pinaceae were removed (“0 Pinaceae”) compared to 4 fewer samples that were classified as CLDE when the number of Pinaceae was increased by as much as 400 % (“+400 % Pinaceae”). The totals along the bottom show that, out of the 8213 pollen samples included in the experiment, 5860 biomes changed when all Pinaceae were removed, compared to up to 2348 when the number of Pinaceae was artificially increased by up to 400 %.
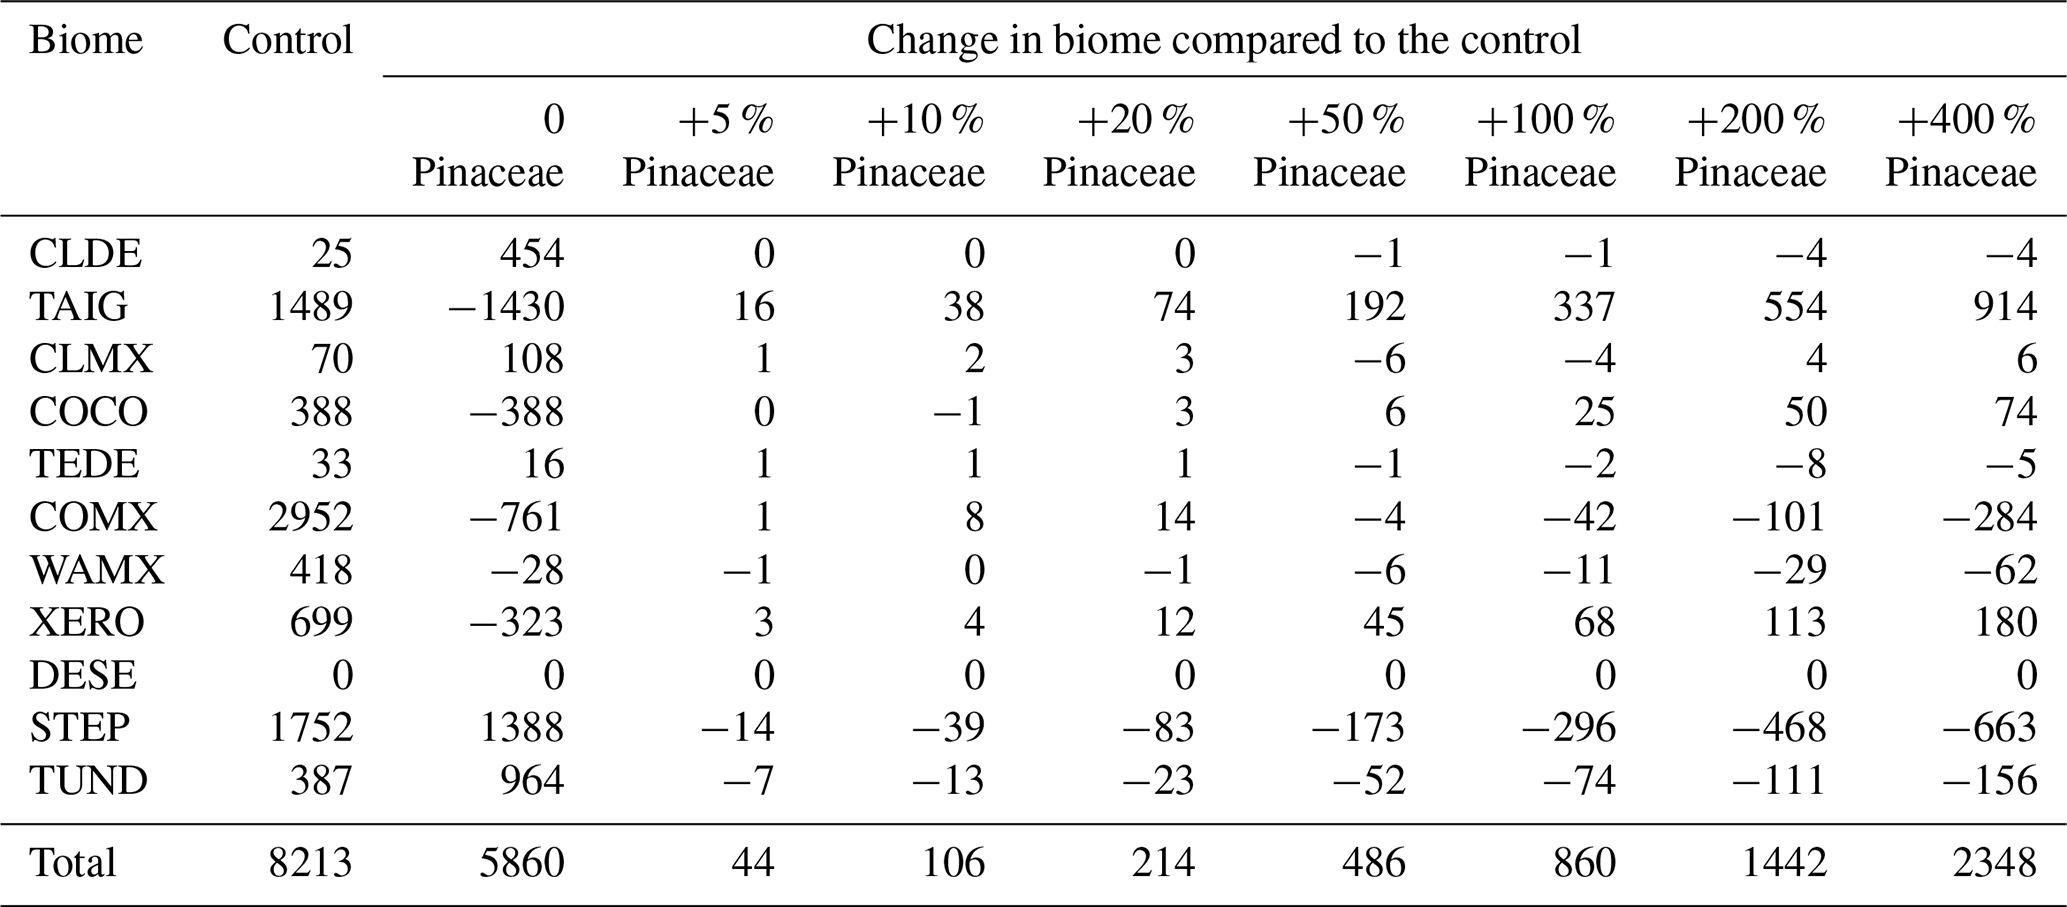
Table A3A comparison of the LGM reconstructed climate for marine sites showing the effect of excluding Pinaceae (shaded) from the pollen assemblage compared to the results of including Pinaceae (unshaded; also presented in Figs. 6–8). It has been proposed that, because of the potential for over-representation of Pinaceae in marine pollen samples, it is better to exclude Pinaceae completely from marine pollen samples. Comparing the two approaches, temperatures are generally 1–2 °C cooler and precipitation is slightly higher when Pinaceae are excluded. The differences for both temperature and precipitation are significantly less than the standard deviation of their uncertainties.
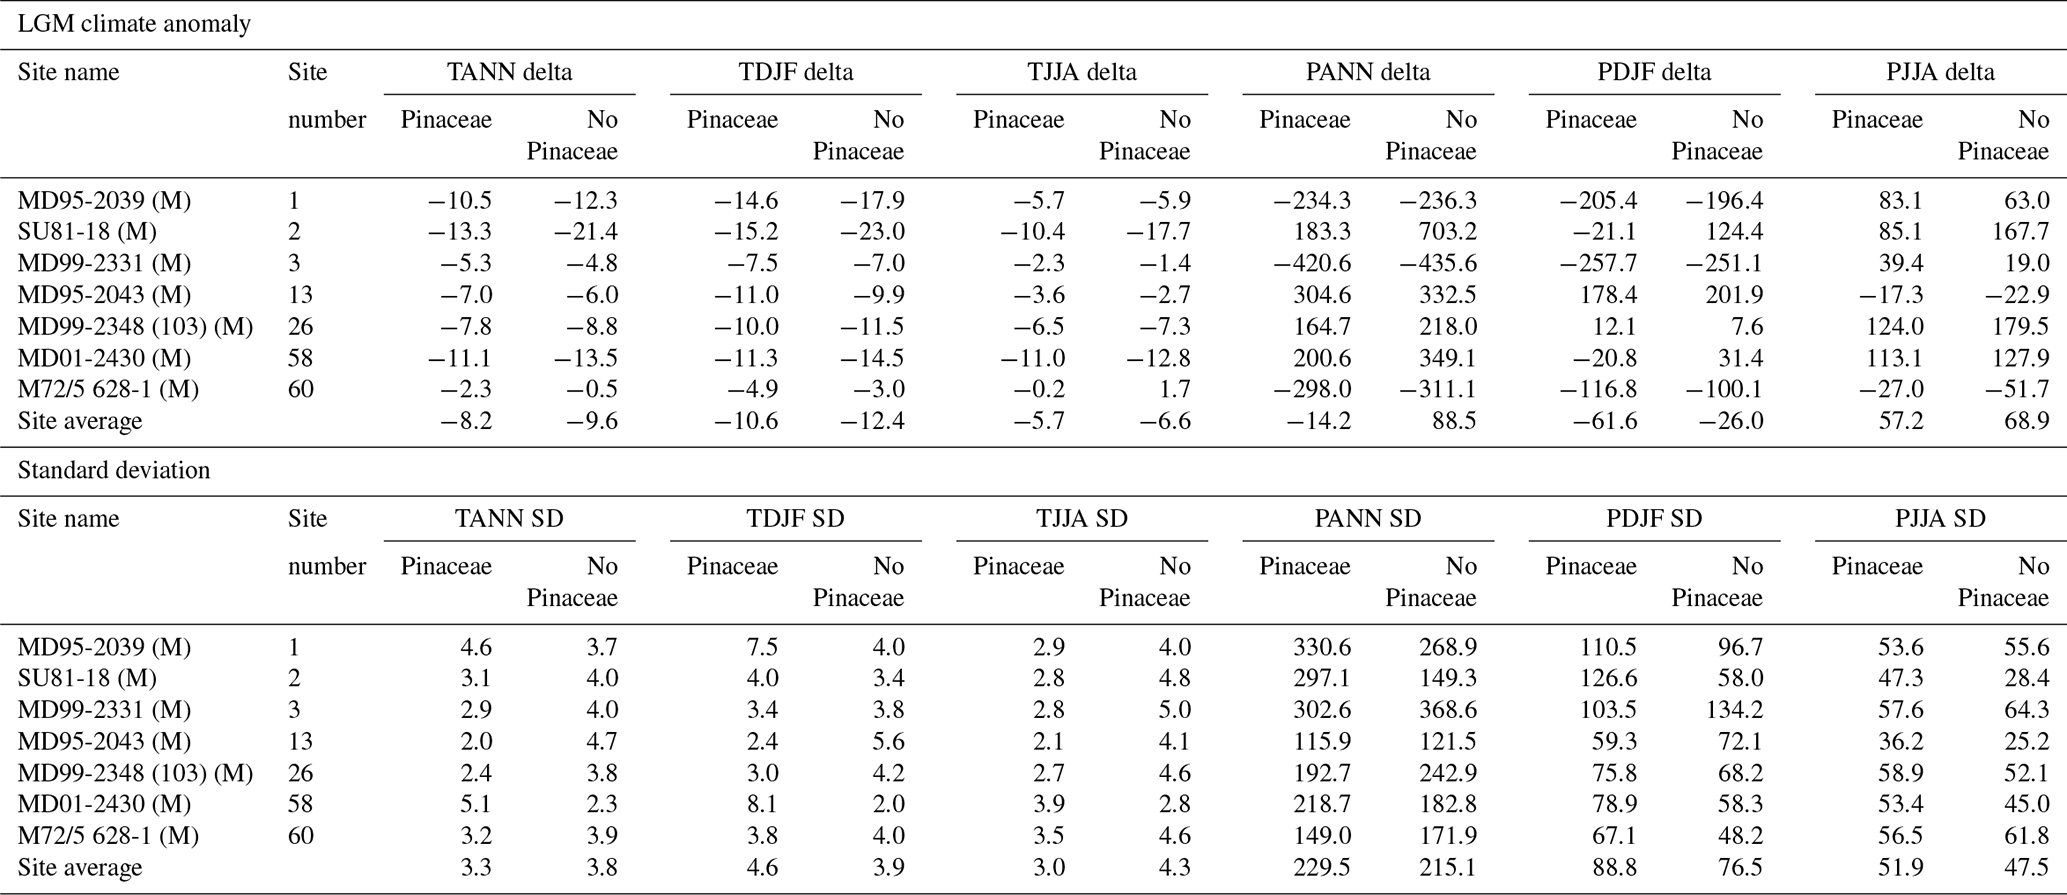
Table A4A comparison of MAT performance statistics based on the modern pollen sample training set using all surface samples from EMPD2 used in the LGM reconstruction (as shown in Table 3) and a subset of 1588 samples from EMPD2 that were classified as steppe. The results show little difference between the two different types of sample. The table includes mean annual temperature and precipitation (TANN and PANN), mean winter temperature and precipitation (TDJF and PDJF), and mean summer temperature and precipitation (TJJA and PJJA).
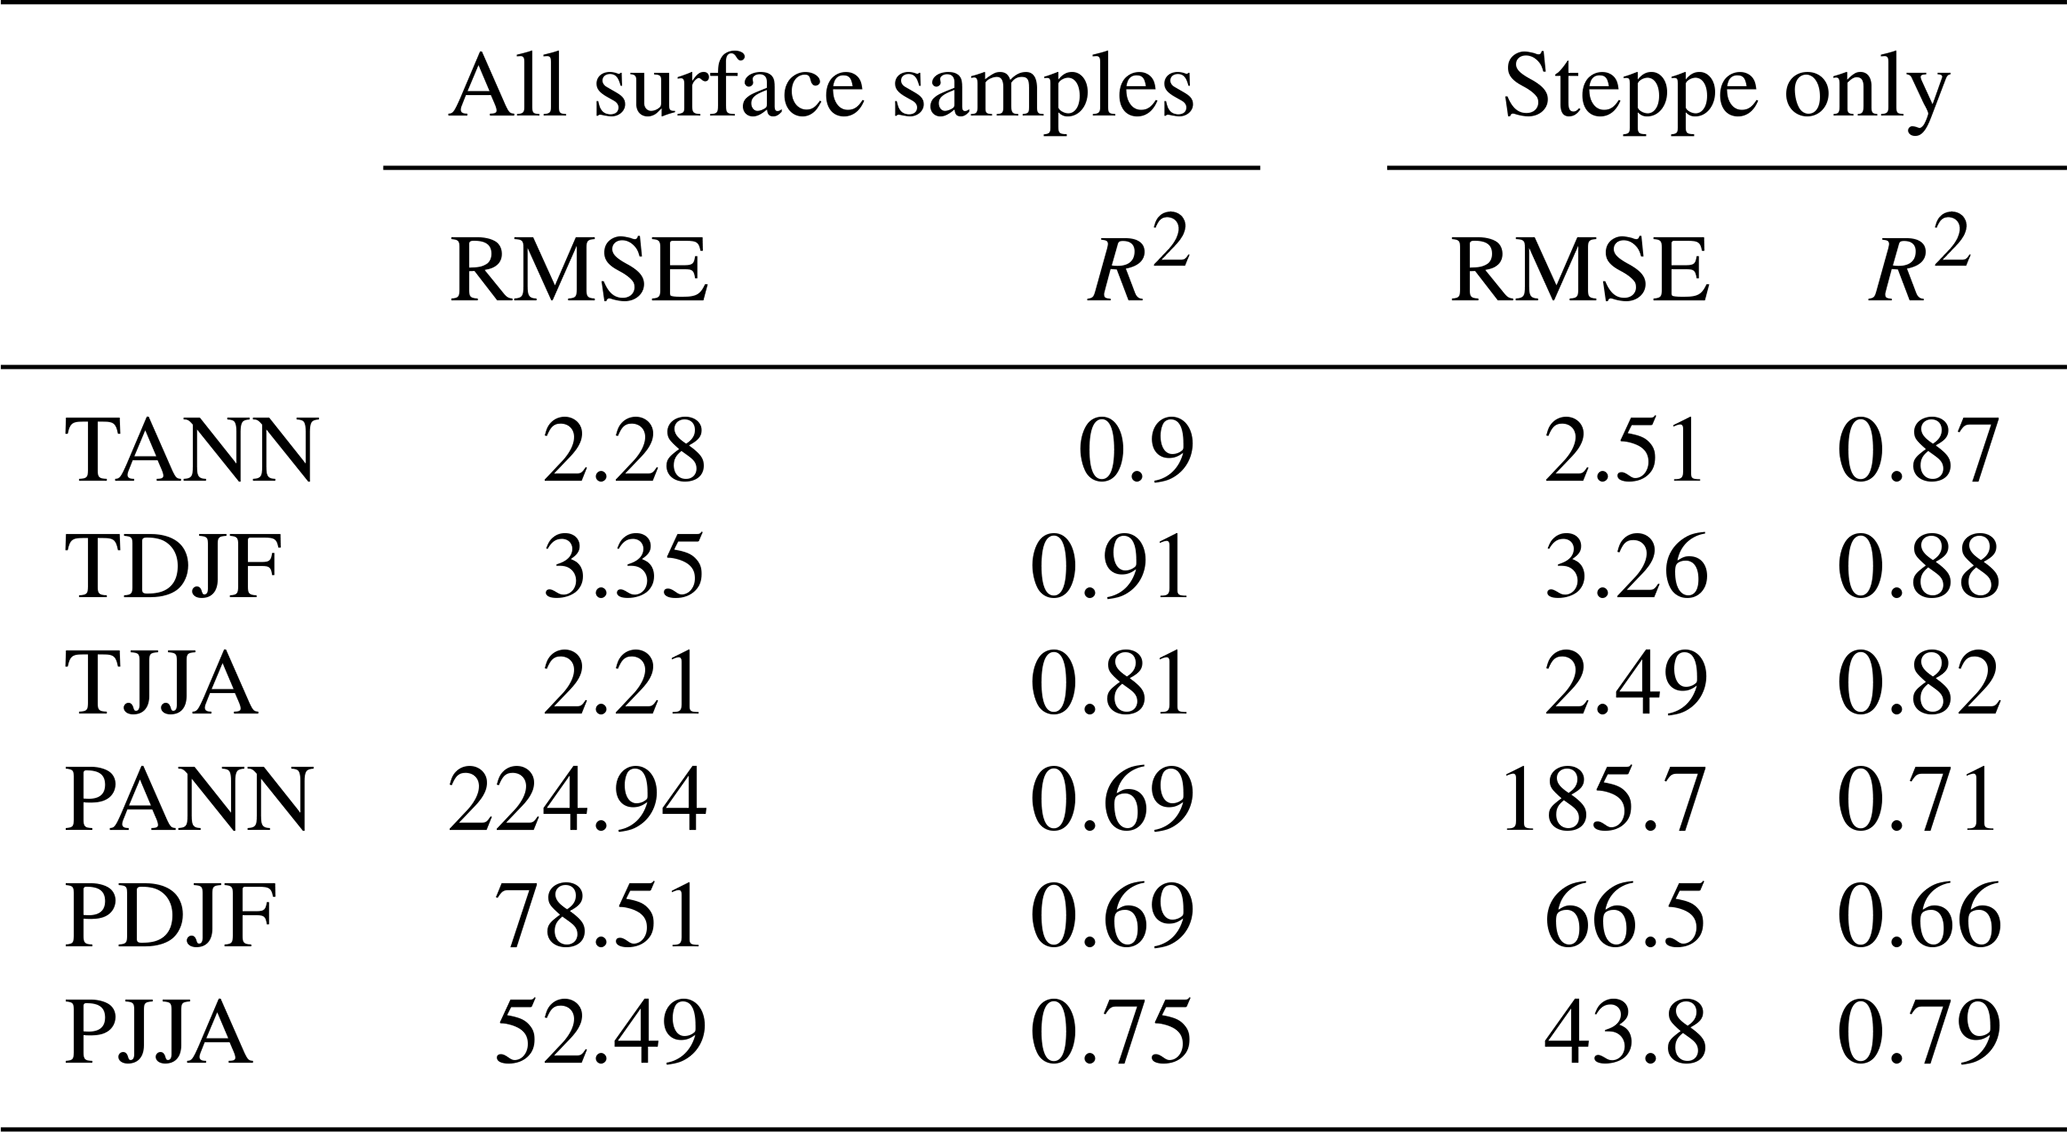
Table A5The biome and ecoregion of the modern surface samples used as analogues in the pollen–climate reconstructions.
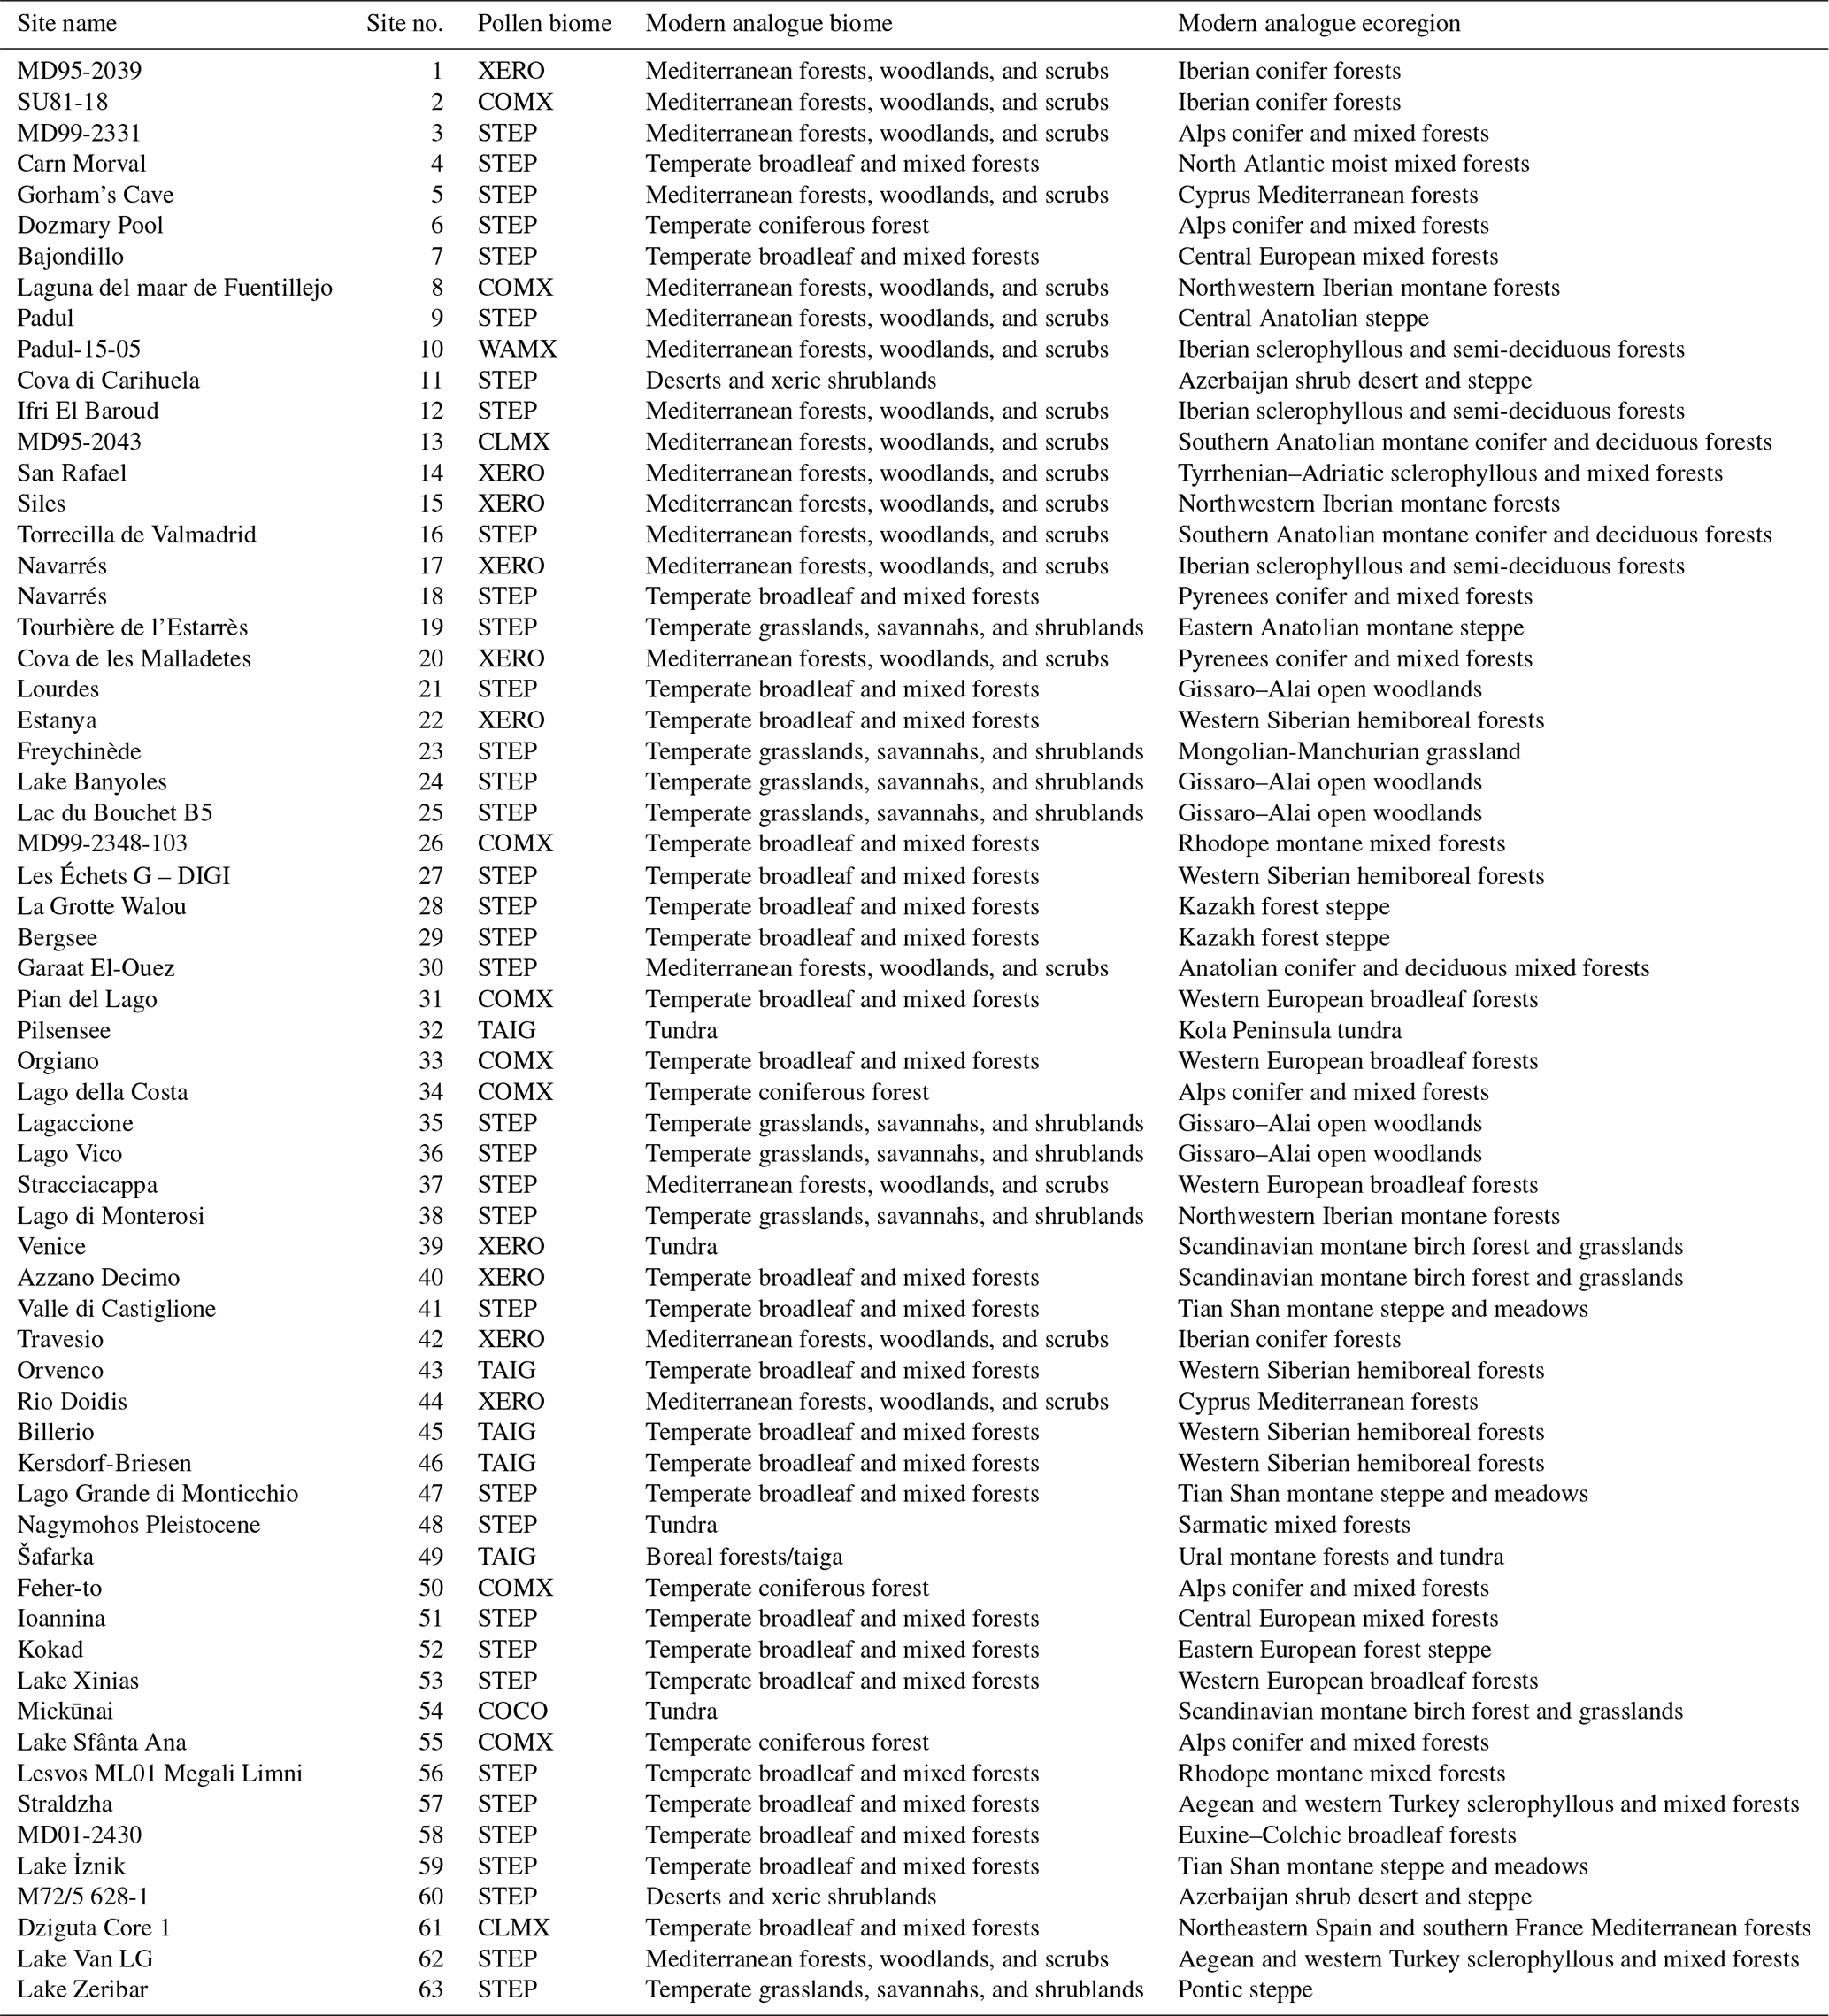
Notes: modern analogue biomes and ecoregions were calculated as the most commonly occurring amongst all six best modern analogue pollen samples in all LGM samples for each pollen site/record. These are taken from EMPD2 (Davis et al., 2020) using the classification of Olson et al. (2001).
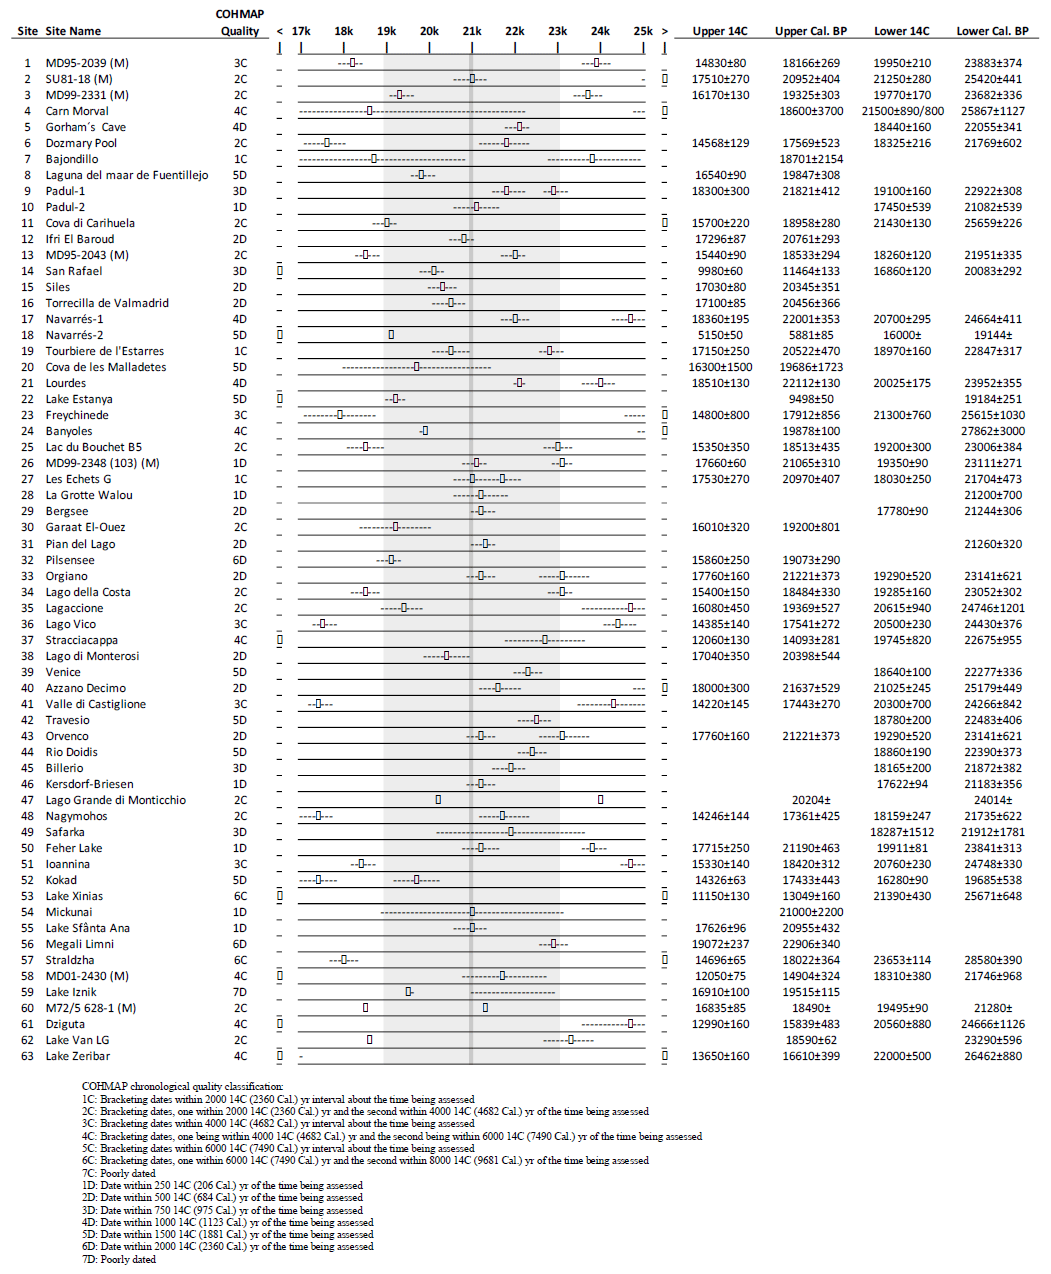
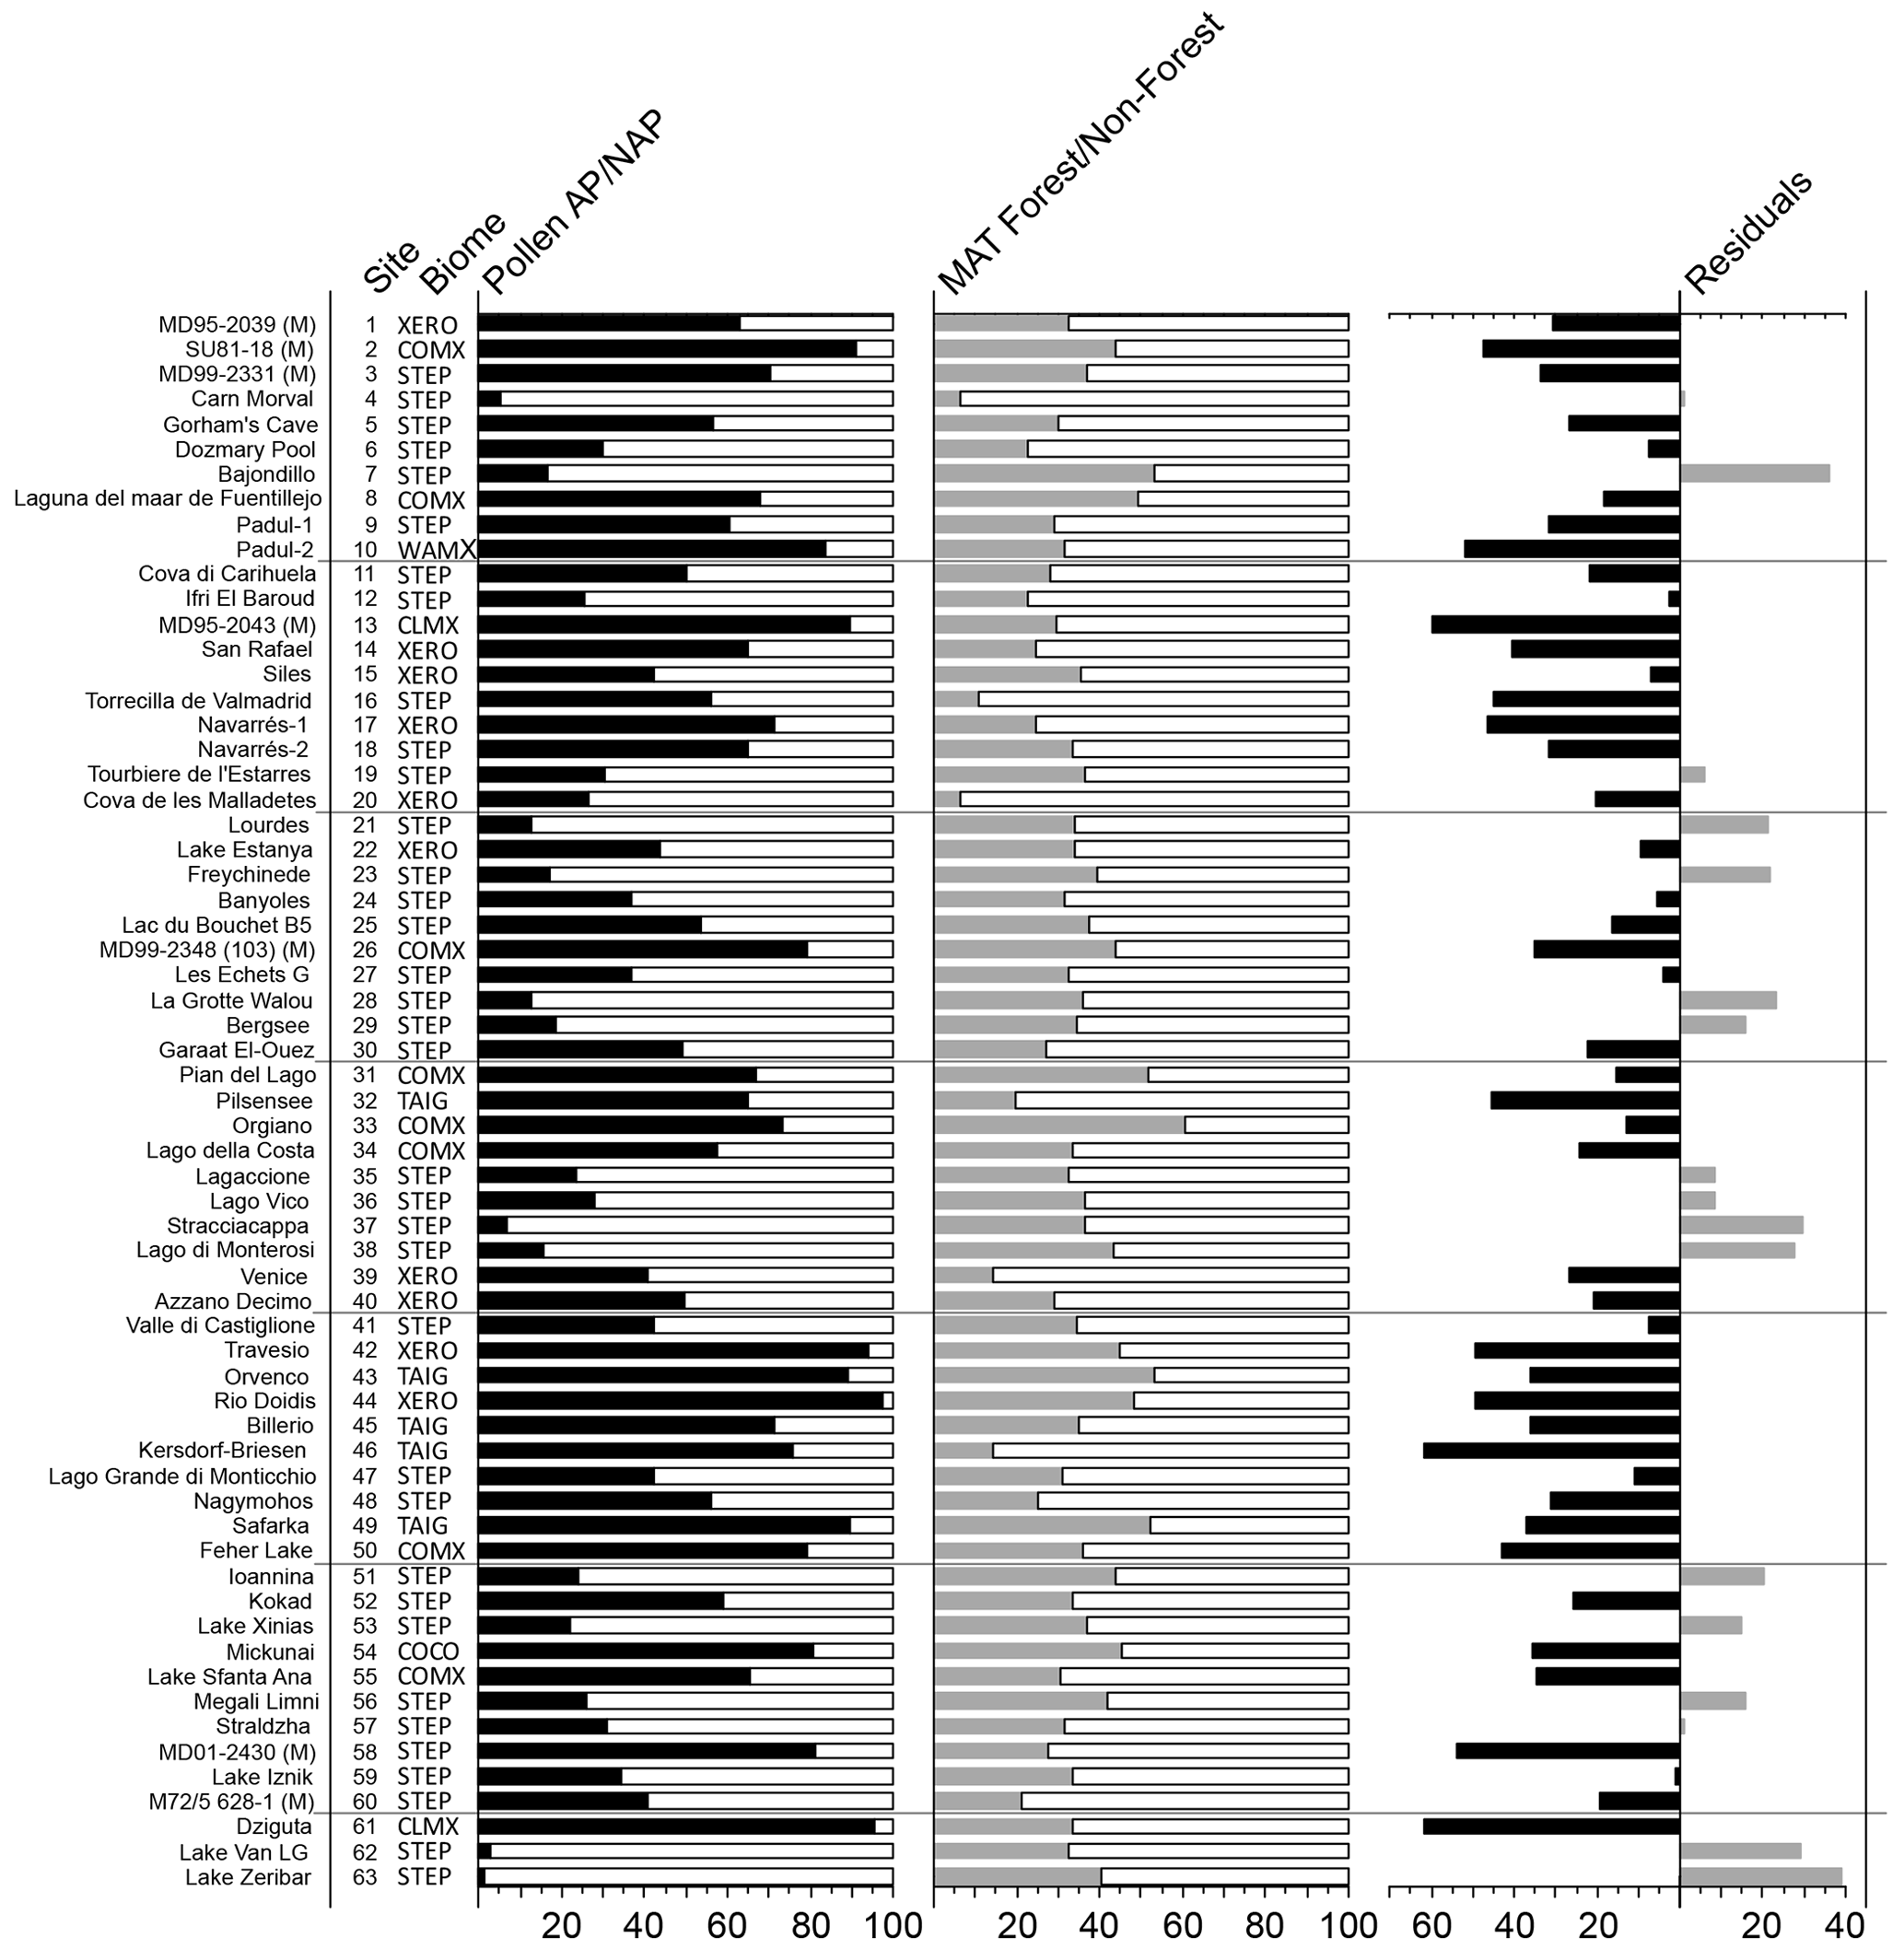
Figure A2Pollen biomes (see Fig. 2 for key), percentage of arboreal pollen (AP) forest cover, percentage of MAT forest cover, and residuals (percentage of AP compared to percentage of MAT forest).
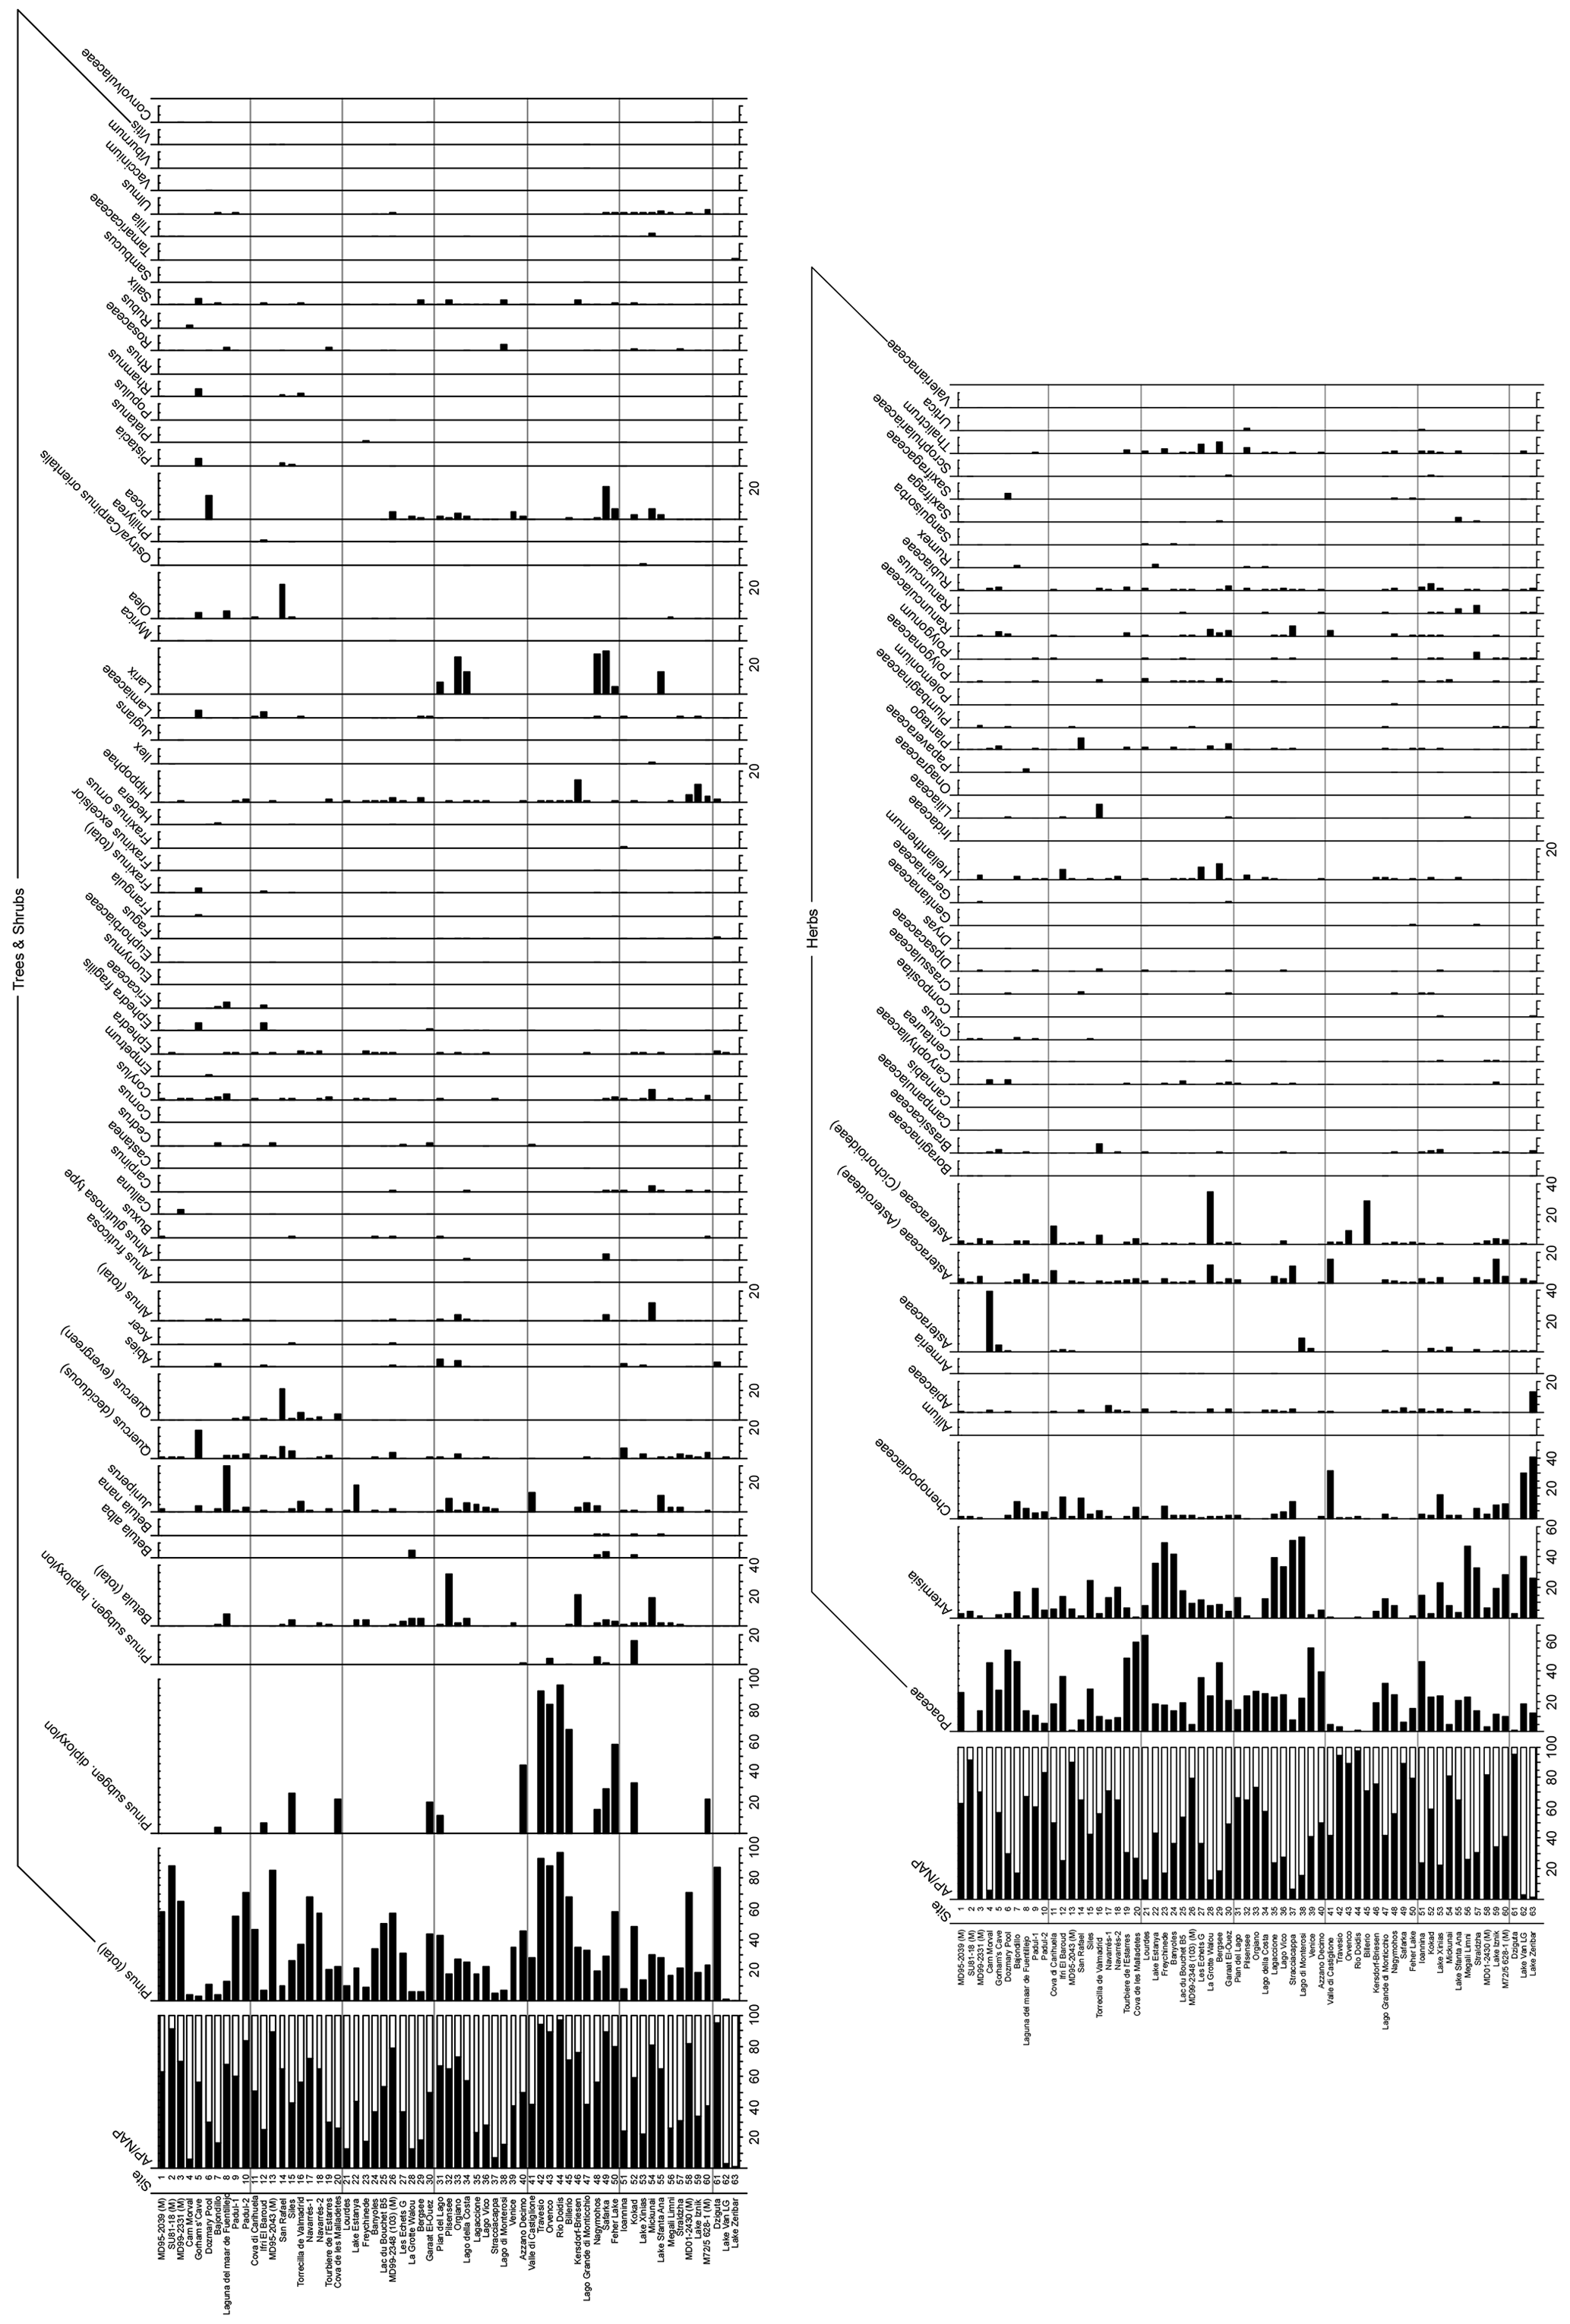
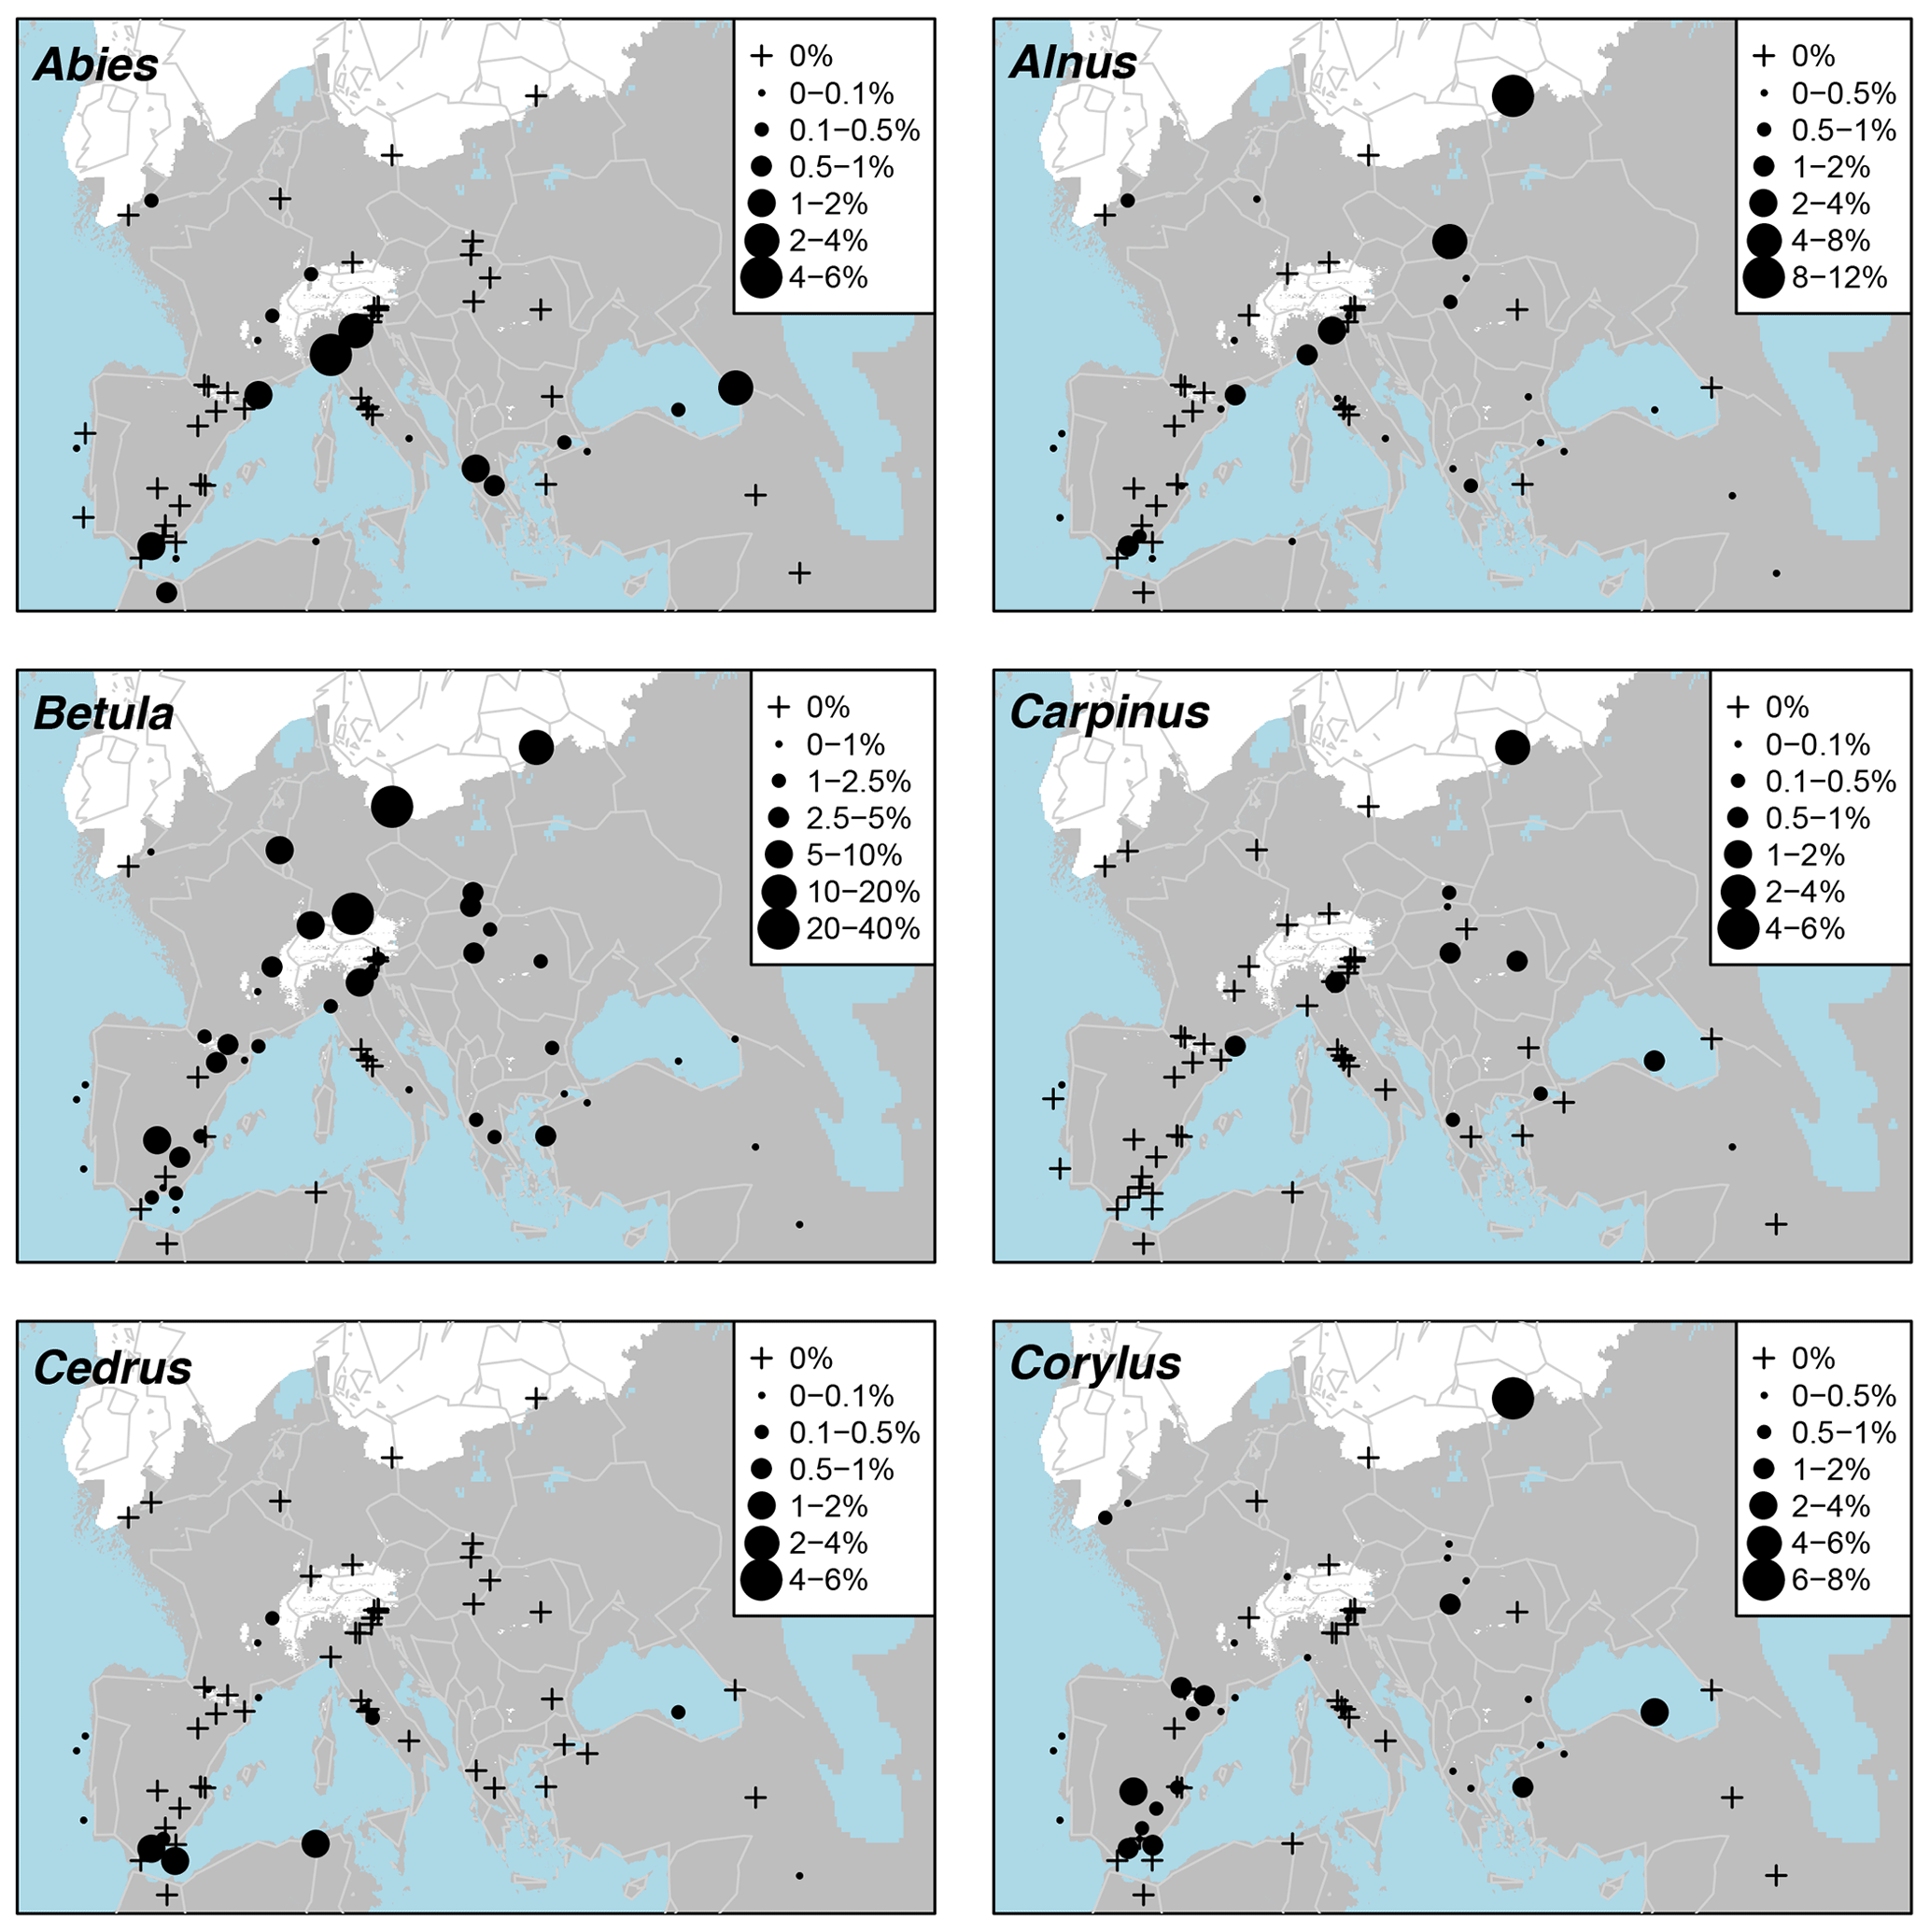
Figure A4Percentage maps of Abies, Alnus, Betula, Carpinus, Cedrus, and Corylus.
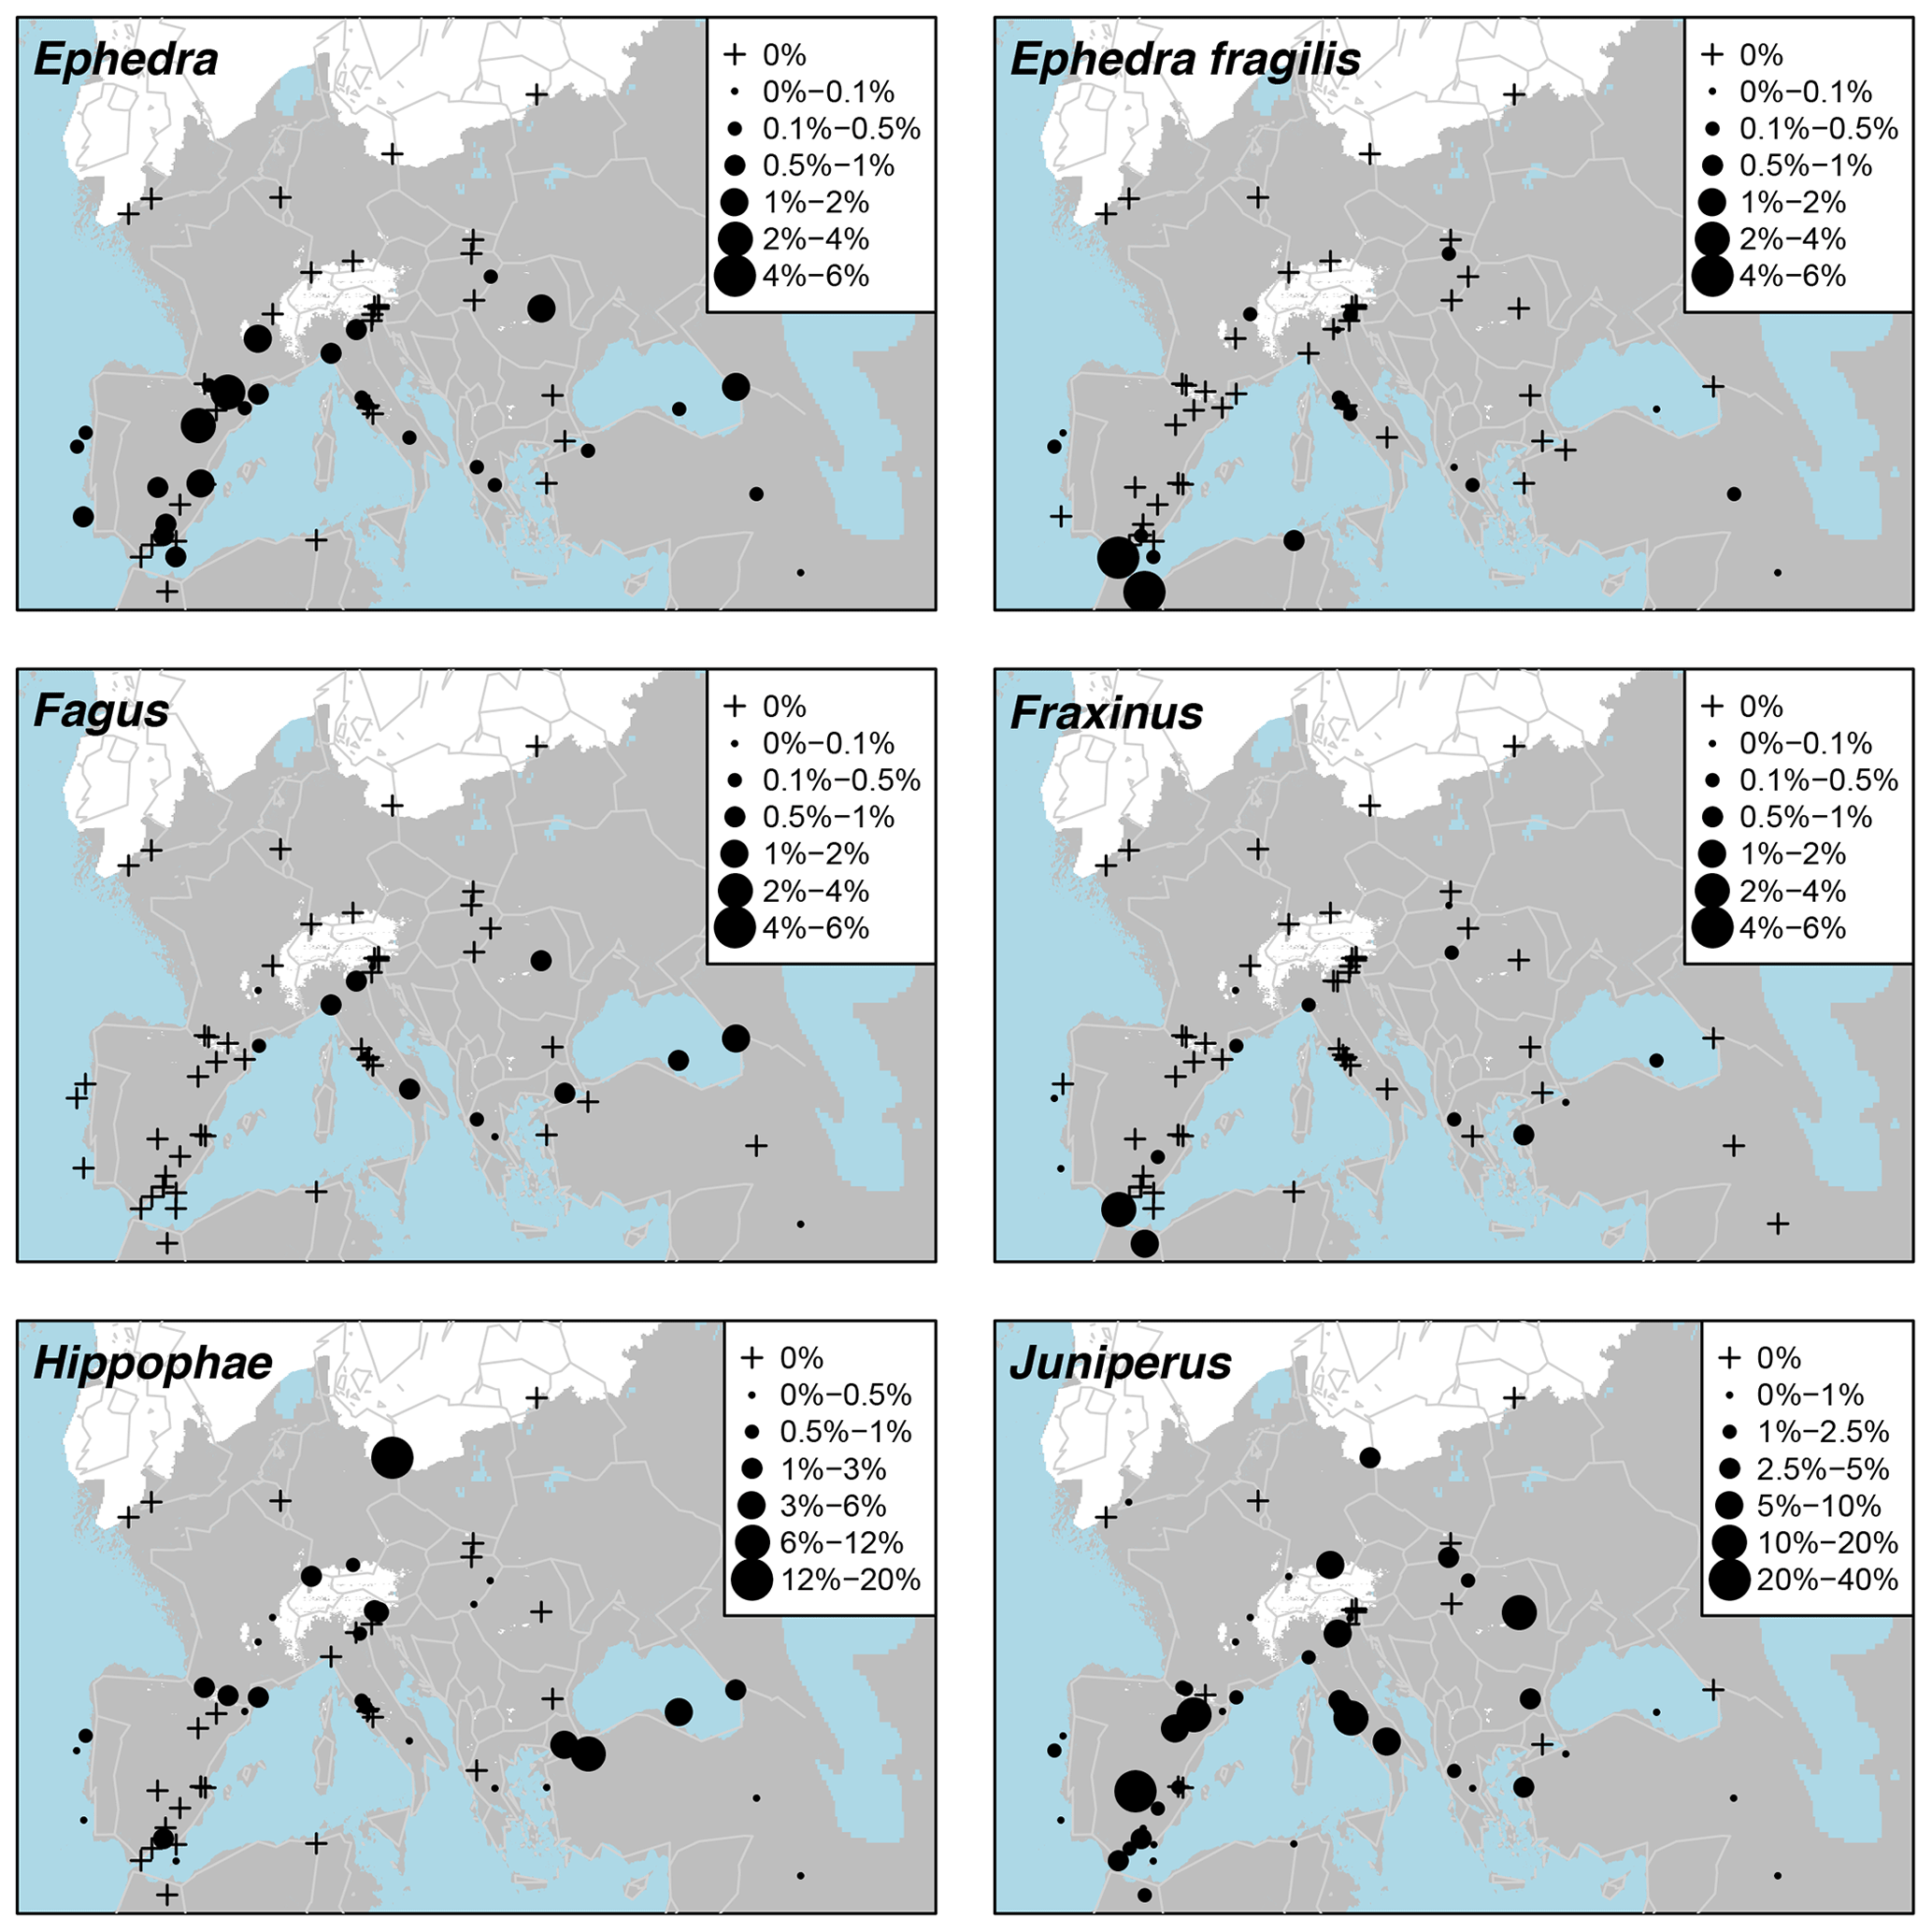
Figure A5Percentage maps of Ephedra, Ephedra fragilis, Fagus, Fraxinus, Hippophae, and Juniperus.
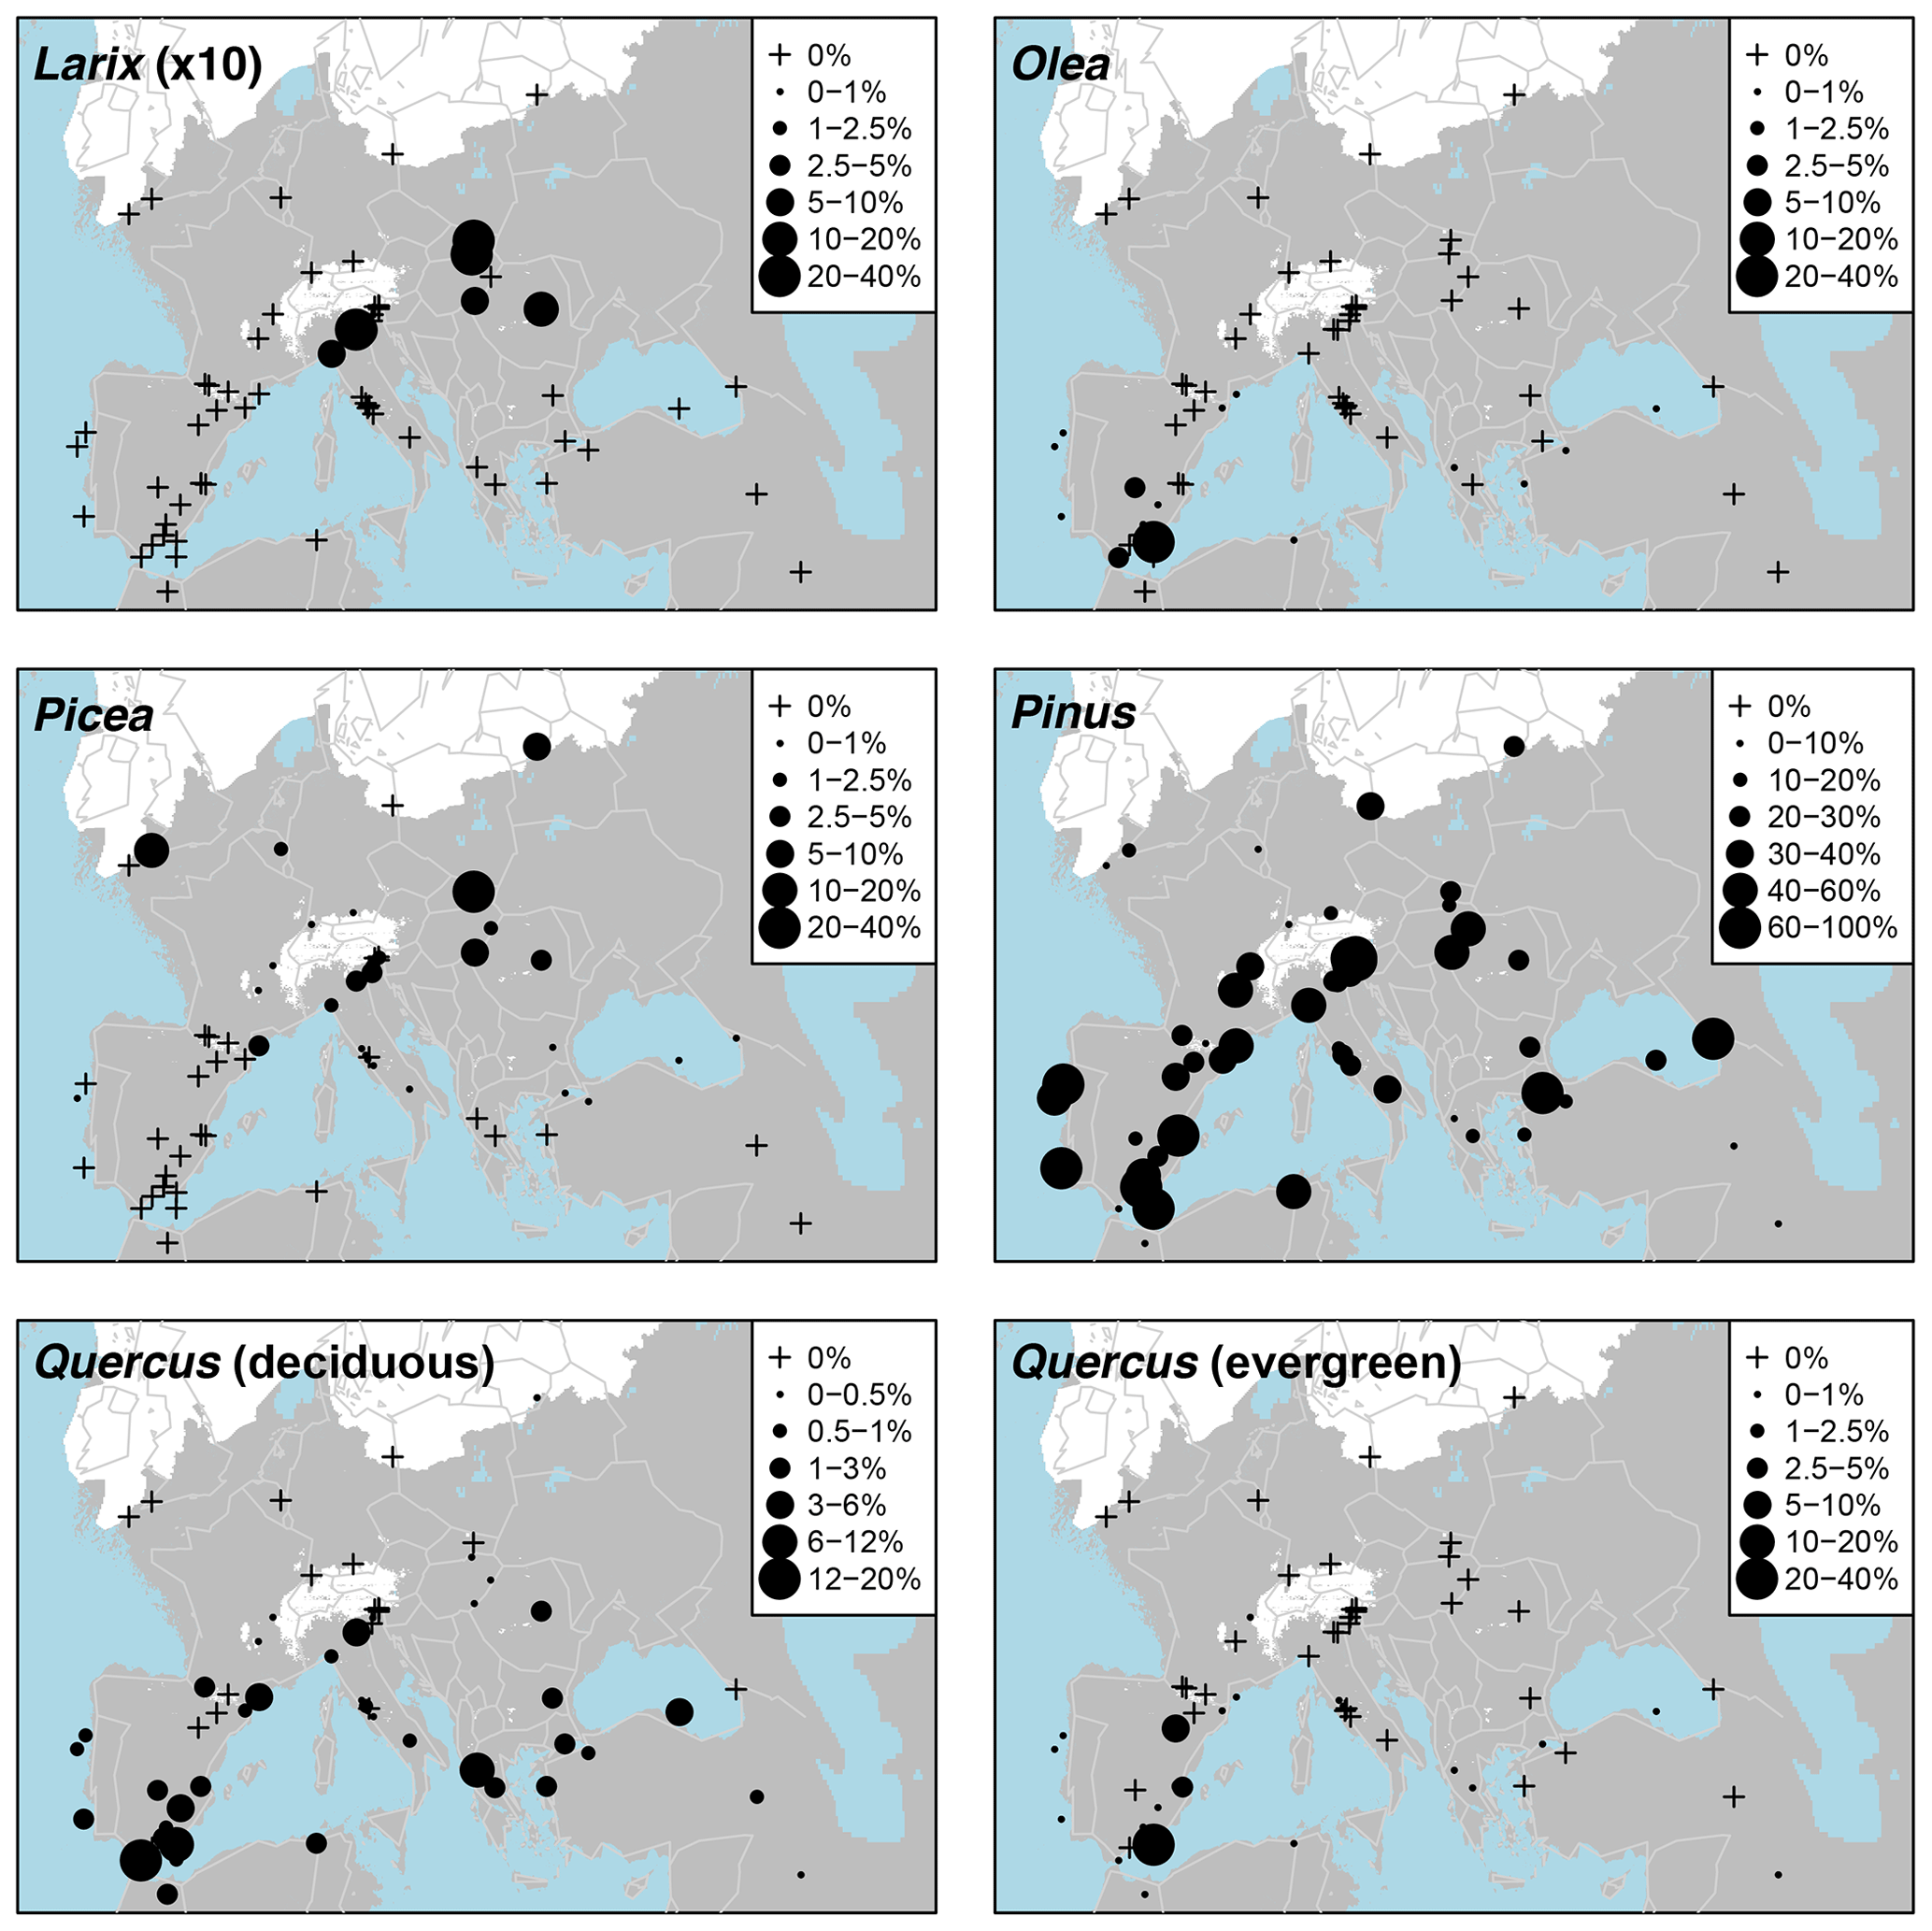
Figure A6Percentage maps of Larix (×10 exaggeration), Olea, Picea, Pinus, Quercus (deciduous), and Quercus (evergreen).
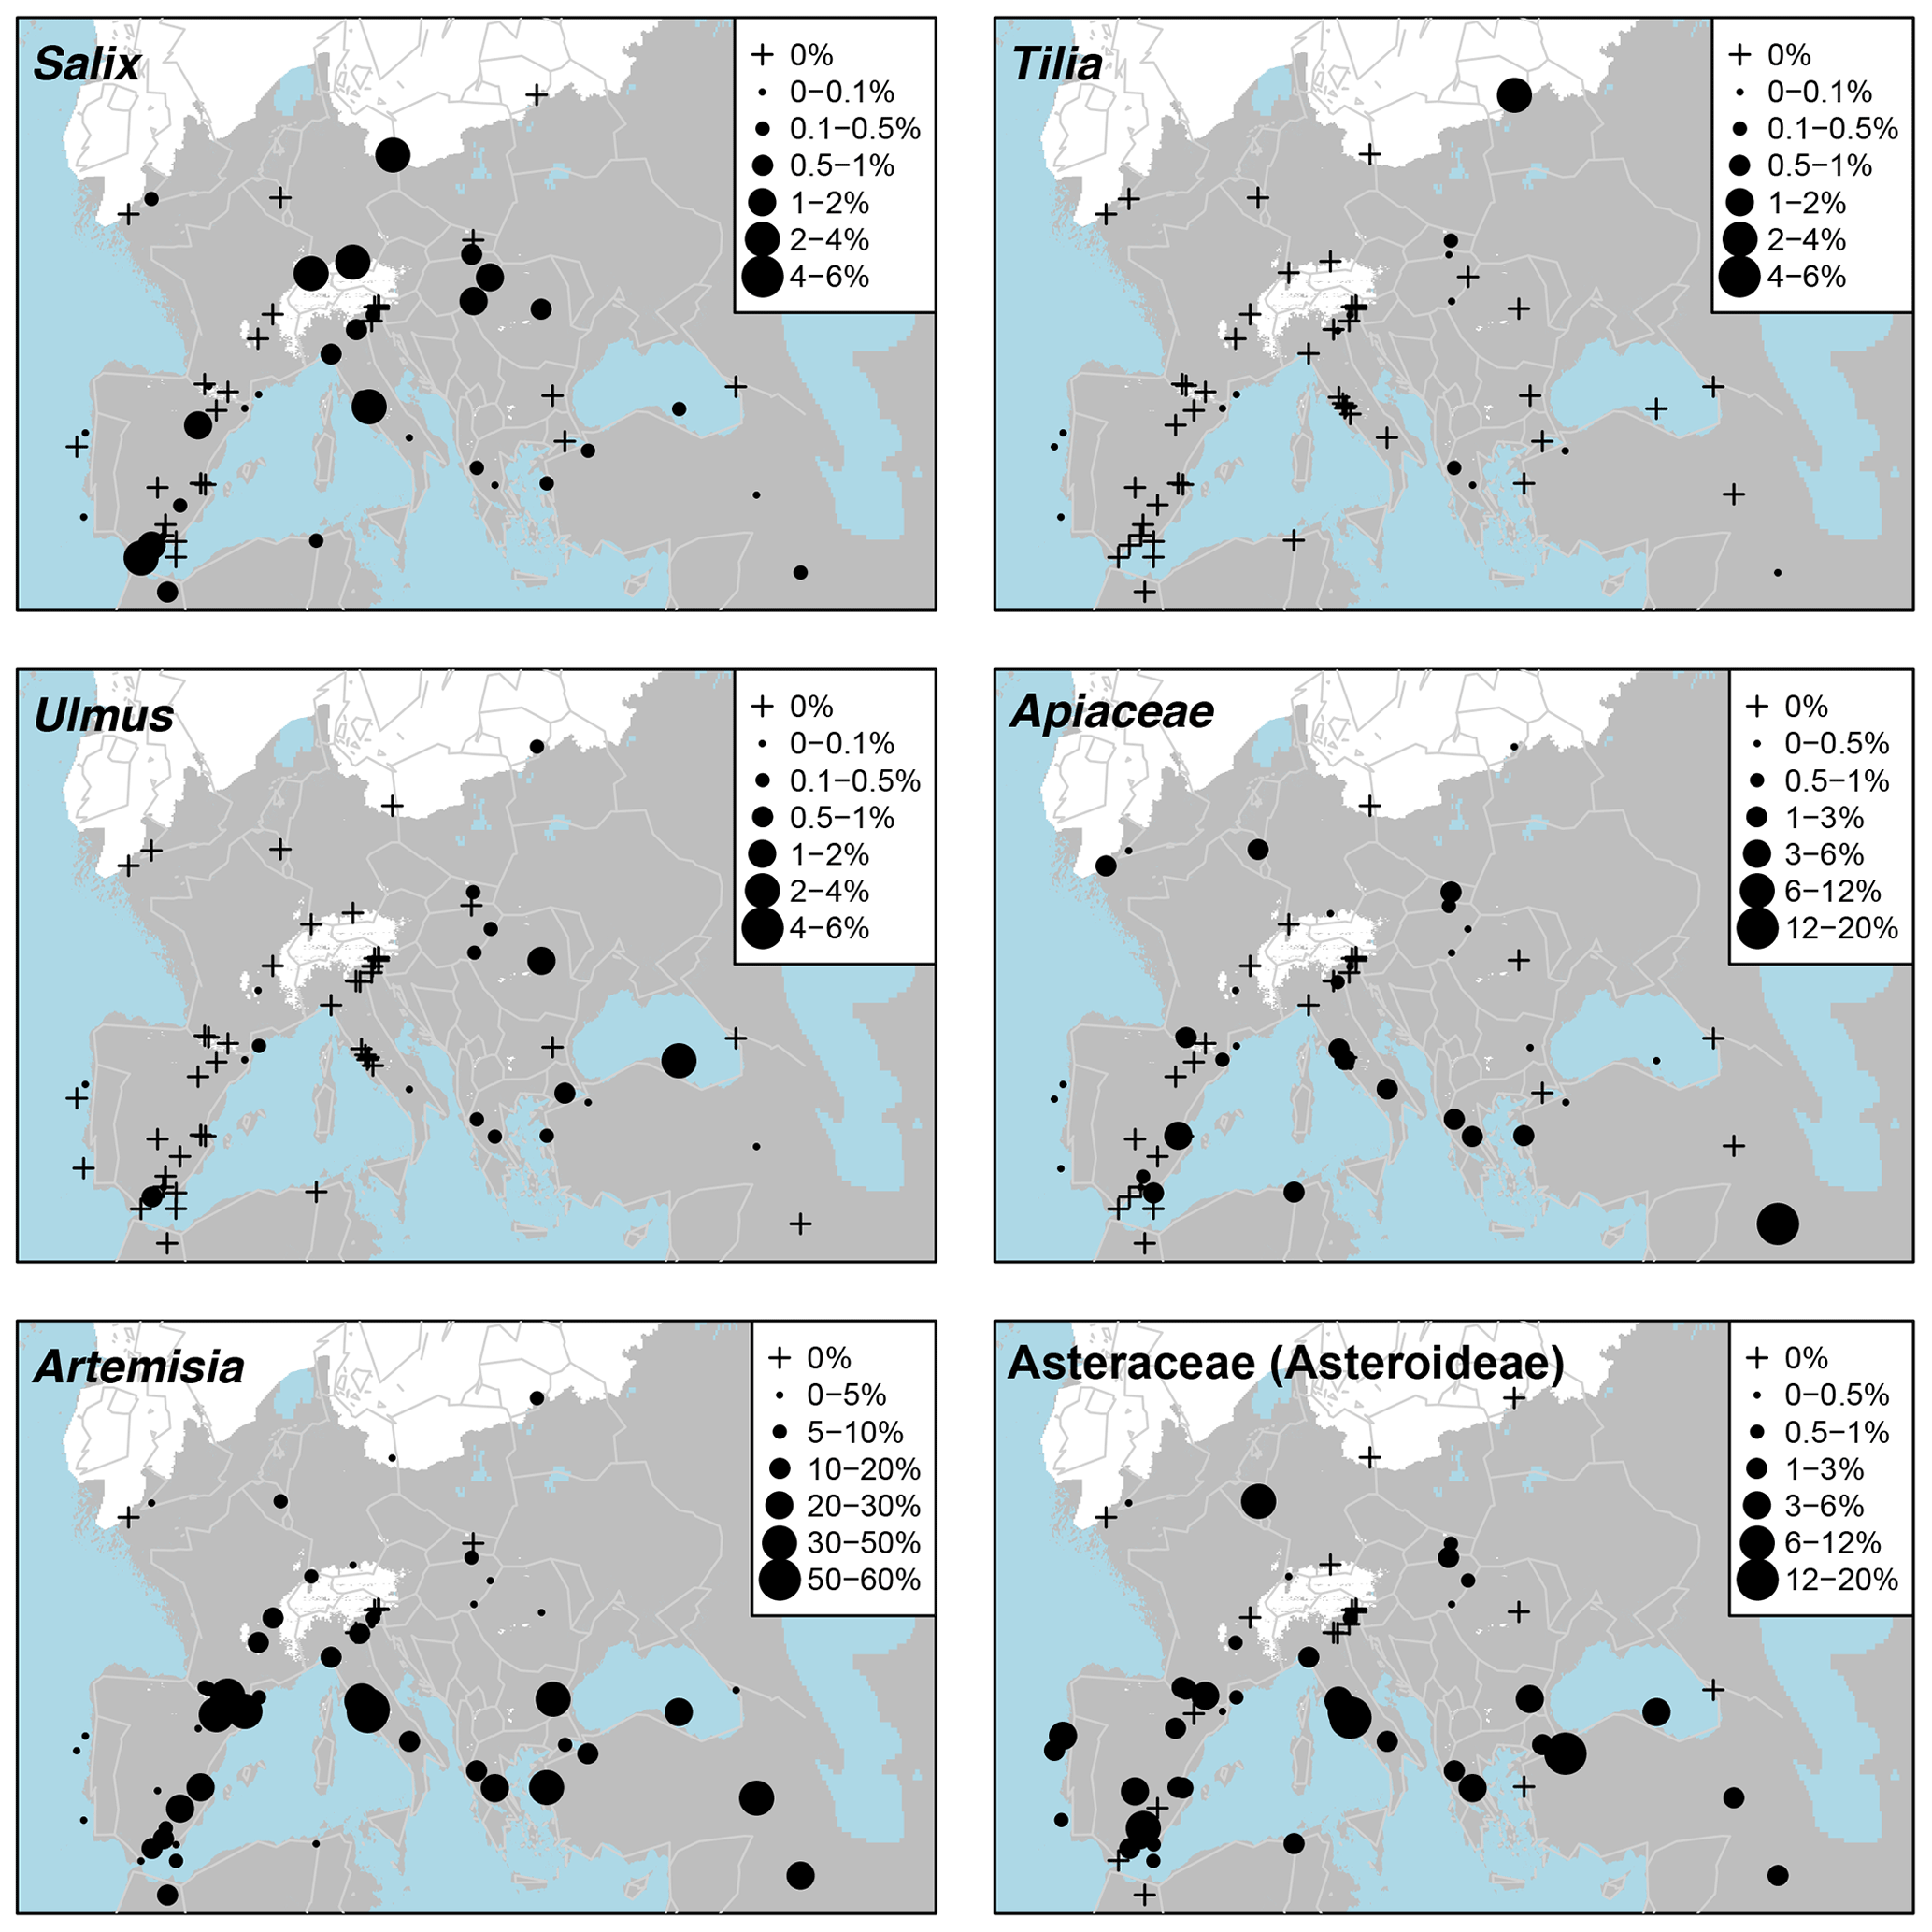
Figure A7Percentage maps of Salix, Tilia, Ulmus, Apiaceae, Artemisia, and Asteraceae (Asteroideae).
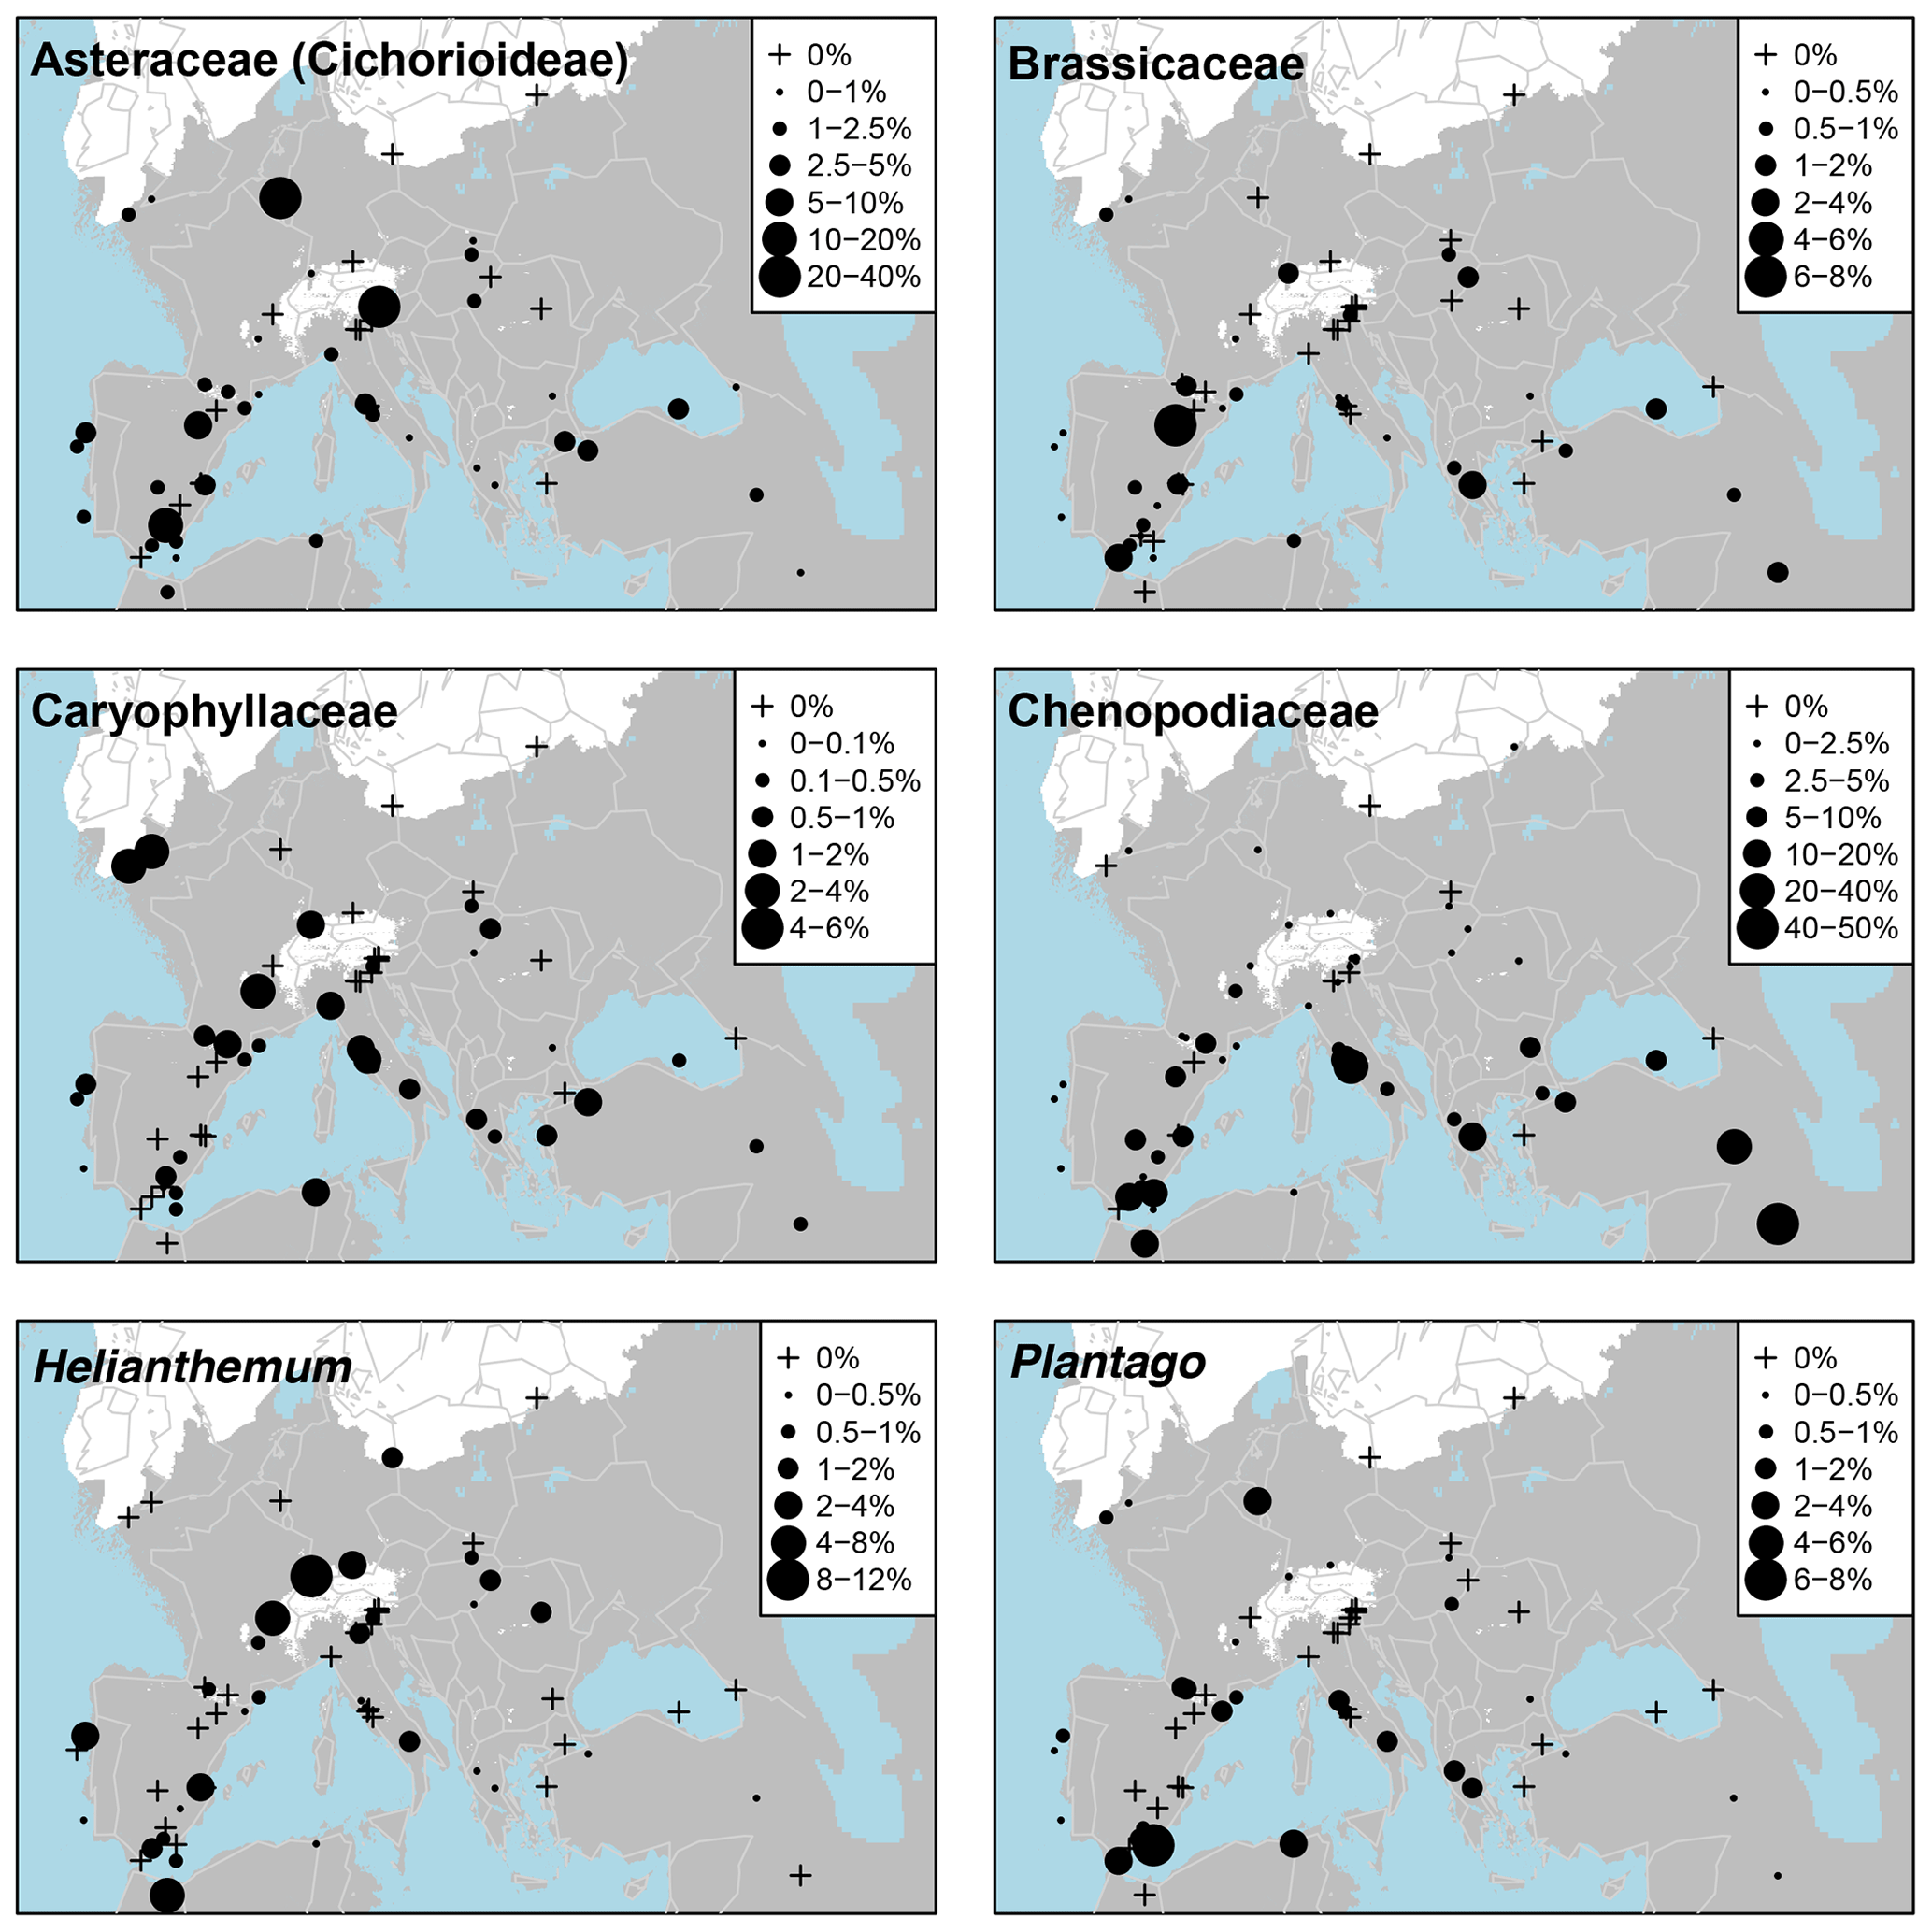
Figure A8Percentage maps of Asteraceae (Cichorioideae), Brassicaceae, Caryophyllaceae, Chenopodiaceae, Helianthemum, and Plantago.
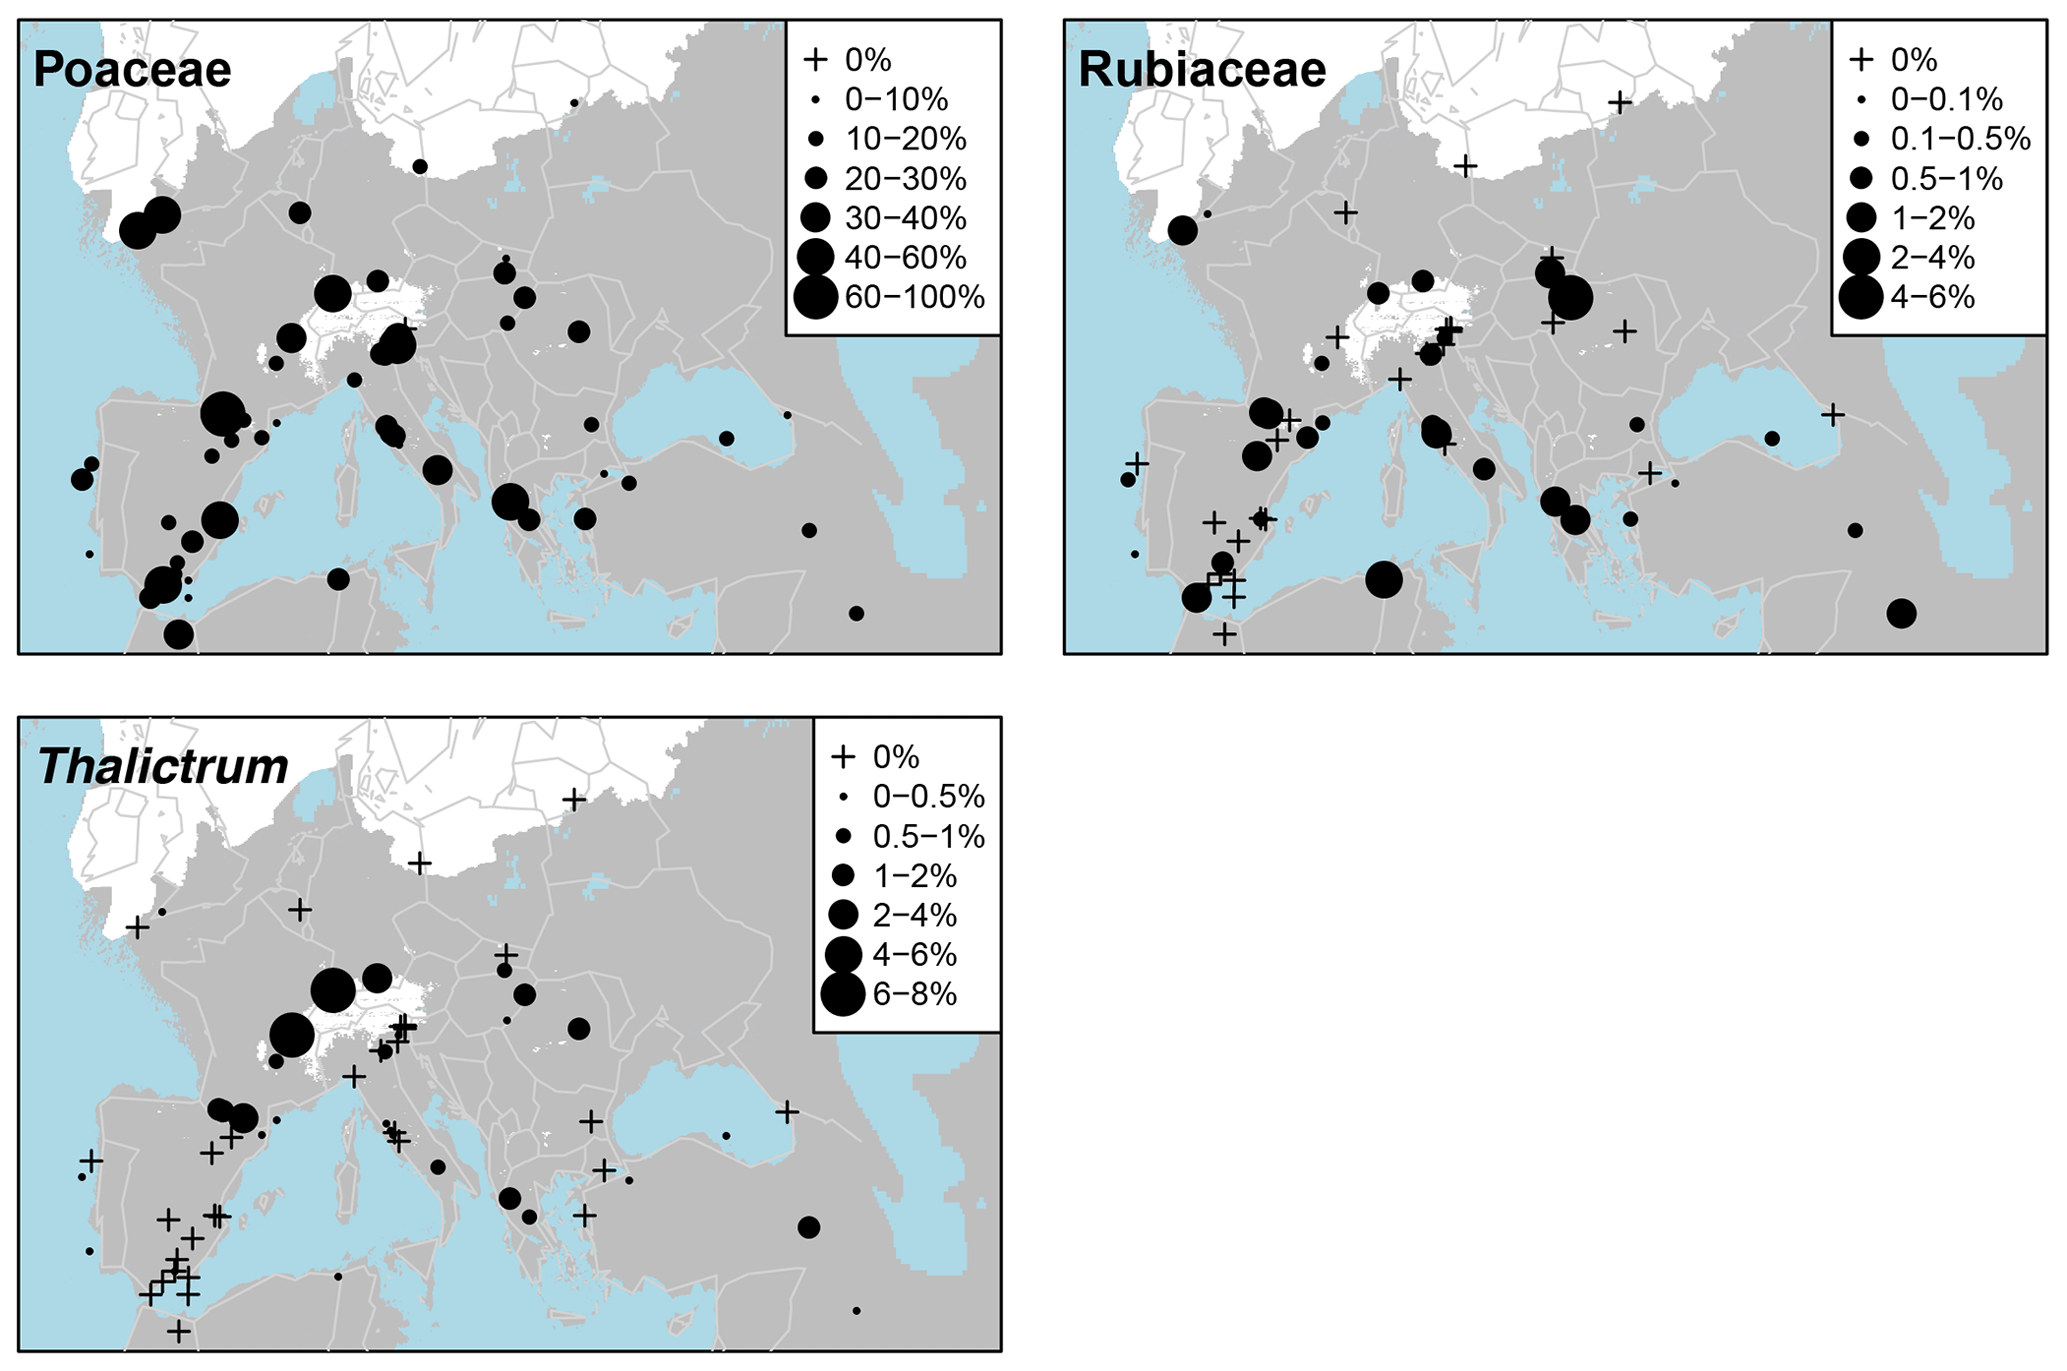
Figure A9Percentage maps of Poaceae, Rubiaceae, and Thalictrum.
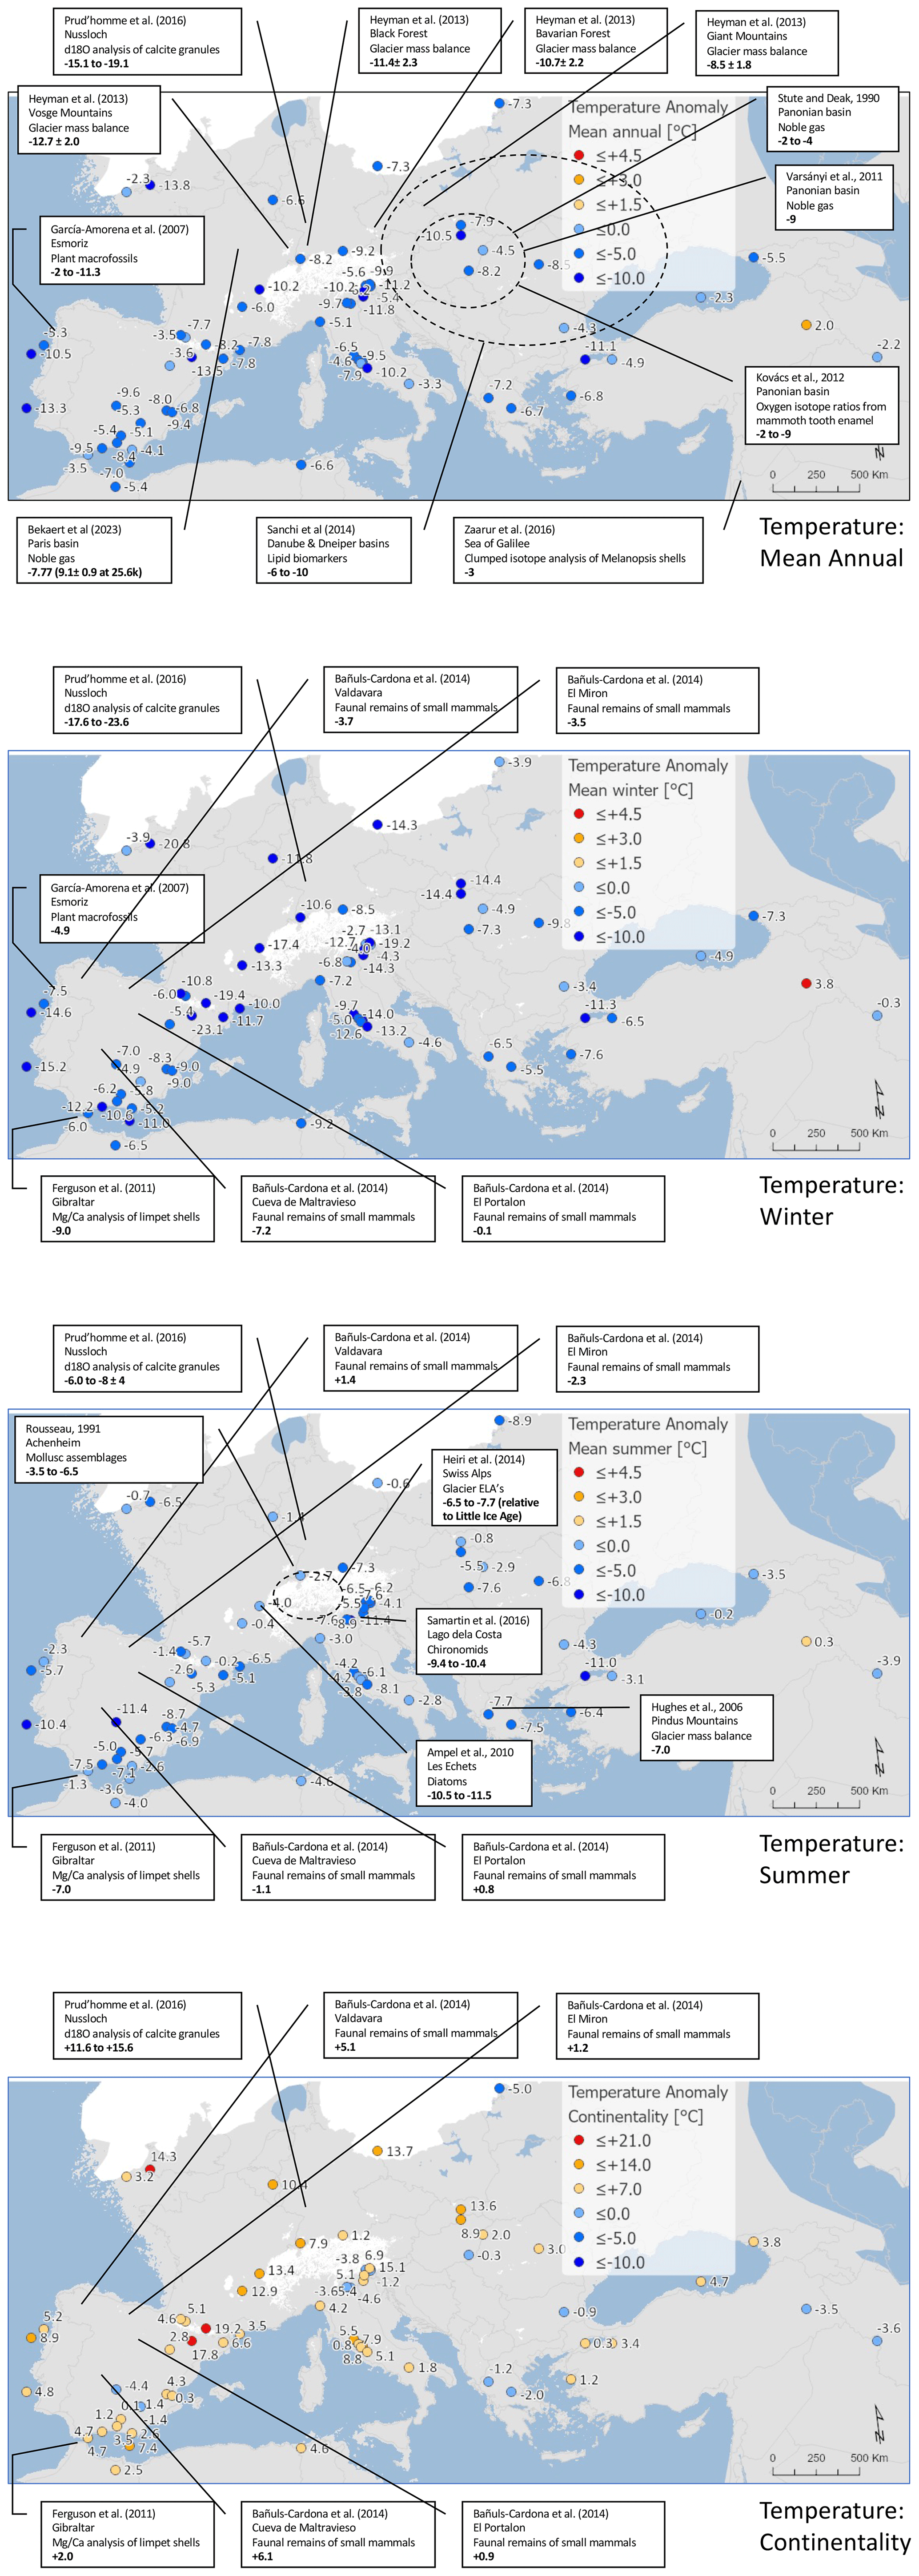
Figure A10Maps of pollen-based MAT reconstructions for LGM annual, winter, and summer temperature anomalies (as shown in Fig. 5), shown with the results of other published studies. Continentality represents the difference in temperature between summer and winter, with positive anomalies indicating an increase in the temperature difference between summer and winter. All values are expressed as anomalies compared with the present day unless otherwise indicated.
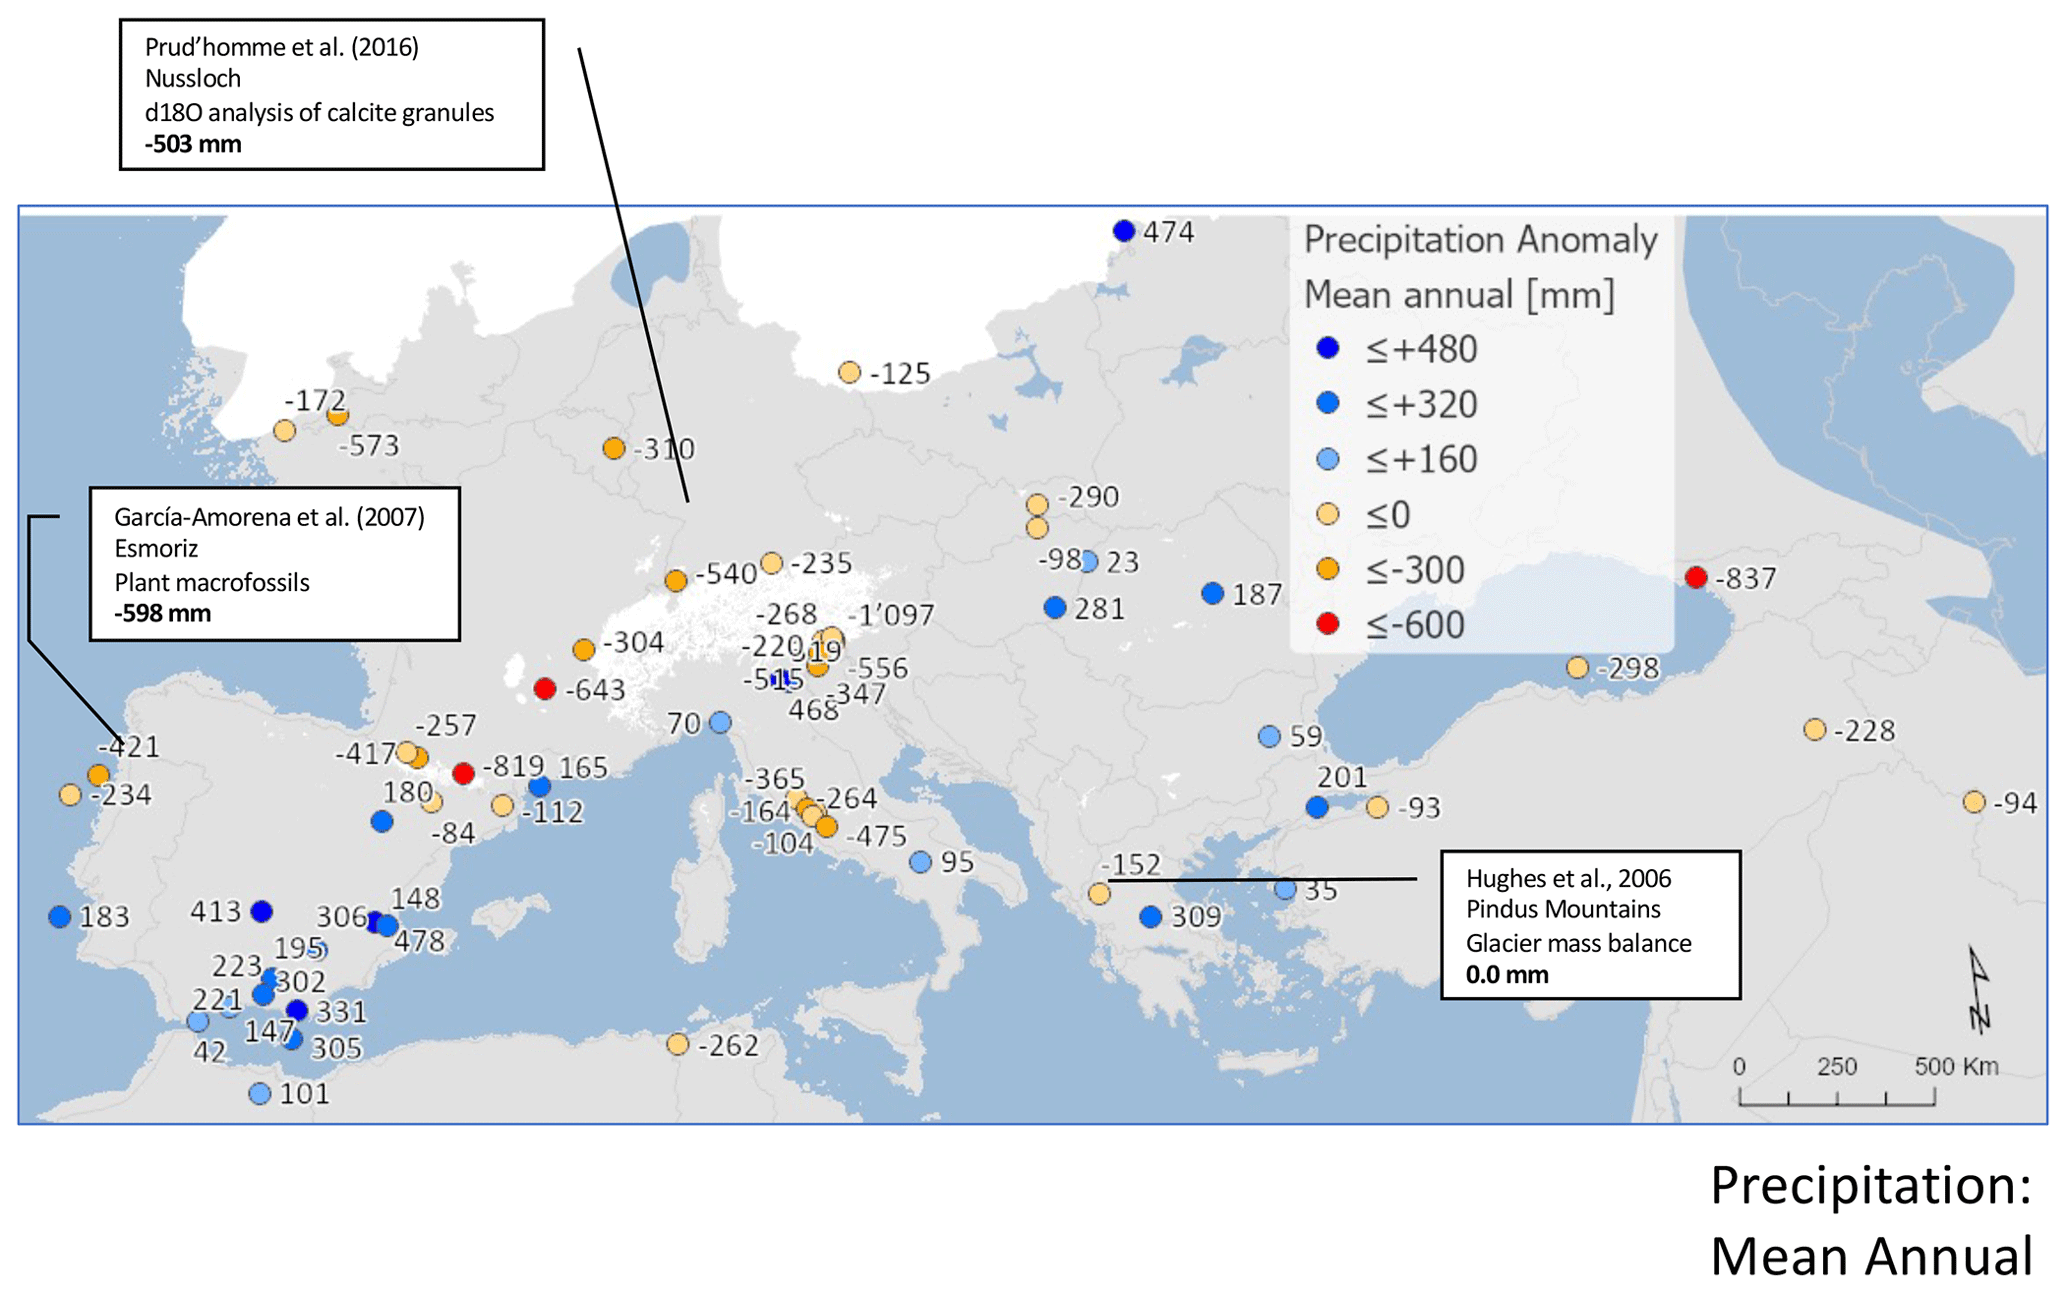
Figure A11Map of pollen-based MAT reconstructions for LGM annual precipitation anomalies (as shown in Fig. 7), shown with the results of other published studies. All values are expressed as anomalies compared with the present day.
Figure data and LGM pollen counts and percentages are available in the supplementary Excel file. Additional data can be obtained by contacting the authors directly.
The supplement related to this article is available online at: https://doi.org/10.5194/cp-20-1939-2024-supplement.
BASD designed the study, undertook the analysis, and wrote the paper. MF and ER designed and prepared the maps. JOK and AB reviewed the paper and provided additional input.
The contact author has declared that none of the authors has any competing interests.
Publisher's note: Copernicus Publications remains neutral with regard to jurisdictional claims made in the text, published maps, institutional affiliations, or any other geographical representation in this paper. While Copernicus Publications makes every effort to include appropriate place names, the final responsibility lies with the authors.
Data were obtained from the European Pollen Database (EPD), based within the Neotoma Paleoecology Database (http://www.neotomadb.org, last access: August 2021). The work of data contributors, data stewards, and the Neotoma and EPD community is gratefully acknowledged. We dedicate this paper to the memory of Eric Grimm, whose tireless work for the EPD and Neotoma helped make this study possible.
This work was supported by a grant from the Swiss National Science Foundation (grant no. 200021_169598) to Basil A. S. Davis and by a grant from the Fonds de Recherche du Québéc – Société et Culture (grant no. 2019-SE3-254686) to Ariane Burke.
This paper was edited by Odile Peyron and Nathalie Combourieu Nebout and reviewed by two anonymous referees.
ACER project members, Goñi, M. F. S., Desprat, S., Daniau, A. L., Bassinot, F. C., Polanco-Martínez, J. M., Harrison, S. P., Allen, J. R. M., Scott Anderson, R., Behling, H., Bonnefille, R., Burjachs, F., Carrión, J. S., Cheddadi, R., Clark, J. S., Combourieu-Nebout, N., Mustaphi, C. J. C., Debusk, G. H., Dupont, L. M., Finch, J. M., Fletcher, W. J., Giardini, M., González, C., Gosling, W. D., Grigg, L. D., Grimm, E. C., Hayashi, R., Helmens, K., Heusser, L. E., Hill, T., Hope, G., Huntley, B., Igarashi, Y., Irino, T., Jacobs, B., Jiménez-Moreno, G., Kawai, S., Peter Kershaw, A., Kumon, F., Lawson, I. T., Ledru, M. P., Lézine, A. M., Mei Liew, P., Magri, D., Marchant, R., Margari, V., Mayle, F. E., Merna Mckenzie, G., Moss, P., Müller, S., Müller, U. C., Naughton, F., Newnham, R. M., Oba, T., Pérez-Obiol, R., Pini, R., Ravazzi, C., Roucoux, K. H., Rucina, S. M., Scott, L., Takahara, H., Tzedakis, P. C., Urrego, D. H., Van Geel, B., Guido Valencia, B., Vandergoes, M. J., Vincens, A., Whitlock, C. L., Willard, D. A., and Yamamoto, M.: The ACER pollen and charcoal database: A global resource to document vegetation and fire response to abrupt climate changes during the last glacial period, Earth Syst. Sci. Data, 9, 679–695, https://doi.org/10.5194/essd-9-679-2017, 2017.
Allen, J. R. M., Hickler, T., Singarayer, J. S., Sykes, M. T., Valdes, P. J., and Huntley, B.: Last glacial vegetation of northern Eurasia, Quaternary Sci. Rev., 29, 2604–2618, https://doi.org/10.1016/j.quascirev.2010.05.031, 2010.
Allen, R., Siegert, M. J., and Payne, A. J.: Reconstructing glacier-based climates of LGM Europe and Russia – Part 2: A dataset of LGM precipitation/temperature relations derived from degree-day modelling of palaeo glaciers, Clim. Past, 4, 249–263, https://doi.org/10.5194/cp-4-249-2008, 2008a.
Allen, R., Siegert, M. J., and Payne, A. J.: Reconstructing glacier-based climates of LGM Europe and Russia – Part 3: Comparison with previous climate reconstructions, Clim. Past, 4, 265–280, https://doi.org/10.5194/cp-4-265-2008, 2008b.
Ampel, L., Bigler, C., Wohlfarth, B., Risberg, J., Lotter, A. F., and Veres, D.: Modest summer temperature variability during DO cycles in western Europe, Quaternary Sci. Rev., 29, 1322–1327, https://doi.org/10.1016/j.quascirev.2010.03.002, 2010.
Anderson, P. M., Barnosky, C. W., Bartlein, P. J., Behling, P. J., Brubaker, L., Cushing, E. J., Dodson, J., Dworetsky, B., Guetter, P. J., Harrison, S. P., Huntley, B., Kutzbach, J. E., Markgraf, V., Marvel, R., McGlone, M. S., Mix, A., Moar, N. T., Morley, J., Perrott, R. A., Peterson, G. M., Prell, W. L., Prentice, I. C., Ritchie, J. C., Roberts, N., Ruddiman, W. F., Salinger, M. J., Spaulding, W. G., Street-Perrott, F. A., Thompson, R. S., Wang, P. K., Webb, T., Winkler, M. G., and Wright, H. E.: Climatic changes of the last 18,000 years: Observations and model simulations, Science, 241, 1043–1052, https://doi.org/10.1126/science.241.4869.1043, 1988.
Arslanov, K. A., Dolukhanov, P. M., and Gei, N. A.: Climate, Black Sea levels and human settlements in Caucasus Littoral 50,000–9000 BP, Quatern. Int., 167–168, 121–127, https://doi.org/10.1016/j.quaint.2007.02.013, 2007.
Bañuls-Cardona, S., López-García, J. M., Blain, H. A., Lozano-Fernández, I., and Cuenca-Bescós, G.: The end of the Last Glacial Maximum in the Iberian Peninsula characterized by the small-mammal assemblages, J. Iber. Geol., 40, 19–27, https://doi.org/10.5209/rev_JIGE.2014.v40.n1.44085, 2014.
Bartlein, P. J., Harrison, S. P., Brewer, S., Connor, S., Davis, B. A. S., Gajewski, K., Guiot, J., Harrison-Prentice, T. I., Henderson, A., Peyron, O., Prentice, I. C., Scholze, M., Seppä, H., Shuman, B., Sugita, S., Thompson, R. S., Viau, A. E., Williams, J., and Wu, H.: Pollen-based continental climate reconstructions at 6 and 21 ka: A global synthesis, Clim. Dynam., 37, 775–802, https://doi.org/10.1007/s00382-010-0904-1, 2011.
Beaudouin, C., Jouet, G., Suc, J. P., Berné, S., and Escarguel, G.: Vegetation dynamics in southern France during the last 30 ky BP in the light of marine palynology, Quaternary Sci. Rev., 26, 1037–1054, https://doi.org/10.1016/j.quascirev.2006.12.009, 2007.
Beghin, P., Charbit, S., Kageyama, M., Combourieu-Nebout, N., Hatté, C., Dumas, C., and Peterschmitt, J. Y.: What drives LGM precipitation over the western Mediterranean? A study focused on the Iberian Peninsula and northern Morocco, Clim. Dynam., 46, 2611–2631, https://doi.org/10.1007/s00382-015-2720-0, 2016.
Bekaert, D. V., Blard, P.-H., Raoult, Y., Pik, R., Kipfer, R., Seltzer, A. M., Legrain, E., and Marty, B.: Last glacial maximum cooling of 9 °C in continental Europe from a 40 kyr-long noble gas paleothermometry record, Quaternary Sci. Rev., 310, 108123, https://doi.org/10.1016/j.quascirev.2023.108123, 2023.
Belis, C. A., Lami, A., Guilizzoni, P., Ariztegui, D., and Geiger, W.: The late Pleistocene ostracod record of the crater lake sediments from Lago di Albano (Central Italy): Changes in trophic status, water level and climate, J. Paleolimnol., 21, 151–169, https://doi.org/10.1023/A:1008095805748, 1999.
Benslama, M., Andrieu-Ponel, V., Guiter, F., Reille, M., de Beaulieu, J-L., Migliore, J., and Djamali, M.: Nouvelles contributions à l'histoire tardiglaciaire et holocène de la végétation en Algérie : analyses polliniques de deux profils sédimentaires du complexe humide d'El-Kala, C. R. Biol., 333, 744–754, https://doi.org/10.1016/j.crvi.2010.08.002, 2010.
Berto, C., López-García, J. M., and Luzi, E.: Changes in the Late Pleistocene small-mammal distribution in the Italian Peninsula, Quaternary Sci. Rev., 225, 106019, https://doi.org/10.1016/j.quascirev.2019.106019, 2019.
Bigelow, N. H., Brubaker, L. B., Edwards, M. E., Harrison, S. P., Prentice, I. C., Anderson, P. M., Andreev, A. A., Bartlein, P. J., Christiansen, T. R., Cramer, W., Kaplan, J. O., Lozhkin, A. V., Matveyeva, N. V., Murray, D. F., McGuire, A. D., Razzhivin, V. Y., Ritchie, J. C., Smith, B., Walker, D. A., Gajewski, K., Wolf, V., Holmqvist, B. H., Igarashi, Y., Kremenetskii, K., Paus, A., Pisaric, M. F. J., and Volkova, V. S.: Climate change and arctic ecosystems: 1. Vegetation changes north of 55° N between the last glacial maximum, mid-Holocene, and present, J. Geophys. Res., 108, 8170, https://doi.org/10.1029/2002JD002558, 2013.
Binney, H., Edwards, M., Macias-Fauria, M., Lozhkin, A., Anderson, P., Kaplan, J. O., Andreev, A., Bezrukova, E., Blyakharchuk, T., Jankovska, V., Khazina, I., Krivonogov, S., Kremenetski, K., Nield, J., Novenko, E., Ryabogina, N., Solovieva, N., Willis, K., and Zernitskaya, V.: Vegetation of Eurasia from the last glacial maximum to present: Key biogeographic patterns, Quaternary Sci. Rev., 157, 80–97, https://doi.org/10.1016/j.quascirev.2016.11.022, 2017.
Birks, H. J. B. and Willis, K. J.: Alpines, trees, and refugia in Europe, Plant Ecol. Divers., 1, 147–160, https://doi.org/10.1080/17550870802349146, 2008.
Bonatti, E. Pollen sequence in the lake sediments. In: Hutchinson, G. E. (ed.), Lanula: an Account of the History and Development of the Lago di Monterosi, Latium, Italy, T. Am. Philos. Soc., 60, 26–31, https://doi.org/10.2307/1005996, 1970.
Bottema, S.: Pollen analytical investigations in Thessaly (Greece), Palaeohistoria, 21, 19–40, 1979.
Braconnot, P., Harrison, S. P., Kageyama, M., Bartlein, P. J., Masson-Delmotte, V., Abe-Ouchi, A., Otto-Bliesner, B., and Zhao, Y.: Evaluation of climate models using palaeoclimatic data, Nat. Clim. Change, 2, 417–424, https://doi.org/10.1038/nclimate1456, 2012.
Brewer, S., Guiot, J., Sánchez-Goñi, M. F., and Klotz, S.: The climate in Europe during the Eemian: a multi-method approach using pollen data, Quaternary Sci. Rev., 27, 2303–2315, https://doi.org/10.1016/j.quascirev.2008.08.029, 2008.
Brewer, S., Giesecke, T., Davis, B. A. S., Finsinger, W., Wolters, S., Binney, H., de Beaulieu, J. L., Fyfe, R., Gil-Romera, G., Kühl, N., Kuneš, P., Leydet, M., and Bradshaw, R. H.: Mapping Lateglacial and Holocene European pollen data: The maps, J. Maps, 13, 921–928, https://doi.org/10.1080/17445647.2016.1197613, 2017.
Camuera, J., Jiménez-Moreno, G., Ramos-Román, M. J., García-Alix, A., Toney, J. L., Anderson, R. S., Jiménez-Espejo, F., Bright, J., Webster, C., Yanes, Y., and Carrión, J. S.: Vegetation and climate changes during the last two glacial-interglacial cycles in the western Mediterranean: A new long pollen record from Padul (southern Iberian Peninsula), Quaternary Sci. Rev., 205, 86–105, https://doi.org/10.1016/j.quascirev.2018.12.013, 2019.
Cao, X., Tian, F., Dallmeyer, A., and Herzschuh, U.: Northern Hemisphere biome changes (>30° N) since 40 cal ka BP and their driving factors inferred from model-data comparisons, Quaternary Sci. Rev., 220, 291–309, https://doi.org/10.1016/j.quascirev.2019.07.034, 2019.
Carrión, J. S.: Late quaternary pollen sequence from Carihuela Cave, southern Spain, Rev. Palaeobot. Palynol., 71, 37–77, https://doi.org/10.1016/0034-6667(92)90157-C, 1992.
Carrión, J. S.: Patterns and processes of Late Quaternary environmental change in a montane region of southwestern Europe, Quaternary Sci. Rev., 21, 2047–2066, https://doi.org/10.1016/S0277-3791(02)00010-0, 2002.
Carrión, J. S. and Dupré-Olivier, M.: Late Quaternary vegetational history of Navarrés, eastern Spain. A two core approach, New Phytol., 134, 177–191, https://doi.org/10.1111/j.1469-8137.1996.tb01157.x, 1996.
Carrión, J. S., Finlayson, C., Fernández, S., Finlayson, G., Allué, E., López-Sáez, J. A., López-García, P., Gil-Romera, G., Bailey, G., and González-Sampériz, P.: A coastal reservoir of biodiversity for Upper Pleistocene human populations: palaeoecological investigations in Gorham's Cave (Gibraltar) in the context of the Iberian Peninsula, Quaternary Sci. Rev., 27, 2118–2135, https://doi.org/10.1016/j.quascirev.2008.08.016, 2008.
Cheddadi, R., Yu, G., Guiot, J., Harrison, S. P., and Colin Prentice, I.: The climate of Europe 6000 years ago, Clim. Dynam., 13, 1–9, 1996.
Chevalier, M., Davis, B. A. S., Heiri, O., Seppä, H., Chase, B. M., Gajewski, K., Lacourse, T., Telford, R. J., Finsinger, W., Guiot, J., Kühl, N., Maezumi, S. Y., Tipton, J. R., Carter, V. A., Brussel, T., Phelps, L. N., Dawson, A., Zanon, M., Vallé, F., Nolan, C., Mauri, A., de Vernal, A., Izumi, K., Holmström, L., Marsicek, J., Goring, S., Sommer, P. S., Chaput, M., and Kupriyanov, D.: Pollen-based climate reconstruction techniques for late Quaternary studies, Earth-Sci. Rev., 210, 103384, https://doi.org/10.1016/j.earscirev.2020.103384, 2020.
Cleator, S. F., Harrison, S. P., Nichols, N. K., Colin Prentice, I., and Roulstone, I.: A new multivariable benchmark for Last Glacial Maximum climate simulations, Clim. Past, 16, 699–712, https://doi.org/10.5194/cp-16-699-2020, 2020.
COHMAP: Climatic changes of the last 18,000 years: observations and model simulations, Science, 241, 1043–1052, 1988.
Collins, P. M., Davis, B. A. S., and Kaplan, J. O.: The mid-Holocene vegetation of the Mediterranean region and southern Europe, and comparison with the present day, J. Biogeogr., 39, 1848–1861, https://doi.org/10.1111/j.1365-2699.2012.02738.x, 2012.
Combourieu Nebout, N., Peyron, O., Dormoy, I., Desprat, S., Beaudouin, C., Kotthoff, U., and Marret, F.: Rapid climatic variability in the west Mediterranean during the last 25 000 years from high resolution pollen data, Clim. Past, 5, 503–521, https://doi.org/10.5194/cp-5-503-2009, 2009.
Connor, S. E., Ross, S. A., Sobotkova, A., Herries, A. I. R., Mooney, S. D., Longford, C., and Iliev, I.: Environmental conditions in the SE Balkans since the Last Glacial Maximum and their influence on the spread of agriculture into Europe, Quaternary Sci. Rev., 68, 200–215, https://doi.org/10.1016/j.quascirev.2013.02.011, 2013.
Cortes-Sanchez, M., Morales-Muniz, A., Simon-Vallejo, M. D., Lozano-Francisco, M. C., and Vera-Pelaez, J. L.: Earliest Known Use of Marine Resources by Neanderthals, PLoS ONE, 6, e24026, https://doi.org/10.1371/journal.pone.0024026, 2011.
Cowling, S. A. and Sykes, M. T.: Physiological significance of low atmospheric CO2 for plant-climate interactions, Quatern. Res., 52, 237–242, https://doi.org/10.1006/qres.1999.2065, 1999.
Damblon, F.: L'enregistrement palynologique de la sequence pléistocène et holocène de la grotte Walou, in: La grotte Walou à Trooz (Belgique), edited by: Draily, C., Pirson, S., and Toussaint, M., Service public de Wallonie (Etudes et Documents, Archéologie, 21), https://www.academia.edu/23006376/Draily_C_Toussaint_M_and_Pirson_S_Dir_2011_La_grotte_Walou_ %E0_Trooz_Belgique_Fouilles_de_1996_ %E0_2004_Volume_2_Les_sciences_de_la_vie_et_les_datations_Monographie_Etudes_et_documents_Arch%E9ologie_21_Namur_Service_public_de_Wallonie_241_p (last access: 25 July 2024), 84–129, 2011.
Daniau, A.-L., Desprat, S., Aleman, J. C., Bremond, L., Davis, B., Fletcher, W., Marlon, J. R., Marquer, L., Montade, V., Morales-Molino, C., Naughton, F., Rius, D., and Urrego, D. H.: Terrestrial plant microfossils in palaeoenvironmental studies, pollen, microcharcoal and phytolith. Towards a comprehensive understanding of vegetation, fire and climate changes over the past one million years, Rev. Micropaleontol., 63, https://doi.org/10.1016/j.revmic.2019.02.001, 2019.
Davis, B. A. S. and Stevenson, A. C.: The 8.2 ka event and Early-Mid Holocene forests, fires and flooding in the Central Ebro Desert, NE Spain, Quaternary Sci. Rev., 26, 1–35, https://doi.org/10.1016/j.quascirev.2007.04.007, 2007.
Davis, B. A. S., Brewer, S., Stevenson, A. C., Guiot, J., and Data Contributors: The temperature of Europe during the Holocene reconstructed from pollen data, Quaternary Sci. Rev., 22, 1701–1706, https://doi.org/10.1016/S0277-3791(03)00173-2, 2003.
Davis, B. A. S., Chevalier, M., Sommer, P., Carter, V. A., Finsinger, W., Mauri, A., Phelps, L. N., Zanon, M., Abegglen, R., Åkesson, C. M., Alba-Sánchez, F., Anderson, R. S., Antipina, T. G., Atanassova, J. R., Beer, R., Belyanina, N. I., Blyakharchuk, T. A., Borisova, O. K., Bozilova, E., Bukreeva, G., Bunting, M. J., Clò, E., Colombaroli, D., Combourieu-Nebout, N., Desprat, S., Di Rita, F., Djamali, M., Edwards, K. J., Fall, P. L., Feurdean, A., Fletcher, W., Florenzano, A., Furlanetto, G., Gaceur, E., Galimov, A. T., Gałka, M., García-Moreiras, I., Giesecke, T., Grindean, R., Guido, M. A., Gvozdeva, I. G., Herzschuh, U., Hjelle, K. L., Ivanov, S., Jahns, S., Jankovska, V., Jiménez-Moreno, G., Karpińska-Kołaczek, M., Kitaba, I., Kołaczek, P., Lapteva, E. G., Latałowa, M., Lebreton, V., Leroy, S., Leydet, M., Lopatina, D. A., López-Sáez, J. A., Lotter, A. F., Magri, D., Marinova, E., Matthias, I., Mavridou, A., Mercuri, A. M., Mesa-Fernández, J. M., Mikishin, Y. A., Milecka, K., Montanari, C., Morales-Molino, C., Mrotzek, A., Muñoz Sobrino, C., Naidina, O. D., Nakagawa, T., Nielsen, A. B., Novenko, E. Y., Panajiotidis, S., Panova, N. K., Papadopoulou, M., Pardoe, H. S., Pȩdziszewska, A., Petrenko, T. I., Ramos-Román, M. J., Ravazzi, C., Rösch, M., Ryabogina, N., Sabariego Ruiz, S., Salonen, J. S., Sapelko, T. V., Schofield, J. E., Seppä, H., Shumilovskikh, L., Stivrins, N., Stojakowits, P., Svobodova Svitavska, H., Świȩta-Musznicka, J., Tantau, I., Tinner, W., Tobolski, K., Tonkov, S., Tsakiridou, M., Valsecchi, V., Zanina, O. G., and Zimny, M.: The Eurasian Modern Pollen Database (EMPD), version 2, Earth Syst. Sci. Data, 12, 2423–2445, https://doi.org/10.5194/essd-12-2423-2020, 2020.
Davis, M. B.: On the theory of pollen analysis, Am. J. Sc., 26, 897–912, 1963.
de Beaulieu, J.-L. and Reille, M.: Pollen analysis of a long upper Pleistocene continental sequence in a Velay maar (Massif Central, France), Palaeogeogr. Palaeoclimatol. Palaeoecol., 80, 35–48, 1990.
Demay, L., Julien, M. A., Anghelinu, M., Shydlovskyi, P. S., Koulakovska, L. V., Péan, S., Stupak, D. V., Vasyliev, P. M., Obáda, T., Wojtal, P., and Belyaeva, V. I.: Study of human behaviors during the Late Pleniglacial in the East European Plain through their relation to the animal world, Quatern. Int., 581–582, 258–289, https://doi.org/10.1016/j.quaint.2020.10.047, 2021.
Douda, J., Doudová, J., Drašnarová, A., Kuneš, P., Hadincová, V., Krak, K., Zákravský, P., and Mandák, B.: Migration patterns of subgenus Alnus in Europe since the last glacial maximum: A systematic review, PLoS One, 9, e88709, https://doi.org/10.1371/journal.pone.0088709, 2014.
Duprat-Oualid, F., Rius, D., Bégeot, C., Magny, M., Millet, L., Wulf, S., and Appelt, O.: Vegetation response to abrupt climate changes in Western Europe from 45 to 14.7 k cal a BP: the Bergsee lacustrine record (Black Forest, Germany), J. Quaternary Sci., 32, 1008–1021, https://doi.org/10.1002/jqs.2972, 2017.
Dupre Ollivier, M.: Palinologiìa y paleoambiente – nuevos datos españoles referencias, Universidad de Valencia, 160 pp., ISBN 84-7795-000-8, 1988.
Edwards, M. E., Anderson, P. M., Brubaker, L. B., Ager, T., Andreev, A. A., Bigelow, N. H., Cwynar, L. C., Eisner, W. R., Harrison, S. P., Hu, F.-S., Jolly, D., Lozhkin, A. V., MacDonald, G. M., Mock, C. J., Ritchie, J. C., Sher, A. V., Spear, R. W., Williams, J., and Yu, G.: Pollen-based biomes for Beringia 18,000, 6000 and 0 14C yr bp, J. Biogeogr., 27, 521–554, https://doi.org/10.1046/j.1365-2699.2000.00426.x, 2000.
Ehlers, J., Gibbard, P. L., and Hughes, P. D. (Eds.): Quaternary Glaciations – Extent and Chronology A Closer Look, Elsevier, ISBN 9780444534477, 2011.
El Amrani, M., Macaire, J. J., Zarki, H., Bréhéret, J. G., and Fontugne, M.: Contrasted morphosedimentary activity of the lower Kert River (northeastern Morocco) during the Late Pleistocene and the Holocene. Possible impact of bioclimatic variations and human action, Comptes Rendus – Geosci., 340, 533–542, https://doi.org/10.1016/j.crte.2008.05.004, 2008.
Elenga, H., Peyron, O., Bonnefille, R., Jolly, D., Cheddadi, R., Guiot, J., Andrieu, V., Bottema, S., Buchet, G., De Beaulieu, J. L., Hamilton, A. C., Maley, J., Marchant, R., Perez-Obiol, R., Reille, M., Riollet, G., Scott, L., Straka, H., Taylor, D., Van Campo, E., Vincens, A., Laarif, F., and Jonson, H.: Pollen-based biome reconstruction for southern Europe and Africa 18,000 yr BP, J. Biogeogr., 27, 621–634, https://doi.org/10.1046/j.1365-2699.2000.00430.x, 2000.
Ferguson, J. E., Henderson, G. M., Fa, D. A., Finlayson, J. C., and Charnley, N. R.: Increased seasonality in the Western Mediterranean during the last glacial from limpet shell geochemistry, Earth Planet. Sc. Lett., 308, 325–333, https://doi.org/10.1016/j.epsl.2011.05.054, 2011.
Feurdean, A., Bhagwat, S. A., Willis, K. J., Birks, H. J. B., Lischke, H., and Hickler, T.: Tree migration-rates: narrowing the gap between inferred post-glacial rates and projected rates, PLoS ONE, 8, e71797, https://doi.org/10.1371/journal.pone.0071797, 2013.
Feurdean, A., Perşoiu, A., Tanţău, I., Stevens, T., Magyari, E. K., Onac, B. P., Marković, S., Andrič, M., Connor, S., Fărcaş, S., Gałka, M., Gaudeny, T., Hoek, W., Kolaczek, P., Kuneš, P., Lamentowicz, M., Marinova, E., Michczyńska, D. J., Perşoiu, I., Płóciennik, M., Słowiński, M., Stancikaite, M., Sumegi, P., Svensson, A., Tămaş, T., Timar, A., Tonkov, S., Toth, M., Veski, S., Willis, K. J., and Zernitskaya, V.: Climate variability and associated vegetation response throughout Central and Eastern Europe (CEE) between 60 and 8 ka, Quaternary Sci. Rev., 106, 206–224, https://doi.org/10.1016/j.quascirev.2014.06.003, 2014.
Fletcher, W. J. and Sanchez Goñi, M. F.: Orbital- and sub-orbital-scale climate impacts on vegetation of the western Mediterranean basin over the last 48 000 yr, Quaternary Res., 70, 451–464, https://doi.org/10.1016/j.yqres.2008.07.002, 2008.
Fick, S. E. and Hijmans, R. J.: WorldClim 2: new 1-km spatial resolution climate surfaces for global land areas, Int. J. Climatol., 37, 4302–4315, https://doi.org/10.1002/joc.5086, 2017.
Fletcher, W. J., Goni, M. F. S., Peyron, O., and Dormoy, I.: Abrupt climate changes of the last deglaciation detected in a Western Mediterranean forest record, Clim. Past, 6, 245–264, https://doi.org/10.5194/cp-6-245-2010, 2010.
Follieri, M., Magri, D., and Sadori, L.: Pollen stratigraphical synthesis from Valle di Castiglione (Roma), Quaternary Int., 3–4, 81–84, https://doi.org/10.1016/1040-6182(89)90076-1, 1989.
Gaillard, M. J., Sugita, S., Mazier, F., Trondman, A. K., Broström, A., Hickler, T., Kaplan, J. O., Kjellström, E., Kokfelt, U., Kuneš, P., Lemmen, C., Miller, P., Olofsson, J., Poska, A., Rundgren, M., Smith, B., Strandberg, G., Fyfe, R., Nielsen, A. B., Alenius, T., Balakauskas, L., Barnekow, L., Birks, H. J. B., Bjune, A., Björkman, L., Giesecke, T., Hjelle, K., Kalnina, L., Kangur, M., Van Der Knaap, W. O., Koff, T., Lageras, P., Latałowa, M., Leydet, M., Lechterbeck, J., Lindbladh, M., Odgaard, B., Peglar, S., Segerström, U., Von Stedingk, H., and Seppä, H.: Holocene land-cover reconstructions for studies on land cover-climate feedbacks, Clim. Past, 6, 483–499, https://doi.org/10.5194/cp-6-483-2010, 2010.
García-Amorena, I., Gómez Manzaneque, F., Rubiales, J. M., Granja, H. M., Soares de Carvalho, G., and Morla, C.: The Late Quaternary coastal forests of western Iberia: A study of their macroremains, Palaeogeogr. Palaeoclim. Palaeoecol., 254, 448–461, https://doi.org/10.1016/j.palaeo.2007.07.003, 2007.
Geiger, R.: The climate near the ground, Blue Hill Met. Observ., Harvard University, Cambridge, https://archive.org/details/climatenearthegr032657mbp/page/n3/mode/2up (last access: 25 July 2024), 1960.
Genov, I.: The Black Sea level from the Last Glacial Maximum to the present time, Geol. Balc., 45, 3–19, 2016.
Giardini, M.: Late Quaternary vegetation history at Stracciacappa (Rome, central Italy), Veg. Hist. Archaeobot., 16, 301–316, https://doi.org/10.1007/s00334-006-0037-y, 2007.
Giesecke, T.: Did thermophilous trees spread into central Europe during the Late Glacial?, New Phytol., 212, 15–18, https://doi.org/10.1111/nph.14149, 2016.
Giesecke, T., Davis, B., Brewer, S., Finsinger, W., Wolters, S., Blaauw, M., de Beaulieu, J.-L., Binney, H., Fyfe, R. M., Gaillard, M.-J., Gil-Romera, G., van der Knaap, W. O., Kuneš, P., Kühl, N., van Leeuwen, J. F. N., Leydet, M., Lotter, A. F., Ortu, E., Semmler, M., and Bradshaw, R. H. W.: Towards mapping the late Quaternary vegetation change of Europe, Veg. Hist. Archaeobot., 23, 75–86, https://doi.org/10.1007/s00334-012-0390-y, 2014.
Giraudi, C.: Climate evolution and forcing during the last 40 ka from the oscillations in Apennine glaciers and high mountain lakes, Italy, J. Quaternary Sci., 32, 1085–1098, https://doi.org/10.1002/jqs.2985, 2017.
Grichuk, V. P.: Main types of vegetation (ecosystems) for the maximum cooling of the last glaciation, in: Atlas of Palaeoclimates and Palaeoenvironments of the Northern Hemisphere, edited by: Frenzel, B., Pecsi, B., and Velichko, A. A., NQUA/Hungarian Academy of Sciences, Budapest, 123–124, https://doi.org/10.2307/1551555, 1992.
Guido, M. A., Molinari, C., Moneta, V., Branch, N., Black, S., Simmonds, M., Stastney, P., and Montanari, C.: Climate and vegetation dynamics of the Northern Apennines (Italy) during the Late Pleistocene and Holocene, Quaternary Sci. Rev., 231, 106206, https://doi.org/10.1016/j.quascirev.2020.106206, 2020.
Guiot, J., Pons, A., de Beaulieu, J. L., and Reille, M. A 140,000-year climatic reconstruction from two European pollen records, Nature, 338, 309–313, https://doi.org/10.1038/338309a0, 1989.
Guiot, J., Torre, F., Jolly, D., Peyron, O., Boreux, J. J., and Cheddadi, R.: Inverse vegetation modeling by Monte Carlo sampling to reconstruct palaeoclimates under changed precipitation seasonality and CO2 conditions: application to glacial climate in Mediterranean region, Ecol. Model., 127, 119–140, https://doi.org/10.1016/S0304-3800(99)00219-7, 2000.
Hansen, M. C., Potapov, P. V., Moore, R., Hancher, M., Turubanova, S. A., Tyukavina, A., Thau, D., Stehman, S. V., Goetz, S. J., Loveland, T. R., Kommareddy, A., Egorov, A., Chini, L., Justice, C. O., and Townshend, J. R. G.: High-resolution global maps of 21st-century forest cover change, Science, 342, 850–853, https://doi.org/10.1126/science.1244693, 2013.
Harrison, S. P., Yu, G. E., and Tarasov, P. E.: Late Quaternary Lake-Level Record from Northern Eurasia, Quatern. Res., 45, 138–159, https://doi.org/10.1006/qres.1996.0016, 1996.
Harrison, S. P., Bartlein, P. J., Brewer, S., Prentice, I. C., Boyd, M., Hessler, I., Holmgren, K., Izumi, K., and Willis, K.: Climate model benchmarking with glacial and mid-Holocene climates, Clim. Dynam., 43, 671–688, https://doi.org/10.1007/s00382-013-1922-6, 2014.
Harrison, S. P., Bartlein, P. J., Izumi, K., Li, G., Annan, J., Hargreaves, J., Braconnot, P., and Kageyama, M.: Evaluation of CMIP5 palaeo-simulations to improve climate projections, Nat. Clim. Change, 5, 735–743, https://doi.org/10.1038/nclimate2649, 2015.
Heiri, O., Koinig, K. A., Spötl, C., Barrett, S., Brauer, A., Drescher-Schneider, R., Gaar, D., Ivy-Ochs, S., Kerschner, H., Luetscher, M., Moran, A., Nicolussi, K., Preusser, F., Schmidt, R., Schoeneich, P., Schwörer, C., Sprafke, T., Terhorst, B., and Tinner, W.: Palaeoclimate records 60-8 ka in the Austrian and Swiss Alps and their forelands, Quaternary Sci. Rev., 106, 186–205, https://doi.org/10.1016/j.quascirev.2014.05.021, 2014.
Heyman, B. M., Heyman, J., Fickert, T., Harbor, J. M., and Forest, B.: Paleo-climate of the central European uplands during the last glacial maximum based on glacier mass-balance modeling Bavarian Forest Republic, Quatern. Res., 79, 49–54, https://doi.org/10.1016/j.yqres.2012.09.005, 2013.
Hughes, A. L. C., Gyllencreutz, R., Lohne, Ø. S., Mangerud, J., and Svendsen, J. I.: The last Eurasian ice sheets – a chronological database and time-slice reconstruction, DATED-1, Boreas, 45, 1–45, https://doi.org/10.1111/bor.12142, 2016.
Hughes, P. D. and Gibbard, P. L.: A stratigraphical basis for the Last Glacial Maximum (LGM), Quatern. Int., 383, 174–185, https://doi.org/10.1016/j.quaint.2014.06.006, 2015.
Hughes, P. D., Woodward, J. C., and Gibbard, P. L.: Late Pleistocene glaciers and climate in the Mediterranean, Global Planet. Change, 50, 83–98, https://doi.org/10.1016/j.gloplacha.2005.07.005, 2006.
Huntley, B.: Dissimilarity mapping between fossil and contemporary pollen spectra in Europe for the past 13,000 years, Quatern. Res., 33, 360–376, https://doi.org/10.1016/0033-5894(90)90062-P, 1990.
Huntley, B. and Allen, J.: Glacial environments III: Palaeo-vegetation patterns in late glacial Europe, in: Neanderthals and modern humans in the European landscape during the last glaciation: Archaeological results of the Stage 3 Project, edited by: Andel, T. H. V. and Davies, W., 79–102, McDonald Institute for Archaeological Research, ISBN 1-902937-21-X, 2003.
Izumi, K. and Bartlein, P., North American paleoclimate reconstructions for the Last Glacial Maximum using an inverse modeling through iterative forward modeling approach applied to pollen data, Geophys. Res. Lett., 43, 10965–10972, https://doi.org/10.1002/2016GL070152, 2016.
Jalut, G., Andrieu, V., Delibrias, G., Fontaugne, M., and Pages, P.: Palaeoenvironment of the valley of Ossau (Western French Pyrenees) during the last 27 000 year, Pollen Spores, 30, 357–393, 1988.
Jalut, G., Marti, J. M., Fontugne, M., Delibrias, G., Vilaplana, J. M., and Julia, R.: Glacial to interglacial vegetation changes in the northern and southern Pyrénées: Deglaciation, vegetation cover and chronology, Quaternary Sci. Rev., 11, 449–480, https://doi.org/10.1016/0277-3791(92)90027-6, 1992.
Jankovská, V.: Vegetation Cover in West Carpathians during the Last Glacial Period Analogy of Present Day Siberian Forest-Tundra and Taiga, in: Proceedings of the XII All-Russian Palynological Conference, Saint-Petersburg, Russia, 29 September–4 October, p. 316, ISBN 978-5-88953-122-1, 2008.
Janská, V., Jiménez-Alfaro, B., Chytrý, M., Divíšek, J., Anenkhonov, O., Korolyuk, A., Lashchinskyi, N., and Culek, M.: Palaeodistribution modelling of European vegetation types at the Last Glacial Maximum using modern analogues from Siberia: Prospects and limitations, Quaternay Sci. Rev., 159, 103–115, https://doi.org/10.1016/j.quascirev.2017.01.011, 2017.
Jost, A., Lunt, D., Abe-Ouchi, A., Abe-Ouchi, A., Peyron, O., Valdes, P. J., and Ramstein, G.: High-resolution simulations of the last glacial maximum climate over Europe: A solution to discrepancies with continental palaeoclimatic reconstructions?, Clim. Dynam., 24, 577–590, https://doi.org/10.1007/s00382-005-0009-4, 2005.
Juggins, S.: Quantitative reconstructions in palaeolimnology: new paradigm or sick science?, Quaternay Sci. Rev., 64, 20–32, https://doi.org/10.1016/j.quascirev.2012.12.014, 2013.
Juggins, S.: Rioja: Analysis of Quaternary Science Data, https://cran.r-project.org/package=rioja (last access: 25 July 2024), 2020.
Juggins, S. and Birks, H. J. B.: Quantitative Environmental Reconstructions from Biological Data, in: Developments in Paleoenvironmental Research 5, edited by: Birks, H. J. B., Springer Science & Business Media B.V., 431–494, https://doi.org/10.1007/978-94-007-2745-8_14, 2012.
Juřičková, L., Horáčková, J., and Ložek, V.: Direct evidence of central European forest refugia during the last glacial period based on mollusc fossils, Quatern. Res., 82, 222–228, https://doi.org/10.1016/j.yqres.2014.01.015, 2014.
Kageyama, M., Laîné, A., Abe-Ouchi, A., Braconnot, P., Cortijo, E., Crucifix, M., de Vernal, A., Guiot, J., Hewitt, C. D., Kitoh, A., Kucera, M., Marti, O., Ohgaito, R., Otto-Bliesner, B., Peltier, W. R., Rosell-Melé, A., Vettoretti, G., Weber, S. L., and Yu, Y.: Last Glacial Maximum temperatures over the North Atlantic, Europe and western Siberia: a comparison between PMIP models, MARGO sea-surface temperatures and pollen-based reconstructions, Quaternary Sci. Rev., 25, 2082–2102, https://doi.org/10.1016/j.quascirev.2006.02.010, 2006.
Kageyama, M., Harrison, S. P., Kapsch, M.-L., Lofverstrom, M., Lora, J. M., Mikolajewicz, U., Sherriff-Tadano, S., Vadsaria, T., Abe-Ouchi, A., Bouttes, N., Chandan, D., Gregoire, L. J., Ivanovic, R. F., Izumi, K., LeGrande, A. N., Lhardy, F., Lohmann, G., Morozova, P. A., Ohgaito, R., Paul, A., Peltier, W. R., Poulsen, C. J., Quiquet, A., Roche, D. M., Shi, X., Tierney, J. E., Valdes, P. J., Volodin, E., and Zhu, J.: The PMIP4 Last Glacial Maximum experiments: preliminary results and comparison with the PMIP3 simulations, Clim. Past, 17, 1065–1089, https://doi.org/10.5194/cp-17-1065-2021, 2021.
Kaltenrieder, P., Belis, C. A., Hofstetter, S., Ammann, B., Ravazzi, C., and Tinner, W.: Environmental and climatic conditions at a potential Glacial refugial site of tree species near the Southern Alpine glaciers. New insights from multiproxy sedimentary studies at Lago della Costa (Euganean Hills, Northeastern Italy), Quaternay Sci. Rev., 28, 2647–2662, https://doi.org/10.1016/j.quascirev.2009.05.025, 2009.
Kaplan, J. O., Pfeiffer, M., Kolen, J. C. A., and Davis, B. A. S.: Large scale anthropogenic reduction of forest cover in last glacial maximum Europe, PLoS One, 11, e0166726, https://doi.org/10.1371/journal.pone.0166726, 2016.
Kehrwald, N. M., McCoy, W. D., Thibeault, J., Burns, S. J., and Oches, E. A.: Paleoclimatic implications of the spatial patterns of modern and LGM European land-snail shell δ18O, Quatern. Res., 74, 166–176, https://doi.org/10.1016/j.yqres.2010.03.001, 2010.
Kelly, A., Charman, D. J., and Newnham, R. M.: A last glacial maximum pollen record from bodmin moor showing a possible cryptic Northern refugium in Southwest England, J. Quaternary Sci., 25, 296–308, https://doi.org/10.1002/jqs.1309, 2010.
Kolodny, Y., Stein, M., and Machlus, M.: Sea-rain-lake relation in the Last Glacial East Mediterranean revealed by δ18O-δ13C in Lake Lisan aragonites, Geochim. Cosmochim. Ac., 69, 4045–4060, https://doi.org/10.1016/j.gca.2004.11.022, 2005.
Kovács, J., Moravcová, M., Újvári, G., and Pintér, A. G.: Reconstructing the paleoenvironment of East Central Europe in the Late Pleistocene using the oxygen and carbon isotopic signal of tooth in large mammal remains, Quatern. Int., 276–277, 145–154, https://doi.org/10.1016/j.quaint.2012.04.009, 2012.
Krebs, P., Pezzatti, G. B., Beffa, G., Tinner, W., and Conedera, M.: Revising the sweet chestnut (Castanea sativa Mill.) refugia history of the last glacial period with extended pollen and macrofossil evidence, Quaternay Sci. Rev., 206, 111–128, https://doi.org/10.1016/j.quascirev.2019.01.002, 2019.
Kuneš, P., Pelánková, B., Chytrý, M., Jankovská, V., Pokorný, P., and Petr, L.: Interpretation of the last-glacial vegetation of eastern-central Europe using modern analogues from southern Siberia, J. Biogeogr., 35, 2223–2236, https://doi.org/10.1111/j.1365-2699.2008.01974.x, 2008.
Küster, H.: Postglaziale Vegetationsgeschichte Südbayerns, Geobotanische Studien zur Prähistorischen Landschaftskunde, Akademie Verlag, Berlin, ISBN 978-3-05-501592-2, 1995.
Lacey, J. H., Leng, M. J., Höbig, N., Reed, J. M., Valero-Garcés, B., and Reicherter, K.: Western Mediterranean climate and environment since Marine Isotope Stage 3: a 50,000-year record from Lake Banyoles, Spain, J. Paleolimnol., 55, 113–128, https://doi.org/10.1007/s10933-015-9868-9, 2016.
Latombe, G., Burke, A., Vrac, M., Levavasseur, G., Dumas, C., Kageyama, M., and Ramstein, G.: Comparison of spatial downscaling methods of general circulation model results to study climate variability during the Last Glacial Maximum, Geosci. Model Dev., 11, 2563–2579, https://doi.org/10.5194/gmd-11-2563-2018, 2018.
Lefort, J. P., Monnier, J. L., and Danukalova, G.: Transport of Late Pleistocene loess particles by katabatic winds during the lowstands of the English Channel, J. Geol. Soc., 176, 1169–1181, https://doi.org/10.1144/jgs2019-07, 2019.
Lehmkuhl, F., Nett, J. J., Pötter, S., Schulte, P., Sprafke, T., Jary, Z., Antoine, P.,Wacha, L., Wolf, D., Zerboni, A., Hošek, J., Marković, S. B., Obreht, I., Sümegi, P., Veres, D., Zeeden, C., Boemke, B., Schaubert, V., Viehweger, J., and Hambach, U.: Loess landscapes of Europe e mapping, geomorphology, and zonal differentiation, Earth-Sci. Rev., 215, 103496, https://doi.org/10.1016/j.earscirev.2020.103496, 2021.
Leroy, S. A. G. and Arpe, K.: Glacial refugia for summer-green trees in Europe and south-west Asia as proposed by ECHAM3 time-slice atmospheric model simulations, J. Biogeogr., 34, 2115–2128, https://doi.org/10.1111/j.1365-2699.2007.01754.x, 2007.
Lev, L., Stein, M., Ito, E., Fruchter, N., Ben-Avraham, Z., and Almogi-Labin, A.: Sedimentary, geochemical and hydrological history of Lake Kinneret during the past 28,000 years, Quaternary Sci. Rev., 209, 114–128, https://doi.org/10.1016/j.quascirev.2019.02.015, 2019.
Lister, A. M. and Stuart, A. J.: The impact of climate change on large mammal distribution and extinction: Evidence from the last glacial/interglacial transition, Comptes Rendus – Geosci., 340, 615–620, https://doi.org/10.1016/j.crte.2008.04.001, 2008.
López-García, J. M. and Blain, H. A.: Quaternary small vertebrates: State of the art and new insights, Quaternary Sci. Rev., 233, 106242, https://doi.org/10.1016/j.quascirev.2020.106242, 2020.
Ludwig, P., Pinto, J. G., Raible, C. C., and Shao, Y.: Impacts of surface boundary conditions on regional climate model simulations of European climate during the Last Glacial Maximum, Geophys. Res. Lett., 44, 5086–5095, https://doi.org/10.1002/2017GL073622, 2017.
Luetscher, M., Boch, R., Sodemann, H., Spötl, C., Cheng, H., Edwards, R. L., Frisia, S., Hof, F., and Müller, W.: North Atlantic storm track changes during the Last Glacial Maximum recorded by Alpine speleothems, Nat. Commun., 6, 27–32, https://doi.org/10.1038/ncomms7344, 2015.
Magri, D.: Persistence of tree taxa in Europe and Quaternary climate changes, Quatern. Int., 219, 145–151, https://doi.org/10.1016/j.quaint.2009.10.032, 2010.
Magri, D. and Parra, I.: Late Quaternary western Mediterranean pollen records and African winds, Earth Planet. Sc. Lett., 200, 401–408, https://doi.org/10.1016/S0012-821X(02)00619-2, 2002.
Magri, D. and Sadori, L.: Late Pleistocene and Holocene pollen stratigraphy at Lago di Vico, central Italy, Veg. Hist. Archaeobot., 8, 247–260, https://doi.org/10.1007/BF01291777, 1999.
Magyari, E., Jakab, G., Rudner, E., and Sümegi, P.: Palynological and plant macrofossil data on Late Pleistocene short-term climatic oscillations in NE-Hungary, Acta Palaeobot. Suppl., 2, 491–502, 1999.
Magyari, E. K., Kuneš, P., Jakab, G., Sümegi, P., Pelánková, B., Schäbitz, F., Braun, M., and Chytrý, M.: Late Pleniglacial vegetation in eastern-central Europe: Are there modern analogues in Siberia?, Quaternary Sci. Rev., 95, 60–79, https://doi.org/10.1016/j.quascirev.2014.04.020, 2014a.
Magyari, E. K., Veres, D., Wennrich, V., Wagner, B., Braun, M., Jakab, G., Karátson, D., Pál, Z., Ferenczy, G., St-Onge, G., Rethemeyer, J., Francois, J. P., von Reumont, F., and Schäbitz, F.: Vegetation and environmental responses to climate forcing during the Last Glacial Maximum and deglaciation in the East Carpathians: Attenuated response to maximum cooling and increased biomass burning, Quaternary Sci. Rev., 106, 278–298, https://doi.org/10.1016/j.quascirev.2014.09.015, 2014b.
Magyari, E. K., Pál, I., Vincze, I., Veres, D., Jakab, G., Braun, M., Szalai, Z., Szabó, Z., and Korponai, J.: Warm Younger Dryas summers and early late glacial spread of temperate deciduous trees in the Pannonian Basin during the last glacial termination (20–9 kyr cal BP), Quat. Sci. Rev., 225, 105980, https://doi.org/10.1016/j.quascirev.2019.105980, 2019.
Margari, V., Gibbard, P. L., Bryant, C. L., and Tzedakis, P. C.: Character of vegetational and environmental changes in southern Europe during the last glacial period; evidence from Lesvos Island, Greece, Quaternary Sci. Rev., 28, 1317–1339, https://doi.org/10.1016/j.quascirev.2009.01.008, 2009.
MARGO Project Members: Constraints on the magnitude and patterns of ocean cooling at the Last Glacial Maximum, Nat. Geosci., 2, 127–132, https://doi.org/10.1038/ngeo411, 2009.
Marsicek, J., Shuman, B. N., Bartlein, P. J., Shafer, S. L., and Brewer, S.: Reconciling divergent trends and millennial variations in Holocene temperatures, Nature, 554, 92–96, https://doi.org/10.1038/nature25464, 2018.
Mauch Lenardić, J., Oros Sršen, A., and Radović, S.: Quaternary fauna of the Eastern Adriatic (Croatia) with the special review on the Late Pleistocene sites, Quatern. Int., 494, 130–151, https://doi.org/10.1016/j.quaint.2017.11.028, 2018.
Mauri, A., Davis, B. A. S., Collins, P. M., and Kaplan, J. O.: The influence of atmospheric circulation on the mid-Holocene climate of Europe: A data-model comparison, Clim. Past, 10, 1925–1938, https://doi.org/10.5194/cp-10-1925-2014, 2014.
Mauri, A., Davis, B. A. S., Collins, P. M., and Kaplan, J. O.: The climate of Europe during the Holocene: A gridded pollen-based reconstruction and its multi-proxy evaluation, Quaternary Sci. Rev., 112, 109–127, https://doi.org/10.1016/j.quascirev.2015.01.013, 2015.
Miebach, A., Niestrath, P., Roeser, P., and Litt, T.: Impacts of climate and humans on the vegetation in northwestern Turkey: palynological insights from Lake Iznik since the Last Glacial, Clim. Past, 12, 575–593, https://doi.org/10.5194/cp-12-575-2016, 2016.
Mikolajewicz, U.: Modeling mediterranean ocean climate of the last glacial maximum, Clim. Past, 7, 161–180, https://doi.org/10.5194/cp-7-161-2011, 2011.
Miola, A., Bondesan, A., Corain, L., Favaretto, S., Mozzi, P., Piovan, S., and Sostizzo, I.: Wetlands in the Venetian Po Plain (northeastern Italy) during the Last Glacial Maximum: Interplay between vegetation, hydrology and sedimentary environment, Rev. Palaeobot. Palynol., 141, 53–81, https://doi.org/10.1016/j.revpalbo.2006.03.016, 2006.
Mix, A. C., Bard, E., and Schneider, R.: Environmental processes of the ice age: Land, oceans, glaciers (EPILOG), Quaternary Sci. Rev., 20, 627–657, https://doi.org/10.1016/S0277-3791(00)00145-1, 2001.
Moine, O., Rousseau, D. D., Jolly, D., and Vianey-Liaud, M.: Paleoclimatic reconstruction using mutual climatic range on terrestrial mollusks, Quatern. Res., 57, 162–172, https://doi.org/10.1006/qres.2001.2286, 2002.
Monegato, G., Ravazzi, C., Donegana, M., Pini, R., Calderoni, G., and Wick, L.: Evidence of a two-fold glacial advance during the last glacial maximum in the Tagliamento end moraine system (eastern Alps), Quatern. Res., 68, 284–302, https://doi.org/10.1016/j.yqres.2007.07.002, 2007.
Monegato, G., Ravazzi, C., Culiberg, M., Pini, R., Bavec, M., Calderoni, G., Jež, J., and Perego, R.: Sedimentary evolution and persistence of open forests between the south-eastern Alpine fringe and the Northern Dinarides during the Last Glacial Maximum, Palaeogeogr. Palaeoclim. Palaeoecol., 436, 23–40, https://doi.org/10.1016/j.palaeo.2015.06.025, 2015.
Moreno, A., González-Sampériz, P., Morellón, M., Valero-Garcés, B. L., and Fletcher, W. J.: Northern Iberian abrupt climate change dynamics during the last glacial cycle: A view from lacustrine sediments, Quaternay Sci. Rev., 36, 139–153, https://doi.org/10.1016/j.quascirev.2010.06.031, 2012.
Naughton, F., Sanchez Goñi, M. F., Desprat, S., Turon, J-L., Duprat, J., Malaizé, B., Joli, D., Cortijo, E., Drago, T., and Freitas, M. C.: Present-day and past (last 25 000 years) marine pollen signal off western Iberia. Marine Micropaleontology, Volume 62, Issue 2, 1 February 2007, 91–114, https://doi.org/10.1016/j.marmicro.2006.07.006, 2007.
Nogues-Bravo, D., Rodriìguez-Saìnchez, F., Orsini, L., de Boer, E., Jansson, R., Morlon, H., Fordham, D. A., and Jackson, S. T.: Cracking the code of biodiversity responses to past climate change, Trends Ecol. Evol., 33, 765–76, 2018.
Nolan, C., Overpeck, J. T., Allen, J. R. M., Anderson, P. M., Betancourt, J. L., Binney, H. A., Brewer, S., Bush, M. B., Chase, B. M., Cheddadi, R., Djamali, M., Dodson, J., Edwards, M. E., Gosling, W. D., Haberle, S., Hotchkiss, S. C., Huntley, B., Ivory, S. J., Kershaw, A. P., Kim, S. H., Latorre, C., Leydet, M., Lézine, A. M., Liu, K. B., Liu, Y., Lozhkin, A. V., McGlone, M. S., Marchant, R. A., Momohara, A., Moreno, P. I., Müller, S., Otto-Bliesner, B. L., Shen, C., Stevenson, J., Takahara, H., Tarasov, P. E., Tipton, J., Vincens, A., Weng, C., Xu, Q., Zheng, Z., and Jackson, S. T.: Past and future global transformation of terrestrial ecosystems under climate change, Science, 361, 920–923, https://doi.org/10.1126/science.aan5360, 2018.
Normand, S., Treier, U. A., and Odgaard, B. V.: Tree refugia and slow forest development in response to post – LGM warming in North – Eastern European Russia, J. Biogeogr., 2, 2–5, 2011.
Olson, D. M., Dinerstein, E., Wikramanayake, E. D., Burgess, N. D., Powell, G. V. N., Underwood, E. C., D'Amico, J. A., Itoua, I., Strand, H. E., Morrison, J. C., Loucks, C. J., Allnutt, T. F., Ricketts, T. H., Kura, Y., Lamoreux, J. F., Wettengel, W. W., Hedao, P., and Kassem, K. R.: Terrestrial ecoregions of the world: a new map of life on Earth, BioScience, 51, 933–938, https://doi.org/10.1641/0006-3568(2001)051[0933:TEOTWA]2.0.CO;2, 2001.
Paganelli, A.: Evolution of vegetation and climate in the Veneto-Po Plain during the Late-Glacial and Early Holocene using pollen-strat-igraphical data, Alp. Mediterr. Quat., 9, 581–589, 1996.
Pantaléon-Cano, J.: Estudi palinologic de sediments litorals de la provincia d'Almeria. Transformacion del paisatge vegetal dins un territori semiarid, PhD thesis, Universitat Autònoma de Barcelona, Barcelona, Spain, 1997.
Pérez-Obiol, R. P. and Julia, R.: Climatic change on the Iberian Peninsula recorded in a 30,000-year pollen record from Lake Banyoles, Quaternary Res., 41, 91–98, 1994.
Peyron, O., Guiot, J., Cheddadi, R., Tarasov, P., Reille, M., De Beaulieu, J. L., Bottema, S., and Andrieu, V.: Climatic Reconstruction in Europe for 18,000 YR B.P. from Pollen Data, Quatern. Res., 49, 183–196, https://doi.org/10.1006/qres.1997.1961, 1998.
Peyron, O., Magny, M., Goring, S., Joannin, S., de Beaulieu, J.-L., Brugiapaglia, E., Sadori, L., Garfi, G., Kouli, K., Ioakim, C., and Combourieu-Nebout, N.: Contrasting patterns of climatic changes during the Holocene across the Italian Peninsula reconstructed from pollen data, Clim. Past, 9, 1233–1252, https://doi.org/10.5194/cp-9-1233-2013, 2013.
Pickarski, N., Kwiecien, O., Langgut, D., and Litt, T.: Abrupt climate and vegetation variability of eastern Anatolia during the last glacial, Clim. Past, 11, 1491–1505, https://doi.org/10.5194/cp-11-1491-2015, 2015.
Pini, R., Ravazzi, C., and Donegana, D.: Pollen stratigraphy, vegetation and climate history of the last 215 ka in the Azzano Decimo core (plain of Friuli, north-eastern Italy), Quaternary Sci. Rev., 28, 1268–1290, https://doi.org/10.1016/j.quascirev.2008.12.017, 2009.
Pini, R. Furlanetto, G., Vallé, F., Badino, F., Wick, L., Anselmetti, F. S., Bertuletti, P., Fusi, N., Morlock, M. A., Delmonte, B., Harrison, S. P., Maggi, V., and Ravazzi, C.: Linking North Atlantic and Alpine Last Glacial Maximum climates via a high-resolution pollen-based subarctic forest steppe record, Quaternary Sci. Rev., 294, 107759, https://doi.org/10.1016/j.quascirev.2022.107759, 2022.
Pons, A. and Reille, M.: The Holocene- and upper Pleistocene pollen record from Padul (Granada, Spain): A new study, Palaeogeogr. Palaeoclim. Palaeoecol., 66, 243–249, 255–263, https://doi.org/10.1016/0031-0182(88)90202-7, 1988.
Potì, A., Kehl, M., Broich, M., Carrión Marco, Y., Hutterer, R., Jentke, T., Linstädter, J., López-Sáez, J. A., Mikdad, A., Morales, J., Pérez-Díaz, S., Portillo, M., Schmid, C., Vidal-Matutano, P., and Weniger, G. C.: Human occupation and environmental change in the western Maghreb during the Last Glacial Maximum (LGM) and the Late Glacial. New evidence from the Iberomaurusian site Ifri El Baroud (northeast Morocco), Quaternay Sci. Rev., 220, 87–110, https://doi.org/10.1016/j.quascirev.2019.07.013, 2019.
Prentice, I. C. and Harrison, S. P.: Ecosystem effects of CO2 concentration: Evidence from past climates, Clim. Past, 5, 297–307, https://doi.org/10.5194/cp-5-297-2009, 2009.
Prentice, I. C., Guiot, J., and Harrison, S. P.: Mediterranean vegetation, lake levels and palaeoclimate at the Last Glacial Maximum, Nature, 360, 658–660, https://doi.org/10.1038/360658a0, 1992.
Prentice, I. C., Guiot, J., Huntley, B., Jolly, D., and Cheddadi, R.: Reconstructing biomes from palaeoecological data: A general method and its application to European pollen data at 0 and 6 ka, Clim. Dynam., 12, 185–194, https://doi.org/10.1007/BF00211617, 1996.
Prentice, I. C., Harrison, S. P., and Bartlein, P. J.: Global vegetation and terrestrial carbon cycle changes after the last ice age, New Phytol., 189, 988–998, https://doi.org/10.1111/j.1469-8137.2010.03620.x, 2011.
Prentice, I. C., Cleator, S. F., Huang, Y. H., Harrison, S. P., and Roulstone, I.: Reconstructing ice-age palaeoclimates: Quantifying low-CO2 effects on plants, Global Planet. Change, 149, 166–176, https://doi.org/10.1016/j.gloplacha.2016.12.012, 2017.
Prud'homme, C., Lécuyer, C., Antoine, P., Moine, O., Hatté, C., Fourel, F., Martineau, F., and Rousseau, D. D.: Palaeotemperature reconstruction during the Last Glacial from δ18O of earthworm calcite granules from Nussloch loess sequence, Germany, Earth Planet. Sc. Lett., 442, 13–20, https://doi.org/10.1016/j.epsl.2016.02.045, 2016.
Prud'homme, C., Lécuyer, C., Antoine, P., Hatté, C., Moine, O., Fourel, F., Amiot, R., Martineau, F., and Rousseau, D. D.: δ13C signal of earthworm calcite granules: A new proxy for palaeoprecipitation reconstructions during the Last Glacial in western Europe, Quaternary Sci. Rev., 179, 158–166, https://doi.org/10.1016/j.quascirev.2017.11.017, 2018.
Puzachenko, A. Y., Markova, A. K., and Pawłowska, K.: Evolution of Central European regional mammal assemblages between the late Middle Pleistocene and the Holocene (MIS7–MIS1), Quatern. Int., 633, 80–102, https://doi.org/10.1016/j.quaint.2021.11.009, 2021.
Ramstein, G., Kageyama, M., Guiot, J., Wu, H., Hély, C., Krinner, G., and Brewer, S.: How cold was Europe at the Last Glacial Maximum? A synthesis of the progress achieved since the first PMIP model-data comparison, Clim. Past, 3, 331–339, https://doi.org/10.5194/cp-3-331-2007, 2007.
Reille, M. and Andrieu, V.: The late Pleistocene and Holocene in the Lourdes Basin, Western Pyrénées, France: new pollen analytical and chronological data, Veg. Hist. Archaeobot., 4, 1–21, https://doi.org/10.1007/BF00198611, 1995.
Reille, M. and de Beaulieu, J. L.: History of the Würm and Holocene vegetation in western velay (Massif Central, France): A comparison of pollen analysis from three corings at Lac du Bouchet, Rev. Palaeobot. Palynol., 54, 233–248, https://doi.org/10.1016/0034-6667(88)90016-4, 1988.
Reimer, A., Landmann, G., and Kempe, S.: Lake Van, Eastern Anatolia, hydrochemistry and history, Aquat. Geochem., 15, 195–222, https://doi.org/10.1007/s10498-008-9049-9, 2009.
Roucoux, K. H., de Abreu, L., Shackleton, N. J., and Tzedakis, P. C.: The response of NW Iberian vegetation to North Atlantic climate oscillations during the last 65 kyr, Quaternary Sci. Rev., 24, 1637–1653, https://doi.org/10.1016/j.quascirev.2004.08.022, 2005.
Rousseau, D. D.: Climatic transfer function from quaternary molluscs in European loess deposits, Quatern. Res., 36, 195–209, https://doi.org/10.1016/0033-5894(91)90025-Z, 1991.
Royer, A., Montuire, S., Legendre, S., Discamps, E., Jeannet, M., and Lécuyer, C.: Investigating the influence of climate changes on rodent communities at a regional-scale (MIS 1–3, Southwestern France), PLoS One, 11, 1–25, https://doi.org/10.1371/journal.pone.0145600, 2016.
Ruiz-Zapata, M. B., Vegas, J., Garcia-Cortes, A., Gil Garcia, M. J., Torres, T., Ortiz, J. E., and Perez-Gonzalez, A.: Vegetation evolution during the Last Maximum Glacial Period in FU-1 sequence (Fuentillejo Lacustrin Maar, Campo de Calatrava, Ciudad Real), Polen, 18, 37–49, 2008.
Ruiz-Zapata, M., Vegas, J., García-Cortés, Á., Gil-García, M., Torres, T., Ortiz, J., Galán, L., and González, A.: Comportamiento de la vegetación, durante el último máximo glaciar, en la secuencia FU-1 (Laguna del Maar de Fuentillejo, Campo de Calatrava, Ciudad Real), 18, 37–49, https://doi.org/10.14201/pol.v18i0.7399, 2009.
Salonen, J., Sanchez Goñi, M. F., Renssen, H., and Plikk, A.: Contrasting northern and southern European winter climate trends during the Last Interglacial, Geology, 49, 1220–1224, https://doi.org/10.1130/G49007.1, 2021.
Salonen, J. S., Ilvonen, L., Seppä, H., Holmström, L., Telford, R. J., Gaidamavicius, A., Stancikaite, M., and Subetto, D.: Comparing different calibration methods (WA/WA-PLS regression and Bayesian modelling) and different-sized calibration sets in pollen-based quantitative climate reconstruction, Holocene, 22, 413–424, 2012.
Salonen, J. S., Korpela, M., Williams, J. W., and Luoto, M.: Machine-learning based reconstructions of primary and secondary climate variables from North American and European fossil pollen data, Sci. Rep., 9, 1–13, https://doi.org/10.1038/s41598-019-52293-4, 2019.
Samartin, S., Heiri, O., Kaltenrieder, P., Kühl, N., and Tinner, W.: Reconstruction of full glacial environments and summer temperatures from Lago della Costa, a refugial site in Northern Italy, Quaternary Sci. Rev., 143, 107–119, https://doi.org/10.1016/j.quascirev.2016.04.005, 2016.
Sanchez Goñi, M. F. and Harrison, S. P.: Millennial-scale climate variability and vegetation changes during the Last Glacial: concepts and terminology, Quaternary Sci. Rev., 29, 2823–2827, https://doi.org/10.1016/j.quascirev.2009.11.014, 2010.
Sánchez Goñi, M. F., Loutre, M. F., Crucifix, M., Peyron, O., Santos, L., Duprat, J., Malaizé, B., Turon, J.-L., and Peypouquet, J.-P.: Increasing vegetation and climate gradient in western Europe over the Last Glacial inception (122–110 ka): Data–model comparison, Earth Planet. Sc. Lett., 231, 111–130, https://doi.org/10.1016/j.epsl.2004.12.010, 2005.
Sanchi, L., Ménot, G., and Bard, E.: Insights into continental temperatures in the northwestern Black Sea area during the Last Glacial period using branched tetraether lipids, Quaternary Sci. Rev., 84, 98–108, https://doi.org/10.1016/j.quascirev.2013.11.013, 2014.
Satkūnas, J. and Grigienė, A.: Eemian-Weichselian palaeoenvironmental record from the Mickūnai glacial depression (Eastern Lithuania), Geologija, 54, 35–51, https://doi.org/10.6001/geologija.v54i2.2482, 2012.
Schäfer, I. K., Bliedtner, M., Wolf, D., Faust, D., and Zech, R.: Evidence for humid conditions during the last glacial from leaf wax patterns in the loess-paleosol sequence El Paraíso, Central Spain, Quatern. Int., 407, 64–73, https://doi.org/10.1016/j.quaint.2016.01.061, 2016.
Scourse, J. D.: Late Pleistocene stratigraphy and palaeobotany of the Isles of Scilly, Philos. T. Roy. Soc. Lond. B, 334, 405–448, https://doi.org/10.1098/rstb.1991.0125, 1991.
Shumilovskikh, L. S., Fleitmann, D., Nowaczyk, N. R., Behling, H., Marret, F., Wegwerth, A., and Arz, H. W.: Orbital- and millennial-scale environmental changes between 64 and 20 ka BP recorded in Black Sea sediments, Clim. Past, 10, 939–954, https://doi.org/10.5194/cp-10-939-2014, 2014.
Spötl, C., Koltai, G., Jarosch, A. H., and Cheng, H.: Increased autumn and winter precipitation during the Last Glacial Maximum in the European Alps, Nat. Commun., 12, 1839, https://doi.org/10.1038/s41467-021-22090-7, 2021.
Stewart, J. R. and Lister, A. M.: Cryptic northern refugia and the origins of the modern biota, Trends Ecol. Evol., 16, 608–613, https://doi.org/10.1016/S0169-5347(01)02338-2, 2001.
Stivrins, N., Soininen, J., Amon, L., Fontana, S. L., Gryguc, G., Heikkilä, M., Heiri, O., Kisielienė, D., Reitalu, T., Stančikaitė, M., Veski, S., and Seppä, H.: Biotic turnover rates during the Pleistocene-Holocene transition, Quaternary Sci. Rev., 151, 100–110, https://doi.org/10.1016/j.quascirev.2016.09.008, 2016.
Strahl, J.: Zur Pollenstratigraphie des Weichselspätglazials von Berlin-Brandenburg [On the palynostratigraphy of the Late Weichselian in Berlin-Brandenburg], Brand. Geowissensch. Beitr., 12, 87–112, 2005.
Stute, M. and Deak, J.: Environmental isotope study (14C, 13C, 18O, D, noble gases) on deep groundwater circulation systems in Hungary with reference to paleoclimate, Radiocarbon, 31, 902–918, https://doi.org/10.1017/s0033822200012522, 1990.
Svenning, J., Normand, S., and Kageyama, M.: Glacial refugia of temperate trees in Europe: insights from species distribution modelling, J. Ecol., 96, 1117–1127, https://doi.org/10.1111/j.1365-2745.2008.01422.x, 2008.
Tarasov, P. E., Webb, T., Andreev, A. A., Afanas'eva, N. B., Berezina, N. A., Bezusko, L. G., Blyakharchuk, T. A., Bolikhovskaya, N. S., Cheddadi, R., Chernavskaya, M. M., Chernova, G. M., Dorofeyuk, N. I., Dirksen, V. G., Elina, G. A., Filimonova, L. V., Glebov, F. Z., Guiot, J., Gunova, V. S., Harrison, S. P., Jolly, D., Khomutova, V. I., Kvavadze, E. V., Osipova, I. M., Panova, N. K., Prentice, I. C., Saarse, L., Sevastyanov, D. V., Volkova, V. S., and Zernitskaya, V. P.: Present-day and mid-Holocene biomes reconstructed from pollen and plant macrofossil data from the former Soviet Union and Mongolia, J. Biogeogr., 25, 1029–1053, https://doi.org/10.1046/j.1365-2699.1998.00236.x, 1998.
Tarasov, P. E., Volkova, V. S., Webb, T., Guiot, J., Andreev, A. A., Bezusko, L. G., Bezusko, T. V., Bykova, G. V., Dorofeyuk, N. I., Kvavadze, E. V., Osipova, I. M., Panova, N. K., and Sevastyanov, D. V.: Last glacial maximum biomes reconstructed from pollen and plant macrofossil data from northern Eurasia, J. Biogeogr., 27, 609–620, https://doi.org/10.1046/j.1365-2699.2000.00429.x, 2000.
Tarasov, P. E., Andreev, A. A., Anderson, P. M., Lozhkin, A. V., Haltia-Hovi, E., Nowaczyk, N. R., Wennrich, V., Brigham-Grette, J., and Melles, M.: A pollen-based biome reconstruction over the last 3.562 million years in the Far East Russian Arctic e new insights on climate–vegetation relationships at the regional scale, Clim. Past, 9, 2759–2775, https://doi.org/10.5194/cp-9-2759-2013, 2013.
Telford, R. J. and Birks, H. J. B.: Evaluation of transfer functions in spatially structured environments, Quaternary Sci. Rev., 28, 1309–1316, https://doi.org/10.1016/j.quascirev.2008.12.020, 2009.
Tzedakis, P. C., Frogley, M. R., Lawson, I. T., Preece, R. C., Cacho, I., and de Abreu, L. Ecological thresholds and patterns of millennial-scale climate variability: The response of vegetation in Greece during the last glacial period, Geology, 32, 109–112, https://doi.org/10.1130/G20118.1, 2004.
Turner, M. G., Wei, D., Prentice, I. C., and Harrison, S. P.: The impact of methodological decisions on climate reconstructions using WA-PLS, Quatern. Res., 99, 341–356, 2021.
Turon, J-L., Lézine, A-M., and Denèfle, M.: Land-sea correlations for the last glaciation inferred from a pollen and dinocyst record from the portuguese margin, Quaternary Res., 59, 88–96, https://doi.org/10.1016/S0033-5894(02)00018-2, 2003.
Valero-Garcés, B. L., González-Sampériz, P., Navas, A., Machin, J., Delgado-Huertas, A., Pena-Monné, J. L., Sancho-Marcén, C., Stevenson, T., and Davis, B.: Paleohydrological fluctuations and steppe vegetation during the last glacial maximum in the central Ebro valley (NE Spain), Quatern. Int., 122, 43–55, https://doi.org/10.1016/j.quaint.2004.01.030, 2004.
Valsecchi, V., Sanchez Goñi, M. F., and Londeix, L.: Vegetation dynamics in the Northeastern Mediterranean region during the past 23 000 yr: Insights from a new pollen record from the Sea of Marmara, Clim. Past, 8, 1941–1956, https://doi.org/10.5194/cp-8-1941-2012, 2012.
van Zeist, W. and Bottema, S. Palynological investigations in Western Iran, Palaeohistoria 19, 19–85, ISSN 0552-9344, 1977.
Vandenberghe, J., French, H. M., Gorbunov, A., Marchenko, S., Velichko, A. A., Jin, H., Cui, Z., Zhang, T., and Wan, X.: The Last Permafrost Maximum (LPM) map of the Northern Hemisphere: Permafrost extent and mean annual air temperatures, 25–17 ka BP, Boreas, 43, 652–666, https://doi.org/10.1111/bor.12070, 2014.
Varsányi, I., Palcsu, L., and Kovács, L. Ó.: Groundwater flow system as an archive of palaeotemperature: Noble gas, radiocarbon, stable isotope and geochemical study in the Pannonian Basin, Hungary, Appl. Geochem., 26, 91–104, https://doi.org/10.1016/j.apgeochem.2010.11.006, 2011.
Vegas, J., Ruiz-Zapata, B., Ortiz, J. E., Galán, L., Torres, T., García-Cortés, Á., Gil-García, M. J., Pérez-González, A., and Gallardo-Millán, J. L.: Identification of arid phases during the last 50 cal. ka BP from the Fuentillejo maar-lacustrine record (Campo de Calatrava Volcanic Field, Spain), J. Quaternary Sci., 25, 1051–1062, https://doi.org/10.1002/jqs.1262, 2010.
Vegas-Vilarrúbia, T., González-Sampériz, P., Morellón, M., Gil-Romera, G., Pérez-Sanz, A., and Valero-Garcés, B.: Diatom and vegetation responses to late glacial and early holocene climate changes at lake estanya (southern pyrenees, NE spain), Palaeogeogr. Palaeoclim. Palaeoecol., 392, 335–349, https://doi.org/10.1016/j.palaeo.2013.09.011, 2013.
Velasquez, P., Kaplan, J. O., Messmer, M., Ludwig, P., and Raible, C. C.: The role of land cover in the climate of glacial Europe, Clim. Past, 17, 1161–1180, https://doi.org/10.5194/cp-17-1161-2021, 2021.
Vicente-Serrano, S. M., Trigo, R. M., López-Moreno, J. I., Liberato, M. L. R., Lorenzo-Lacruz, J., Beguería, S., Morán-Tejeda, E., and El Kenawy, A.: Extreme winter precipitation in the Iberian Peninsula in 2010: Anomalies, driving mechanisms and future projections, Clim. Res., 46, 51–65, https://doi.org/10.3354/cr00977, 2011.
Watts, W. A., Allen, J. R. M., and Huntley, B.: Vegetation history and palaeoclimate of the last glacial period at Lago grande di Monticchio, southern Italy, Quaternary Sci. Rev., 15, 133–153, https://doi.org/10.1016/0277-3791(95)00093-3, 1996.
Williams, J. W. and Jackson, S. T.: Palynological and AVHRR observations of modern vegetational gradients in eastern North America, The Holocene, 4, 485–497, 2003.
Williams, J. W., Webb, T., Shurman, B. N., and Bartlein, P. J.: Do Low CO2 Concentrations Affect Pollen-Based Reconstructions of LGM Climates? A Response to “Physiological Significance of Low Atmospheric CO2 for Plant–Climate Interactions” by Cowling and Sykes, Quatern. Res., 53, 402–404, https://doi.org/10.1006/qres.2000.2131, 2000.
Williams, J. W., Grimm, E. G., Blois, J., Charles, D. F., Davis, E., Goring, S. J., Graham, R., Smith, A. J., Anderson, M., Arroyo-Cabrales, J., Ashworth, A. C., Betancourt, J. L., Bills, B. W., Booth, R. K., Buckland, P., Curry, B., Giesecke, T., Hausmann, S., Jackson, S. T., Latorre, C., Nichols, J., Purdum, T., Roth, R. E., Stryker, M., and Takahara, H.: The Neotoma Paleoecology Database: A multi-proxy, international community-curated data resource, Quatern. Res., 89, 156–177, https://doi.org/10.1017/qua.2017.105, 2018.
Willis, K. J. and Van Andel, T. H.: Trees or no trees? The environments of central and eastern Europe during the Last Glaciation, Quaternary Sci. Rev., 23, 2369–2387, https://doi.org/10.1016/j.quascirev.2004.06.002, 2004.
Wu, H., Guiot, J., Brewer, S., and Guo, Z.: Climatic changes in Eurasia and Africa at the last glacial maximum and mid-Holocene: Reconstruction from pollen data using inverse vegetation modelling, Clim. Dynam., 29, 211–229, https://doi.org/10.1007/s00382-007-0231-3, 2007.
Wu, H., Li, Q., Yu, Y., Sun, A., Lin, Y., Jiang, W., and Luo, Y.: Quantitative climatic reconstruction of the Last Glacial Maximum in China, Sci. China Earth Sci., 62, 1269–1278, https://doi.org/10.1007/s11430-018-9338-3, 2019.
Yu, G. and Harrison, S. P.: Lake status records from Europe: data base documentation, in: NOAA Paleoclimatology Publications Series, NOAA, Boulder, Colorado, https://catalog.data.gov/dataset/noaa-wds-paleoclimatology-lake-status-records-from-europe-data-base-documentation2 (last access: 25 July 2024), 1995.
Zaarur, S., Affek, H. P., and Stein, M.: Last glacial-Holocene temperatures and hydrology of the Sea of Galilee and Hula Valley from clumped isotopes in Melanopsis shells, Geochim. Cosmochim. Ac., 179, 142–155, https://doi.org/10.1016/j.gca.2015.12.034, 2016.
Zanon, M., Davis, B. A. S., Marquer, L., Brewer, S., and Kaplan, J. O.: European forest cover during the past 12,000 years: A palynological reconstruction based on modern analogs and remote sensing, Front. Plant Sci., 9, 253, https://doi.org/10.3389/fpls.2018.00253, 2018.
Zech, M., Buggle, B., Leiber, K., Marković, S., Glaser, B., Hambach, U., Huwe, B., Stevens, T., Sümegi, P., Wiesenberg, G., and Zöller, L.: Reconstructing Quaternary vegetation history in the Carpathian Basin, SE-Europe, using n-alkane biomarkers as molecular fossils: Problems and possible solutions, potential and limitations, Quaternary Sci. J., 58, 148–155, https://doi.org/10.3285/eg.58.2.03, 2010.