the Creative Commons Attribution 4.0 License.
the Creative Commons Attribution 4.0 License.
 | 28 Aug 2024
Late Quaternary glacial maxima in southern Patagonia: insights from the Lago Argentino glacier lobe
Shanti B. Penprase
Maximillian S. Van Wyk de Vries
Andrew D. Wickert
Andrew G. Jones
Shaun A. Marcott
Jorge A. Strelin
Mateo A. Martini
Tammy M. Rittenour
Guido Brignone
Mark D. Shapley
Emi Ito
Kelly R. MacGregor
Marc W. Caffee
Determining the timing and extent of Quaternary glaciations around the globe is critical to understanding the drivers behind climate change and glacier fluctuations. Evidence from the southern mid-latitudes indicates that local glacial maxima preceded the global Last Glacial Maximum (LGM), implying that feedbacks in the climate system or ice dynamics played a role beyond the underlying orbital forcings. To shed light on these processes, we investigated the glacial landforms shaped and deposited by the Lago Argentino glacier (50° S), an outlet lobe of the former Patagonian Ice Sheet, in southern Argentina. We mapped geomorphological features on the landscape and dated moraine boulders and outwash sediments using 10Be cosmogenic nuclides and feldspar infrared stimulated luminescence (IRSL) to constrain the chronology of glacial advance and retreat. We report that the Lago Argentino glacier lobe reached more extensive limits prior to the global LGM, advancing during the middle to late Pleistocene between 243–132 ka and during Marine Isotope Stage 3 (MIS 3), culminating at 44.5 ± 8.0 and at 36.6 ± 1.0 ka. Our results indicate that the most extensive advance of the last glacial cycle occurred during MIS 3, and we hypothesize that this was a result of longer and colder winters, as well as increased precipitation delivered by a latitudinal migration of the Southern Westerly Winds belt, highlighting the role of local and regional climate feedbacks in modulating ice mass changes in the southern mid-latitudes.
Please read the corrigendum first before continuing.
-
Notice on corrigendum
The requested paper has a corresponding corrigendum published. Please read the corrigendum first before downloading the article.
-
Article
(12330 KB)
- Corrigendum
-
Supplement
(1944 KB)
-
The requested paper has a corresponding corrigendum published. Please read the corrigendum first before downloading the article.
- Article
(12330 KB) - Full-text XML
- Corrigendum
-
Supplement
(1944 KB) - BibTeX
- EndNote


Unraveling the timing of continental ice sheet growth and decay is crucial for determining glacier response to climate forcings and feedbacks within the Earth's system. However, our understanding of the climatic drivers behind global glacier change is limited by the availability of highly resolved past glacial records. For instance, Northern Hemisphere insolation intensity has been proposed to pace the climate of the Southern Hemisphere during the last million years, implying synchronous ice sheet growth and decay across hemispheres every ∼ 100 ka, coincident with the eccentricity cycles of the Earth's orbit (Abe-Ouchi et al., 2013; Hays et al., 1976; Imbrie et al., 1993). Nonetheless, evidence indicates that glaciers in mid to high latitudes in the Southern Hemisphere expanded prior to the global Last Glacial Maximum (LGM, 26.5–19 ka; Clark et al., 2009), suggesting that other mechanisms, apart from the underlying orbital parameters, could have played a role in inducing pre-LGM glacier growth, such as local ice dynamics, ocean–atmosphere interactions, and latitudinal shift of the Southern Westerly Winds (SWW; Fig. 1a; Darvill et al., 2015, 2016; Denton et al., 2021; Doughty et al., 2015; García et al., 2018; Hall et al., 2020; Mendelová et al., 2020; Shulmeister et al., 2019).
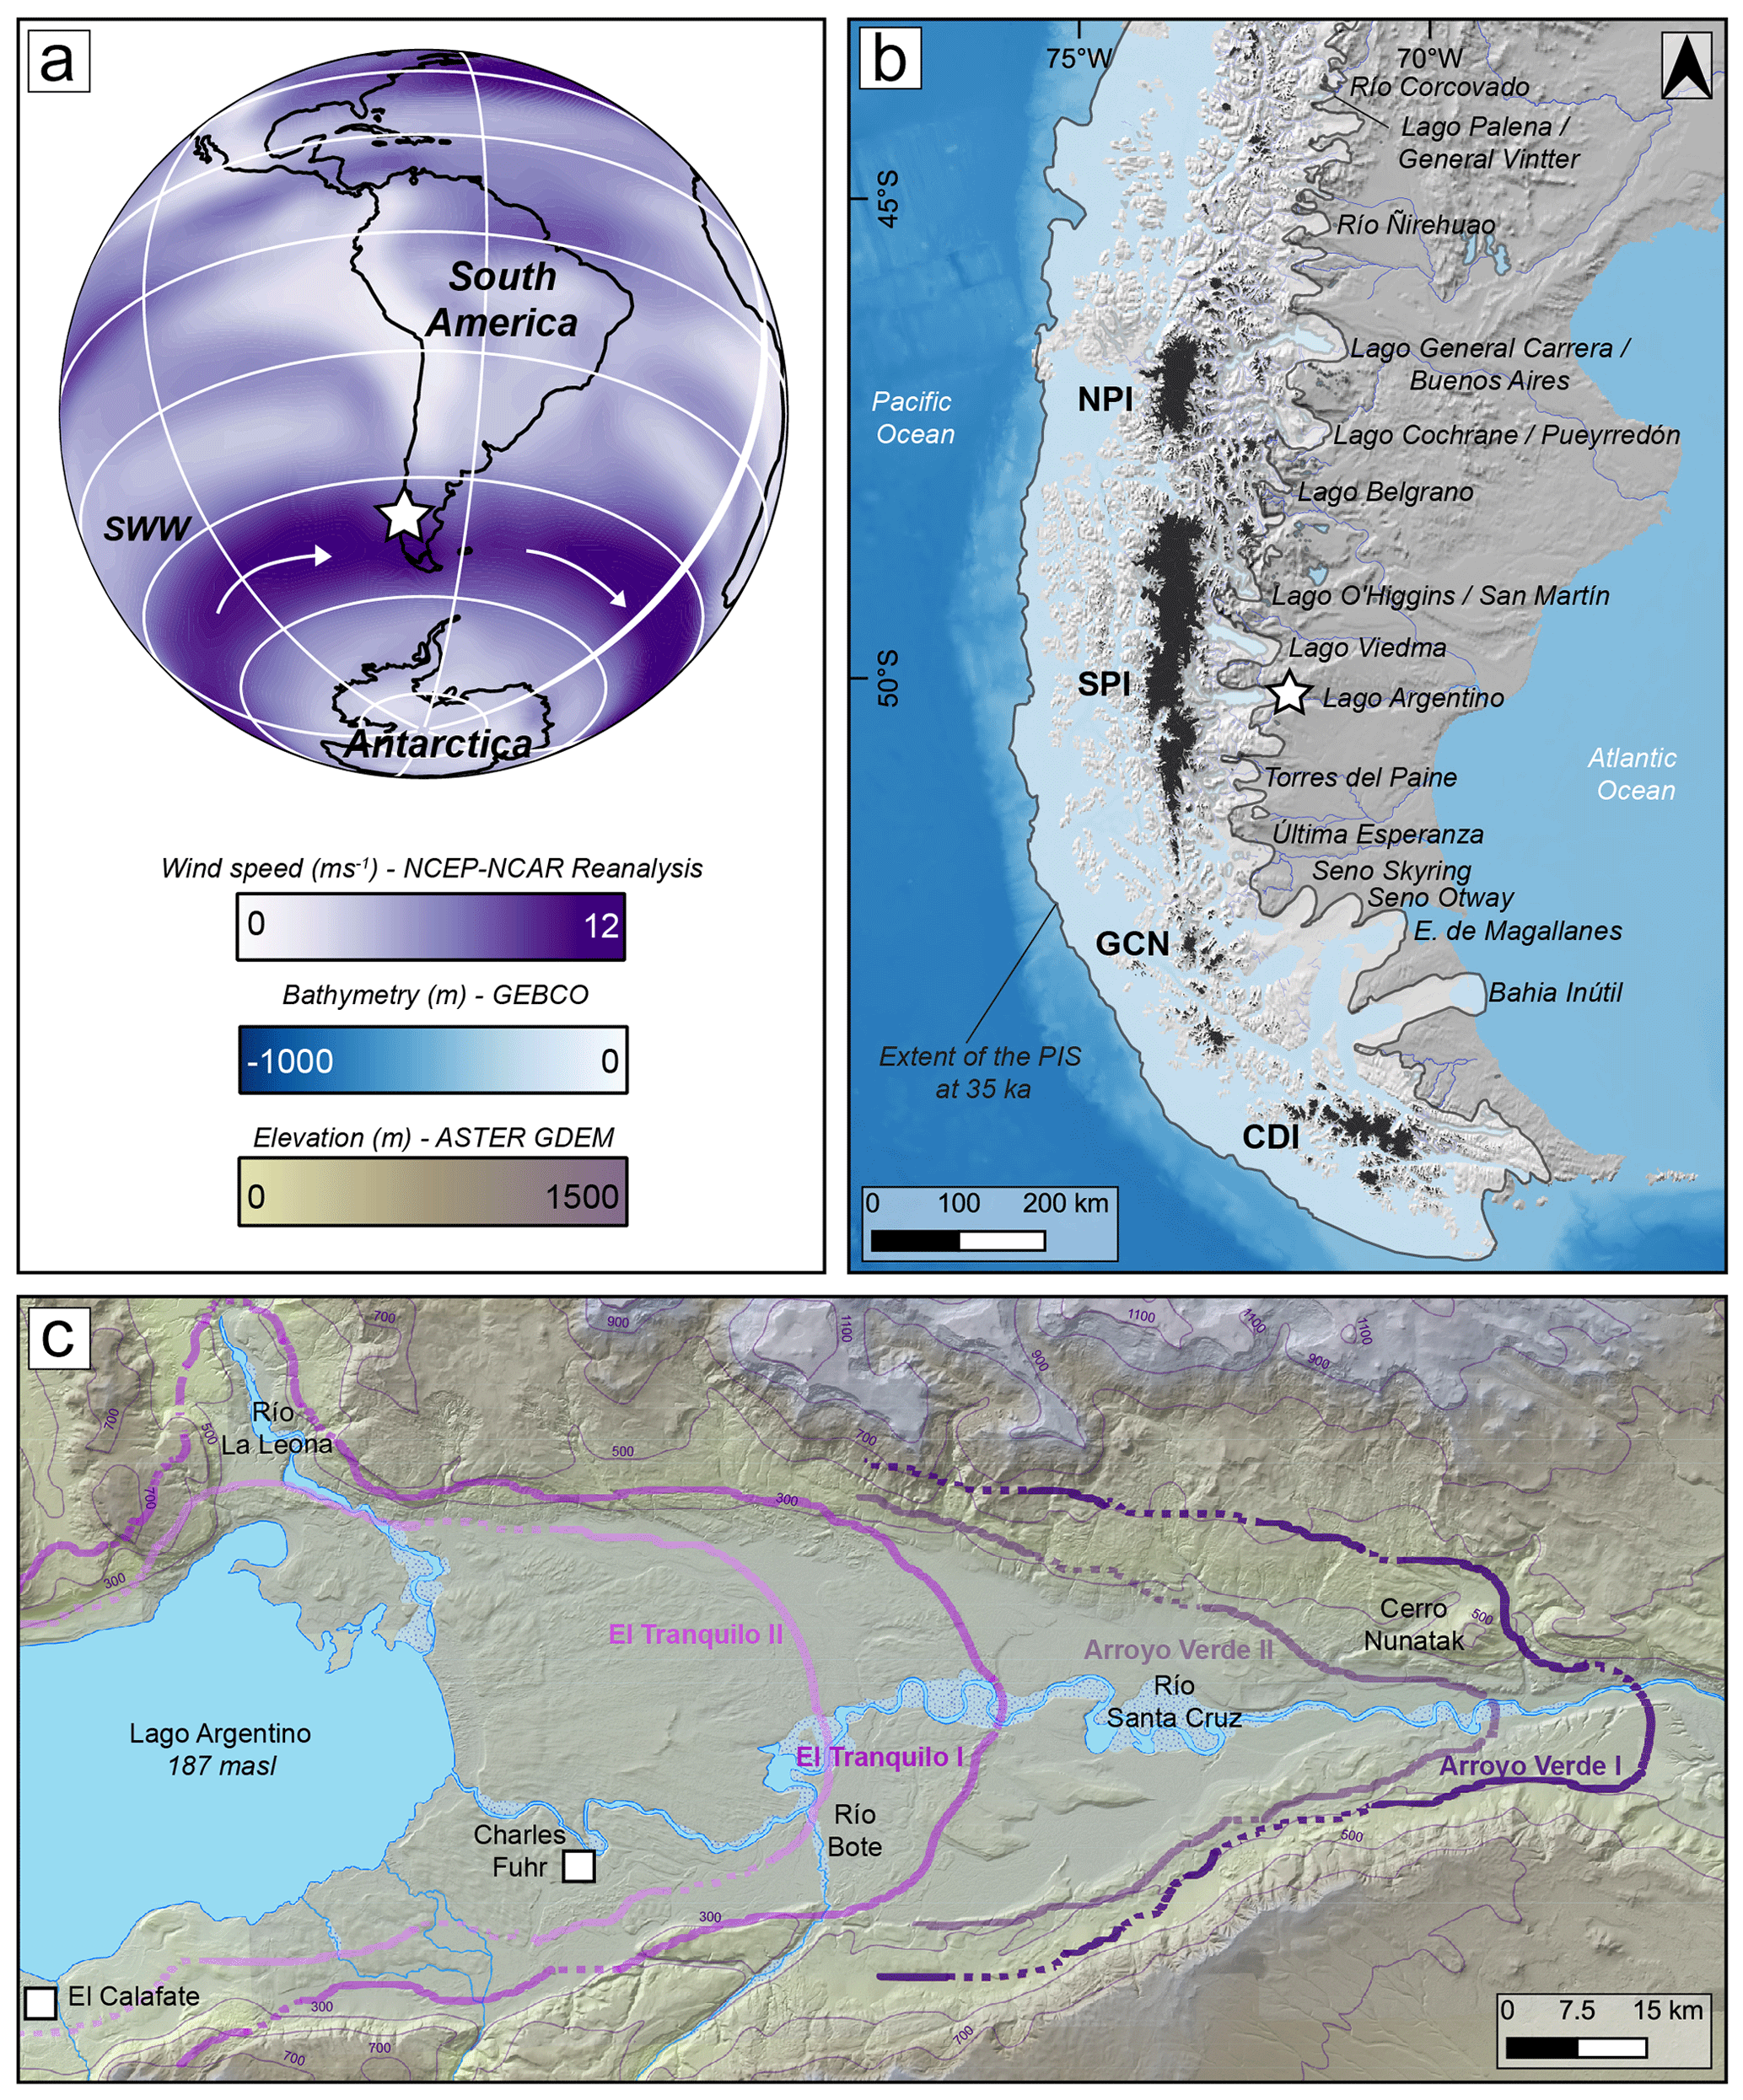
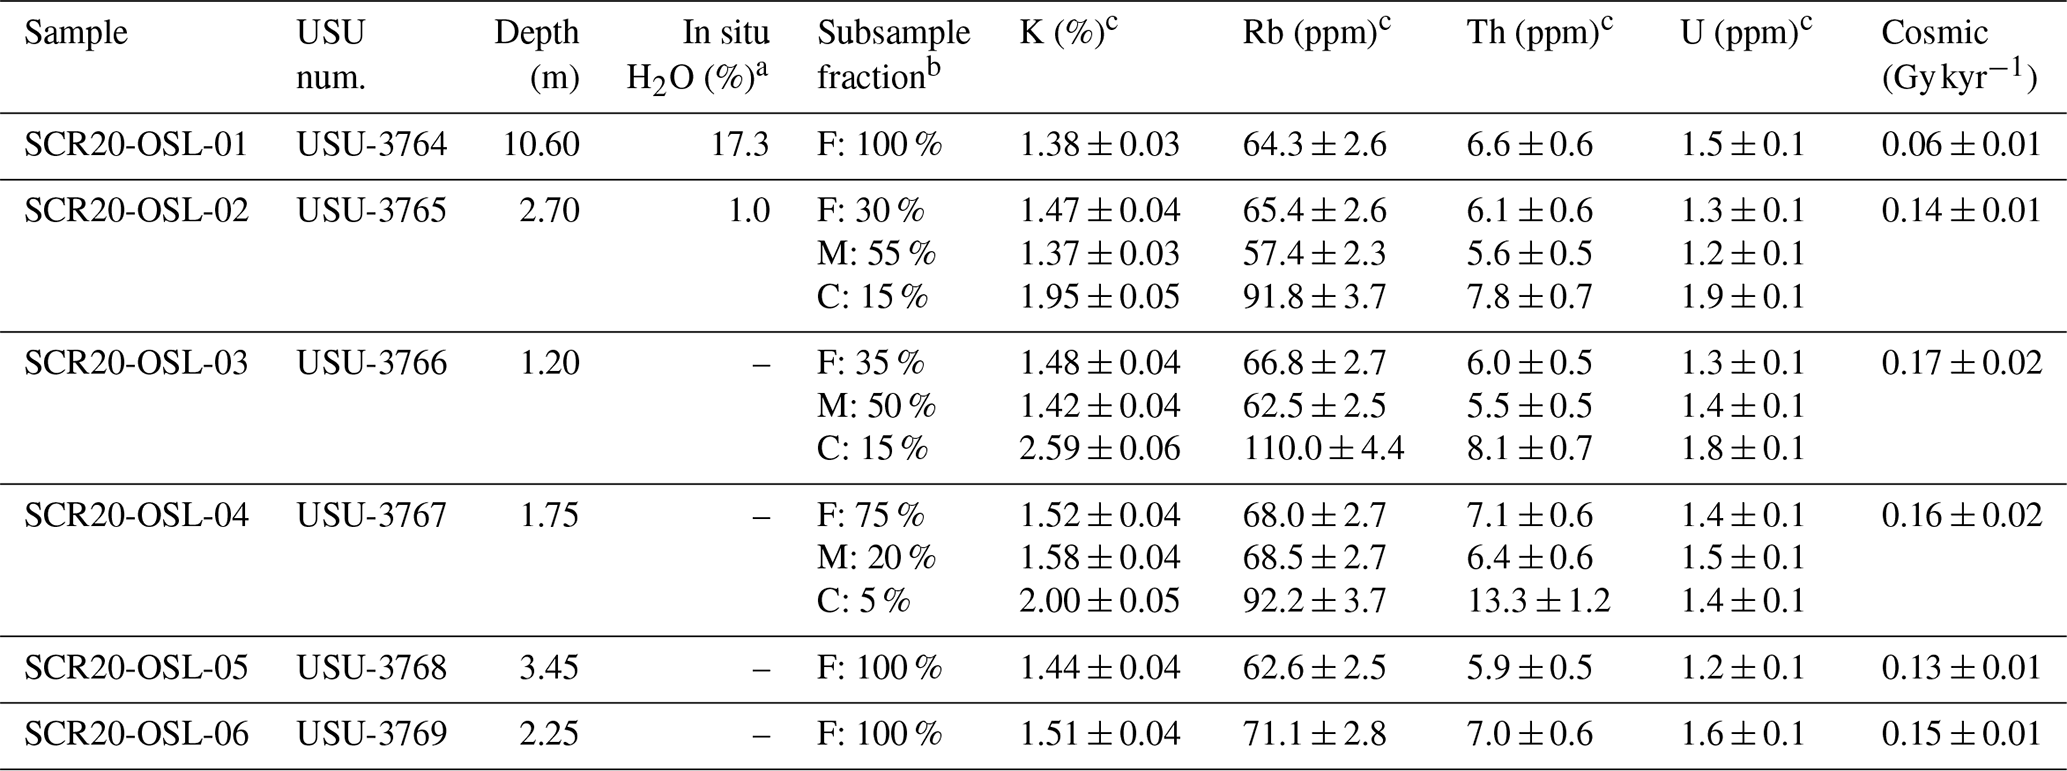
Figure 1(a) Location of study site in a hemispheric context along with Southern Westerly Winds (SWW) depicted by wind speed data at 850 mb from the NCEP-NCAR Reanalysis 1 after Kalnay et al. (1996). (b) Ice extent of the former Patagonian Ice Sheet (PIS) at 35 ka (Davies et al., 2020) along with major outlet lobes, topographic hillshade after the ETOPO Global Relief Model (NOAA), bathymetry data from the General Bathymetric Chart of the Oceans (GEBCO), and ice bodies: Northern Patagonian Ice Field (NPI), Southern Patagonian Ice Field (SPI), Gran Campo Nevado (GCN), and Cordillera Darwin Ice Field (CDI). The white star denotes the location of the study site (Lago Argentino glacier lobe). (c) Digital elevation model (DEM) of the upper basin of Río Santa Cruz located eastward of Lago Argentino, available from the Instituto Geográfico Nacional of Argentina (IGN). Shades of purple indicate the defined (solid lines) and inferred (dashed lines) of the middle to late Pleistocene glaciation limits (Strelin and Malagnino, 1996, 2009).
Since glacial chronologies are necessary to determine the timing and occurrence of glacial expansions and recessions, dating glacial deposits provides a first-order constraint on past glacier fluctuations. In South America, evidence indicates that the Patagonian Ice Sheet (PIS) expanded during the last glacial cycle (115–11.7 ka; Hughes et al., 2013), reaching its maximum extent between 35–28 ka in northern sites and around 47 ka in southern sites (Davies et al., 2020). The PIS formed a continuous ice sheet along the spine of the Andean Cordillera from 38 to 55° S (Fig. 1b), with a sea level equivalent of approximately 1.5 m (Davies et al., 2020; Hulton et al., 2002)
Lago Argentino (Fig. 1b) is located on the eastern flank of the Southern Patagonian Ice Field and constitutes the largest ice-contact lake in the world, with multiple lake-terminating glaciers calving into it (Van Wyk de Vries et al., 2022). Lago Argentino drains to the east into the Río Santa Cruz basin and ultimately the Atlantic Ocean. Given that during the LGM the western margin of the PIS reached the sea (Davies et al., 2020), fewer moraines are preserved in the terrestrial geological record. In contrast, glacial landforms in the arid eastern foreland of the Andes are better preserved due to lower weathering rates, in response to the rain shadow effect imposed by Andean Range (Garreaud et al., 2009), making moraines located in the Argentine steppe more suitable for geochronological dating. Despite well-dated glacial records for the Lago Argentino and Río Santa Cruz basin during the Plio-Pleistocene (Clague et al., 2020; Mercer, 1976; Strelin and Malagnino, 1996; Strelin et al., 1999) as well as during the Late Glacial and Holocene (Kaplan et al., 2011; Strelin et al., 2011, 2014), the middle to late Pleistocene glacial history of the Lago Argentino glacier lobe, an outlet lobe of the former PIS, remains largely unstudied.
To fill this data gap on the age and extent of the Lago Argentino glacier lobe for the remainder of the Pleistocene and to improve the understanding of glacial cycles in the Southern Hemisphere during this period, we produce a new highly resolved geomorphological map of the upper basin of the Río Santa Cruz, date moraine crest boulders with cosmogenic nuclide surface exposure dating, and date proglacial outwash using feldspar infrared stimulated luminescence (IRSL). We report the extent of the Lago Argentino glacier lobe during the late Quaternary and show that the maximum ice extent during the last glacial cycle occurred during Marine Isotope Stage 3 (MIS 3; 57–29 ka; Lisiecki and Raymo, 2005), preceding the Northern Hemisphere glacial maximum that occurred during MIS 2 (MIS 2; 29–14 ka; Lisiecki and Raymo, 2005). Therefore, this dataset highlights the PIS sensitivity to local and regional climate feedbacks and provides an improved understanding of the landscape evolution of the Lago Argentino basin during the Pleistocene.
2.1 Physical setting
The Río Santa Cruz valley (∼ 50° S) runs ∼ 250 km from the easternmost end of Lago Argentino to the Atlantic Ocean. Late Miocene to early Pliocene basaltic plateaus bound it to the north and south (Ramos and Kay, 1992). These plateaus are underlain by early to middle Mesozoic marine and fluvial sedimentary successions (Casadio et al., 2000; Goyanes and Massabie, 2015). The upper sector of this valley consists of a broad plain (Fig. 1c) that narrows ∼ 65 km east of the lake's margin, where glacial landforms are present (Strelin and Malagnino, 1996).
The drainage basin surface area is about 30 × 103 km2, where river length is ∼ 385 km with a maximum modern water discharge of ∼ 1200 m3 s−1 in March, while minimum discharge values are measured in September (∼ 300 m3 s−1, Pasquini et al., 2021). Discharge has increased in the Lago Argentino basin throughout the 21st century due to rapid and accelerating ice loss on the eastern flank of the ice fields (Van Wyk De Vries et al., 2023). The SWW deliver the bulk of the precipitation from the west in a predominant SW–NE direction (Fig. 1a), with greater summer intensity (Garreaud et al., 2009). In a similar seasonal fashion, ice melt rates and glacier velocity reach their maximum during the summer (Minowa et al., 2017, 2021; Mouginot and Rignot, 2015). Precipitation is abundant on the west of the Andean range and reaches annual values of between 5000–10 000 mm, but the semiarid terrain around Lago Argentino receives less than 200 mm yr−1 (Garreaud et al., 2013; Lenaerts et al., 2014).
2.2 Glacial history and previous studies
Several authors have contributed to the understanding of the local landscape evolution, even though no chronological evidence is available for the middle to late Pleistocene glaciations. During his journey to South America, Darwin (1842) discussed the possible glaciomarine origin of erratic boulders in the Río Santa Cruz basin. The first geomorphological assessment was carried out by Caldenius (1932), who identified four distinct moraine belts and according to their preservation state assigned relative ages based on the Fennoscandian glaciations (De Geer, 1927). Caldenius (1932) named these moraine systems (from eastern outer to western inner) Initioglacial, Daniglacial, Gotiglacial, and Finiglacial.
Based on this framework and new observations, different authors assigned Caldenius' Finiglacial moraines to the Last Glaciation, and the outer moraines complexes to the early and middle Pleistocene glaciations (Feruglio, 1944; Strelin and Malagnino, 1996; Strelin et al., 1999; Strelin and Malagnino, 2009; Rabassa and Clapperton, 1990; Wenzens, 1999, 2005). Mercer (1976) provided one of the first geochronological constraints by dating lava flows overlying glacial deposits, and determined the easternmost glaciations occurred during the Pliocene and early Pleistocene at 3.5–1.5 Ma. These results were supported by additional dating carried out in the vicinity of Lago Viedma and Lago Argentino (Clague et al., 2020).
Strelin and Malagnino (1996, 2009) mapped and described glacial deposits and provided the first geomorphological map with its associated stratigraphy. They proposed that five glaciations occurred in the upper Río Santa Cruz basin and named them (from eastern outer to western inner) Estancia La Fructuosa, Chuñi Aike, Cerro Fortaleza, Arroyo Verde, and El Tranquilo. For this work, we only focus on the Arroyo Verde and El Tranquilo moraines, as identified by Strelin and Malagnino (1996). These authors interpreted that the Lago Argentino glacier lobe deposited the Arroyo Verde I and II moraines at one of the narrowest points of the valley and then the El Tranquilo I and II moraines located closer to the lake's margin (Fig. 1c). Based on a morphostratigraphic approach, they suggested that the Arroyo Verde I and II moraines were deposited during the Penultimate Glaciation and that a large proglacial lake developed after the glacier receded. Later, they suggested that El Tranquilo I and II moraines could have been deposited during the last glacial cycle, but they did not have the geochronology necessary to confirm this. Lastly, Strelin and Malagnino (1996, 2009) suggested that the Lago Argentino glacier lobe readvanced and deposited the Puerto Banderas moraines westwards of El Tranquilo moraines. The latter are known to date from the Antarctic Cold Reversal, deposited about 10 km from the modern ice at ∼ 13 ka (Strelin et al., 2011).
3.1 Geomorphological mapping
We built on previous mapping efforts and geomorphological studies carried out in the vicinity of the upper basin of Río Santa Cruz to create a new, detailed geomorphological map of the Arroyo Verde and El Tranquilo glaciations over an areal extent of ∼ 2000 km2 (Strelin and Malagnino, 1996, 2009; Strelin et al., 1999). We identified landforms remotely using a 5 m resolution aerial-photogrammetry-derived digital elevation model (DEM) provided by the Instituto Geográfico Nacional of Argentina (IGN) and an orthomosaic of the area (pixel = 40 cm). We complemented these using Google Earth satellite imagery. We conducted field validation during 2019 and 2020 to complement the remote sensing and verify initial geomorphological interpretations (Chandler et al., 2018). We assessed glacial land systems by performing sedimentary and stratigraphic logging around the major landforms, and we then manually digitized the geomorphological features using ArcMap 10.5 and QGIS, where we created both polygons and polylines to delineate the landforms. We followed previously published criteria (Cooper et al., 2021; Leger et al., 2020; Mendelová et al., 2020; Peltier et al., 2023; Soteres et al., 2020, 2022), and we classified these features based on their primary depositional environment as ice marginal (e.g., moraines, hummocks), subglacial (e.g., glacial lineations, drumlins), glaciofluvial (e.g., outwash plains), glaciolacustrine, and other non-glacial features (such as modern hydrography). Lastly, we used built-in geospatial tools to derive the count, length, and orientation of the mapped topographic features.
Table 1Geographical and analytical data for the 10Be exposure age calculation of the moraine complexes deposited by the Lago Argentino glacier lobe.
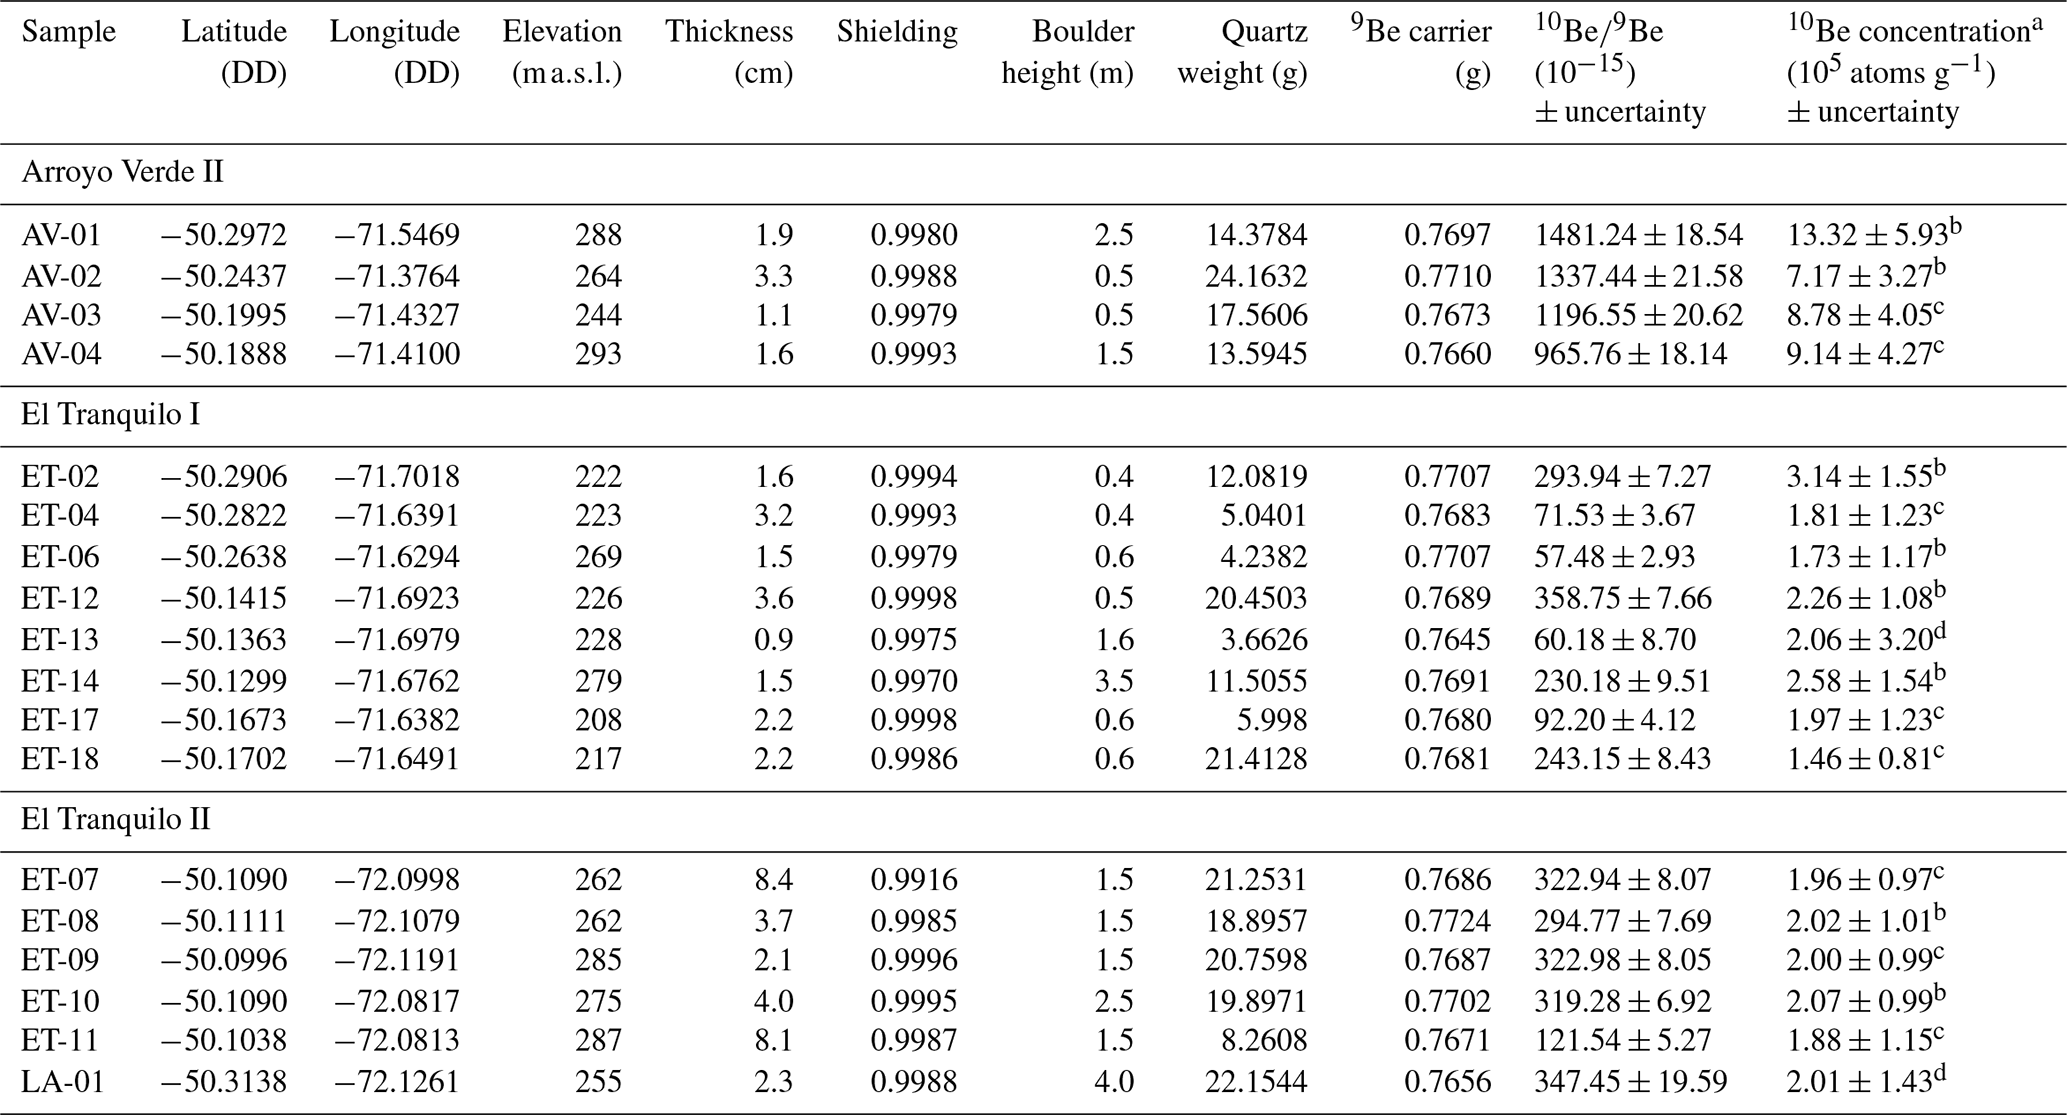
a The 10Be concentrations have been background-corrected from the mean of their process-blank ratios. b The corrections were based on blank values of 1.06, 0.62, and 1.24 × 10⁻¹⁵. c The corrections were based on blank values of 0.77, 0.69, and 0.95 × 10⁻¹⁵. d The corrections were based on blank values of 2.33 and 0.68 × 10⁻¹⁵.
3.2 Geochronological dating
3.2.1 The 10Be cosmogenic nuclide surface exposure dating
We determine the age of moraine abandonment (therefore, culmination of ice advance) by using 10Be cosmogenic nuclide surface exposure dating on moraine boulders. We targeted boulders from the Arroyo Verde and El Tranquilo moraines, as defined by Strelin and Malagnino (1996). We sampled 18 quartz-bearing boulders of 0.5–4 m in height, deposited across three different moraine complexes (i.e., Arroyo Verde II, El Tranquilo I, El Tranquilo II). We targeted subrounded boulders lacking erosional features (e.g., pitting) to avoid removal of nuclides due to post-depositional processes and sampled those exposed on moraine crests. We collected approximately 1.5–2 kg from flat surfaces using a hammer and a chisel. We report the location (latitude, longitude, elevation) of the sampled boulders using a handheld GPS with a vertical uncertainty of < 10 m. We account for topographic shielding using a GIS-based toolbox (Li, 2013, 2018) on the DEMs employed for mapping (see Sect. 3.1). We provide field and analytical information in Table 1.
We processed the samples for 10Be extraction at the University of Wisconsin–Madison following standard laboratory procedures (Ceperley et al., 2020; Jones et al., 2023) using a 9Be carrier solution prepared from raw beryl (OSU White, 9Be concentration = 251.6 ± 0.9 ppm; Marcott, 2011). The ratios were measured at the Purdue University Rare Isotope Measurement Laboratory (PRIME Lab) and normalized to standard 07KNSTD, which has an assumed ratio of 2.85 × 10¹² (Nishiizumi et al., 2007). Lastly, we background-corrected the 10Be concentrations with batch-specific blank values (Tables 1 and S2 in the Supplement).
Table 2The 10Be ages with 1σ internal and external uncertainties according to the different scaling schemes: LSDn (Lifton et al., 2014), St (Stone, 2000; Lal, 1991), and Lm (Stone, 2000; Lal, 1991). We report mean moraine age and standard deviation, the weighted mean and standard deviation, and outliers (∗).
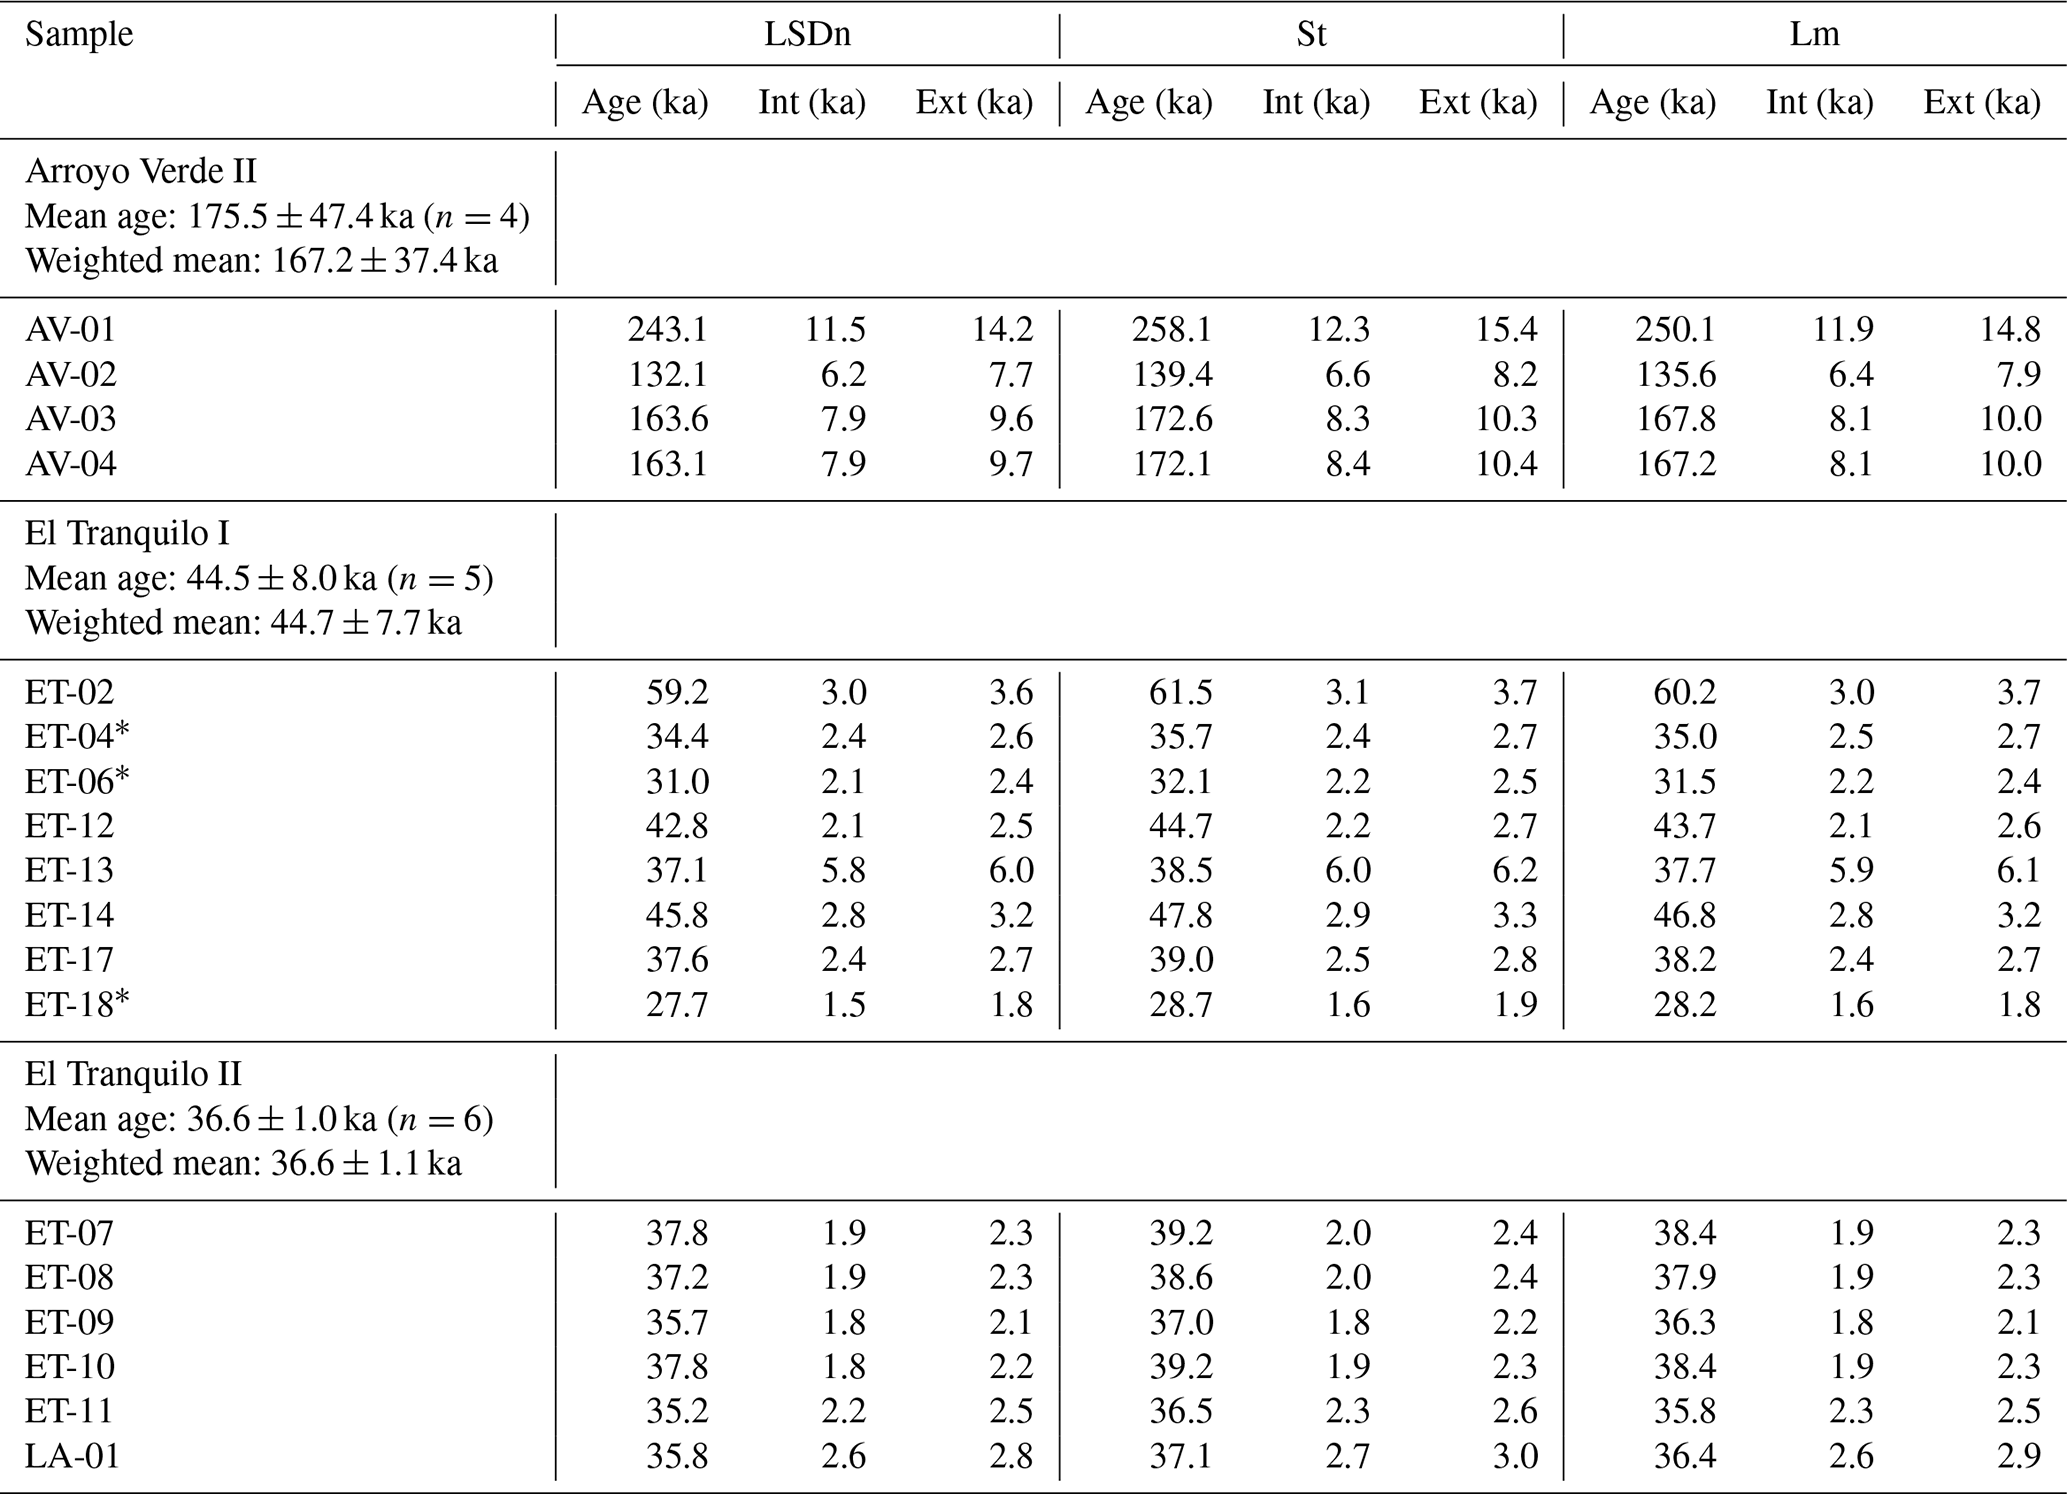
We calculated exposure ages using Version 3 of the CRONUS-Earth online calculator (last accessed: 20 October 2023; Balco et al., 2008), employing a local production rate developed for the Late Glacial chronology at Lago Argentino (3.71 ± 0.11 ; Kaplan et al., 2011). We did not apply snow correction to our ages given the low precipitation levels in the area today, and we considered a rock density of 2.65 g cm−3. As part of a sensitivity test, we calculated the ages with different erosion rates for all landforms, ranging from 0.2–1.4 mm ka−1 according to Douglass et al. (2006) and Kaplan et al. (2005), respectively, with the latter representing a maximum erosion rate. Since the outcomes of using different erosion rates (Table S1 in the Supplement and Fig. S6) do not change the main results of this work and given that age differences overlap within analytical uncertainties, we use an erosion rate equivalent to zero for all the samples for our reported ages and interpretations. Here, we report the calculated ages using the time-dependent scaling (Lm: Lal, 1991; Stone, 2000), the non-time-dependent scaling (St: Stone, 2000; Lal, 1991), and the LSDn scaling scheme developed by Lifton et al. (2014). Even though we account for different scaling schemes listed in Table 2, the choice of the scaling scheme (LSDn) does not impact our interpretations. We report the age of each moraine complex in the text as the computed mean and standard deviation (Table 2). Lastly, we employ the iceTEA toolbox to plot age distribution and to identify outliers (Jones et al., 2019).
Table 3Infrared stimulated luminescence (IRSL) age information.
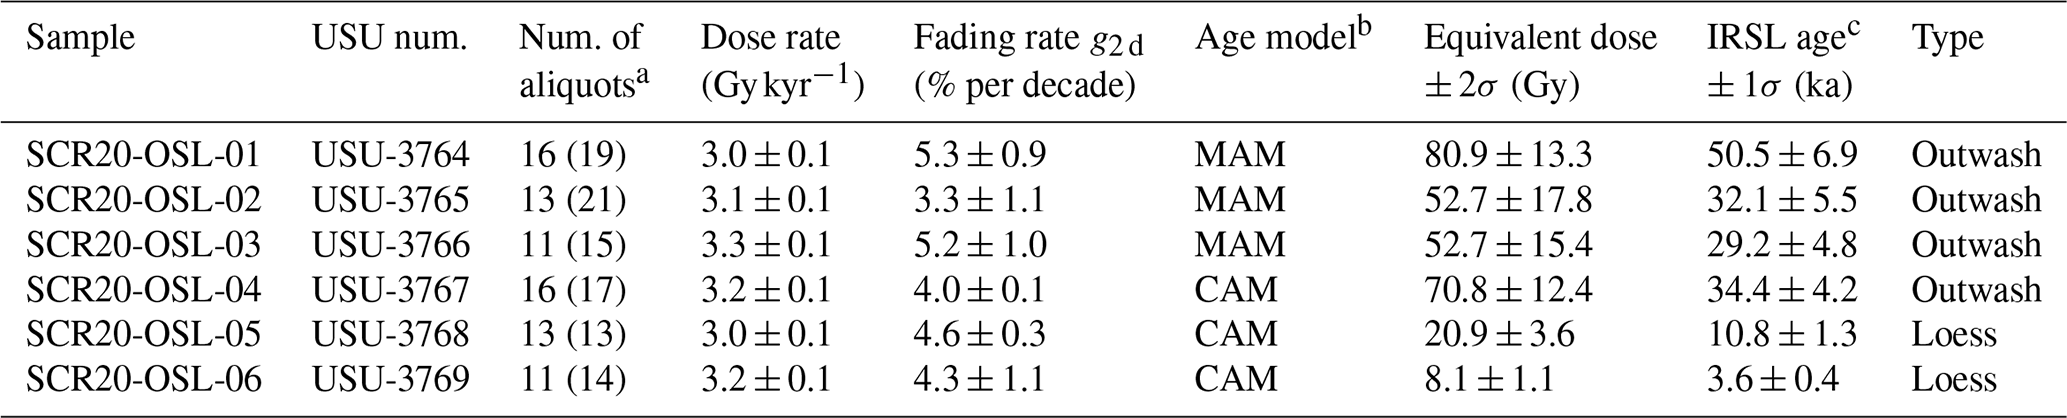
a Age analysis using the single-aliquot regenerative-dose procedure of Wallinga et al. (2000) on 1–2 mm small-aliquots of feldspar sand (150–250 µm) at 50 °C IRSL. Number of aliquots used in age calculation and number of aliquots analyzed in parentheses. b Equivalent dose (DE) and IRSL age calculated using the central age model (CAM) or minimum age model (MAM) of Galbraith and Roberts (2012). c IRSL age on each aliquot corrected for fading following the method by Auclair et al. (2003) correction model of Huntley and Lamothe (2001).
Table 4Dose rate information.
a Assumed 5 ± 2 % for moisture content in dose rate calculation for all samples. b Dose rate subsamples based on grain size: fine (F, < 1.7 mm), medium (M, 1.7–16 mm), coarse (C, > 16 mm), and weighted proportions (%) of subsamples used with chemistry in gamma dose rate calculation. Beta dose rate uses chemistry from fine fraction (< 1.7 mm) only when F is > 50 %. c Radioelemental concentrations determined using ICP-MS and ICP-AES techniques; dose rate is derived from concentrations by conversion factors from Guérin et al. (2011). Grain-size-based internal beta dose rate determined assuming 12.5 % K and 400 ppm Rb using Mejdahl (1979). Alpha contribution to dose rate determined using an efficiency factor, or “a value”, of 0.09 ± 0.01 after Rees-Jones (1995).
3.2.2 Feldspar infrared stimulated luminescence (IRSL) dating
We collected four proglacial sediment samples and two loess samples to date the timing of outwash and aeolian deposition using infrared stimulated luminescence (IRSL, Tables 3 and S3 in the Supplement). Luminescence approaches, including optically stimulated luminescence (OSL) and IRSL, are well suited to date the timing of deposition and subsequent burial of sediment grains. While other studies in Patagonia have been able to use quartz grains and OSL dating in glaciogenic sediments (Smedley et al., 2016), due to poor quartz quality and paucity of the local lithology of Río Santa Cruz, we used feldspar grains and IRSL to date these sediments, as previously performed in other glacial settings in Patagonia (Blomdin et al., 2012). We carried out sample collection according to established field procedures published by Nelson et al. (2015) using opaque aluminum tubes, opaque plastic caps, and a rubber mallet. We processed the samples at Utah State University Luminescence Laboratory following standard procedures involving sieving to 150–250 µm, HCl and H2O2 treatments to remove carbonates and organics, and heavy mineral separation at 2.58 g cm−3 with no HF pre-treatment to isolate the potassium-rich feldspar component. The IRSL signal was measured on 1–2 mm aliquots (∼ 20–50 grains) at 50 °C according to the single-aliquot regenerative-dose (SAR) procedures for potassium feldspar dating (Wallinga et al., 2000). Measurements were performed on Risø TL/OSL Model DA-20 readers with infrared light-emitting diodes (LEDs, 870 ± 40 nm, ∼ 120 mW cm−2) and signals were detected through a blue filter pack of 2 and 4 mm thick filters (BG-39 and Corning 7-39, respectively). IRSL ages were corrected for fading (loss of signal with time; Huntley and Lamothe, 2001; Auclair et al., 2003) and reported using the central and minimum age models (CAM and MAM; Galbraith and Roberts, 2012) based on skew in the aliquot data indicative of partial bleaching (see Fig. S7 in the Supplement for radial plots). Samples for dose rate determination were collected in sediments surrounding the sample tube and analyzed for elemental concentration using ICP-MS and ICP-AES techniques. These concentration values were converted to dose rate following the conversion factors of Guérin et al. (2011) and beta attenuation values of Brennan (2003) using the DRAC online dose rate calculator (Durcan et al., 2015). The beta dose included contribution from 12.5 % internal potassium and 400 ppm Rb and an a value of 0.086. Contribution of cosmic radiation to the dose rate was calculated using sample depth, elevation, and latitude–longitude following Prescott and Hutton (1994). Total dose rates were calculated based on water content, radioisotope concentrations, and cosmic contribution (Table 4).
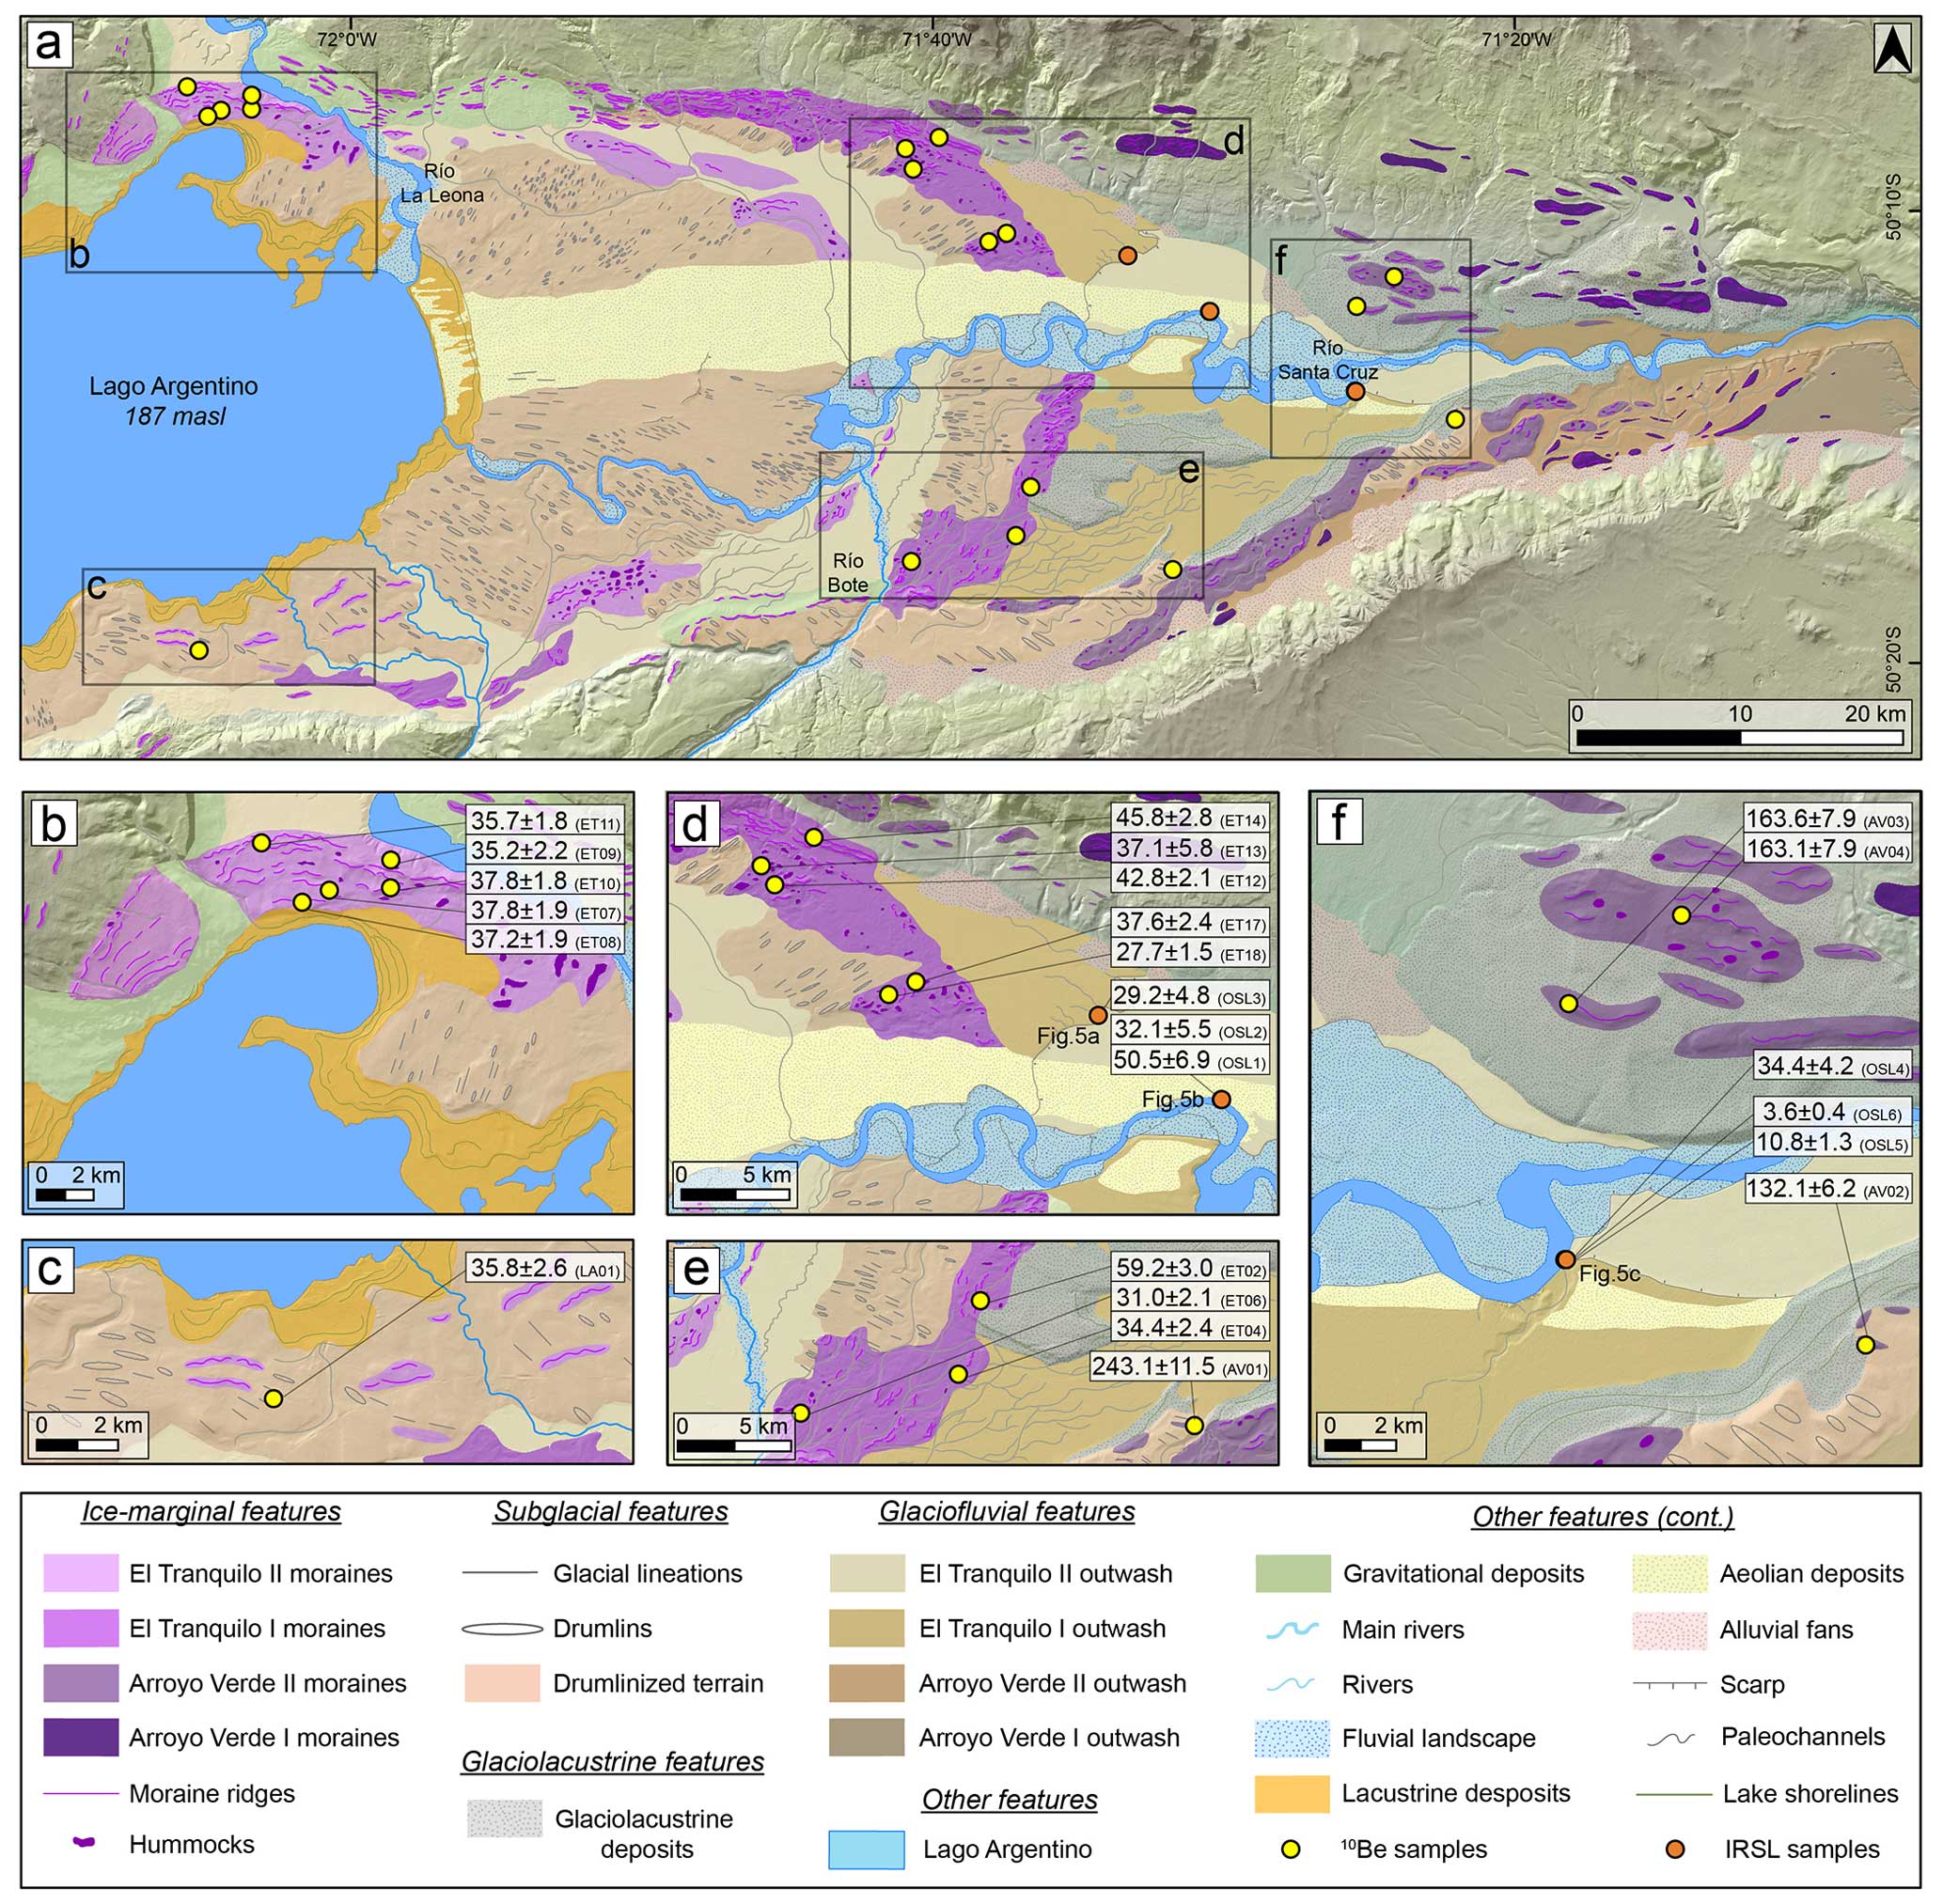
Figure 2(a) Quaternary geomorphological map of the main glacial landforms in the upper Río Santa Cruz basin (Fig. 1c) including ice marginal (moraines, hummocks), subglacial (drumlins, lineations), glaciolacustrine, glaciofluvial (outwash plains), and other features. Panels (b–f) are close-up views of the mapped landforms along with geochronological results denoting the age in thousands of years (kilo annum, ka) with 1σ analytical uncertainty of the boulder sampled (yellow circles). Luminescence samples (orange circles) are associated with their corresponding profile in Fig. 5.
4.1 Geomorphological mapping
4.1.1 Ice marginal features – moraine complexes
We mapped and defined moraine complexes as confined areas of positive relief with curved and continuous shapes composed of moraine ridges and hummocks (Leger et al., 2020) that are separated from each other by outwash plains (Peltier et al., 2023). Moraine ridges are recognized as linear-to-curved high-relief glaciogenic landforms that exhibit a break in slope, while hummocks are subrounded to rounded mounds (Leger et al., 2020). We identified four major moraine complexes in the upper Río Santa Cruz valley (Figs. 2, S1, S2), i.e., Arroyo Verde I, Arroyo Verde II, El Tranquilo I, and El Tranquilo II, that indicate the former position of the Lago Argentino glacier lobe (Strelin and Malagnino, 1996, 2009).
The Arroyo Verde I moraines are located at one of the easternmost edges of the upper basin of the Río Santa Cruz, where the valley reaches its narrowest point, following a discontinuous semicircular pattern. Numerous moraine crests reach elevations between 270 and 350 m in the southeastern margin, while they can be recognized in the northeastern margin up to 450 m at the flanks of Cerro Nunatak and about 500 m in the northwest, close to Río La Leona basin (Fig. 1c). The moraines are less well preserved on the valley slopes, where mass wasting deposits are widespread. The frontal margin of the Arroyo Verde II moraines is located ∼ 10 km west of the Arroyo Verde I moraines and comprises multiple ridges and low-relief hummocks (∼ 10 m).
The El Tranquilo I moraines are located about 20 km to the west of the Arroyo Verde II moraines and form a quasi-continuous and semicircular pattern comprised of several moraine ridges and abundant low-relief hummocks (5–10 m) in the frontal portion. These deposits are well developed and reach elevations up to 400 m in the northern margin, compared to less-developed moraines that reach elevations below 300 m in the southern margin. Lastly, El Tranquilo II moraines are located ∼ 10 km inboard of the El Tranquilo I moraines, separated by an extensive outwash plain in the central portion of the valley. Here, these moraines exhibit low-gradient and low-relief surfaces and are intersected by alluvial fans and paleochannels. They are found partially covered by an extensive aeolian sediment field. This moraine complex is better developed at the northern margin of the Lago Argentino, where several lateral ridges are evident, but it is less preserved in the southern margin.
4.1.2 Subglacial features
We defined drumlinized terrains as diffused areas that contain linear features indicative of ice flow direction (Soteres et al., 2020). We identified and mapped over 600 subglacial features, including drumlins (linear depositional landforms with oval or ellipsoidal shapes) and glacial lineations (linear and narrow depositional landforms) inboard of the main moraine complexes (Leger et al., 2020), with a mean length of 372 m (Figs. 2, S2, S3). The drumlin field is extensive in the center of the valley, particularly inboard of the El Tranquilo II moraines, where it exhibits a fan-like distribution parallel to the direction of ice flow, with a predominantly W–E orientation for the longest axis and an additional NW–SE component (Fig. S2).
4.1.3 Glaciofluvial features
We identified outwash plains as extensive low-gradient proglacial surfaces composed of sands and rounded gravels (Soteres et al., 2020) and associated them with their corresponding moraine complexes, following the framework established by Strelin and Malagnino (1996). While the Arroyo Verde glaciofluvials are located at eastern sites and at higher elevations, the El Tranquilo outwash plains are widespread in the center of the valley at elevations between 180–200 m with low-gradient slopes (∼ 0.3 % to 1 %). Notably, the El Tranquilo I outwash is located outboard of its corresponding moraine complex, whereas the El Tranquilo II outwash is found outboard of both moraine complexes. Strelin and Malagnino (1996) indicated that El Tranquilo I outwash was incised by glacial meltwater and later refilled by El Tranquilo II outwash. Additionally, abundant paleochannels can be traced in the southern margin of the valley, following a braided pattern, as noticeable in the satellite imagery (Figs. 2 and S3). Evidence of former meltwater routing was mapped as paleochannels given their sinuosity, negative relief, and lack of modern drainage (Leger et al., 2020).
4.1.4 Glaciolacustrine features
Glaciolacustrine landforms are mainly found in the center of the valley, outboard of El Tranquilo I moraines, which partially cover the surface of the glaciolacustrine deposits (Fig. 2). Exposed sections show deformed silt-sized sequences with thicknesses reaching up to ∼ 3 m or more. Lacustrine landforms are evident in the southeastern margin of the valley in the form of paleolake shorelines, paleodeltas, and spits. The northeastern margin of the valley also exhibits lacustrine landforms, which are partially covered by moraine ridges and hummocks from the Arroyo Verde II advance. However, these are found in a lesser state of preservation compared to the ones located in the center of the valley. Additionally, we mapped raised (paleo)lacustrine deposits and their (paleo)lake shorelines as continuous landforms with linear and parallel features circling lacustrine deposits that trace the former lake-level surface (Leger et al., 2020). These deposits and features are found on the eastern margin of the lake and in the central part of the valley (Strelin and Malagnino, 1996).
4.1.5 Other features
We identified additional features apart from modern hydrography (major rivers, rivers, lake, fluvial landscape). We recognized alluvial fans based on their fan-like shape, while gravitational deposits were identified based on their bowl-like shape and break in slope (Leger et al., 2020). On the other hand, we mapped scarp surfaces according to their continuous break in slope and the sharp elevation change (Leger et al., 2020). Lastly, aeolian deposits were identified across the landscape during ground-validating fieldwork and mapped on the imagery based on their distinctive lighter colors and their elongated and parallel surface morphology.
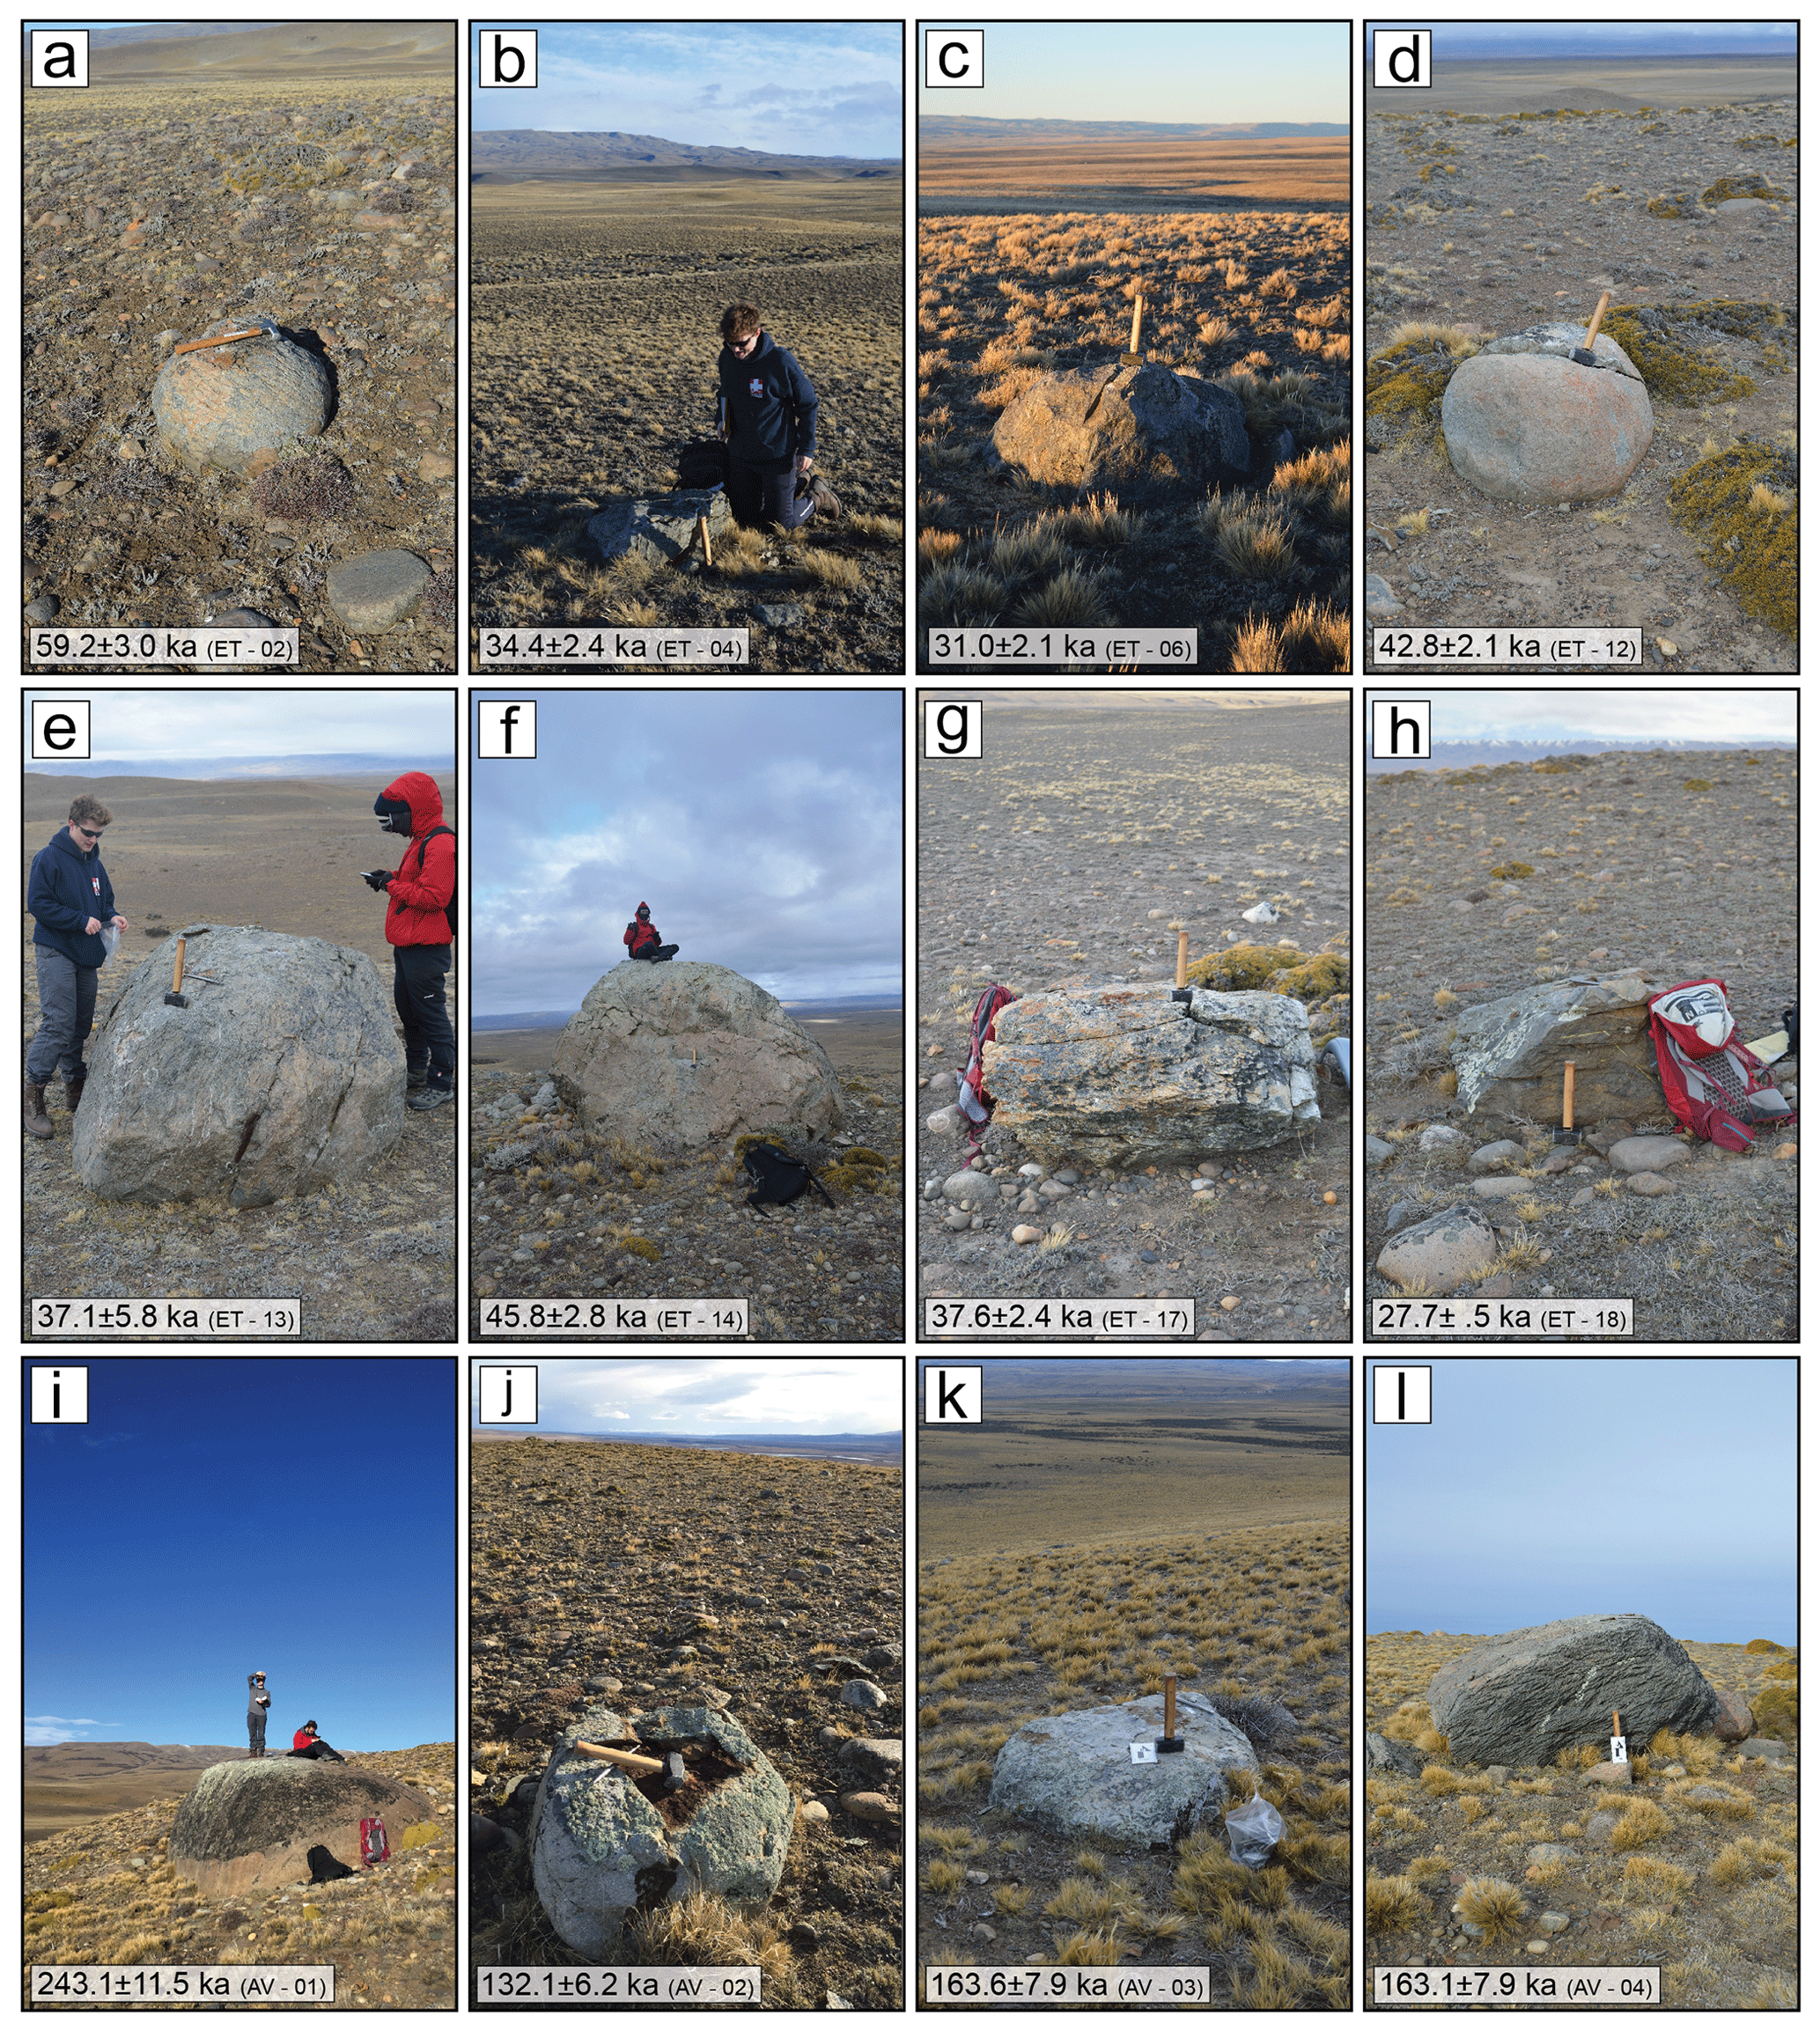
Figure 3Field photos of the sampled boulders for (a–h) El Tranquilo I and (i–l) Arroyo Verde II moraines and their corresponding 10Be exposure ages in thousands of years (ka) with 1σ analytical uncertainty.
Figure 4(a) Aerial view of the El Tranquilo II moraines located at the northeastern margin of Lago Argentino along with the 10Be exposure ages obtained for the sampled boulders in thousands of years (ka) with 1σ analytical uncertainty. (b) On-land view of the El Tranquilo II moraines shown in panel (a). (c–h) Boulders sampled from this moraine complex. Note that sample LA-01 (h) is not pictured in the aerial photo but is part of the same moraine complex.
4.2 Geochronological dating
4.2.1 Arroyo Verde moraines
We sampled four boulders for 10Be exposure dating from the Arroyo Verde II moraine complex (Fig. 3i–l). The lateral moraines are found at both the southern and northern margin of the Río Santa Cruz Valley and constitute the outermost moraine sampled (Fig. 2). Ages range from 243.1 ± 11.5 ka (AV-01) to 132.1 ± 6.24 ka (AV-02) in the southern margin, while samples collected at the northern margin resulted in 163.6 ± 7.85 ka (AV-03) and 163.15 ± 7.9 ka (AV-04).
4.2.2 El Tranquilo moraines
We report a total of 14 10Be cosmogenic nuclide ages from both the outermost and innermost landforms from this moraine complex, El Tranquilo I and El Tranquilo II, respectively (Fig. 2). The eight boulders from El Tranquilo I moraines have ages ranging from 59.2 to 27.7 ka (Fig. 3a–h). Six samples from El Tranquilo II moraines yield a tightly clustered distribution of exposure ages, where the age range is 37.8–35.2 ka.
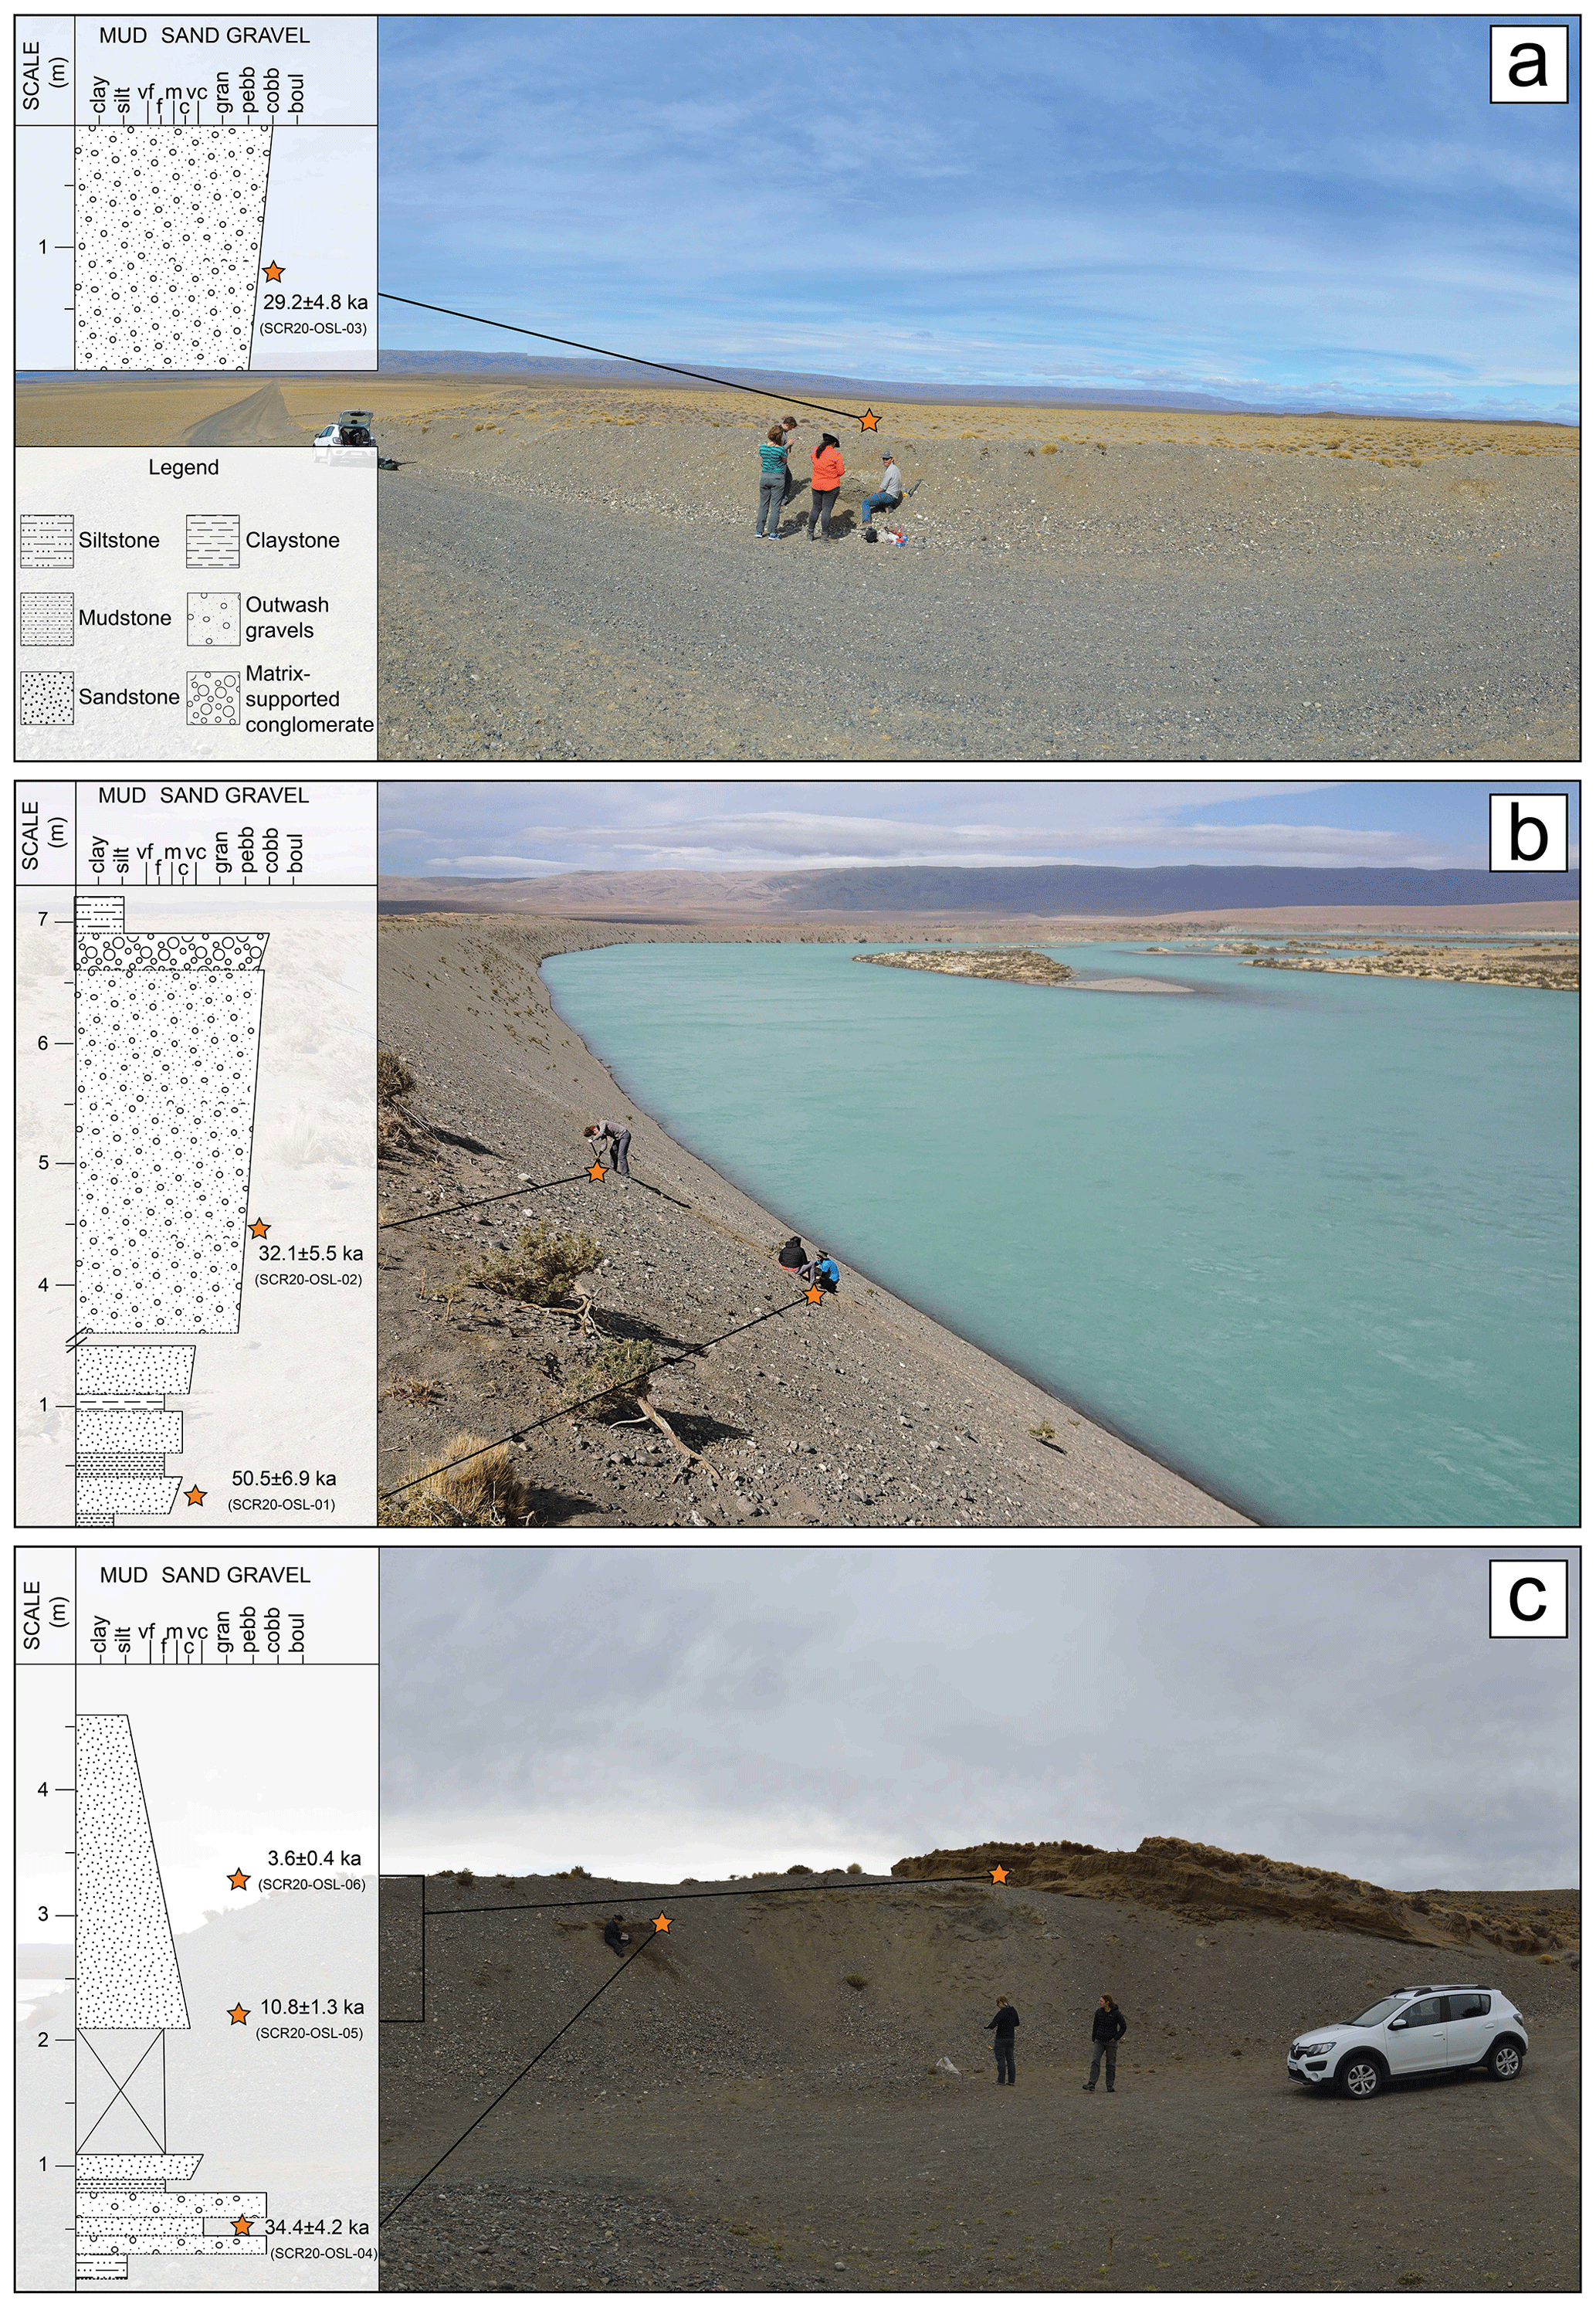
Figure 5Field photos of outwash sediments sampled for IRSL retrieved from the El Tranquilo II outwash plains, along with their sedimentary profiles as follows: (a) outwash profile where the westernmost sample was collected, (b) aggradational sequence at the riverbank where samples SCR20-OSL-01 and 02 were collected, and (c) easternmost section surveyed with sampled outwash and loess deposits.
We sampled sections of the outwash plains for IRSL dating, obtaining four IRSL samples from El Tranquilo II outwash (Figs. 2 and 5a–c). The western sample (Fig. 5a) was collected from a sandy layer within a 1–2 m thick unit of pebble- and cobble-sized gravels and provided an IRSL age of 29.2 ± 4.8 ka (SCR20-OSL-03). Two samples were collected in the central portion of the valley, from an actively eroding riverbank, where a lower unit of fine to coarse sands alternates with fine silts and provides an IRSL age of 50.5 ± 6.9 ka (SCR20-OSL-01). The upper part of this section gives way to a ∼ 3.5 m thick pebble- to cobble-sized outwash deposit that has an IRSL age of 32.1 ± 5.5 ka (SCR20-OSL-02), which is ultimately capped by ∼ 0.5 m thick cobbles and silty aeolian deposits (Fig. 5b). The eastern section is a 1 m thick profile located at the southern margin of the valley (Fig. 5c). The lower part of this section is composed of coarse sands that alternate with pebble-sized gravels that resulted in an IRSL age of 34.4 ± 4.2 ka (SCR20-OSL-04). The upper part of this section is characterized by a ∼ 2.5 m unit containing well-sorted fine sand and silt sediments interpreted as aeolian deposits (loess). The lowermost loess sample yielded an IRSL of 10.8 ± 1.3 ka (SCR20-OSL-05), while the uppermost sample resulted in 3.6 ± 0.4 ka (SCR20-OSL-06).
5.1 Arroyo Verde moraine chronology
Boulder samples from the Arroyo Verde II moraine produced a range of ages. The two boulders located on the northern margin of the valley provided similar 10Be ages (∼ 163 ka: Fig. 3k–l). One boulder south of these provided a younger age of 132.1 ± 6.2 ka (AV-02, Fig. 3j). On the other hand, sample AV-01, located along the southern valley margin and farther up the valley, provided the oldest age (243.1 ± 11.5 ka, Fig. 3i) of the entire dataset.
Although the three younger ages are consistent, they might not record the true age of moraine deposition, so we cannot attribute the deposition of the Arroyo Verde II moraines to a particular Marine Isotope Stage. Boulders from moraine systems older than ∼ 100 ka on the Argentinian steppe are prone to yield younger ages due to exhumation during moraine degradation, sometimes underestimating the age of moraine deposition by a glacial cycle or more (Darvill et al., 2015; Hein et al., 2009, 2011, 2017; Leger et al., 2023; Mendelová et al., 2020). These studies focused on major outlet lobes of the PIS and showed that outwash cobbles from stable proglacial terrace surfaces provide ages closer to the true age of moraine deposition. Relevant to our dataset, exposure ages from cobbles obtained from stable outwash surfaces correlated to the Moreno (Lago Buenos Aires) and Hatcher (Lago Pueyrredón) moraines revealed that they correspond to MIS 8 rather than to MIS 6, as indicated by moraine boulders (Kaplan et al., 2005; Hein et al., 2009, 2017).
Because the above argument suggests that our boulder ages could be minimum-limiting ages on the timing of moraine deposition, we do not exclude the age of sample AV-01 (243 ka) from our age computation. Ultimately, we speculate that this moraine system could have been deposited during MIS 6 (191–130 ka; Lisiecki and Raymo, 2005) or potentially during MIS 8 (243–300 ka; Lisiecki and Raymo, 2005), given that our results range between 243 and 132 ka. Additional geochronological work is needed to better resolve the ages of the Arroyo Verde moraines.
5.2 El Tranquilo moraine chronology
Geomorphological mapping and stratigraphy indicate that the Lago Argentino glacier expanded at least twice during the last glacial cycle, with the El Tranquilo I moraines forming prior to the El Tranquilo II moraines (see Sect. 4.1). Despite our 10Be ages showing that the El Tranquilo I and II moraines are statistically indistinguishable, our mapping indicates that they are stratigraphically distinct. Our dataset determines that these moraines were occupied and abandoned during MIS 3, constituting the largest preserved extent of the Argentino glacier lobe during the last glacial cycle.
While the El Tranquilo II moraines provided consistent ages, with a mean age of 36.6 ± 1.0 ka (no outliers removed), El Tranquilo I moraines show a scattered distribution of ages across the moraine complex with a mean age of 39.4 ± 9.9 ka. These moraines on the northern laterals are more developed and better preserved compared to the ones on the central portion of the valley. Consequently, we expect boulders from the northern laterals to provide a closer age to moraine deposition compared to boulders located in the central portion of the valley. For instance, boulders around the valley center rarely exceed half a meter in height, making these smaller boulders more susceptible to exhumation, which could result in younger ages. The hummocky landforms from the central portion of the valley are heavily affected by post-depositional processes such as aeolian erosion and deposition, landsliding, and alluvial-fan development (Fig. S4 in the Supplement). Additionally, samples from landforms located in the valley center could have been affected by former proglacial routes, as noted in paleochannels described in Sect. 4.1.4. Therefore, we exclude three ages (Table 2) that are younger than the mean age of El Tranquilo II moraines to calculate the mean age of the El Tranquilo I, which results in 44.5 ± 8.0 ka.
The IRSL ages are stratigraphically consistent with the MIS 3 glaciation recorded in the cosmogenic nuclide exposure chronology and closely complement the glacial history presented here. Based on stratigraphy and an IRSL age of ∼ 50 ka retrieved from coarse sands collected from the lower (though not the lowest) section of the riverbank, we indicate that this age represents a minimum-limiting age on the timing of glacial advance and outwash deposition (Fig. 5b). Therefore, we suggest that fluvial aggradation was underway by ∼ 50 ka with the El Tranquilo I moraine abandonment occurring at 44.5 ± 8.0 ka about 10 km westward. On the other hand, IRSL ages from outwash gravels (∼ 34–29 ka, Table 3) post-date the El Tranquilo II moraines, providing a close age of outwash abandonment, suggesting that glacier recession occurred shortly after ∼ 36 ka.
Lastly, two additional IRSL ages from loess deposits capping the El Tranquilo II outwash (lower section = 10.8 ka, upper section = 3.6 ka) indicate sustained aeolian activity for the remainder of the Holocene; highlighting prolonged aeolian deposition, as can be widely observed in the landscape.
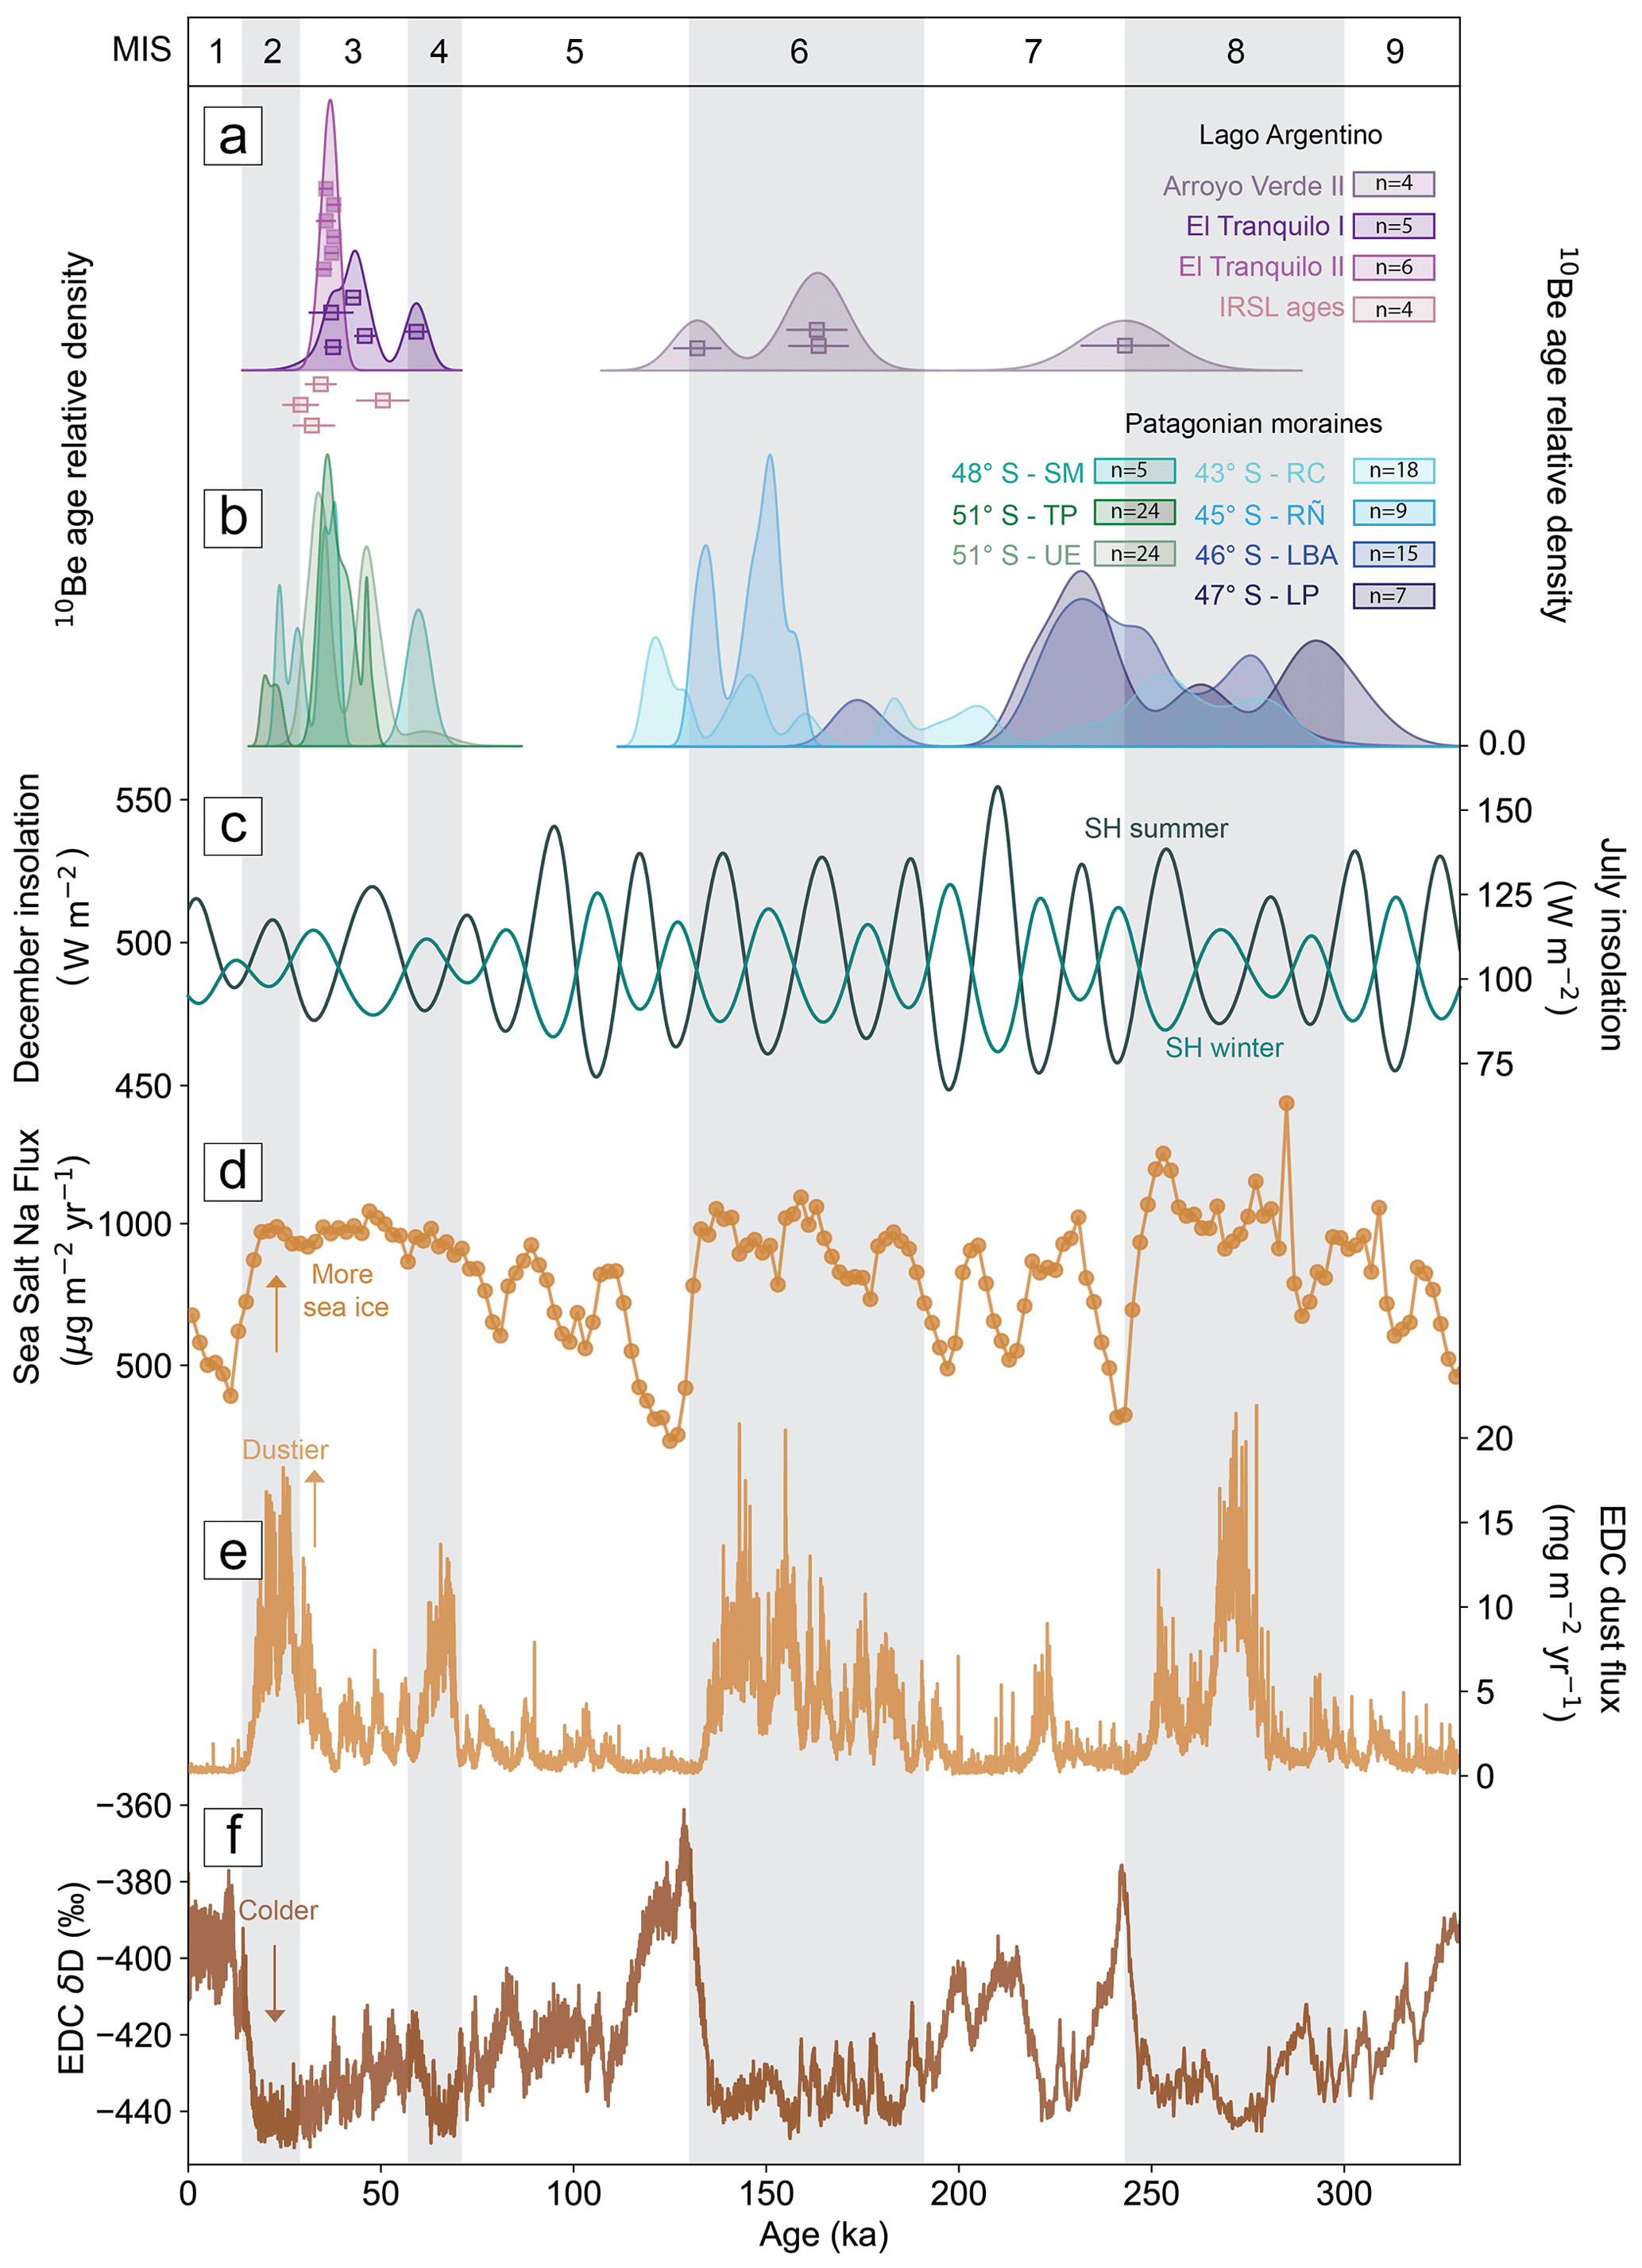
Figure 6(a) Cosmogenic 10Be and IRSL outwash ages for the Lago Argentino outlet lobe, with squares representing the individual ages along with their corresponding error. (b) Patagonian moraine age distributions from published studies mentioned in the text: Lago Buenos Aires (LBA, Hein et al., 2017), Lago Pueyrredón (LP, Hein et al., 2009), Río Corcovado (RC, Leger et al., 2023), Río Ñirehuao (RÑ, Peltier et al., 2023), Lago San Martín (SM, Glasser et al., 2011), Torres del Paine (TP, García et al., 2018), and Última Esperanza (UE, García et al., 2018; Sagredo et al., 2011). (c) Summer and winter insolation values obtained for Lago Argentino (50° S) for a December average (summer) and July average (winter) after Berger and Loutre (1991). (d) Sea salt sodium flux that serves as a proxy for Antarctic sea ice variability from EPICA Dome C ice core (Wolff et al., 2006). (e) Dust variability from the EPICA Dome C ice core (Lambert et al., 2008). (f) EPICA Dome C δ deuterium isotope record from the EPICA Dome C ice core (Jouzel et al., 2007) as a proxy for temperature variations.
5.3 Paleoclimate implications – Arroyo Verde moraines
Our moraine chronology (Fig. 6a) corroborates other Patagonian records of large – and sometimes maximum – glacier advances during MIS 6 and 8 (Fig. 6b). Recently, Leger et al. (2023) indicated that the Río Corcovado glacier lobe (∼ 43° S), located in northeastern Patagonia, reached its maximum extent during MIS 8 between 290–245 ka and subsequently advanced during MIS 6 between 150–130 ka. Peltier et al. (2023) showed that the Río Ñirehuao glacier lobe (∼ 45° S) advanced during MIS 6 at 153 and 137 ka and potentially during MIS 8 at ∼ 260 ka. In central Patagonia, MIS 8 advances have been dated around Lago Buenos Aires (∼ 46° S) at ∼ 265 ka (Hein et al., 2017) and around Lago Pueyrredón (∼ 47° S) at ∼ 260 ka (Hein et al., 2009). Hagemann et al. (2024) found increased sediment supply due to enhanced ice discharge off the coast of Chile during MIS 6. Additionally, MIS 6 ages have been reported in other regions of the southern mid-latitudes in the southern Alps of New Zealand (Putnam et al., 2013) and southwestern Tasmania (Kiernan et al., 2010).
The timing of these advances in Patagonia during both MIS 8 and MIS 6 coincides with lower mean atmospheric temperatures (Jouzel et al., 2007) recorded by deuterium isotopes from Antarctic ice cores (Fig. 6f) and increased dust fluxes inferred to be derived from enhanced rock flour production due to glacial erosion (Fig. 6e; Lambert et al., 2008). Additionally, sea salt sodium fluxes (Fig. 6d), indicative of sustained sea ice, are reported to be greater during glacial periods (Wolff et al., 2006). According to Peltier et al. (2023), maximum glacial expansion in Patagonia should occur as both eccentricity and obliquity reach minimum values, which further correspond with expansive sea ice around Antarctica and a northward migration of the Subantarctic Front. While these conditions could drive and pace the expansion of the PIS over glacial cycles, glacial erosion has been proposed to modulate the extent of the glacial advances from one glacial cycle to the next. Valley over-deepening over glacial–interglacial timescales could lead to progressively more negative mass balance and successively less extensive advances (Kaplan et al., 2009).
5.4 Paleoclimate implications – El Tranquilo moraines
5.4.1 Comparison with other glacial records during Marine Isotope Stage 3 (MIS 3)
Our chronological and geomorphological constraints indicate that the Lago Argentino ice lobe expanded at least twice in upper Río Santa Cruz basin during MIS 3 (Fig. 6a), with fluvial aggradation underway before 50.5 ± 6.9 ka and glacial advance culminating at 44.5 ± 8.0 ka (El Tranquilo I) and at 36.6 ± 1.0 ka (El Tranquilo II). We determine that this outlet lobe reached its maximum extent during MIS 3, when it deposited the El Tranquilo I and II moraines ∼ 120 km away from the modern ice front, constituting the earliest and largest preserved advance of the last glacial cycle. Cross-cutting relationships, informed by El Tranquilo II outwash deposited within valleys incised into the El Tranquilo I outwash, allow us to determine that these were two different advances of the Lago Argentino glacier lobe during MIS 3.
Our new chronology for the Lago Argentino glacier lobe fits well into other evidence showing that some glaciers in the southern mid-latitudes advanced during MIS 4 or 3 and were more extensive than the global LGM (MIS 2). MIS 3 glacial expansions have been widely recognized and dated across Patagonia. Radiocarbon dating on till sequences from the Chilean Lake District (∼ 42° S), northern Patagonia, determined that glacial expansions occurred at ∼ 33.6, 30.8 ka and during early MIS 2 (Denton et al., 1999; Moreno et al., 2015). In central Patagonia, exposure ages indicated that the PIS expanded at Lago San Martín (Fig. 1b) during late MIS 3, culminating between 38–34 ka (Glasser et al., 2011), while Hein et al. (2010) dated the outermost moraine of Lago Pueyrredón (Fig. 1b), providing ages ranging between ∼ 32–25 ka. Although moraine data from Lago Buenos Aires (Fig. 1b) resulted in MIS 2 ages (Douglass et al., 2006; Kaplan et al., 2004, 2005), outwash deposits dated by luminescence (Smedley et al., 2016) suggest that the proglacial plains were formed during MIS 3 between ∼ 34 and 30.8 ka. In southern Patagonia, results from moraine boulders indicate that the Torres del Paine and Última Esperanza (Fig. 1b) outlet lobes expanded during MIS 3, with ice advances culminating at ∼ 48, 39, and 35 ka (Çiner et al., 2022; Girault et al., 2022; Sagredo et al., 2011; García et al., 2018), indicating that the MIS 2 advance was half the extent of the local LGM during MIS 3 (Fig. 6b). At Seno Skyring (Fig. 1b), Lira et al. (2022) reported full glacial conditions during MIS 2, though implying that some of the samples could reflect previous exposure from earlier glaciations, in concordance with nearby records.
In southernmost South America, Darvill et al. (2015) demonstrated that the Bahia Inútil–San Sebastián (Fig. 1b) glacier lobe advanced during MIS 3 between ∼ 45.6 and 30.1 ka, while Peltier et al. (2021) reported that the Magallanes lobe advanced during MIS 4, highlighting that these two lobes occupied their most extensive positions prior to the global LGM. Additionally, glacial conditions predating the global LGM have also been identified and dated in other regions of the southern mid-latitudes. For instance, a millennial-scale moraine chronology indicates that glaciers expanded from ∼ 45 to 20 ka in the South Atlantic region (Mount Usborne, Hall et al., 2020) and between ∼ 56 and ∼ 43 ka in the sub-Antarctic islands (Rudolph et al., 2024). Several lines of evidence support that glaciers in the southern Alps of New Zealand expanded prior to the global LGM, with the most extensive advance of the last glacial cycle occurring during MIS 4 (Schaefer et al., 2015) or MIS 3 (Doughty et al., 2015; Kelley et al., 2014; Putnam et al., 2013; Shulmeister et al., 2019, 2018; Strand et al., 2019).
5.4.2 Comparison with paleoclimate records and possible drivers of glacier fluctuations
Previous studies have investigated the role of insolation in driving a pre-LGM glacier growth in the southern mid-latitudes (Fig. 6c). Huybers and Denton (2008) hypothesized that Antarctic temperatures were influenced by the duration of the seasons in the Southern Hemisphere. Winter duration was enhanced during MIS 3 relative to MIS 2, which would ultimately promote lower temperatures that were capable of driving glacier growth (Darvill et al., 2016). Additionally, southern winter insolation is thought to have played a role in driving an early MIS 3 glacier advance in southern Patagonia, since winter insolation was at its minimum during this time ∼ 48 ka, exacerbating colder winters (García et al., 2018). Lower summer insolation intensity towards late MIS 3 at ∼ 35 ka, along with longer winters and reduced seasonality, would have favored ice growth during this time, coincident with some of the glacial advances in Patagonia and New Zealand (Darvill et al., 2016), including our Lago Argentino record presented here. However, these advances culminated at different times and not necessarily in a synchronous fashion, implying that insolation might not be the single forcing responsible for modulating the timing of glacier growth across the southern mid-latitudes prior to the global LGM (Darvill et al., 2015, 2016; Doughty et al., 2015; García et al., 2018; Putnam et al., 2013).
Our Lago Argentino glacial chronology suggests that ice advances culminated broadly in phase with Antarctic stadials, as evidenced in a progressive trend towards lower temperatures recorded in ice cores by lower deuterium values and higher dust fluxes at the millennial scale during MIS 3 (Fig. 6e and f). While our record and others (Denton et al., 1999; García et al., 2018; Kelley et al., 2014; Putnam et al., 2013; Sagredo et al., 2011; Strand et al., 2019) suggest simultaneous cooling in Antarctica and the southern mid-latitudes, the timing of occurrence of glacial advances may have varied across different sites (Darvill et al., 2016). This could be explained by the fact that sea ice formation and expansion around Antarctica was enhanced (Fig. 6d) (Fogwill et al., 2015; Sigman et al., 2004; Wolff et al., 2006) in addition to ocean stratification, as evidenced in lower opal fluxes in the Southern Ocean indicative of decreased upwelling (Anderson et al., 2009). In turn, these conditions would have promoted a northward shift of the Subantarctic Front, which is thought to be responsible for both a latitudinal migration and strengthening of the core of SWW belt (Kohfeld et al., 2013). This migration would have delivered increased precipitation over some zones of the southern mid-latitudes, such as at ∼ 50° S (Lago Argentino), modulating glacier mass balance at the millennial scale, allowing glaciers in the southern latitudes to advance earlier in the glacial cycle, such as during MIS 3 (Darvill et al., 2015, 2016; Hagemann et al., 2024; Hall et al., 2020; Herman and Brandon, 2015; Shulmeister et al., 2019; Sproson et al., 2024).
These conditions driven by feedbacks between the atmosphere–Southern Ocean coupled system, controlled by orbital parameters, would have modulated glacial expansion of the PIS during MIS 3, with glacial erosion hotspots at ∼ 50° S (Lago Argentino, Herman and Brandon, 2015; Sproson et al., 2024) and in other southern sites between ∼ 50 and ∼ 40 ka (see Sect. 5.4.1). Additionally, we suggest that sustained lower atmospheric temperatures, as well as a northward migration of the SWW belt, would have promoted widespread ice growth across Patagonia during late MIS 3, coincident with some other Patagonian lobes that experienced their local glacial maximum between ∼ 35 and ∼ 28 ka (see Sect. 5.4.1). An equatorial migration of the SWW belt would have decreased precipitation over the southernmost latitudes during MIS 2 and could explain why some southern glacier lobes experienced a less extensive MIS 2 advance (Fogwill et al., 2015; Hall et al., 2020), which could be partly due to a westward migration of the ice divide (García et al., 2018; Mendelová et al., 2020; Sugden et al., 2002). This implies that moisture-starved glaciers would have not reached their prior extent, highlighting the role of increased precipitation in driving an early and extensive glacial maximum across the southern mid-latitudes (Darvill et al., 2015, 2016; García et al., 2018; Rother et al., 2014; Shulmeister et al., 2019). We hypothesize that increased precipitation during MIS 3 would have been favorable for glaciers to develop a temperate regime, as indicated for some of the southernmost outlet lobes of the PIS (Darvill et al., 2017). At eastern Lago Argentino, this is evidenced in lateral meltwater channels, as well as widespread presence of drumlins and lineations inboard the moraine complexes. In turn, lower shear stresses at the glacier base favored by this thermal regime would have promoted enhanced basal sliding, allowing for glaciers to extend farther to the east.
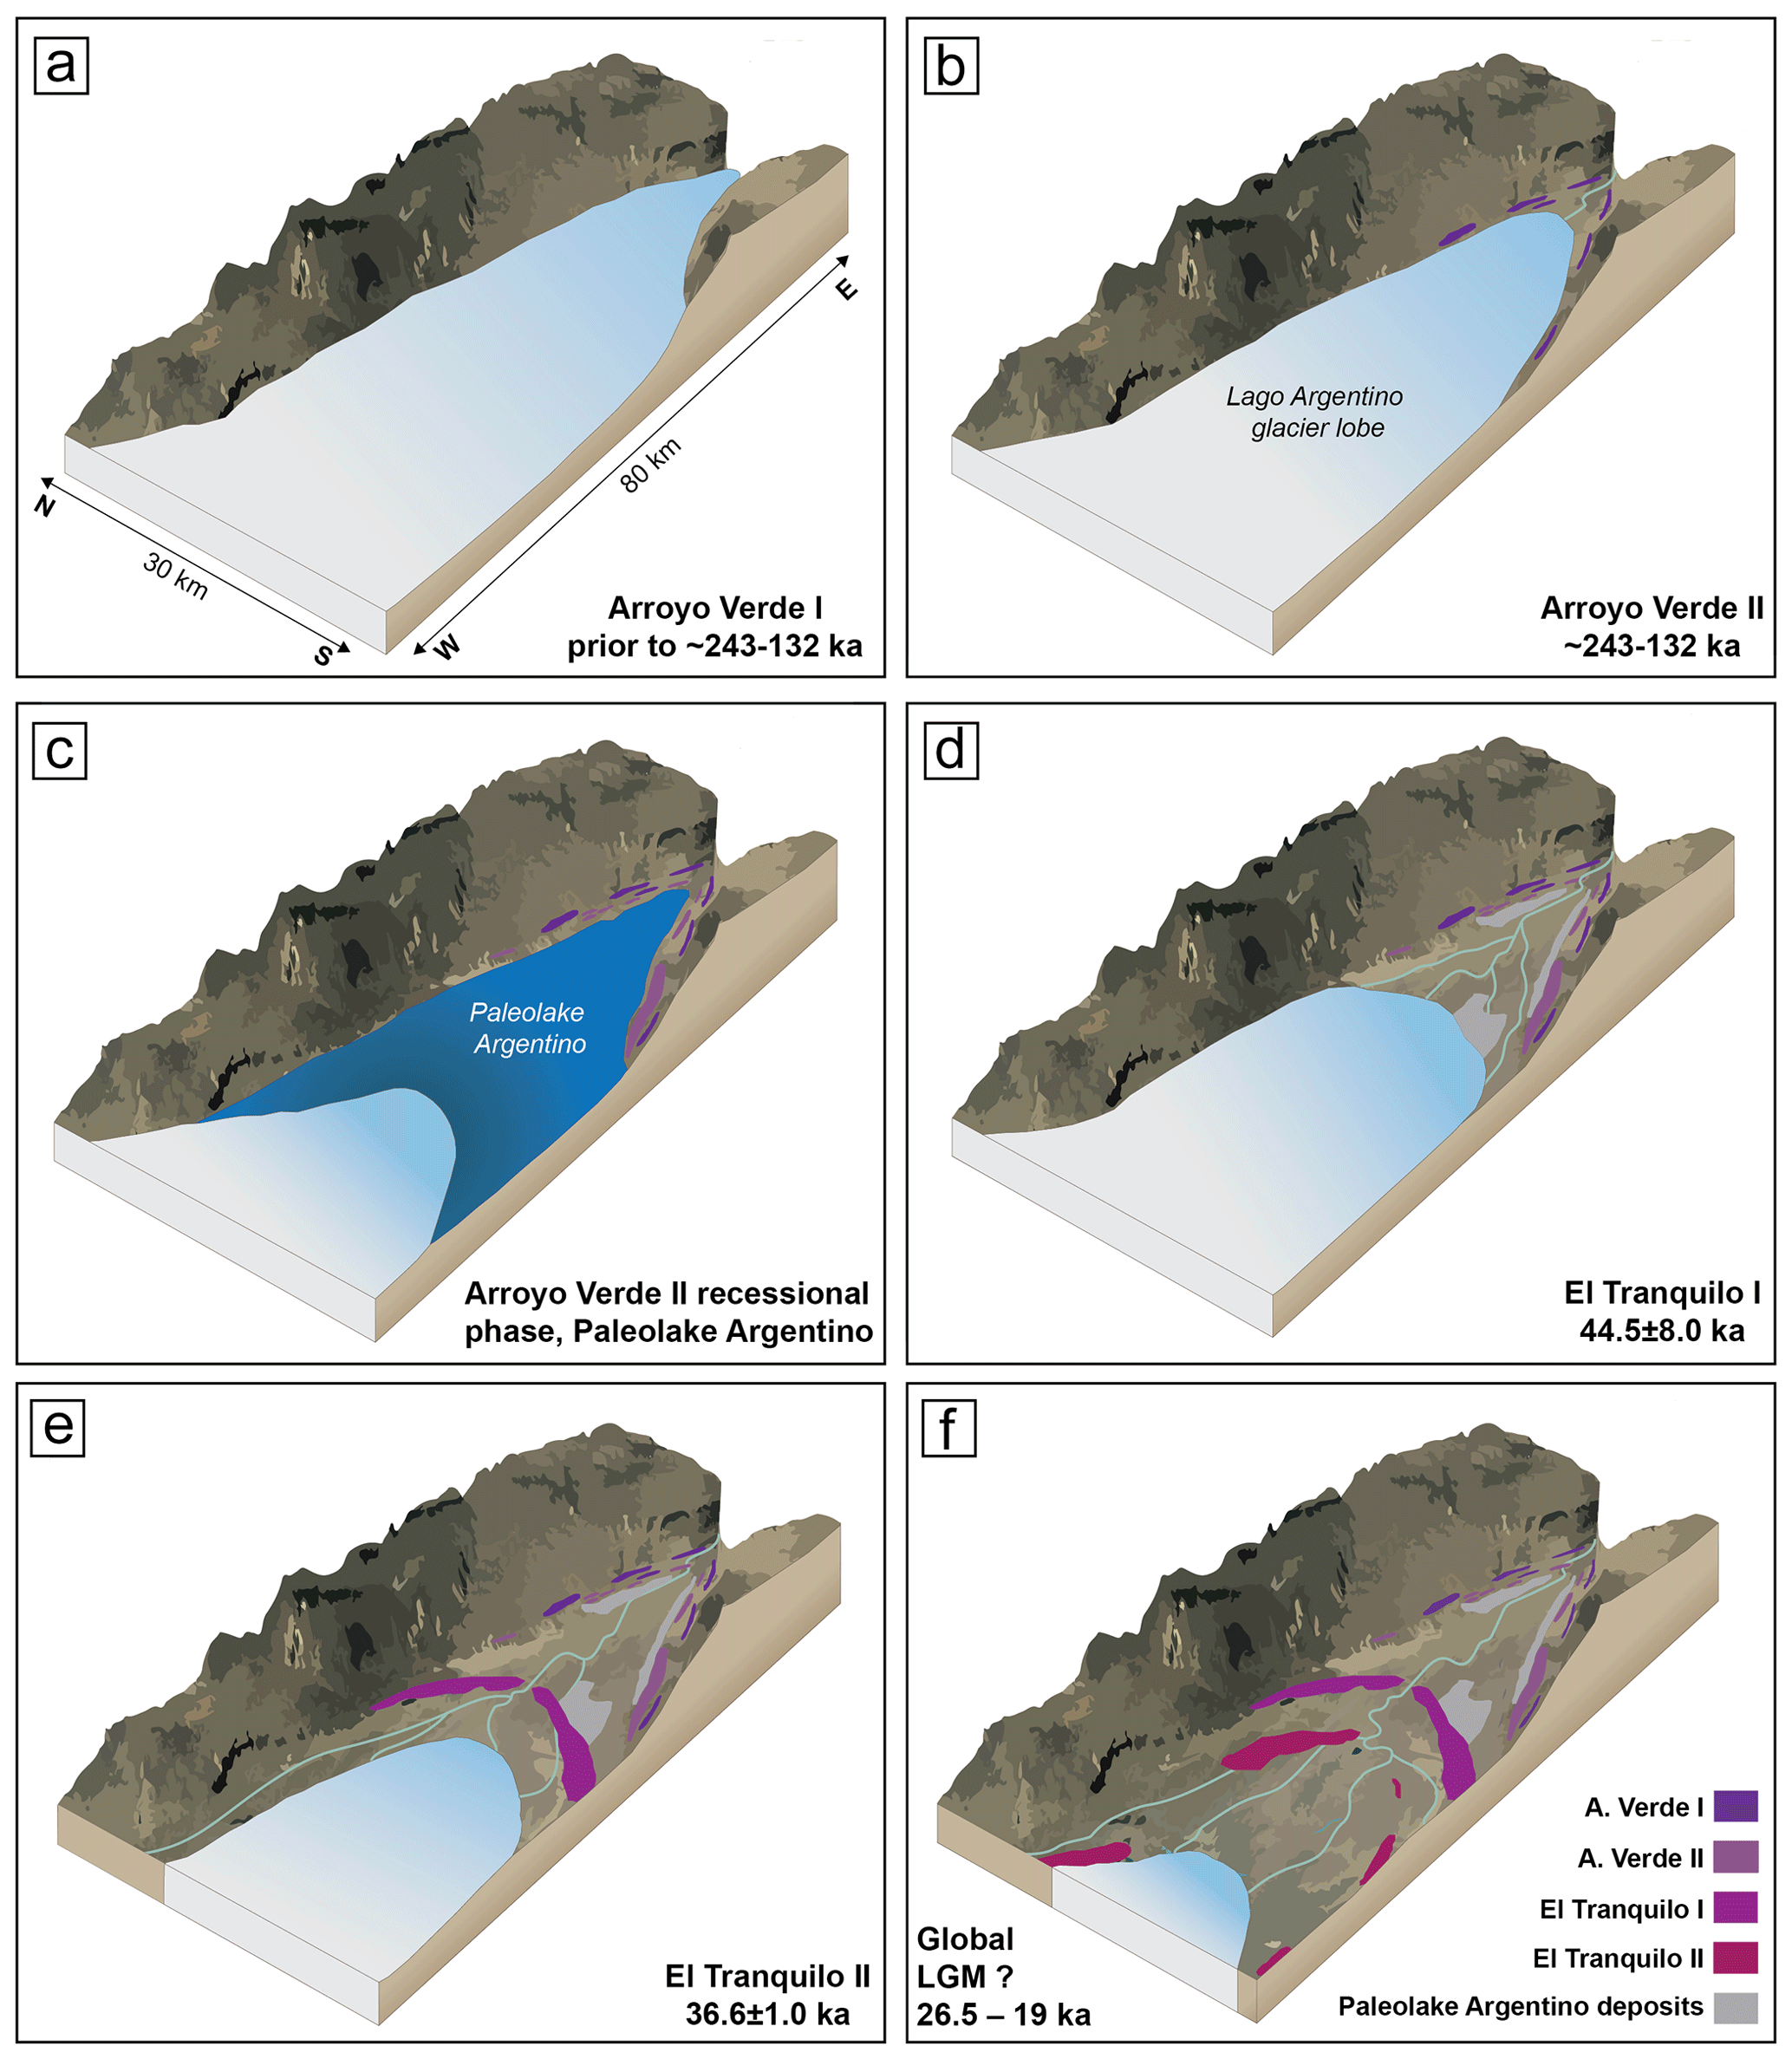
Figure 7Landscape evolution conceptual model developed for the upper basin of the Río Santa Cruz and eastern margin of Lago Argentino, based on geochronological and geomorphological data presented here along with published interpretations (Strelin and Malagnino, 1996; Strelin et al., 1999; Strelin and Malagnino, 2009). (a) Easternmost extent of the Lago Argentino outlet lobe during the Arroyo Verde I phase prior to ∼ 243–132 ka. (b) Extent of the Lago Argentino outlet lobe during the Arroyo Verde II phase between ∼ 243–132 ka. (c) Arroyo Verde II recessional phase along with development of an extensive paleolake (Paleolake Argentino) likely during the Penultimate Deglaciation. (c) Extent of the Lago Argentino glacier with moraine abandonment occurring at ∼ 44.5 ka (El Tranquilo I moraines). (e) Extent of the Lago Argentino glacier at ∼ 36.5 ka (El Tranquilo II moraines). (f) Recession after ∼ 36.5 ka, with ice potentially present at the margin of the lake, presumably during the global LGM (26–19 ka).
5.5 Landscape evolution synthesis
The Arroyo Verde I moraines presumably indicate the easternmost glacier extent of the Lago Argentino outlet lobe at the upper basin of the Río Santa Cruz during the mid-Pleistocene (prior to 243–132 ka), where the valley reaches its narrowest point (Fig. 7a). Additional stratigraphic and glaciotectonic data indicate that the extension of this advance was topographically controlled and limited by the existing Pliocene plateaus located at the northern and southern margins of the valley (Goyanes and Massabie, 2015), as well as preceding west-to-east faulting (Glasser and Ghiglione, 2009). Geomorphological and chronological evidence presented here is therefore indicative that the outlet lobe did not reach elevations above the plateaus (∼ 800–1000 m) during the Arroyo Verde glacial advances.
Glacial deposits from this advance are found in the vicinity of Río La Leona. The asymmetric nature of the morphology of the valley, which is deeper at the northern margin, as well as the orientation of the subglacial landforms, suggests that the Lago Argentino lobe merged with tributary glaciers from the Guanaco, Turbio, and Viedma basins in the north and with the Río Bote tributary in the south (Strelin and Malagnino, 1996).
Strelin and Malagnino (1996) suggested that widespread glacier recession took place after the deposition of the Arroyo Verde I moraine and pointed out that the geomorphic evidence is not conclusive as to whether the following advance (i.e., Arroyo Verde II) is part of the same glaciation or not. Results from cosmogenic nuclide surface exposure dating presented here indicate that the Lago Argentino lobe advanced between 243 and 132 ka, depositing the Arroyo Verde II moraines.
Later, a large proglacial lake developed, reaching elevations of ∼ 280 , previously recognized as Paleolake Argentino (Strelin and Malagnino, 1996), and it is represented by the glaciolacustrine sediments mapped in Fig. 2. Widespread lacustrine landforms, particularly at the southern margin of the valley, suggest that this paleolake lasted long enough in order to develop deltas, spits, and shorelines. Strelin and Malagnino (1996) suggested that this paleolake formed during the Arroyo Verde II recessional phase in response to valley over-deepening (Strelin and Malagnino, 1996, 2009), where the Arroyo Verde II moraines served as a dam (Fig. 7c). Afterward, fluvial routing eroded these moraines, causing the paleolake to eventually drain. This paleolake is then thought to have been drained abruptly in response to moraine degradation by fluvial erosion (Strelin and Malagnino, 1996, 2009).
Fluvial aggradation was underway by ∼ 50.5 ± 6.9 ka, indicating a minimum-limiting age for the following ice advance during MIS 3, while the Lago Argentino glacier lobe abandoned the El Tranquilo I moraines at ∼ 44.5 ± 8.0 ka (Fig. 7d). Moraine deposits from this stage were correlated with glacial deposits at higher elevations at the northern margin of the valley, suggesting that the Lago Argentino outlet lobe reached the southern part of Río La Leona valley (Strelin and Malagnino, 1996). Additionally, fault planes within deformed glaciolacustrine sediments evidence a stress transfer from the north side to the southeast and a west–east pushing due to glacier loading (Goyanes and Massabie, 2015). The Lago Argentino glacier developed an extensive glaciofluvial plain during this stage that was later partially eroded by the El Tranquilo II outwash, resulting in the incision of the previously deposited outwash plain and filling of younger outwash (cut and fill).
Inboard of the El Tranquilo I moraines, the Tranquilo II moraines were deposited at ∼ 36.6 ± 1.0 ka during a less extensive ice advance that did not reach the Río La Leona valley, being spatially restricted to the northeastern margin of Lago Argentino (Fig. 7e). Here, paleochannels reveal that the Río La Leona drained into Río Santa Cruz as the ice occupied the eastern margins of Lago Argentino. Later, the Río La Leona changed its drainage route by draining into the lake after the ice lobe abandoned the margins of Lago Argentino (Fig. 7e) and receded westward (Strelin and Malagnino, 1996). Strelin and Malagnino (1996) indicated that during this time the lake level dropped from about 230 to 210 m as the moraine circling Lago Argentino was subsequently eroded. While evidence of an MIS 2 advance is lacking in our terrestrial geomorphic record, we speculate that it could be deposited within the lake basin or covered by the extensive aeolian deposits located at the eastern margin of the lake (Fig. 7f). Later, widespread recession took place until the following advance occurred during the Late Glacial. This advance is recorded in the Puerto Banderas moraines about 45 km west of the margins of Lago Argentino (Strelin et al., 2011).
Finally, we indicate that our IRSL ages document the onset of loess deposition at ∼ 10.8 ka in southern Patagonia, as well as sustained aeolian activity during the Holocene. Our ages (10.8 and 3.6 ka) coincide with warm and dry intervals recorded by changes in pollen assemblages retrieved from Lago Cipreses (Moreno et al., 2018), which is located less than 100 km south of Lago Argentino. While evidence for glacial advances is available from southern Patagonia during the Holocene (García et al., 2020; Kaplan et al., 2016; Reynhout et al., 2019; Sagredo et al., 2021; Strelin et al., 2014), the paucity of glacial records at ∼ 10.8 and ∼ 3.6 ka coincides with these warm and dry periods defined by pollen assemblages (Moreno et al., 2018).
We investigate the glaciogenic landforms at the upper basin of Río Santa Cruz, eastern Lago Argentino, and we identify at least four moraine complexes (i.e., Arroyo Verde I and II, El Tranquilo I and II) through high-resolution geomorphological mapping. We use two independent geochronological techniques to provide the first published constraints on the timing of the middle to late Pleistocene glaciations by employing 10Be cosmogenic nuclide surface exposure dating on boulders and IRSL on outwash sediments. We determine that the Lago Argentino glacier, an outlet lobe of the former Patagonian Ice Sheet, expanded between ∼ 240–130 ka in the upper basin of the Río Santa Cruz, where it deposited the Arroyo Verde II moraines during the middle to late Pleistocene. Additionally, we find that fluvial aggradation due to glacier advance was underway by 50.5 ± 6.9 ka and that El Tranquilo I moraines were deposited during Marine Isotope Stage 3 at 44.5 ± 8.0 ka. This advance precedes the global Last Glacial Maximum and constitutes the most extensive advance of the Lago Argentino glacier during the last glacial cycle, being consistent with published records around the southern mid-latitudes. We determine that the second pulse of this advance (i.e., El Tranquilo II) culminated at 36.6 ± 1.0 ka, while proglacial plains became abandoned between 34–29 ka. We hypothesize that the glacier did not occupy the Río Santa Cruz upper basin during MIS 2 and likely remained limited to the margins of the modern Lago Argentino.
Based on our new chronology, we find that glacial conditions recorded in Antarctic ice cores were also present and widespread across Patagonia, both in the north and in the south. We hypothesize that the duration of the Southern Hemisphere winters along with minimum summer insolation promoted colder conditions during MIS 3. These conditions caused the Southern Westerly Winds (SWW) belt to strengthen and shift latitudinally, resulting in enhanced precipitation in the southern latitudes, which in turn drove glacial expansion at Lago Argentino. Our record coincides with evidence from different glacier lobes nearby (e.g., Torres del Paine, Última Esperanza, and San Sebastián–Bahia Inútil) and highlights the role of millennial-scale fluctuations of the strength and latitudinal position of the SWW belt in modulating the mass balance of mid-latitude glaciers during the last glacial cycle. We suggest that increased precipitation would have induced a temperate regime of the Lago Argentino glacier, favoring basal sliding and causing the glacier to reach its most extensive position during the last glacial cycle before MIS 2. Lastly, we document the onset of aeolian deposition after ∼ 10.8 ka following warmer and drier conditions in southern Patagonia, as evidenced is pollen records nearby.
All data associated with the production of new 10Be exposure ages and IRSL ages, including field and analytical data, are provided in the tables and figures and in the Supplement. The 5 m digital elevation model is available from Instituto Geográfico Nacional at https://www.ign.gob.ar/NuestrasActividades/Geodesia/ModeloDigitalElevaciones/Introduccion (Instituto Geográfico Nacional, 2020). The global relief model from NOAA can be found at https://doi.org/10.25921/fd45-gt74 (NOAA National Centers for Environmental Information, 2022). Global bathymetry data are available from the GEBCO website at https://doi.org/10.5285/1c44ce99-0a0d-5f4f-e063-7086abc0ea0f (GEBCO Compilation Group, 2024). Wind speed data are available from the NCEP-NCAR Reanalysis 1 at https://psl.noaa.gov/data/gridded/data.ncep.reanalysis.html (Kalnay et al., 1996). Outlines (ice sheet extent, rivers, lakes, and ice fields) used in Fig. 1b were adapted from the PATICE project (Davies et al., 2020). Insolation curves obtained for Lago Argentino area were derived using climlab (https://climlab.readthedocs.io/en/latest/index.html, Rose, 2023). Lastly, shapefiles produced in this work are available at https://doi.org/10.5281/zenodo.11556612 (Romero et al., 2024).
The supplement related to this article is available online at: https://doi.org/10.5194/cp-20-1861-2024-supplement.
MR, SBP, MSVWdV, and ADW conceived the study. MR, AGJ, and SAM carried out 10Be extraction. SBP and TMR analyzed IRSL samples. MR generated maps with inputs from MAM and JAS. MR processed the data and wrote the manuscript with input from all authors.
The contact author has declared that none of the authors has any competing interests.
Publisher's note: Copernicus Publications remains neutral with regard to jurisdictional claims made in the text, published maps, institutional affiliations, or any other geographical representation in this paper. While Copernicus Publications makes every effort to include appropriate place names, the final responsibility lies with the authors.
This article is part of the special issue “Icy landscapes of the past”. It is not associated with a conference.
The authors would like to thank the owners of the sites visited that granted them access, Anastasia Fedotova and Guillermo Tamburini-Beliveau for field support, and the locals in El Calafate that provided directions and facilitated the expedition. Rock crushing was carried out at the STAMP Lab at the University of Minnesota Twin Cities; therefore, we thank the research staff that assisted in the process. The authors thank Michael R. Kaplan for early conversations that greatly improved the interpretation of the dataset and Phillip Larson and Victoria M. Fernandes for the insights into fluvial geomorphology. Additionally, we thank Eduardo Malagnino for feedback on glacial geomorphological mapping and colleagues from the GUANACO project for conversations that inspired this work. Lastly, we would like to thank the editor Neil Glasser for handling the review and Andrew Hein and Christopher Darvill for their insightful reviews that greatly improved the manuscript.
This material is based on work supported by the National Science Foundation through a collaborative research award (grant no. EAR-1714614) granted to Andrew D. Wickert, Emi Ito, and Anders J. Noren and coordinated by Maria Beatrice Magnani.
This paper was edited by Neil Glasser and reviewed by Christopher Darvill and Andrew Hein.
Abe-Ouchi, A., Saito, F., Kawamura, K., Raymo, M. E., Okuno, J., Takahashi, K., and Blatter, H.: Insolation-driven 100,000-year glacial cycles and hysteresis of ice-sheet volume, Nature, 500, 190–193, https://doi.org/10.1038/nature12374, 2013. a
Anderson, R. F., Ali, S., Bradtmiller, L. I., Nielsen, S. H., Fleisher, M. Q., Anderson, B. E., and Burckle, L. H.: Wind-driven upwelling in the southern ocean and the deglacial rise in atmospheric CO2, Science, 323, 1443–1448, https://doi.org/10.1126/SCIENCE.1167441, 2009. a
Auclair, M., Lamothe, M., and Huot, S.: Measurement of anomalous fading for feldspar IRSL using SAR, Radiat. Meas., 37, 487–492, https://doi.org/10.1016/S1350-4487(03)00018-0, 2003. a, b
Balco, G., Stone, J. O., Lifton, N. A., and Dunai, T. J.: A complete and easily accessible means of calculating surface exposure ages or erosion rates from 10Be and 26Al measurements, Quat. Geochronol., 3, 174–195, https://doi.org/10.1016/j.quageo.2007.12.001, 2008. a
Berger, A. and Loutre, M.: Insolation values for the climate of the last 10 million years, Quaternary Sci. Rev., 10, 297–317, https://doi.org/10.1016/0277-3791(91)90033-Q, 1991. a
Blomdin, R., Murray, A., Thomsen, K. J., Buylaert, J.-P., Sohbati, R., Jansson, K. N., and Alexanderson, H.: Timing of the deglaciation in southern Patagonia: Testing the applicability of K-Feldspar IRSL, Quat. Geochronol., 10, 264–272, 2012. a
Brennan, B. J.: Beta doses to spherical grains, Radiat. Meas., 37, 299–303, https://doi.org/10.1016/S1350-4487(03)00011-8, 2003. a
Caldenius, C. C.: Las Glaciaciones Cuaternarias en la Patagonia y Tierra del Fuego, Geogr. Ann., 14, 1–164, https://doi.org/10.2307/519583, 1932. a, b
Casadio, S., Feldmann, R. M., and Foland, K. A.: 40Ar/39Ar age and oxygen isotope temperature of the Centinela Formation, southwestern Argentina: An Eocene age for crustacean-rich “Patagonian” beds, J. S. Am. Earth Sci., 13, 123–132, https://doi.org/10.1016/S0895-9811(00)00013-4, 2000. a
Ceperley, E. G., Marcott, S. A., Reusche, M. M., Barth, A. M., Mix, A. C., Brook, E. J., and Caffee, M.: Widespread early Holocene deglaciation, Washington Land, northwest Greenland, Quaternary Sci. Rev., 231, 106181, https://doi.org/10.1016/j.quascirev.2020.106181, 2020. a
Chandler, B. M. P., Lovell, H., Boston, C. M., Lukas, S., Barr, I. D., Benediktsson, I. O., Benn, D. I., Clark, C. D., Darvill, C. M., Evans, D. J. A., Ewertowski, M. W., Loibl, D., Margold, M., Otto, J.-C., Roberts, D. H., Stokes, C. R., Storrar, R. D., and Stroeven, A. P.: Glacial geomorphological mapping: A review of approaches and frameworks for best practice, Earth-Sci. Rev., 185, 806–846, https://doi.org/10.1016/j.earscirev.2018.07.015, 2018. a
Çiner, A., Sarıkaya, M. A., Yıldırım, C., Girault, I., Todisco, D., Martin, F., Borrero, L., and Fabel, D.: Terrestrial cosmogenic 10Be dating of the Última Esperanza ice lobe moraines (52° S, Patagonia) indicates the global Last Glacial Maximum (LGM) extent was half of the local LGM, Geomorphology, 414, 108381, https://doi.org/10.1016/j.geomorph.2022.108381, 2022. a
Clague, J. J., Barendregt, R. W., Menounos, B., Roberts, N. J., Rabassa, J., Martinez, O., Ercolano, B., Corbella, H., and Hemming, S. R.: Pliocene and Early Pleistocene glaciation and landscape evolution on the Patagonian Steppe, Santa Cruz province, Argentina, Quaternary Sci. Rev., 227, 105992, https://doi.org/10.1016/j.quascirev.2019.105992, 2020. a, b
Clark, P. U., Dyke, A. S., Shakun, J. D., Carlson, A. E., Clark, J., Wohlfarth, B., Mitrovica, J. X., Hostetler, S. W., and Mccabe, A. M.: The Last Glacial Maximum, Science, 325, 3–7, https://doi.org/10.1126/science.1172873, 2009. a
Cooper, E.-L., Thorndycraft, V. R., Davies, B. J., Palmer, A. P., and García, J.-L.: Glacial geomorphology of the former Patagonian Ice Sheet (44–46° S), J. Maps, 17, 661–681, https://doi.org/10.1080/17445647.2021.1986158, 2021. a
Darvill, C. M., Bentley, M. J., Stokes, C. R., Hein, A. S., and Rodés, A.: Extensive MIS 3 glaciation in southernmost Patagonia revealed by cosmogenic nuclide dating of outwash sediments, Earth Planet. Sc. Lett., 429, 157–169, https://doi.org/10.1016/j.epsl.2015.07.030, 2015. a, b, c, d, e, f
Darvill, C. M., Bentley, M. J., Stokes, C. R., and Shulmeister, J.: The timing and cause of glacial advances in the southern mid-latitudes during the last glacial cycle based on a synthesis of exposure ages from Patagonia and New Zealand, Quaternary Sci. Rev., 149, 200–214, https://doi.org/10.1016/j.quascirev.2016.07.024, 2016. a, b, c, d, e, f, g
Darvill, C. M., Stokes, C. R., Bentley, M. J., Evans, D. J. A., and Lovell, H.: Dynamics of former ice lobes of the southernmost Patagonian Ice Sheet based on a glacial landsystems approach, J. Quatern. Sci., 32, 857–876, https://doi.org/10.1002/jqs.2890, 2017. a
Darwin, C.: On the Distribution of the Erratic Boulders and on the Contemporaneous Unstratified Deposits of South America, Transactions of the Geological Society of London, 6, 415–431, https://doi.org/10.1144/transgslb.6.2.415, 1842. a
Davies, B. J., Darvill, C. M., Lovell, H., Bendle, J. M., Dowdeswell, J. A., Fabel, D., García, J.-L., Geiger, A., Glasser, N. F., Gheorghiu, D. M., Harrison, S., Hein, A. S., Kaplan, M. R., Martin, J. R. V., Mendelova, M., Palmer, A., Pelto, M., Rodés, A., Sagredo, E. A., Smedley, R. K., Smellie, J. L., and Thorndycraft, V. R.: The evolution of the Patagonian Ice Sheet from 35 ka to the present day (PATICE), Earth-Sci. Rev., 204, 103152, https://doi.org/10.1016/j.earscirev.2020.103152, 2020. a, b, c, d, e
De Geer, G.: Late Glacial Clay Varves in Argentina: Measured by Dr Carl Caldenius, Dated and Connected with the Solar Curve Through the Swedish Timescale, Geogr. Ann., 9, 1–8, https://doi.org/10.1080/20014422.1927.11881142, 1927. a
Denton, G. H., Lowell, T., Heusser, C., Schlüchter, C., Andersen, B., Heusser, L. E., Moreno, P., and Marchant, D.: Geomorphology, Stratigraphy, and Radiocarbon Chronology of LlanquihueDrift in the Area of the Southern Lake District, Seno Reloncaví, and Isla Grande de Chiloé, Chile, Geogr. Ann. A, 81, 167–229, https://doi.org/10.1111/1468-0459.00057, 1999. a, b
Denton, G. H., Putnam, A. E., Russell, J. L., Barrell, D. J. A., Schaefer, J. M., Kaplan, M. R., and Strand, P. D.: The Zealandia Switch: Ice age climate shifts viewed from Southern Hemisphere moraines, Quaternary Sci. Rev., 257, 106771, https://doi.org/10.1016/j.quascirev.2020.106771, 2021. a
Doughty, A. M., Schaefer, J. M., Putnam, A. E., Denton, G. H., Kaplan, M. R., Barrell, D. J., Andersen, B. G., Kelley, S. E., Finkel, R. C., and Schwartz, R.: Mismatch of glacier extent and summer insolation in Southern Hemisphere mid-latitudes, Geology, 43, 407–410, https://doi.org/10.1130/G36477.1, 2015. a, b, c
Douglass, D. C., Singer, B. S., Kaplan, M. R., Mickelson, D. M., and Caffee, M. W.: Cosmogenic nuclide surface exposure dating of boulders on last-glacial and late-glacial moraines, Lago Buenos Aires, Argentina: Interpretive strategies and paleoclimate implications, Quat. Geochronol., 1, 43–58, https://doi.org/10.1016/j.quageo.2006.06.001, 2006. a, b
Durcan, J. A., King, G. E., and Duller, G. A. T.: DRAC: Dose Rate and Age Calculator for trapped charge dating, Quat. Geochronol., 28, 54–61, https://doi.org/10.1016/j.quageo.2015.03.012, 2015. a
Feruglio, E.: Estudios geológicos y glaciológicos en la región del Lago Argentino (Patagonia), Boletín Academia Nacional de Ciencias, Córdoba, Argentina, 37, 1–208, 1944. a
Fogwill, C., Turney, C., Hutchinson, D., Taschetto, A., and England, M.: Obliquity Control On Southern Hemisphere Climate During The Last Glacial, Sci. Rep.-UK, 5, 11673, https://doi.org/10.1038/srep11673, 2015. a, b
Galbraith, R. and Roberts, R.: Statistical aspects of equivalent dose and error calculation and display in OSL dating: An overview and some recommendations, Quat. Geochronol., 11, 1–27, https://doi.org/10.1016/j.quageo.2012.04.020, 2012. a, b
García, J. L., Hein, A. S., Binnie, S. A., Gómez, G. A., González, M. A., and Dunai, T. J.: The MIS 3 maximum of the Torres del Paine and Última Esperanza ice lobes in Patagonia and the pacing of southern mountain glaciation, Quaternary Sci. Rev., 185, 9–26, https://doi.org/10.1016/j.quascirev.2018.01.013, 2018. a, b, c, d, e, f, g, h, i
García, J. L., Hall, B. L., Kaplan, M. R., Gómez, G. A., De Pol-Holz, R., García, V. J., Schaefer, J. M., and Schwartz, R.: 14C and 10Be dated Late Holocene fluctuations of Patagonian glaciers in Torres del Paine (Chile, 51° S) and connections to Antarctic climate change, Quaternary Sci. Rev., 246, 106541, https://doi.org/10.1016/J.QUASCIREV.2020.106541, 2020. a
Garreaud, R., Vuille, M., Compagnucci, R., and Marengo, J.: Present-day South American climate, Palaeogeogr. Palaeocl., 281, 180–195, https://doi.org/10.1016/j.palaeo.2007.10.032, 2009. a, b
Garreaud, R., Lopez, P., Minvielle, M., and Rojas, M.: Large-Scale Control on the Patagonian Climate, J. Climate, 26, 215–230, https://doi.org/10.1175/JCLI-D-12-00001.1, 2013. a
GEBCO Compilation Group: GEBCO 2024 Grid, GEBCO Compilation Group [data set], https://doi.org/10.5285/1c44ce99-0a0d-5f4f-e063-7086abc0ea0f, 2024. a
Girault, I., Todisco, D., Çiner, A., Sarıkaya, M. A., Yıldırım, C., Quiquerez, A., Martin, F., Borrero, L., Fabel, D., Grandjean, P., Nehme, C., and Mouralis, D.: 10Be chronology of deglaciation and ice-dammed lake regression in the vicinity of the Mylodon Cave (Cerro Benítez, Patagonia, Chile), Quaternary Sci. Rev., 278, 107354, https://doi.org/10.1016/j.quascirev.2021.107354, 2022. a
Glasser, N. F. and Ghiglione, M. C.: Structural, tectonic and glaciological controls on the evolution of fjord landscapes, Geomorphology, 105, 291–302, https://doi.org/10.1016/j.geomorph.2008.10.007, 2009. a
Glasser, N. F., Jansson, K. N., Goodfellow, B. W., De Angelis, H., Rodnight, H., and Rood, D. H.: Cosmogenic nuclide exposure ages for moraines in the Lago San Martin Valley, Argentina, Quaternary Res., 75, 636–646, https://doi.org/10.1016/j.yqres.2010.11.005, 2011. a, b
Goyanes, G. and Massabie, A.: Push moraines in the upper valley of Santa Cruz river, southwest Argentina. Structural analysis and relationship with Late Pleistocene paleoclimate, J. S. Am. Earth Sci., 57, 1–11, https://doi.org/10.1016/j.jsames.2014.10.003, 2015. a, b, c
Guérin, G., Mercier, N., and Adamiec, G.: Dose-rate conversion factors: update, Ancient TL, 29, 5–8, 2011. a, b
Hagemann, J. R., Lamy, F., Arz, H. W., Lembke-Jene, L., Auderset, A., Harada, N., Ho, S. L., Iwasaki, S., Kaiser, J., Lange, C. B., and Murayama, M.: A marine record of Patagonian ice sheet changes over the past 140,000 years, P. Natl. Acad. Sci. USA, 121, e2302983121, https://doi.org/10.1073/pnas.2302983121, 2024. a, b
Hall, B., Lowell, T., and Brickle, P.: Multiple glacial maxima of similar extent at 20–45 ka on Mt. Usborne, East Falkland, South Atlantic region, Quaternary Sci. Rev., 250, 106677, https://doi.org/10.1016/j.quascirev.2020.106677, 2020. a, b, c, d
Hays, J. D., Imbrie, J., and Shackleton, N. J.: Variations in the Earth's Orbit: Pacemaker of the Ice Ages, Science, 194, 1121–1132, https://doi.org/10.1126/science.194.4270.1121, 1976. a
Hein, A. S., Hulton, N. R. J., Dunai, T. J., Schnabel, C., Kaplan, M. R., Naylor, M., and Xu, S.: Middle Pleistocene glaciation in Patagonia dated by cosmogenic-nuclide measurements on outwash gravels, Earth Planet. Sc. Lett., 286, 184–197, https://doi.org/10.1016/j.epsl.2009.06.026, 2009. a, b, c, d
Hein, A. S., Hulton, N. R. J., Dunai, T. J., Sugden, D. E., Kaplan, M. R., and Xu, S.: The chronology of the Last Glacial Maximum and deglacial events in central Argentine Patagonia, Quaternary Sci. Rev., 29, 1212–1227, https://doi.org/10.1016/j.quascirev.2010.01.020, 2010. a
Hein, A. S., Dunai, T. J., Hulton, N. R., and Xu, S.: Exposure dating outwash gravels to determine the age of the greatest Patagonian glaciations, Geology, 39, 103–106, 2011. a
Hein, A. S., Cogez, A., Darvill, C. M., Mendelova, M., Kaplan, M. R., Herman, F., Dunai, T. J., Norton, K., Xu, S., Christl, M., and Rodés, A.: Regional mid-Pleistocene glaciation in central Patagonia, Quaternary Sci. Rev., 164, 77–94, https://doi.org/10.1016/j.quascirev.2017.03.023, 2017. a, b, c, d
Herman, F. and Brandon, M.: Mid-latitude glacial erosion hotspot related to equatorial shifts in southern Westerlies, Geology, 43, 987–990, 2015. a, b
Hughes, P. D., Gibbard, P. L., and Ehlers, J.: Timing of glaciation during the last glacial cycle: Evaluating the concept of a global 'Last Glacial Maximum' (LGM), Earth-Sci. Rev., 125, 171–198, https://doi.org/10.1016/j.earscirev.2013.07.003, 2013. a
Hulton, N. R. J., Purves, R. S., McCulloch, R. D., Sugden, D. E., and Bentley, M. J.: The Last Glacial Maximum and deglaciation in southern South America, Quaternary Sci. Rev., 21, 233–241, https://doi.org/10.1016/S0277-3791(01)00103-2, 2002. a
Huntley, D. J. and Lamothe, M.: Ubiquity of anomalous fading in K-feldspars and the measurement and correction for it in optical dating, Can. J. Earth Sci., 38, 1093–1106, https://doi.org/10.1139/e01-013, 2001. a, b
Huybers, P. and Denton, G.: Antarctic temperature at orbital timescales controlled by local summer duration, Nat. Geosci., 1, 787–792, https://doi.org/10.1038/ngeo311, 2008. a
Imbrie, J., Berger, A., Boyle, E. A., Clemens, S. C., Duffy, A., Howard, W. R., Kukla, G., Kutzbach, J., Martinson, D. G., McIntyre, A., Mix, A. C., Molfino, B., Morley, J. J., Peterson, L. C., Pisias, N. G., Prell, W. L., Raymo, M. E., Shackleton, N. J., and Toggweiler, J. R.: On the structure and origin of major glaciation cycles 2. The 100,000-year cycle, Paleoceanography, 8, 699–735, https://doi.org/10.1029/93PA02751, 1993. a
Instituto Geográfico Nacional: Modelo Digital de Elevaciones [data set], https://www.ign.gob.ar/NuestrasActividades/Geodesia/ModeloDigitalElevaciones/Introduccion, last access: 31 August 2020. a
Jones, A. G., Marcott, S. A., Gorin, A. L., Kennedy, T. M., Shakun, J. D., Goehring, B. M., Menounos, B., Clark, D. H., Romero, M., and Caffee, M. W.: Four North American glaciers advanced past their modern positions thousands of years apart in the Holocene, The Cryosphere, 17, 5459–5475, https://doi.org/10.5194/tc-17-5459-2023, 2023. a
Jones, R., Small, D., Cahill, N., Bentley, M., and Whitehouse, P.: iceTEA: Tools for plotting and analysing cosmogenic-nuclide surface-exposure data from former ice margins, Quat. Geochronol., 51, 72–86, https://doi.org/10.1016/j.quageo.2019.01.001, 2019. a
Jouzel, J., Masson-Delmotte, V., Cattani, O., Dreyfus, G., Falourd, S., Hoffmann, G., Minster, B., Nouet, J., Barnola, J. M., Chappellaz, J., Fischer, H., Gallet, J. C., Johnsen, S., Leuenberger, M., Loulergue, L., Luethi, D., Oerter, H., Parrenin, F., Raisbeck, G., Raynaud, D., Schilt, A., Schwander, J., Selmo, E., Souchez, R., Spahni, R., Stauffer, B., Steffensen, J. P., Stenni, B., Stocker, T. F., Tison, J. L., Werner, M., and Wolff, E. W.: Orbital and Millennial Antarctic Climate Variability over the Past 800,000 Years, Science, 317, 793–796, https://doi.org/10.1126/science.1141038, 2007. a, b
Kalnay, E., Kanamitsu, M., Kistler, R., Collins, W., Deaven, D., Gandin, L., Iredell, M., Saha, S., White, G., Woollen, J., Zhu, Y., Chelliah, M., Ebisuzaki, W., Higgins, W., Janowiak, J., Mo, K. C., Ropelewski, C., Wang, J., Leetmaa, A., Reynolds, R., Jenne, R., and Joseph, D.: The NCEP/NCAR 40-Year Reanalysis Project, B. Am. Meteorol. Soc., 77, 437–472, https://doi.org/10.1175/1520-0477(1996)077<0437:TNYRP>2.0.CO;2, 1996 (data available at: https://psl.noaa.gov/data/gridded/data.ncep.reanalysis.html, last access: 20 October 2023). a
Kaplan, M. R., Ackert, R. P., Singer, B. S., Douglass, D. C., and Kurz, M. D.: Cosmogenic nuclide chronology of millennial-scale glacial advances during O-isotope stage 2 in Patagonia, Bull. Geol. Soc. Am., 116, 308–321, https://doi.org/10.1130/B25178.1, 2004. a
Kaplan, M. R., Douglass, D. C., Singer, B. S., Ackert, R. P., and Caffee, M. W.: Cosmogenic nuclide chronology of pre-last glacial maximum moraines at Lago Buenos Aires, 46° S, Argentina, Quaternary Res., 63, 301–315, https://doi.org/10.1016/j.yqres.2004.12.003, 2005. a, b, c
Kaplan, M. R., Hein, A. S., Hubbard, A., and Lax, S. M.: Can glacial erosion limit the extent of glaciation?, Geomorphology, 103, 172–179, 2009. a
Kaplan, M. R., Strelin, J. A., Schaefer, J. M., Denton, G. H., Finkel, R. C., Schwartz, R., Putnam, A. E., Vandergoes, M. J., Goehring, B. M., and Travis, S. G.: In-situ cosmogenic 10Be production rate at Lago Argentino, Patagonia: Implications for late-glacial climate chronology, Earth Planet. Sc. Lett., 309, 21–32, https://doi.org/10.1016/j.epsl.2011.06.018, 2011. a, b
Kaplan, M. R., Schaefer, J. M., Strelin, J. A., Denton, G. H., Anderson, R. F., Vandergoes, M. J., Finkel, R. C., Schwartz, R., Travis, S. G., Garcia, J. L., Martini, M. A., and Nielsen, S. H.: Patagonian and southern South Atlantic view of Holocene climate, Quaternary Sci. Rev., 141, 112–125, https://doi.org/10.1016/j.quascirev.2016.03.014, 2016. a
Kelley, S. E., Kaplan, M. R., Schaefer, J. M., Andersen, B. G., Barrell, D. J., Putnam, A. E., Denton, G. H., Schwartz, R., Finkel, R. C., and Doughty, A. M.: High-precision 10 Be chronology of moraines in the Southern Alps indicates synchronous cooling in Antarctica and New Zealand 42,000 years ago, Earth Planet. Sc. Lett., 405, 194–206, https://doi.org/10.1016/j.epsl.2014.07.031, 2014. a, b
Kiernan, K., Fink, D., Greig, D., and Mifud, C.: Cosmogenic radionuclide chronology of pre-last glacial cycle moraines in the Western Arthur range, Southwest Tasmania, Quaternary Sci. Rev., 29, 3286–3297, https://doi.org/10.1016/j.quascirev.2010.07.023, 2010. a
Kohfeld, K., Graham, R., De Boer, A., Sime, L., Wolff, E., Le Quéré, C., and Bopp, L.: Southern Hemisphere westerly wind changes during the Last Glacial Maximum: paleo-data synthesis, Quaternary Sci. Rev., 68, 76–95, https://doi.org/10.1016/j.quascirev.2013.01.017, 2013. a
Lal, D.: Cosmic ray labeling of erosion surfaces: in situ nuclide production rates and erosion models, Earth Planet. Sc. Lett., 104, 424–439, https://doi.org/10.1016/0012-821X(91)90220-C, 1991. a, b, c, d
Lambert, F., Delmonte, B., Petit, J. R., Bigler, M., Kaufmann, P. R., Hutterli, M. A., Stocker, T. F., Ruth, U., Steffensen, J. P., and Maggi, V.: Dust – Climate couplings over the past 800,000 years from the EPICA Dome C ice core, Nature, 452, 616–619, https://doi.org/10.1038/nature06763, 2008. a, b
Leger, T. P. M., Hein, A. S., Bingham, R. G., Martini, M. A., Soteres, R. L., Sagredo, E. A., and Martínez, O. A.: The glacial geomorphology of the Río Corcovado, Río Huemul and Lago Palena/General Vintter valleys, northeastern Patagonia (43° S, 71° W), J. Maps, 16, 651–668, https://doi.org/10.1080/17445647.2020.1794990, 2020. a, b, c, d, e, f, g, h
Leger, T. P. M., Hein, A. S., Rodés, Á., Bingham, R. G., Schimmelpfennig, I., Fabel, D., Tapia, P., and ASTER Team: A cosmogenic nuclide-derived chronology of pre-Last Glacial Cycle glaciations during MIS 8 and MIS 6 in northern Patagonia, Clim. Past, 19, 35–59, https://doi.org/10.5194/cp-19-35-2023, 2023. a, b, c
Lenaerts, J. T. M., Broeke, M. R. v. d., Wessem, J. M. v., Berg, W. J. v. d., Meijgaard, E. v., Ulft, L. H. v., and Schaefer, M.: Extreme Precipitation and Climate Gradients in Patagonia Revealed by High-Resolution Regional Atmospheric Climate Modeling, J. Climate, 27, 4607–4621, https://doi.org/10.1175/JCLI-D-13-00579.1, 2014. a
Li, Y. K.: Determining topographic shielding from digital elevation models for cosmogenic nuclide analysis: a GIS approach and field validation, J. Mt. Sci., 10, 355–362, https://doi.org/10.1007/s11629-013-2564-1, 2013. a
Li, Y. K.: Determining topographic shielding from digital elevation models for cosmogenic nuclide analysis: a GIS model for discrete sample sites, J. Mt. Sci., 15, 939–947, https://doi.org/10.1007/s11629-018-4895-4, 2018. a
Lifton, N., Sato, T., and Dunai, T. J.: Scaling in situ cosmogenic nuclide production rates using analytical approximations to atmospheric cosmic-ray fluxes, Earth Planet. Sc. Lett., 386, 149–160, https://doi.org/10.1016/j.epsl.2013.10.052, 2014. a, b
Lira, M.-P., García, J.-L., Bentley, M. J., Jamieson, S. S. R., Darvill, C. M., Hein, A. S., Fernández, H., Rodés, A., Fabel, D., Smedley, R. K., and Binnie, S. A.: The Last Glacial Maximum and Deglacial History of the Seno Skyring Ice Lobe (52° S), Southern Patagonia, Front. Earth Sci., 10, 892316, https://doi.org/10.3389/feart.2022.892316, 2022. a
Lisiecki, L. E. and Raymo, M. E.: A Pliocene–Pleistocene stack of 57 globally distributed benthic δ18O records, Paleoceanography, 20, 1–17, https://doi.org/10.1029/2004PA001071, 2005. a, b, c, d
Marcott, S. A.: Late Pleistocene and Holocene Glacier and Climate Change, PhD, Oregon State University, Oregon, United States, iSBN: 9781124762432, 2011. a
Mejdahl, V.: Thermoluminescence Dating: Beta-Dose Attenuation in Quartz Grains, Archaeometry, 21, 61–72, https://doi.org/10.1111/j.1475-4754.1979.tb00241.x, 1979. a
Mendelová, M., Hein, A. S., Rodés, A., and Xu, S.: Extensive mountain glaciation in central Patagonia during Marine Isotope Stage 5, Quaternary Sci. Rev., 227, 105996, https://doi.org/10.1016/j.quascirev.2019.105996, 2020. a, b, c, d
Mercer, J. H.: Glacial history of southernmost South America, Quaternary Res., 6, 125–166, https://doi.org/10.1016/0033-5894(76)90047-8, 1976. a, b
Minowa, M., Sugiyama, S., Sakakibara, D., and Skvarca, P.: Seasonal variations in ice-front position controlled by frontal ablation at Glaciar Perito Moreno, the Southern Patagonia Icefield, Front. Earth Sci., 5, 1, https://doi.org/10.3389/feart.2017.00001, 2017. a
Minowa, M., Schaefer, M., Sugiyama, S., Sakakibara, D., and Skvarca, P.: Frontal ablation and mass loss of the Patagonian icefields, Earth Planet. Sc. Lett., 561, 116811, https://doi.org/10.1016/J.EPSL.2021.116811, 2021. a
Moreno, P. I., Denton, G. H., Moreno, H., Lowell, T. V., Putnam, A. E., and Kaplan, M. R.: Radiocarbon chronology of the last glacial maximum and its termination in northwestern Patagonia, Quaternary Sci. Rev., 122, 233–249, https://doi.org/10.1016/j.quascirev.2015.05.027, 2015. a
Moreno, P. I., Vilanova, I., Villa-Martínez, R., Dunbar, R. B., Mucciarone, D. A., Kaplan, M. R., Garreaud, R. D., Rojas, M., Moy, C. M., De Pol-Holz, R., and Lambert, F.: Onset and Evolution of Southern Annular Mode-Like Changes at Centennial Timescale, Sci. Rep.-UK, 8, 3458, https://doi.org/10.1038/s41598-018-21836-6, 2018. a, b
Mouginot, J. and Rignot, E.: Ice motion of the Patagonian Icefields of South America: 1984–2014, Geophys. Res. Lett., 42, 1441–1449, https://doi.org/10.1002/2014GL062661, 2015. a
NOAA National Centers for Environmental Information: ETOPO 2022 15 Arc-Second Global Relief Model, NOAA National Centers for Environmental Information [data set], https://doi.org/10.25921/fd45-gt74, 2022. a
Nelson, M. S., Gray, H. J., Johnson, J. A., Rittenour, T. M., Feathers, J. K., and Mahan, S. A.: User Guide for Luminescence Sampling in Archaeological and Geological Contexts, Advances in Archaeological Practice, 3, 166–177, https://doi.org/10.7183/2326-3768.3.2.166, 2015. a
Nishiizumi, K., Imamura, M., Caffee, M. W., Southon, J. R., Finkel, R. C., and McAninch, J.: Absolute calibration of 10Be AMS standards, Nucl. Instrum. Meth. B, 258, 403–413, https://doi.org/10.1016/j.nimb.2007.01.297, 2007. a
Pasquini, A. I., Cosentino, N. J., and Depetris, P. J.: The Main Hydrological Features of Patagonia's Santa Cruz River: An Updated Assessment, in: Environmental Assessment of Patagonia's Water Resources, Environmental Earth Sciences, edited by: Torres, A. I. and Campodonico, V. A., Springer International Publishing, Cham, https://doi.org/10.1007/978-3-030-89676-8_9, pp. 195–210, 2021. a
Peltier, C., Kaplan, M. R., Birkel, S. D., Soteres, R. L., Sagredo, E. A., Aravena, J. C., Araos, J., Moreno, P. I., Schwartz, R., and Schaefer, J. M.: The large MIS 4 and long MIS 2 glacier maxima on the southern tip of South America, Quaternary Sci. Rev., 262, 106858, https://doi.org/10.1016/J.QUASCIREV.2021.106858, 2021. a
Peltier, C., Kaplan, M. R., Sagredo, E. A., Moreno, P. I., Araos, J., Birkel, S. D., Villa-Martínez, R., Schwartz, R., Reynhout, S. A., and Schaefer, J. M.: The last two glacial cycles in central Patagonia: A precise record from the Ñirehuao glacier lobe, Quaternary Sci. Rev., 304, 107873, https://doi.org/10.1016/j.quascirev.2022.107873, 2023. a, b, c, d, e
Putnam, A. E., Schaefer, J. M., Denton, G. H., Barrell, D. J., Birkel, S. D., Andersen, B. G., Kaplan, M. R., Finkel, R. C., Schwartz, R., and Doughty, A. M.: The Last Glacial Maximum at 44°S documented by a 10Be moraine chronology at Lake Ohau, Southern Alps of New Zealand, Quaternary Sci. Rev., 62, 114–141, https://doi.org/10.1016/j.quascirev.2012.10.034, 2013. a, b, c, d
Rabassa, J. and Clapperton, C. M.: Quaternary glaciations of the southern Andes, Quaternary Sci. Rev., 9, 153–174, https://doi.org/10.1016/0277-3791(90)90016-4, 1990. a
Ramos, V. A. and Kay, S. M.: Southern Patagonian plateau basalts and deformation: Backarc testimony of ridge collisions, Tectonophysics, 205, 261–282, https://doi.org/10.1016/0040-1951(92)90430-E, 1992. a
Rees-Jones, J.: Optical dating of young sediments using fine-grain quartz, Ancient TL, 13, 9–15, 1995. a
Reynhout, S. A., Sagredo, E. A., Kaplan, M. R., Aravena, J. C., Martini, M. A., Moreno, P. I., Rojas, M., Schwartz, R., and Schaefer, J. M.: Holocene glacier fluctuations in Patagonia are modulated by summer insolation intensity and paced by Southern Annular Mode-like variability, Quaternary Sci. Rev., 220, 178–187, https://doi.org/10.1016/j.quascirev.2019.05.029, 2019. a
Romero, M., Penprase, S., Van Wyk de Vries, M., Wickert, A., Jones, A., Marcott, S., Strelin, J., Martini, M., Rittenour, T., Brignone, G., Shapley, M., Ito, E., MacGregor, K., and Caffee, M.: Shapefiles of Lago Argentino – Rio Santa Cruz glacial landforms, Zenodo [data set], https://doi.org/10.5281/zenodo.11556612, 2024. a
Rose, B. E. J.: Insolation, The Climate Laboratory [code], https://climlab.readthedocs.io/en/latest/index.html, last access: 20 October 2023. a
Rother, H., Fink, D., Shulmeister, J., Mifsud, C., Evans, M., and Pugh, J.: The early rise and late demise of New Zealand's last glacial maximum, P. Natl. Acad. Sci. USA, 111, 11630–11635, 2014. a
Rudolph, E. M., Hedding, D. W., Hodgson, D. A., Fabel, D., Gheorghiu, D. M., Shanks, R., and Nel, W.: A glacial chronology for sub-Antarctic Marion Island from MIS 2 and MIS 3, Quaternary Sci. Rev., 325, 108485, 2024. a
Sagredo, E. A., Moreno, P. I., Villa-Martínez, R., Kaplan, M. R., Kubik, P. W., and Stern, C. R.: Fluctuations of the Última Esperanza ice lobe (52° S), Chilean Patagonia, during the last glacial maximum and termination 1, Geomorphology, 125, 92–108, https://doi.org/10.1016/j.geomorph.2010.09.007, 2011. a, b, c
Sagredo, E. A., Reynhout, S. A., Kaplan, M. R., Aravena, J. C., Araya, P. S., Luckman, B. H., Schwartz, R., and Schaefer, J. M.: Holocene History of Río Tranquilo Glacier, Monte San Lorenzo (47° S), Central Patagonia, Front. Earth Sci., 9, https://doi.org/10.3389/feart.2021.813433, 2021. a
Schaefer, J. M., Putnam, A. E., Denton, G. H., Kaplan, M. R., Birkel, S., Doughty, A. M., Kelley, S., Barrell, D. J., Finkel, R. C., Winckler, G., Anderson, R. F., Ninneman, U. S., Barker, S., Schwartz, R., Andersen, B. G., and Schluechter, C.: The Southern Glacial Maximum 65,000 years ago and its Unfinished Termination, Quaternary Sci. Rev., 114, 52–60, https://doi.org/10.1016/J.QUASCIREV.2015.02.009, 2015. a
Shulmeister, J., Thackray, G. D., Rittenour, T. M., and Hyatt, O. M.: Multiple glacial advances in the Rangitata Valley, South Island, New Zealand, imply roles for Southern Hemisphere westerlies and summer insolation in MIS 3 glacial advances, Quaternary Res., 89, 375–393, https://doi.org/10.1017/qua.2017.108, 2018. a
Shulmeister, J., Thackray, G. D., Rittenour, T. M., Fink, D., and Patton, N. R.: The timing and nature of the last glacial cycle in New Zealand, Quaternary Sci. Rev., 206, 1–20, https://doi.org/10.1016/j.quascirev.2018.12.020, 2019. a, b, c, d
Sigman, D. M., Jaccard, S. L., and Haug, G. H.: Polar ocean stratification in a cold climate, Nature, 428, 59–63, https://doi.org/10.1038/nature02357, 2004. a
Smedley, R. K., Glasser, N. F., and Duller, G. A. T.: Luminescence dating of glacial advances at Lago Buenos Aires (46° S), Patagonia, Quaternary Sci. Rev., 134, 59–73, https://doi.org/10.1016/j.quascirev.2015.12.010, 2016. a, b
Soteres, R. L., Peltier, C., Kaplan, M. R., and Sagredo, E. A.: Glacial geomorphology of the Strait of Magellan ice lobe, southernmost Patagonia, South America, J. Maps, 16, 299–312, https://doi.org/10.1080/17445647.2020.1736197, 2020. a, b, c
Soteres, R. L., Sagredo, E. A., Moreno, P. I., Lowell, T. V., and Alloway, B. V.: Glacial geomorphology of the central and southern Chilotan Archipelago (42.2° S–43.5° S), northwestern Patagonia, J. Maps, 18, 151–167, https://doi.org/10.1080/17445647.2021.2008538, 2022. a
Sproson, A. D., Yokoyama, Y., Miyairi, Y., Aze, T., Clementi, V. J., Riechelson, H., Bova, S. C., Rosenthal, Y., and Childress, L. B.: Near-synchronous Northern Hemisphere and Patagonian Ice Sheet variation over the last glacial cycle, Nat. Geosci., 17, 450–457, https://doi.org/10.1038/s41561-024-01436-y, 2024. a, b
Stone, J. O.: Air pressure and cosmogenic isotope production, J. Geophys. Res.-Sol. Ea., 105, 23753–23759, https://doi.org/10.1029/2000JB900181, 2000. a, b, c, d
Strand, P. D., Schaefer, J. M., Putnam, A. E., Denton, G. H., Barrell, D. J. A., Koffman, T. N. B., and Schwartz, R.: Millennial-scale pulsebeat of glaciation in the Southern Alps of New Zealand, Quaternary Sci. Rev., 220, 165–177, https://doi.org/10.1016/j.quascirev.2019.07.022, 2019. a, b
Strelin, J. A. and Malagnino, E. C.: Glaciaciones Pleistocenas de Lago Argentino y Alto Valle del Río Santa Cruz. XIII Congreso Geológico Argentino, Buenos Aires, 13–18 October 1996, 4, 311–325, 1996. a, b, c, d, e, f, g, h, i, j, k, l, m, n, o, p, q, r, s, t, u, v, w
Strelin, J. A. and Malagnino, E.: Charles darwin and the oldest glacial events in patagonia: the erratic blocks of the río santa cruz valley, Revista de la Asociación Geológica Argentina, 64, 101–108, 2009. a, b, c, d, e, f, g, h, i
Strelin, J. A., Re, G., Keller, R., and Malagnino, E.: New evidence concerning the Plio–Pleistocene landscape evolution of southern Santa Cruz region, J. S. Am. Earth Sci., 12, 333–341, https://doi.org/10.1016/S0895-9811(99)00022-X, 1999. a, b, c, d
Strelin, J. A., Denton, G. H., Vandergoes, M. J., Ninnemann, U. S., and Putnam, A. E.: Radiocarbon chronology of the late-glacial Puerto Bandera moraines, Southern Patagonian Icefield, Argentina, Quaternary Sci. Rev., 30, 2551–2569, https://doi.org/10.1016/j.quascirev.2011.05.004, 2011. a, b, c
Strelin, J. A., Kaplan, M. R., Vandergoes, M. J., Denton, G. H., and Schaefer, J. M.: Holocene glacier history of the Lago Argentino basin, Southern Patagonian Icefield, Quaternary Sci. Rev., 101, 124–145, https://doi.org/10.1016/j.quascirev.2014.06.026, 2014. a, b
Sugden, D. E., Hulton, N. R. J., and Purves, R. S.: Modelling the inception of the Patagonian icesheet, Quatern. Int., 95–96, 55–64, https://doi.org/10.1016/S1040-6182(02)00027-7, 2002. a
Van Wyk de Vries, M., Ito, E., Shapley, M., Brignone, G., Romero, M., Wickert, A. D., Miller, L. H., and MacGregor, K. R.: Physical Limnology and Sediment Dynamics of Lago Argentino, the World's Largest Ice-Contact Lake, J. Geophys. Res.-Earth, 127, e2022JF006598, https://doi.org/10.1029/2022JF006598, 2022. a
Van Wyk De Vries, M., Romero, M., Penprase, S. B., Ng, G.-H. C., and Wickert, A. D.: Increasing rate of 21st century volume loss of the Patagonian Icefields measured from proglacial river discharge, J. Glaciol., 69, 1187–1202, https://doi.org/10.1017/jog.2023.9, 2023. a
Wallinga, J., Murray, A., and Wintle, A.: The single-aliquot regenerative-dose (SAR) protocol applied to coarse-grain feldspar, Radiat. Meas., 32, 529–533, https://doi.org/10.1016/S1350-4487(00)00091-3, 2000. a, b
Wenzens, G.: Fluctuations of Outlet and Valley Glaciers in the Southern Andes (Argentina) during the Past 13,000 Years, Quaternary Res., 51, 238–247, https://doi.org/10.1006/qres.1999.2043, 1999. a
Wenzens, G.: Glacier advances east of the Southern Andes between the Last Glacial Maximum and 5,000 BP compared with lake terraces of the endorrheic Lago Cardiel (49° S, Patagonia, Argentina), Z. Geomorphol., 49, 433–454, https://doi.org/10.1127/zfg/49/2005/433, 2005. a
Wolff, E. W., Fischer, H., Fundel, F., Ruth, U., Twarloh, B., Littot, G. C., Mulvaney, R., Röthlisberger, R., de Angelis, M., Boutron, C. F., Hansson, M., Jonsell, U., Hutterli, M. A., Lambert, F., Kaufmann, P., Stauffer, B., Stocker, T. F., Steffensen, J. P., Bigler, M., Siggaard-Andersen, M. L., Udisti, R., Becagli, S., Castellano, E., Severi, M., Wagenbach, D., Barbante, C., Gabrielli, P., and Gaspari, V.: Southern Ocean sea-ice extent, productivity and iron flux over the past eight glacial cycles, Nature, 440, 491–496, https://doi.org/10.1038/nature04614, 2006. a, b, c
The requested paper has a corresponding corrigendum published. Please read the corrigendum first before downloading the article.
- Article
(12330 KB) - Full-text XML
- Corrigendum
-
Supplement
(1944 KB) - BibTeX
- EndNote