the Creative Commons Attribution 4.0 License.
the Creative Commons Attribution 4.0 License.
 | 29 Jul 2024
Interaction between the East Asian summer monsoon and westerlies as shown by tree-ring records
Shengchun Xiao
Xiaomei Peng
Quanyan Tian
Aijun Ding
Jiali Xie
Jingrong Su
Atmospheric circulation changes, their driving mechanisms, and interactions are important topics in global change research. Local changes in the East Asian summer monsoon (EASM) and the midlatitude westerlies will inevitably affect the climate and ecology of the arid zone of northwestern China. Hence, it is important to study these regional changes. While previous studies in this area are all single-point climate reconstruction studies, there is a lack of research on the interaction areas and driving mechanisms of the two major circulations. Dendroclimatology can provide high-resolution, long-term, and reliable multi-point proxies for the study of interannual and interdecadal climate change. We chose to observe these changes in the Alxa Plateau using dendrochronological methods. We assembled ring-width records of Qinghai spruce (Picea crassifolia) in the mountain regions surrounding the Alxa Plateau: the Helan Mountains, Changling Mountain, and Dongda Mountain. The results show that radial growth was indeed affected by changes in the monsoon and westerlies. The heterogeneity of precipitation and climatic wet–dry changes in different regions is primarily influenced by the interactions between atmospheric circulation systems, each with its own dominant controlling factors. In the case of the Helan Mountains, both of these major atmospheric circulation systems play a significant role in shaping climate changes. Changling Mountain in the southern part of the Alxa Plateau is mainly influenced by the EASM. Dongda Mountain is mainly influenced by the westerlies. Understanding these local conditions will help us predict climate changes in northwestern China.
- Article
(6128 KB) - Full-text XML
- BibTeX
- EndNote


The alpine zone of Qinghai–Tibet, the arid zone of the northwestern interior, and the humid zone of the east constitute the three main areas of China's natural geomorphology (Chen et al., 2019a). The northwestern China inland dry zone is located in the hinterland of the Eurasian continent and is among the driest regions in the world. It displays typical climatic characteristics of a continental climate. This region is mainly influenced by the westerlies and the East Asian summer monsoon (EASM). The interaction of these two factors results in high precipitation variability and hence frequent droughts. This was true even before the onset of global climate change in the area, and it has been even more pronounced in recent years. This inland arid zone is ecologically fragile (Chen et al., 2019a, b; Zhang et al., 2023).
The semi-arid and arid regions of northern China are characterized by large areas of sand and desert. They are the second-largest source of dust in the world after the Sahara. Their contribution to global climate change is large. So far inland, the influence of the EASM is often weak (Zhang et al., 2021; Liu et al., 2022). It is opposed by the westerlies that flow from the North Atlantic climate zone toward the East Asian monsoon climate zone (Qu et al., 2004). The interaction between the westerlies and the EASM governs precipitation, water vapor transport, and thus the climate of northwestern China (Feng et al., 2004; Wang et al., 2005; Li et al., 2008; Ma et al., 2011).
To estimate the impact of global change on this interaction, it is crucial to comprehend its historical context. Global atmospheric circulation is likely to change, as is the EASM. Climate change will affect not only the regional climate and regional water resources (Ding et al., 2023); it will also affect East Asia (dust storms) and even the rest of the globe. Hence, the study of climate in this region is of great practical and theoretical significance (Chen et al., 2019a, 9b).
The westerlies and the EASM meet at the northern boundary of the Asian summer monsoon (Huang et al., 2023). In northern China, this boundary runs from west to east, along the eastern section of the Qilian Mountains, the southern foothills of the Helan Mountains, the Daqing Mountains, and the western section of the Daxinganling Mountains. This is not a static boundary. It fluctuates within a range of 200–700 km (Chen et al., 2018). It is important to understand the history of these fluctuations (Huang et al., 2023).
This can be done using climate records such as lacustrine, eolian, and dendrochronological records (Sun et al., 2003; Liu et al., 2005; Li, 2009; Chen et al., 2010, 2019b; Li et al., 2016; Qin et al., 2023). Dendrochronology is one of the best tools for studying paleoclimatic changes due to its precise dating, high resolution, good continuity, and high replication (Zhang et al., 2003; Shao et al., 2010; Yang et al., 2014; Liu et al., 2016).
The climate history of the Baotou area, at the northern edge of the EASM, has been studied at interannual and interdecadal scales for the past 260 years based on June–August precipitation reconstruction from tree-ring samples from the western Yin Mountains (Liu et al., 2001, 2003). Using tree rings and historical records, Kang and Yang (2015) reconstructed the annual precipitation history of the East Asian monsoon northern fringe zone for the last 530 years. They analyzed spatial variability and possible driving mechanisms using the 400 mm isohyet.
Several May–July precipitation sequences have been reconstructed using ring-width and latewood-width data from Chinese pine (Pinus tabulaeformis) growing in the Helan Mountains (Ma et al., 2003; Liu et al., 2004; Chen et al., 2016). Studies of tree-ring carbon and oxygen isotopes from Chinese pine samples have shown that δ18O values increase with summer precipitation, while δ13C values decrease (Q. L. Zhang et al., 2005; Liu et al., 2008). The westerlies have also been shown to affect precipitation in the Helan Mountains (Chen et al., 2010).
Principal component analysis of tree-ring chronologies constructed from data collected at several sites in Gansu suggests that trees at these sites were more influenced by EASM than by westerlies (Chen et al., 2013). These researchers also found that the EASM weakened in the 1970s but recovered in the early 1990s. Tree-ring data allowed the reconstruction of 330 years of PDSI (Palmer Drought Severity Index) values for the Mount Hasi region (at the northern boundary of the summer monsoon zone) (Kang et al., 2012). This study confirmed that radial growth of Chinese pine has declined over the past 3 decades due to the weakening of the EASM. Dendrochronological reconstruction of precipitation in the Mount Changling region (again using Chinese pine) suggested that precipitation in that region mainly depends on the EASM (Chen et al., 2012). Other researchers have assembled tree-ring chronologies from pines growing in the Mount Qilian region and the northern mountains of the Hexi Corridor. Here again precipitation is associated with the EASM. These chronologies have allowed scholars to compile precipitation, temperature, and drought records for the last thousand years (Gou et al., 2015a, b; Zhang et al., 2017).
Most modern research studying climate change in the region is carried out on single sample sites (Wang et al., 2004; Liu et al., 2005, 2016; Chen et al., 2010, 2016, 2018; Li et al., 2016). While there is a dearth of multi-site, regional, and long-timescale studies on the interaction of the westerlies and the EASM, this research focuses on the interplay area and investigates the spatiotemporal heterogeneity in climate change and its dominant driving factors, specifically related to the westerlies and East Asia monsoon circulation in the Alxa Plateau.
Qinghai spruce (Picea crassifolia) is a common tree species in the Helan, Changling, and Dongdashan mountain areas around the Alxa Plateau. Using dendrochronological methods, we analyzed the climate response characteristics of spruce radial growth on the above three mountains. Combining the relevant westerly and East Asia monsoon circulation indices, the driving mechanism of the regional climate change with the interaction and synergistic roles of two atmospheric circulation systems in the Alxa Plateau was explored. The results will lay a theoretical foundation for the climatic evolution of the region and the desertification control.
2.1 Study area
The Alxa Plateau is located in the western part of the Inner Mongolia Autonomous Region and is surrounded by mountains (Fig. 1). It consists primarily of three deserts: Tengger, Ulan Buh, and Badan Jaran. It lies south of the Gobi desert. It is the main source of the fierce sandstorms and dust storms that blow toward eastern China and the Pacific. It has been much affected by climate change; sandstorms and dust storms have increased, much to the detriment of lands to the east. The Chinese government is doing what it can to establish an environmental defense line there. This currently involves the Northern Sand Prevention Belt of the national “Two Ecological Barriers” and “Three Belts” ecological security strategy pattern (Xiao et al., 2017, 2019).
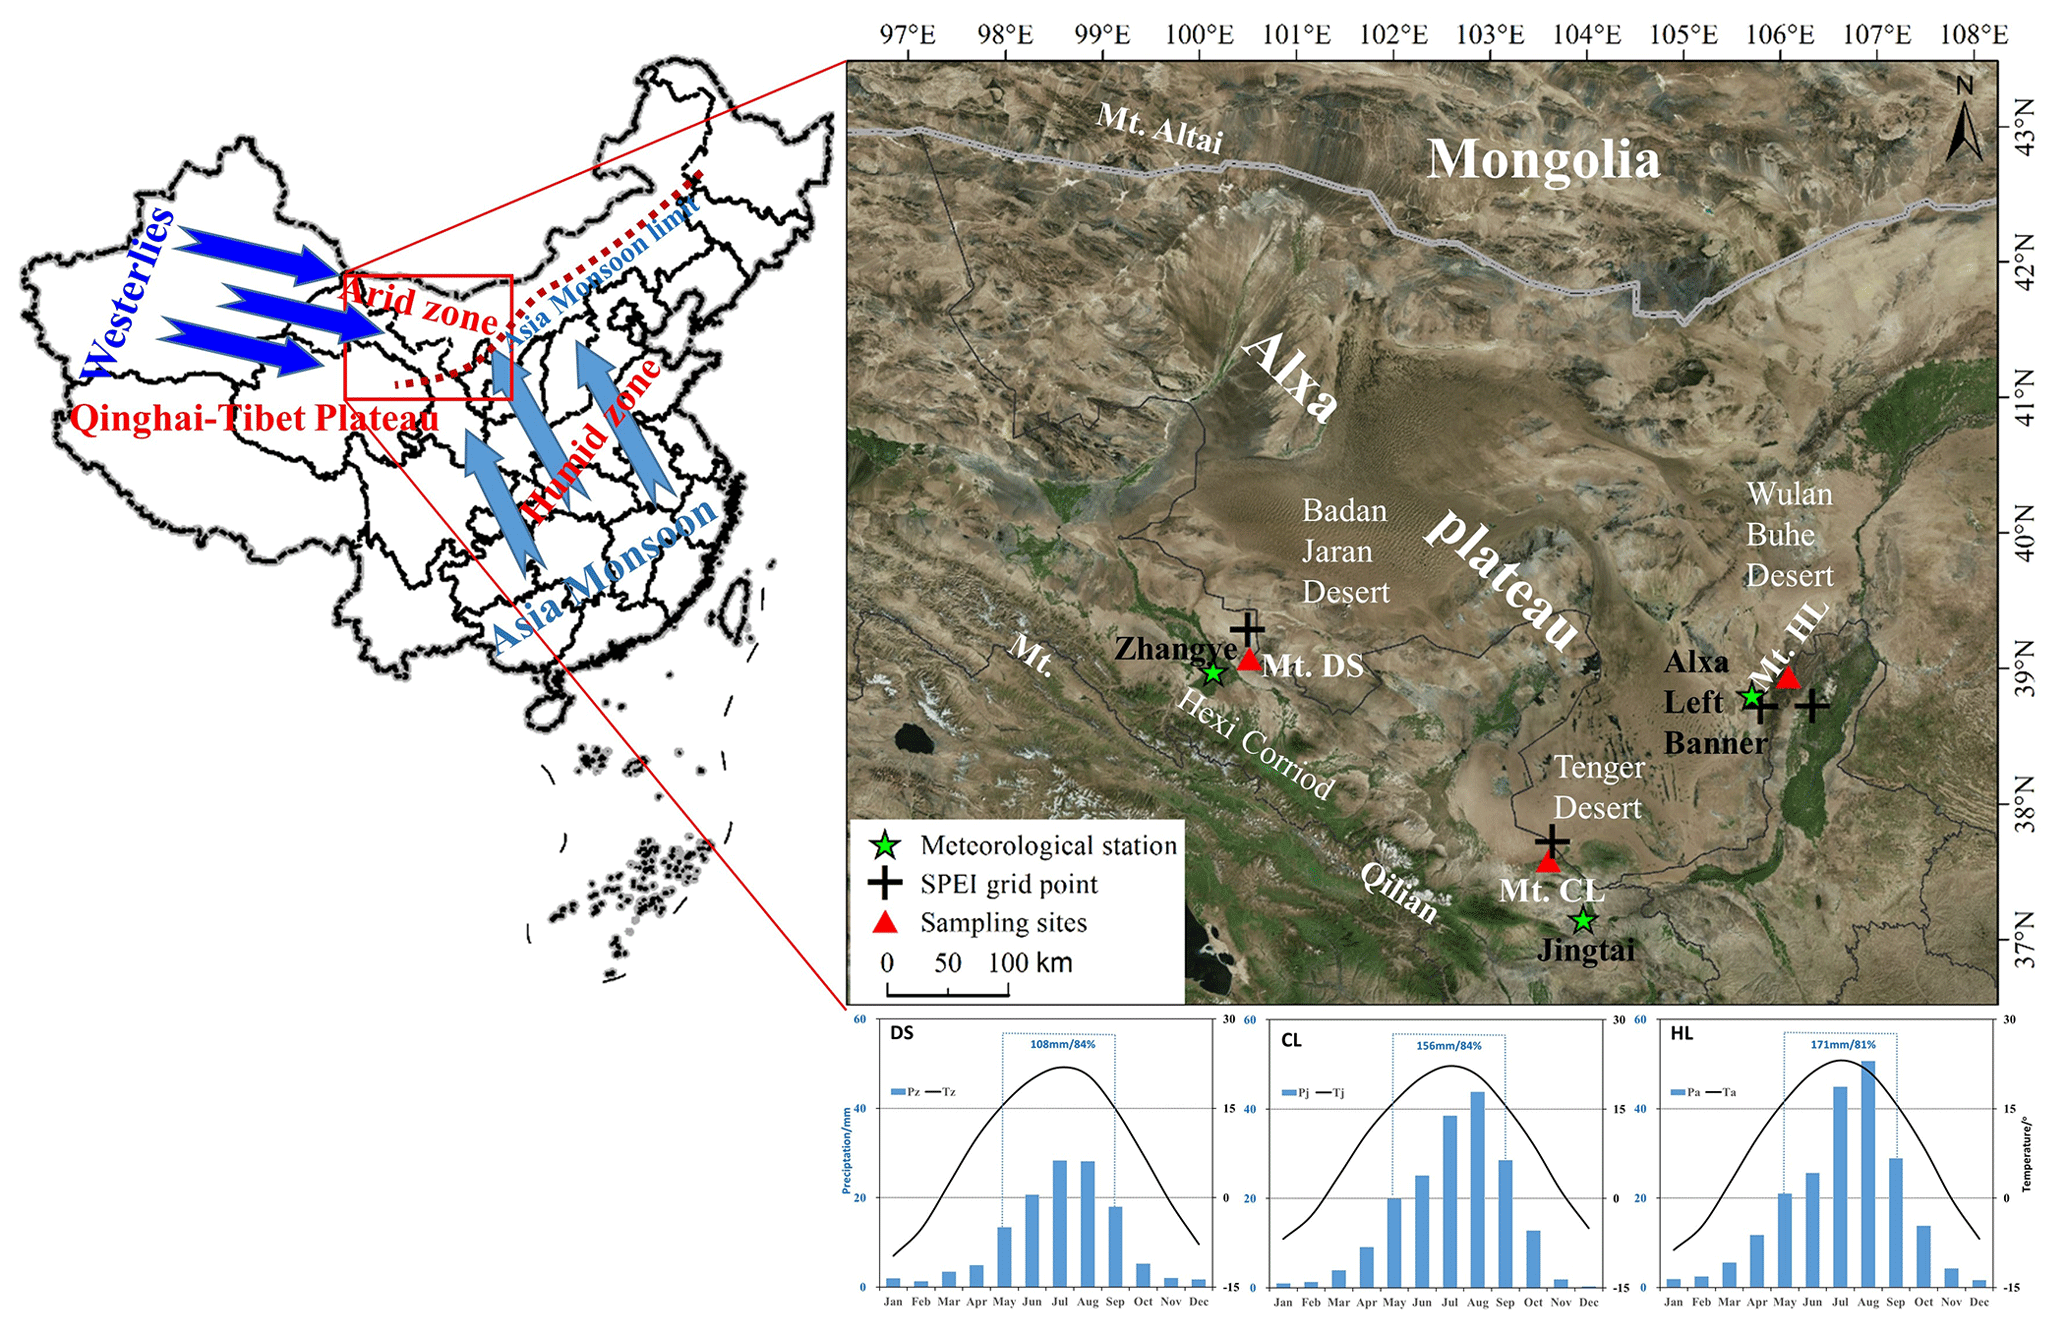
Figure 1Location of tree-ring sampling sites and a climatic diagram of the study area (the upper right panel is from Mapworld). Pa and Ta are the monthly total precipitation and monthly mean temperature at the Alxa Left Banner meteorological station (1953–2016). Pj and Tj are the precipitation and temperature figures for the Jingtai meteorological station (1957–2017). Pz and Tz are the precipitation and temperature figures for the Zhangye meteorological station (1957–2017). The dashed box and appended data indicate the total growing season precipitation in the study area and the proportion of total annual precipitation. Publisher's remark: please note that the above figure contains disputed territories.
There are several mountain ranges surrounding the Alxa Desert, such as the Helan Mountains in the east, the northern mountains of the Hexi Corridor, and the outliers of the Altai Mountains in the north. These mountains not only block the eastward and southward expansion of the desert (driven by high-pressure regions from Mongolia); they are also the source of mountain rivers and streams that water the oases on the plateau.
The Alxa Plateau is located in the eastern margin of the inland arid region of central Asia. It is affected not only by the midlatitude westerly circulation, but also by the Asian monsoon and the Tibet plateau monsoon. It is in the zone where the midlatitude westerly circulation and the Asian monsoon interact (Xiao et al., 2017; Chen et al., 2019b). As a result, vegetation cover in this region there is characterized by pronounced interannual variability (Ou and Qian, 2006; Tang et al., 2006; Li et al., 2013).
The Helan Mountains (38°27′–39°30′ N, 105°20′–106°41′ E) (sampling site henceforth abbreviated as HL) are located at the eastern edge of the Tengger Desert. They stretch more than 200 km from north to south; the main peak is ∼3556 m. The mountain forests are dominated by Qinghai spruce and Chinese pine, juniper, mountain aspen, and elm.
Mount Changling (37°12′–37°17′, 102°45′–103°48′ E) (sampling site henceforth abbreviated as CL) is an independent mountain protruding northward from the remnants of the eastern Qilian Mountains. It is located at the southern edge of the Tengger Desert; its elevations range from 2100 to 2900 m. The dominant tree species are Qinghai spruce and Chinese pine.
Dongdashan (39°00′–39°04′ N, 100°45′–100°51′ E) (sampling site henceforth abbreviated as DS) is located at the southwestern edge of the Badan Jaran Desert and the middle part of Mount Qilian. It is one of the northern mountains along the Hexi Corridor; the range consists of mountains that vary from 2200 to 2637 m in elevation. Forests are dominated by Qinghai spruce and Qilian juniper. The distances between the CL and HL, CL and DS, and DS and HL sampling sites are approximately 250, 310, and 450 km, respectively.
The temperatures of the coldest months recorded at meteorological stations in the Alxa Left Banner (a division of the Alxa League region), Jingtai (a county in Gansu), and Zhangye (a city in Gansu) all occurred in January, ranging from −9.8 to −6.8°. The hottest months at those stations were in July (21.9 to 23.1°). These meteorological stations are the closest stations to our three sampling sites (Fig. 1).
Precipitation measured at those stations varied widely. The multiyear average of total precipitation from May to September was 171 mm at Alxa Left Banner station, 156 mm at Jingtai station, and 108 mm at Zhangye station. This accounted for more than 80 % of the annual precipitation (Fig. 1).
2.2 Sample collection, processing, and data analysis method
2.2.1 Sample collection, processing, and dendrochronology construction
Researchers used standard methods of tree-ring sample collection. One core was drilled from each tree at the sample site. We collected 209 cores in total from five sampling sites at HL, 48 cores from one sampling site at CL, and 81 cores from two sampling sites at DS. Relevant information for the sampling sites is summarized in Table 1.
Table 1Statistical characteristics of the sampling sites and the tree-ring chronologies.
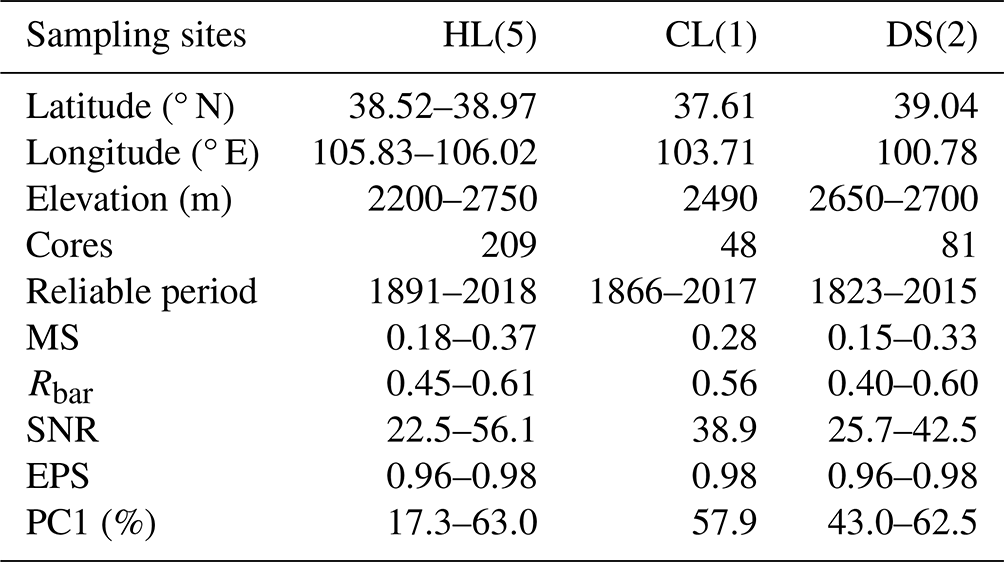
Chronologies were constructed using standard dendrochronological methods (Cook, 1985). In order to highlight the high-frequency signal, the RES chronology is selected for later climate analysis. We calculated the highly significant correlations (P<0.001) between the chronologies of different points at the HL and DS mountains; a weighting method was used to finally synthesize a chronology for each mountain. Generally, the subsample signal strength (SSS) index and the mean series intercorrelation (Rbar) are used to evaluate the credibility and quality of the chronologies. The length of the reliable chronology is indicated by the parts of the series with a subsample signal strength (SSS) index > 0.85 (Wigley et al., 1984). Another important statistic is the mean series intercorrelation (Rbar), which is the mean correlation coefficient among the ring series and is therefore an indication of the common variance.
2.2.2 Climate data, atmospheric circulation indices, and the related analyzing methods for chronological correlation
Climate data for the study areas HL, CL, and DS were collected from the nearest meteorological stations in Alxa Left Banner, Jingtai, and Zhangye, respectively (http://data.cma.cn, last access: 20 March 2024).
We used the SPEI (Standardized Precipitation Evapotranspiration Index) to represent the local drought and wetness conditions, which is widely used in dendrochronology studies and considers the effects of potential evapotranspiration, precipitation, and timescales (Vicente-Serrano et al., 2010). SPEI data (grid-point resolution 0.5°×0.5°) were obtained from the grid-point datasets of the National Center for Environmental Predictions–National Center for Atmospheric Research (NCEP-NCAR). Timescales ranged from 1 to 15 months. The mean values of data from two grid points closest to the HL sampling site (38.75° N, 105.75° E and 38.75° N, 106.25° E; period 1953–2015) were chosen for subsequent analysis. Grid-point data from one site closest to our CL sampling site (37.75° N, 103.75° E; period 1951–2015) were used for later analysis. Grid-point data from one site closest to our DS sampling site (39.25° N, 100.75° E; period 1951–2015) were also used. As SPEI datasets are multiscale, we preprocessed the data to identify and select 11-month scaled SPEI datasets for subsequent analysis.
We took into account the so-called lagging effect (the influence of fall and winter climate factors on the radial growth of trees shows up later in the year) and chose to use temperature, precipitation, and SPEI data from September of the previous year to September of the current year (abbreviated as P9–P12 and C1–C9), as collected at each meteorological station, for our climate response analysis.
The East Asian summer monsoon index (EASMI) represents the activity strength of the EASM. The East Asian summer monsoon (EASM) index is defined as an area-averaged seasonally (JJA) dynamical normalized seasonality (DNS) at 850 hPa within the East Asian monsoon domain (10–40° N, 110–140° E) (Li and Zeng, 2005). Larger EASMI values indicate a stronger summer monsoon and smaller ones a weaker monsoon. In this study, the EASMI (mean values for June–August in the period 1950–2017) defined by Li and Zeng (2005) was used to study the impact of the EASM on climate change in the study area.
We used the westerly circulation index (WCI annual mean; https://cmdp.ncc-cma.net/cn/index.htm, last access: 20 July 2024) to represent the strength of the midlatitude westerlies. The larger the WCI value, the stronger the Eurasian latitudinal circulation; the smaller the value, the weaker the Eurasian latitudinal circulation. WCI data (period 1951–2015) were derived from the Eurasian Latitudinal Circulation Index published by the National Climate Center of the China Meteorological Administration (https://cmdp.ncc-cma.net/cn/index.htm, last access: 20 July 2024.
Interannual and interdecadal (sliding moving average of 11 years) chrono-climatic and chrono-cyclonic index correlation and partial correlation analyses were performed using SPSS 19.0. Based on the characteristics of tree-ring series, the sequences were classified into three groups of low, average, and high ring widths using mean ± 1δ (δ: standard deviation) as the classification criterion (with mean ± 2δ as the extreme year). Correlation statistical tests were performed with the corresponding annual circulation indices; similar treatments and analyses were performed for the two major circulation indices.
3.1 Ring-width chronologies and their characteristics
Based on the sampling cores from five sample sites at HL, two sample sites at DS, and one sample site at CL, ring-width residual chronologies were derived for each of the three study areas (Fig. 2). Statistical parameters showed that the three chronologies meet the usual requirements for correctly performed dendrochronological studies (Table 1).
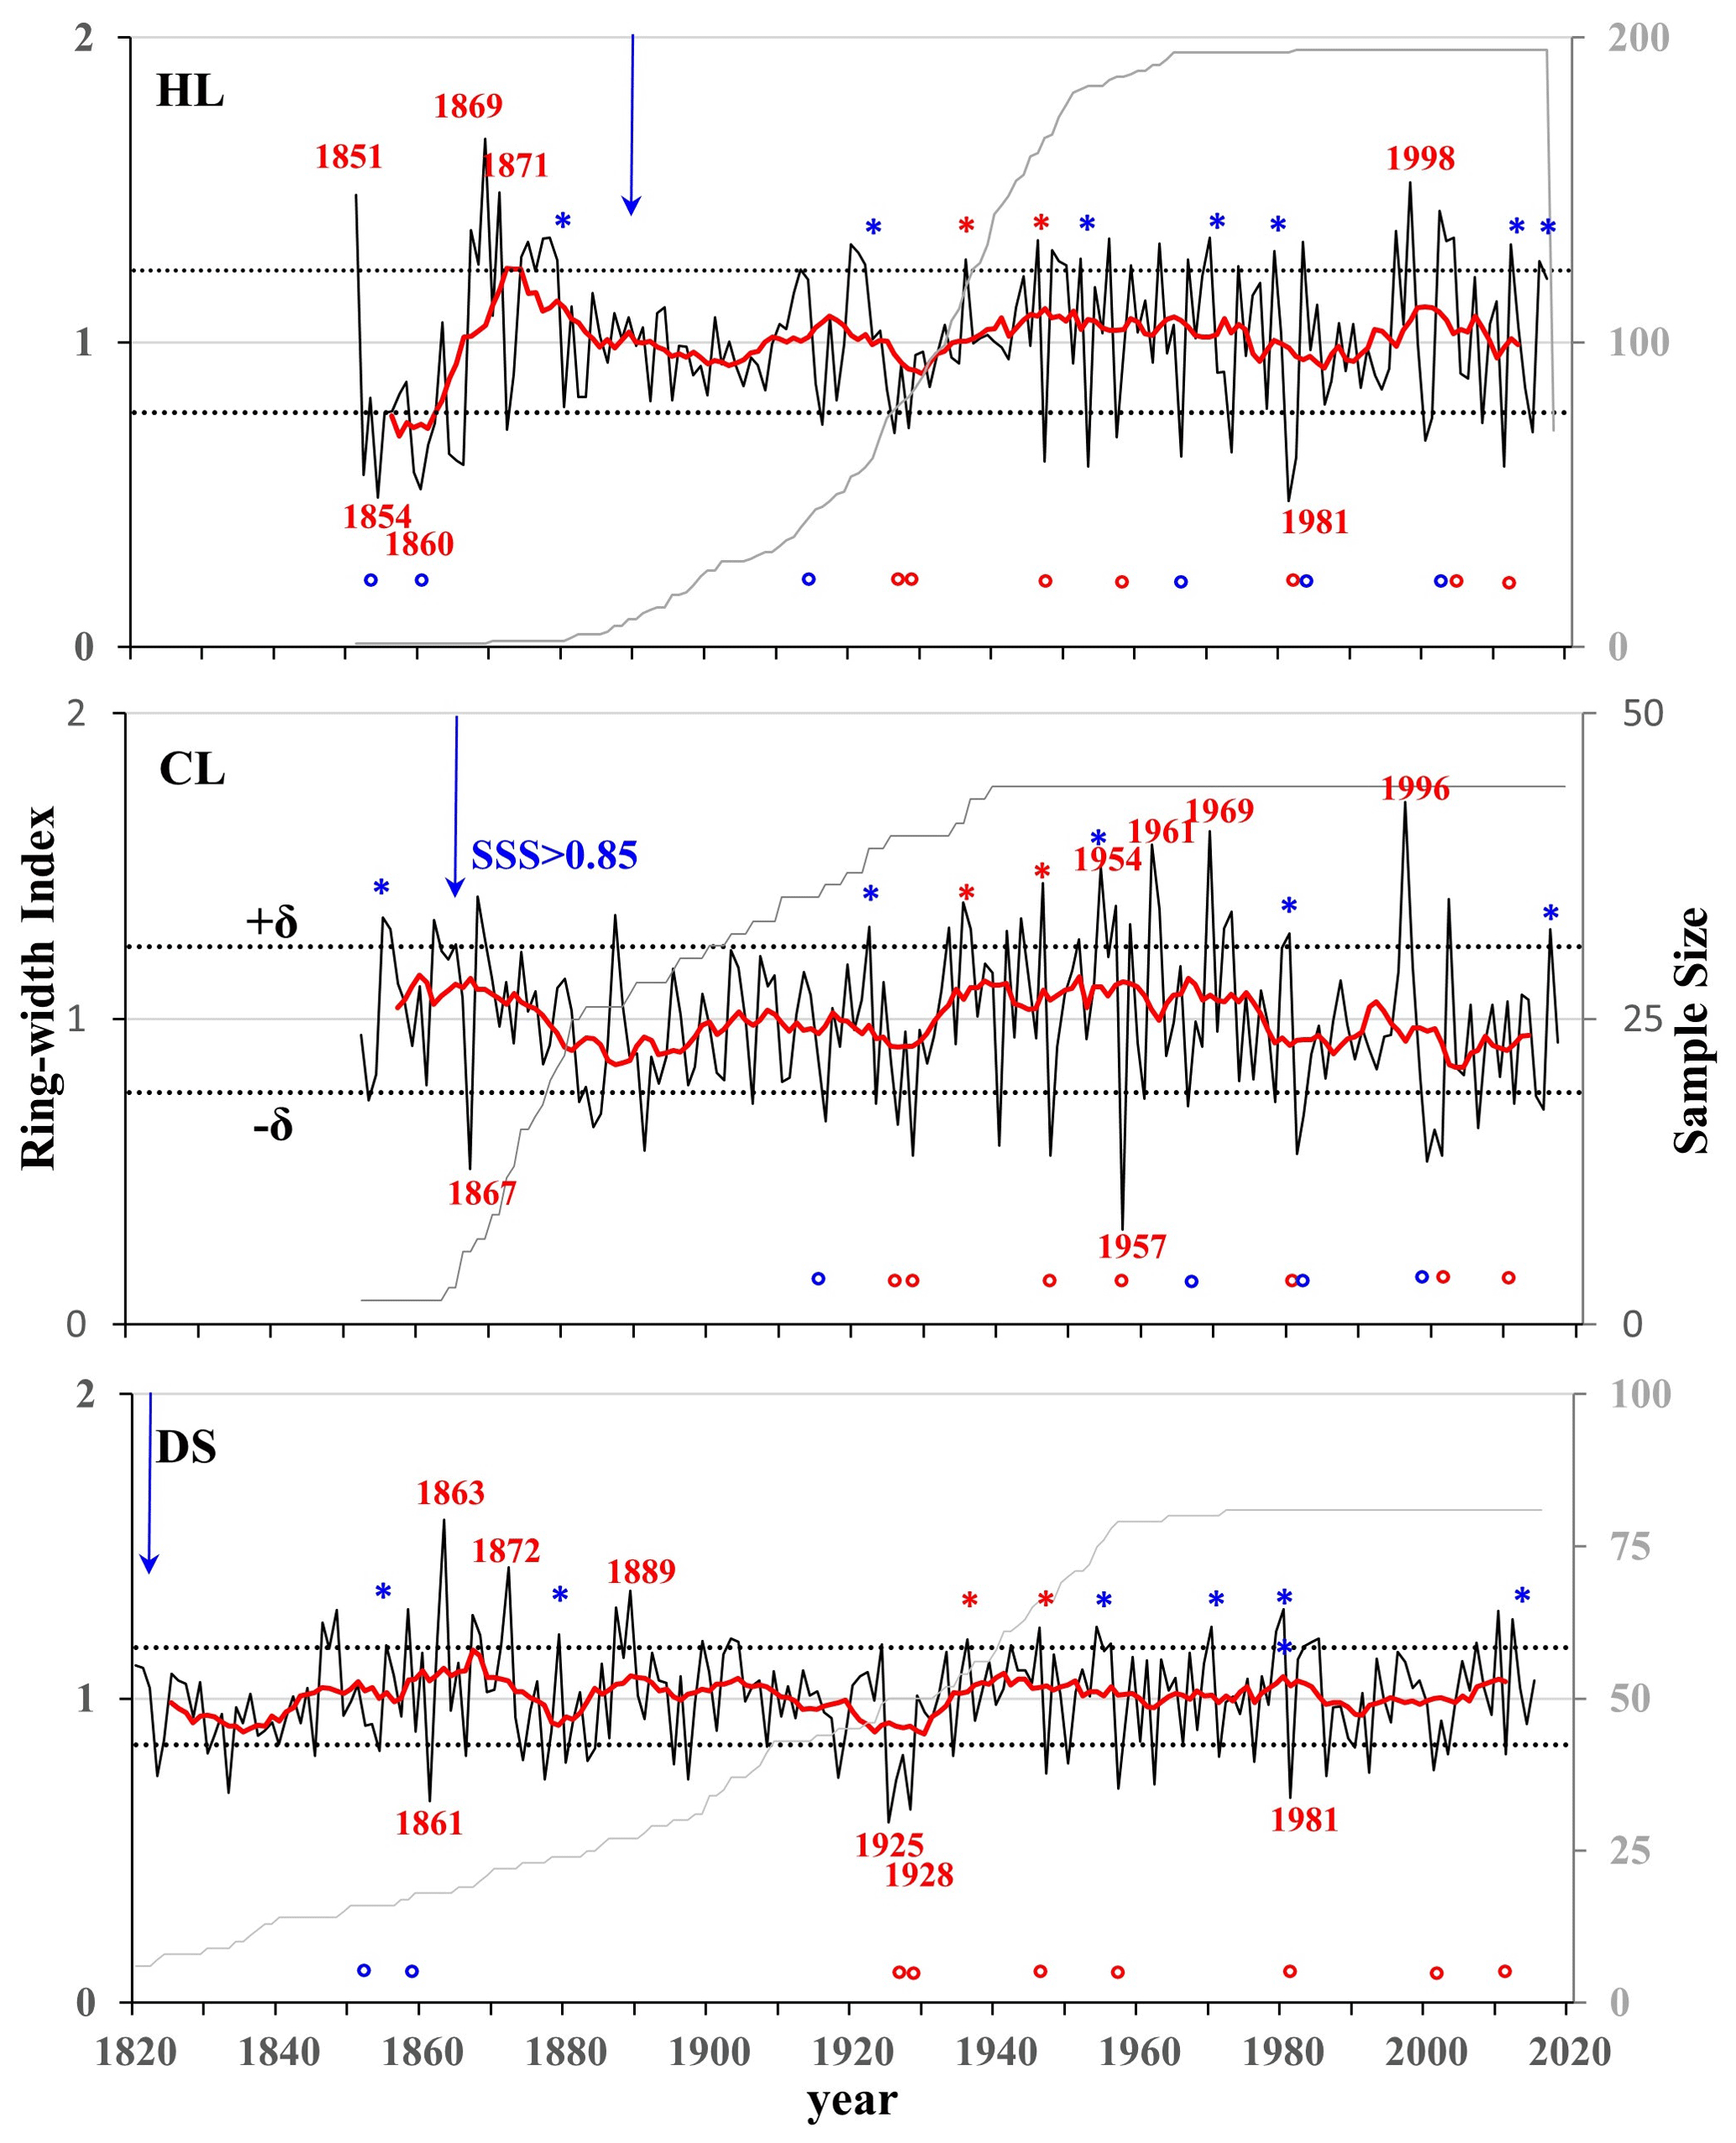
Figure 2Residual ring-width chronologies for the three study areas. The dark lines indicate the chronology; gray lines indicate the sample depth; red lines indicate the 11-year running mean chronology; dotted horizontal lines indicate the mean value ±1δ (years with data identified as mean ±2δ, δ: standard deviation). Blue asterisks (*) and “o” symbols indicate the years shared between two of the three sample sites. Red asterisks (*) and “o” symbols show years shared between three sample sites. Blue arrows indicate the start of the reliable residual chronology (SSS > 0.85).
Reliable period (SSS > 0.85), MS (mean sensitivity), Rbar (mean series intercorrelation), SNR (signal to noise ratio), EPS (expressed population signal), and PC1 (variance explained by the first principal component) refer to residual chronologies.
3.2 Climate response characteristics
Correlation analysis comparing (a) monthly mean temperature and precipitation at neighboring meteorological stations and (b) SPEI at the nearest grid point showed that, overall, the three residual chronologies were correlated negatively with monthly mean air temperature, positively correlated with monthly precipitation, and positively correlated with SPEI during the growing season (Fig. 3).
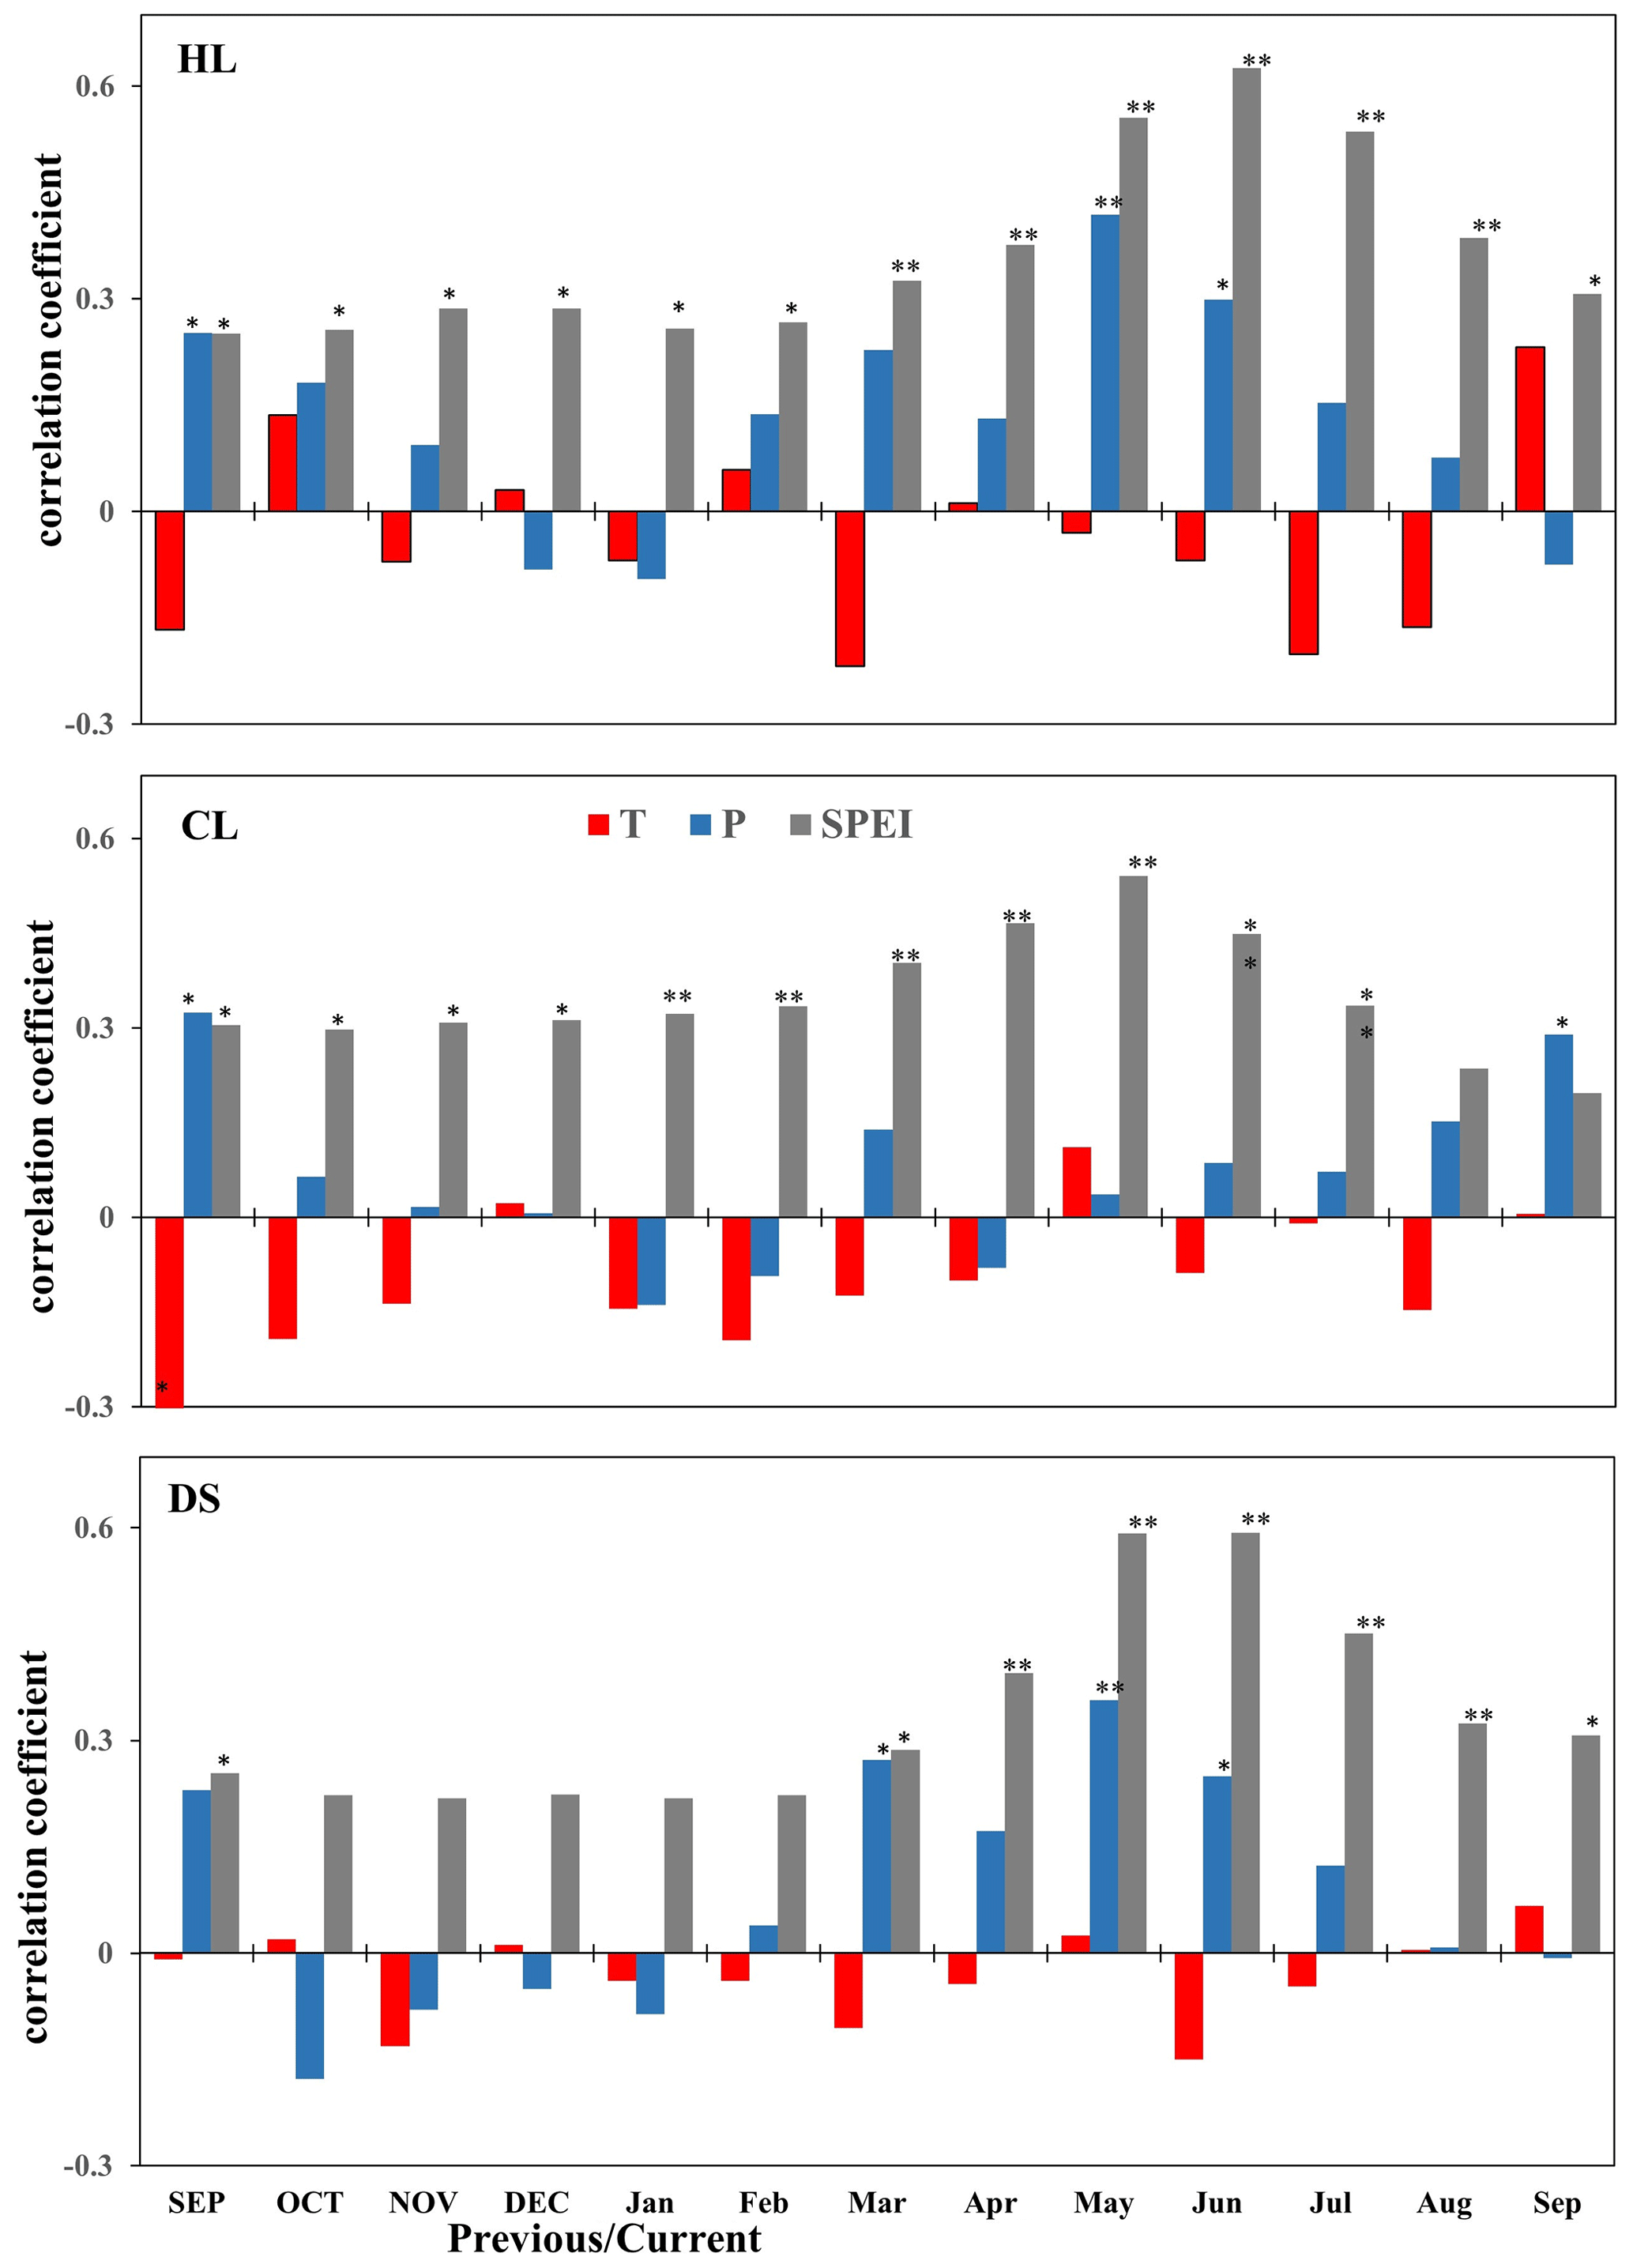
Figure 3Correlation coefficients (Pearson's r values) between the residual ring-width chronologies of Qinghai spruce at the three study areas (HL, CL, and DS) and the observed monthly temperature (T), total monthly precipitation (P), and SPEI. * Pearson's r correlation, significant at P<0.05. Pearson's r correlation, significant at P<0.01. Month names of the previous year are in uppercase letters.
HL chronology was correlated negatively with mean temperature mainly in C5–C8 in the growing season but not at a significant level. It was also positively correlated with precipitation in all months except P12, C1, and C9, reaching significant levels (P<0.05) in P9, C5, and C6. All months were positively correlated with SPEI and reached statistical significance (P<0.05), with C3–C8 showing highly significant correlation levels (P<0.01).
CL chronology was negatively correlated with the mean temperature in most months but only reached a significant negative correlation (P<0.05) with P9. CL chronology was positively correlated with monthly precipitation, save for C1, C2, and C4. Only P9 and C9 reached statistical significance (P<0.05). All months were positively correlated with SPEI, with P9–C7 reaching significant correlation levels (P<0.05) and C1–C7 reaching highly significant correlation levels (P<0.01).
DS chronology showed weak correlations between DS chronology and monthly mean temperatures. None of the correlations reached levels of significance. DS chronology was positively correlated with P9 and C2–C8 precipitation and reached significant correlation levels for C3, C5, and C6 (P<0.05). All months were positively correlated with SPEI, with P9 and C3–C9 reaching significant correlation levels (P<0.05) and C4–C8 reaching highly significant correlation levels (P<0.01).
Overall, the radial growth of Qinghai spruce at the three study areas seems to have been limited, for the most part, by low precipitation during the growing season (April–July). The three chronologies reflect regional wet and dry variations.
3.3 Regional climate changes as recorded by tree-ring widths
3.3.1 Regional climate change viewed at interannual scales
On interannual scales, the three residual chronologies, when compared, showed highly significant correlations (HL–CL: n=166, r=0.298, P<0.001; HL-DS: n=165, r=0.331, P<0.001; CL–DS: n=164, r=0.374, P<0.001). This indicates that there was a high degree of consistency in the radial growth of Qinghai spruce in the three regions.
According to the results of the chronology–climate response analysis in the previous section, the high and low ring-width indices (mean ± 1 − 2δ) of the chronology at the three sample sites indicate wetter or drier and extreme wet or dry years, respectively (Fig. 2).
Overall, the three ring-width residual chronologies (HL, CL, DS) had a total of 2 shared wetter years and 7 shared drier years. The HL and CL chronologies shared 4 wet years and 11 dry years, the HL and DS chronologies shared 5 wet years and 9 dry years, and the CL and DS chronologies shared 5 wet years and 7 dry years (Fig. 2).
There were no extremely wet years shared by the three sample sites. However, there were 2 shared wetter years in 1936 and 1946 and several shared wetter years in later years among the three sample sites. For example, note the wetter years in 1922 and 2016 for HL and DS chronologies; 1959, 1979, and 2012 for HL and DS chronologies; and 1855, 1954, and 1980 for CL and DS chronologies (Fig. 2).
The extreme drought years are consistent among the three sample sites. For instance, there was an extreme drought year in 1981 at HL and DS sample sites; it was also a drought year at CL. An extreme drought year at CL in 1957 was also a drought year for the other two chronologies. Moreover, the extreme drought year of 1928 at DS was a drought year at the other two sites. Drought years in 1926, 1947, 2001, and 2011 were seen at all three sites and at two of the three sample sites (1916, 1966, 1982, and 2000 at HL and CL; 1854 and 1861 at HL and DS) (Fig. 2).
3.3.2 Characteristics of regional climate change at interdecadal scales
On the decadal scale, the 11 a running mean series indicates that at the HL site there were four wetter periods (mid-1860s to early 1880s, 1910s to 1920s, mid-1930s to mid-1970s, and late 1990s to early 2010s). Four drought periods were seen (mid-1850s to mid-1860s, early 1890s to late 1900s, circa 1930s, and mid-1970s to 1980s) (Fig. 4).
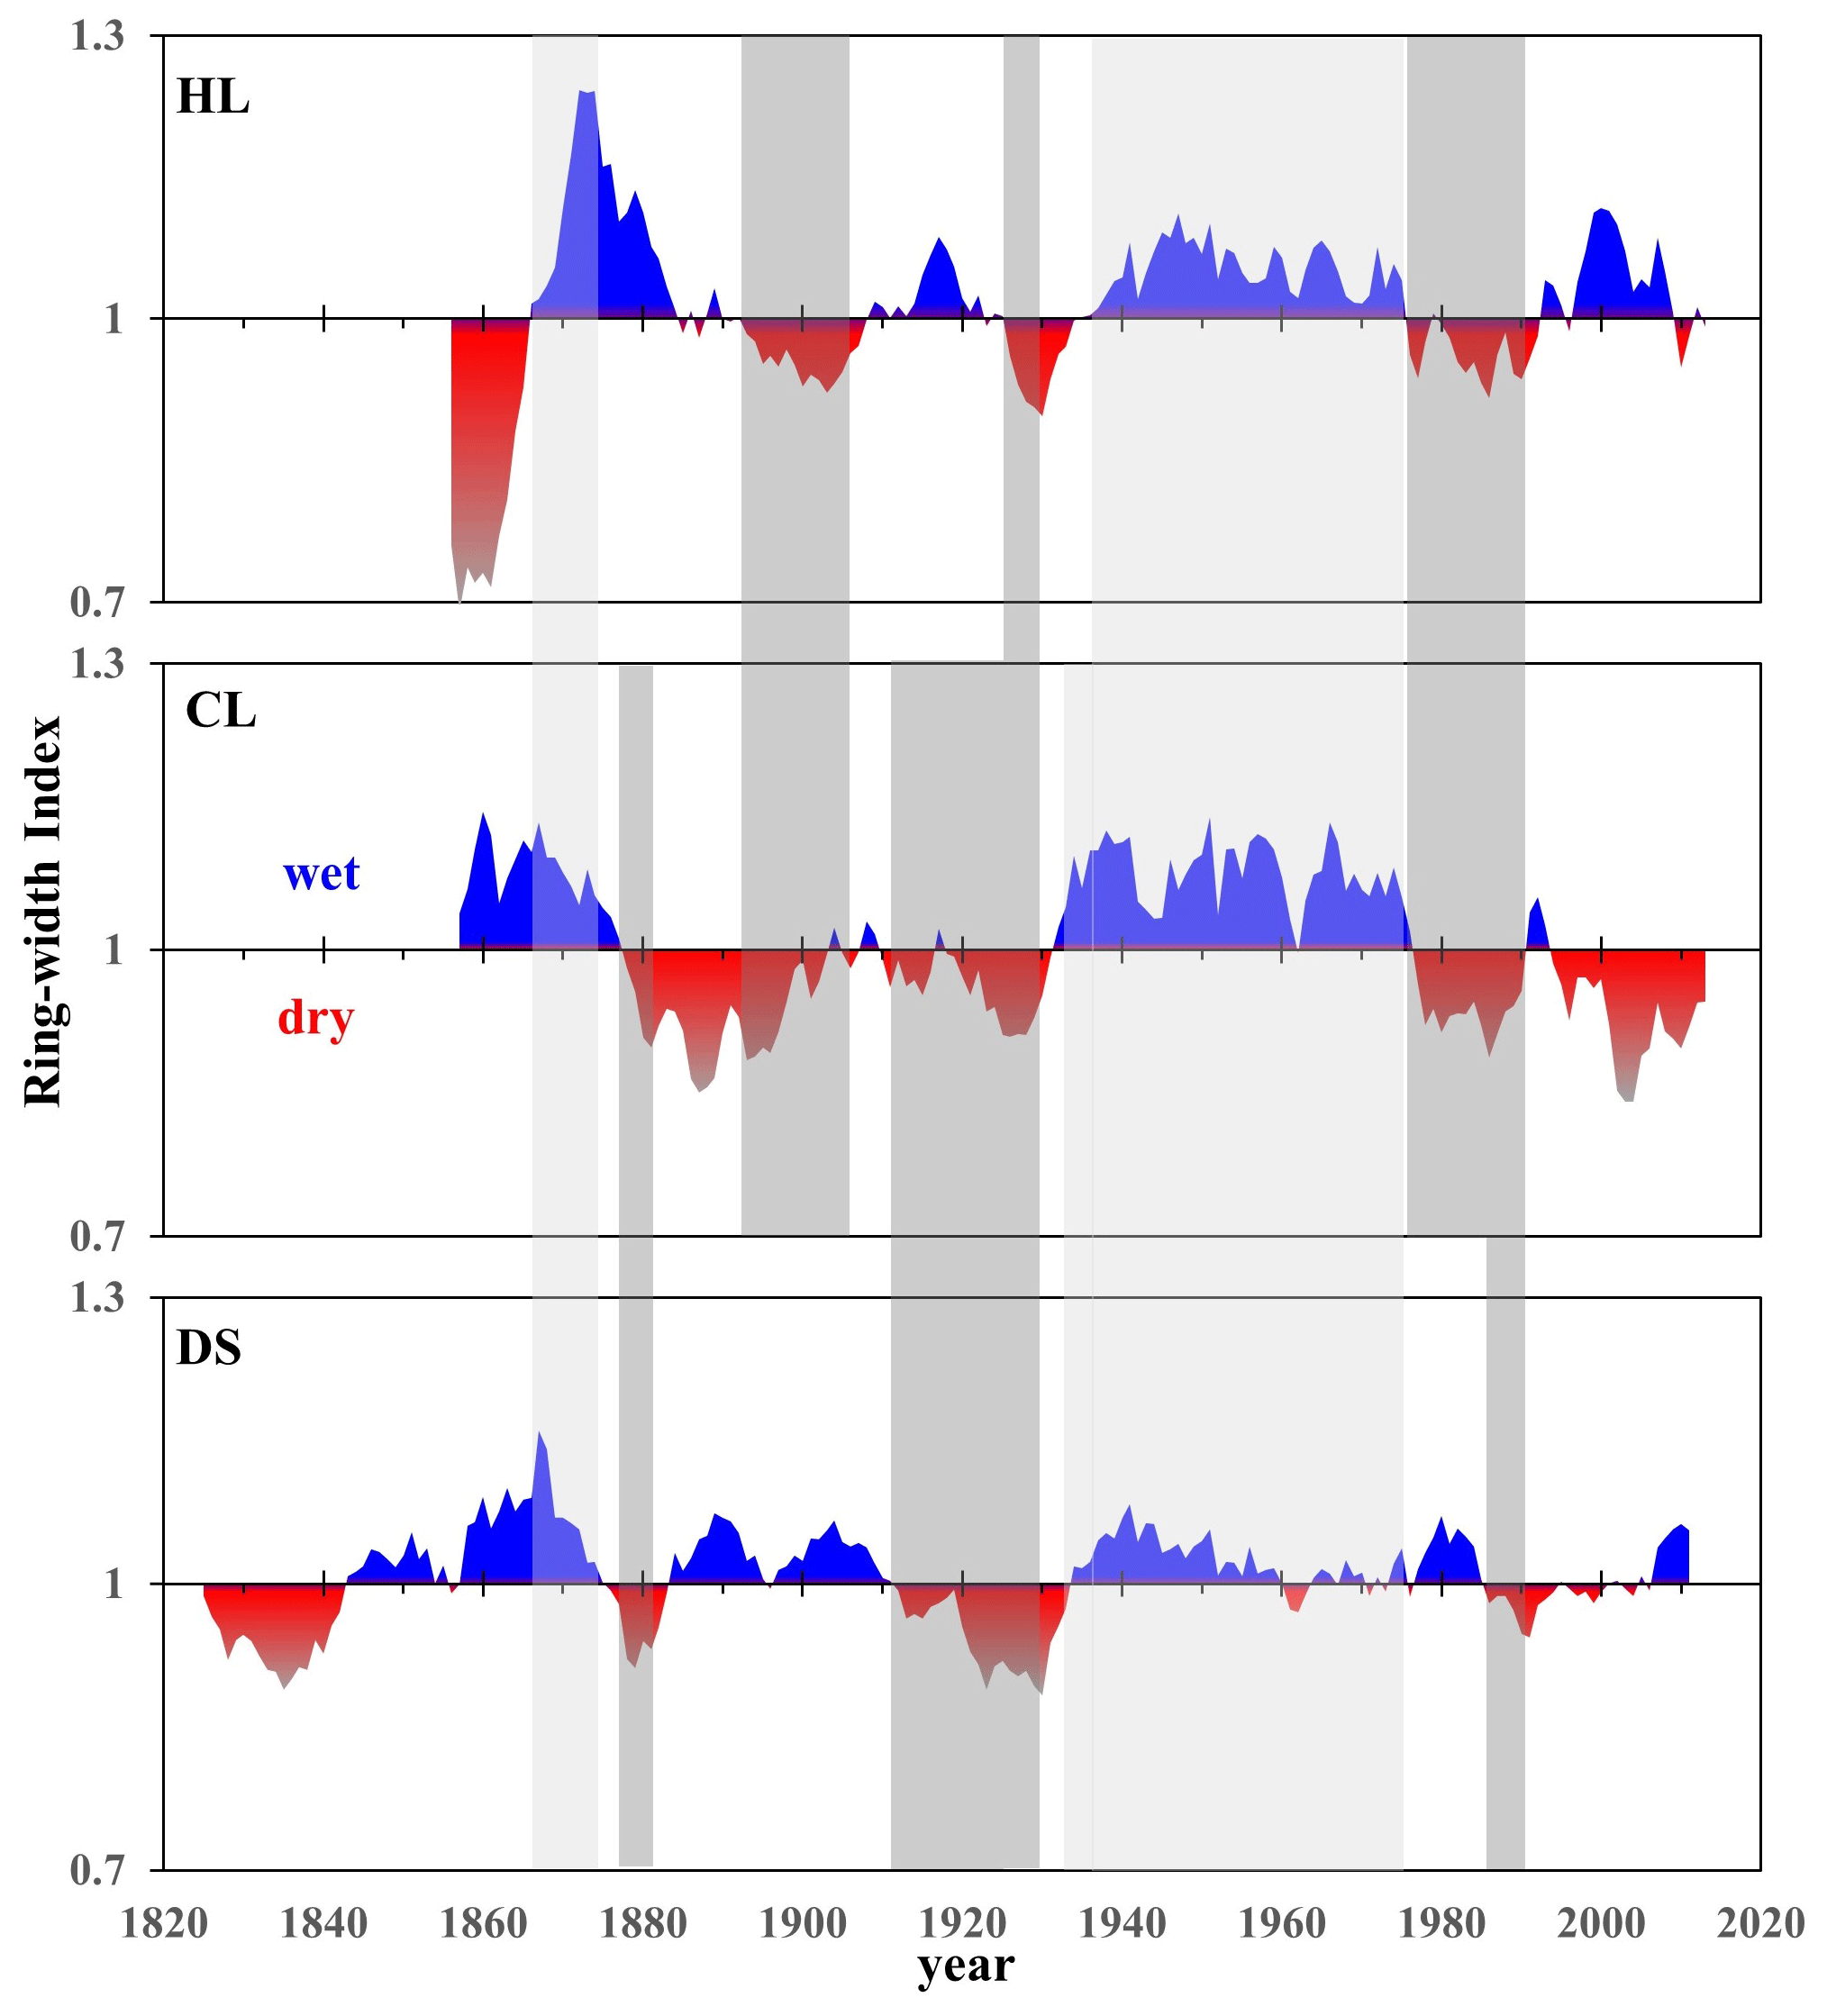
Figure 4Three regional chronologies demonstrating alternation between dry (red) and wet (blue) years on interdecadal scales (11 a running mean). The gray and light gray bands indicate consistent changes of the dry and wet periods.
The CL regional chronology revealed two main wetter periods (mid-1850s to mid-1870s; mid-1930s to mid-1970s) and two longer drought periods (late 1870s to early 1930s; following the late 1970s) (Fig. 4).
The DS regional chronology showed four main wetter periods (mid-1840s to mid-1870s, mid-1880s to late 1900s, mid-1930s to mid-1980s, and late 2000s to early 2010s). There were four drought periods (mid-1820s to mid-1840s, mid-1870s to 1880s, early 1910s to early 1930s, and late 1980s to mid-2000s). The drought during the last drought period was less severe (Fig. 4).
The three chronologies show both synchronized phases and differential changes on an interdecadal scale. The more synchronized dry phases of climate change were the drought periods of the 1930s and 1990s. When we compared the DS chronology to the HL and CL chronologies on decadal scales, we noted that DS droughts tended to last longer and that they started and ended later than CL droughts. However, HL and DS droughts tended to end at the same time (Fig. 4).
There were two wet periods in the 1870s and the mid-1930s to 1970s which were shared by all three sample sites. The latter period was the longest-lasting wet period we saw in our study. There were also dry and wet periods that were not shared by any of our sites. There was an HL drought (mid-1850s to mid-1860s) not shared by the other two sites, which were wetter. HL and CL shared drought periods (1890s to 1910s; 1980s), while DS was wetter. Conversely, wetter periods at HL were sometimes accompanied by drought at the other two sites. Drought at CL was sometimes accompanied by wet periods at the other two sites. DS was wet during the 2010s, but the other two sites were in drought (Fig. 4).
The results of the above studies show that there are diversified and complex features in the interdecadal processes of climate change in different regions around the Alxa Plateau.
3.4 Driving mechanism of the regional climate changes
3.4.1 Driving mechanism of the regional climate changes of typical years
On the interannual scale, three regional chronologies we developed showed fairly weak negative correlations between the EASM and the westerlies; none of the correlations were statistically significant. We carried out correlation analyses of the three regional ring-width chronologies and two major circulation indices. This was done in high, medium, and low ring-width index groups (Figs. 5 and 6).
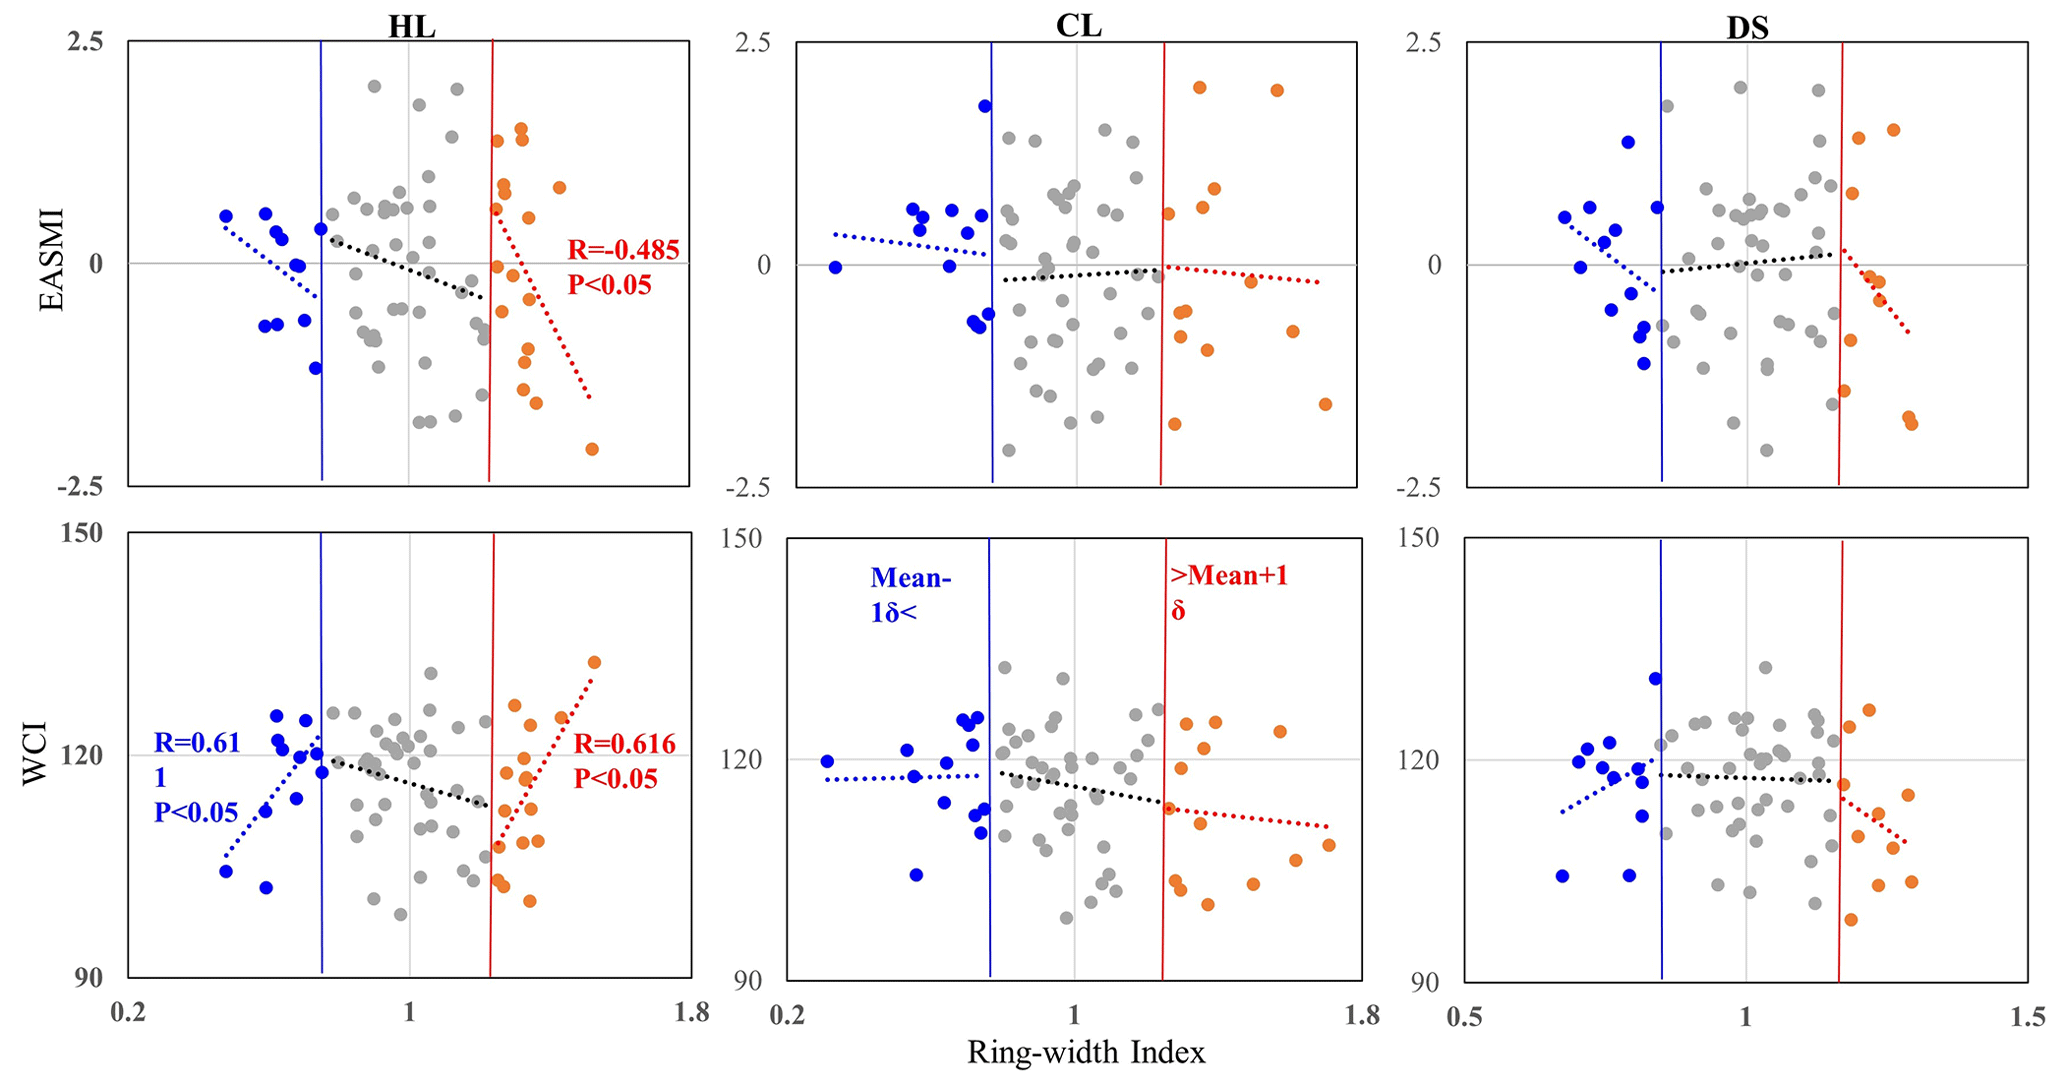
Figure 5Grouping related charts among the ring-width index of three regions (HL, CL, and DS) and the two atmospheric circulation indices (EASMI and WCI), grouped by chronological values. The noted numbers are the Pearson correlation coefficients (two-tailed test) and the corresponding significant credible level. Only the significant correlations were labeled. Red dots indicate the higher ring-width index group (> mean + 1δ), gray dots indicate the middle ring-width index group (> mean-1δ mean + 1δ), and blue dots indicate the lower ring-width index group (> mean − 1δ).
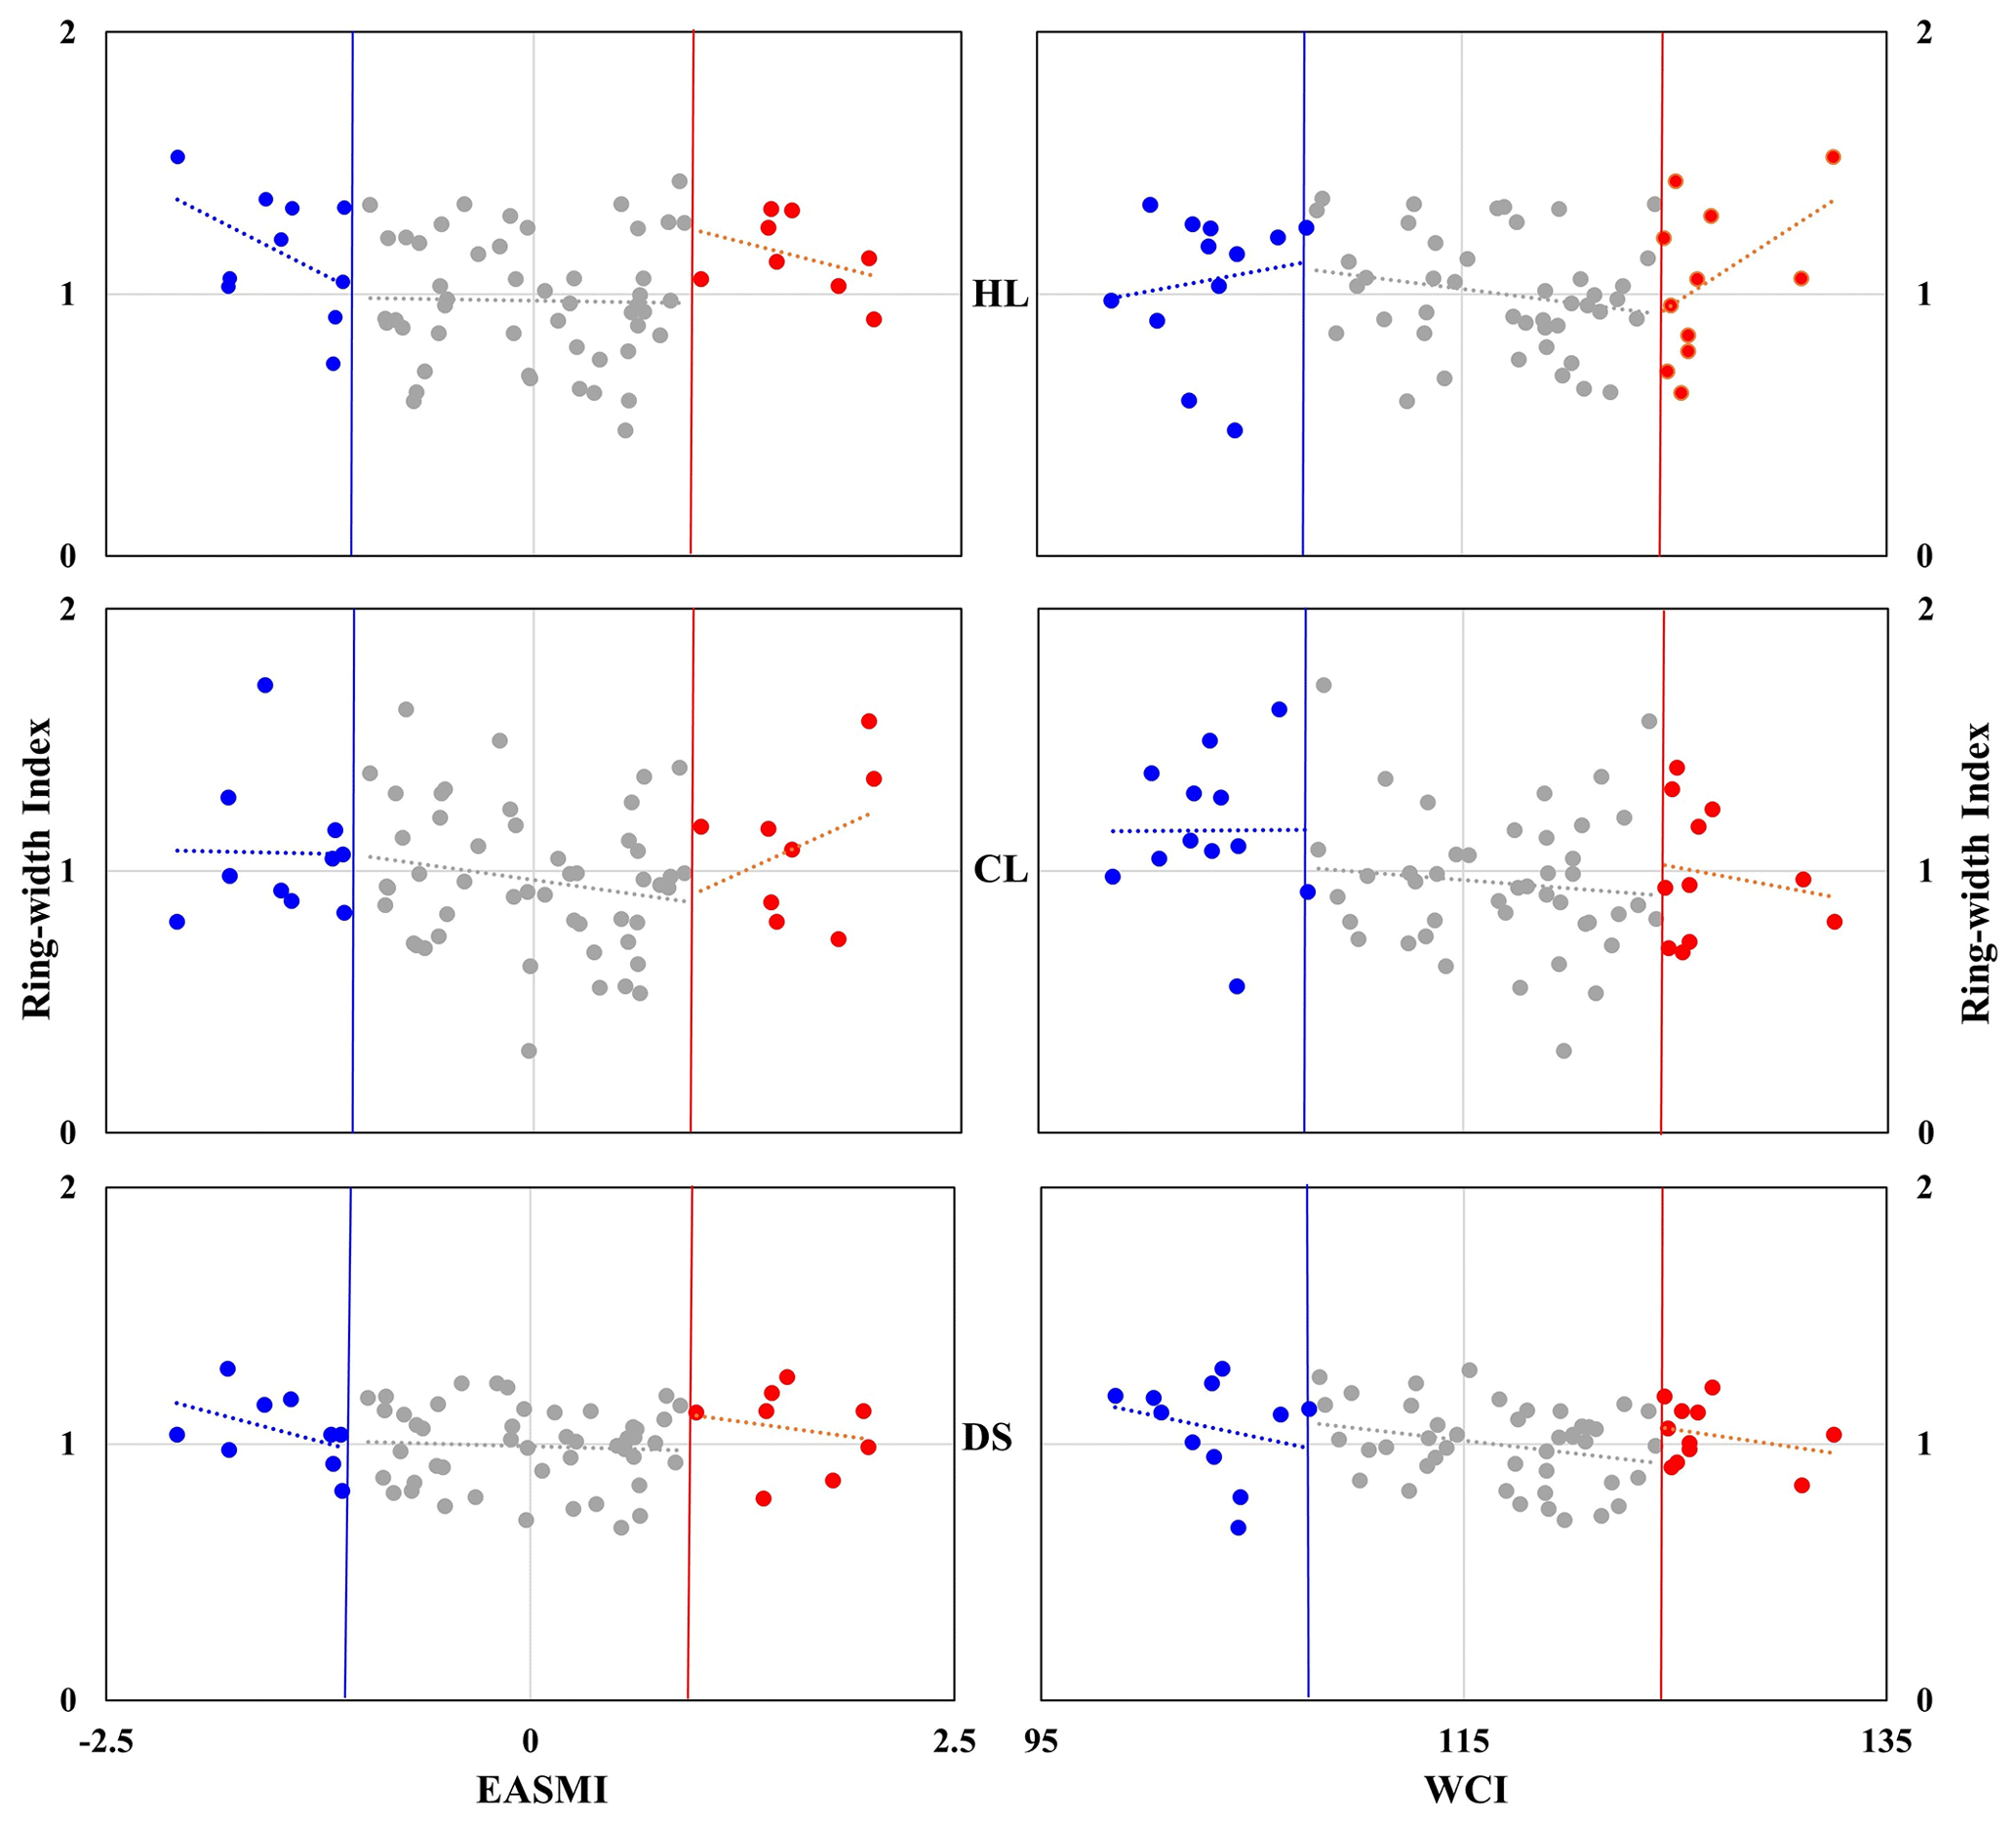
Figure 6Grouping related charts among the two atmosphere circulation indexes (EASMI and WCI) and the ring-width index of three regions (HL, CL, and DS), grouped by the two atmosphere circulation index. Red dots indicate the higher atmosphere circulation index group (> mean + 1δ), gray dots indicate the middle atmosphere circulation index group (> mean − 1δ mean + 1δ), and blue dots indicate the lower atmosphere circulation index group (> mean − 1δ).
At HL, the results of our combined subgroup correlation analyses suggest that correlations between radial growth groups and atmospheric circulations were stable. Correlation between the higher ring-width group and atmosphere circulation indices and between the lower ring-width group and the WCI were all significant (P<0.05) (Figs. 5 and 6).
At CL, correlations of the higher and middle ring-width groups with the WCI as well as the higher and middle WCI groups with the ring-width index were all negative. Correlations between the higher and middle ring-width groups and the EASMI as well as between the higher and middle EASMI groups and the ring-width index were inconsistent (Figs. 5 and 6).
At DS, correlations between the higher and lower ring-width groups and the EASMI as well as between the higher and lower EASMI groups and the ring-width indices were consistent. The correlations between the higher ring-width groups and the WCI and between the higher WCI groups and the ring-width index were consistent. However, the correlations between the lower ring-width groups and the WCI, and also between the lower WCI groups and the ring-width index, were inconsistent (Figs. 5 and 6).
Except for HL, none of the ring-width groups or the atmospheric circulation index groups of the others reached a level of significance. These results suggest that HL is strongly affected by the size of, and the interaction between, the EASM and the westerly winds. On an interannual scale, stronger west winds and a weaker monsoon could result in variations from the ordinary climate (veering towards drier or wetter). Weaker west winds and a stronger monsoon formed the normal climate at HL. At the CL and DS sites, both atmospheric circulations were relatively weak on interannual scales. They had complex interactions.
3.4.2 Driving mechanisms of the regional climate changes on a decadal scale
At HL, both the EASM and the westerly circulation had highly significant effects on the radial growth of Qinghai spruce. At CL, the EASM also had highly significant effects on the radial growth of Qinghai spruce. There, correlation coefficients were higher for the EASMI (EASM index) than they were for the HL index. Correlations between the WCI and radial growth were negative but not at a significant level.
At DS, correlation between radial growth and the WCI was extremely negative (P<0.01). Correlation between radial growth and the EASM was positive (P>0.1) (Fig. 7). These results suggest that at HL, alternations between dry and wet seasons were affected by both the EASM and the westerlies. If either of the two atmospheric circulations was stronger, the climate tended to be wetter. At CL, alternations between dry and wet were affected mainly by the EASM. When the EASM was stronger, the climate was wetter. At DS, the climate was affected mainly by the westerlies. The stronger the winds, the wetter the climate (Fig. 7).
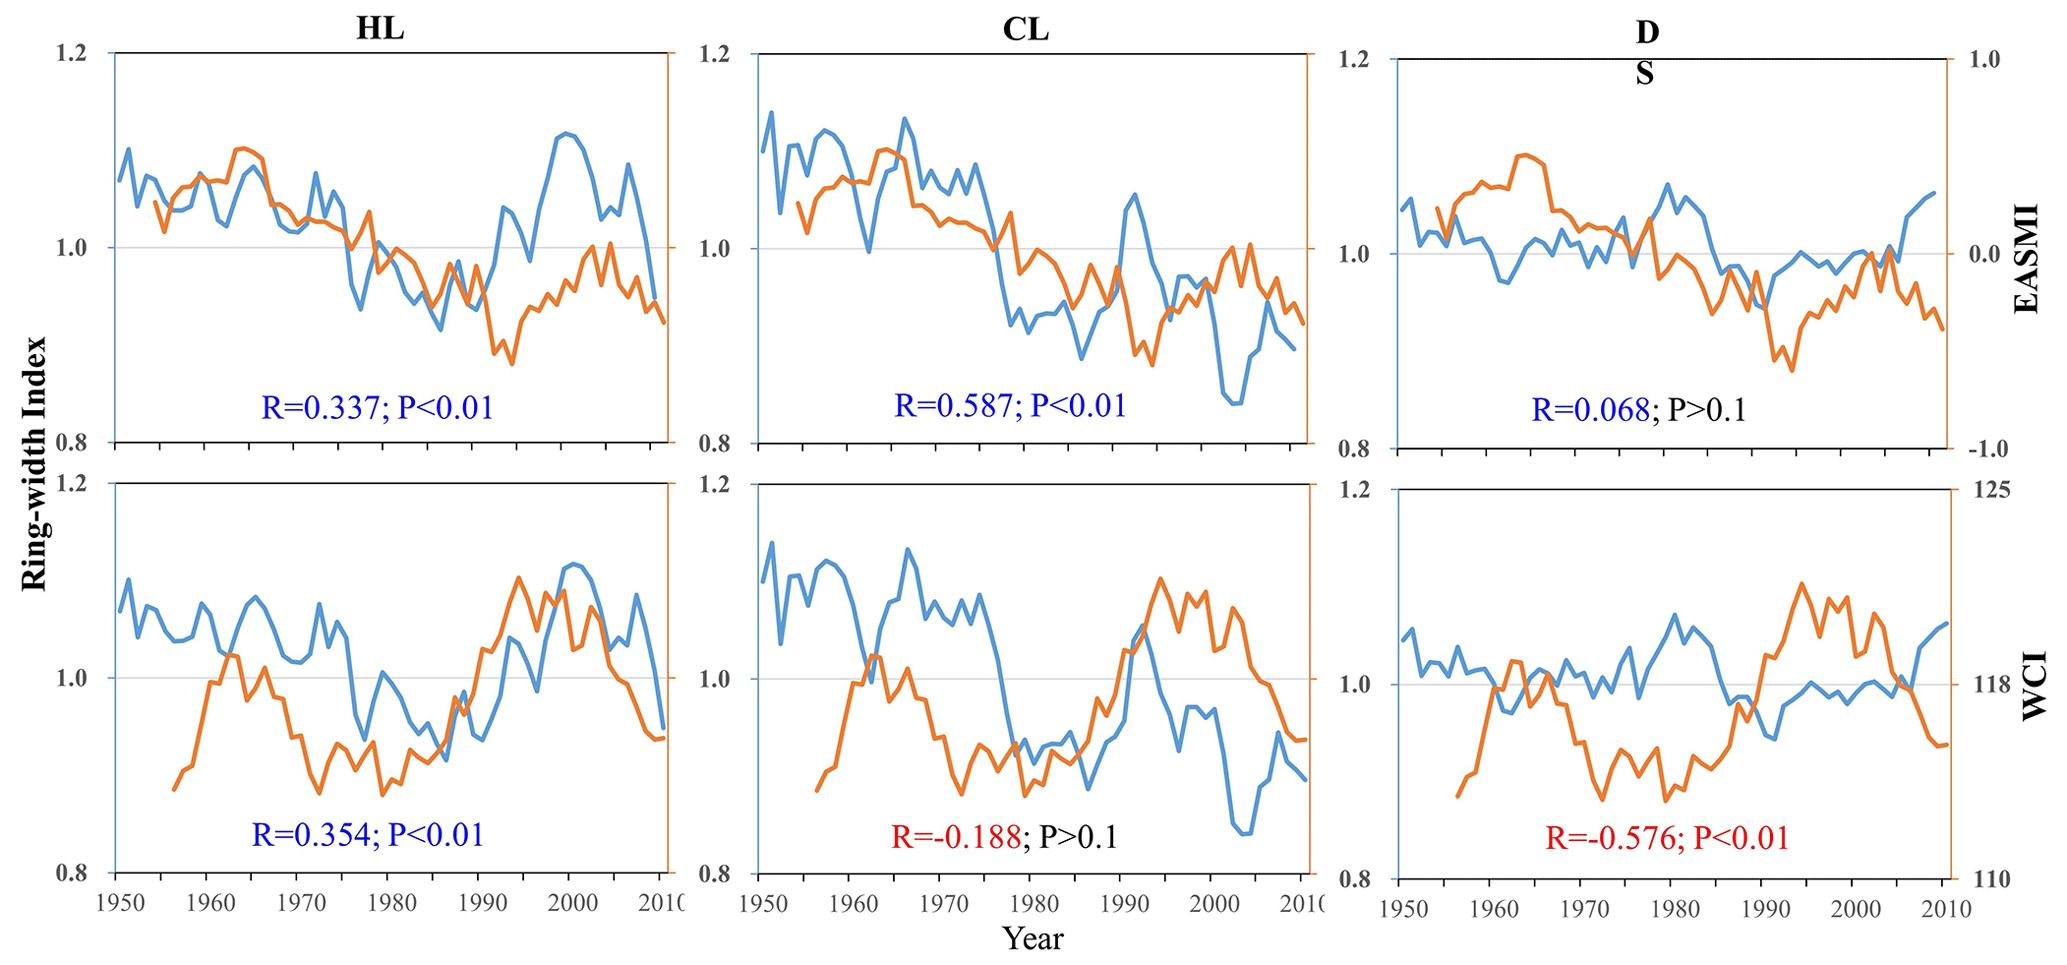
Figure 7Interdecadal-scale (11 a running average) correlations of the three residual chronologies with the EASMI and WCI.
The results of our interdecadal partial correlation analysis of the three RES chronologies with the WCI and EASMI further illustrate the impacts of the two circulation systems on the climate of the three regions (Table 2).
Table 2Interdecadal partial correlation analysis of the three residual chronologies with the WCI and EASMI.
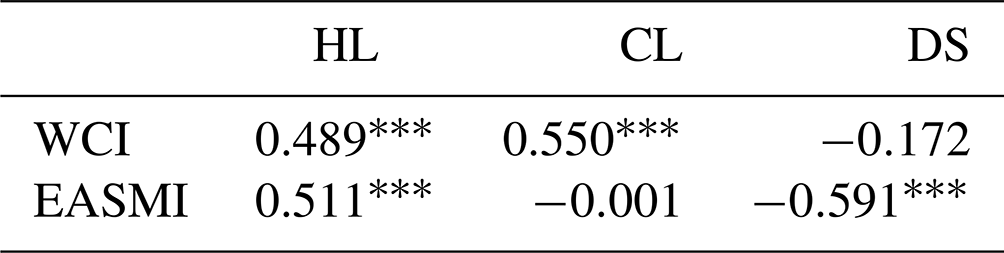
Correlation significance levels (two-tailed test): P<0.001. Summary: at HL (on the eastern boundary of the Alxa Plateau), both EASMI and WCI influenced the alternation between wet and dry. St CL (on the southern boundary of the Alxa Plateau), climate was mainly influenced by the EASM. At DS (on the western boundary of the Alxa Plateau and the middle part of Hexi Corridor), climate was mainly influenced by the westerlies.
At HL, if we control one variable (the WCI or EASMI) from our analysis, the other variables will all show a positive correlation with its chronology (P<0.0001). At CL, when we controlled the WCI, we found a positive significant correction between the chronology and EASMI (P<0.0001). If we controlled the effect of EASMI, we saw a weak negative correction between the chronology and WCI (Table 2). At DS, if we controlled EASMI, we saw a negative significant correlation between the chronology and WCI (P<0.0001). If we controlled the WCI, we saw an insignificant negative correlation between the chronology and EASMI (Table 2).
4.1 Climate changes indicated by regional chronologies
Our chronology–climate response analysis (Fig. 3) showed that the radial growth index of Qinghai spruce in the HL, CL, and DS mountains was a good record of regional climate changes around the Alxa Plateau (Fig. 2). On the interannual scale, the three regional chronologies noted that the extreme drought years of 1928, 1957, and 1981 were shared by two or more locations, as were the drought years of 1854, 1861, 1916, 1926, 1947, 1966, and 2001 (Fig. 2).
We note that drought was reported by other tree-ring studies for these regions (Chen et al., 2016), also for the Qilian Mountains (Zhang et al., 2011, 2017). Several other drought years (1854, 1884, and 1925–1928) were also seen in the dry–wet climate history (PDSI and recorded by tree-ring widths) in the nearby area of Mount Hasi, which lies on the edge of the regions most influenced by the EASM (Kang et al., 2012).
The drought years of 1823, 1833, 1854, 1877, 1883–1885, 1895, 1908, 1971, 1992, and 2003 seen in results for the Alxa Plateau are also seen in 12 tree-ring reconstructed drought series for the Qilian Mountains (an area mainly influenced by westerlies) (Zhang et al., 2011). We also note that wetter years seen in our three regional chronologies were also seen in results from the Hasi and Xinglong Mountains, which are also on the edge of the area influenced by the EASM (Fang et al., 2009; Kang et al., 2012).
If we compare our results with those seen for the EASM-affected areas at Mount Guiqing for 1820–2005 (Fang et al., 2010), we note that only 3 of the 8 drought years in that area (1928, 2000, and 2001) were seen in our three chronologies. We also note results from the westerly-influenced area at Mount Tianshan (Jiang et al., 2017). The wetter years of 1846, 1903, and 1942 at DS were also extreme wet years at Mount Tianshan. A total of 2 wet years, 1848 and 1959, recorded at DS are either 1 year earlier or 1 year later than extremely wet years at Mount Tianshan, which might suggest some correlation. Drier years at DS (1884, 1947, and 1951) are 1 or 2 years later than the extremely dry years at Mount Tianshan. This suggests that these phenomena could be related to broader changes in the extent and strength of the atmospheric circulation.
On a broader (interdecadal) scale, an extreme drought period in the 1920s–1930s was shared by much of northern China (Liang et al., 2006; Fang et al., 2009, 2010). This is the same drought that we note in our chronologies for HL, CL, and DS (Liu et al., 2002, 2013; Chen et al., 2010; Fan et al., 2012; Zhang et al., 2015). A drought in 1890–1900 was noted by dendrochronological studies and regional history documents (Yuan, 1994; Ma et al., 2003; Cai and Liu, 2007).
Ma and Fu's (2006) study showed a broad shift towards a drying climate in 1977–1978 (eastern area in northwestern China, also northern China). Several other dendrochronological studies showed a combination of high temperatures and low precipitation in the late 1970s to early 1990s (Y. X. Zhang et al., 2005; Cai and Liu, 2007; Cai, 2009). This same drought was seen at DS, if somewhat later and for a shorter time. We also note its effects at HL and CL. This would be consistent with the increased humidity of the climate in the eastern region of northwestern China (the EASM-influenced region experiencing >400 mm of precipitation). This region would include Mount Xinglong (Fang et al., 2009; Chen et al., 2015), the easternmost part of the Qilian Mountains, and Mount Guiqing (Fang et al., 2010).
The wet period that lasted from the 1940s to the early 1970s has been recorded by several tree-ring width chronologies covering HL, CL, and DS (Liu et al., 2004, 2005; Gao et al., 2006; Cai, 2009; Chen et al., 2010). Regional history documents also record some severe flood disasters in this period (Yuan, 1994). We also see this wet period in tree-ring width chronologies from Mount Xinglong (Fang et al., 2009; Chen et al., 2015) and Mount Guiqing (Fang et al., 2010).
The wet period in the 1830s–1840s evident in the chronologies in Xinglong Mountain (Fang et al., 2009; Chen et al., 2015) and Guiqing Mountain (Fang et al., 2010) corresponds to the dry period of DS. The wet period in the 1830s–1840s corresponds to the dry period of HL and CL and to the wet period of DS. The observed phenomena can be attributed to differences in the extent and intensity of EASM and westerly atmospheric circulations.
4.2 Influence of atmospheric circulations and their interaction on climate change in the Alxa Plateau
Water vapor carried by the westerlies will extend southward to the northern part of Qinghai, the Hexi region of Gansu, the northern part of Ningxia, and the northern part of Shaanxi Province, sometimes passing through the northern border of the Xinjiang region (Li et al., 2012). The area bounded by 35 and 55° N, 110 and 140° E seems to be crucial to fluctuations in the westerlies. This in turn affects the distribution of rain belts in summer. Its mean WCI values are weakly positively correlated with the rainfall in the middle of Yellow River Basin and its northern regions (Yan et al., 2007). The results showed that the middle ring-width index group of Qinghai spruce in the three sample sites, which are located in the key area for interaction between the wind and monsoon, presented weaker negative correlation with WCI on the interannual scale (Fig. 5).
The EASM boundary zone has a greater influence on precipitation at higher latitudes and thus on vegetation growth. This boundary zone can fluctuate due to the interannual variability of the EASM and the westerlies. There may be lagging effects at the midlatitudes (Ou and Qian, 2006). Again, we note that on an interannual scale, there is much variation in the strengths and interactions of the EASM as well as westerly circulation and thus in climate in our three study regions (Fig. 5).
Sun et al. (2019) showed that when the westerly circulation strengthens, high-latitude air pressure drops across the entire Asian continent. Siberian high pressures and the EASM are weakened. The southward movement of the cold air is also correspondingly weakened. That is not conducive to the north and south exchanging cold and warm air vapor to form precipitation. With a lower WCI and weakened latitudinal circulation, the meridional circulation will strengthen, which favors the exchange of warm and cold air between the north and south to form precipitation.
Yang et al. (2019) proposed that in years with weak summer westerlies in the middle latitudes, the upper-level jet stream tends to shift southward. This southward displacement of the jet stream, coupled with weakened lower-level divergence, hampers the northward transport of warm air into the southwestern region. Consequently, this leads to reduced availability of water vapor sources and ultimately results in diminished summer precipitation within the transitional zone of typical monsoon activity. If the jet stream moves northward, precipitation increases.
Xu et al. (2010) indicated that in the middle Qilian Mountains the westerlies affect precipitation directly, while the EASM only indirectly affects precipitation. When the westerlies become stronger (weaker), the high precipitation zone moves northwestward (southeastward).
At DS, radial growth showed weak negative correlations with higher WCI and also higher, middle, and lower EASMI groups (Figs. 5 and 6). At HL, when high chronology indices are positive they are significantly correlated with westerly circulation; when they are negative they significantly correlate with EASM (Figs. 5 and 6). At CL, which lies further to the south than HL, a higher EASMI leads to a more humid climate. Other effects are more complicated: for example, the higher and lower ring-width index groups, associated with extreme dry and wet climate years, have weak negative correlations with EASMI (Figs. 5 and 6). Jiang et al. (2019) published the results of their hydrogen and oxygen isotope studies of surface water at more than 3000 sampling sites in northern China. They showed that surface water recharge at DS is due to the westerlies and recharge at CL is due to the EASM. HL, in contrast, sits at the boundary of the EASM; water recharge there is due to both the EASM and the westerlies.
Jiang and Wang (2005) noted significant declines in the EASM in the mid-1960s and mid-1970s, which led to decline in the radial growth of Qinghai spruce in our study area. The effect of the latter declining period was much greater than that of the former, whatever the intensity or duration. The effects of these declines were stronger at CL and DS than at HL. In the mid-1970s, EASM retreat had stronger negative effects at CL and then at HL. However, decline in the EASM proved to be a facilitator of radial growth at DS (Fig. 7).
In the same period the westerly circulation also retreated. The EASM retreated again in the 1990s, while the westerlies strengthened. This resulted in a drier climate at CL. However, it was also correlated with fluctuating wet periods at HL and a weak wet period at DS. The above results, to a certain extent, support our view on the driving mechanisms of climate change in the three study areas, especially DS.
When we look at this area on a geologic scale, we learn that the westerly circulation strengthened during the Ice Age. Westerly jet streams moved southward to about 35° N. When the westerlies weakened in the Interglacial Age, the westerly jet streams moved northward to ∼37° N (Sun et al., 2003). A study of Holocene lake-level evolution in the ancient Zhuye lake, central Alxa Plateau, showed that lake-level change was subject to the combined effects of EASM and the arid climate of central Asia (Li, 2009). This result further illustrates the complexity of lake evolution and climate change in the EASM marginal zone.
The westerly circulation also interacts with the monsoon on the Tibetan Plateau, which has a profound effect on the climate of the Asian monsoon region as well as the global climate (Qu et al., 2004). There has also been much research using proxy indicator cycles, indicating that our study area is also influenced by large-scale ocean–atmosphere changes on interannual and interdecadal scales, such as the North Atlantic Oscillation (NAO), Pacific Decadal Oscillation (PDO), El Niño–Southern Oscillation (ENSO), and sunspot activity (Gou et al., 2015a, b; Liu et al., 2016; Wang et al., 2017). Generally, the intensity of ENSO was inversely correlated with the intensity of the EASM. There was a negative correlation between PDO and regional dry–wet variation west of 100° E. When the NAO is in a positive phase (negative phase), it indicates that the midlatitude westerly winds are in strong (declining) phase, which is conducive to (unfavorable for) precipitation formation.
However, all of the abovementioned large-scale climate and ocean–atmosphere changes affect the EASM and westerly circulation through different pathways (Li, 2009), which in turn have various effects on the northwestern edge zone of the EASM and the zone of interaction between the two major atmospheric circulations.
In conclusion, based on the analysis of the regional chronologies collected in the HL, CL, and DS mountains that are arrayed around the Alxa Plateau, we can safely assert that the radial growth of Qinghai spruce in the study area is mainly affected by regional precipitation. This precipitation varies constantly over time and space, primarily influenced by the interactions between two atmospheric circulation systems, EASM and westerlies. At HL, both of these atmospheric circulation systems play a significant role in shaping climate changes. At CL, the climate is mainly influenced by the EASM. At DS, climate is more heavily influenced by the westerly circulation.
In the future, it is to be hoped that more refined, smaller-scale research can be done on the climate history in the deserts of the Alxa Plateau. Such research may finally provide a theoretical basis to explain regional climate driving mechanisms and thus enable better desertification controls.
All data for this paper are available upon request.
All authors approved the manuscript and agreed on its submission. SX: conceptualization, methodology, funding acquisition, investigation, resources, writing (original draft, review and editing). XP: funding acquisition, writing review. QT: investigation, data collection, and sample processing. AD: investigation, data collection, and sample processing. JX: methodology and writing review. JS: methodology and writing review.
The contact author has declared that none of the authors has any competing interests.
The study was jointly funded by the National Natural Science Foundation of China (NSFC) (nos. 42171031, 42171167) and the Inner Mongolia Autonomous Region Special Fund project for the Transformation of Scientific and Technological Achievements (2021CG0046).
Publisher's note: Copernicus Publications remains neutral with regard to jurisdictional claims made in the text, published maps, institutional affiliations, or any other geographical representation in this paper. While Copernicus Publications makes every effort to include appropriate place names, the final responsibility lies with the authors.
This paper was edited by Zhongshi Zhang and reviewed by five anonymous referees.
Cai, Q. F.: Response of Pinus tabulaeformis tree-ring growth to three moisture indices and January to July Walter index reconstruction in Helan mountain, Mar. Geol. Quatern. Geol., 29, 131–136, 2009.
Cai, Q. F. and Liu, Y.: January to August temperature variability since 1776 inferred from tree-ring width of Pinus tabulaeformis in Helan Mountain, J. Geogr. Sci., 17, 293–303, https://doi.org/10.1007/s11442-007-0293-5, 2007.
Chen, F., Yuan, Y. J., Wei, W. S., Yu, S. L., Li, Y., Zhang, R., Fan, Z., Zhang, T., and Shang, H.: PDSI changes of May to July recorded by tree rings in the northern Helan Mountains, Adv. Clim. Changes Res., 65, 344–348, 2010.
Chen, F., Yuan, Y. J., Wei, W. S., Yu, S. L., Fan, Z. A., Zhang, R. B., Zhang, T. W., Li, Q., and Shang, H. M.: Temperature reconstruction from tree-ring maximum latewood density of Qinghai spruce in middle Hexi Corridor, China, Theor. Appl. Climatol., 107, 633–643, https://doi.org/10.1007/s00704-011-0512-y, 2012.
Chen, F., Wei, W. S., Yuan, Y. J., Yu, S. L., Shang, H. M., Zhang, T. W., Zhang, R. B., Wang, H. Q., and Qin, L.: Variation of annual precipitation during 1768–2006 in Gansu Inferred from multi-site tree-ring chronologies, J. Desert Res., 33, 1520–1526, https://doi.org/10.7522/j.issn.1000-694X.2013.00218, 2013.
Chen, F., Yuan, Y. J., Zhang, T. W., and Linderholm, H. W.: Annual precipitation variation for the southern edge of the Gobi Desert (China) inferred from tree rings: linkages to climatic warming of twentieth century, Nat. Hazards, 81, 939–955, https://doi.org/10.1007/s11069-015-2113-z, 2016.
Chen, F. H., Chen, J. H., Huang, W., Chen, S. Q., Huang, X. Z., Jin, L. Y., Jia, J., Zhang, X. J., An, C., and Zhang, J.: Westerlies Asia and monsoonal Asia: spatiotemporal differences in climate change and possible mechanisms on decadal to sub-orbital timescales, Earth-Sci. Rev., 192, 337–354, https://doi.org/10.1016/j.earscirev.2019.03.005, 2019a.
Chen, F. H., Fu, B. J., Xia, J., Wu, D., Wu, S. H., Zhang, Y. L., Sun, H., Liu, Y., Fang, X. M., Qin, B. Q., Li, X., Zhang, T. J., Liu, B. Y., Dong, Z. B., Hou, S. G., Tian, L. D., Xu, B. Q., Dong, G. H., Zheng, J. Y., Yang, W., Wang, X., Li, Z. J., Wang, F., Hu, Z. B., Wang, J., Liu, J. B., Chen, J. H., Huang, W., Hou, J. Z., Cai, Q. F., Long, H., Jiang, M., Hu, Y. X., Feng, X. M., Mo, X. G., Yang, X. Y., Zhang, D. J., Wang, X. H., Yin, Y. H., and Liu, X. C.: Major advances in studies of the physical geography and living environment of China during the past 70 years and future prospects, Sci. China Earth Sci., 62, 1665–1701, https://doi.org/10.1007/s11430-019-9522-7, 2019b.
Chen, J., Huang, W., Jin, L., Chen, J. H., Chen, S. Q., and Chen, F. H.: A climatological northern boundary index for the East Asian summer monsoon and its interannual variability, Sci. China Earth Sci., 61, 13–22, https://doi.org/10.1007/s11430-017-9122-x, 2018.
Cook, E. R.: A Time Series Analysis approach to tree ring standardization (Dendrochronology, forestry, dendroclimatology, autoregressive process)[D], The University of Arizona, Tuscon, Arizona, 1985.
Ding, Y. H., Liu, Y. J., Xu, Y., Wu, P., Xue, T., Wang, J., Shi, Y., Zhang, Y. X., Song, Y. F., and Wang, P. L.: Regional responses to global climate change: progress and prospects for trend, causes, and projection of climatic warming-wetting in Northwest China, Adv. Earth Sci., 38, 551–562, 2023.
Fan, Z. A., Wei, W. S., Chen, F., and Yuan, Y. J.: Precipitation variation from 1775 to 2005 at the eastern margin of Tengger Desert, China inferred from tree-ring, J. Desert Res., 32, 996–1002, 2012.
Fang, K. Y., Gou, X. H., Chen, F. H., Yang, M. X., Li, J. B., He, M. S., Zhang, Y., Tian, Q. H., and Peng, J. F.: Drought variations in the eastern part of northwest China over the past two centuries: evidence from tree rings, Clim. Res., 38, 129–135, https://doi.org/10.3354/cr00781, 2009.
Fang, K. Y., Gou, X. H., Chen, F. H., D'arrigo, R., and Li, J. B.: Tree-ring based drought reconstruction for the Guiqing Mountain (China): linkages to the Indian and Pacific Oceans, Int. J. Climatol., 30, 1137–1145, https://doi.org/10.1002/joc.1974, 2010.
Feng, W., Wang, K. L., and Jiang, H.: Influences of westerly wind inter-annual change on water vapor transport over northwest china summer, Plateau Meteorol., 23, 270–275, 2004.
Gao, S. Y., Lu, R. J., Qiang, M. R., Ha, S., Zhang, D. S., Chen, Y., and Xia, H.: Precipitation variation recorded by tree-rings in the northern Tengger Desert of the last 140 years, Chin. Sci. Bull., 51, 326–331, https://doi.org/10.1360/csb2006-51-3-326, 2006.
Gou, X. H., Gao, L. L., Deng, Y., Chen, F. H., Yang, M. X., and Still, C.: An 850-year tree-ring-based reconstruction of drought history in the western Qilian Mountains of northwestern China, Int. J. Climatol., 35, 3308–3319, https://doi.org/10.1002/joc.4208, 2015a.
Gou, X. H., Deng, Y., Gao, L. L., Chen, F. H., Cook, E., Yang, M. M., and Zhang, F.: Millennium tree-ring reconstruction of drought variability in the eastern Qilian Mountains, northwest China, Clim. Dynam., 45, 1761–1770, https://doi.org/10.1007/s00382-014-2431-y, 2015b.
Huang, L. X., Chen, J., Yang, K., Yang, Y. J., Huang, W., Zhang, X., and Chen, F. H.: The northern boundary of the Asian summer monsoon and division of westerlies and monsoon regimes over the Tibetan Plateau in present-day, Sci. China Earth Sci., 66, 882–893, https://doi.org/10.1007/s11430-022-1086-1, 2023.
Jiang, D. B. and Wang, H. J.: Natural interdecadal weakening of East Asian summer monsoon in the late 20th century, Chin. Sci. Bull., 50, 1923–1929, https://doi.org/10.1360/982005-36, 2005.
Jiang, P., Liu, H. Y., Wu, X. C., and Wang, H. Y.: Tree-ring-based SPEI reconstruction in central Tianshan Mountains of China since A.D. 1820 and links to westerly circulation, Int. J. Climatol., 37, 2863–2872, https://doi.org/10.1002/joc.4884, 2017.
Jiang, W. J., Wang, G. C., Sheng, Y. Z., Shi, Z. M., and Zhang, H.: Isotopes in groundwater (2H, 18O, 14C) revealed the climate and groundwater recharge in the Northern China, Sci. Total Environ., 666, 298–307, https://doi.org/10.1016/j.scitotenv.2019.02.245, 2019.
Kang, S. Y. and Yang, B.: Precipitation variability at the northern fringe of the Asian summer monsoon in Northern China and its possible mechanism over the past 530 years, Quaternary Sci., 35, 1185–1193, 2015.
Kang, S. Y., Yang, B., and Qin, C.: Recent tree-growth reduction in north central China as a combined result of a weakened monsoon and atmospheric oscillations, Climatic Change, 115, 519–536, https://doi.org/10.1007/s10584-012-0440-6, 2012.
Li, D. L., Shao, P. C., and Wang, H.: The position variations of the north boundary of East Asia subtropical summer monsoon in 1951–2009, J. Desert Res., 33, 1511–1519, https://doi.org/10.7522/j.issn.1000-694X.2013.00217, 2013.
Li, J. L., Li, Z. R., Yang, J. C., Shi, Y. Z., and Fu, J.: Analyses on spatial distribution and temporal variation of atmosphere water vapor over northwest China in summer of later 10 years, Plateau Meteorol., 31, 1574–1581, 2012.
Li, J. P. and Zeng, Q. C.: A new monsoon index, its interauual variability and related with monsoon precipitation, Clim. Environ. Res., 10, 351–365, 2005.
Li, W. L., Wang, K. L., Fu, S. M., and Jiang, H.: The interrelationship between regional Westerly index and the water vapor budget in Northwest China, J. Glaciol. Geocryol., 30, 28–34, 2008.
Li, Y.: The pollen records from lake sediments and climate & lake model in the Marginal area of Asian monsoon, Lanzhou University, Lanzhou, China, https://kns.cnki.net/kcms2/article/abstract?v=62vjN2oCPVZ7NJ3 (last access: 24 July 2024), 2009.
Li, Z. X., Feng, Q., Song, Y., Wang, Q. J., Yang, J., Li, Y. G., Li, J. G., and Guo, X. Y.: Stable isotope composition of precipitation in the south and north slopes of Wushaoling Mountain, northwestern China, Atmos. Res., 182, 87–101, https://doi.org/10.1016/j.atmosres.2016.07.023, 2016.
Liang, E. Y., Liu, X. H., Yuan, Y. J., Qin, N. S., Fang, X. Q., Huang, L., Zhu, H. F., Wang, L., and Shao, X. M.: The 1920s drought recorded by tree rings and historical documents in the semi-arid and arid areas of Northern China, Climatic Change, 79, 403–432, https://doi.org/10.1007/s10584-006-9082-x, 2006.
Liu, J. B., Chen, J., Chen, S. Q., Yan, X. W., Dong, H. R., and Chen, F. H.: Dust storms in northern China and their significance for the concept of the Anthropocene, Sci. China Earth Sci., 65, 921–933, https://doi.org/10.1007/s11430-021-9889-8, 2022.
Liu, Y., Cai, Q. F., Ma, L. M., and An, Z. S.: Tree ring precipitation records from Baotou and the East Asia summer monsoon variations for the last 254 years, Earth Sci. Front., 8, 91–97, 2001.
Liu, Y., Ma, L. M., Cai, Q. F., An, Z. S., Liu, W. G., and Gao, L. Y.: Reconstruction of summer temperature (June–August) at Mt. Helan, China, from tree-ring stable carbon isotope values since AD 1890, Sci. China Ser. D, 45, 1127–1136, https://doi.org/10.1360/02yd9109, 2002.
Liu, Y., Won-Kyu, P., Cai, Q. F., Jung-Wook, S., and Hyun-Sook, J.: Monsoonal precipitation variation in the East Asia since A.D. 1840 – tree-ring evidences from China and Korea, Sci. China Ser. D, 46, 1031–1039, https://doi.org/10.1007/BF02959398, 2003.
Liu, Y., Shi, J. F., Shishov, V., Vaganov, E., Yang, Y. K., Cai, Q. F., Sun, J. Y., Wang, L., and Djanseitov, I.: Reconstruction of May–July precipitation in the north Helan Mountain, Inner Mongolia since A.D. 1726 from tree-ring late-wood widths, Chin. Sci. Bull., 49, 405–409, https://doi.org/10.1007/BF02900325, 2004.
Liu, Y., Cai, Q. F., Shi, J. F., Hughes, M. K., Kutzbach, J. E., Liu, Z. Y., Ni, F. B., and An, Z. S.: Seasonal precipitation in the south-central Helan Mountain region, China, reconstructed from tree-ring width for the past 224 years, Can. J. Forest Res., 35, 2403–2412, https://doi.org/10.1139/x05-168, 2005.
Liu, Y., Cai, Q. F., Liu, W. G., Yang, Y. K., Sun, J. Y., Song, H. M., and Li, X. X.: Monsoon precipitation variation recorded by tree-ring δ18O in arid Northwest China since AD 1878, Chem. Geol., 252, 56–61, https://doi.org/10.1016/j.chemgeo.2008.01.024, 2008.
Liu, Y., Lei, Y., Sun, B., Song, H. M., and Li, Q.: Annual precipitation variability inferred from tree-ring width chronologies in the Changling–Shoulu region, China, during AD 1853–2007, Dendrochronologia, 31, 290–296, https://doi.org/10.1016/j.dendro.2013.02.001, 2013.
Liu, Y., Sun, C. F., Li, Q., and Cai, Q. F.: A Picea crassifolia tree-ring width-based temperature reconstruction for the Mt. Dongda region, Northwest China, and its relationship to large-scale climate forcing, PLoS One, 11, e0160963, https://doi.org/10.1371/journal.pone.0160963, 2016.
Ma, L. M., Liu, Y., Cai, Q. F., and An, Z. S.: The precipitation records from tree-ring late wood width in the helan mountain, Mar. Geol. Quatern. Geol., 23, 109–114, https://doi.org/10.16562/j.cnki.0256-1492.2003.04.016, 2003.
Ma, M. J., Pu, Z. X., Wang, S. G., and Zhang, Q. A.: Characteristics and numerical simulations of extremely large atmospheric boundary-layer heights over an arid region in north-west china, Boundary-Lay. Meteorol., 140, 163–176, https://doi.org/10.1007/s10546-011-9608-2, 2011.
Ma, Z. G. and Fu, C. B.: The basic facts of aridity in northern China from 1951 to 2004, Chin. Sci. Bull., 51, 2429–2439, 2006.
Ou, T. H. and Qian, W. H.: Vegetation variations along the monsoon boundary zone in East Asia, Chin. J. Geophys., 49, 698–705, 2006.
Qin, L., Liu, G. X., Li, X. Z., Chongyi, E., Li, J., Wu, C. R., Guan, X., and Wang, Y.: A 1000-year hydroclimate record from the Asian summer monsoon-Westerlies transition zone in the northeastern Qinghai-Tibetan Plateau, Climatic Change, 176, 1–20, https://doi.org/10.1007/s10584-023-03497-1, 2023.
Qu, W. J., Zhang, X. H., Wang, D., Shen, Z. X., Mei, F. M., Cheng, Y., and Yan, L. W.: The important significance of westerly wind study, Mar. Geol. Quatern. Geol., 24, 125–132, https://doi.org/10.16562/j.cnki.0256-1492.2004.01.018, 2004.
Shao, X. M., Xu, Y., Yin, Z. Y., Liang, E. Y., Zhu, H. F., and Wang, S.: Climatic implications of a 3585-year tree-ring width chronology from the northeastern Qinghai-Tibetan Plateau, Quaternary Sci. Rev., 29, 2111–2122, https://doi.org/10.1016/j.quascirev.2010.05.005, 2010.
Sun, D. H., An, Z. S., Su, R. H., Deer, H. Y., and Sun, Y. B.: The dust deposition records of the evaluation of Asia monsoon and Westerly circulation in north China in the last 2.6 Ma, Sci. China Ser. D, 33, 497–504, 2003.
Sun, L. Q., Li, T. J., Li, Q. L., and Wu, Y. P.: Responses of autumn flood peak in the Yellow River source regions to westerly circulation index, J. Glaciol. Geocryol., 41, 1475–1482, https://doi.org/10.7522/j.issn.1000-0240.2019.0028, 2019.
Tang, X., Qian, W. H., and Liang, P.: Climatic features of boundary belt for East Asian Summer Monsoon, Plateau Meteorol., 25, 375–381, 2006.
Vicente-Serrano, S. M., Beguería, S., and López-Moreno, J. I.: A multiscalar drought index sensitive to global warming: the standardized precipitation evapotranspiration index, J. Climate, 23, 1696–1718, https://doi.org/10.1175/2009jcli2909.1, 2010.
Wang, B. J., Huang, Y. X., He, J. H., and Wang, L. J.: Relation between vapour transportation in the period of East Asian Summer Monsoon and drought in Northwest China, Plateau Meteorol., 23, 912–917, 2004.
Wang, J. L., Yang, B., Ljungqvist, F. C., Luterbacher, J., Osborn, T. J., Briffa, K. R., and Zorita, E.: Internal and external forcing of multidecadal Atlantic climate variability over the past 1,200 years, Nat. Geosci., 10, 512–517, https://doi.org/10.1038/ngeo2962, 2017.
Wang, K. L., Jiang, H., and Zhao, H. Y.: Atmospheric water vapor transport from westerly and monsoon over the Northwest China, Adv. Water Sci., 16, 432–438, https://doi.org/10.14042/j.cnki.32.1309.2005.03.021, 2005.
Wigley, T. M. L., Briffa, K. R., and Jones, P. D.: On the average value of correlated time series, with applications in dendroclimatology and hydrometeorology, J. Clim. Appl. Meteorol., 23, 201–213, 1984.
Xiao, S. C., Chen, X. H., and Ding, A. J.: Study process of climate changes, environment evolution and its driving mechanism in the last two centuries in the Alxa Desert, J. Desert Res., 37, 1102–1201, https://doi.org/10.7522/j.issn.1000-694x.2017.00002, 2017.
Xiao, S. C., Yan, C. Z., Tian, Y. Z., Si, J. H., Ding, A. J., Chen, X. H., Han, C., and Teng, Z. Y.: Regionalization for desertification control and countermeasures in the Alxa Plateau, China, J. Desert Res., 39, 182–192, 2019.
Xu, J. J., Wang, K. L., Jiang, H., Li, Z. G., Sun, J., Luo, X. P., and Zhu, Q. L.: A numerical simulation of the effects of Westerly and Monsoon on precipitation in the Heihe River Basin, J. Glaciol. Geocryol., 32, 489–496, 2010.
Yan, H. S., Hu, J., Fan, K., and Zhang, Y. J.: The analysis of relationship between the variations of Westerly Index in summer and precipitation during the flood period over China in the last 50 years, Chin. J. Atmos. Sci., 31, 717–726, 2007.
Yang, B., Qin, C., Wang, J. L., He, M. H., Melvin, T. M., Osborn, T. J., and Briffa, K. R.: A 3,500-year tree-ring record of annual precipitation on the northeastern Tibetan Plateau, P. Natl. Acad. Sci. USA, 111, 2903–2908, https://doi.org/10.1073/pnas.1319238111, 2014.
Yang, J. H., Zhang, Q., Liu, X. Y., Yue, P., Shang, J. L., Ling, H., and Li, W. J.: Spatial-temporal characteristics and causes of summer precipitation anomalies in the transitional zone of typical summer monsoon, China, Chin. J. Geophys., 62, 4120–4128, https://doi.org/10.6038/cjg2019M0639, 2019.
Yuan, L.: Hazards history in northwestern China, Gansu people's press, Lanzhou, China, 1994.
Zhang, F., Chen, Q. M., Su, J. J., Deng, Y., Gao, L. L., and Gou, X. H.: Tree-ring recorded of the drought variability in the northwest monsoon marginal, China, J. Glaciol. Geocryol., 39, 245–251, 2017.
Zhang, Q., Yang, J. H., Wang, P. L., Yu, H. P., Yue, P., Liu, X. Y., Lin, J. J., Duan, X. Y., Zhu, B., and Yan, X. Y.: Progress and prospect on climate warming and humidification in Northwest China, Chin. Sci. Bull., 68, 1814–1828, https://doi.org/10.1360/TB-2022-0643, 2023.
Zhang, Q. B., Cheng, G. D., Yao, T. D., Kang, X. C., and Huang, J. G.: A 2,326 year tree-ring record of climate variability on the northeastern Qinghai-Tibetan Plateau, Geophys. Res. Lett., 30, 1739, https://doi.org/10.1029/2003GL017425, 2003.
Zhang, Q. L., Liu, W. G., Liu, Y., Ning, Y. F., and Wen, Q. B.: Relationship between the stable carbon and oxygen isotopic compositions of tree ring in the Mt. Helan region, Northwestern China, Geochimica, 34, 51–56, https://doi.org/10.19700/j.0379-1726.2005.01.006, 2005.
Zhang, S., Xu, H., Lan, J. H., Goldsmith, Y., Torfstein, A., Zhang, G. L., Zhang, J., Song, Y. P., Zhou, K. E., Tan, L. C., Xu, S., Xu, X. M., and Enzel, Y.: Dust storms in northern China during the last 500 years, Sci. China Earth Sci., 64, 813–824, https://doi.org/10.1007/s11430-020-9730-2, 2021.
Zhang, Y., Shao, X. M., Yin, Z. Y., Liang, E. Y., Tian, Q. H., and Xu, Y.: Characteristics of extreme droughts inferred from tree-ring data in the Qilian Mountains, 1700–2005, Clim. Res., 50, 141–159, https://doi.org/10.3354/cr01051, 2011.
Zhang, Y. X., Yu, L., and Yin, H.: Annual precipitation reconstruction over last 191 years at the south edge of Badain Jaran Desert based on tree ring width data, Desert Oasis Meteorol., 9, 12–16, https://doi.org/10.3969/j.issn.1002-0799.2015.01.003, 2015.
Zhang, Y. X., Gou, X. H., Hu, W. D., Peng, J. F., and Liu, P. X.: The drought events recorded in tree ring width in Helan Mt. over past 100 years, Acta Ecol. Sin., 25, 2121–2126, 2005b.