the Creative Commons Attribution 4.0 License.
the Creative Commons Attribution 4.0 License.
 | 22 Jul 2024
Reconstructing Younger Dryas ground temperature and snow thickness from cave deposits
Paul Töchterle
Anna Baldo
Julian B. Murton
Frederik Schenk
R. Lawrence Edwards
Gabriella Koltai
The Younger Dryas stadial was characterised by a rapid shift towards cold-climate conditions in the North Atlantic realm during the last deglaciation. While some climate parameters including atmospheric temperature and glacier extent are widely studied, empirical constraints on permafrost temperature and snow thickness are limited. To address this, we present a regional dataset of cryogenic cave carbonates (CCCs) from three caves in Great Britain that formed at temperatures between −2 and 0 °C. Our CCC record indicates that these permafrost temperatures persisted for most of the Younger Dryas. By combining ground temperatures with surface temperatures from high-resolution ground-truthed model simulations, we demonstrate that ground temperatures were approximately 6.6 ± 2.3 °C warmer than the mean annual air temperature. Our results suggest that the observed temperature offset between permafrost and the atmosphere can be explained by an average snow thickness between 0.2 and 0.9 m, which persisted for 233 ± 54 d per year. By identifying modern analogues from climate reanalysis data, we demonstrate that the inferred temperature and snow cover characteristics for the British Isles during the Younger Dryas are best explained by extreme temperature seasonality, comparable to continental parts of today's Arctic Archipelago. Such a climate for the British Isles necessitates a winter sea ice margin at approximately 45° N in the North Atlantic Ocean.
- Article
(3349 KB) - Full-text XML
-
Supplement
(2218 KB) - BibTeX
- EndNote


The Younger Dryas stadial refers to a period from approximately 12.9 to 11.6 ka (Cheng et al., 2020) when the climatic transition from the Last Glacial Maximum to the Holocene was interrupted by a shift towards extremely cold climate conditions in the North Atlantic realm. Proxy records from northwestern Europe and Greenland show the most severe cooling (e.g. Renssen and Isarin, 1997; Heiri et al., 2014), with absolute temperature estimates ranging from 5 to 10 °C of cooling relative to the preceding Bølling–Allerød interstadial (e.g. Denton et al., 2005; Baldini et al., 2015). Meanwhile, temperature trends in parts of the Southern Hemisphere and elsewhere were attenuated or even reversed (e.g. Shakun and Carlson, 2010; Carlson, 2013; Reeves et al., 2013). There is ongoing debate on the cause of the Younger Dryas. The most prominent hypotheses include a slow-down of the Atlantic Meridional Overturning Circulation (AMOC) in response to increased meltwater input (e.g. Broecker, 2006; Murton et al., 2010), atmospheric reorganisation (e.g. Brauer et al., 2008), radiative forcing after an extra-terrestrial impact (e.g. Firestone et al., 2007; Israde-Alcántara et al., 2012), and a combination of these factors (Renssen et al., 2015).
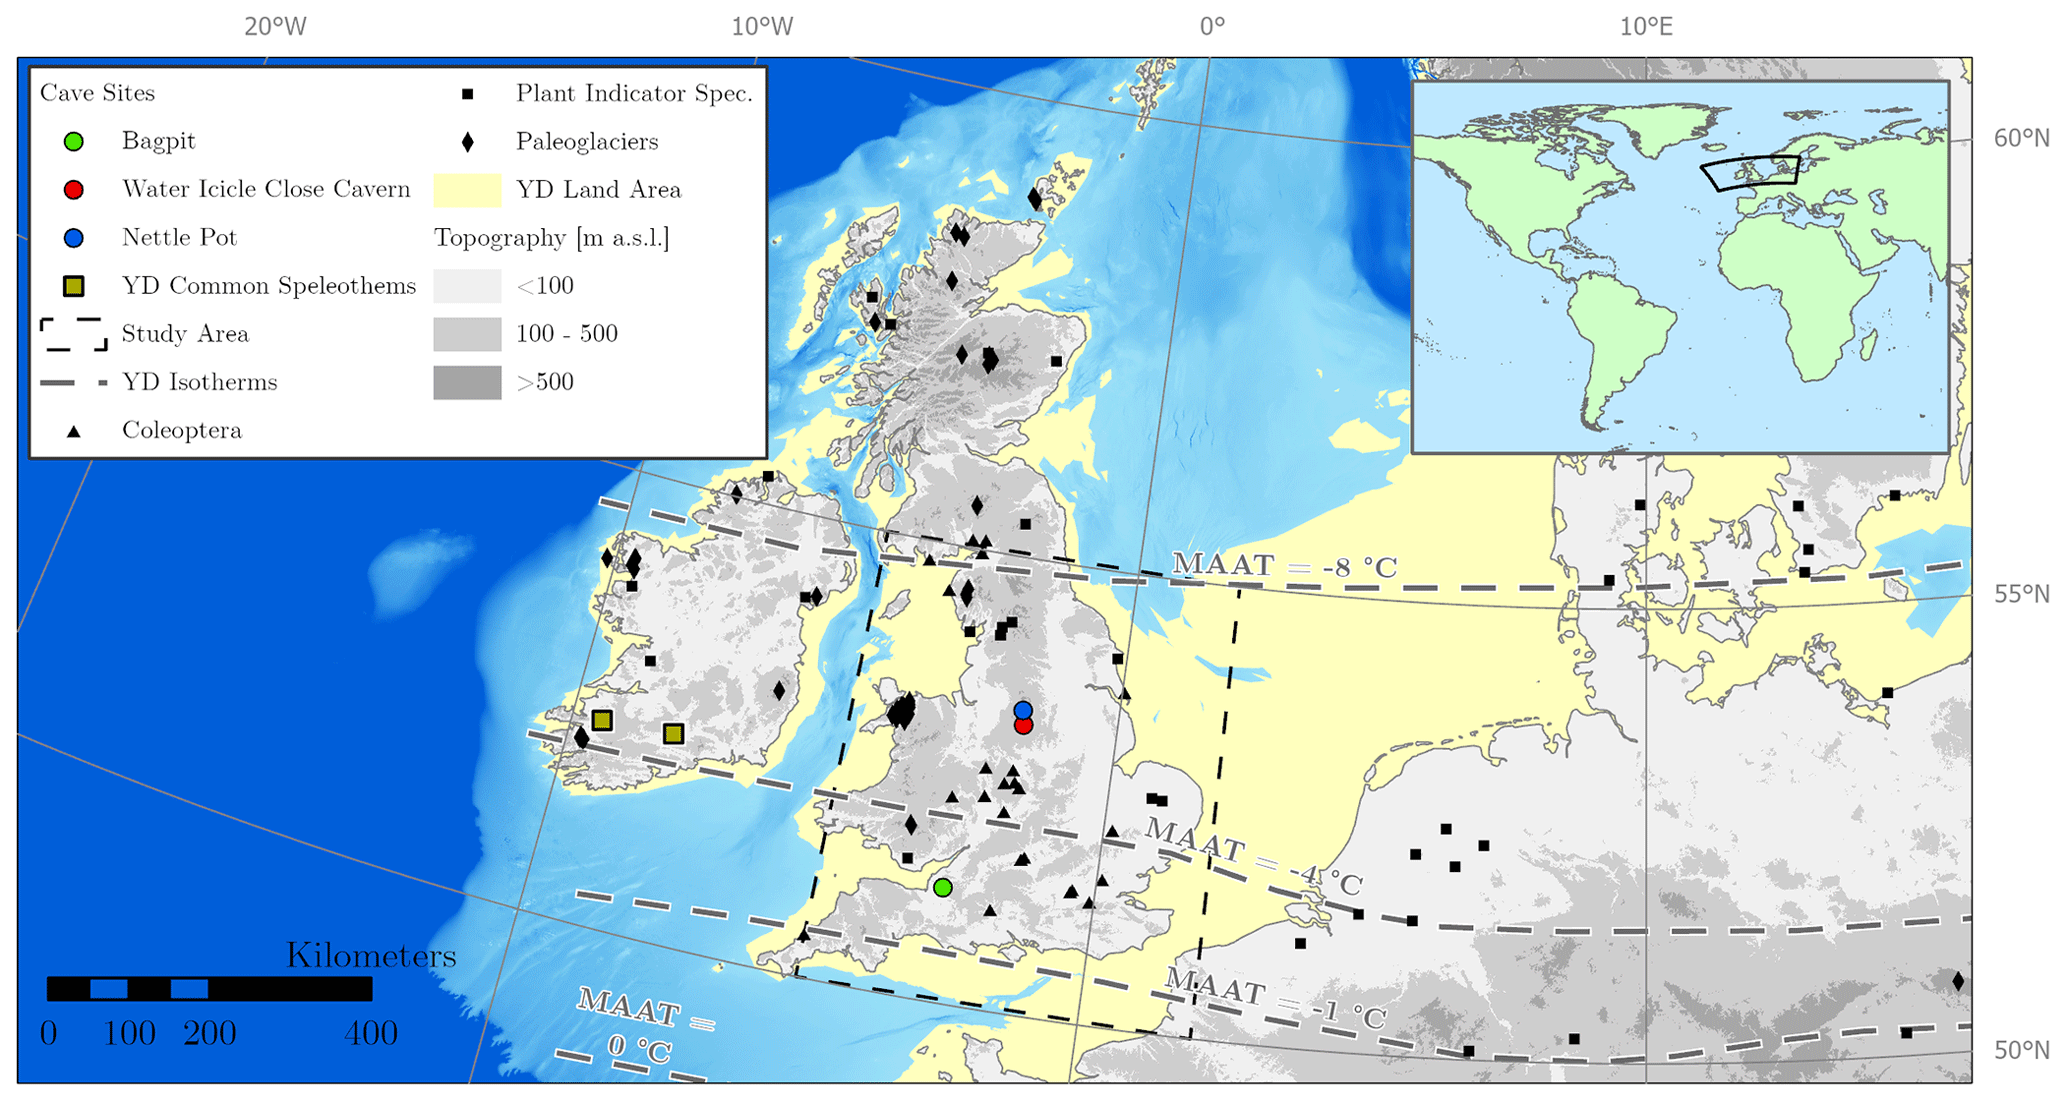
Figure 1Topographical map of the study region. The studied cave sites are marked by coloured dots, and two additional caves with reported common speleothem deposition during the Younger Dryas (Swabey, 1996) are shown in grey. The extent of the study area (50–55° N, −5° W–2° E) is delineated by a dashed black line. Black symbols depict the study sites that were considered in Younger Dryas surface temperature reconstructions (i.e. triangles – Coleoptera, Atkinson et al., 1987; squares – different biogenic proxies including plant indicator species, Schenk et al., 2018; diamonds – paleo-glacier equilibrium line altitude, ELA; Rea et al., 2020). Dashed isotherms are taken from a Younger Dryas temperature reconstruction based on periglacial features (Isarin, 1997). The Younger Dryas land area is equivalent to the −60 m bathymetry contour line and has not been adjusted for post-glacial isostatic rebound.
In the North Atlantic realm, the Younger Dryas was characterised by extreme seasonal changes, namely relatively short summers that likely were only slightly cooler than those of today contrasted with long and cold winters (Denton et al., 2005; Schenk et al., 2018). Sea level was approximately 60 m lower than at present (e.g. Smith et al., 2011; Cronin, 2012), exposing large parts of the European continental shelf that today are covered by the English Channel and the North Sea (Fig. 1). In the local chronostratigraphic nomenclature of the British Isles, the Younger Dryas is traditionally seen as the equivalent to Loch Lomond stadial, which has primarily been defined by Scottish moraine chronologies (e.g. Ballantyne and Harris, 1994; Golledge et al., 2007; Golledge, 2010). Recent studies have cast doubt on the synchronicity of the Loch Lomond stadial with the Younger Dryas, arguing that Scottish glaciers already formed during the preceding interstadial and melted during the Younger Dryas (Bromley et al., 2014, 2018, 2023; Putnam et al., 2019). Nevertheless, a majority of studies on independent proxy records dated to the Younger Dryas infer a significantly colder climate and lower mean annual air temperature (MAAT) than today (e.g. Swabey, 1996; Jones et al., 2004; Palmer et al., 2010; Brooks and Langdon, 2014; Lincoln et al., 2020; Timms et al., 2021).
While many components of the Younger Dryas climate system of the British Isles have been inferred from proxy data, few studies have addressed past permafrost (Ballantyne and Harris, 1994; Isarin, 1997; Williams, 1965; Murton and Ballantyne, 2017), in part due to limitations of identifying and dating evidence of the former permafrost presence. Reliable archives that provide direct evidence for past permafrost include ice-wedge pseudomorphs and a variety of geomorphological features (e.g. French, 1999; Vandenberghe et al., 2012, 2014; Ballantyne, 2018a). Hiatuses in the growth periods of common speleothem deposits like stalagmites and flowstones have also been used to reconstruct past permafrost at mid- and high latitudes (Vaks et al., 2013, 2020; Biller-Celander et al., 2021). However, a weakness of this approach is that it merely implies hydrological inactivity of the karst aquifer, which may or may not be related to sub-zero temperatures and permafrost. Consequently, additional context is required to use hiatuses in common speleothems as an indicator for past permafrost.
Cryogenic cave carbonates (CCCs) are a special subtype of speleothem that occur as loose piles of morphologically diverse carbonate crystals in isolated cave chambers and are commonly associated with permafrost (Žák et al., 2004, 2008, 2018). The formation of these mineral deposits with grain sizes larger than approx. 1 mm requires a sufficiently large volume of water to freeze at a slow rate. Consequently, the cave environment must maintain the solidus temperature of water (i.e. 0 °C or slightly below that if the solution is sufficiently briny) for extended periods of time. Previous studies have defined the CCC formation window between −1 and 0 °C, whereas a temperature between −0.5 and 0 °C is deemed more likely (Koltai et al., 2021; Spötl et al., 2021). Recent studies reported in situ finds of CCCs and provided further support for this genetic model of slowly freezing ionised water at temperatures slightly below 0 °C, which previously had relied on indirect field evidence and the carbon and oxygen isotopic composition (Bartolomé et al., 2015; Munroe et al., 2021). CCC formation conditions are thus well constrained, thereby enabling their use as a reliable paleo-thermometer from which past permafrost can be determined (e.g. Žák et al., 2012; Orvošová et al., 2014; Dublyansky et al., 2018).
In this study, we apply a regional, model-integrated approach to CCCs to elucidate past permafrost distribution and the ground thermal regime. We present a dataset from three caves in the British Isles comprising 10 distinct CCC deposits that date to the Younger Dryas stadial. Ground temperatures derived from CCCs are placed in context with concurrent common speleothem deposition in the region, air temperature proxy data, and high-resolution climate model simulations. From these data, quantitative constraints on the ground thermal regime, as well as the thickness of snow cover, are derived. Our results amend previous reconstructions of permafrost and winter precipitation in the British Isles during the Younger Dryas and provide suggestions for the future use of CCCs as a paleo-permafrost archive.
The CCC samples presented in this study were taken from three different cave sites across a 300 km long north–south transect of Great Britain (Fig. 1). The caves are situated within thick (up to 600 m) sequences of Palaeozoic limestones in the regions of the Peak District east of Manchester (mean elevation ∼ 200 m above sea level, ) and the Mendip Hills south of Bristol (mean elevation ∼ 150 ).
The entrance to Water Icicle Close Cavern (WIC; local topography in Fig. S1; cave plan in Fig. S2) is situated at 341 No natural entrance is known, and the cave is accessed via a medieval mine shaft. Over 1 km of passages has been explored, most of which formed along a horizontal level between 30 and 40 m below the surface. The present-day MAAT in the region is 8.3 °C, and mean annual precipitation amounts to approximately 1000 mm, a negligible portion of which falls as snow (Fig. S3; ERA5 reanalysis data from 1990 to 2020; Muñoz Sabater, 2019). Monitoring of the cave atmosphere between 2019 and 2020 revealed a stable microclimate with a constant cave air temperature of 8.7 °C (Fig. S4), in close agreement with the local MAAT. Broken speleothems from this cave have previously been used to identify a period of cave glaciation between 87 and 83 ka related to permafrost (Gunn et al., 2020), and two CCC deposits of Younger Dryas age have been reported (Töchterle et al., 2022).
Second, Nettle Pot (NTL; local topography in Fig. S1; cave plan in Fig. S2), located in the Peak District, is a more vertical cave system with passages as deep as 170 m below the entrance, which lies at 467 The modern climate is characterised by a MAAT of 8.2 °C and 1040 mm of mean annual precipitation (Fig. S3). The CCC deposit presented herein is located within a sloping passage at a depth of 130 m. Cave access is technically demanding and precluded long-term monitoring. Due to the depth of the system, however, a thermal anomaly by convective heat fluxes, which could potentially lead to sub-zero temperature at the CCC site in the absence of regional permafrost, is unlikely.
Third, Bagpit cave (BGP; local topography in Fig. S1; cave plan in Fig. S2) is a relatively small cave system, with a 172 m long network of explored passages, located in the Mendip Hills south of Bristol. The cave entrance lies at 257 and was only recently discovered through excavation efforts by caving enthusiasts. The local climate is comparable to the caves in the Peak District, although with a warmer MAAT of 10.2 °C and a lower mean annual precipitation of approximately 850 mm. Cave monitoring reveals a seasonal temperature cycle at 15 m below the surface of between 9.8 and 10.9 °C, with a 6-month phase shift compared to surface temperatures (Fig. S5). This indicates that conductive heat flux is the dominant mode of energy transfer in the system, and advective heat flux by air ventilation and/or groundwater flow is negligible. These low-amplitude temperature variations were observed at a shallow part of the cave, and they are likely to be attenuated in the deeper parts where CCC samples were taken (between 20 and 28 m below the surface). As with WIC, the mean cave temperature in Bagpit (10.4 °C) closely resembles the local MAAT.
Table 1Isochron ages and metrics of the analysed CCC deposits. The reported error in the isotopic ratios corresponds to the respective 2σ uncertainty. The reported R2 corresponds to the respective regression in the vs. plane of the 3D isochron. Isochron ages are relative to 1950 AD. A graphic representation of the isochrones is provided in the Supplement.
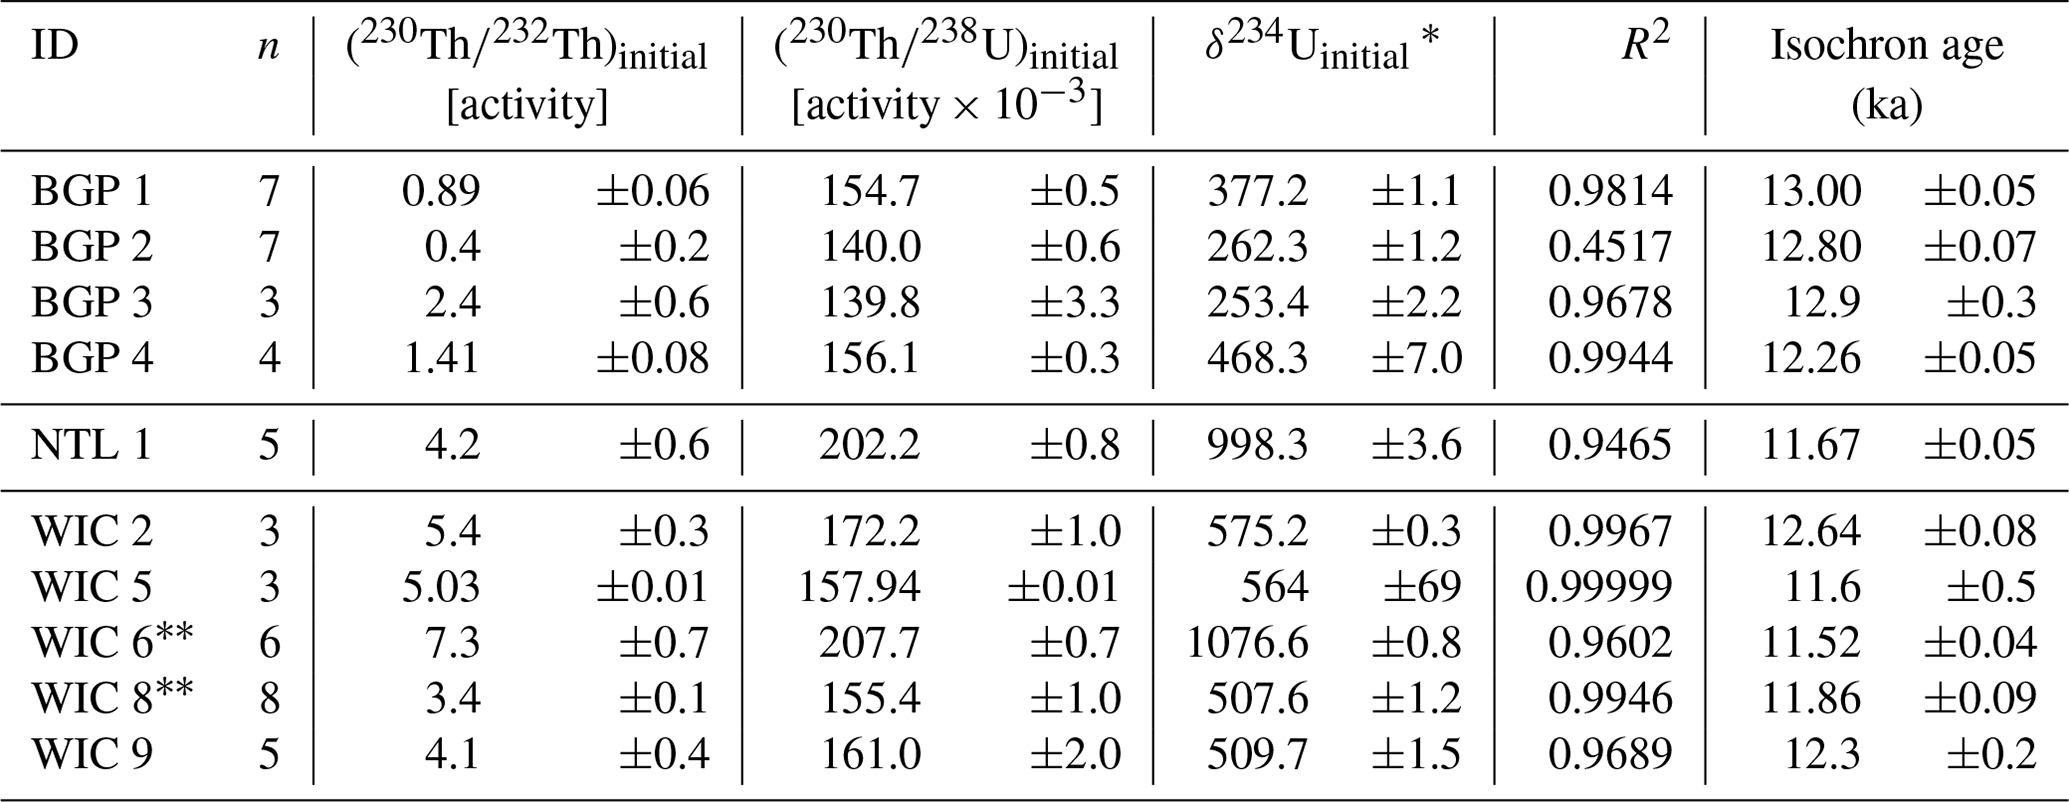
∗ δ234U = . From Töchterle et al. (2022).
All three caves are complex systems in which large parts were previously isolated from the surface and only became accessible through digging and excavation in modern times. The sites where CCCs were found are situated in the homotrophic zone of the systems, far away from the cave entrance, where temperatures are in stable equilibrium with the local MAAT, as evidenced by the monitoring data. While anthropogenic modifications to the cave passages (e.g. excavation) may have altered air circulation patterns, monitoring shows that the cave temperature at the respective sites remained in equilibrium with the surrounding host rock and MAAT. These thermal characteristics are a prerequisite for cave-based paleoclimate studies in general and inspire confidence that the selected cave sites did not behave as cold-air traps in the past. The caves all lie on NE-facing slopes, leeward of the predominant SW wind direction, with relatively gently slope angles below 15° (Fig. S1). The bedrock is covered with shallow (typically less than 1 m) soil that is drained efficiently through the underlying karst aquifers, leading to a lack of surface water bodies in the immediate vicinity of the caves.
3.1 Monitoring and sampling
The CCC samples for this study were collected during several field trips between 2018 and 2020. Sites of CCC occurrences were mapped, and a subsample was taken from each patch. Sampling of CCC patches was done by scooping up a representative sample with a knife while taking care to leave the overall appearance of the site intact. At two of the three caves (BGP and WIC), temperature loggers (HOBO Water Temp Pro v2, calibrated in an ice bath) were installed and recorded the ambient cave air temperature for at least 1 year at a temporal resolution of 30 min.
3.2 Stable isotopes
To confirm the cryogenic origin of the samples presented in this study, we used carbon and oxygen stable isotope analysis as a diagnostic tool. From each sample, several specimens were selected and cleaned in an ultrasonic bath with deionised water. After subsequent drying, approx. 20–30 µg of powdered material was drilled from random places on the specimen using a burr-tipped carbide dental drill. Powder samples were then analysed on a Thermo Scientific DELTA V Plus mass spectrometer coupled to a Gas Bench II module, according to standard analytical procedures (Spötl and Vennemann, 2003). Results are reported in reference to the Vienna Pee Dee Belemnite (VPDB) standard at a long-term analytical precision of 0.05 ‰ for δ18O and 0.06 ‰ for δ13C (Spötl, 2011).
3.3 Dating of CCCs
An aliquot of three to eight CCC specimens (between 20 and 60 mg each) was selected for analysis at the University of Minnesota's Edwards Trace Metal Isotope Geochemistry Laboratory. Where the grain size of CCCs was too small to yield enough material for analysis from a single grain, multiple smaller grains of similar morphology were combined (WIC 2 and WIC 5 in Table 1). Each aliquot was cleaned in an ultrasonic bath of deionised water prior to analysis, and visible detritus was removed with a toothbrush. The cleaned specimens were dissolved in dilute HNO3 before undergoing chemical preparation (Edwards et al., 1987), and extracts of uranium and thorium were analysed on a Thermo Fisher Neptune Plus multi-collector inductively coupled plasma mass spectrometer in the peak-jumping configuration with an electron multiplier (Shen et al., 2012).
The decay constants used for age calculation were λ238 = 1.55125 × 10⁻¹⁰ a−1 (Jaffey et al., 1971) and λ234 = 2.82206 × 10⁻⁶ a−1 (Cheng et al., 2013) for uranium and λ230 = 9.1705 × 10⁻⁶ a−1 (Cheng et al., 2013) and λ232 = 4.9475 × 10⁻¹¹ a−1 (LeRoux and Glendenin, 1963) for thorium. Reported ages are based on linear –– isochron models (Töchterle et al., 2022) and reported in kiloyears before 1950 (ka) at a 2σ uncertainty interval of the respective regression.
3.4 Modern climate data
In order to compare our paleo-archive with modern analogues, we used the monthly ERA5 Land reanalysis dataset (Muñoz Sabater, 2019) and extracted gridded time series (0.25° × 0.25°) for soil temperature, snow thickness, and 2 m air temperature between 1990 and 2020.
For permafrost extent and percentages, the 2010 time slice from the European Space Agency's (ESA) Climate Change Initiative Permafrost project was used (Obu et al., 2021). This dataset is based on satellite measurements of land surface temperature (Moderate Resolution Imaging Spectroradiometer, MODIS) to drive a permafrost-specific thermal model (CryoGrid 1; Gisnås et al., 2013) at a 1 km × 1 km spatial resolution and covers the Northern Hemisphere for the period 1997–2018. Note that only the permafrost area fraction parameter is used hereafter. We classified the percentage areal extent of permafrost based on generally accepted intervals (i.e. < 10 % of area = isolated discontinuous permafrost; 10 %–50 % = sporadic discontinuous; 50 %–90 % = extensive discontinuous; > 90 % = continuous permafrost). Areas with a permafrost fraction below 10 % were removed from the dataset.
For all subsequent calculations, the reanalysis data and the permafrost grid were down-sampled to a lower resolution of 92 km × 92 km using spatial mean values.
The CCC samples presented in this study were taken from three different cave sites across a 300 km long north–south transect across Britain (Fig. 1). The studied samples comprise a large variety of crystal morphologies, as is typical of CCCs. Common morphological types include (i) milky-white (semi-)spherical crystals with high degrees of non-crystallographic branching (Shtukenberg et al., 2012); (ii) brownish crystals that cover the entire morphological range, which is induced by non-crystallographic branching; and (iii) aggregates of the two aforementioned types (Fig. S6).
Stable isotope analyses of the studied CCC deposits yielded values between −16.0 and −8.1 ‰ for δ18O and −7.4 and −0.2 ‰ for δ13C (Fig. S7). These values follow a characteristic offset from common dripstone/flowstone speleothems in the area, which have significantly higher δ18O values of approximately −5 to −3 ‰ and lower δ13C values of approximately −11 to −8 ‰ (Fig. S7; e.g. Gunn et al., 2020). This offset between common speleothems and CCCs is diagnostic for “CCCcoarse” (sensu Luetscher et al., 2013); hence, we can be confident that our samples formed during the slow freezing of water in a stable climate (Žák et al., 2018).
Overall, 51 analyses were performed on 10 distinct CCC deposits from the 3 caves in the study area (Table S1), and an isochron age for each CCC deposit was calculated. The formation ages of CCC deposits cover a time span from 13.00 ± 0.05 to 11.52 ± 0.04 ka (Table 1), which is broadly consistent with published definitions of the Younger Dryas boundaries (Cheng et al., 2020). Ages from Bagpit cave cover only the earlier part of the Younger Dryas (ca. 13.00 to ca. 12.26 ka), whereas the analysed CCC deposits from the two caves in the north are more concentrated towards the latter half of the period (ca. 12.64 to ca. 11.52 ka) (Fig. 2). Overall, however, there is no prominent clustering of ages.
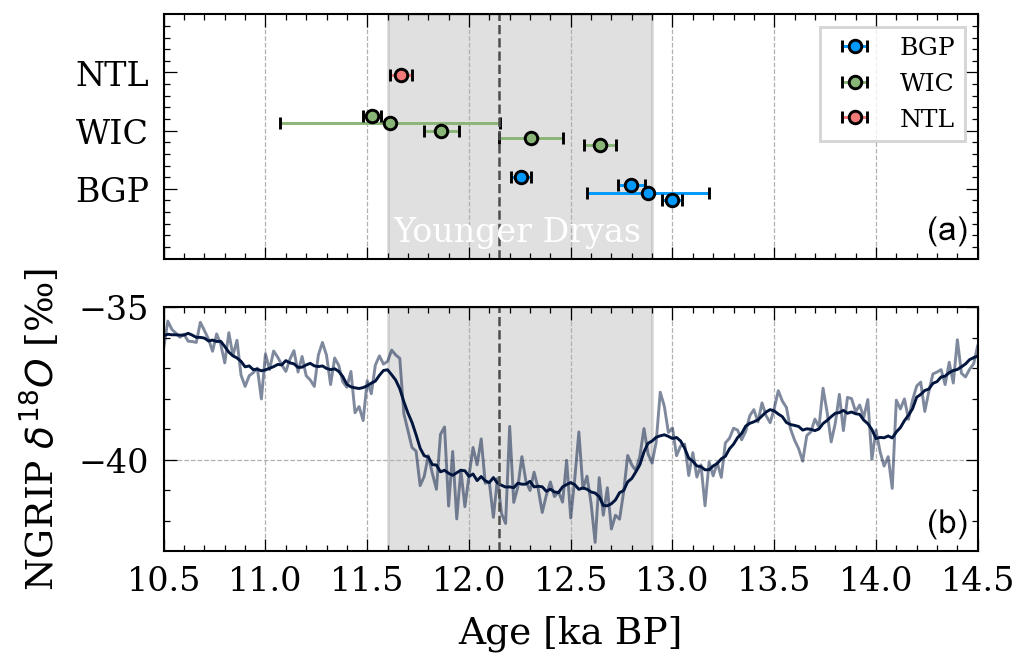
Figure 2Formation ages of CCCs in comparison to the Greenland ice core record. (a) CCC formation ages from the studied cave sites. Error bars refer to the 2σ error in the respective isochron. Grey shaded area represents the defined limits of the Younger Dryas period. Caves are sorted by latitude (north is top) along the vertical axis, and the position of individual data points is offset arbitrarily for better visibility. (b) δ18O in Greenland precipitation from the North Greenland Ice Core Project (NGRIP) ice core record (Rasmussen et al., 2014). The smoothed line represents a 100-year moving average. The dashed vertical line indicates the mid-Younger-Dryas transition (12.15 ka).
4.1 Ground temperatures during the Younger Dryas
We infer from temperature monitoring data at the cave sites that conductive heat flux is the dominant mode of energy transfer, and thus, thermal anomalies causing cave temperature to deviate from MAAT are unlikely to have affected the sites. Consequently, cave temperatures can be assumed to mirror changes in atmospheric temperature on decadal or longer timescales. The distribution of CCC ages suggests that ground temperatures (in a depth range between 20 and 130 m) around the respective cave sites were within the CCC formation window throughout large parts of the Younger Dryas. Note that, in this study, we conservatively opted to extend the CCC formation window to −2–0 °C as opposed to previous studies (i.e. −1–0 °C in Koltai et al., 2021; Spötl et al., 2021) in order to account for short-term positive thermal anomalies that may arise from convective heat transfer by substantial amounts of infiltrating water.
The presence of permafrost in the study area during the Younger Dryas has already been demonstrated in previous studies. For example, geomorphological and sedimentological evidence from various sites across northern Europe suggests that continuous permafrost (MAAT < −8 °C; see Fig. 1) existed north of 54° N, with discontinuous permafrost (MAAT < −1 °C) reaching as far south as 50° N (Isarin, 1997). Moreover, the Younger Dryas coincides with a hiatus of burial sites in the archaeological record of the British Isles which is possibly linked to changed funerary practices in response to perennially frozen ground (Blockley and Gamble, 2016). These results from independent archives align well with the British CCC record.
Critically, CCC records are inherently discontinuous in time. A given CCC deposit can only provide evidence for the presence of permafrost at a certain point in time, whereas the absence of CCCs does not verify the absence of permafrost. Consequently, it is necessary to take extreme caution when interpreting gaps in the CCC record. Precise temporal constraints for periods of permafrost aggradation and/or degradation cannot be derived directly from CCC ages. It is possible that significant short-term spikes in temperature occurred during the gaps in the British CCC record (Fig. 2), although there is no evidence in other (continuous) proxy records to suggest that they did (e.g. Brauer et al., 2008; Lane et al., 2013; Cheng et al., 2020).
Interestingly, a large number of climate records from the North Atlantic realm and elsewhere show a prominent switch from an extremely cold and dry climate to notably milder conditions that occurred mid-Younger Dryas at approximately 12.15 ka (e.g. Brauer et al., 2008; Bakke et al., 2009; Lane et al., 2013; Baldini et al., 2015; Cheng et al., 2020). The British CCC record also shows no data in the southern sector after 12.21 ka, though it is difficult to assess its significance, especially because the dataset (one cave with four CCC deposits in this case) is small. However, our data do not exclude the possibility of a northward migration of the ground 0 °C isotherm at the time of the mid-Younger Dryas transition nor do they support it. Overall, the British CCC record provides convincing evidence that ground temperatures at the studied cave sites were in the range of the CCC formation window between −2 and 0 °C throughout most of the Younger Dryas stadial.
4.2 Common speleothems during the Younger Dryas
By counterargument, the presence of permafrost as derived from the British CCC record would imply a cessation of growth of common speleothems. The published literature gives ambiguous evidence of a general Younger Dryas speleothem hiatus. Numerous studies report speleothem ages that at least overlap the Younger Dryas boundaries within error (e.g. Atkinson et al., 1978, 1986; Gascoyne et al., 1983; Baker et al., 1996). However, these studies mostly used alpha-spectrometry methods which have large analytical uncertainty compared to modern mass-spectrometry-based methods (i.e. between 7 % and 150 % of the absolute age at the 1σ level, which corresponds to an age uncertainty between ± 0.8 and ± 18 ka in absolute numbers for a 12.0 ka sample). Due to this excessive age uncertainty, these data are not suitable to detect a potential speleothem hiatus during a millennial-scale climate event such as the Younger Dryas. While numerous Younger Dryas speleothem records have been published from continental Europe south of the study area, modern mass-spectrometry-based evidence for common speleothem growth on the British Isles has only been reported from two caves in the Republic of Ireland: Crag Cave (Swabey, 1996; McDermott et al., 1999; Fankhauser et al., 2016) and Mitchelstown Cave (Swabey, 1996). These sites are located at 52° N, roughly equivalent to the southernmost site (BGP) reported in this study, although they are in closer proximity to the Younger Dryas coastline (Fig. 1) and at significantly lower elevation (approximately 100 ). To date, there is no conclusive evidence of common speleothem deposition during the Younger Dryas either in the caves reported herein or in any of the caves in their proximity. Given that the ground temperatures we inferred from CCCs are close to 0 °C, it would, however, not be surprising to see at least episodic common speleothem growth at other caves where conditions such as aspect, elevation, or the cave ventilation regime were more favourable, like at the cited examples in the Republic of Ireland. Overall, the available evidence from common speleothems in connection with our CCC ages is in good agreement with the distribution of continuous and discontinuous permafrost inferred from periglacial features (Isarin, 1997; see Fig. 1).
4.3 Temperature offset between permafrost and the atmosphere
Periglacial activity, including thermal contraction cracking, was widespread during the Younger Dryas in the British Isles (Ballantyne and Harris, 1994; Murton and Ballantyne, 2017). Based on observations from today's permafrost regions, ice wedges tend to crack by thermal contraction most frequently in areas with a MAAT of lower than about −6 and −8 °C in coarse-grained sediments (sand and gravel) and lower than about −4 °C in fine-grained sediments (silt and clay), although these constitute only approximate upper estimates because local factors also influence cracking (Ballantyne, 2018b). At the time of cracking, cold (winter) air temperatures usually between −25 and −40 °C, and ground surface temperatures from −15 to −25 °C are considered necessary (French, 2017). The mean atmospheric temperatures which prevailed throughout large parts of the Younger Dryas have been constrained by numerous quantitative proxy records. Here, we are using the results of meta-analyses which compiled temperature estimates from over 300 individual sites in total in the British Isles and adjacent NW Europe (locations shown in Fig. 1) to derive a robust estimate of Younger Dryas MAAT.
Table 2Younger Dryas temperature proxies. Compilation of published estimations for Younger Dryas MAAT at the cave sites from paleo-glacier ELA (Rea et al., 2020), the mutual climatic range of Coleoptera remains (Atkinson et al., 1987), and periglacial features (Isarin, 1997). The temperatures were adjusted to the respective cave elevation with a lapse rate of −6.5 °C km−1.
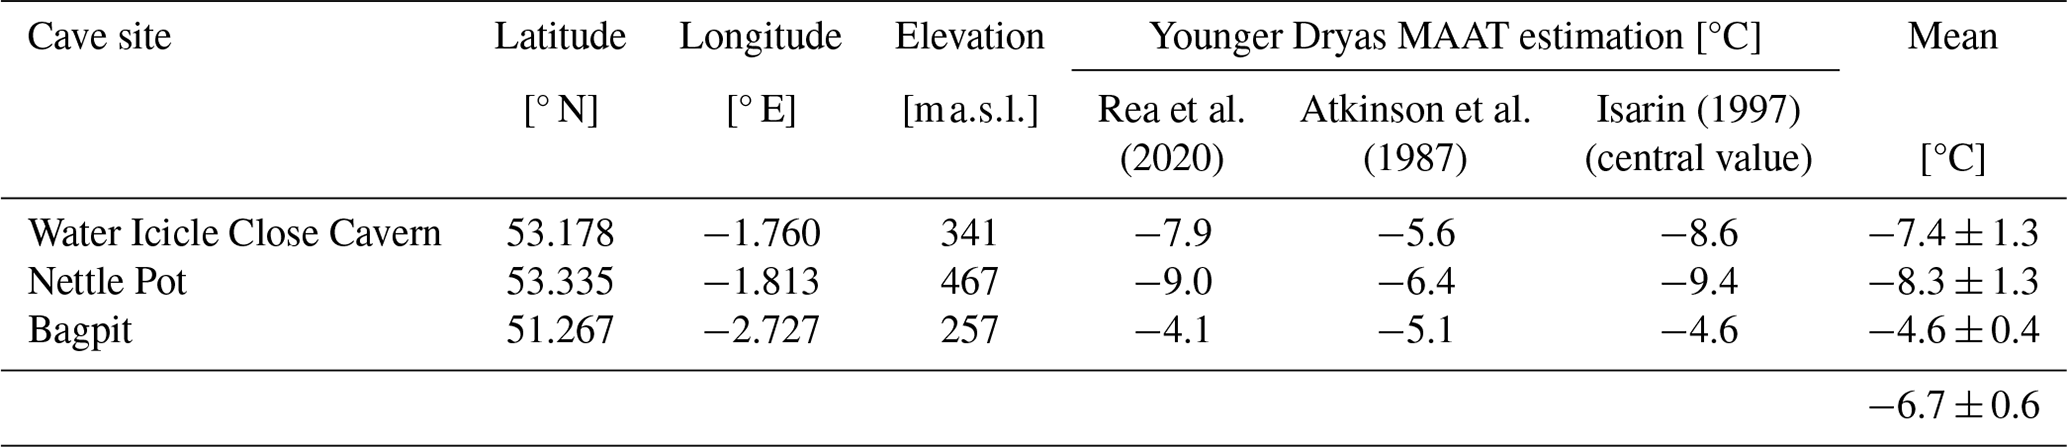
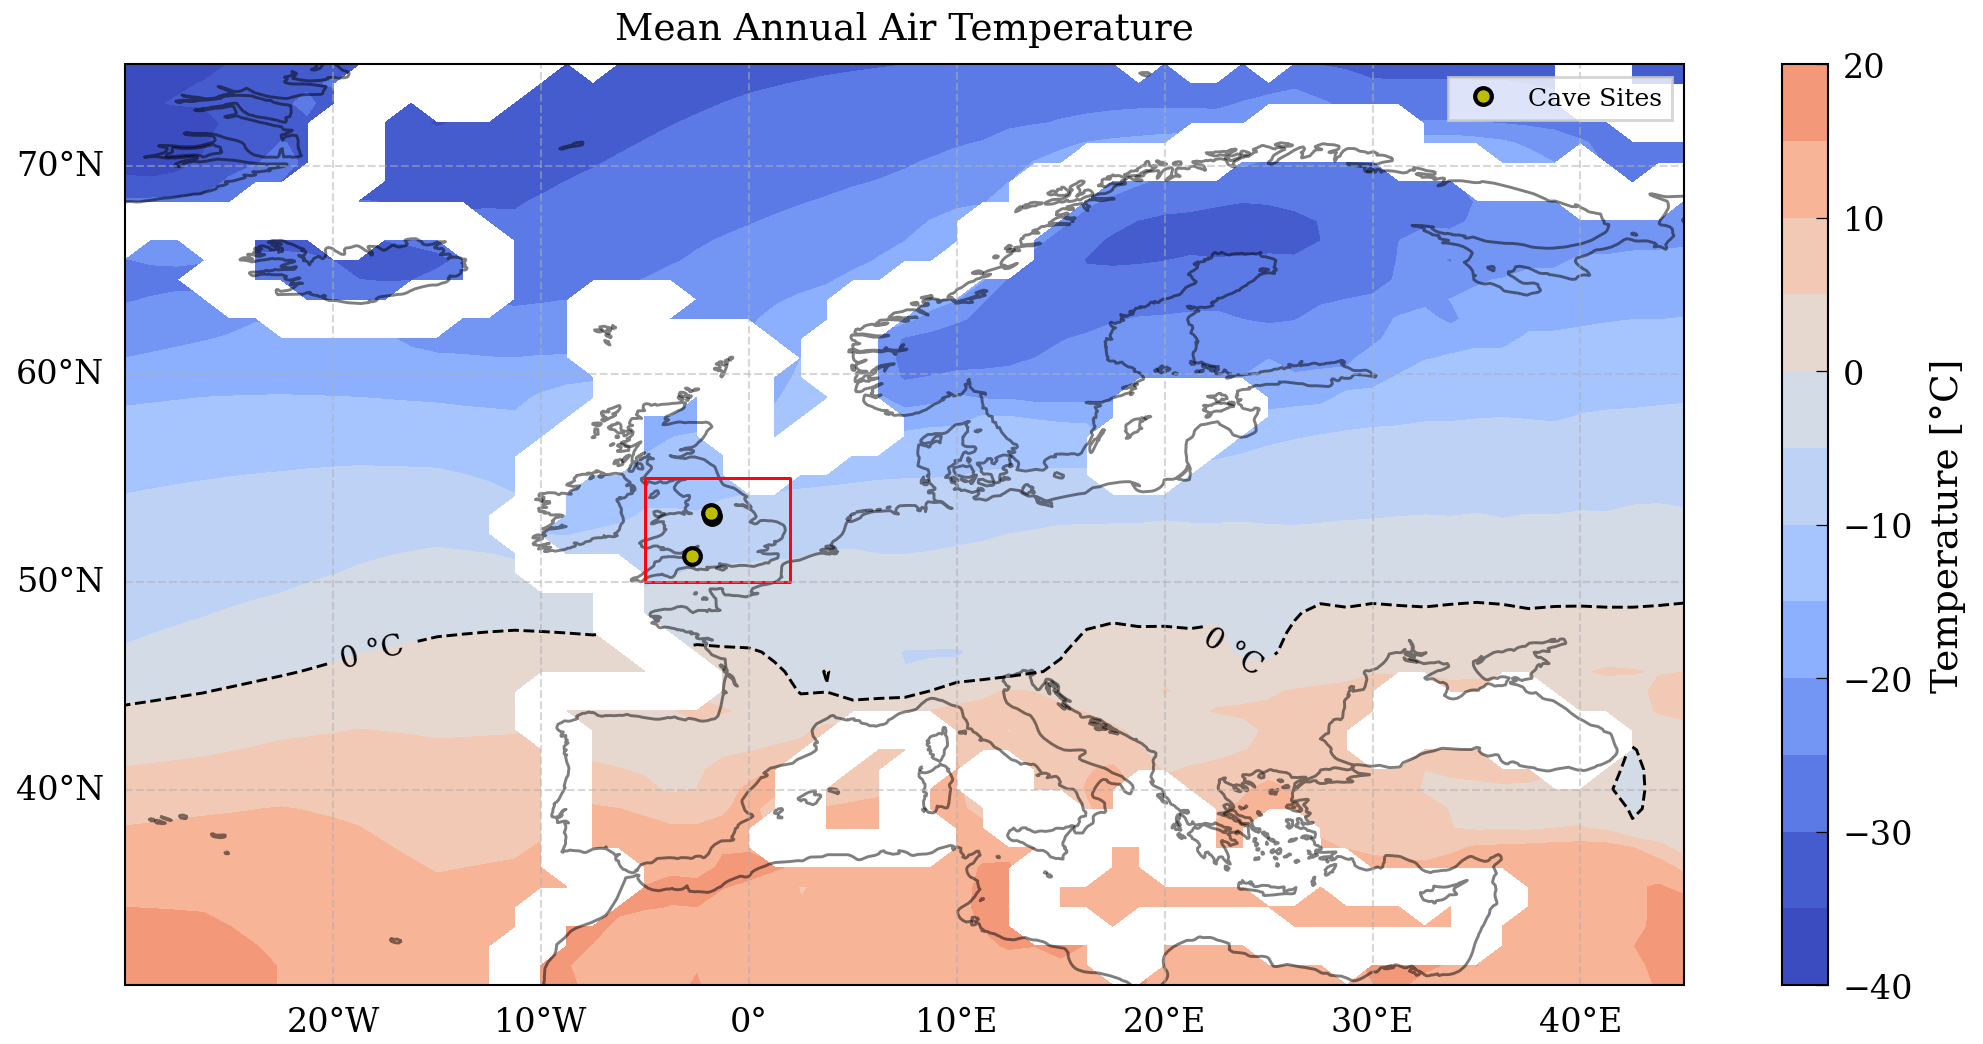
Figure 3Mean annual air temperature over Europe according to a high-resolution model simulation of the Younger Dryas (Schenk et al., 2018). The positions of cave sites in this study are depicted as yellow dots, and the red rectangle delineates the study area (50–55° N, −5–2° E).
A reconstruction based on the equilibrium line altitude (ELA) of paleo-glaciers on the British Isles found that the MAAT in the study area (50–55° N) was between 0.3 and −7.9 °C (Rea et al., 2020). A record of MAAT based on the mutual climatic range of Coleoptera (i.e. beetles) shows comparable values of −3 ± 2 °C for the Younger Dryas (Atkinson et al., 1987). Furthermore, MAAT estimates derived from periglacial features attributed to the same time period provide a temperature range of −1 to −8 °C (Isarin, 1997). After adjusting these MAAT estimates to the elevation of our cave sites by applying an environmental lapse rate of −6.5 °C km−1, we determined that the resulting averages of MAAT values at the cave sites are −7.4 ± 1.3 °C for WIC, −8.3 ± 1.3 °C for NTL and −4.6 ± 0.4 °C for BGP, giving a total average for all cave sites of −6.7 ± 0.6 °C (Table 2).
In this study, we compare CCC-derived mean annual ground temperature (MAGT) at depths of 20 to 130 m to atmospheric surface temperatures from a recent modelling study using the Community Earth System Model (CESM 1.0.5). The model was run at a higher spatial resolution than other global circulation models for the Younger Dryas period (i.e. 0.9° × 1.25° or approximately 100 km × 100 km), and the resulting surface temperatures are in good agreement with a wide range of available proxy records (Schenk et al., 2018). Figure 3 shows the modelled Younger Dryas MAAT distribution over Europe according to CESM simulations. The study region (50–55° N, −5° W–2° E; red rectangle in Fig. 3) shows a MAAT value of −7.6 ± 2.1 °C (the uncertainty refers to the 1σ spatial variability in the MAAT across the grid cells within the study area), which is in agreement with the proxy-derived MAAT for our study sites (Table 2). Modelled monthly temperature averages cover a range from −31.6 ± 3.7 °C in January to 15.5 ± 2.4 °C in July, resulting in a hypercontinental climate with extreme temperature seasonality of 47.1 ± 4.4 °C (Fig. 4).
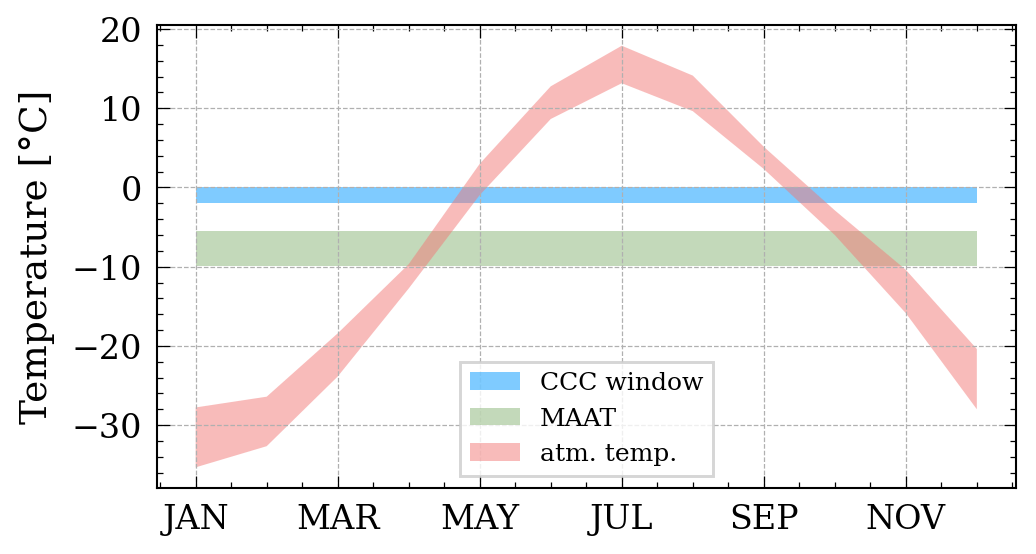
Figure 4Simulated temperature seasonality for the Younger Dryas averaged over the study area (red rectangle in Fig. 3). In the absence of insulating layers, ground temperatures below the depth of zero annual amplitude would equilibrate to the MAAT of −7.6 ± 2.1 °C, which is well below the zone of CCC formation.
Such surface temperatures are certainly cold enough to facilitate permafrost formation in the study area during the Younger Dryas. However, the modelled MAAT (−7.6 ± 2.1 °C), as well as the averaged MAAT reconstructed from proxies (−6.7 ± 0.6 °C, Table 2), is significantly colder than the CCC-derived MAGT (−1 ± 1 °C), with an offset of ΔT = 6.6 ± 2.3 °C (CESM) or ΔT = 5.7 ± 1.2 °C (proxy reconstructions), respectively. The relationship between MAAT and MAGT in permafrost is non-linear, and observed offsets are the result of multiple factors, including aspect, snow cover, vegetation, seasonality, soil moisture, and the porosity of the substrate (Murton, 2021). The TTOP model (abbreviated from temperature at the top of permafrost), as the name suggests, is widely used to predict the MAGT at the top of the permafrost layer based on MAAT (Smith and Riseborough, 2002). The effects of snow and vegetation cover are implemented in the model via semi-empirical adjustment factors. To quantify the MAAT–MAGT offset (Fig. 5), the model defines two fundamental types of temperature offset.
-
The nival offset (ΔTS) includes the insulating effects of snow cover. Since snow is a poor conductor of heat, sufficiently thick snow cover limits heat loss from the ground during winter and causes a positive offset of the MAGT from MAAT. The nival offset only has a warming effect while air temperatures are below 0 °C (i.e. when snow is not melting).
-
The thermal offset (or active layer offset; ΔTT) results from higher rates of heat conduction through ice as opposed to liquid water or air. In winter, when moisture in the soil and epikarst layer has turned to ice, heat conduction is more efficient (i.e. approximately 4 times faster) than in summer, thus creating a net cooling effect that counteracts the nival offset.
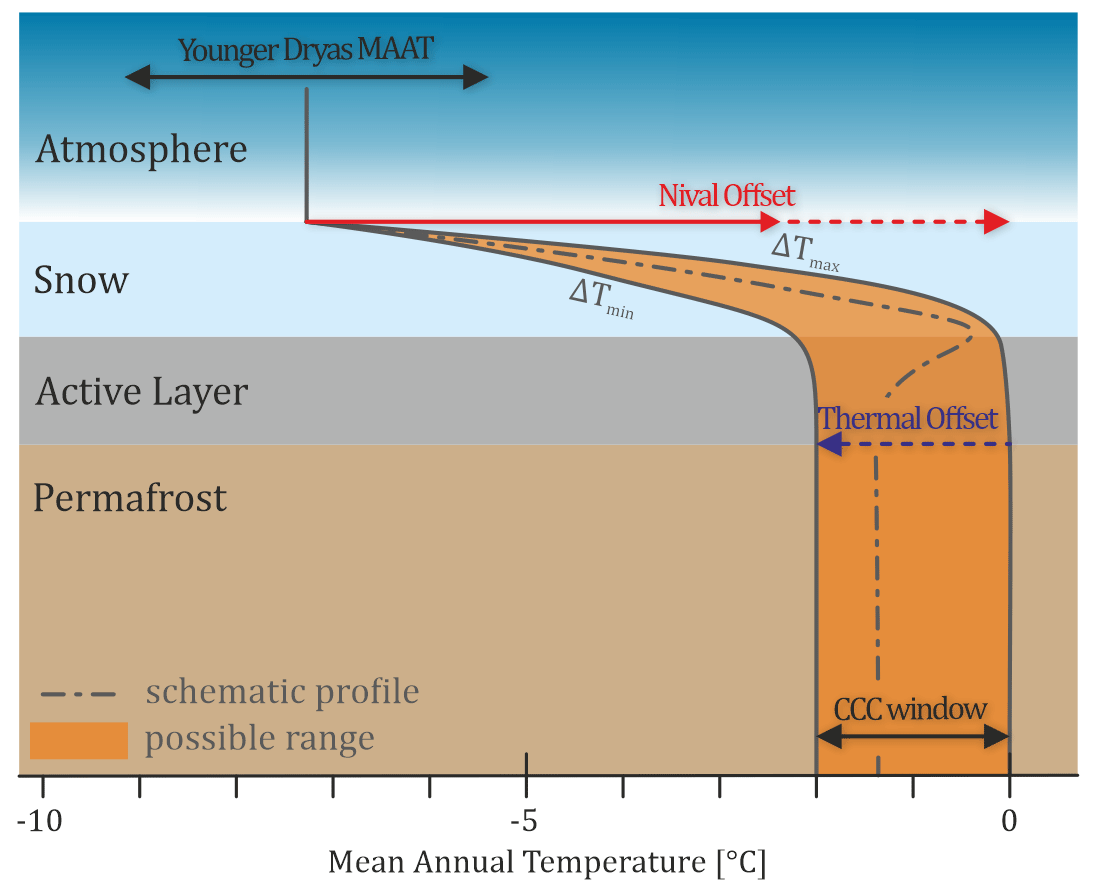
Figure 5Conceptual model of permafrost temperature in relation to MAAT and snow thickness (TTOP model), modified after Smith and Riseborough (Smith and Riseborough, 2002). Depicted values for the Younger Dryas MAAT and the CCC window for permafrost temperature are as mentioned in the main text. Solid grey lines correspond to the inferred minimum and maximum total offset values ΔTmin and ΔTmax, assuming that the thermal offset is 0. Since this assumption is unlikely, any profile (schematic example shown as dash-dotted grey line) within the limits of these endmembers is theoretically possible.
To quantify the contribution of these offsets, the TTOP model assumes equilibrium conditions.
Our CCC-derived MAGT and modelled MAAT provide quantitative constraints on the net effect of these temperature offsets. With the warming contribution of the nival offset limited to a maximum temperature of 0 °C, the maximum ΔT in the absence of a corresponding thermal offset is ΔTmax = 7.6 ± 2.1 °C. Conversely, MAGT could not have been cooled below the CCC formation window (−1 ± 1 °C), resulting in a minimum offset of ΔTmin = 5.6 ± 2.1 °C. These values are considered endmembers and delineate a range of possible temperature profiles that arise from different combinations of nival and thermal offsets but result in ΔT values within the specified range (Fig. 5).
The relatively narrow range of possible temperature profiles implies that the warming contribution of the nival offset at the study sites was much larger than the corresponding cooling attributed to the thermal offset within the active layer. A minor cooling effect via the thermal offset is consistent with situations at the study sites where either soil moisture was low because of good drainage through the underlying karst system or simply because the soil layer was not thick enough to have a significant effect. Of course, the paleo-active layer thickness at the three cave sites is unknown, though by analogy with relatively warm discontinuous permafrost today in the mountains of northern Norway, where the MAGT at 10 m depth is near 0 °C and the bedrock is relatively dry (Farbrot et al., 2013) and so the thermal offset is probably limited, it may have ranged on the order of 10 m. Either way, the observed range of ΔT points towards significant seasonal snow cover as the main cause of temperature offset in these limestone terrains of the British Isles during the Younger Dryas.
4.4 Younger Dryas snow cover and modern analogues
By combining CCC-derived MAGT and modelled temperatures, it is possible to constrain the temperature offset between permafrost and the atmosphere at the study sites during the Younger Dryas and to identify snow cover as the crucial factor. We apply two principal lines of argument to quantify the amount of snow cover that best explains the observed ΔT.
- 1.
Analytical approach.
In the original version of the TTOP model, Smith and Riseborough (2002) described the relationship between MAAT and MAGT with a set of equations employing air temperature indices and n factors to assess the contributions of the nival and thermal offsets. Re-arranging these equations, the n factor corresponding to the snow cover effect nf can be expressed as
where If is the annual air freezing index (i.e. degree days < 0 °C), which can be derived from the MAAT via an empirical relationship
Using the value we derived for ΔT = 6.6 ± 2.3 °C as input for ΔTS, Eq. (1) gives nf = 0.39 ± 0.22 as the corresponding range of n factors for the nival offset at the study sites during the Younger Dryas. This n factor relates to the mean annual snow thickness Zs according to another relationship provided by Riseborough and Smith (1998) that is depicted in Fig. 6. With the values for nf and MAAT that derive from modelling and CCCs, a mean snow thickness for the study sites during the Younger Dryas between 0.2 and 0.9 m can be reconstructed, with a nominal value of approximately 0.4 m, representing a snow water equivalent (SWE) of 148 ± 125 mm and assuming a bulk snow density of 0.27 ± 0.15 g cm−3 (Sturm et al., 2010).
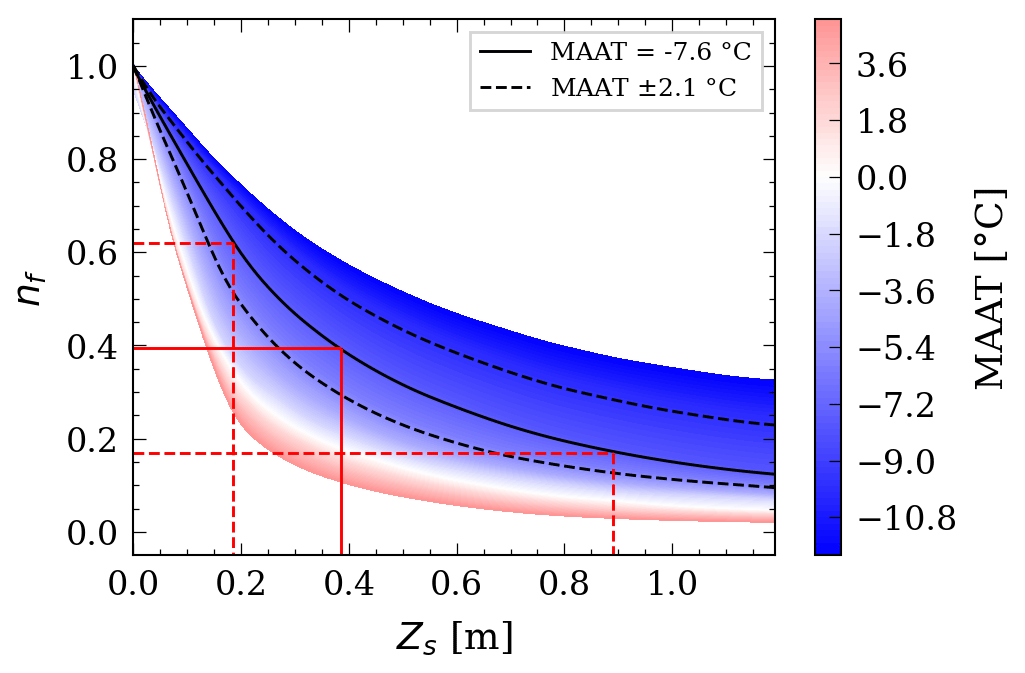
Figure 6Snow thickness reconstruction according to the analytical approach. Depicted is the relationship between snow thickness (Zs), snow cover n factor (nf), and MAAT according to Riseborough and Smith (Riseborough and Smith, 1998). The solid black line represents the modelled Younger Dryas MAAT at the studied cave sites with uncertainty boundaries shown as dashed black lines. Solid and dashed red lines represent the nf value calculated from the CCC-derived ΔT and its respective uncertainty. A mean annual snow thickness Zs between 0.2 and 0.9 m can be reconstructed, with the highest probability at approximately 0.4 m.
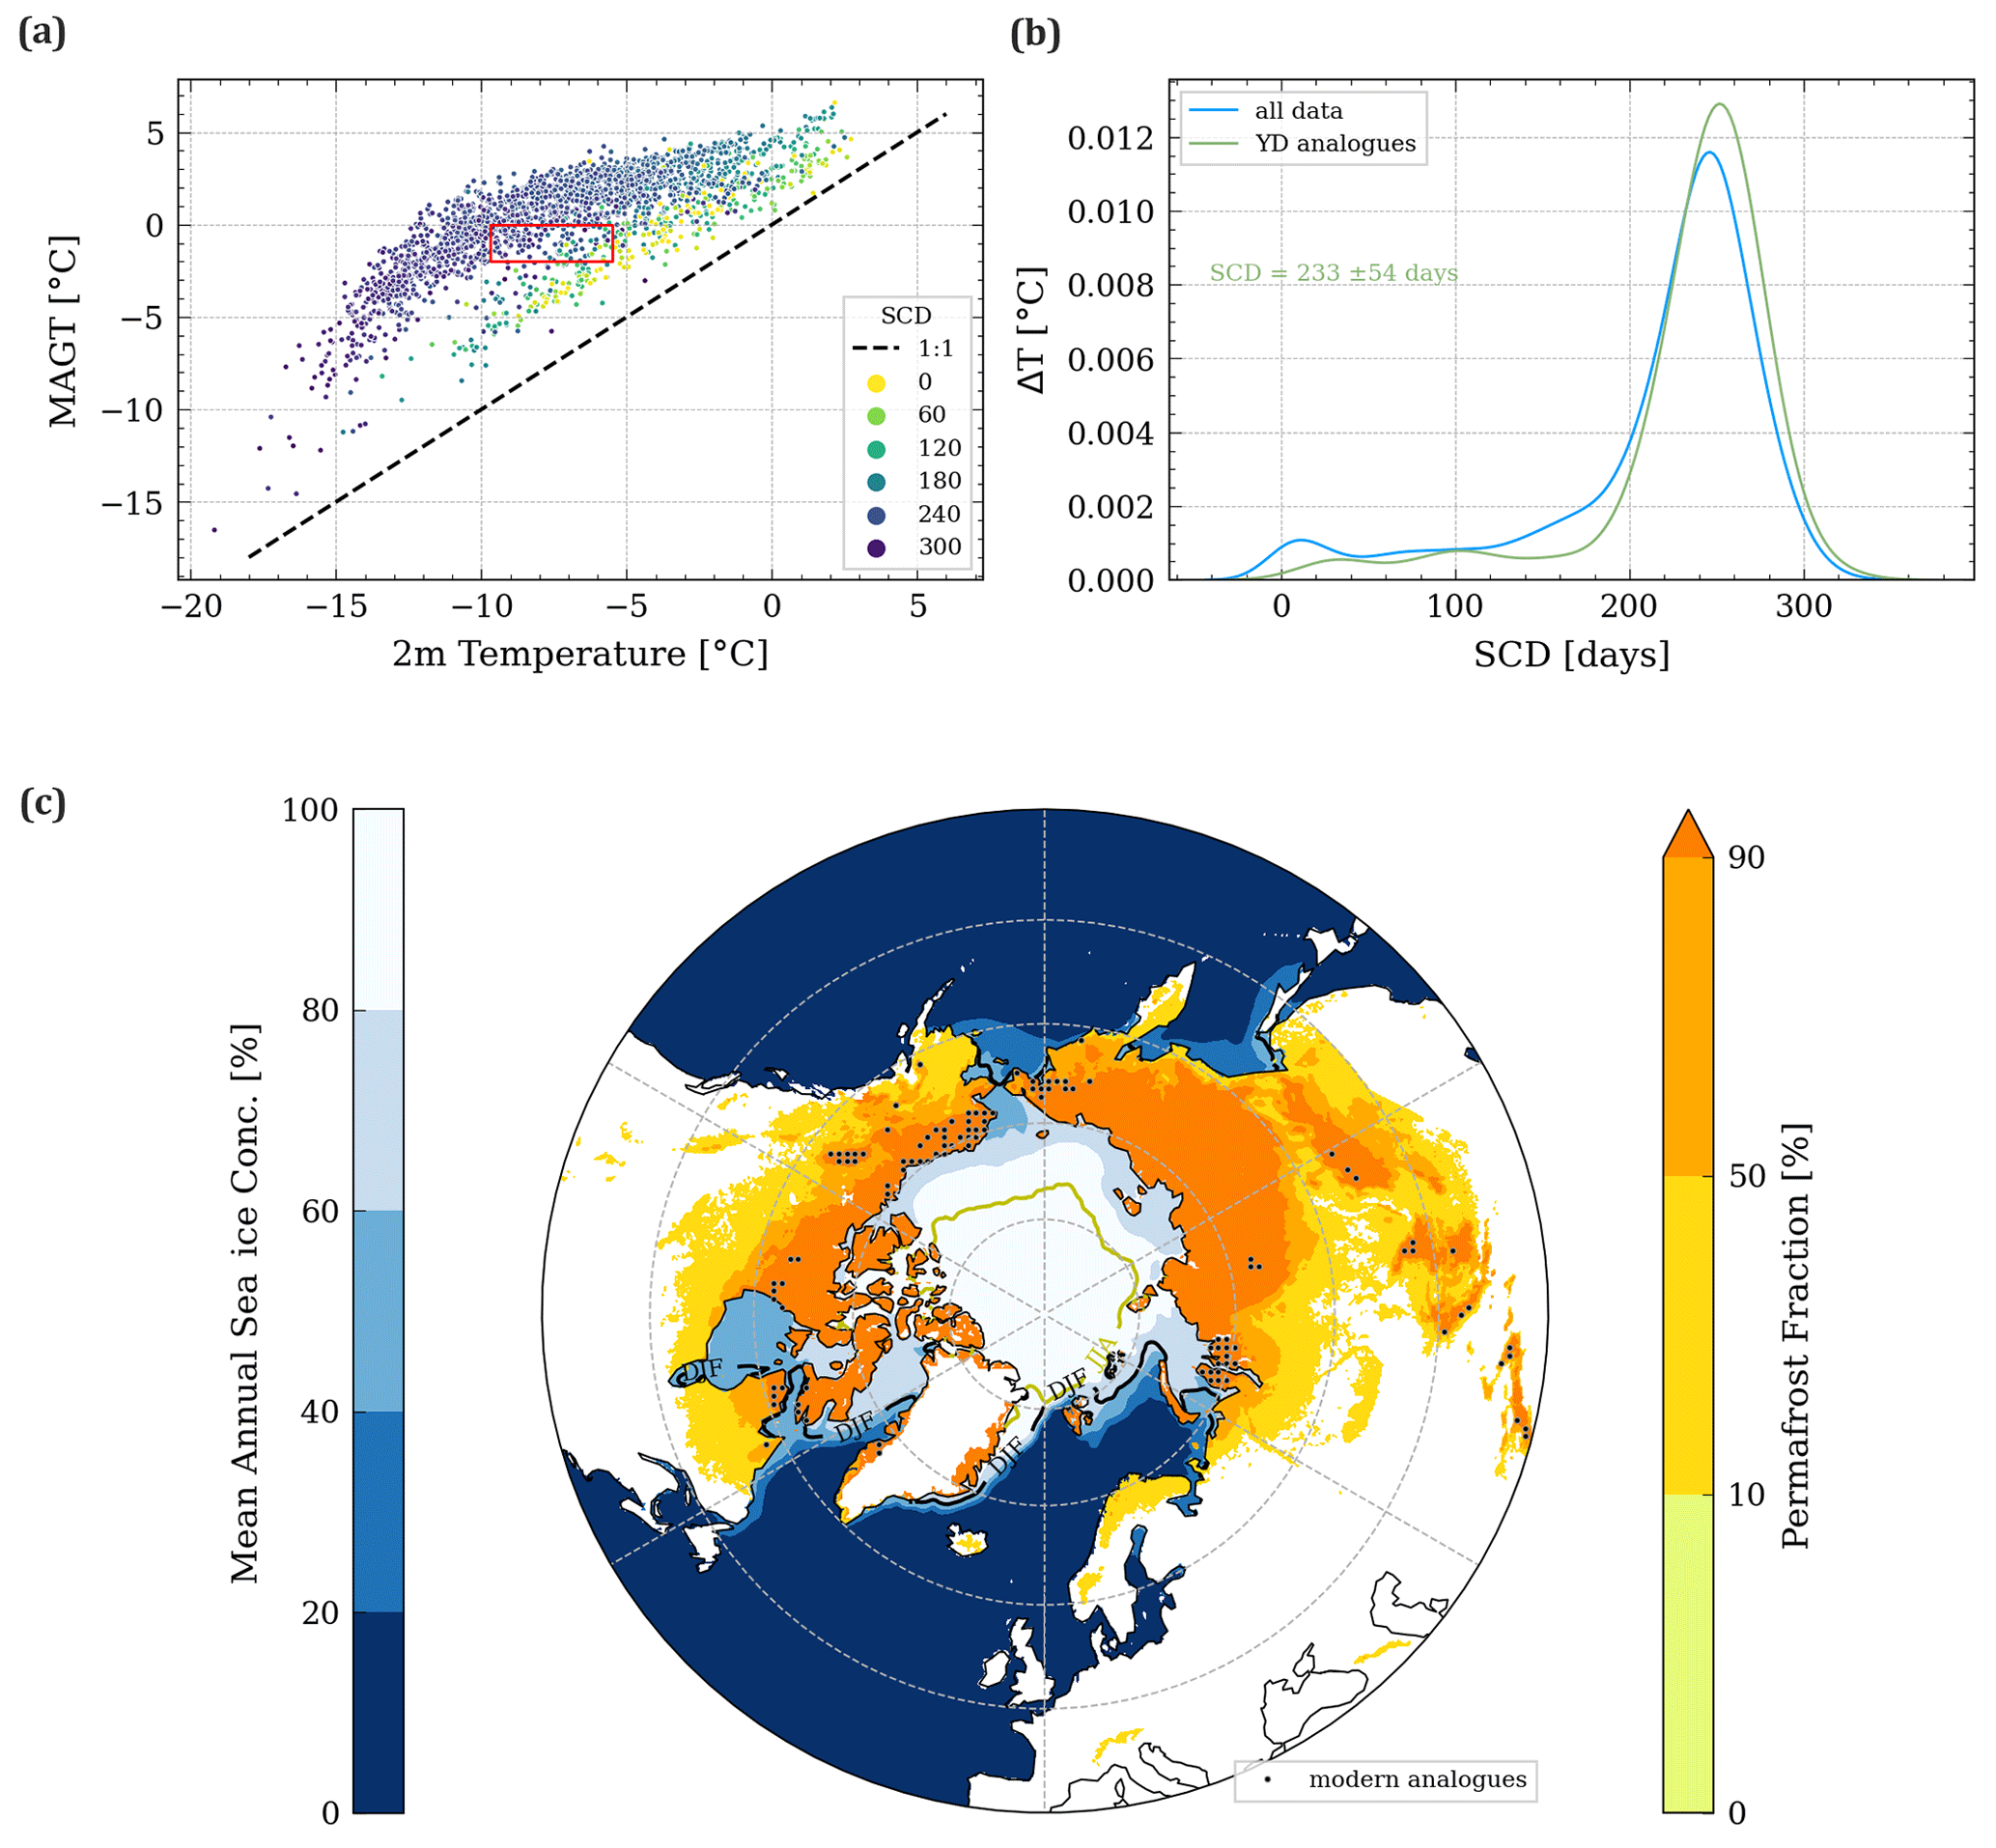
Figure 7Visualisation of the statistical approach using modern analogues. (a) Relationship between the modern-day temperature offset between MAAT at 2 m above ground surface, MAGT, and snow cover days (SCDs) from reanalysis data (ERA5 monthly from 1990 to 2020). Individual data points represent 30-year averages of a gridded subset that covers areas of the Northern Hemisphere where the permafrost fraction is larger than 10 %. The red rectangle delineates the range of values constrained by CCC-inferred MAGT and CESM simulations for the Younger Dryas in the study area. (a) Normalised kernel density estimates of SCDs of the same dataset depicted in panel (a) (i.e. all data) and the subset constrained by the CCC- and model-inferred MAAT and MAGT (i.e. YD analogues). (c) Map of modern permafrost distribution (Obu et al., 2021; data for year 2010). Blue colours show the 30-year mean sea ice concentration between 1987 and 2017 (Walsh et al., 2017). The black and yellow lines delineate the mean position of the 90 % concentration contour line during winter (December–February, DJF) and summer (June–August, JJA), respectively, of the same 30-year observation period. Black dots show the location of grid cells that fall within the CCC-derived temperature window shown in (a).
- 2.
Statistical approach using modern analogues.
We use 30-year averages for air temperature 2 m above the ground surface, MAGT, snow cover days (SCDs), and snow height from reanalysis data (ERA5 monthly from 1990 to 2020; Muñoz Sabater, 2019) to quantify the relationship between MAAT, MAGT, and snow cover in areas of the Northern Hemisphere where permafrost currently exists (Fig. 7; see Sect. 3 for a detailed explanation). From the quantitative constraints we derived from CCCs and CESM simulations (i.e. MAGT of −1 ± 1 °C and MAAT of −7.6 ± 2.1 °C; red rectangle in Fig. 7a), it is possible to identify those grid cells in our reanalysis dataset that best resemble the British Isles during the Younger Dryas with respect to surface and ground temperatures.
The geographical locations of these modern analogues can be plotted on a map as shown in Fig. 7c. They predominantly cluster at low-elevation coastal areas bordering the Arctic Ocean (e.g. Yamal Peninsula, NE Siberia, NW Alaska, and parts of the Arctic Archipelago) with some minor clusters at inner-continental mountainous areas (e.g. Mackenzie Mountains and Altai Mountains). On average, the mean annual snow cover at these locations lasts for 233 ± 54 SCDs per year, whereas the SCD distribution of this subset is very similar to the general distribution of the whole reanalysis dataset (Fig. 7b). The corresponding mean snow thickness, as recorded in the reanalysis data from 1990 to 2020, is 0.5 ± 0.2 m or 135 ± 92 mm of snow water equivalent (SWE), with the same range of bulk snow densities as used in the analytical approach.
As described earlier, our CESM simulations show extreme temperature seasonality of 47.1 ± 4.4 °C in the study area during the Younger Dryas. With respect to this metric, the reanalysis data of the modern analogue sites show similar although slightly lower values with a mean seasonal temperature range of 38.2 ± 6.7 °C. Such extremes are characteristic of regions with high continentality, even though some modern analogues are situated relatively close to the Arctic Ocean (Fig. 7c). In the context of the British Isles during the Younger Dryas, the increased continentality despite the proximity to the North Atlantic Ocean can be explained by the presence of sea ice throughout a substantial part of the year, which would have limited heat exchange between ocean and atmosphere.
The two methods used for assessing the potential range of snow thickness based on thermal parameters derived from the British CCC record are independent of each other. The results are in excellent agreement, although with substantial uncertainty that arises from Younger Dryas temperature estimates and a lack of constraints on other critical parameters such as snow density. The uncertainty does, however, fall within the range of inherent year-to-year snow thickness variability.
It needs to be explicitly stated at this point that the snow thickness estimates are not equivalent to the total winter precipitation amount, and the two should not be compared directly without applying adequate transfer functions. The validity of our snow thickness estimates may be assessed qualitatively against paleo-precipitation estimates for the Younger Dryas. Most quantitative estimates of Younger Dryas paleo-precipitation in the British Isles come from reconstructions of glacier ELAs. In Scotland, north of our study area, these reconstructions infer a steep west-to-east decline in precipitation (Ballantyne and Harris, 1994; Palmer et al., 2010). Annual precipitation from the Monadhliath ice field adjusted to the sea level equivalent gives an annual precipitation of 1211 ± 480 mm, 692 ± 360 mm of which fell as snow. Winter precipitation values from other glaciers cited in this study are between 379 ± 315 and 2066 ± 323 mm. Throughout the winter season, the snowpack is subject to compaction and erosion processes that generally reduce the overall thickness. Consequently, the mean SWE is always lower than the corresponding winter precipitation amount over the course of the accumulation season. The Younger Dryas SWE estimates we inferred are consistently lower than glacier-derived winter precipitation values from Scotland and can be regarded as valid estimates according to this logic.
4.5 Climatic context
Winter sea ice inhibits heat and moisture exchange between the ocean and atmosphere during the cold season, thus contributing to extreme winter cold, while summer temperatures and precipitation might remain largely unaffected (Singarayer et al., 2006). Numerous studies have proposed a model where the North Atlantic experienced a surge in seasonal sea ice during the Younger Dryas, which in turn caused extreme temperature seasonality over downwind land masses (e.g. Atkinson et al., 1987; Renssen and Isarin, 1997; Isarin and Renssen, 1999; Denton et al., 2005; Schenk et al., 2018). While the causal relationships are still under debate, most authors agree that the fundamental mechanism behind this surge is a weakening of AMOC and the southward migration of the sea ice margin in winter down to ∼ 45° N (Schenk et al., 2018).
At this point, the geographical location of the modern analogues we identified with our statistical approach warrants further discussion. The (coastal) modern analogues we inferred from the British CCC record border parts of the Arctic Ocean that experience seasonal sea ice cover in the modern-day climate setting (Fig. 7c). More precisely, they are situated in the vicinity of the 90 % contour line of winter (December–February, DJF) sea ice concentration and are far away from perennial sea ice.
The extreme seasonality of 47.1 ± 4.4 °C that is implied in the CESM simulations we used in our study is in agreement with the aforementioned model of a Younger Dryas sea ice surge, whereas we found that significant amounts of seasonal snow cover are necessary to reconcile the modelled air temperature with MAGT that we empirically derived from CCC deposits. The fact that the modern analogues we identified via the same approach also experience seasonal sea ice cover stresses that winter sea ice in the North Atlantic reached the study area at 50–55° N during the Younger Dryas, consistent with a simulated maximum extent down to ∼ 45° N in CESM (Schenk et al., 2018).
Empirical evidence for extensive North Atlantic sea ice during the Younger Dryas is provided by marine sediment cores (Cabedo-Sanz et al., 2013; Müller and Stein, 2014) and was also suggested on the basis of multiple terrestrial proxy records (e.g. Brauer et al., 2008; Lane et al., 2013; Baldini et al., 2015). A connection between sea ice and long-term permafrost stability has been proposed for Siberia in previous studies (Vandenberghe et al., 2012; Vaks et al., 2020) and is consistent with the British CCC record. Overall, our study supports a model of the Younger Dryas as a period of extreme seasonality dominated by severe and long-lasting winters in response to increased winter sea ice extent and amends the existing body of evidence with empirical constraints on ground temperatures and snow cover thickness and duration.
The presented record of CCCs complements the existing evidence of the Younger Dryas paleoenvironment of the British Isles and the wider North Atlantic region in several aspects. The main conclusions can be summarised as follows:
-
CCCs indicate persistent permafrost temperatures between −2 and 0 °C at the three cave sites throughout the Younger Dryas.
-
These ground temperatures were approximately 6.6 ± 2.3 °C warmer than the mean annual air temperature, suggesting a significant insulating effect of snow.
-
Snow thickness between 0.2 and 0.9 m persisted for around 8 months per year (233 ± 54 d), demonstrating the critical role of snow cover in modulating ground temperatures.
-
The temperature offset between permafrost and atmosphere, as well as the snow cover parameters we inferred for the study area during the Younger Dryas, are comparable to modern regions, with continuous to discontinuous permafrost near parts of the Arctic Ocean experiencing extensive winter sea ice cover (e.g. Yamal Peninsula, NE Siberia, NW Alaska, and parts of the Arctic Archipelago). These regions, which are also characterised by extreme seasonality in surface temperature, can be considered modern analogues for the paleoenvironment of the British Isles during the Younger Dryas. The severity and length of the inferred winter climate is consistent with a winter sea ice extent down to ∼ 45° N that inhibits any ocean to atmosphere heat fluxes around the British Isles throughout large parts of the year.
All raw data necessary to replicate the results presented in this study are provided in Tables 1 and 2, the Supplement (Table S1), or are available via the cited sources (https://doi.org/10.5285/6e2091cb0c8b4106921b63cd5357c97c, Obu et al., 2021; https://doi.org/10.24381/cds.68d2bb30, Muñoz Sabater, 2019; Schenk et al., 2018). The code used for the various calculations is available upon request from the corresponding author.
The supplement related to this article is available online at: https://doi.org/10.5194/cp-20-1521-2024-supplement.
PT and GEM designed the study, conducted fieldwork, and performed laboratory analyses. PT and AB conducted data post-processing analyses. FS designed and ran the CESM 1.0.5 climate simulations and, together with JBM, was involved in data analyses and data–model integration. PT wrote the initial draft, and all co-authors were involved with supervision and editing of the article.
The contact author has declared that none of the authors has any competing interests.
Publisher's note: Copernicus Publications remains neutral with regard to jurisdictional claims made in the text, published maps, institutional affiliations, or any other geographical representation in this paper. While Copernicus Publications makes every effort to include appropriate place names, the final responsibility lies with the authors.
The authors thank Xianglei Li, Dylan Parmenter, and Peter Schroedl for assistance with analyses, as well as Lena Friedrich for additional stable isotope analyses. The help of Alison Moody, John Gunn, Alan Brentnall, Rob Eavis, Andy Freem, and Robbie Shone with cave access, guiding, additional fieldwork, surveying, and discovering CCC sites is greatly appreciated. Our sincere gratitude is extended to Natural England and the trustees of the Devonshire Maintenance Fund for permission to conduct fieldwork and collect samples. We also thank Sina Longman for providing us with access to her extensive database of speleothem ages from the British Isles, which pleasantly streamlined the literature review process.
This research has been funded in whole or in part by the Austrian Science Fund (FWF) (grant DOI https://doi.org/10.55776/Y1162, project no. Y 1162). For open-access purposes, the author has applied a CC BY public copyright license to any author-accepted manuscript version arising from this submission. Frederik Schenk has received funding from the Swedish Research Council for Sustainable Development (FORMAS; grant nos. 2020-01000 and 2023-01631). The simulations with CESM1.0.5 were enabled by resources provided by the National Academic Infrastructure for Supercomputing in Sweden (NAISS) and the Swedish National Infrastructure for Computing (SNIC) at Linköping University, Sweden, and partially funded by the Swedish Research Council (grant nos. 2022-06725 and 2018-05973).
This paper was edited by Dominik Fleitmann and reviewed by two anonymous referees.
Atkinson, T. C., Harmon, R. S., Smart, P. L., and Waltham, A. C.: Palaeoclimatic and geomorphic implications of dates on speleothems from Britain, Nature, 272, 24–28, https://doi.org/10.1038/272024a0, 1978.
Atkinson, T. C., Lawson, T. J., Smart, P. L., Harmon, R. S., and Hess, J. W.: New data on speleothem deposition and palaeoclimate in Britain over the last forty thousand years, J. Quaternary Sci., 1, 67–72, https://doi.org/10.1002/jqs.3390010108, 1986.
Atkinson, T. C., Briffa, K. R., and Coope, G. R.: Seasonal temperatures in Britain during the past 22,000 years, reconstructed using beetle remains, Nature, 325, 587–592, https://doi.org/10.1038/325587a0, 1987.
Austrian Science Fund (FWF): Northeast Greenland Speleothem Project, https://doi.org/10.55776/Y1162, 2019.
Baker, A., Smart, P. L., and Edwards, R. L.: Mass spectrometric dating of flowstones from Stump Cross Caverns and Lancaster Hole, Yorkshire: palaeoclimate implications, J. Quaternary Sci., 11, 107–114, https://doi.org/10.1002/(SICI)1099-1417(199603/04)11:2<107:AID-JQS236>3.0.CO;2-E, 1996.
Bakke, J., Lie, Ø., Heegaard, E., Dokken, T., Haug, G. H., Birks, H. H., Dulski, P., and Nilsen, T.: Rapid oceanic and atmospheric changes during the Younger Dryas cold period, Nat. Geosci., 2, 202–205, https://doi.org/10.1038/ngeo439, 2009.
Baldini, L. M., McDermott, F., Baldini, J. U. L., Arias, P., Cueto, M., Fairchild, I. J., Hoffmann, D. L., Mattey, D. P., Müller, W., Nita, D. C., Ontañón, R., Garciá-Moncó, C., and Richards, D. A.: Regional temperature, atmospheric circulation, and sea-ice variability within the Younger Dryas Event constrained using a speleothem from northern Iberia, Earth Planet. Sc. Lett., 419, 101–110, https://doi.org/10.1016/j.epsl.2015.03.015, 2015.
Ballantyne, C. K.: Glacially moulded landslide runout debris in the Scottish Highlands, Scot. Geogr. J., 134, 224–236, https://doi.org/10.1080/14702541.2018.1501085, 2018a.
Ballantyne, C. K.: Periglacial geomorphology, Wiley Blackwell, Hoboken, NJ, 454 pp., ISBN 9781405100069, 2018b.
Ballantyne, C. K. and Harris, C.: The periglaciation of Great Britain, Cambridge University Press, Cambridge, 340 pp., ISBN 978-0-521-32459-5, 1994.
Bartolomé, M., Sancho, C., Osácar, M. C., Moreno, A., Leunda, M., Spötl, C., Luetscher, M., López-Martínez, J., and Belmonte, A.: Characteristics of cryogenic carbonates in a Pyrenean ice cave (northern Spain), Geogaceta, 58, 107–110, 2015.
Biller-Celander, N., Shakun, J. D., McGee, D., Wong, C. I., Reyes, A. V., Hardt, B., Tal, I., Ford, D. C., and Lauriol, B.: Increasing Pleistocene permafrost persistence and carbon cycle conundrums inferred from Canadian speleothems, Science Advances, 7, eabe5799, https://doi.org/10.1126/sciadv.abe5799, 2021.
Blockley, S. and Gamble, C.: Europe in the Younger Dryas: Animal Resources, Settlement and Funerary Behaviour, in: Hunter-gatherer behavior: Human response during the Younger Dryas, edited by: Eren, M. I., Routledge, London, New York, 179–194, ISBN 9781315427133, 2016.
Brauer, A., Haug, G. H., Dulski, P., Sigman, D. M., and Negendank, J. F. W.: An abrupt wind shift in western Europe at the onset of the Younger Dryas cold period, Nat. Geosci., 1, 520–523, https://doi.org/10.1038/ngeo263, 2008.
Broecker, W. S.: Was the Younger Dryas Triggered by a Flood?, Science, 312, 1146–1148, https://doi.org/10.1126/science.1123253, 2006.
Bromley, G., Putnam, A., Borns, H., Lowell, T., Sandford, T., and Barrell, D.: Interstadial Rise and Younger Dryas Demise of Scotland's Last Ice Fields, Paleoceanography and Paleoclimatology, 33, 412–429, https://doi.org/10.1002/2018PA003341, 2018.
Bromley, G., Putnam, A., Hall, B., Rademaker, K., Thomas, H., Balter-Kennedy, A., Barker, S., and Rice, D.: Lateglacial shifts in seasonality reconcile conflicting North Atlantic temperature signals, J. Geophys. Res.-Earth, 128, e2022JF006951, https://doi.org/10.1029/2022JF006951, 2023.
Bromley, G. R. M., Putnam, A. E., Rademaker, K. M., Lowell, T. V., Schaefer, J. M., Hall, B., Winckler, G., Birkel, S. D., and Borns, H. W.: Younger Dryas deglaciation of Scotland driven by warming summers, P. Natl. Acad. Sci. USA, 111, 6215–6219, https://doi.org/10.1073/pnas.1321122111, 2014.
Brooks, S. J. and Langdon, P. G.: Summer temperature gradients in northwest Europe during the Lateglacial to early Holocene transition (15–8 ka BP) inferred from chironomid assemblages, Quatern. Int., 341, 80–90, https://doi.org/10.1016/j.quaint.2014.01.034, 2014.
Cabedo-Sanz, P., Belt, S. T., Knies, J., and Husum, K.: Identification of contrasting seasonal sea ice conditions during the Younger Dryas, Quaternary Sci. Rev., 79, 74–86, https://doi.org/10.1016/j.quascirev.2012.10.028, 2013.
Carlson, A. E.: Paleoclimate – The Younger Dryas Climate Event, in: Encyclopedia of Quaternary Science, Elsevier, 126–134, https://doi.org/10.1016/b978-0-444-53643-3.00029-7, 2013.
Cheng, H., Edwards, R. L., Shen, C.-C., Polyak, V. J., Asmerom, Y., Woodhead, J., Hellstrom, J., Wang, Y., Kong, X., Spötl, C., Wang, X., and Calvin Alexander, E.: Improvements in 230Th dating, 230Th and 234U half-life values, and U–Th isotopic measurements by multi-collector inductively coupled plasma mass spectrometry, Earth Planet. Sc. Lett., 371–372, 82–91, https://doi.org/10.1016/j.epsl.2013.04.006, 2013.
Cheng, H., Zhang, H., Spötl, C., Baker, J. L., Sinha, A., Li, H., Bartolomé, M., Moreno, A., Kathayat, G., Zhao, J., Dong, X., Li, Y., Ning, Y., Jia, X., Zong, B., Ait Brahim, Y., Pérez-Mejías, C., Cai, Y., Novello, V. F., Cruz, F. W., Severinghaus, J. P., An, Z., and Edwards, R. L.: Timing and structure of the Younger Dryas event and its underlying climate dynamics, P. Natl. Acad. Sci. USA, 117, 23408–23417, https://doi.org/10.1073/pnas.2007869117, 2020.
Cronin, T. M.: Rapid sea-level rise, Quaternary Sci. Rev., 56, 11–30, https://doi.org/10.1016/j.quascirev.2012.08.021, 2012.
Denton, G., Alley, R., Comer, G., and Broecker, W.: The role of seasonality in abrupt climate change, Quaternary Sci. Rev., 24, 1159–1182, https://doi.org/10.1016/j.quascirev.2004.12.002, 2005.
Dublyansky, Y., Moseley, G. E., Lyakhnitsky, Y., Cheng, H., Edwards, R. L., Scholz, D., Koltai, G., and Spötl, C.: Late Palaeolithic cave art and permafrost in the Southern Ural, Sci. Rep.-UK, 8, 12080, https://doi.org/10.1038/s41598-018-30049-w, 2018.
Edwards, R. L., Chen, J. H., and Wasserburg, G. J.: 238U–234U–230Th–232Th systematics and the precise measurement of time over the past 500,000 years, Earth Planet. Sc. Lett., 81, 175–192, https://doi.org/10.1016/0012-821X(87)90154-3, 1987.
Fankhauser, A., McDermott, F., and Fleitmann, D.: Episodic speleothem deposition tracks the terrestrial impact of millennial-scale last glacial climate variability in SW Ireland, Quaternary Sci. Rev., 152, 104–117, https://doi.org/10.1016/j.quascirev.2016.09.019, 2016.
Farbrot, H., Isaksen, K., Etzelmüller, B., and Gisnås, K.: Ground Thermal Regime and Permafrost Distribution under a Changing Climate in Northern Norway, Permafrost Periglac., 24, 20–38, https://doi.org/10.1002/ppp.1763, 2013.
Firestone, R. B., West, A., Kennett, J. P., Becker, L., Bunch, T. E., Revay, Z. S., Schultz, P. H., Belgya, T., Kennett, D. J., Erlandson, J. M., Dickenson, O. J., Goodyear, A. C., Harris, R. S., Howard, G. A., Kloosterman, J. B., Lechler, P., Mayewski, P. A., Montgomery, J., Poreda, R., Darrah, T., Hee, S. S. Q., Smith, A. R., Stich, A., Topping, W., Wittke, J. H., and Wolbach, W. S.: Evidence for an extraterrestrial impact 12,900 years ago that contributed to the megafaunal extinctions and the Younger Dryas cooling, P. Natl. Acad. Sci. USA, 104, 16016–16021, https://doi.org/10.1073/pnas.0706977104, 2007.
French, H. M.: Past and present permafrost as an indicator of climate change, Polar Res., 18, 269–274, https://doi.org/10.3402/polar.v18i2.6584, 1999.
French, H. M.: The Periglacial Environment, 4th edn., John Wiley & Sons, Inc, Chichester, UK, ISBN 978-1-119-13278-3, 2017.
Gascoyne, M., Ford, D. C., and Schwarcz, H. P.: Rates of cave and landform development in the Yorkshire Dales from speleothem age data, Earth Surf. Proc. Land., 8, 557–568, https://doi.org/10.1002/esp.3290080607, 1983.
Gisnås, K., Etzelmüller, B., Farbrot, H., Schuler, T. V., and Westermann, S.: CryoGRID 1.0: Permafrost Distribution in Norway estimated by a Spatial Numerical Model, Permafrost Periglac., 24, 2–19, https://doi.org/10.1002/ppp.1765, 2013.
Golledge, N. R.: Glaciation of Scotland during the Younger Dryas stadial: a review, J. Quaternary Sci., 25, 550–566, https://doi.org/10.1002/jqs.1319, 2010.
Golledge, N. R., Fabel, D., Everest, J. D., Freeman, S., and Binnie, S.: First cosmogenic 10Be age constraint on the timing of Younger Dryas glaciation and ice cap thickness, western Scottish Highlands, J. Quaternary Sci., 22, 785–791, https://doi.org/10.1002/jqs.1113, 2007.
Gunn, J., Fairchild, I. J., Moseley, G. E., Töchterle, P., Ashley, K. E., Hellstrom, J., and Edwards, R. L.: Palaeoenvironments in the central White Peak District (Derbyshire, UK): evidence from Water Icicle Close Cavern, Cave Karst Sci., 47, 153–168, 2020.
Heiri, O., Brooks, S. J., Renssen, H., Bedford, A., Hazekamp, M., Ilyashuk, B., Jeffers, E. S., Lang, B., Kirilova, E., Kuiper, S., Millet, L., Samartin, S., Toth, M., Verbruggen, F., Watson, J. E., van Asch, N., Lammertsma, E., Amon, L., Birks, H. H., Birks, H. J. B., Mortensen, M. F., Hoek, W. Z., Magyari, E., Muñoz Sobrino, C., Seppä, H., Tinner, W., Tonkov, S., Veski, S., and Lotter, A. F.: Validation of climate model-inferred regional temperature change for late-glacial Europe, Nat. Commun., 5, 4914, https://doi.org/10.1038/ncomms5914., 2014.
Isarin, R. F. B.: Permafrost Distribution and Temperatures in Europe During the Younger Dryas, Permafrost Periglac., 8, 313–333, https://doi.org/10.1002/(SICI)1099-1530(199709)8:3<313:AID-PPP255>3.0.CO;2-E, 1997.
Isarin, R. F. B. and Renssen, H.: Reconstructing and modelling Late Weichselian climates: the Younger Dryas in Europe as a case study, Earth-Sci. Rev., 48, 1–38, https://doi.org/10.1016/S0012-8252(99)00047-1, 1999.
Israde-Alcántara, I., Bischoff, J. L., Domínguez-Vázquez, G., Li, H.-C., DeCarli, P. S., Bunch, T. E., Wittke, J. H., Weaver, J. C., Firestone, R. B., West, A., Kennett, J. P., Mercer, C., Xie, S., Richman, E. K., Kinzie, C. R., and Wolbach, W. S.: Evidence from central Mexico supporting the Younger Dryas extraterrestrial impact hypothesis, P. Natl. Acad. Sci. USA, 109, E738-47, https://doi.org/10.1073/pnas.1110614109, 2012.
Jaffey, A. H., Flynn, K. F., Glendenin, L. E., Bentley, W. C., and Essling, A. M.: Precision Measurement of Half-Lives and Specific Activities of 235U and 238U, Phys. Rev. C, 4, 1889–1906, https://doi.org/10.1103/PhysRevC.4.1889, 1971.
Jones, R. L., O'Brien, C. E., and Coope, G. R.: Palaeoenvironmental reconstruction of the Younger Dryas in Jersey, UK Channel Islands, based on plant and insect fossils, P. Geologist. Assoc., 115, 43–53, https://doi.org/10.1016/S0016-7878(04)80033-6, 2004.
Koltai, G., Spötl, C., Jarosch, A. H., and Cheng, H.: Cryogenic cave carbonates in the Dolomites (northern Italy): insights into Younger Dryas cooling and seasonal precipitation, Clim. Past, 17, 775–789, https://doi.org/10.5194/cp-17-775-2021, 2021.
Lane, C. S., Brauer, A., Blockley, S. P. E., and Dulski, P.: Volcanic ash reveals time-transgressive abrupt climate change during the Younger Dryas, Geology, 41, 1251–1254, https://doi.org/10.1130/G34867.1, 2013.
LeRoux, L. J. and Glendenin, L. E.: Half-life of thorium-232, in: Proc. Natl. Conf. Nuclear Energy, Application of Isotopes and Radiation, Pretoria, South Africa, 5–8 April 1963, 83–94, 1963.
Lincoln, P. C., Matthews, I. P., Palmer, A. P., Blockley, S. P. E., Staff, R. A., and Candy, I.: Hydroclimatic changes in the British Isles through the Last-Glacial-Interglacial Transition: Multiproxy reconstructions from the Vale of Pickering, NE England, Quaternary Sci. Rev., 249, 106630, https://doi.org/10.1016/j.quascirev.2020.106630, 2020.
Luetscher, M., Borreguero, M., Moseley, G. E., Spötl, C., and Edwards, R. L.: Alpine permafrost thawing during the Medieval Warm Period identified from cryogenic cave carbonates, The Cryosphere, 7, 1073–1081, https://doi.org/10.5194/tc-7-1073-2013, 2013.
McDermott, F., Frisia, S., Huang, Y., Longinelli, A., Spiro, B., Heaton, T. H. E., Hawkesworth, C. J., Borsato, A., Keppens, E., Fairchild, I. J., van der Borg, K., Verheyden, S., and Selmo, E.: Holocene climate variability in Europe: Evidence from δ18O, textural and extension-rate variations in three speleothems, Quaternary Sci. Rev., 18, 1021–1038, https://doi.org/10.1016/S0277-3791(98)00107-3, 1999.
Müller, J. and Stein, R.: High-resolution record of late glacial and deglacial sea ice changes in Fram Strait corroborates ice–ocean interactions during abrupt climate shifts, Earth Planet. Sc. Lett., 403, 446–455, https://doi.org/10.1016/j.epsl.2014.07.016, 2014.
Muñoz Sabater, J.: ERA5-Land monthly averaged data from 1950 to present, Copernicus Climate Change Service (C3S) Climate Data Store (CDS) [data set], https://doi.org/10.24381/cds.68d2bb30, 2019.
Munroe, J., Kimble, K., Spötl, C., Marks, G. S., McGee, D., and Herron, D.: Cryogenic cave carbonate and implications for thawing permafrost at Winter Wonderland Cave, Utah, USA, Sci. Rep., 11, 6430, https://doi.org/10.1038/s41598-021-85658-9, 2021.
Murton, J. B.: Permafrost and climate change, in: Climate Change, edited by: Letcher, T. M., Elsevier, 281–326, https://doi.org/10.1016/B978-0-12-821575-3.00014-1, 2021.
Murton, J. B., Bateman, M. D., Dallimore, S. R., Teller, J. T., and Yang, Z.: Identification of Younger Dryas outburst flood path from Lake Agassiz to the Arctic Ocean, Nature, 464, 740–743, https://doi.org/10.1038/nature08954, 2010.
Murton, J. B. and Ballantyne, C. K.: Periglacial and permafrost ground models for Great Britain, in: Engineering Geology and Geomorphology of Glaciated and Periglaciated Terrains – Engineering Group Working Party Report, edited by: Griffiths, J. S. and Martin, C. J., Geological Society, London, Engineering Geology Special Publications, 28, 501–597, https://doi.org/10.1144/EGSP28.5, 2017.
Obu, J., Westermann, S., Barboux, C., Bartsch, A., Delaloye, R., Grosse, G., Heim, B., Hugelius, G., Irrgang, A., Kääb, A. M., Kroisleitner, C., Matthes, H., Nitze, I., Pellet, C., Seifert, F. M., Strozzi, T., Wegmüller, U., Wieczorek, M., and Wiesmann, A.: ESA Permafrost Climate Change Initiative (Permafrost_cci): Permafrost extent for the Northern Hemisphere, v3.0, NERC EDS Centre for Environmental Data Analysis [data set], https://doi.org/10.5285/6e2091cb0c8b4106921b63cd5357c97c, 2021.
Orvošová, M., Deininger, M., and Milovský, R.: Permafrost occurrence during the Last Permafrost Maximum in the Western Carpathian Mountains of Slovakia as inferred from cryogenic cave carbonate, Boreas, 43, 750–758, https://doi.org/10.1111/bor.12042, 2014.
Palmer, A. P., Rose, J., Lowe, J. J., and MacLeod, A.: Annually resolved events of Younger Dryas glaciation in Lochaber (Glen Roy and Glen Spean), western Scottish Highlands, J. Quaternary Sci., 25, 581–596, https://doi.org/10.1002/jqs.1370, 2010.
Putnam, A. E., Bromley, G. R. M., Rademaker, K., and Schaefer, J. M.: In situ 10Be production-rate calibration from a 14C-dated late-glacial moraine belt in Rannoch Moor, central Scottish Highlands, Quat. Geochronol., 50, 109–125, https://doi.org/10.1016/j.quageo.2018.11.006, 2019.
Rasmussen, S. O., Bigler, M., Blockley, S. P. E., Blunier, T., Buchardt, S. L., Clausen, H. B., Cvijanovic, I., Dahl-Jensen, D., Johnsen, S. J., Fischer, H., Gkinis, V., Guillevic, M., Hoek, W. Z., Lowe, J. J., Pedro, J. B., Popp, T., Seierstad, I. K., Steffensen, J. P., Svensson, A. M., Vallelonga, P., Vinther, B. M., Walker, M. J. C., Wheatley, J. J., and Winstrup, M.: A stratigraphic framework for abrupt climatic changes during the Last Glacial period based on three synchronized Greenland ice-core records: Refining and extending the INTIMATE event stratigraphy, Quaternary Sci. Rev., 106, 14–28, https://doi.org/10.1016/j.quascirev.2014.09.007, 2014.
Rea, B. R., Pellitero, R., Spagnolo, M., Hughes, P., Ivy-Ochs, S., Renssen, H., Ribolini, A., Bakke, J., Lukas, S., and Braithwaite, R. J.: Atmospheric circulation over Europe during the Younger Dryas, Science Advances, 6, eaba4844, https://doi.org/10.1126/sciadv.aba4844, 2020.
Reeves, J. M., Barrows, T. T., Cohen, T. J., Kiem, A. S., Bostock, H. C., Fitzsimmons, K. E., Jansen, J. D., Kemp, J., Krause, C., Petherick, L., and Phipps, S. J.: Climate variability over the last 35,000 years recorded in marine and terrestrial archives in the Australian region: an OZ-INTIMATE compilation, Quaternary Sci. Rev., 74, 21–34, https://doi.org/10.1016/j.quascirev.2013.01.001, 2013.
Renssen, H. and Isarin, R. F. B.: Surface temperature in NW Europe during the Younger Dryas: AGCM simulation compared with temperature reconstructions, Clim. Dynam., 14, 33–44, https://doi.org/10.1007/s003820050206, 1997.
Renssen, H., Mairesse, A., Goosse, H., Mathiot, P., Heiri, O., Roche, D. M., Nisancioglu, K. H., and Valdes, P. J.: Multiple causes of the Younger Dryas cold period, Nat. Geosci., 8, 946–949, https://doi.org/10.1038/ngeo2557, 2015.
Riseborough, D. W. and Smith, M. W.: Exploring the limits of permafrost, in: Permafrost: Seventh International Conference: Proceedings, edited by: Lewkowicz, A. G. and Allard, M., Collection Nordicana No 55, Yellowknife, Canada, 23–27 June 1998, 935–942, 1998.
Schenk, F., Väliranta, M., Muschitiello, F., Tarasov, L., Heikkilä, M., Björck, S., Brandefelt, J., Johansson, A. V., Näslund, J.-O., and Wohlfarth, B.: Warm summers during the Younger Dryas cold reversal, Nat. Commun., 9, 1–13, https://doi.org/10.1038/s41467-018-04071-5, 2018.
Shakun, J. D. and Carlson, A. E.: A global perspective on Last Glacial Maximum to Holocene climate change, Quaternary Sci. Rev., 29, 1801–1816, https://doi.org/10.1016/j.quascirev.2010.03.016, 2010.
Shen, C.-C., Wu, C.-C., Cheng, H., Edwards, R. L., Hsieh, Y.-T., Gallet, S., Chang, C.-C., Li, T.-Y., Lam, D. D., Kano, A., Hori, M., and Spötl, C.: High-precision and high-resolution carbonate 230Th dating by MC-ICP-MS with SEM protocols, Geochim. Cosmochim. Ac., 99, 71–86, https://doi.org/10.1016/j.gca.2012.09.018, 2012.
Shtukenberg, A. G., Punin, Y. O., Gunn, E., and Kahr, B.: Spherulites, Chem. Rev., 112, 1805–1838, https://doi.org/10.1021/cr200297f, 2012.
Singarayer, J. S., Bamber, J. L., and Valdes, P. J.: Twenty-First-Century Climate Impacts from a Declining Arctic Sea Ice Cover, J. Climate, 19, 1109–1125, https://doi.org/10.1175/JCLI3649.1, 2006.
Smith, D. E., Harrison, S., Firth, C. R., and Jordan, J. T.: The early Holocene sea level rise, Quaternary Sci. Rev., 30, 1846–1860, https://doi.org/10.1016/j.quascirev.2011.04.019, 2011.
Smith, M. W. and Riseborough, D. W.: Climate and the limits of permafrost: A zonal analysis, Permafrost Periglac., 13, 1–15, https://doi.org/10.1002/ppp.410, 2002.
Spötl, C.: Long-term performance of the Gasbench isotope ratio mass spectrometry system for the stable isotope analysis of carbonate microsamples, Rapid Commun. Mass Sp., 25, 1683–1685, https://doi.org/10.1002/rcm.5037, 2011.
Spötl, C. and Vennemann, T. W.: Continuous-flow isotope ratio mass spectrometric analysis of carbonate minerals, Rapid Commun. Mass Sp., 17, 1004–1006, https://doi.org/10.1002/rcm.1010, 2003.
Spötl, C., Koltai, G., Jarosch, A. H., and Cheng, H.: Increased autumn and winter precipitation during the Last Glacial Maximum in the European Alps, Nat. Commun., 12, 1839, https://doi.org/10.1038/s41467-021-22090-7, 2021.
Sturm, M., Taras, B., Liston, G. E., Derksen, C., Jonas, T., and Lea, J.: Estimating Snow Water Equivalent Using Snow Depth Data and Climate Classes, J. Hydrometeorol., 11, 1380–1394, https://doi.org/10.1175/2010JHM1202.1, 2010.
Swabey, S. E. J.: Rates of natural climate change a study of speleothems, The Open University, https://oro.open.ac.uk/54553/1/262754.pdf (last access: 1 September 2023), 1996.
Timms, R. G. O., Abrook, A. M., Matthews, I. P., Francis, C. P., Mroczkowska, A., Candy, I., Brooks, S. J., Milner, A. M., and Palmer, A. P.: Evidence for centennial-scale Lateglacial and early Holocene climatic complexity from Quoyloo Meadow, Orkney, Scotland, J. Quaternary Sci., 36, 339–359, https://doi.org/10.1002/jqs.3282, 2021.
Töchterle, P., Steidle, S. D., Edwards, R. L., Dublyansky, Y., Spötl, C., Li, X., Gunn, J., and Moseley, G. E.: 230Th/U isochron dating of cryogenic cave carbonates, Geochronology, 4, 617–627, https://doi.org/10.5194/gchron-4-617-2022, 2022.
Vaks, A., Gutareva, O. S., Breitenbach, S. F. M., Avirmed, E., Mason, A. J., Thomas, L., Osinzev, A. V., Kononov, A. M., and Henderson, G. M.: Speleothems reveal 500,000-year history of Siberian permafrost, Science, 340, 183–186, https://doi.org/10.1126/science.1228729, 2013.
Vaks, A., Mason, A. J., Breitenbach, S. F. M., Kononov, A. M., Osinzev, A. V., Rosensaft, M., Borshevsky, A., Gutareva, O. S., and Henderson, G. M.: Palaeoclimate evidence of vulnerable permafrost during times of low sea ice, Nature, 577, 221–225, https://doi.org/10.1038/s41586-019-1880-1, 2020.
Vandenberghe, J., Renssen, H., Roche, D. M., Goosse, H., Velichko, A. A., Gorbunov, A., and Levavasseur, G.: Eurasian permafrost instability constrained by reduced sea-ice cover, Quaternary Sci. Rev., 34, 16–23, https://doi.org/10.1016/j.quascirev.2011.12.001, 2012.
Vandenberghe, J., French, H. M., Gorbunov, A., Marchenko, S., Velichko, A. A., Jin, H., Cui, Z., Zhang, T., and Wan, X.: The Last Permafrost Maximum (LPM) map of the Northern Hemisphere: Permafrost extent and mean annual air temperatures, 25–17 ka BP, Boreas, 43, 652–666, https://doi.org/10.1111/bor.12070, 2014.
Walsh, J. E., Fetterer, F., Scott S. J., and Chapman, W. L.: A database for depicting Arctic sea ice variations back to 1850, Geogr. Rev., 107, 89–107, https://doi.org/10.1111/j.1931-0846.2016.12195.x, 2017.
Williams, R. B. G.: Permafrost in England during the Last Glacial Period, Nature, 205, 1304, https://doi.org/10.1038/2051304a0, 1965.
Žák, K., Urban, J., Cıìlek, V., and Hercman, H.: Cryogenic cave calcite from several Central European caves: Age, carbon and oxygen isotopes and a genetic model, Chem. Geol., 206, 119–136, https://doi.org/10.1016/j.chemgeo.2004.01.012, 2004.
Žák, K., Onac, B. P., and Perşoiu, A.: Cryogenic carbonates in cave environments: A review, Quatern. Int., 187, 84–96, https://doi.org/10.1016/j.quaint.2007.02.022, 2008.
Žák, K., Richter, D. K., Filippi, M., Živor, R., Deininger, M., Mangini, A., and Scholz, D.: Coarsely crystalline cryogenic cave carbonate – a new archive to estimate the Last Glacial minimum permafrost depth in Central Europe, Clim. Past, 8, 1821–1837, https://doi.org/10.5194/cp-8-1821-2012, 2012.
Žák, K., Onac, B. P., Kadebskaya, O., Filippi, M., Dublyansky, Y., and Luetscher, M.: Cryogenic Mineral Formation in Caves, in: Ice caves, edited by: Perşoiu, A. and Lauritzen, S.-E., Elsevier, Amsterdam, Oxford, Cambridge, Mass., https://doi.org/10.1016/B978-0-12-811739-2.00035-8, 2018.