the Creative Commons Attribution 4.0 License.
the Creative Commons Attribution 4.0 License.
 | 27 Jun 2024
600 years of wine must quality and April to August temperatures in western Europe 1420–2019
Christian Pfister
Stefan Brönnimann
Andres Altwegg
Rudolf Brázdil
Laurent Litzenburger
Daniele Lorusso
Thomas Pliemon
This study investigates the validity of wine must quality as an April-to-August temperature proxy between 1420 and 2019 based on expert ratings and quality measurements from Germany, Luxembourg, eastern France, and the Swiss Plateau. This is highly relevant as uncertainties remain on past climate variations during this period. The evidence was reviewed according to the best practice of historical climatology. Expert ratings tended to agree with Oechsle density measurements that gradually replaced them from the 1840s. A statistical model calibrated to predict wine must quality from climate data explains 75 % of the variance, underlining the potential value of wine must quality as a climate proxy. Premium crops were collected in years of early harvest involving high insolation during maturation, while poor crops resulted from very late harvests in cold and wet summers. An analysis of daily weather types for high- and low-quality years after 1763 shows marked differences. On a decadal timescale, the average quality was highest from 1470 to 1479, from 1536 to 1545, and from 1945 to 1954. Poor crops were collected in periods with prevailing cold and wet summers such as 1453 to 1466, 1485 to 1494, 1585 to 1614, 1685 to 1703, 1812 to 1821, and 1876 to 1936. In the period of enhanced warming after 1990, high quality became the rule.
- Article
(3440 KB) - Full-text XML
- BibTeX
- EndNote


Viticulture in the mid-latitudes of Europe is known to be closely linked to weather and climate. Due to the sensitivity of grape yields to the weather in the growing season, the revenues of wine producers (i.e., price multiplied by quantity) and the grape quality also vary considerably (Ashenfelter and Storchman, 2016). With other influences that are only minor, temperature controls the rate of physiological development of the vine (Vitis vinifera L.) through bud break to flowering, setting, veraison, and berry-ripening (Gladstones, 2011). Grape harvest dates (GHDs) from archives of societies are thus essential for the high-resolution reconstruction of past climate during the warm season. Pejml (1974), using 19th-century wine quality data for Velké Žernoseky in Bohemia (Czech Republic), concluded that, for years with good or excellent wine, the probability of above-mean temperatures in the vegetation period was 73 %, while in the years with low quality the probability of below-mean temperatures was 77 %. Brázdil et al. (2008) analysed wine quality from three 19th- and early 20th-century series from South Moravia (Czech Republic), suggesting that the relations between grape quality and harvest together with climatic conditions could build an additional proxy to reconstruct the temperature conditions in past times. Kiss et al. (2011) included grape quality data from the late 18th century in their May–August temperature reconstructions for western Hungary. In fact, whereas the longest homogeneous GHD series goes back to the mid-14th century (Labbé et al., 2019), proxies using the quantity and quality of wine must are available back to the 11th century for extreme years. In 1043, for example, chroniclers from northeastern and southern Germany and what is now Belgium complained of “cold, almost wintry rains with strong winds”, which led to a poor harvest of sour grapes and a wet grain crop, resulting in famine (Alexandre, 1987). In recent decades, the relationship between drought and temperature in western Europe has weakened because enhanced warming from anthropogenic greenhouse gases can generate the high temperatures needed for early harvests without drought (Cook and Wolkovich, 2016).
This article investigates grapevine must quality with weather and climate, connecting historical with oenological and climatological research over the past 600 years. The term “grapevine must” originates from the Latin “vinum mustum” meaning “young wine” (Wikipedia, https://en.wikipedia.org/wiki/Must, last access: 5 January 2023). In the historical past, grapes were crushed manually by foot or by a hand-operated wooden press while the freshly pressed juice flowed into a receptacle. “Quality” denotes the amount of sugar in the wine must. To become proper wine, the wine must needs to be stored in barrels, of which the material (oak or metal) contributes to the final quality of the bottled wine.
The German physician and natural scientist Gustav Schübler (1787–1834) was the pioneer of historical oenology in Europe, as this field of research may be called. As a professor of botany and natural history at the German University of Tübingen, he investigated the influence of weather on cultivated plants (Loose, 2022). He compiled information on GHDs along with the quantity and quality of wine must harvests in historical documents back to the late Middle Ages to explore “whether the climate of Germany has changed for centuries, whether it has remained the same, or whether these conditions are perhaps due to greater periods that have so far escaped observation” (Schübler, 1831:3). He thus already considered the three oenological parameters that are used today for climate reconstructions. Grape harvest data were also compiled and discussed in northern Italy and France around this time, although without a historical climate focus (Bonardi et al., 2020).
After the warm summers in the late 1940s arousing fear of desertification, climate change became an issue again. Looking for evidence in the past millennium, Müller (1953), who was then the director of the State Viticulture Institute in Freiburg im Breisgau, compiled the climatologically relevant oenoclimatic sources known for southern Germany standing on Schübler's shoulders. For the same reasons, the Luxembourgish professor Eugène Lahr (1950) may have drawn on ancient data on the quality and quantity of Moselle wines in the Grand Duchy of Luxembourg. Rima (1963) investigated the periodicities in a long time series of grapevine quality and quantity from Johannisberg Castle situated in Geisenheim (Hesse). Lauer and Frankenberg (1986) analysed the climatic parameters affecting grape quality and harvest amount in the German federal state of Palatinate (west of the Rhine) over the period 1948–1980 using multiple regression and a principal component analysis (in German). Their results are summarised as follows. The months from May to August of the harvest year explain the highest variance among all significant influencing factors. In May, soil temperatures matter; in June, sunshine becomes important; in July, also temperature; and, in August, drought is the main factor. Conditions in autumn, on the other hand, fall off. In general, cold, low-radiation, and damp weather in the phase from May to July of the harvest year increases the acidity of the wine at the expense of the sugar content. Molitor et al. (2016) investigated the impact of seasonal heat on grapevine must quality and quantity in the vine-growing region in Luxembourg for the reference period 1854–1885. While wine must quality was highly significant, vine must quantity as an additional predictor variable did not improve model output.
The US climatologist Gregory V. Jones, specialising in the climatology of viticulture, and the environmental scientist Robert E. Davis investigated records of harvest date and of harvest quantity and quality using vineyard observations kept from 1938 to 1995 in Bordeaux (France). The two authors concluded that a large part of the annual fluctuations in the three abovementioned oenoclimatic proxies was controlled by a few large-scale weather events. Cyclonic weather conditions with strong winds and cold fronts reduce grape quantity and quality, also delaying the ripening of the berries. On the other hand, warm high-pressure conditions allow early large harvests with high sugar content to mature. In other words, late harvests were always small and sour, while early harvests were often large and of high quality (Jones and Davis, 2000).
The Italian historian Lorusso (2013, 2018) investigated the extent to which GHDs can be climatically complemented and differentiated through information on wine must quality. In his innovative PhD, he compiled 26 relevant vintage expert-rating time series for the period of the 18th and 19th centuries. His results tend to agree with those of Jones and Davis (2000), according to whom early harvests generally correspond to good and very good wines and late harvests to sour and poor crops. For “average” observations in the middle time intervals of seasonal differentiations, he obtained information on rainfall and short-term shocks on grape quality besides temperatures. Lorusso also demonstrated significant correlations between grape quality and wine prices for the 19th and 20th centuries. In Germany, there is a society for the history of wine (Gesellschaft für Geschichte des Weines e.V.) that organises thematic conferences twice a year and publishes relevant articles (https://www.geschichte-des-weines.de/, last access: 7 June 2023). Outside Europe, wine studies in the humanities and social sciences are just a part of food history, alcohol history, or both (McIntyre, 2017).
The present study extends the abovementioned investigations of wine must quality in a western European setting back into the early 15th century. The study raises the question of whether the reconstruction of summer temperatures based on GHDs can be improved by including evidence of wine must quality. The paper is structured as follows. Section 2 presents the sources and discusses their reliability and validity. In Sect. 3 we analyse the statistical properties of regional series before they are merged into an overall series. Section 3 on methods focusses on the climatic interpretation of the overall series. Section 4 presents the statistical model. Section 5 reviews the main results and discusses their limitations. Section 6 points to the added value of the study and closes with a view to further research.
2.1 Overview of sources
As early as the 11th century, chronicles refer to the sugar content of the wine must and the size of the harvest in exceptional years by reference to a proxy that had a close connection to their experience (Pfister and Wanner, 2021). Wine was in the past at the same time an everyday drink, a religious symbol, and a cash crop, and its sugar content already mattered for its price (Lorusso, 2018). Reports on wine must quality became more continuous from the 13th century onwards. Starting in the early 19th century, they were systematically collected for documenting past climate fluctuations.
Table 1 presents the temporal coverage of the used sources. Following Schübler's (1831) approach, the educationalist Karl Pfaff (1795–1866) published a “Württemberg Wine Chronicle” including quality and quantity data since the 13th century (Pfaff, 1865). Two years later, the German naturalist and oenologist Friedrich August Dochnahl published a wine chronicle for the town of Neustadt an der Weinstrasse (Rhineland-Palatinate, Germany) covering the long period from 1420 to 1867 (Dochnahl, 1867). The most reliable data for the period 1420 to 1537 were drawn from the study for Metz by Litzenburger (2015). Lahr (1950) compiled a wine chronicle from 1627 onwards for the Luxembourgish vine-growing region located at the northern border of viticulture in Europe at that time (Fig. 1). His grape quality chronicle was continued up to 1989 (Bundesamt für Landwirtschaft BLW, 2023). After the hot, dry summers of the late 1940s, Müller (1953) supplemented the data collected by Pfaff up to 1950 (Müller, 1953). For verification, a wine chronicle of the wine village of Briedel (Rhineland-Palatinate) from 1644 to present was consulted (Thur, 2016). The longest must-quality series based on expert ratings known so far was drawn from the winery of the Johannisberg Castle from 1700 to 2000 (Staab et al., 2001). Most Swiss sources originate from the cantons Zürich (Müller, 1878), Schaffhausen (Wildberger, 1896), Thurgau (Wein Schatzung, 1817), and St. Gallen (Rheintalisches Weinbüchlein, 1803), situated in the northeastern part of the Swiss Plateau. The estimated annual qualities for Germany, France, and Luxembourg and for the Swiss Plateau are contained in the repositorium by Pfister et al. (2023).
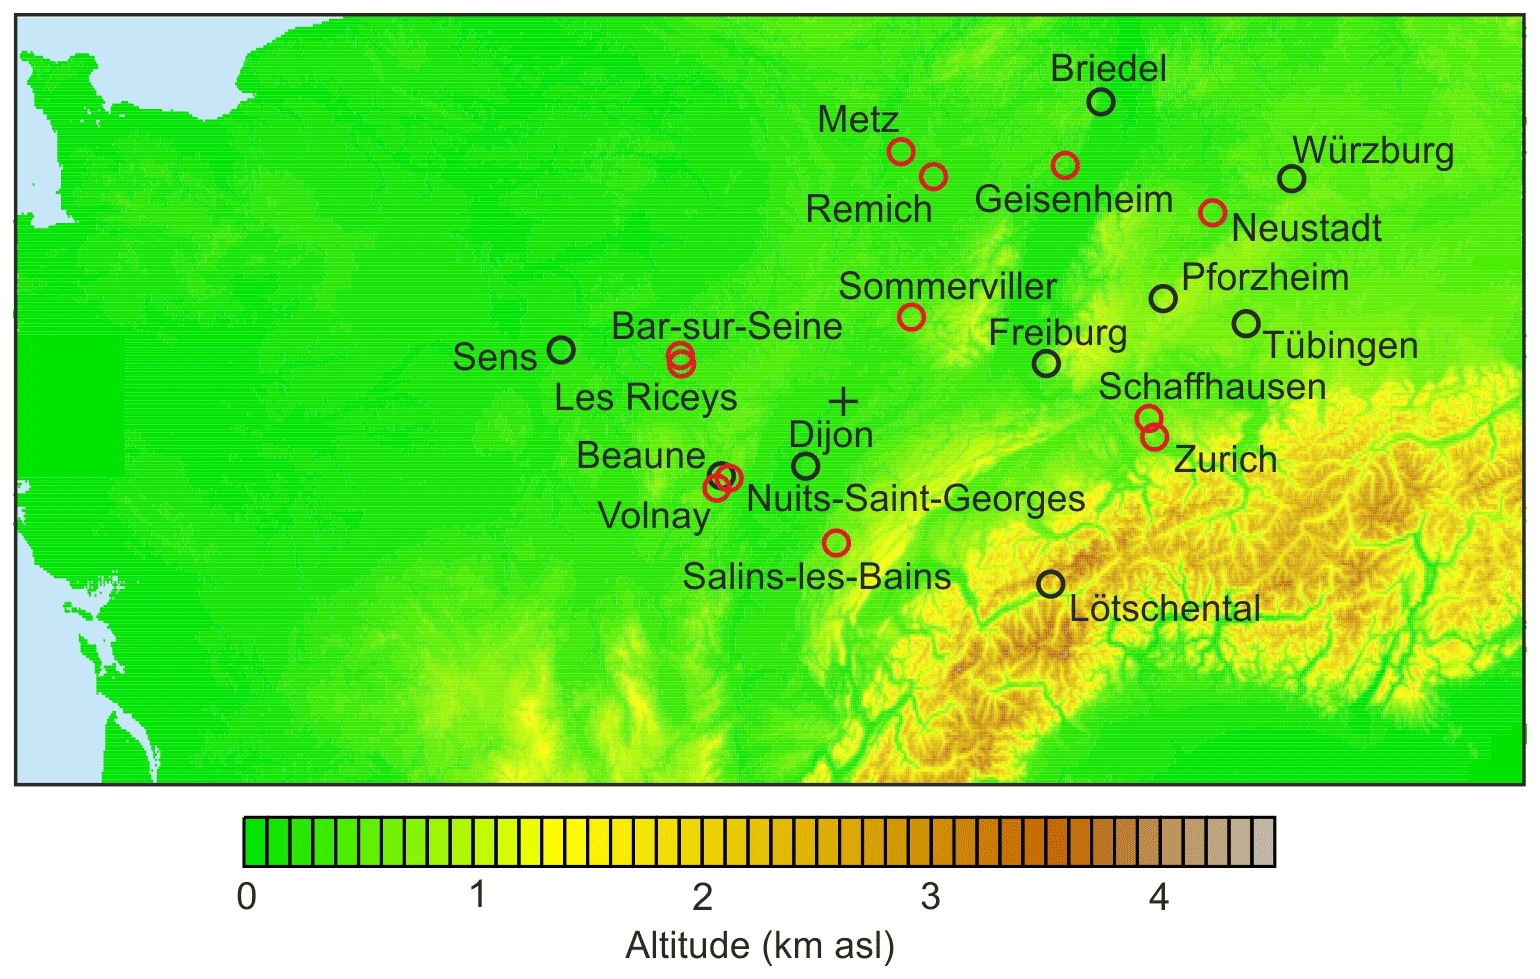
Figure 1Spatial layout of sources and locations. Red circles: location of sources. Black circles: other locations mentioned in the text. The cross + marks the location of the grid point used for the climatic model (Sect. 3).
Table 1Survey of sources. Alt: altitude above sea level. E: expert opinions. ° Oe: degrees Oechsle. Bx: Brix. De: Germany. Lu: Luxembourg. CH: Switzerland.
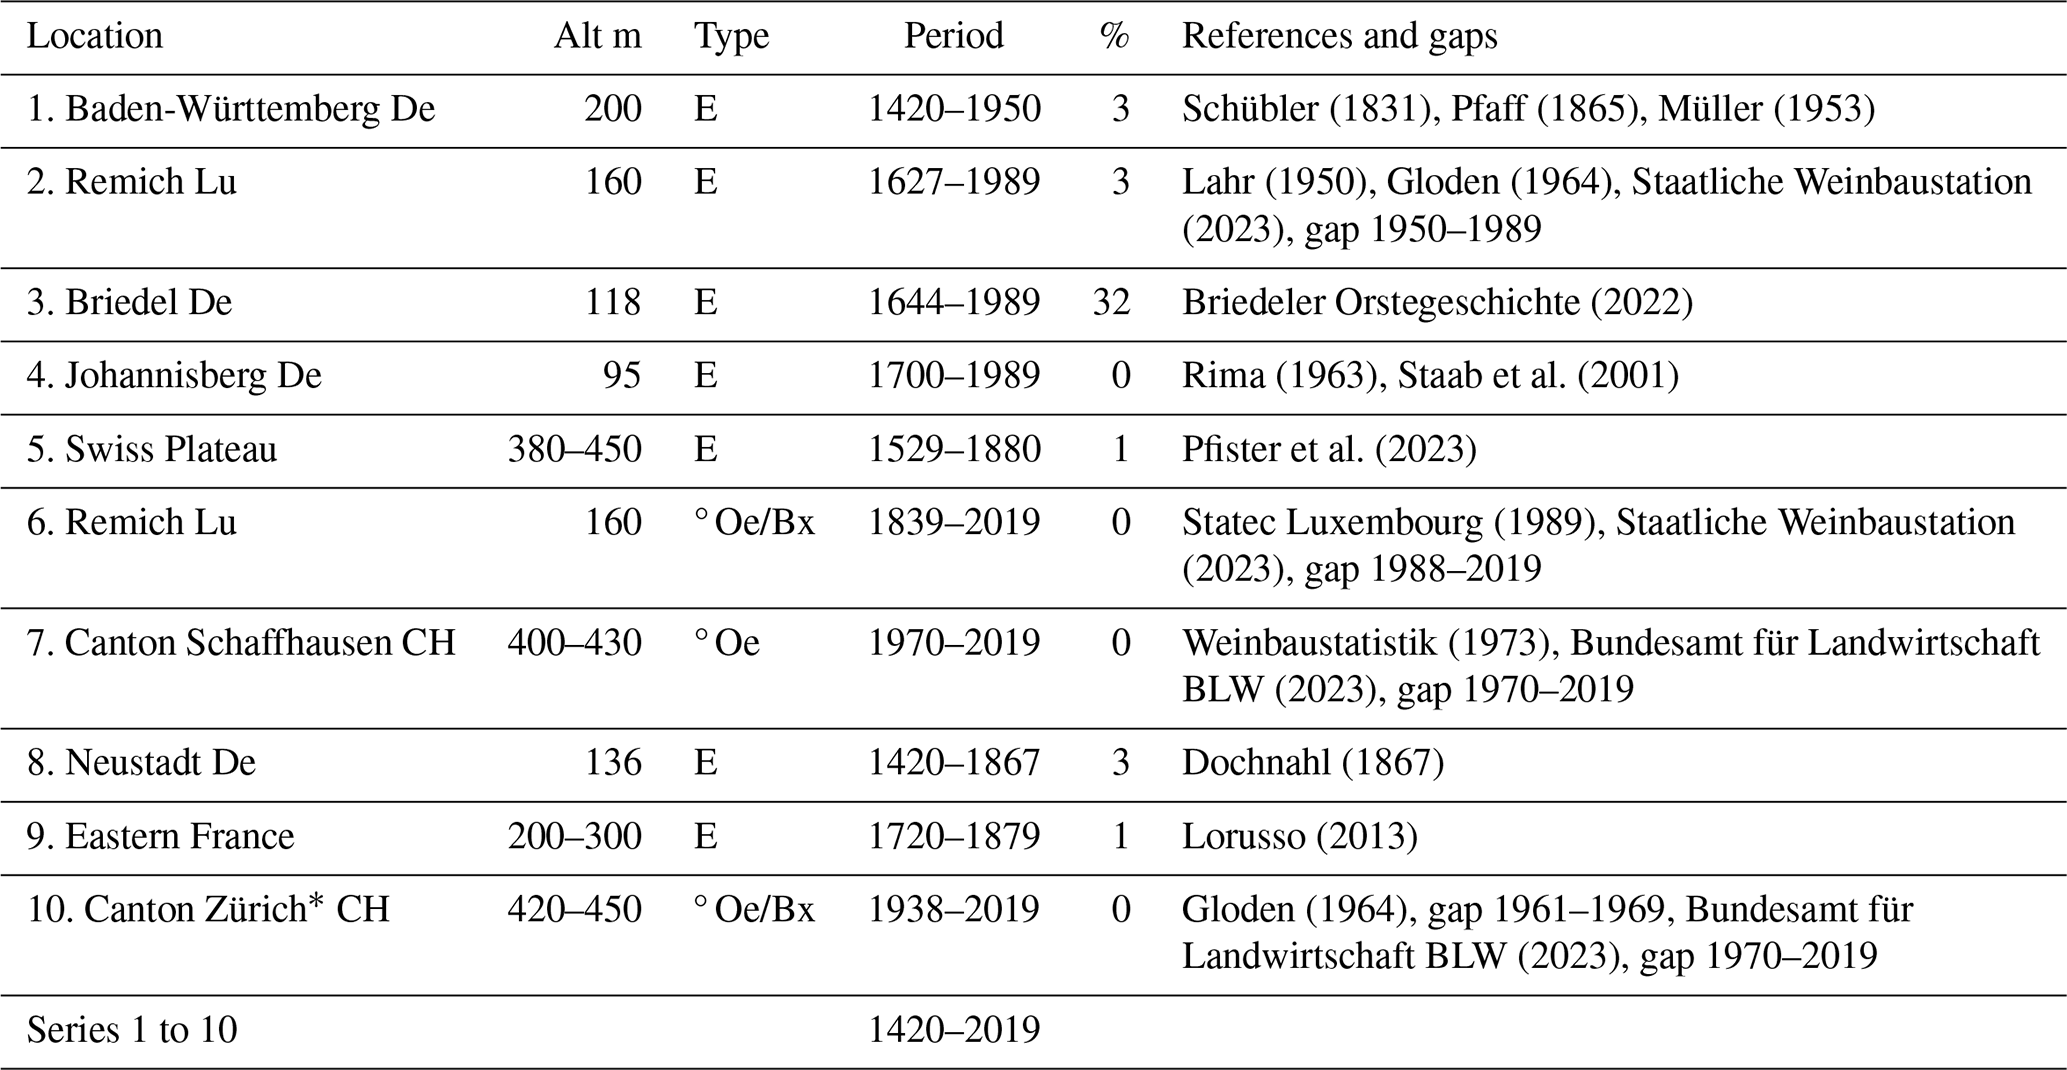
* 1938–1960 District Meilen.
From the mid-19th century, expert ratings were gradually replaced by measurements of sugar content. Appropriate devices measure the density of the unfermented wine must before it is stored in barrels. It corresponds to the proportion of dissolved substances (mainly sugar). Weighing the wine must yields a standardised quality criterion comparable across regions and continents. According to current knowledge, the mechanic and goldsmith Ferdinand Oechsle (1774–1852) from Pforzheim (Baden, Germany) invented the must scale in 1836. However, he was not the forerunner. In fact, must weighing was practised in southern Germany from 1754. Schübler (1831) quotes a relevant treatise by the Stuttgart city physician Reuss (1773). The device was regularly used from 1839 in the Duchy of Luxembourg for purposes of quality control (Statec Luxembourg, 1989). In the Swiss cantons, the method was introduced at different times starting in the late 19th century. In Canton Schaffhausen, for example, it is documented from 1853. Starting in 1874, the communities had to report the results of the annual must weighing to the authorities (Source S8), whereas this regulation was introduced in Canton Zürich only after 1938 (Altwegg et al., 2023). From 1970 onwards, the Swiss Federal Office for Agriculture has published the cantonal averages of must weighing according to cultivar (Source S9). Starting in 1995, results are given in degrees Brix (° Bx; a measure commonly used to measure the dissolved sugar content of an aqueous solution, mostly on the American continent; Wikipedia) (Agropiu, 2024).
Based on geographical location (Fig. 1), three groups of sources can be identified. Metz (France) and Remich (Luxembourg), as well as Briedel, Neustadt an der Weinstrasse, and Johannisberg (Germany), are located at the historical northern wine-growing border, where the vines are particularly sensitive to warm and cold summers. The Rhineland, Württemberg, and the Swiss Plateau are located farther south, whereas the French communities are situated more to the west.
2.2 Source reliability
The best practice of historical source evaluation was applied to assess the reliability of notations on vintage expert ratings. In addition to transcriptional and printing errors, wine chronicles are likely to have included flawed information from noncontemporary sources. However, such flaws are difficult to detect. Flawed-quality data may at least be tracked down indirectly, be it by contradiction of added weather reports in the chronicles with those from contemporary sources or by cross-checking with evidence from neighbouring regions. Some gaps and inconsistencies were filled with Schübler's (1831) original data and with evidence from the comprehensive study for Metz by Litzenburger (2015). Quasi-continuous contemporary data are available for Swiss cantons from the official annual assessment of wine must prices. In the town of Zürich, from 1421 onwards, the authorities used to take a sample of wine must from a vineyard near the lake on the eve of Martinmas (11 November) to estimate the price of wine per bucket, often also specifying the quality (Nabholz, 1908). The vineyards owned by the authority were cultivated by sharecroppers, who had to give half of the yield as rent, while they sold their half on the market and to creditors. The authorities tried to prevent speculation, stabilising their income in record years by setting a takeover price while accommodating the sharecroppers in case of crop failures (Sonderegger, 1994). Corresponding official price and quality indications are documented for the cantons of Schaffhausen, Thurgau, St. Gallen, and Zurich from different points in time (Wildberger, 1896; Wein Schatzung, 1817; Rheintalisches Weinbüchlein, 1803, see Pfister et al., 2023).
2.3 Source validity
Wine must quality can be defined as the average rating assigned by wine experts to a vintage (Almaraz, 2015). At present, the cross-correlation between different sets of expert ratings is usually large (Jones et al., 2005; Baciocco et al., 2014). It is assumed that ratings were made by consensus among guilds of local vine-growers who had the necessary knowledge and experience.
Table 2Size of regional quality classes (expert ratings) 1420–1989 (De: Germany. Lu: Luxembourg).
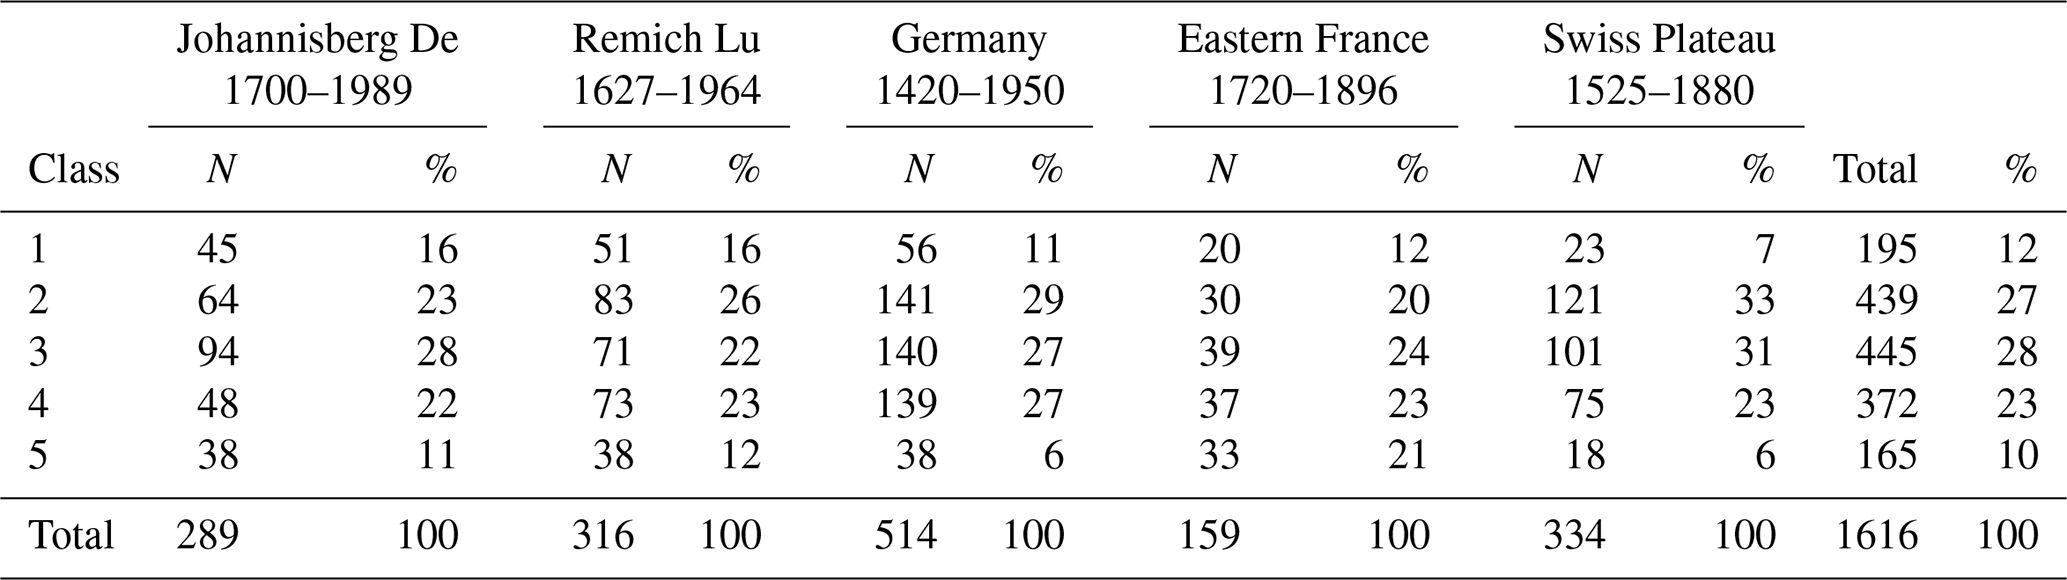
Table 3Correlations between regional series of expert ratings, 1420–1989 (for all correlations p<0.01). Bold: ° Oechsle measurements (De: Germany. Lu: Luxembourg. CH: Switzerland). Note that NA stands for not available.
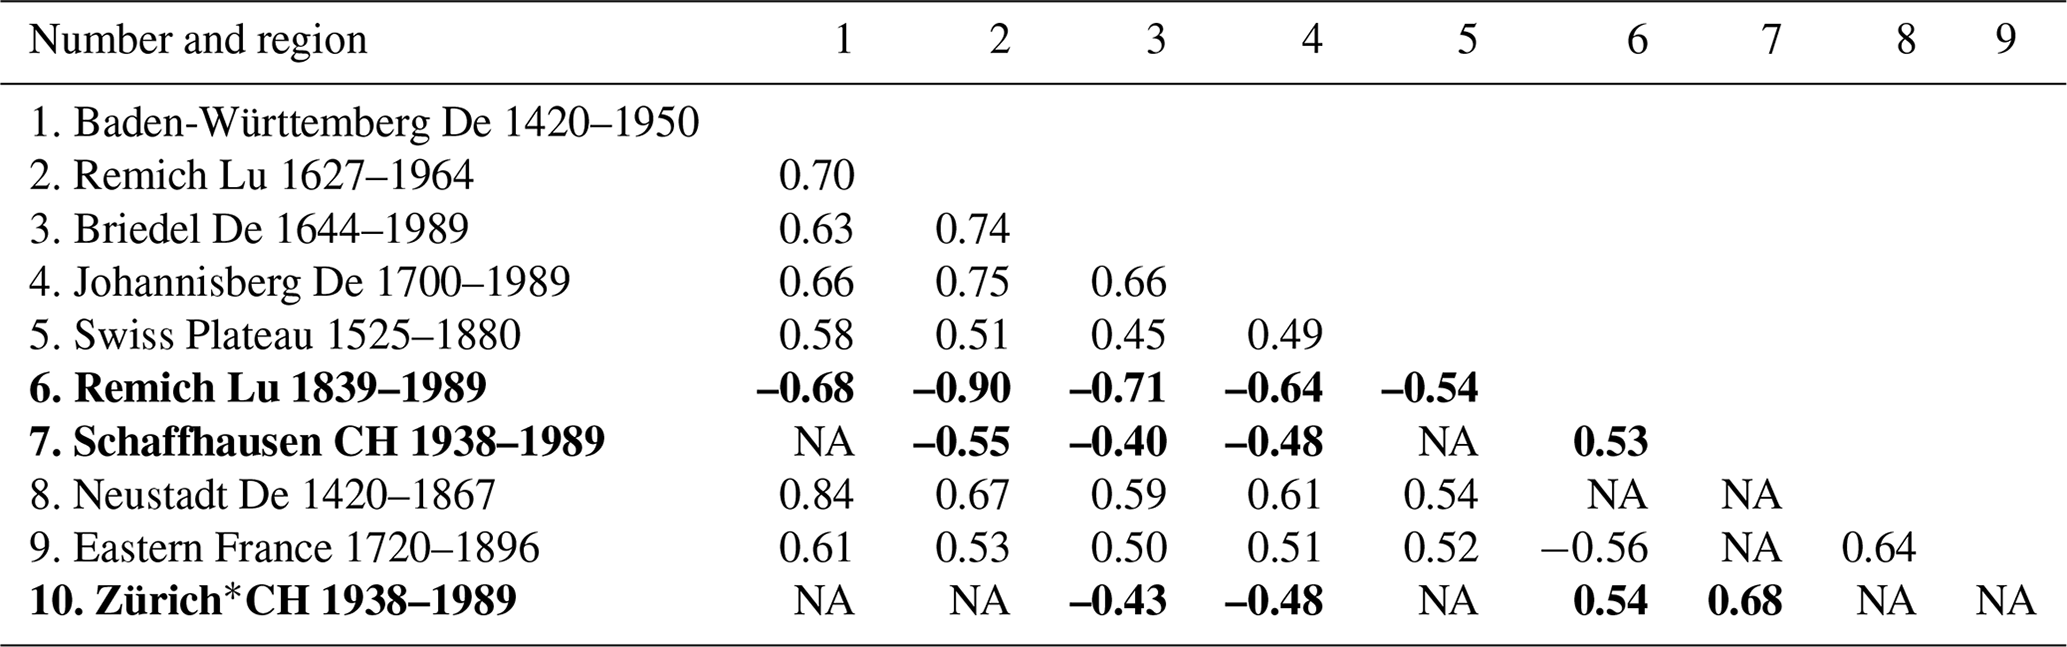
* Meilen 1938–1980.
To assess the validity of documentary data as climate proxies, the evidence from different independent sources is compared. Correlation of regional vintage-rating time series allows certain conclusions to be drawn in this respect, but the uncertainties involved cannot be quantified. As chroniclers used quite similar terms to refer to wine must quality, the source information could be standardised. Following Bassermann-Jordan (1907), it became commonplace to distinguish five quality classes of wine must from 1 (premium) to 5 (nearly undrinkable), often adding a summary description of relevant growing-season weather spells (Lauer and Frankenberg, 1986; Lorusso, 2018; Molitor et al., 2016). Table 2 compares the relative size of the quality classes among regions according to expert ratings. Overall, the proportion of premium and poor wines is the lowest. On the other hand, the proportion of good wines tends to be overestimated. The differences involved in Table 2 point to the fact that expert ratings may be classified as acceptable approximations.
Table 3 presents a statistical comparison of the classified regional series. Values show the coefficient of correlation among regional series that are all significant. The correspondence among the German, Luxembourgish, and Swiss expert ratings is highly significant, while the values for the French municipalities located farther west are somewhat lower. It is concluded that the good spatial agreement of evidence speaks for its validity as a climatic proxy. Note that measured ° Oechsle values are highly correlated with expert ratings from the same location, as the examples of the Upper Moselle valley () and French data (Lorusso, 2013) show. Starting from the mid-19th century, expert ratings were gradually abandoned in favour of Oechsle density measurements. In Switzerland, this was done by each canton at different times, whereas in Luxembourg expert ratings were maintained in parallel to measurements until 1989.
To check the quality of climate reconstruction over time, the regional expert ratings were compared with grape harvest dates (GHDs). This proxy is available in the form of long time series (Daux et al., 2012). However, it should be noted that the setting of the vintage date is based on a decision-making process. Due to severe frost or long rains, vintners may start harvesting before the grapes have reached full maturity, or in the case of plague or military threats the harvest may be skipped altogether (Garnier et al., 2011). Taking the example of the highly cited “Dijon series” (Chuine et al., 2004), a critical source review may even be needed for contemporary data. The two historians, Labbé and Gaveau (2011), discovered that the extremely early harvest date set by the prefect of the department Côte d'Or in the hot summer of 2003 was in fact a bureaucratic artefact. According to the local press, the grape harvest in the Burgundian wine metropolis of Beaune actually began 19 d after the official date.
Table 4Correlation (ρ) of GHD+ series with wine must quality and MXD tree ring data (Büntgen et al., 2006) over time (for all correlations p<0.01). GHD+ is the mean of the standardised GHD series of Beaune (France, from 1420) and of the Swiss Plateau series (from 1460).
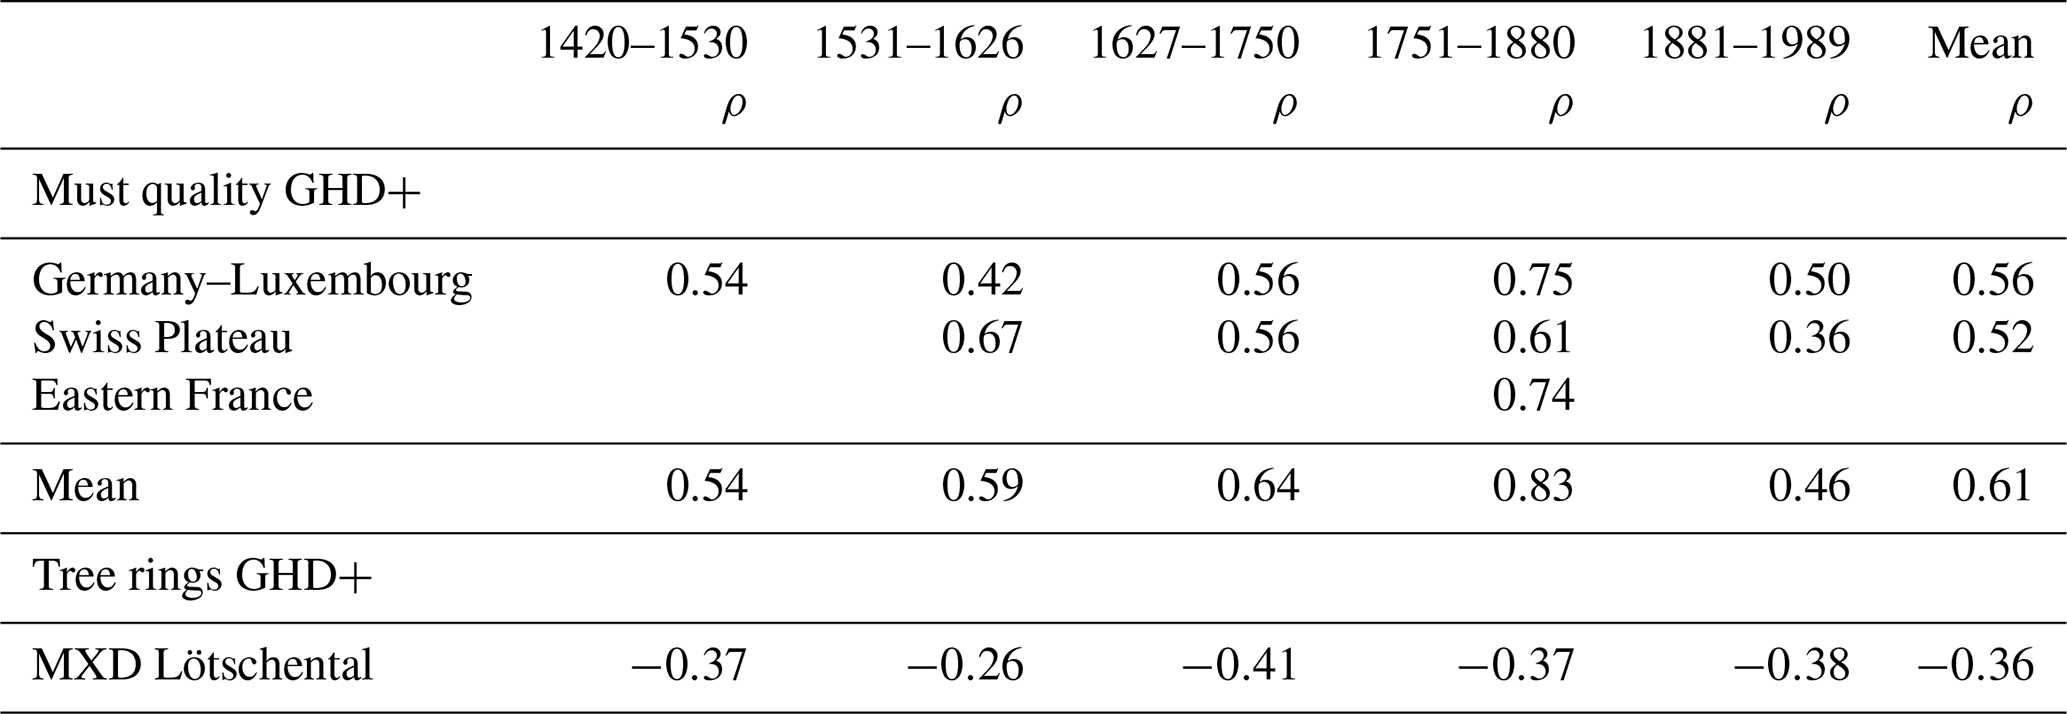
To compensate for local effects, two long-GHD series were used, namely that of Beaune (France) from 1354 to 2018 based on the red Pinot Noir cultivar (Labbé et al., 2019) and that of the Swiss Plateau from 1461 to 2011 (Wetter and Pfister, 2013) based on traditional white grape cultivars, mostly Elbling and Räuschling (Aeberhard, 2005). The vines in Beaune are grown at altitudes between 220 m and 300 m a.s.l., whereas those in the Swiss Plateau are grown at altitudes between 370 and 500 m. Both series were standardised by dividing the anomalies from the mean by the standard deviation. The resulting composite series named “GHD+” starts in 1461. In addition to the GHD, the highly cited 1250-year-long series of maximum latewood density (MXD) data from the Lötschental (Canton Valais) (Büntgen et al., 2006) was integrated as an independent proxy.
Table 4 shows the degree of agreement between the GHD+ series with regional wine must quality and MXD tree ring data over time. Coefficients in Table 4 are lowest from 1420 to 1524, due to a small number of observations per year and to the fact that until 1460 only the GHD series from Beaune is available. The correlation of must quality with tree ring MXD does not show a clear pattern. It is generally lower prior to 1880 and remains at the same level between 1881 and 1989. No interpretation is provided for this. The correlation of mean quality with GHD+ is lower between 1881 and 1989 than in the two preceding time periods, while the correlation of GHD+ with tree ring MXD is at the same level. This points to the inaccurate assessment of vine must quality due to low quality in face of the breakdown of the harvest amount which in Switzerland coincided with a long period of transition from expert evaluation to density measurement. For Luxembourg, where the transition took place starting in the mid-19th century, correlations are higher (not shown).
Figure 2 shows scatterplots of GHD+ and wine must quality in 1420–1989 (right) and 1751–1880 (left). Correlations between GHD+ and wine must quality over the whole period of investigation show a relatively large scattering, which is mainly due to low case numbers and the availability of a single GHD series before 1460. On the other hand, the correlation for the period between 1781 and 1880 (Fig. 2) reaches a maximum of 69 %, whereby the outliers are due to extreme weather events (Table 5).
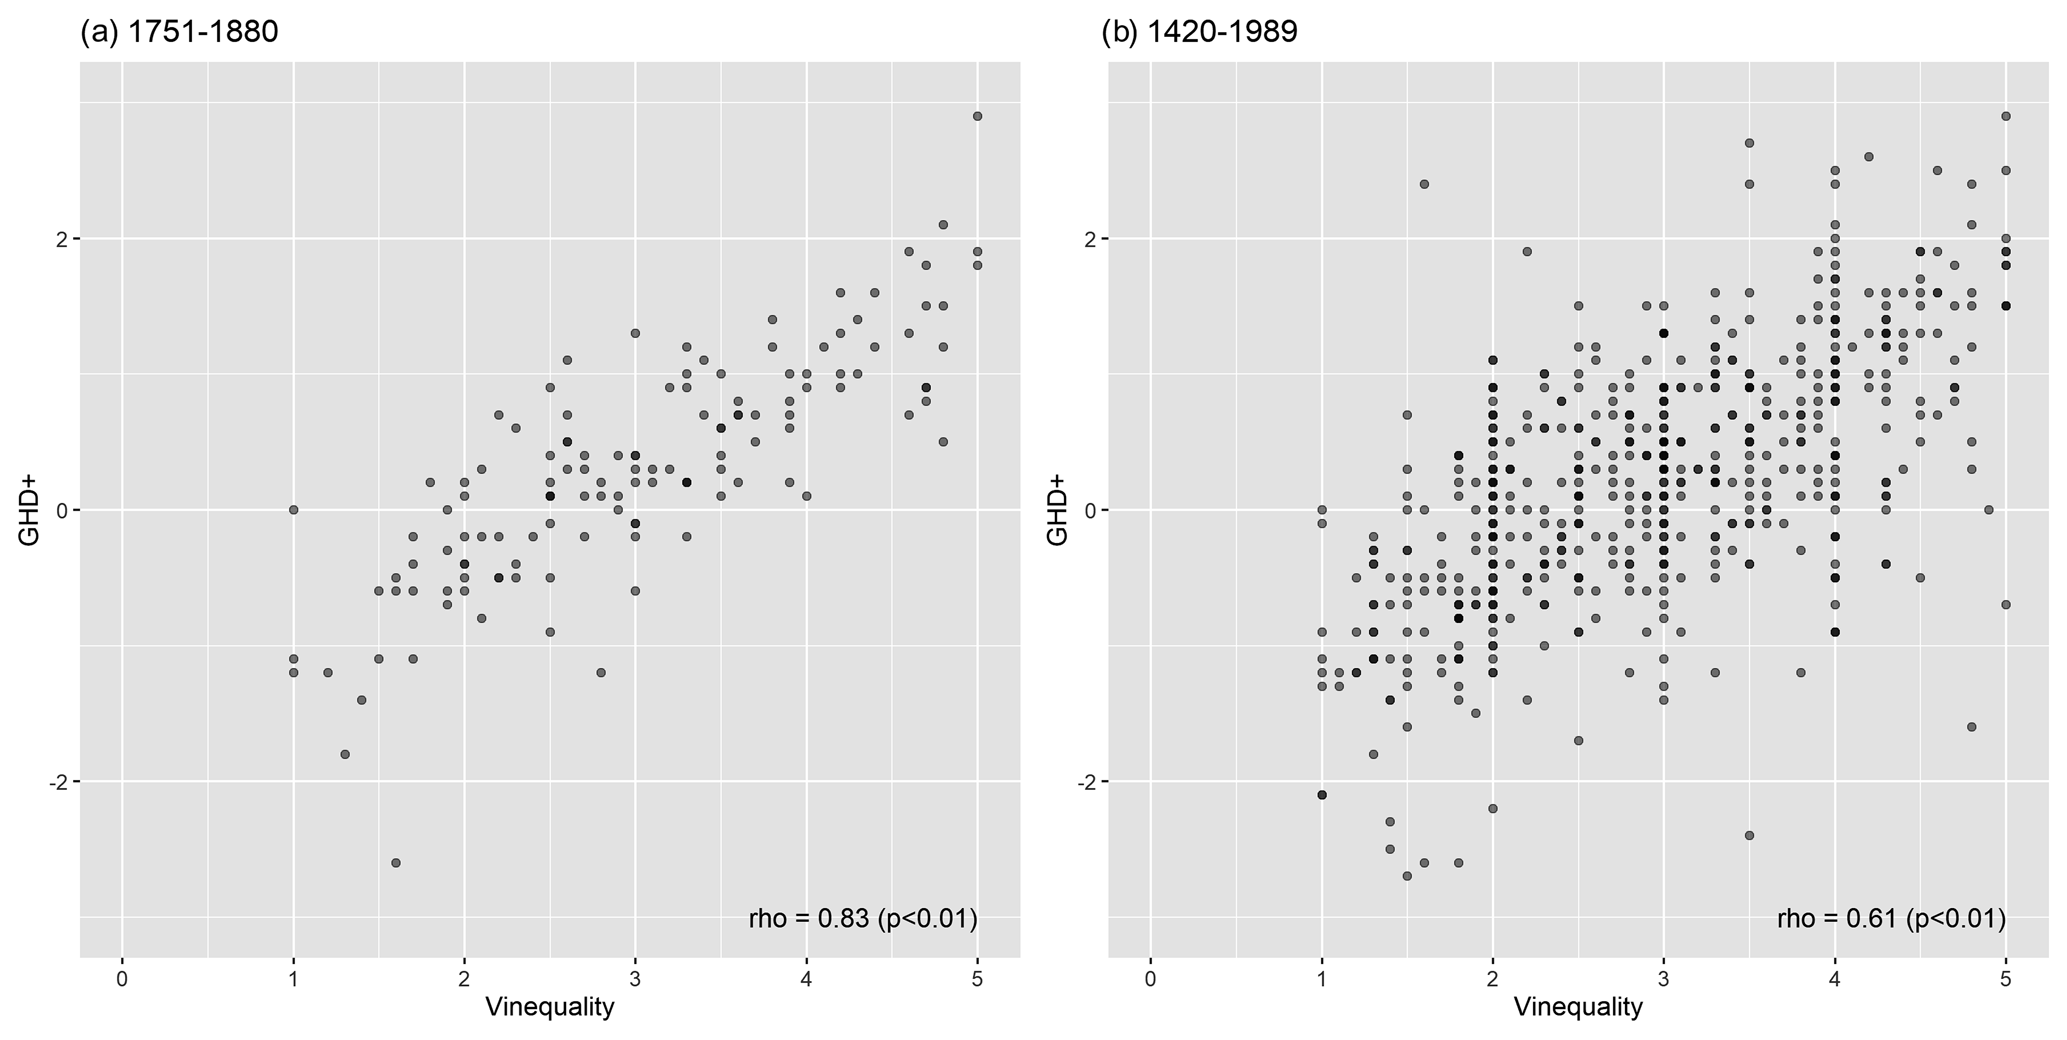
Figure 2Scatterplots of GHD+ with average wine must quality in 1751 to 1880 and 1420 to 1989. GHD+: mean standard deviation of the GHD series of Beaune (France) (from 1420) and of the Swiss Plateau series (from 1460). Correlations between GHD+ and wine must quality over the whole period of investigation (panel b, 1420–1989) show a relatively large scatter, which is mainly due to low case numbers and the availability of a single GHD series prior to panel (a), reaching a high coefficient of determination of 69 %, whereby the outliers are due to effects of extreme weather (Table 5).
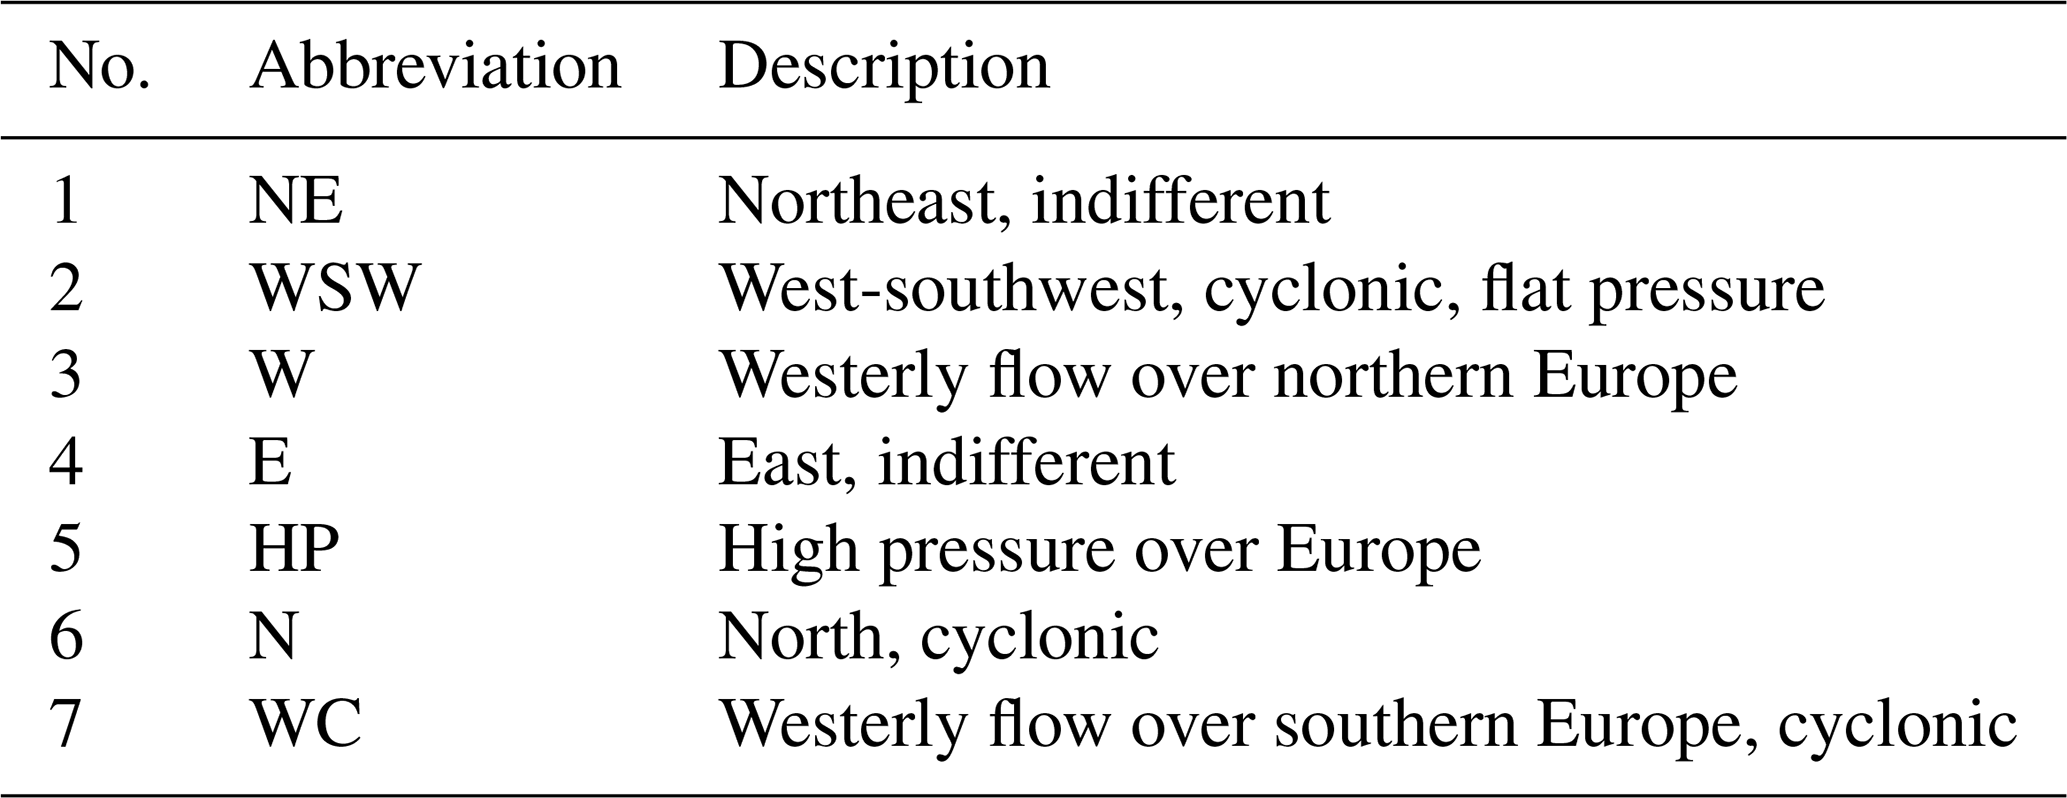
Table 5Description of CAP7 weather types (Schwander et al., 2017).
A validation of the data against modern climate observations was not attempted because the data on wine must quality between 1881 and 1989 are of lower quality that those between 1751 and 1880 (Table 4). Starting in 1990 the quality values are no longer meaningful in terms of climate history because of a substantial quality improvement. In the field of climate reconstruction, data assimilation methods (or other inverse methods) are increasingly used, and these methods require a forward model such as the statistical model presented in this paper. The inversion approaches range from simple Bayesian methods, such as weighted analogues sampled from climate model simulations (Reichen et al., 2022) to off-line ensemble Kalman filters (Valler et al., 2022). The series shown can be used in any of these approaches, together with other series, to obtain a climate reconstruction.
A statistical model for investigating the influence of growing-season weather on wine must quality needs to build on the vegetation cycle of the vines. The blossoms, after flowering in early summer, develop into berries after fruit set in midsummer. Up to this stage, the development of the vine is essentially controlled by the temperature between April and July. At the beginning of the ripening period, called veraison, in August the berries are still small and hard. Subsequently they soften and change colour, and their sugar content increases at the expense of acidity. The ripening process takes about 3 to 4 weeks (Combe and Smart, 2015). Dry and sunny conditions matter during this period (Lauer and Frankenberg, 1986). The earlier the ripening begins, the greater the chance to get a good crop, as the insolation decreases relatively quickly from mid-August. On the other hand, the berries hardly ripen in a late year.
Based on this information, we used a statistical model for wine must quality based on monthly local temperature and precipitation. We started by considering the temperature and precipitation of all months from April to August as predictor variables and then proceeded with a backward selection. Variables that were not statistically significant (p<0.05) were excluded from the model.
The meteorological variables were taken from ModE-RA (Valler et al., 2024). This is a global monthly climate reconstruction of the period 1421–2008 based on assimilating natural proxy data, documentary data, and instrumental observations into an ensemble of global atmospheric model simulations (Bhend et al., 2023). The generation of the product closely follows the predecessor product EKF400v2 (Valler et al., 2022) but uses a greatly expanded set of documentary data (Burgdorf et al., 2023) and instrumental observations (Lundstad et al., 2023) and a new ensemble of statistical model simulations (Hand et al., 2023). From this data set, which consists of 20 ensemble members, we used the ensemble mean of the grid point 5.6° E and 47.6° N (see Fig. 1) to represent the area of interest. We calibrated the model in the period 1781–1880 because instrumental data coverage over Europe for this period is excellent, so the reconstruction is of high quality. The remaining years were used for independent evaluation.
Furthermore, we used daily weather type reconstructions, CAP7 (Cluster Analysis of Principal Components with 7 types), for Switzerland back to 1763 from Schwander et al. (2017). The weather types are based on the official MeteoSwiss weather types, CAP9 (Cluster Analysis of Principal Components with 9 types; Weusthoff, 2011). For the reconstruction, these were reduced to seven types, as there were two pairs of two weather types that were not easily distinguishable. The weather types were successfully used for addressing, e.g., the decadal variability in floods (Brönnimann et al., 2019). A brief description of the types is given in Table 5.
Daily weather type reconstructions offer an additional way to explore the relation between wine must quality and climate. In this study, we analysed weather type frequency from 1763 for years with particularly high and low quality of wine must. Figure 3 shows the average sea-level pressure patterns. Types WSW cyclonic, N cyclonic, and WSW over S Europe are cyclonic weather types that are often associated with the passage of a weather system. Types NE indifferent, E indifferent, and HP over Europe (which is rather rare) are anticyclonic weather types expected to be related to comparably warm and dry conditions (according to Schwander et al., 2017).
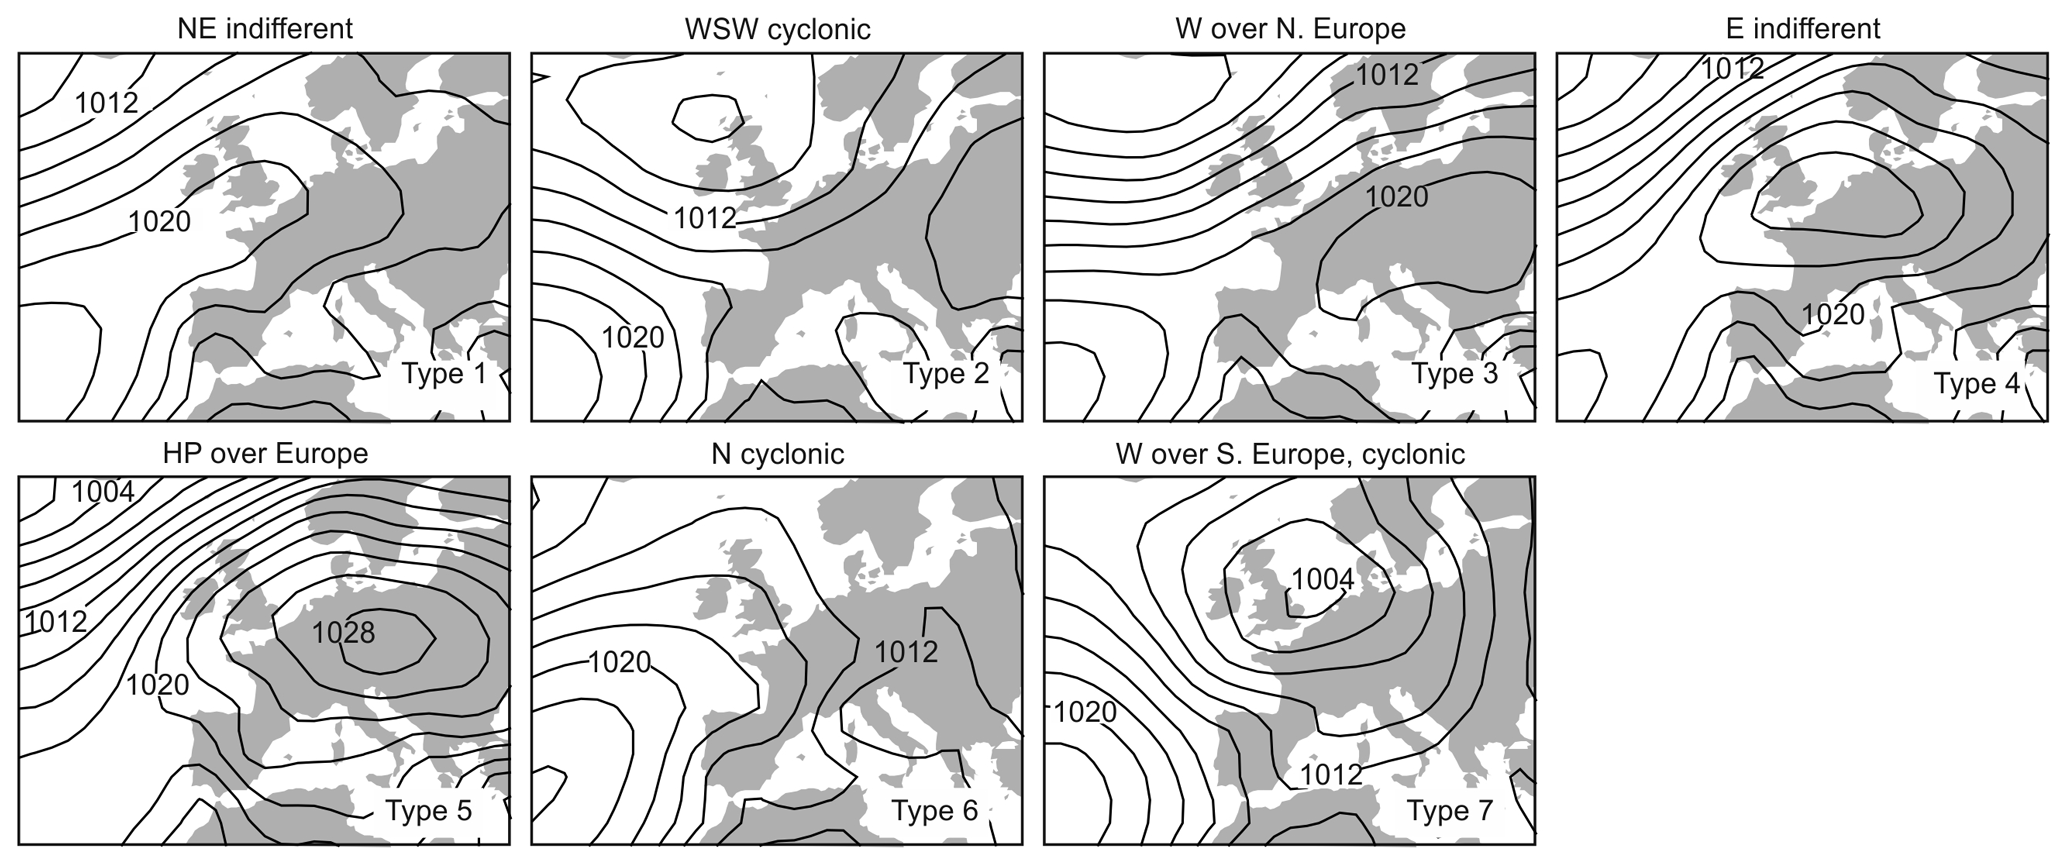
Figure 3Sea-level pressure averaged for each of the seven weather types in CAP7 over the warm season (May–October) for the period 1958–1998 based on 20CRv2c (from Brönnimann et al., 2019).
The presentation of the results begins with an overview of the climatic analysis and then discusses the final wine must quality series and its changes over time. The relation of wine must quality with climate was investigated with the regression model. The backward selection resulted in a statistical model that retained the temperature and precipitation of all relevant months, April to August. Temperatures in this period were all significant according to the results of Lauer and Frankenberg (1986) and Lorusso (2013), as well as precipitation in April and August. Precipitation in May, June, and July was below the selection criteria. Admittedly, contemporary observers only discussed conditions in the summer months. The results are summarised in Table 6.
Table 6Results from the statistical modelling approach for series of wine must quality and grape harvest date. Columns indicate the explained variance in the calibration period (1751–1880) and in the verification period (1525 to 1750), as well as the significance of the coefficients ( denotes p<0.001, denotes p<0.01, and * denotes p<0.05).
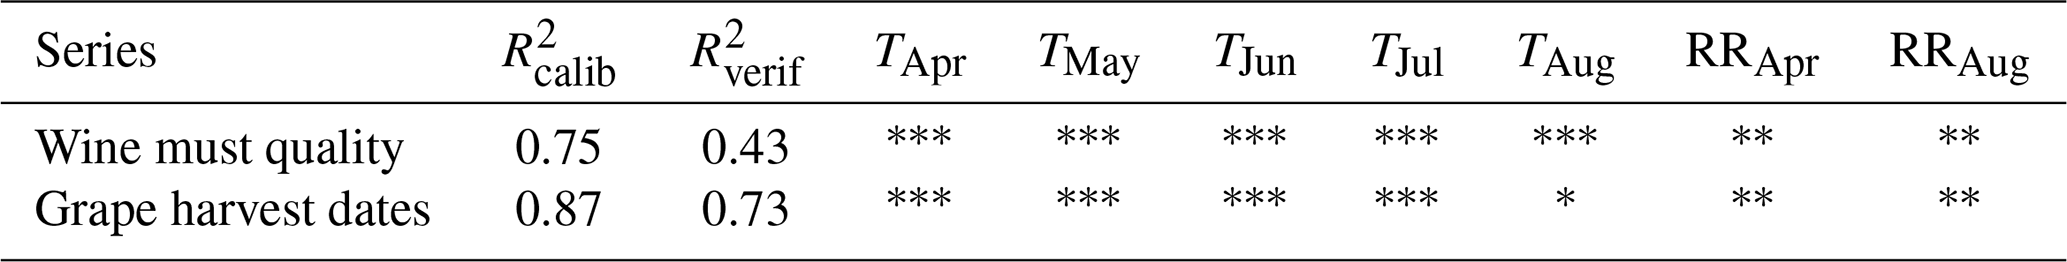
The regression model provides an excellent fit to the data, with an explained variance of 75 %. The performance in the verification period (1525 to 1750) is lower. This could be due to fewer series contributing to the average in earlier years or a lower quality of the reconstruction (see also Table 4). Nevertheless, the agreement is still good.
In Fig. 4, we show the observed and reconstructed wine must quality series back to 1420. The reconstruction also fits well with the observations outside the calibration window. However, the model overestimates extremes, which is arguably due to the linearity of the model. It predicts values outside the restricted quality scale. A simple truncation to the interval [1, 5] already increases correlations. Variable transformations as in Labbé et al. (2019) might further increase the accuracy.
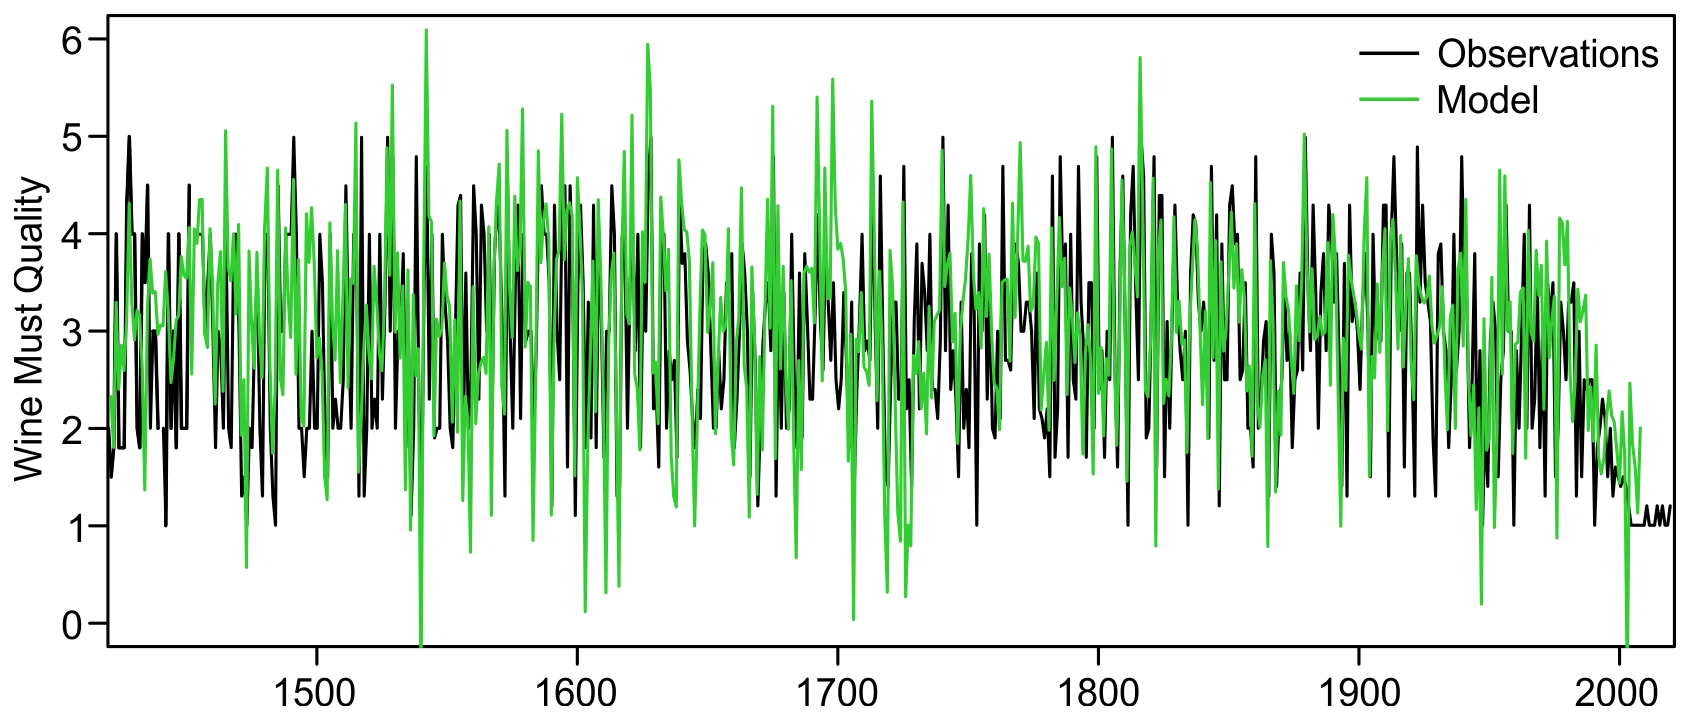
Figure 4Observed series of wine quality (average; black) from 1420 to 2019 and series obtained with a statistical model calibrated in 1781–1800 (green). The model is explained in Sect. 3.
For comparison, we also applied the same regression model to grape harvest dates and found an even better performance (87 % explained variance in the calibration and 73 % in the verification period). It should be noted, however, that grape harvest dates entered the reconstructions; thus the two data sets are not entirely independent, although the amount of instrumental data in the calibration period is massive, such that the influence of grape harvest dates on the reconstruction is arguably small.
In Fig. 5, we analysed the daily weather types for 5 years with excellent wine must quality and 5 years with very low quality in the period 1763 to 1947. The years were selected according to specific thresholds. A slight increase in the threshold would greatly increase the number of cases, thus weakening the robustness of the conclusion. The cyclonic weather types 2 (WSW cyclonic), 6 (N cyclonic), and 7 (W flow over southern Europe, cyclonic) were more frequent in years with low wine must quality than in years with high quality. Conversely, types 1 (NE indifferent), 3 (westerly flow over northern Europe), and 4 (E indifferent) dominated during years with high must quality. This follows the expected pattern, except that one might also have suspected more abundant high-pressure days over central Europe (type 5) in the good-quality years. We find almost the same number of type 5 weather type in both vintages identified with either low or high must quality. This might be due to the fact that this type is rare.
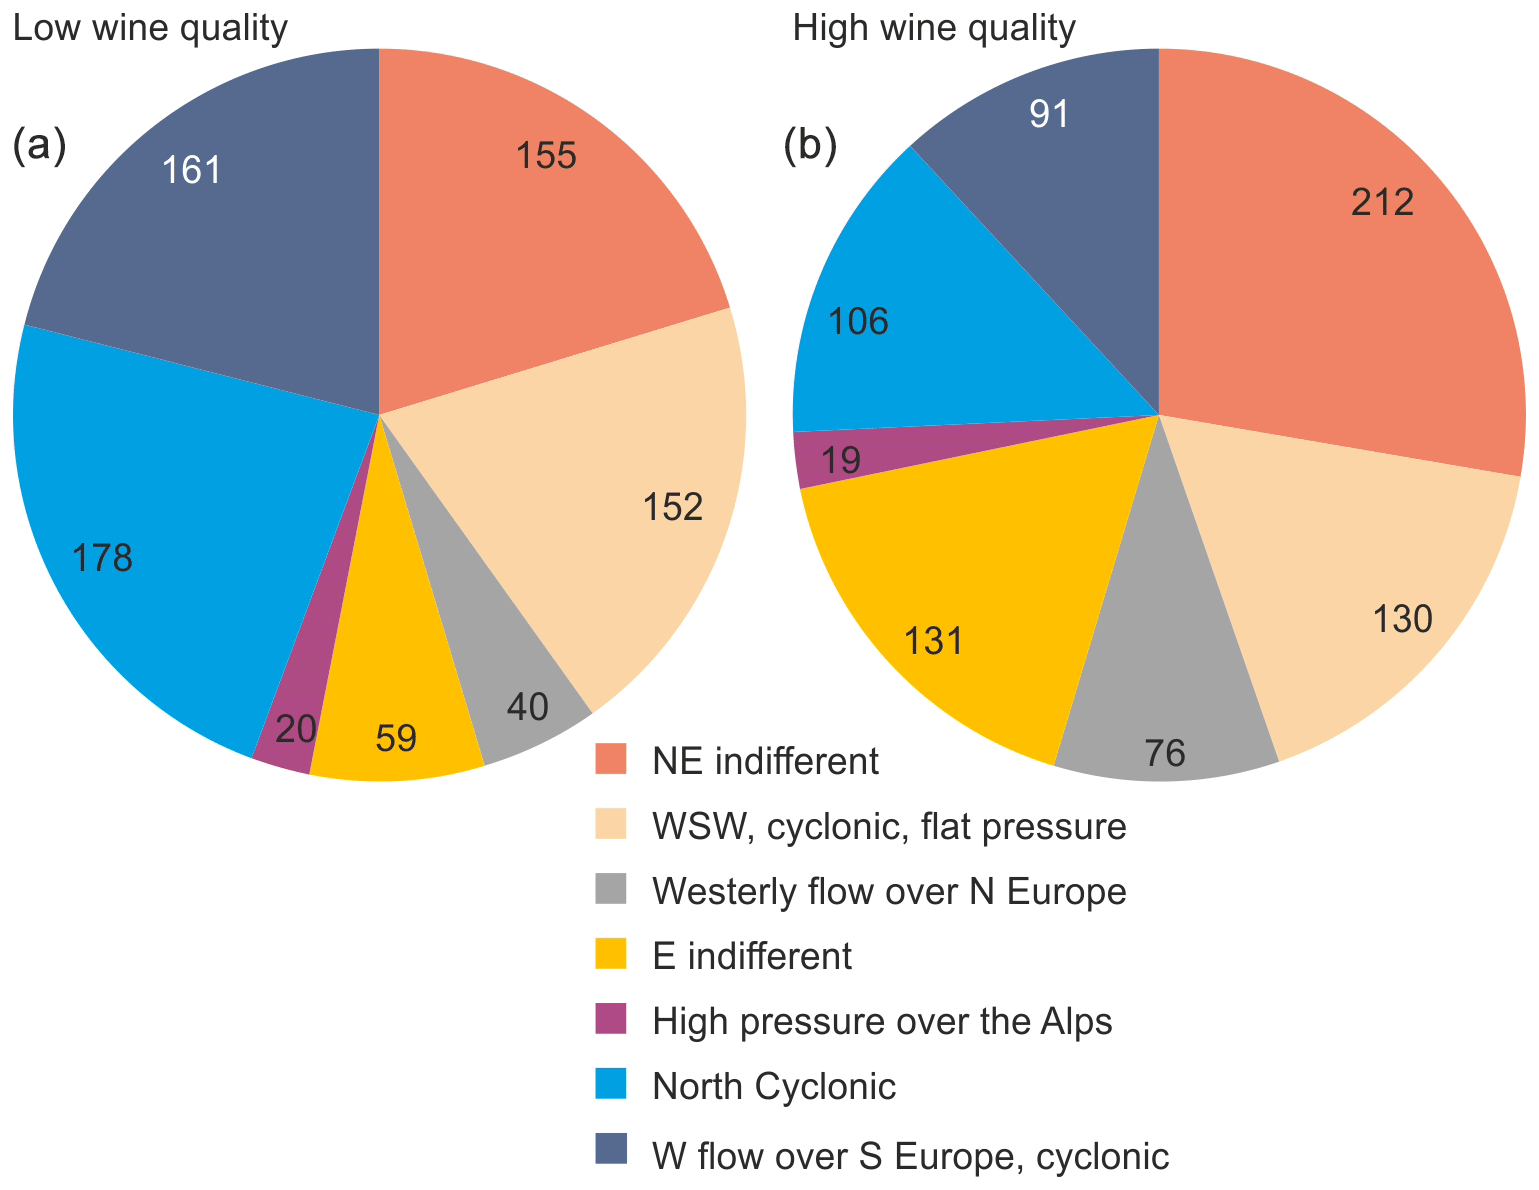
Figure 5Frequency of Swiss weather types from April to August for years with low wine must quality (panel a; 1785, 1799, 1816, 1860, and 1879) and years with high wine must quality (panel b; 1811, 1834, 1846, 1947, and 1949).
Figure 6 presents the average annual wine must quality in western Europe from 1420 to 2019. The data are identical to those in Fig. 4 but are presented in a different context. Prior to 1988, years with high and low quality fluctuated around the long-term average (2.94). A total of 42 % of the top-quality wines was obtained between 1471 and 1616, and 36 % was obtained between 1834 and 1983, while only five vintages achieved top marks in the 195 years between 1616 and 1811. In three periods (1469–1513, 1656–1674, and 1940–1978), high qualities were slightly more frequent, whereas poor qualities predominated in the three periods 1559–1589, 1800–1853, and 1888–1929. On a decadal timescale, quality was highest in the 3 decades from 1470 to 1479, from 1536 to 1545, and from 1945 to 1954. Each decade culminated in a remarkably hot extreme, namely 1473, 1540, and 1947. The hottest year in the millennium was probably 1473 (Camenisch et al., 2020), whereas 1947 was the hottest year between 1719 and 2002 (Pfister and Wanner, 2021). Wines were often undrinkable between 1491 and 1542 and during the 237-year-long period between 1713 and 1939. Between 1782 and 1821 this applies to one in five harvests.
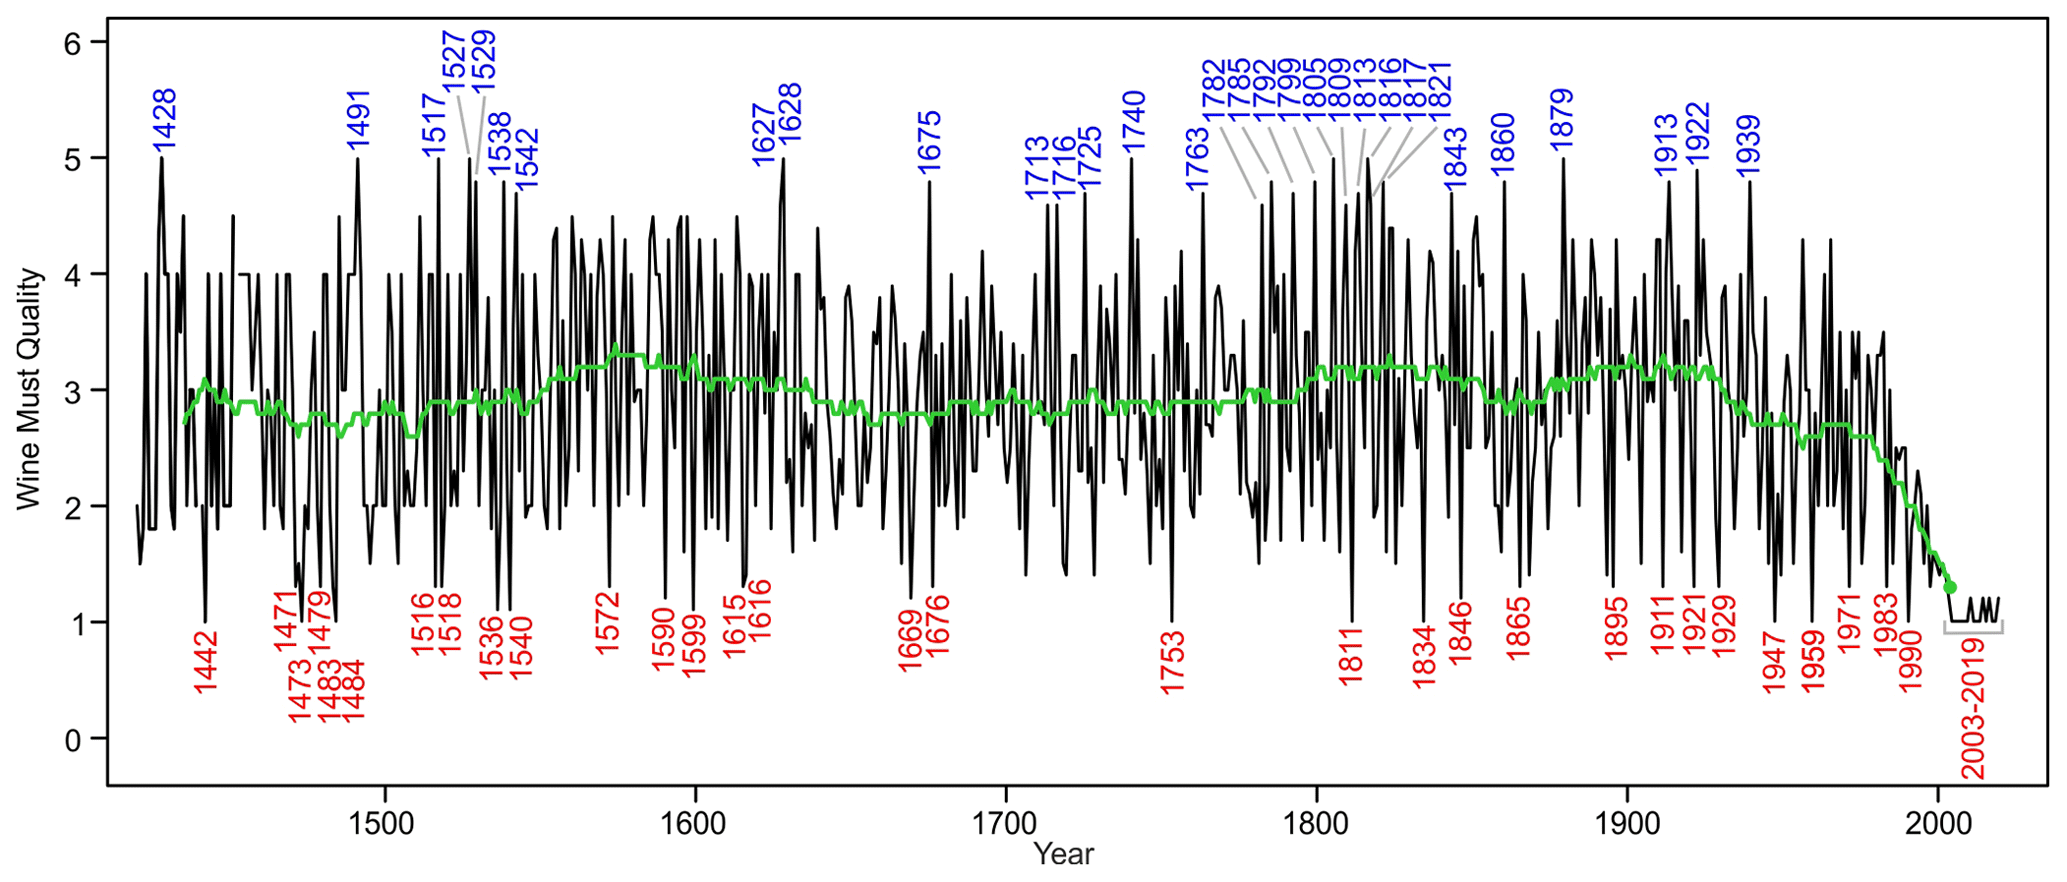
Figure 6Annual average wine must quality in western Europe from 1420 to 2019 ranking from 1 (top quality) to 5 (poor quality). The multidecadal trend is highlighted by a 31-year low-pass filter (green). The 5 % top wine musts and the 5 % poorest ones are indicated in red and in blue, respectively. The almost complete lack of top wine must qualities between 1676 and 1811 and the high frequency of poor qualities between 1782 and 1821 are striking.
Premium grape musts were obtained in the 30 years 1442, 1471, 1473, 1479, 1483, 1484, 1516, 1536, 1540, 1590, 1599, 1615, 1616, 1669, 1676, 1706, 1753, 1811, 1834, 1846, 1865, 1895, 1911, 1921, 1929, 1947, 1949, 1959, 1971, and 1983, whereas 1947 was probably on top. A bottle of Château d'Yquem was on sale for EUR 2950 in 2021 (Pfister and Wanner, 2021). In 1540, grapes were ripe in early August albeit severely suffering from water stress. In many vineyards, the picking of grapes was interrupted and resumed after a rain spell in September (Wetter and Pfister, 2013). The late vintage yielded a great amount of honey-sweet, dirt-cheap wine which led to excessive drinking. Apparently, hundreds of people drank themselves to death (Dochnahl, 1867). In the Prince Bishopric residence in Würzburg, the 1540 premium wine was reserved for guests and members of the Court. The last bottle still survives in the city's civic hospital (Glaser, 2013). The top wine of 1811 was called “Comet Wine” because a comet in that year seemed to herald impending doom (Bonardi, 2007).
Terrible wines were obtained in the 30 years 1428, 1465, 1491, 1517, 1527, 1529, 1538, 1542, 1627, 1675, 1713, 1716, 1725, 1740, 1763, 1782, 1785, 1792, 1799, 1805, 1809, 1813, 1816, 1817, 1821, 1843, 1860, 1879, 1913, and 1939. Some of them got nicknames. The wine in 1529 was called “Türkenwein” (Turkish wine) because the Turks besieged Vienna in that year, and the sour drink in 1860 became known as “Garibaldi” after the Italian freedom fighter of the time (Müller, 1953).
The striking characteristic of the entire series (Fig. 6) is the almost-continuous increase in must weights with the transition from slow to rapid anthropogenic warming in 1988. Besides the effect of climate change, the increase in quality in the Swiss Plateau is also due to quantity restrictions imposed by the authorities after several bumper harvests and the delaying of the harvest date due to good weather conditions (Altwegg et al., 2023). Most wine musts obtained in the past 20 years can be classified as top compared with those in preceding centuries.
Figure 7 compares the evolution of must quality, summer days, and hot days in 1970–2019. A meaningful comparison of meteorological parameters with wine must quality since 1970 requires focusing upon a single cultivar. Riesling was selected because it was grown in Remich for a long time. The average must weight of this cultivar increased by 24 % from the period 1970–1989 to 2000–2019. The number of summer days increased by 75 %, and the number of hot days tripled over this time period. Due to enhanced warming, new cultivars were grown at the expense of traditional varieties. The downside of this development includes the spread of heat-loving pests, the higher frequency of mould due to more warm and humid weather in late summer, and drought stress and water shortage in hot summers (Schweizerisches Idiotikon, 1905; Weinjahr 2007–2018).
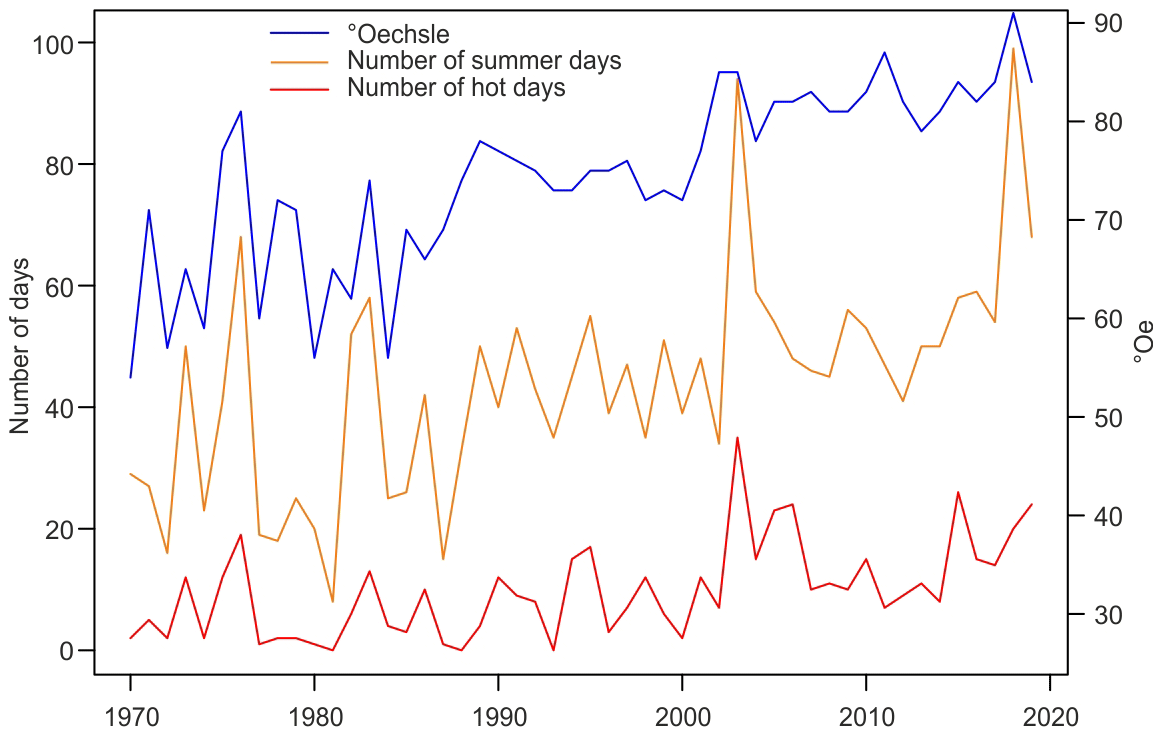
Figure 7Riesling must quality and number of summer days and hot days in Remich (Lu) 1970–2019. Summer days: days reaching 25 °C. Hot days: days reaching 30 °C. Data: Oechsle density of the Riesling cultivar and temperature measurements at the viticultural research station of Remich, Mostwägungen (Mostwägungen, 2020).
The study demonstrated that evidence on wine must quality based on expert ratings is a valid summer temperature proxy so long as the documentary evidence is critically evaluated. Considering the effort spent on this task, the question of the added climatic value of wine must evidence for historical climatology arises. Where GHDs are lacking or questionable, wine must quality may be the most reliable highly resolved summer temperature proxy, invaluable for establishing drought summers and cold, wet seasons. Prior to the late 15th century, it supports and complements the long Beaune GHD series starting in 1354 (Labbé et al., 2019). Further research should focus on the size of grape harvests, which is also related to weather and climate. Economic historians might be interested in wine prices which depended on both the quantity and quality of grape harvests.
Data sets are available at https://doi.org/10.48620/317 (Pfister et al., 2023).
CP was responsible for conceptualisation, data curation, formal analysis, investigation, methodology, resources, validation and writing, and original draft preparation, as well as review and editing. SB was responsible for meteorological and statistical analysis, modelling, validation, visualisation, writing, and review. AA was responsible for data acquisition, data analysis, writing, and review. RB was responsible for resources and writing. LL was responsible for data acquisition and writing. DL was responsible for data acquisition and writing. TP was responsible for draft preparation, visualisation, and editing.
The contact author has declared that none of the authors has any competing interests.
Publisher's note: Copernicus Publications remains neutral with regard to jurisdictional claims made in the text, published maps, institutional affiliations, or any other geographical representation in this paper. While Copernicus Publications makes every effort to include appropriate place names, the final responsibility lies with the authors.
Christian Pfister acknowledges Stefan Doktor of Schloss Johannisberg (Germany) and Christian Sieber of the Staatsarchiv des Kantons Zürich for providing valuable information.
Rudolf Brázdil was supported by AdAgriF – Advanced methods of greenhouse gases emission reduction and sequestration in agriculture and forest landscape for climate change mitigation (grant no. CZ.02.01.01/00/22_008/0004635). Stefan Brönnimann was funded by the Schweizerischer Nationalfonds zur Förderung der Wissenschaftlichen Forschung (grant no. 188701) and the H2020 European Research Council (grant no. 787574).
This paper was edited by Denis-Didier Rousseau and reviewed by two anonymous referees.
Aeberhard, M.: Geschichte der alten Traubensorten, Arcadia Verlag, Solothurn, ISBN 9783941595026, 2005.
Agropiu: Tabelle di comparazione dei valori rifrattometrici, densimetrici ed alcool probabilmente nei mosti di uva, https://pdfslide.net/documents/tabelle-di-comparazione-dei-valori-di-comparazione-sim-jaulmes (last access: 10 May 2024), 2024.
Alexandre, P.: Le climat en Europe au moyen âge: contribution à l'histoire des variations climatiques de 1000 à 1425, d'après les narratives de l'Europe Occidentale, Ecole des hautes études en sciences sociales, Paris, 827 pp., 1987.
Almaraz, P.: Bordeaux wine quality and climate fluctuations during the last century: Changing temperatures and changing industry, Clim. Res., 64, 187, https://doi.org/10.3354/cr01314, 2015.
Altwegg, A., Pfister, C., and Schumacher, P.: Klimaerwärmung und Weinqualität am Zürichsee, Schweizerische Zeitschrift für Obst- und Weinbau, 8, 10–13, https://doi.org/10.21256/zhaw-28141, 2023.
Ashenfelter, O. and Storchman, K.: The Economics of Wine, Weather, and Climate Change, Rev. Environ. Econ. Policy, 10, 25-46, https://doi.org/10.1093/reep/rev018, 2016.
Baciocco, K. A., Davis, R. E., and Jones, G. V.: Climate and Bordeaux wine quality: identifying the key factors that differentiate vintages based on consensus rankings, J. Wine Res., 25, 75–90, https://doi.org/10.1080/09571264.2014.888649, 2014.
Bassermann-Jordan, F.: Geschichte des Weinbaus, Keller, Frankfur am Main, 1907.
Bhend, J., Franke, J., Folini, D., Wild, M., and Brönnimann, S.: An ensemble-based approach to climate reconstructions, Clim. Past, 8, 963–976, https://doi.org/10.5194/cp-8-963-2012, 2023.
Bonardi, L.: Vins de la comète, vins de la Saint-Martin, Des parallélismes œ no-climatiques entre France et Italie du Nord, Actes du colloque international Réchauffement climatiques, quels impacts probables sur les vignobles, 28–30 March 2007, Dijon, 2007.
Bonardi, L, Lorusso, D., and de Mastrovito, D.: Vins, vendanges et fluctuations climatiques. Enquête en Italie, Les Rencontres du Clos Vougeot (3-5 octobre 2019), Dijon, Centre Georges Chevrier, 113-127, 2020.
Brázdil, R., Zahradníček, P. Dobrovolný, P., Kotyza, O., and Valášek, H.: Historical and recent viticulture as a source of climatological knowledge in the Czech Republic, Geografie, 113, 351–371, https://doi.org/10.37040/geografie2008113040351, 2008.
Brönnimann, S., Frigerio, L., Schwander, M., Rohrer, M., Stucki, P., and Franke, J.: Causes of increased flood frequency in central Europe in the 19th century, Clim. Past, 15, 1395–1409, https://doi.org/10.5194/cp-15-1395-2019, 2019.
Bundesamt für Landwirtschaft BLW: Das Weinjahr 1970–2021, https://www.blw.admin.ch/blw/de/home/suche.html#weinjahr (last access: 4 February 2023), 2023.
Büntgen, U., Frank, D., and Nievergelt, C.: Summer temperature variations in the European Alps, A.D. 755–2004, J. Climate, 19, 5606–5623, https://doi.org/10.1175/JCLI3917.1, 2006.
Burgdorf, A.-M., Brönnimann, S., Adamson, G., Amano, T., Aono, Y., Barriopedro, D., Bullon, T., Camenisch, C., Camuffo, D., Daux, V., del Rosario Prieto, M., Dobrovolny, P., Gallego, D., Garcia-Herrera, R., Gergis, J., Grab, S., Hannaford, M. J., Holopainen, J., Kelso, C., Kern, Z., Kiss, A., Lin Kuan-Hui, E., Loader, N. J., Mozny, M., Nash, D., Nicholson, S. E., Pfister, C., Rodrigo, F. S., Rutishauser, T., Sharma, S., Takacs, K., Vargas, E. T., and Vega, I.: DOCU-CLIM: A global documentary climate dataset for climate reconstructions, Sci. Data, 10, 402, https://doi.org/10.1038/s41597-023-02303-y, 2023.
Camenisch, C., Brázdil, R., Kiss, A., Pfister, C., Wetter, O., Rohr, C., Contino, A., and Retsö, D.: Extreme heat and drought in 1473 and their impacts in Europe in the context of the early 1470s, Reg. Environ. Change, 20, 19, https://doi.org/10.1007/s10113-020-01601-0, 2020.
Chuine, I., Yiou, P., Viovy, N., Seguin, B., Daux, V., and Le Roy Ladurie, E.: Grape ripening as a past climate indicator, Nature, 432, 89–290, https://doi.org/10.1038/432289a, 2004.
Combe, B. and Smart, R.: Veraison, in: The Oxford Companion to Wine, 4th Edn., edited by: Robinson, J., Oxford University Press, Oxford, 26–27, ISBN 9780198705383, 2015.
Cook, B. and Wolkovich, E.: Climate change decouples drought from early wine grape harvests in France, Nat. Clim. Change, 6, 715–720, https://doi.org/10.1038/nclimate2960, 2016.
Daux, V., Garcia de Cortazar-Atauri, I., Yiou, P., Chuine, I., Garnier, E., Le Roy Ladurie, E., Mestre, O., and Tardaguila, J.: An open access database of grape harvest dates for climate research: data description and quality assessment, Clim. Past, 8, 1403–1418, https://doi.org/10.5194/cp-8-1403-2012, 2012.
Dochnahl, F. A.: Chronik von Neustadt an der Haardt und den umliegenden Orten […] unter besonderer Berücksichtigung der Weinjahre, Neustadt an der Haard, Verlag von Gottschick Witters Buchhandlung, https://www.digitale-sammlungen.de/de/view/bsb10482125?page=5 (last access: 17 March 2023), 1867.
Garnier, E., Daux, V., and Yiou, P.: Grapevine harvest dates in Besançon (France) between 1525 and 1847: social outcomes or climatic evidence?, Climatic Change, 104, 703–727, https://doi.org/10.1007/s10584-010-9810-0, 2011.
Gladstones, J. S.: Wine, terroir and climate change, Hyde Park Press, Adelaide, ISBN 1862549249, 2011.
Glaser, R.: Klimageschichte Mitteleuropas, 1200 Jahre Wetter, Klima, Katastrophen, Wiss. Buchges., Darmstadt, ISBN 3896786040, 2013.
Gloden, N.: Weinbauchronik der Luxemburger Mosel von 1900 bis 1964 […] reprint from “De Letzeburger Wönzer”, https://agriculture.public.lu/dam-assets/veroeffentlichungen/berichte/weinbau/weinjahr/Weinbauchronik-1900bis1964.pdf (last access: 10 May 2024), 1964.
Hand, R., Samakinwa, E., Lipfert, L., and Brönnimann, S.: ModE-Sim – A medium size AGCM ensemble to study climate variability during the modern era (1420 to 2009), Geosci. Model Dev., 16, 4853–4866, https://doi.org/10.5194/gmd-16-4853-2023, 2023.
Jones, G. V. and Davis, R. E.: Using a synoptic climatological approach to understand climate-viticulture relationships, Int. J. Climatol., 20, 813–837, https://doi.org/10.1002/1097-0088(20000630)20:8<813::AID-JOC495>3.0.CO;2-W, 2000.
Jones, G. V., White, M. A., Cooper, O. A., and Storchmann, K.: Climate Change and Global Wine Quality, Climatic Change, 73, 319–343, https://doi.org/10.1007/s10584-005-4704-2, 2005.
Kiss, A., Wilson, R., and Bariska, I.: An experimental 392-year documentary-based multi-proxy (vine and grain) reconstruction of May–July temperatures for Kõszeg, West-Hungary, Int. J. Biometeorol., 55, 595–611, https://doi.org/10.1007/s00484-010-0367-4, 2011.
Labbé, T. and Gaveau, F.: Les dates de vendange à Dijon: établissement critique et révision archivistique d'une série ancienne, Revue Historique, 657, 19–51, https://doi.org/10.3917/rhis.111.0019, 2011.
Labbé, T., Pfister, C., Brönnimann, S., Rousseau, D., Franke, J., and Bois, B.: The longest homogeneous series of grape harvest dates, Beaune 1354–2018, and its significance for the understanding of past and present climate, Clim. Past, 15, 1485–1501, https://doi.org/10.5194/cp-15-1485-2019, 2019.
Lahr, E.: Un siècle d'Observations météorologiques appliquée à l'étude du Climat Luxembourgeois, Gran-Duché de Luxembourg, Service météorologique et hydrographique, Imprimerie Bourg-Bourger, Luxembourg, 1950.
Lauer, W. and Frankenberg, P.: Zur Rekonstruktion des Klimas im Bereich der Rheinpfalz seit Mitte des 16. Jahrhunderts mit Hilfe von Zeitreihen der Weinquantität und Weinqualität, Gustav Fischer, Stuttgart, 1–52, 1986.
Litzenburger, L.: Une ville face au climat. Metz à la fin du Moyen Âge (1400–1530), Presses Universitaires de Nancy, Nancy, ISBN 2814302256, 2015.
Loose, R.: Gustav Schübler (1787–1834): Professor für Naturgeschichte und Botanik in Tübingen, Franz Steiner, Stuttgart, ISBN 978-3-515-13254-1, 2022.
Lorusso, D.: Il clima del Vino. Metodi di Riconstruzione e impatti economici delle fluttuazioni climatiche nelle regioni vitivinicole (Secoli XVII–XX), PhD thesis, Università di Milano, https://air.unimi.it/retrieve/dfa8b991-0f57-748b-e053-3a05fe0a3a96/phd_unimi_R09333.pdf (last access: 4 August 2022), 2013.
Lorusso, D.: Dates de vendanges et qualité des millésimes en Bourgogne entre XVIII et XXI siècle, in: Bourgogne(s) viticole(s): enjeux et perspectives historiques d'un territoire, edited by: Wolikow, S. and Jacquet, O., EUD, Dijon, 63–77, ISBN 978-2364412637, 2018.
Lundstad, E., Brugnara, Y., Pappert, D., Kopp, J., Hürzeler, A., Andersson, A., Chimani, B., Cornes, R., Demarée, G., Filipiak, J., Gates, L. Ives, G.L., Jones, J., M., Jourdain, S., Kiss, A., Nicholson, S. E., Przybylak, R., Jones, P., Rousseau, D., Tinz, B., Rodrigo, F. S., Grab, S., Fernando Domínguez-Castro, F., Slonosky, V., Cooper, J., Brunet, M., and Brönnimann, S.: Global historical climate database – HCLIM, Sci. Data, 10, 44, https://doi.org/10.1038/s41597-022-01919-w, 2023.
McIntyre, J.: Wine studies in the humanities and social sciences: a report on symposia and the state of the field, J. Wine Res., 28, 159–164, https://doi.org/10.1080/09571264.2017.1309645, 2017.
Molitor, D., Udelhoven, T., Ney, S., Hoffmann, I., and Pfister, L: Historical vintage descriptions from Luxembourg – an indicator for the climatic conditions in the past?, Vitis, 55, 23–30, https://doi.org/10.5073/vitis.2016.55.23-30, 2016.
Mostwägungen: Mostwägungen Luxemburg 1910 bis 2020, parallel dazu Weinbauchronik mit qualitativen Qualitätsschätzungen – Moststatistiken detailliert 1910 bis 2020, https://agriculture.public.lu/de/weinbau-oenologie/publikationen/online-archiv.html (last access: 7 November 2022), 2020.
Müller, C. K. (Ed.): Joh[ann] Heinrich Waser […] und sein statistischer Nachlass, Fortgeführt bis zur Gegenwart, Zürcher Jahrbuch für Gemeinnützigkeit 1877, 88–167, Zurich, 1878.
Müller, K.: Geschichte des Badischen Weinbaus. Mit einer badischen Weinchronik und einer Darstellung der Klimaschwankungen im letzten Jahrtausend, Lahr, Schauenburg, 1953.
Nabholz, H.: Zürcher Stadtbücher des XIV. und XV. Jahrhunderts, in: Vol. 3, Hirzel, Zürich, 1908.
Pejml, K.: Příspěvek ke znalosti kolísání klimatu v Čechách v 16. až 18. stol. (Contribution to the knowledge of climate fluctuations in Bohemia from the 16th to 18th centuries). Meteorologické zprávy, 27, 90-95, 1974.
Pfaff, K.: Württembergische Weinchronik. Ein Bericht über die Quantität und Qualität des Weins und die darauf einwirkenden Witterungsverhältnisse […], Konrad Meychardt, Esslingen, 1865.
Pfister, C. and Wanner, H.: Climate and Society in Europe. The last thousand years, Haupt, Bern, ISBN 978-3-258-08234-9, 2021.
Pfister, C., Brönnimann, S., Altwegg, A., Brázdil, R., Litzenburger, L., Lorusso, D., and Pliemon, T.: Annual wine must quality data from Germany, Luxembourg, France and the Swiss Plateau for 1420 to 2019, BORIS Repository [data set], https://doi.org/10.48620/317, 2023.
Reichen, L., Burgdorf, A. M., Brönnimann, S., Franke, J., Hand, R., Valler, V., Samakinwa, E., Brugnara, Y., and Rutishauser, T.: A decade of cold Eurasian winters reconstructed for the early 19th century, Nat. Commun., 13, 2116, https://doi.org/10.1038/s41467-022-29677-8, 2022.
Reuss, J. J.: Musta et vina nectarina examine hydrostatica explorata, Dissertation, University of Tübingen, Tübingen, 1773.
Rheintalisches Weinbüchlein: Rheintalisches Weinbüchlein […] des sogenannten Weinlaufs nebst einem Anhang der Weinpreise von Weinfelden und Konstanz, St. Gallen, 1803.
Rima, A.: Considerazioni su una serie agraria biseculare: la produzione di di vino nel Rheingau (1791–1950), Geofisica e Meteorologia, 12, 1–11, 1963.
Schübler, G.: Über die Verhältnisse des Weinbaues in Würtemberg [sic!] vom Jahr 1236–1830 und wichtigere sich darauf beziehende Witterungserscheinungen, Stuttgart und Tübingen, Cottasche Buchhandlung, 80 pp., 1831.
Schwander, M., Brönnimann, S., and Delaygue, G.: Reconstruction of Central European daily weather types back to 1763, Int. J. Climatol., 37, 30–44, https://doi.org/10.1002/joc.4974, 2017.
Schweizerisches Idiotikon: Article “Winrechnung” [Wine account settlement] in Idiotikon Bd. 6, Spalte 136, https://digital.idiotikon.ch/idtkn/idmobil.htm#!page/60136/mode/1up (last access: 10 May 2024), 1905.
Sonderegger, S.: Landwirtschaftliche Entwicklung in der spätmittelalterlicher Nordostschweiz, St. Gallen, ISBN 3908048222, 1994.
Staab, J., Seeliger, H. R., and Schleicher, W.: Schloss Johannisberg – Neun Jahrhunderte Weinkultur am Rhein, Woschek, Gütersloh, ISBN 978-3924744359, 2001.
Staatliche Weinbaustation: Das Weinjahr NNNN und seine Ernteergebnisse, Veröffentlichung der Staatlichen Weinbaustation 1966–2020, https://agriculture.public.lu/dam-assets/publications/ivv/archiv/moststat-weinjahr/weinjahr-1967.pdf (lat access: 23 Janiary 2023), 2023.
Statec Luxembourg – Service Central de la Statistique et des Etudes Economiques Luxembourg (Ed.), Statistiques Historiques 1839–1989, Luxembourg, 129–136, https://agriculture.public.lu/dam-assets/publications/ivv/archiv/geschichte/Statistiques-historiques-1839-1989.pdf (last access: 18 September 2023), 1989.
Thur, H.: Weinchronik, in: Briedeler Geschichten 2, Annalen Regesten und Urkundenverzeichnis, Im Selbstverlag, Briedel, 296–306, 2016.
Valler, V., Franke, J., Brugnara, Y., and Brönnimann, S.: An updated global atmospheric paleo-reanalysis covering the last 400 years, Geosci. Data J., 9, 89–107, https://doi.org/10.1002/gdj3.121, 2022.
Valler, V., Franke, J., Brugnara, Y., Samakinwa, E., Hand, R., Lundstad, E., Burgdorf, A.-M., Lipfert, L., Friedman, A. R., and Brönnimann, S.: ModE-RA – a global monthly paleo-reanalysis of the modern era (1421–2008), Sci. Data, 11, 36, https://doi.org/10.1038/s41597-023-02733-8, 2024.
Weinbaustatistik: Weinbaustatistik, 1874–1973, Staatsarchiv Schaffhausen HZ 6036, 1973.
Wein Schatzung: Wein Schatzung, so alle Jahr auff Martiny gemacht wird. Steckborn am Under Seh (1569–1817), Zentralbibliothek Zürich, Zürich, Ms 2091, 1817.
Wetter, O. and Pfister, C.: An underestimated record-breaking event – why summer 1540 was likely warmer than 2003, Clim. Past, 9, 41–56, https://doi.org/10.5194/cp-9-41-2013, 2013.
Weusthoff, T.: Weather type classification at MeteoSwiss: introduction of new automatic classification schemes, Arbeitsberichte der MeteoSchweiz, 235, 46, 2011.
Wildberger, W.: Schaffhauser Martinischlag. Obrigkeitliche Schatzungen von Getreide und Wein auf Martini der Jahre 1466 bis 1895 mit landwirtschaftlich-historischen Nachrichten […] Schaffhausen, Carl Schochs Buchhandlung, https://www.google.ch/books/edition/Schaffhauser_Martinschlag/Hx01AQAAIAAJ?hl=de&gbpv=1&dq=inauthor:"W.+Wildberger"&printsec=frontcover (last access: 10 May 2024), 1896.