the Creative Commons Attribution 4.0 License.
the Creative Commons Attribution 4.0 License.
 | 17 Jan 2024
Climate and disease in historical urban space: evidence from 19th century Poznań, Poland
Jörg Peter Vögele
Marek Brabec
This study examines the relationship between temperature levels and precipitation amounts as explanatory variables for the probability of death due to waterborne and airborne diseases in historical urban space. To date, the literature has not focused on the climatological epidemiology of 19th century Polish urban areas. We used individual mortality data from Poznań parish death registers between 1850 and 1900. Each deceased individual was assigned average monthly temperature values and precipitation amounts in the month of death, LAG1 (1-month-lagged) temperature and LAG1 rainfall, and place of residence. We studied the relationship between weather conditions and mortality using formalized statistical models reflecting the discrete nature of the response data (via multinomial logistic regression). Lagged monthly average temperature levels and lagged monthly average precipitation amounts were better predictors of airborne and waterborne disease mortality than the concurrent (non-lagged) monthly averages. The lagged effects of temperature and precipitation on waterborne and airborne diseases were significant (except for the smooth lagged average monthly temperature effect for airborne diseases). There was also significant spatial heterogeneity (differences among city quarters) in the prevalence of deaths due to waterborne and airborne diseases.
- Article
(1729 KB) - Full-text XML
-
Supplement
(2574 KB) - BibTeX
- EndNote


A large body of literature has evidenced the existence of a relationship between climate or, more precisely, its components, such as temperature and precipitation, and the health status and well-being of humans (e.g. Diaz et al., 2001). The relationship between temperature level and precipitation amounts is observed in correlations between various disease rates, cause-specific death rates, and weather variations on different timescales – over weeks, months, or years. More recently, there has been greater interest in the impact of extreme temperatures (extreme highs and/or extreme lows) on health and risk of death. Healthy people, without comorbidities, have an effective heat regulation system that allows the body to effectively cope with thermal stress. However, in particularly sensitive groups including the elderly, infants, and people with comorbidities of the circulatory system and respiratory system, thermoregulation at extremely high or low temperatures is disturbed (Calleja-Agius et al., 2021). Recent research has shown that 37 % of warm-season heat-related deaths can be attributed to anthropogenic climate change, with increased mortality observed on every continent (Vicedo-Cabrera et al., 2021; Zhao et al., 2022). Prolonged periods of hot days are responsible for the increase in heat-related death rates (e.g. Hajat et al., 2007; D'Ippoliti et al., 2010; Tong et al., 2012; Kent et al., 2014; Chen et al., 2015), especially due to cardiovascular and respiratory diseases (Basu and Samet, 2002; Donaldson et al., 2003; Basu, 2009), mental and nervous system disorders (Stafoggia et al., 2006), diabetes, and kidney and urinary system diseases (Conti et al., 2005; Rey et al., 2007). Studies have also proven a link between extremely high ambient temperature during pregnancy and high prevalence of hypertension, eclampsia, cataracts in infants (Poursafa et al., 2015), perinatal brain injury (Kasdorf and Perlman, 2013), a high prevalence of preterm births (Lajinian et al., 1997; Flouris et al., 2009; Basu et al., 2010; Auger et al., 2014; Ha et al., 2017), and a significant increase in infant mortality (Rooney et al., 1998; Kysely and Kim, 2009; Basagaña et al., 2011; Nitschke et al., 2011). In turn, extremely low temperatures lead to increased incidence of respiratory infections (Alberdi and Díaz, 1997; Huynen et al., 2001; Mäkinen et al., 2009). Excess morbidity and mortality during periods of low temperatures are especially observed in elderly people (Alberdi et al., 1998; Huynen et al., 2001; Ballester et al., 2003).
A link between weather patterns and population health has also been noted in relation to historical times. Research by Åström et al. (2016) showed that mortality decreased over time as a result of improvements in nutritional status, a decline in infant deaths, and positive changes in the course of demographic and epidemiological transition. Also indicated was a broader context for weather factor deterioration: a decrease in agricultural production, which translated into an increase in grain and food prices, in turn reducing the comfort of societies and leading to demographic crises and annual variations in births, marriages, and deaths (Imhof, 1976; Lee, 1981; Galloway, 1985, 1986, 1994; Pfister and Wanner, 2021). The annual seasonal patterns of mortality were thus shaped by climate components, such as temperature or precipitation. Summer surpluses of deaths were usually caused by infectious diseases, especially cholera, dysentery, and typhoid, while in infants, there was a strongly marked summer peak associated with nutritional diarrhoea or other diseases of the digestive system (e.g. Woods et al., 1988, 1989; Landers, 1992; Liczbińska, 2009a, b, 2011, 2015; Vögele, 2010; Budnik and Liczbińska, 2015). Temperature and humidity were also shown to be associated with malaria incidences in historical Europe, for example in Denmark (Ingholt et al., 2022), Sweden (Chen et al., 2021), and Finland (Hulden and Hulden, 2009), or plague (Krauer et al., 2021). In autumn and winter higher frequencies of morbidity were recorded more often than in the warm months of the year due to diseases of the respiratory tract, such as pneumonia and bronchitis, and diseases of the circulatory system. Diseases of these two systems were frequent causes of excess deaths in autumn and winter, until early spring (Landers, 1992; Liczbińska, 2009a, b, 2011, 2015; Budnik and Liczbińska, 2015). Meanwhile, Swedish studies of historical populations (Junkka et al., 2021; Karlsson et al., 2021) have indicated that the impact of environmental factors on human health is highly complex and largely dependent on the specific local context, with many additional, often unknown, contributing determinants of vulnerability.
Although the relationship between climate components, such as temperature, precipitation, humidity, and health status, is well-documented in the literature, this has concerned only contemporary and/or selected populations from the past. There is a gap in such research regarding eastern and central Europe, although such studies are crucial in order to analyse long-term developments often associated with climate change. When it comes to acute infectious diseases, until the end of the 19th century and for the first decades of the 20th century, studies on morbidity and mortality from infectious diseases were limited to elucidating risk and causative factors. The work on the cholera epidemic in the 1850s in relation to ecological conditions in an urban space, conducted by John Snow, is considered to be a starting point for systematic epidemiological research on infectious diseases (Fisman, 2007). Previously, miasmatic theories were prevalent, ascribing outbreaks of cholera and typhoid fever to unspecified germs which came to the surface with rising groundwater (Vögele, 2001). In this context, rainfall was considered to be a major variable. Such theory provided the scientific framework for construction of expensive drainage and sewerage systems in the cities. With the rise of bacteriology towards the end of the 19th century, cholera and typhoid became associated with specific waterborne pathogens and a concrete aetiology. As a consequence, adequate central water supply systems became crucial for municipalities. For historical populations, to the best of our knowledge, there are no studies pointing to the relationship between the risk of death from waterborne and airborne diseases as well as the local weather and climate, as described by temperatures and precipitation patterns. Nor has the literature been focused on the epidemiology of the 19th century Polish urban space in a climatological context.
The present study examines the relationship between temperature values and precipitation rates as explanatory variables and the probability of death due to waterborne and airborne diseases in a historical urban space as responses. We focused on two types of infectious diseases due to their high burden for 19th century populations and the growing evidence from contemporary populations that they are related to climate and weather. We studied the relationship using formalized statistical models reflecting the discrete nature of the response data via multinomial logistic regression.
After the Congress of Vienna in February 1815, the city of Poznań became the capital of the Grand Duchy of Poznań, which was in territorial and administrative terms a part of the Prussian state. The Prussian authorities soon decided to turn the city into a fortress, which inhibited the city's spatial development for many years (Trzeciakowska and Trzeciakowski, 1987; Matusik, 2021). With time, the city started to suffer from the lack of free space and at the end of the 19th century it was ”suffocating” within the surrounding walls. After 1867, the major barriers inhibiting the influx of population from rural areas disappeared as all previously applicable charges for permanent stay registration were abolished, while after 1870, the demand for labour force increased; that is why Poznań became an attractive destination mainly for the population of Greater Poland's rural areas looking for jobs in the city. Due to the lack of space in the overcrowded city centre, the incoming migrants settled mainly on the outskirts (Matusik, 2021). The area of 943 ha was enclosed within the city walls and did not change until the beginning of the 20th century (Kruszka, 2004). In the 1860s, 1870s, and 1890s the city was inhabited by over 53 000, 60 000, and 73 000 people, respectively (Galloway, 2007), which means that within the fortress the density per square kilometre increased with time along with the increase in the population size, and in the years mentioned above it was over 5500, 6300, and 7700 people per square kilometre, respectively. At the beginning of the 20th century the fortress was demolished, the urban area expanded to 3300 ha, and the population increased to over 117 000 people, which resulted in the decline of the population density to 3500 per square kilometre (Kruszka, 2004).
The ecological conditions in Poznań deteriorated increasingly and in parallel with the population increase. High population density and lack of urban infrastructure deteriorated “urban ecology”, and this contributed to frequent epidemics of infectious diseases. Particularly dangerous were epidemics of cholera, repeating in 1831, 1837, 1848, 1852, 1855, and 1866. They caused massive and rapid changes in population numbers within a short period of time (Piankowski, 1987; Liczbińska, 2021). There were also outbreaks of measles (in 1857, 1861, and 1869), scarlet fever (1863 and 1874), and smallpox (1871) (Liczbińska, 2009a, b). In Poznań, in the years when epidemics occurred most often, i.e. in 1850–1874, the infant mortality rate was at the level of 315 per 1000 live births. For comparison, in 1895–1904, after implementation of a water supply system and sewage system, infant mortality declined to 199 per 1000 live births (Supplement Table S1). Life expectancy at birth until the end of 1880s did not exceed 30 years (Table S2).
The first systematic air temperature observations in Greater Poland took place after the creation of a measurement network by the Prussian Meteorological Institute established in Berlin in 1847. The first temperature measurements began in Poznań on 1 January 1848 in meteorological station at 1 Pocztowa Street (Smosarski, 1925; Kolendowicz et al., 2019). In August 1885 the station was located at 2 Zielona Street. Thermometers without a shield were placed at 6.2 m above ground level (a.g.l.). They were not exposed to direct sunlight, but the neighbourhood, which included buildings with several floors, could have significantly reduced the airflow and thus decreased the temporal variance of air temperature. This station operated until the end of 1910 (Kolendowicz et al., 2019). Until 1884, measurements were taken three times a day: at 06:00, 14:00, and 22:00. In December 1884, the hours of observation were changed to 07:00, 14:00, and 21:00. This continued until May 1919. Meteorological observations in Poznań were carried out by professors at the Municipal Real School, and in 1889, meteorological measurements were taken by the Physical Institute of the Royal Academy (Smosarski, 1925). Initially, a Mahlmann rain gauge was used to measure precipitation. After 1880, Osnaghi and then Hellman rain gauges were introduced into precipitation observations. Those rain gauges were placed on poles at 1 m a.g.l. The measurements were taken once a day at 14:00 and after 1885 at 07:00. In the 1890s, a meteorological station also operated in Jeżyce, which at that time was a village near Poznań. The thermometers were set at 9.5 m a.g.l., and the rain gauge was placed in the garden at 1 m a.g.l. Observations were taken three times a day: at 07:00, 14:00, and 21:00 (Smosarski, 1925).
Data on mortality were obtained from parish death registers for the years from 1850 to 1900, deposited in the State Archives in Poznań. Each individual entry contained the date of death (day, month, year), place of residence, and cause of death. Records for the following parishes were used: St. Margaret, St. Mary Magdalene, Holy Cross, and St. Martin. For the analysis, 35 005 individual entries containing the cause of death recorded were used. The specific causes of death were categorized as follows: (1) waterborne diseases (WBDs) including cholera, typhoid fever, dysentery, and diarrhoea; (2) airborne diseases (ABDs) including measles, smallpox, whooping cough, diphtheria, croup, influenza, measles, scarlet fever, and rashes; (3) other causes of death (diseases of the circulatory, excretory, and nervous systems not related to waterborne and airborne diseases). Therefore, we can consider the three-cause exhaustive death classification to be an instance of multinomial distribution. For each deceased person, the following meteorological data were assigned: the average monthly temperatures in the month of death and in the month preceding the month of death (LAG1, or 1-month-lagged temperature), as well as the average rainfall in the month of death and the month preceding the month of death (LAG1 rainfall). The data on temperatures and precipitation for Poznań for the years 1850–1900 were taken from the monograph by Władysław Smosarski: Temperature and precipitation in Greater Poland, published in 1925 by the Ministry of Religious Affairs and Public Education in Poznań. Five quarters were distinguished within the fortification ring (1–5) (Fig. 1). Quarters 1–4 included the area on the left bank of the Warta River, while quarter 5 encompassed the streets on the right bank of the Warta River (Piankowski, 1987). To each individual deceased person, a quarter identification (quarter number) was assigned based on their address.
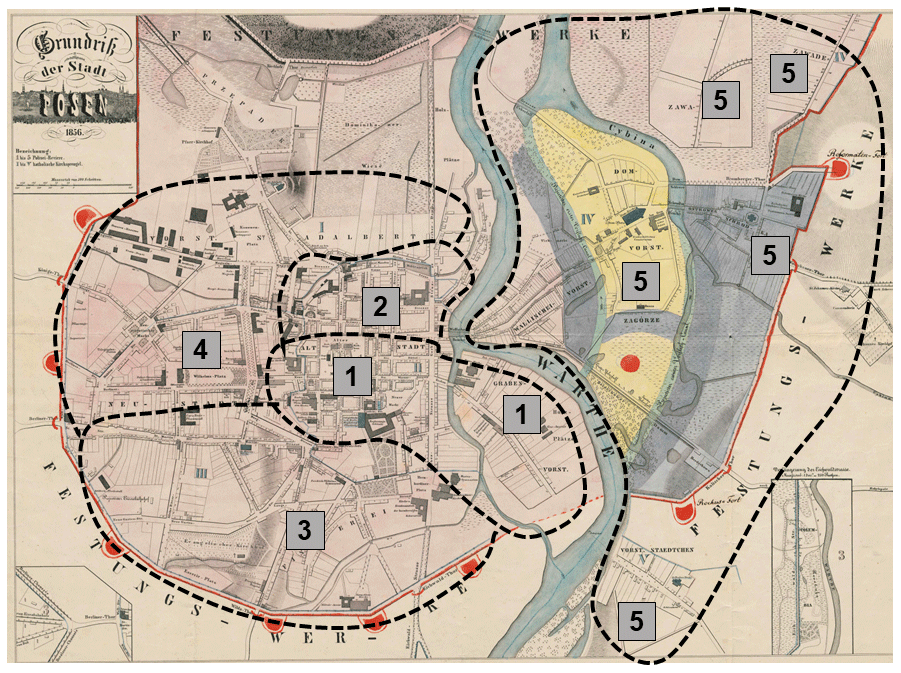
Figure 1City of Poznań divided into five quarters. Map produced by Grażyna Liczbińska based on data collected while authoring the paper and the map Grundriss der Stadt Posen (1856).
All analyses were based on multinomial logistic regression (Hosmer and Lemeshow, 2000; Harrell, 2015). We modelled the probabilities of death due to waterborne diseases (WBDs), airborne diseases (ABDs), and other causes of death as a function of several covariates simultaneously. Modelling in the multinomial logistic regression was conducted with a flexible GAM (generalized additive model; Hastie and Tibshirani, 1990; Wood, 2017) approach, which made it possible to capture both parametric (e.g. linear) and general smooth effects (e.g. penalized-spline-implemented curves). We explored various models and came up with a model structure where the probability of death depended on the year in which it occurred (allowing for flexible, smooth, and nonparametric annual trends – as we did not have any a priori information about the shape of the trends as mathematical functions), 1-month-lagged average temperature values and 1-month-lagged precipitation amount. It is interesting to note that the 1-month-lagged models for both temperature and precipitation patterns were always better (in terms of AIC, the Akaike information criterion; Burnham and Anderson, 2002) than non-lagged models, so we used the lagged version. The covariate effects can be different for different categories of causes of death (model allows for cause-specific actions of a concrete covariate). For well-known identifiability reasons (Hosmer and Lemeshow, 2000), the multinomial model of the three possible response categories (waterborne diseases, airborne diseases, other causes of death) in fact has two dimensions and not three, as this third category constitutes a baseline. We therefore chose “the other causes of death” category as the baseline. We fitted two modifications of the model – one non-spatial or purely temporal (without distinguishing different city quarters) and the other spatial–temporal (allowing for varying incidence among quarters). As a sensitivity check, the quarter model was then implemented in two ways – as a GMRF (Gaussian Markov random field; Rue and Held, 2005) and in the fixed quarter effects version. Since the results of the two were very similar, we preferred the simpler fixed-effects quarter version and only present its results here. The models were fitted in R (R Core Team, 2023) using the mgcv package (Wood, 2017). They were implemented with complexity-penalized splines for smooth components (Harrell, 2015; Wood, 2017), estimated via penalized likelihood with penalization constants being held at their REML (restricted maximum likelihood; Harville, 1977; Wood et al., 2016) estimates.
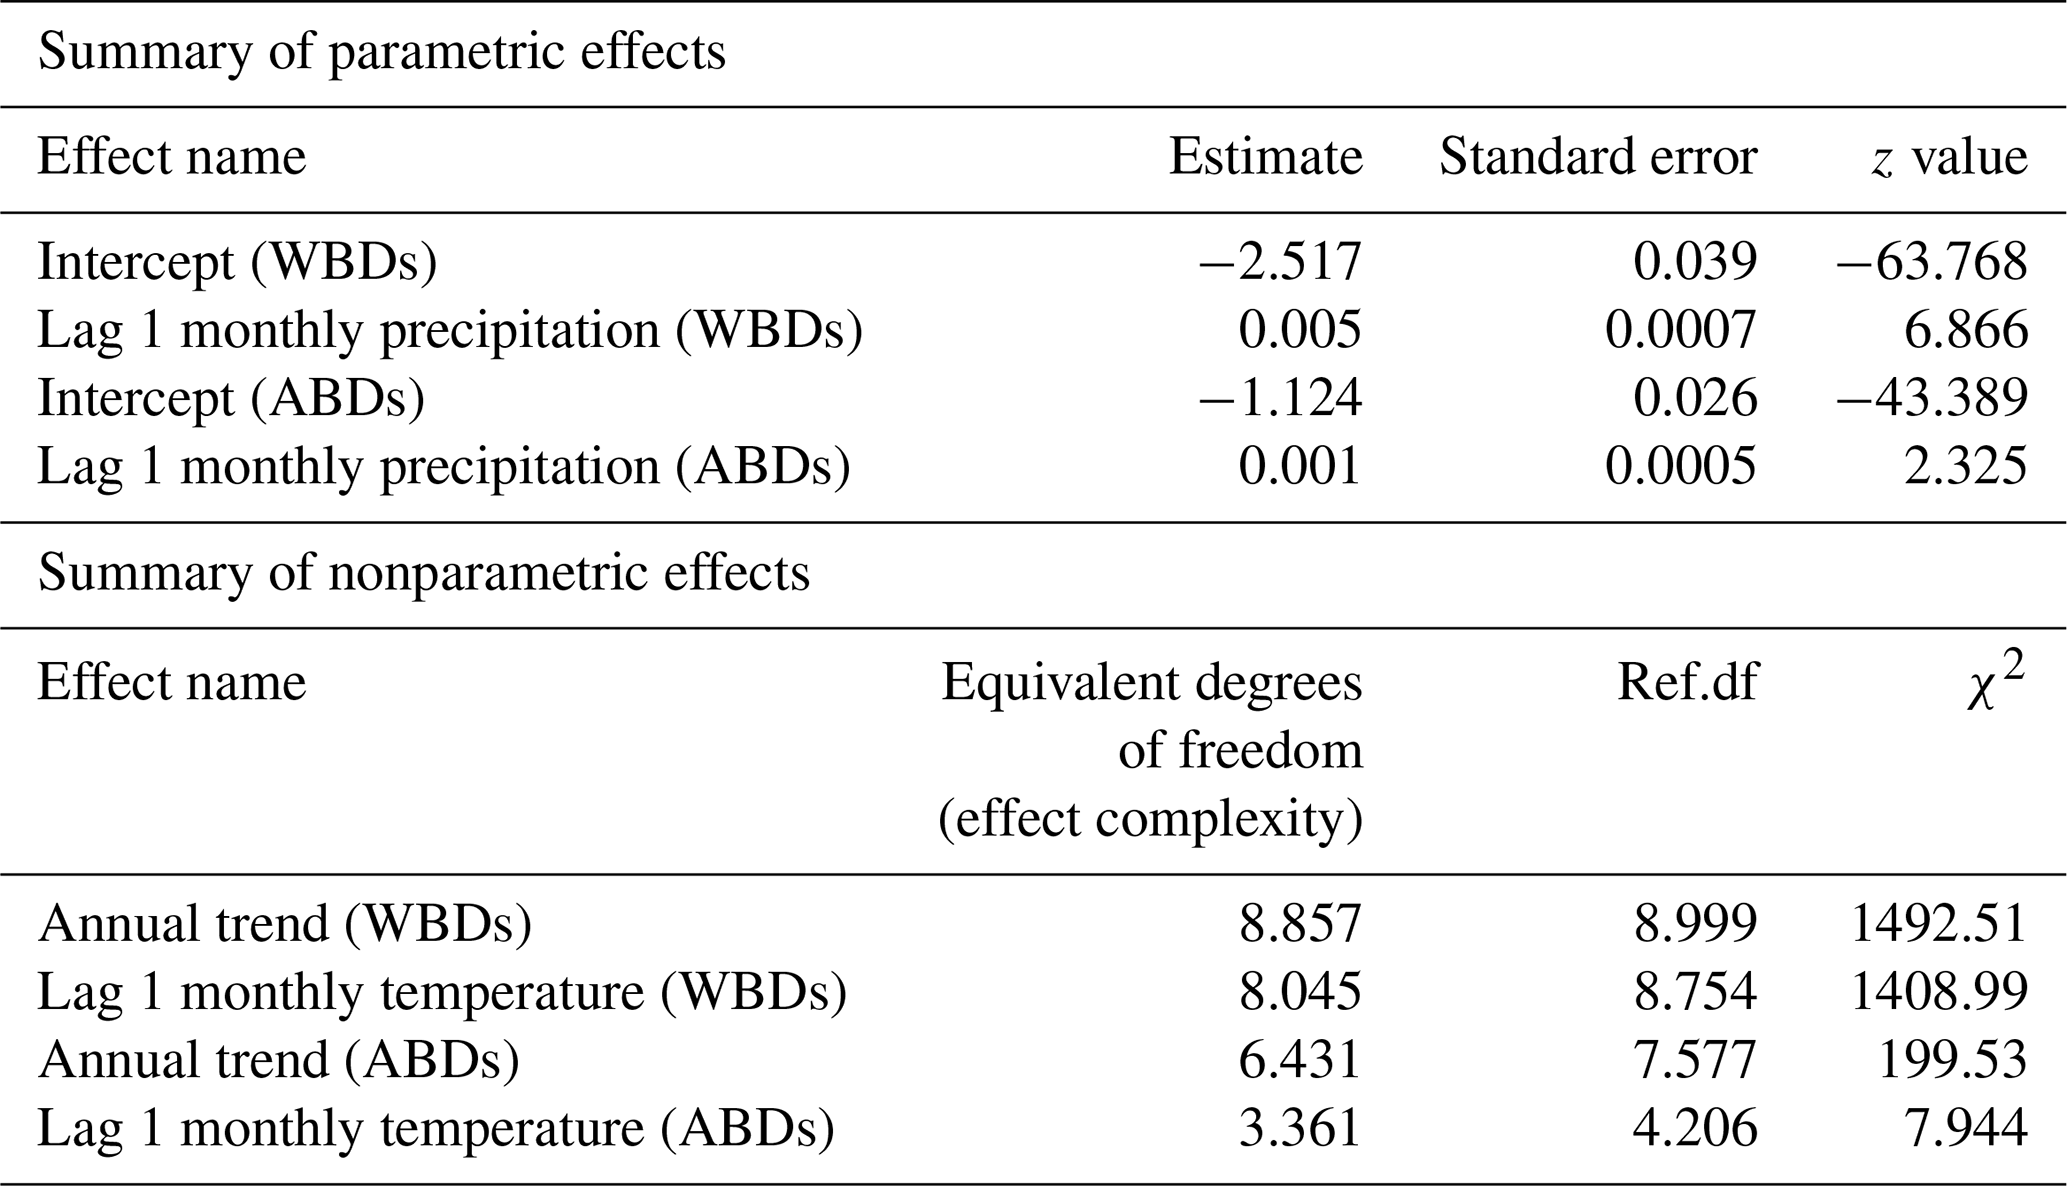
6.1 Precipitation and temperature effects on the probability of deaths from waterborne and airborne diseases
The detailed parametric and nonparametric effects for monthly precipitation amounts and temperature levels on the probability of deaths due to waterborne diseases and airborne diseases are summarized in Table 1. All effects in the model are significant, except for the smooth lagged average monthly temperature effect for airborne diseases (AIC = 7899 for the 1-month-lagged model and AIC = 8479 for non-lagged model). The growing lagged precipitation rates increased the probability of death both from waterborne and airborne deceases. The lagged monthly average precipitation effect was much greater for deaths from waterborne diseases than for deaths from airborne ones. The smooth effect of lagged monthly average temperature value was larger for deaths due to waterborne diseases than deaths caused by airborne diseases. Similarly, the annual trends were more significant for waterborne diseases than for airborne diseases. The results from the purely temporal model are presented in Figs. 2–3. Note that the lagged average temperature effect was larger for waterborne diseases and of a different shape than for airborne diseases (Figs. 4–5). For waterborne diseases the increased overall effect occurred much faster in higher temperatures (approximately above 15 ∘C) than in lower (colder) ones (Fig. 4). In low temperatures, the probability of deaths from waterborne diseases was the lowest in the lowest temperatures (Fig. 4). Many epidemiological studies of contemporary populations from different regions of the world have shown that precipitation and temperature are major environmental factors linked to the prevalence of waterborne diseases (e.g. Singh et al., 2001; Hashizume et al., 2008; Drayna et al., 2010; Eisenberg et al., 2013; Carlton et al., 2014; Chowdhury et al., 2018; Levy et al., 2018; Deshpande et al., 2020). High temperatures and humidity favour multiplication and survival of waterborne pathogens and their vectors (Singh et al., 2001; Semenza and Menne, 2009; Drayna et al., 2010; Carlton et al., 2014, 2016). Periods of heavy rainfall are also related to the prevalence of waterborne diseases by increasing the likelihood of water contamination from sewage (Moors et al., 2013). They flush faecal material into waterways and into surface drinking water and enhance the multiplication of intestinal pathogens. Heavy rains increase hydrologic transport-driven iron availability in environmental waters, leading to increased microbial growth (Faruque et al., 2005); they can flush accumulated pathogens into surface water directly through runoff and indirectly through the mobilization of bacteria in soil (Carlton et al., 2014). The lags after rainfall and temperature measurements for waterborne diseases, as obtained for 19th century Poznań, have also been observed in contemporary populations, for example in Hong Kong (Wang et al., 2018), the United States (Drayna et al., 2010), and New Zealand (Lai et al., 2020). This phenomenon could be related to the incubation periods of waterborne pathogens, which vary in length in various types of pathogens.
Table 1Parametric and nonparametric effects for monthly precipitation amounts and temperature levels on probability of death due to waterborne diseases (WBDs) and airborne diseases (ABDs).
The incubation period of Vibrio cholerae is 1–5 d (Azman et al., 2013; Eisenberg et al., 2013). For other diarrhoea-causing pathogens, mainly rotavirus and pathogenic Escherichia coli, the incubation period is usually around 1week (Eisenberg et al., 2003), while lags reported in cholera endemic settings range from several weeks to 2 months (Hashizume et al., 2008, 2010). Bacillary dysentery symptoms begin within 2 to 10 d of infection, whereas amoebiasis starts more gradually and usually lasts about 2 weeks (Infectious Intestinal Disease, 2012). Meanwhile, Salmonella typhi and Salmonella paratyphi incubate between 1 and 3 weeks (Infectious Intestinal Disease, 2012). A similar maximum three-week incubation period was seen for Listeria monocytogenes (Infectious Intestinal Disease, 2012). In 19th century Poznań longer lags in the effects of temperature and precipitation for waterborne diseases might have been caused by the accumulation of bio-organic materials at the bottoms of the water reservoirs, transport driven by rainfall from discharged sewage, and then decay under high ambient and water temperature. Delayed effects of measured temperatures and precipitation for waterborne diseases could have also been caused by plankton blooms trigged by nutrients driven into the waters with heavy rains. The city was in a network of three rivers with plankton blooms from the spring through summer months until autumn. Biological material stayed at the bottoms of the rivers until autumn, when the temperature was still high (Kaniecki, 2004). The annual sanitary reports on water cleanliness in the Warta River highlighted contamination by such substances as nitric acid, chlorine, ammonia, and hydrogen sulfide. This did not prevent people from using water from the river for consumption (Kaniecki, 2004). Poznań at that time suffered from poor sanitation conditions and lack of access to clean water. Heavy rains contaminated surface and groundwater with sewage, which was then used by Poznań inhabitants for drinking, cooking, and washing clothes. The sanitary infrastructure was practically nonexistent until the end of the 19th century, thus favouring the spread of infections with urban sewage. Water was drawn from shallow wells which were often polluted with harmful sewage discharged directly to the moats. There were also street gutters with ineffective drainage full of still, contaminated water during the summer heat periods (Kaniecki, 2004; Liczbińska, 2011). The sewage system was opened in 1896 (Kaniecki, 2004). This was very late compared with other European cities, such as Hamburg (1842), London (1850s), Paris (1850s), Leipzig (1860), Frankfurt (1867), Zurich (1867), and Prague (1868) (Kappner, 2019). A modern water supply system was only completed in 1866. Meanwhile, Paris had tap water supply since 1802, London since 1808, and Berlin since the 1850s (Kappner, 2019). In Poznań it was systematically developed with the increase in the number of inhabitants and dwellings; between 1889 and 1913, it extended from 29 to 176 km (Sobczak, 1979). Unfortunately, it was of little significance when compared with Berlin, where the water supply network at that time was of 661 246 m (Vögele, 1998), and by 1892, 100 % of Berlin's lots were provided with tap water (Kappner, 2019).
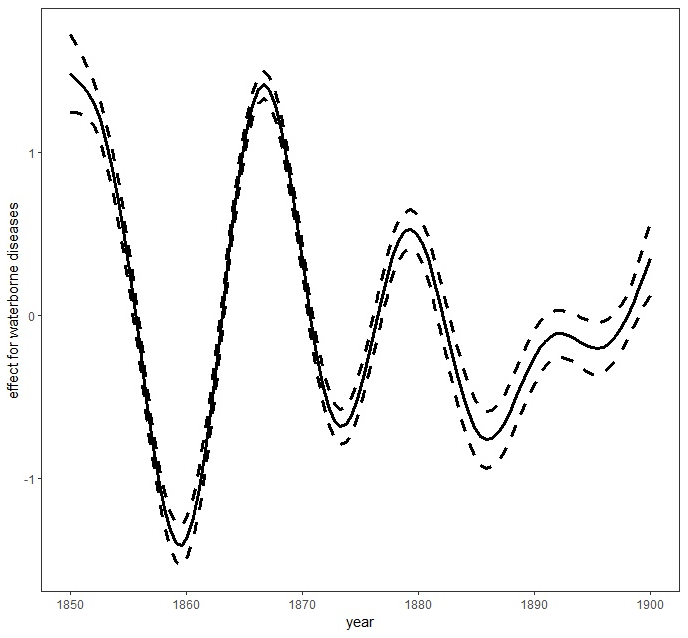
Figure 2Smooth trends (smooth curves and their 95 % asymptotic pointwise confidence limits) for waterborne diseases. Figure produced by Marek Brabec based on data collected for the project supported by the National Science Centre, Poland, under a grant entitled “Cholera epidemic in 1866 as a turning point in the history of Poznań” (no. UMO-2021/41/B/HS3/00594).
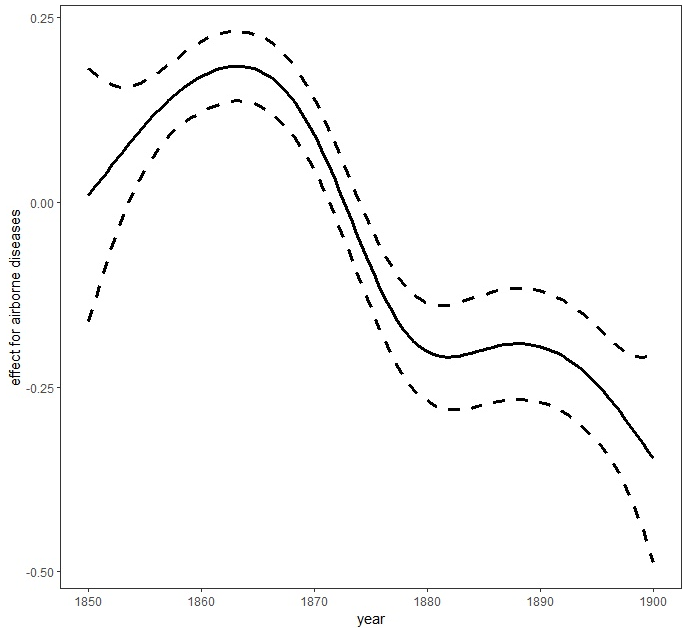
Figure 3Smooth trends (smooth curves and their 95 % asymptotic pointwise confidence limits) for airborne diseases. Figure produced by Marek Brabec based on data collected for the project supported by the National Science Centre, Poland, under a grant entitled “Cholera epidemic in 1866 as a turning point in the history of Poznań” (no. UMO-2021/41/B/HS3/00594).
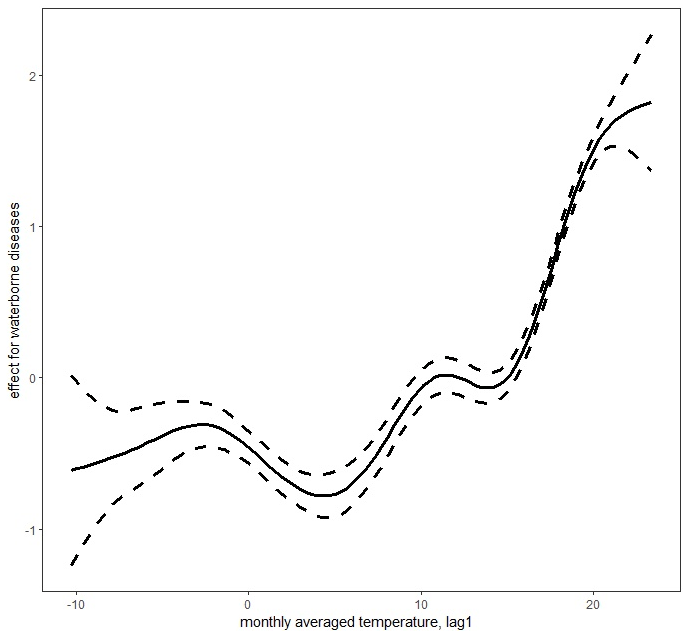
Figure 4Lagged mean temperature effect for waterborne diseases. Figure produced by Marek Brabec based on data collected for the project supported by the National Science Centre, Poland, under a grant entitled “Cholera epidemic in 1866 as a turning point in the history of Poznań” (no. UMO-2021/41/B/HS3/00594).
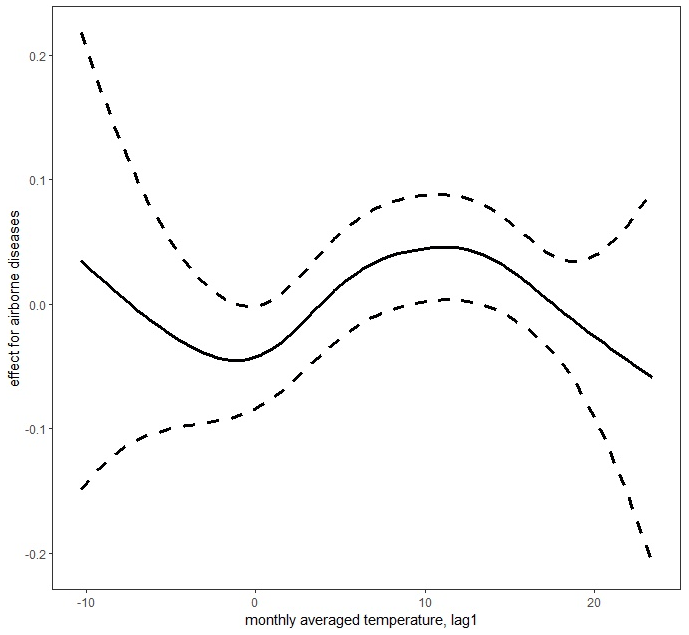
Figure 5Lagged mean temperature effect for airborne diseases. Figure produced by Marek Brabec based on data collected for the project supported by the National Science Centre, Poland, under a grant entitled “Cholera epidemic in 1866 as a turning point in the history of Poznań” (no. UMO-2021/41/B/HS3/00594).
In the case of airborne diseases, our research showed the temperature effects to be non-monotonic: both increasing and decreasing (Fig. 5). The highest probability of death was noted at middle temperatures (local maximum of the effect curve at around 12 ∘C – when the temperatures are neither too low nor too high, mostly in fall and spring). Then the probability showed a decrease as the temperature increased. When the temperature decreased from 12 ∘C, the probability of deaths due to airborne disease first decreased (to a local minimum around the freezing point). With a further decrease in temperature, the airborne disease probability tended to increase, but since there were not sufficient data with very low temperatures (there were not as many extraordinarily cold years), the super-cold temperature effect had to be estimated with a very high level of uncertainty (very wide 95 % confidence intervals about the estimate) to be safely interpretable. This is probably due to the wide temperature spectrum necessary for survival of airborne disease agents. Tang (2009) has suggested that bacteria within the same structural classification (e.g. Gram-negative) may vary in how they respond to temperature and humidity. The research of Harper (1961) showed that low temperatures of 7–8 ∘C were optimal for airborne influenza survival. This was corroborated by Lowen et al. (2007), who proved that influenza was most readily transmitted through the air in cold and dry conditions. Other studies have shown that temperatures above about 24 ∘C appear to reduce the survival of airborne bacteria (Tang, 2009). This has been confirmed in Gram-negative, Gram-positive, and intracellular bacteria such as Pseudomonas (Handley and Webster, 1995), Salmonella (Dinter and Muller, 1988), Serratia (Ehrlich et al., 1970), Escherichia (Wathes et al., 1986), Bacillus (Ehrlich et al., 1970), Bordetella (Stehmann et al., 1992), and Chlamydia (Theunissen et al., 1993). Regarding fungi, which are also airborne disease agents, studies have confirmed their pathogenic relationship with high temperatures and humidity and also with low winter temperatures and dry air (Oliveira et al., 2005). Airborne agents, such as viruses, bacteria, or fungi, are transmitted as small particles suspended in the air through breathing, talking, coughing, sneezing, or raising dust (Božič and Kandič, 2021). The dynamics of their survival and spread are influenced by the ambient temperature and humidity and favoured more by population density than sanitary and epidemiological factors. Hence, lagged effects of average temperatures for airborne diseases were smaller than for waterborne diseases. Moreover, many airborne agents, such as viruses causing influenza, have a relatively short infectivity timescale, which resulted in a very short lag. For example, the incubation period for influenza is typically 1–4 d (Belshan at al., 2014).
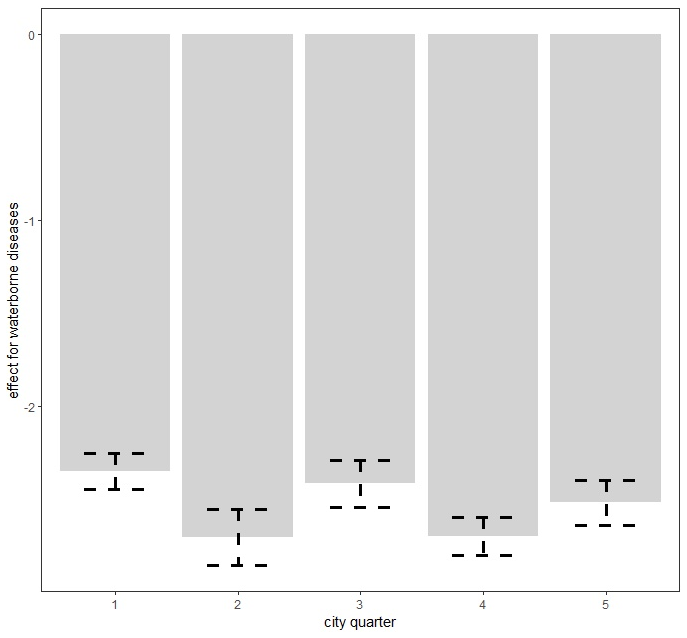
Figure 6Spatially varying probability of death due to waterborne diseases in Poznań quarters. Figure produced by Marek Brabec based on data collected for the project supported by the National Science Centre, Poland, under a grant entitled “Cholera epidemic in 1866 as a turning point in the history of Poznań” (no. UMO-2021/41/B/HS3/00594).
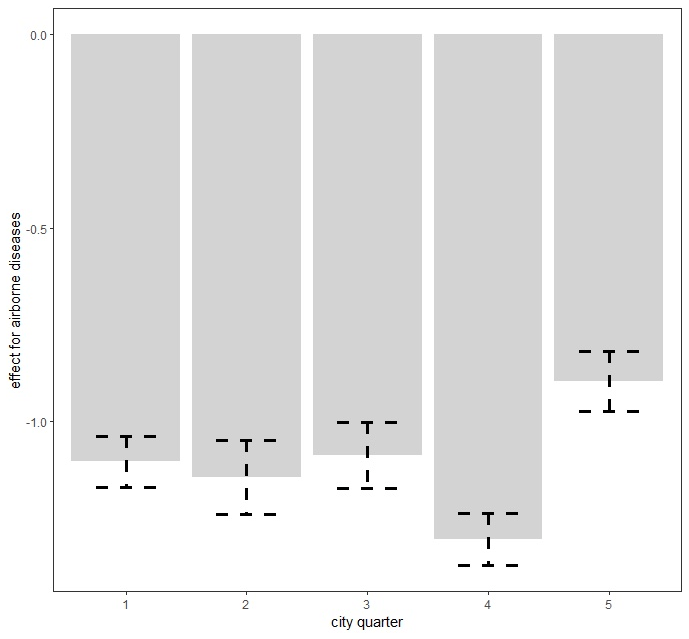
Figure 7Spatially varying probability of death due to airborne diseases in Poznań quarters. Figure produced by Marek Brabec based on data collected for the project supported by the National Science Centre, Poland, under a grant entitled “Cholera epidemic in 1866 as a turning point in the history of Poznań” (no. UMO-2021/41/B/HS3/00594).
Table 2Parametric and nonparametric effects for monthly precipitation amounts, temperature levels, and city quarters on probability of death due to waterborne diseases (WBDs) and airborne diseases (ABDs).
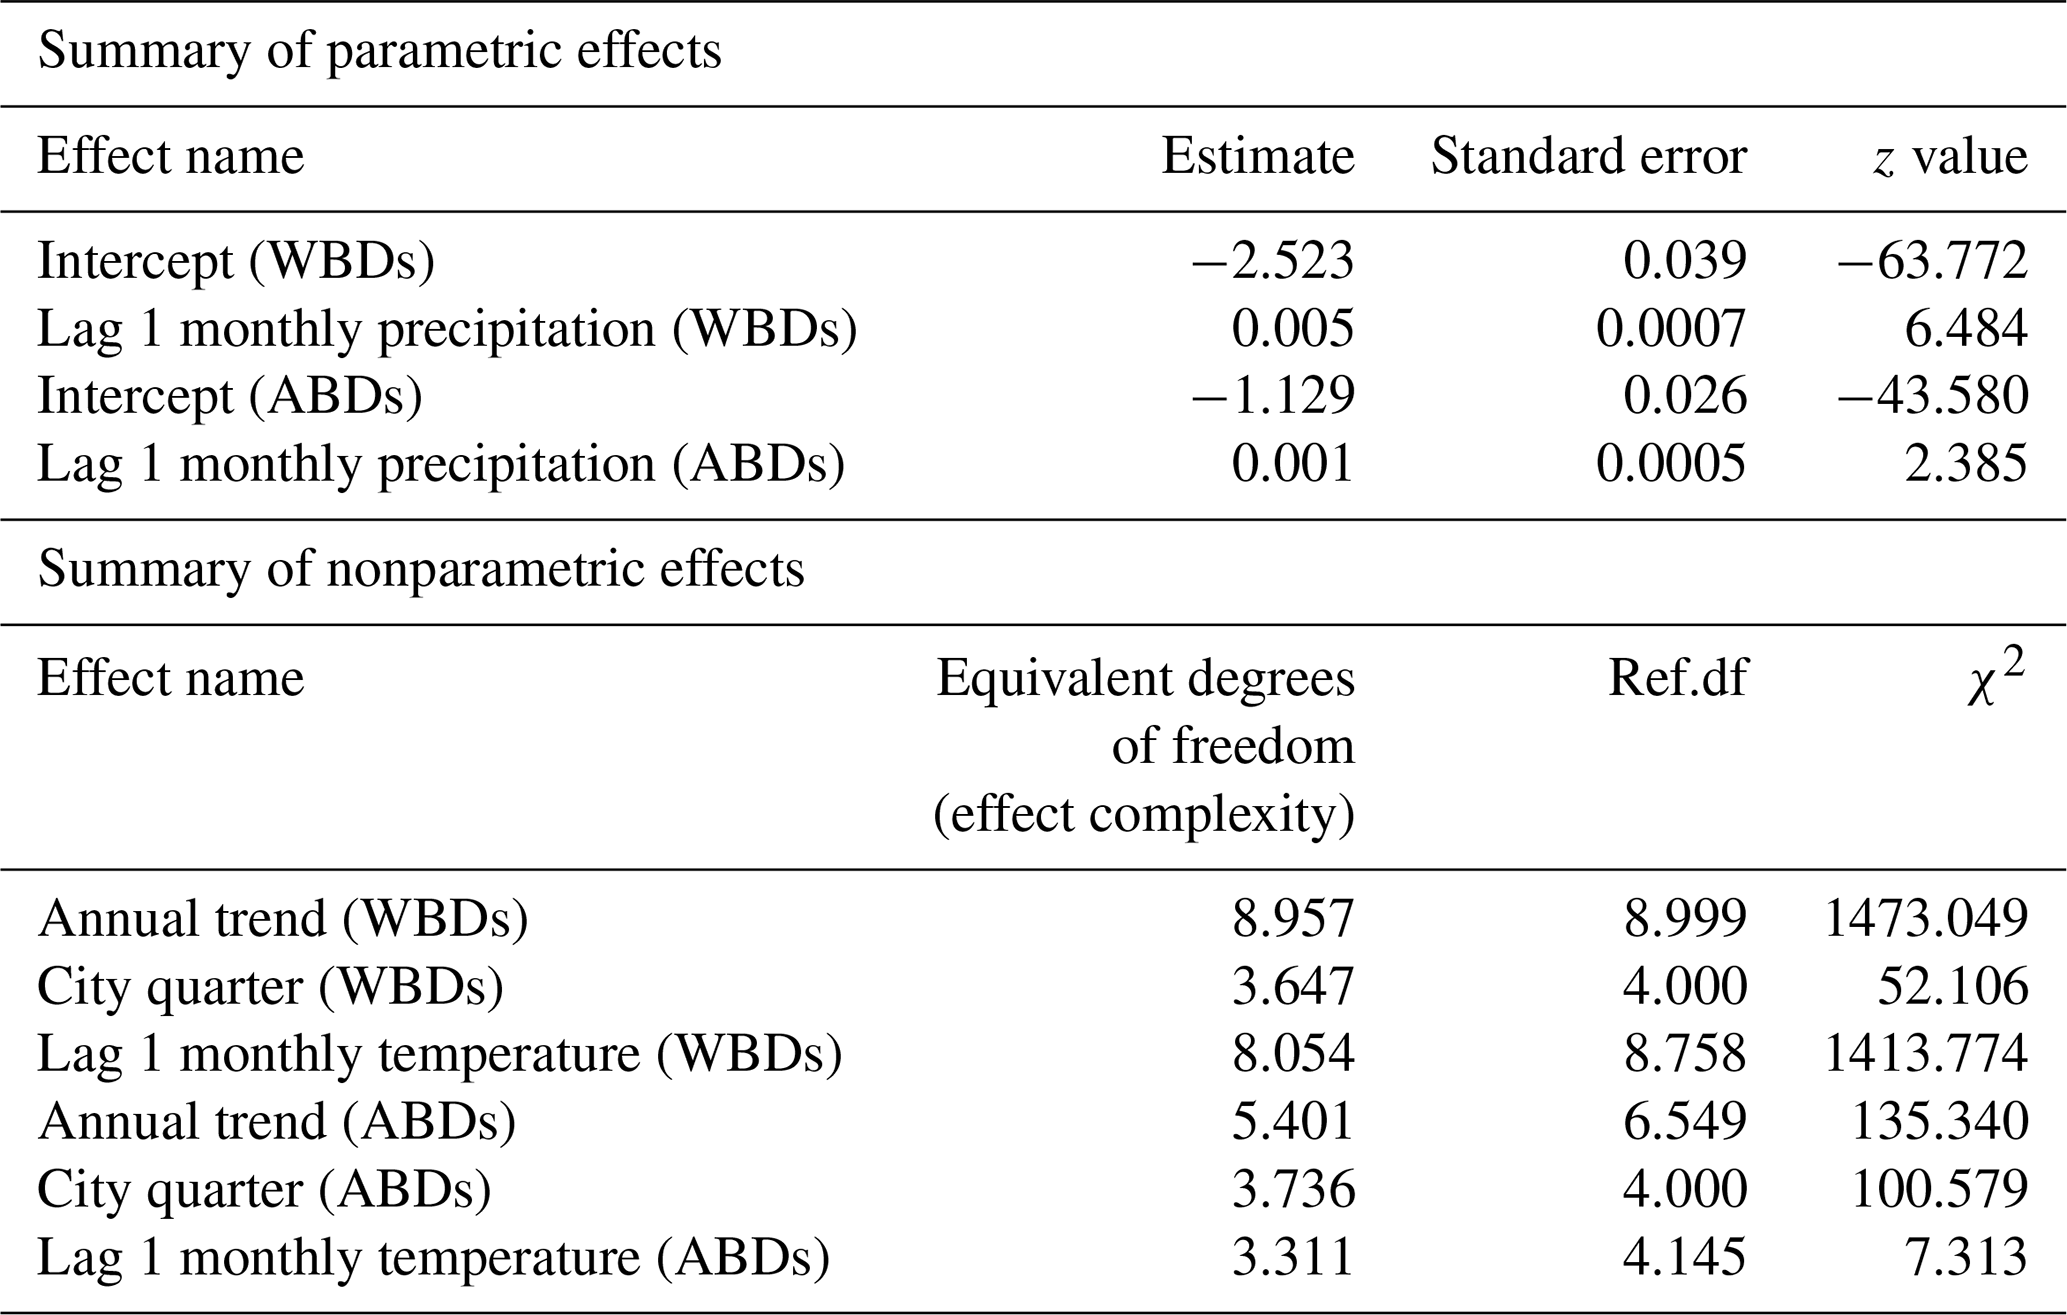
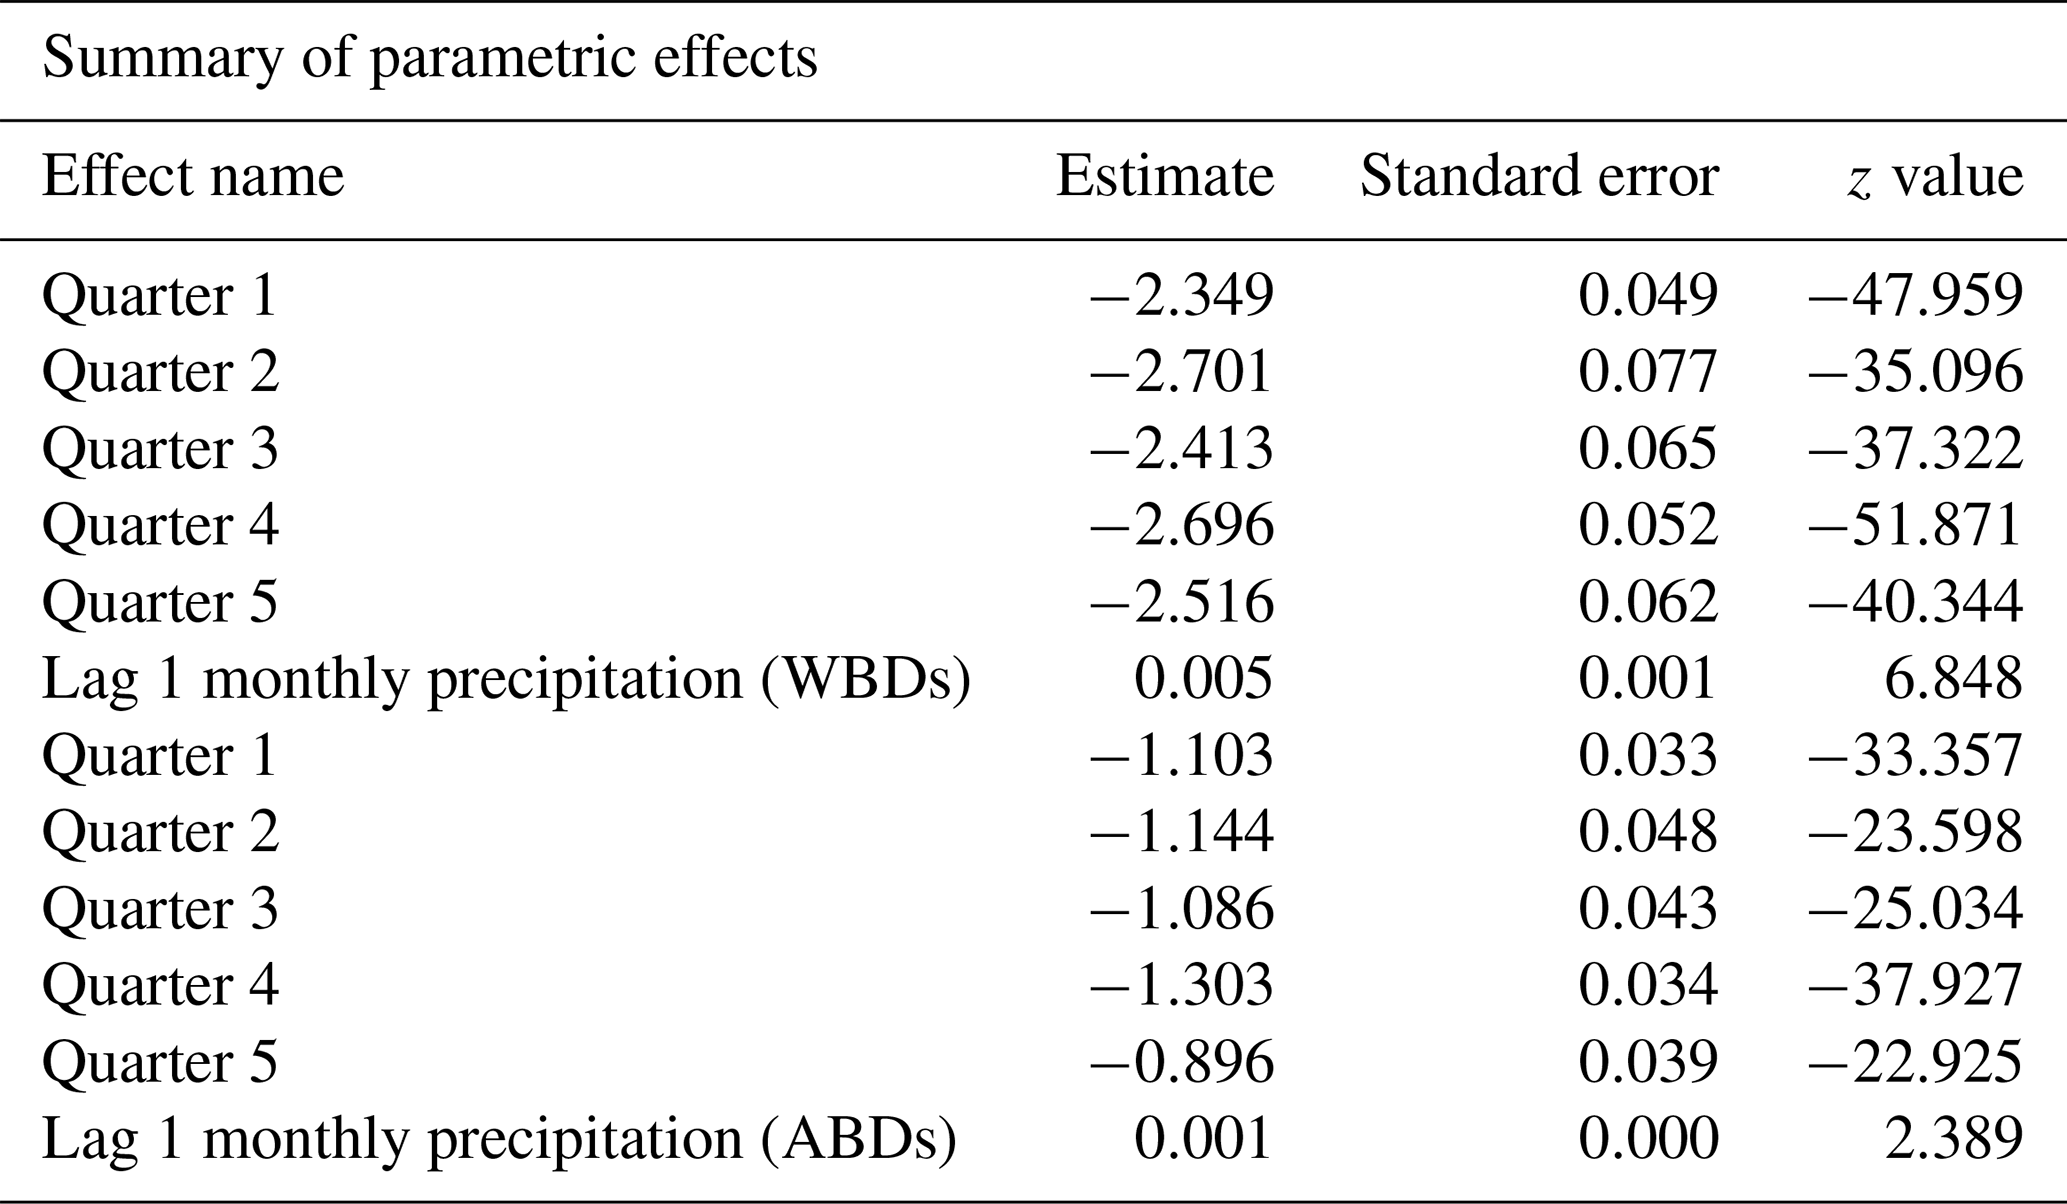
Table 3Parametric coefficients for city quarters and monthly precipitation amounts on probability of death due to waterborne diseases (WBDs) and airborne diseases (ABDs).
6.2 Spatial (quarter) differences in the probability of deaths from waterborne and airborne diseases
The area of the city of Poznań enclosed within its fortress walls was divided into five quarters superintended by five police stations (Piankowski, 1987). Quarters 1–4 were located on the left bank of the Warta River, while quarter 5 was on the right bank (Fig. 1). The quarters differed in terms of the number of inhabitants and their social and economic composition, infrastructure, and hygienic conditions. It is for this reason that we decided to introduce the city quarters into the model. The results are presented in Table 2. The effects of average precipitation amounts and temperature levels on the probability of death due to waterborne and airborne diseases were significant, except for lagged monthly average temperature effect upon airborne diseases. This model suggested that there were substantial differences in mortality rates due to waterborne and airborne diseases in different quarters. Parametric coefficients for monthly rainfall rates and direct effects of city quarters on the probability of deaths due to waterborne diseases (WBDs) and airborne diseases (ABDs) are demonstrated in Table 3. All effects were statistically significant. The smooth and lagged effects were very similar to those from the previous models (Figs. 2–5) and are therefore not presented graphically here. Figure 6 demonstrates spatially varying probability of death due to waterborne diseases in the five city quarters. In quarter 1 the probability of deaths caused by waterborne diseases was higher than in quarter 2, while in quarter 3 it was higher than in quarter 4. We should recall once again that in 1850 Poznań had over 44 000 inhabitants, which 10 years later had increased to 50 000, then over 60 000 in the 1870s and 1880s, and at the end of the century – over 73 000 (Galloway, 2007). In the area, which had not changed size since the construction of the fortress, the population density increased with population number so that at the end of the 19th century there were over 7700 persons per square kilometre (Kruszka, 2004). Such overcrowded space presented a considerable epidemiological problem related to the lack of sanitary infrastructure and clean water supply. A street was at the same time a gutter, and every water reservoir became a source for drinking water. Since underground waters were shallow, they were heavily contaminated by leaks from cesspits and sewers. Waste was poured onto the streets or courtyards, from where it flowed down the sewers to the wells. This continued up until the mid-19th century, when water was drawn mainly from the rivers, shallow wells, sources located near the cemeteries, and shallow ditches supplied with water from ponds. The first wooden waterworks were built in 1847. These drew water from the spring in Winiary and distributed it to the wells in Świętokrzyski Square, Bernardyński Square, and the suburb of St. Adalbert. The total length of that aqueduct was 2.5 km, which was insufficient for the supply of clean water to all inhabitants (Kaniecki, 2004). According to data collected by the police heads during the cholera epidemic in 1866, quarters 1, 2, 3, and 4 were inhabited by 8513, 8631, 11095, and 9194 people, respectively, while quarter 5 was inhabited by 7706 people (Polizeipräsidium Posen 5676, 1866–1868). Quarters 1, 2, and 5 were located in the neighbourhood of the Warta River, which for the many inhabitants could potentially have been a source of drinking water. The highest probability of death due to waterborne diseases was observed in quarters 1 and 5, as well as, to our surprise, in quarter 3. The Market Square area and neighbouring streets (a part of quarter 1) were the only places in the city with access to potable water. This was related to the fact that in the 16th century the fountains with fresh spring water supplied by pipelines from outside the city were built there. The rest of Poznań's inhabitants used polluted water sources located in the vicinity of their houses (Kaniecki, 2004). Moreover, the surplus of deaths from waterborne diseases in quarter 1 and quarter 3 was related to the presence of hospitals in those quarters. The first was established in the 1820s in the former Bernardine Convent (in quarter 1), and the second was the city hospital on Szkolna Street, opened in 1854 (in quarter 3) (Kaniecki, 2004). At that time hospitals were unsanitary and overcrowded, which, in times of epidemics, made them rather more “places of dying” than “places of recovery”. In quarter 5, which at that time included the most dilapidated districts of Chwaliszewo, Śródka, Zagórze, Zawady, and Ostrówek and was inhabited by the poorest part of Poznań society, drinking water was taken straight from the rivers, moats, and ponds (Kaniecki, 2004). The cholera-specific mortality rates in 1866 for quarters 1, 2, 3, and 4 were two to three deaths per 100 people, while for quarter 5 the rate was six deaths per 100 people (Piankowski, 1987). This example of the 1866 cholera epidemic shows that despite quarter 5 having the lowest population size compared to the other quarters, the higher mortality in this quarter can be attributed to the lack of drinking water supplies, the very low levels of population hygiene, and no (systematized) isolation of ill people and carriers. The spatially varying probability of death due to airborne diseases in Poznań is presented in Fig. 7: its level was highest in quarter 5. Just as the mortality from waterborne diseases is dependent mainly on the level of hygiene, the mortality from airborne diseases is influenced by a number of other factors, including housing and working conditions, standard of living, and nutrition, but also individual characteristics of the immune system (Liczbińska, 2009a). The standard of living in quarter 5 might well have been the lowest of all. This district was inhabited by the poorest social strata: small craftsmen and labourers, whose wages did not reach the minimum subsistence level (Liczbińska, 2015). These inhabitants earned 500 to 600 marks per year on average, most of which was spent on rent, with the rent for one room being 40 %–56 % of the salary of the lowest earners even up to the beginning of the 20th century. After paying their rent, a labourer had less than 1 mark per day to support the whole family (Łuczak, 1965). The workday in the overcrowded industrial plants became increasingly longer and working conditions deteriorated. In many craft workshops, the 12 h workday was often extended to 16 h (Liczbińska, 2015). In 1900, nearly 45 % of the Poznań population still lived in one-room dwellings, which were often cramped, damp, and unheated, with the single room sometimes being shared by 5 to 12 people (Liczbińska, 2015). These overcrowded places likely facilitated the spread of airborne agents and led to the increase in morbidity from respiratory diseases, especially in the autumn and winter. The poor health conditions of labourers were further exacerbated by malnutrition affecting their immune systems (Wu et al., 2019; Munteanu and Schwartz, 2022). Quarters 1–4, on the other hand, were inhabited by the wealthier part of Poznań society: artisans of various trades, including shoemakers, tailors, bricklayers, and carpenters, and a more professional group represented by the owners of taverns, restaurants, wine bars, and beer halls located in the Market Square. Those comprising the intelligentsia (doctors, teachers, officials, etc.) and merchants also resided in quarters 1–4 (Trzeciakowska and Trzeciakowski, 1987; Matusik, 2021).
Individual demographic data on causes of death have been shown to provide deep insight into the relationship between mortality and its various climatic, ecological, and social determinants. The extensive body of literature has highlighted that poor urban ecology in 19th century populations was related to the lack of sewage systems and clean water intakes as the main factors responsible for death surpluses. Furthermore, studying the impact of meteorological phenomena on infectious diseases in past populations is of key importance in understanding their health status and adaptation to environmental conditions. In our study, using monthly average temperature values and precipitation rates, we demonstrated the influence of climate on the probability of death from infectious diseases. We pointed out the complexity of the relationship of precipitation rates and air temperatures with waterborne and airborne diseases in city districts that differed in hygiene and standards of living. Our findings underline the need to account for climatic factors when evaluating the probability of death due to infectious diseases in urban spaces. Further research is required to uncover to what extent socioeconomic and biophysical factors can modify climate–disease relationships. While the burden of infectious diseases has been in decline since the second half of the 19th century as a result of improved hygiene, medical advances, and improved quality of life, the effects of climate change may have slowed progress in reducing the impact of these diseases.
Collection of the data on mortality was supported by the National Science Centre, Poland, under a grant entitled “Cholera epidemic in 1866 as a turning point in the history of Poznań” (no. UMO-2021/41/B/HS3/00594).
Data on temperatures were drawn from the monograph of Władysław Smosarski (Temperature and precipitation in Greater Poland), published in 1925 by the Ministry of Religious Affairs and Public Education in Poznań.
Data appear in the Supplement to this paper. The dataset used in this study is available at https://doi.org/10.17632/zzxsm52dwz.1 (Liczbińska, 2024).
The supplement related to this article is available online at: https://doi.org/10.5194/cp-20-137-2024-supplement.
GL, MB, and JPV designed the study. MB provided the statistical analysis and prepared Figs. 2–7. GL provided cartographical Fig. 1 and the biological context. GL and JPV provided the historical analysis and context. All authors discussed the methods and results and provided comments on the paper.
The contact author has declared that none of the authors has any competing interests.
Publisher's note: Copernicus Publications remains neutral with regard to jurisdictional claims made in the text, published maps, institutional affiliations, or any other geographical representation in this paper. While Copernicus Publications makes every effort to include appropriate place names, the final responsibility lies with the authors.
Our thanks are due to colleagues from the State Archives in Poznań for the suggestions that we received while working on this article.
This work was supported by the National Science Centre, Poland, under a grant entitled “Cholera epidemic in 1866 as a turning point in the history of Poznań” (no. UMO-2021/41/B/HS3/00594).
This paper was edited by Hans Linderholm and reviewed by Fredrik Charpentier Ljungqvist and one anonymous referee.
Alberdi, J. C. and Díaz, J.: Modelización de la mortalidad diaria en la Comunidad de Madrid (1986–1991), Gac. Sanit., 11, 9–15, 1997.
Alberdi, J. C., Díaz, J., Montero, J. C., and Mirón, I. J.: Daily mortality in Madrid community 1986–1992: relationship with meteorological variables, Eur. J. Epidemiol., 14, 571–578, https://doi.org/10.1023/a:1007498305075, 1998.
Åström, D. O., Edvinsson, S., Hondula, D., Rocklöv, J., and Schumann, B.: On the association between weather variability and total and cause-specific mortality before and during industrialization in Sweden, Demographic Res., 35, 991–1010, https://doi.org/10.4054/DemRes.2016.35.33, 2016.
Auger, N., Naimi, A. I., Smargiassi, A., Lo, E., and Kosatsky, T.: Extreme Heat and Risk of Early Delivery Among Preterm and Term Pregnancies, Epidemiol., 25, 344–350, https://doi.org/10.1097/EDE.0000000000000074, 2014.
Azman, A. S., Rudolph, K. E., Cummings, D. A., and Lessler, J.: The incubation period of cholera: a systematic review, J. Infection, 66, 432–438, https://doi.org/10.1016/j.jinf.2012.11.013, 2013.
Ballester, F., Michelozzi, P., and Iňiguez, C.: Weather, climate, and public health, J. Epidemiol. Commun. H., 57, 759–760, https://doi.org/10.1136/jech.57.10.759, 2003.
Basagaña, X., Sartini, C., Barrera-Gómez, J., Dadvand, P., Cunillera, J., Ostro, B., Sunyer, J., and Medina-Ramón, N.: Heat Waves and Cause-Specific Mortality at All Ages, Epidemiol., 22, 765–772, https://doi.org/10.1097/EDE.0b013e31823031c5, 2011.
Basu, R.: High ambient temperature and mortality: a review of epidemiologic studies from 2001 to 2008, Environ. Health., 8, 1–13, https://doi.org/10.1186/1476-069X-8-40, 2009.
Basu, R. and Samet, J. M.: Relation between elevated ambient temperature and mortality: a review of the epidemiologic evidence, Epidemiol. Rev., 24, 190–202, https://https://doi.org/10.1093/epirev/mxf007, 2002.
Basu, R., Malig, B., and Ostro, B.: High Ambient Temperature and the Risk of Preterm Delivery, Am. J. Epidemiol., 172, 1108–1117, https://doi.org/10.1093/aje/kwq170, 2010.
Belshan, M. A., Knoop, F. C., and Huggett, K. N.: Influenza A, Reference Module in Biomedical Sciences, https://doi.org/10.1016/B978-0-12-801238-3.05048-0, ISBN 9780128012383, 2014.
Božič, A. and Kandič, M.: Relative humidity in droplet and airborne transmission of disease, J. Biol. Phys., 47, 1–29, https://doi.org/10.1007/s10867-020-09562-5, 2021.
Budnik, A. and Liczbińska, G.: Biological and cultural causes of seasonality of deaths in historical populations from Poland, Coll. Antropol., 39, 491–499, 2015.
Burnham, K. P. and Anderson, D. R.: Model Selection and Multimodel Inference: A practical information-theoretic approach, 2nd ed., New York-Berlin-Heidelberg, https://doi.org/10.1007/b97636, ISBN 978-0-387-95364-9, 2002.
Calleja-Agius, J., England, K., and Calleja, N.: The effect of global warming on mortality, Early Hum. Dev., 155, 105222, https://doi.org/10.1016/j.earlhumdev.2020.105222, 2021.
Carlton, E. J., Eisenberg, J. N. S., Goldstick, J., Cevallos, W., Trostle, J., and Levy, K.: Heavy Rainfall Events and Diarrhea Incidence: The Role of Social and Environmental Factors, Am. J. Epidemiol., 179, 344–352, https://doi.org/10.1093/aje/kwt279, 2014.
Carlton, E. J., Woster, A. P., DeWitt, P., Goldstein, R. S., and Levy, K.: A systematic review and meta-analysis of ambient temperature and diarrhoeal diseases, Int. J. Epidemiol., 45, 117–130, https://doi.org/10.1093/ije/dyv296, 2016.
Chen, K., Bi, J., Chen, J., Chen, X., Huang, L., and Zhou, L.: Influence of Heat Wave Definitions to the Added Effect of Heat Waves on Daily Mortality in Nanjing. China, Sci. Total Environ., 506–507, 18–25, https://doi.org/10.1016/j.scitotenv.2014.10.092, 2015.
Chen, T. T., Ljungqvist, F. C., Castenbrandt, H., Hildebrandt, F., Ingholt, M. M., Hesson, J. C., Ankarklev, J., Seftigen, K., and Linderholm, H. W.: The spatiotemporal distribution of historical malaria cases in Sweden: a climatic perspective, Malar. J., 20, 212, https://https://doi.org/10.1186/s12936-021-03744-9, 2021.
Chowdhury, F. R., Ibrahim, Q. S. U., Bari, M. S., Alam, M. M. J., Dunachie, S. J., Rodriguez-Morales, A. J., and Patwary, M. I.: The association between temperature, rainfall, and humidity with common climate-sensitive infectious diseases in Bangladesh, PLoS ONE, 13, e0199579, https://https://doi.org/10.1371/journal.pone.0199579, 2018.
Conti, S., Meli, P., Minelli, G., Solimini, R., Toccaceli, V., Vichi, M., Beltrano, C., and Perini, L.: Epidemiologic study of mortality during the summer 2003 heat wave in Italy, Environ. Res., 98, 390–399, https://doi.org/10.1016/j.envres.2004.10.009, 2005.
Deshpande, A., Chang, H. H., and Levy, K.: Heavy Rainfall Events and Diarrheal Diseases: The Role of Urban–Rural Geography, Am. J. Trop. Med. Hyg., 103, 1043–1049, https://doi.org/10.4269/ajtmh.19-0768, 2020.
Diaz, H. F., Kovats, R. S., McMichael, A. J., and Nicholls, N.: Climate and human health linkages on multiple timescales, in: History and Climate: Memories of the Future?, edited by: Jones, P. D., Ogilvie, A. E. J., Davies, T. D., and Briffa, K. R., Springer, Berlin/Heidelberg, 267–289, https://doi.org/10.1007/978-1-4757-3365-5, ISBN 978-0-306-46589-5, 2001.
Dinter, P. S. and Muller, W.: The tenacity of bacteria in the airborne state. VI. Tenacity of airborne S. senftenberg, Zbl. Hyg. Umweltmed., 186, 278–288, 1988.
D'Ippoliti, D., Michelozzi, P., Marino, C., de'Donato, F., Menne, B., Katsouyanni, K., Kirchmayer, U., Analitis, A., Medina-Ramón, M., Paldy, A., Atkinson, R., Kovats, S., Bisanti, L., Schneider, A., Lefranc, A., Iňiguez, C., and Perucci, C. A.: The Impact of Heat Waves on Mortality in 9 European Cities: Results from the Euro HEAT Project, Environ. Health., 9, 37, https://doi.org/10.1186/1476-069X-9-37, 2010.
Donaldson, G. C., Keatinge, W. R., and Näyhä, S.: Changes in summer temperature and heat-related mortality since 1971 in North Carolina, South Finland, and South East England, Environ. Res., 91, 1–7, https://doi.org/10.1016/s0013-9351(02)00002-6, 2003.
Drayna P., McLellan, S. L., Simpson, P., Li, S-H., and Gorelick, M. H.: Association between rainfall and pediatric emergency department visits for acute gastrointestinal illness, Environ. Health Persp., 118, 1439–1443, https://doi.org/10.1289/ehp.0901671, 2010.
Ehrlich, R., Miller, S., and Walker, R. L.: Relationship between atmospheric temperature and survival of airborne bacteria, Appl. Microbiol., 19, 245–249, 1970.
Eisenberg, M. C., Kujbita, G., Tuite, A. R., Fisman, D. N., and Tien, J. H.: Examining rainfall and cholera dynamics in Haiti using statistical and dynamic modeling approaches, Epidemics, 5, 197–207, https://doi.org/10.1016/j.epidem.2013.09.004, 2013.
Faruque, S. M., Islam, M. J., Ahmad, Q. S., Faruque, A. S. G., Sack, D. A., Nair, G. B., and Mekalanos, J. J.: Self-limiting nature of seasonal cholera epidemics: Role of host-mediated amplification of phage, P. Natl. Acad. Sci. USA, 102, 6119–6161, https://doi.org/10.1073/pnas.0502069102, 2005.
Fisman, D. N.: Seasonality of Infectious Diseases, Ann. Rev. Publ. Health, 28, 127–143; https://doi.org/10.1146/annurev.publhealth.28.021406.144128, 2007.
Flouris, A. D., Spiropoulos, Y., Sakellariou, G. J., and Koutedakis, Y.: Effect of Seasonal Programming on Fetal Development and Longevity: Links with Environmental Temperature, Am. J. Hum. Biol., 21, 214–216, https://doi.org/10.1002/ajhb.20818, 2009.
Galloway, P. R.: Annual variations in deaths by age, deaths by cause, prices, and weather in London 1670 to 1830, Pop. Stud.-J. Demogr., 39, 487–505, 1985.
Galloway, P. R.: Long-term fluctuations in climate and population in the preindustrial era, Popul. Dev. Rev. 12, 1–24, 1986.
Galloway, P. R.: Secular changes in the short-term preventive, positive, and temperature checks to population growth in Europe, 1460 to 1909, Climatic Change, 26, 3–63, 1994.
Galloway, P. R.: Galloway Prussia Database 1861 to 1914, https://www.patrickgalloway.com/ (last access: 10 October 2023), 2007.
Grundriss der Stadt Posen: The Collection of the Raczyński Library, catalogue no. CYRYL_12_2_2_272_0001, https://cyryl.poznan.pl/ (last access: 19 March 2023), 1856.
Ha, S., Liu, D., Zhu, Y., Kim, S. S., Sherman, S., and Mendola, P.: Ambient Temperature and Early Delivery of Singleton Pregnancies, Environ. Health Persp., 25, 453–459, https://doi.org/10.1289/EHP97, 2017.
Hajat, S., Kovats, R. S., and Lachowycz, K.: Heat-Related and Cold-Related Deaths in England and Wales: Who Is at Risk?, Occup. Environ. Med., 64, 93–100, https://doi.org/10.1136/oem.2006.029017, 2007.
Handley, B. A. and Webster, A. J. F.: Some factors affecting the airborne survival of bacteria outdoors, J. Appl. Bacteriol., 79, 368–378, https://doi.org/10.1111/j.1365-2672.1995.tb03150.x, 1995.
Harper, G. J.: Airborne micro-organisms: survival tests with four viruses. J. Hyg.-Lond., 59, 479–486, https://doi.org/10.1017/S0022172400039176, 1961.
Harrell, F. E.: Regression Modeling Strategies, Springer Series in Statistics, 2nd ed., New York, Springer, https://doi.org/10.1007/978-3-319-19425-7, ISBN 978-3-319-19424-0, 2015.
Harville, D. A.: Maximum Likelihood Approaches to Variance Component Estimation and to Related Problems, J. Am. Stat. Assoc., 72, 320–338, https://doi.org/10.1080/01621459.1977.10480998, 1977.
Hashizume, M., Armstrong, B., Hajat, S., Wagatsuma, Y., Faruque, A.S.G., Hayashi, T., and Sack, D. A.: The effect of rainfall on the incidence of cholera in Bangladesh, Epidemiol., 19, 103–110, https://doi.org/10.1097/EDE.0b013e31815c09ea, 2008.
Hashizume, M., Faruque, A. S. G., Wagatsuma, Y., Hayashi, T., and Armstrong, B.: Cholera in Bangladesh: climatic components of seasonal variation, Epidemiol., 21, 706–710, https://doi.org/10.1097/EDE.0b013e3181e5b053, 2010.
Hastie, T. J. and Tibshirani, R. J.: Generalized Additive Models, Boca Raton, London, New York, Washington DC, https://doi.org/10.1201/9780203753781, 1990.
Hosmer, D. W. and Lemeshow, S.: Applied Logistic Regression, 2nd ed., New Jersey, https://doi.org/10.1002/0471722146, 2000.
Hulden, L. and Hulden, L.: The decline of malaria in Finland – the impact of the vector and social variables, Malar. J., 8, 94, https://doi.org/10.1186/1475-2875-8-94, 2009.
Huynen, M. M., Martens, P., Schram, D., Weijenberg, M. P., and Kunst, A. E.: The impact of heat waves and cold spells on mortality rates in the Dutch population, Environ. Health Persp., 109, 463–470, https://doi.org/10.1289/ehp.01109463, 2001.
Imhof, A. E.: Aspekte der Bevölkerungsentwicklung in den nordischen Ländern: 1720–1750, Francke, Giessen, ISBN 9783772011856, 1976.
Infectious Intestinal Disease: Public Health & Clinical Guidance, https://www.hpsc.ie/ (last access: 10 October 2023), 2012.
Ingholt, M. M., Chen, T. T., Hildebrandt, F., Pedersen, R. K., and Simonsen, L.: Temperate climate malaria in nineteenth century Denmark, BMC Infect. Dis., 22, 432, https://https://doi.org/10.1186/s12879-022-07422-2, 2022.
Junkka, J., Karlsson, L., Lundevaller, E. H., and Schumann, B.: Climate vulnerability of Swedish newborns: Gender differences and time trends of temperature-related neonatal mortality, 1880–1950, Environ. Epidemiol., 192, 110400, https://doi.org/10.1016/j.envres.2020.110400, 2021.
Kaniecki, A.: Poznań. The history of the city written with water, Poznań, ISBN 83-7063-376-5, 2004.
Kappner, K.: Cholera Forcing and the Urban Water Infrastructure: Lessons from Historical Berlin, EHES Working Paper 167, 1–46, 2019.
Karlsson, L., Junkka, J., Lundevaller, E. H., and Schumann, B.: Ambient temperature and stillbirth risks in northern Sweden, 1880–1950, Environ. Epidemiol., 5, e176, https://doi.org/10.1097/EE9.0000000000000176, 2021.
Kasdorf, E. and Perlman, J. M.: Hyperthermia, Inflammation, and Perinatal Brain Injury, Pediatr. Neurol., 49, 8–14, https://doi.org/10.1016/j.pediatrneurol.2012.12.026, 2013.
Kent, S. T., McClure, L. A., Zaitchik, B., Smith, T. T., and Gohlke, J. M.: Heat Waves and Health Outcomes in Alabama (USA): The Importance of Heat Wave Definition, Environ. Health Persp., 122, 151–158, https://doi.org/10.1016/j.healthplace.2018.08.017, 2014.
Kolendowicz, K., Czarnecki, B., Półrolczak, B., Taszarek, M., Tomczyk, A. M., and Szyga-Pluga, K.: Homogenization of air temperature and its long-term trends in Poznań (Poland) for the period 1848–2016, Theor. Appl. Climatol., 136, 1357–1370, https://doi.org/10.1007/s00704-018-2560-z, 2019.
Krauer, F., Viljugrein, H., and Dean, K. R. The influence of temperature on the seasonality of historical plague outbreaks, Proc. R. Soc. B., 288, 20202725, https://https://doi.org/10.1098/rspb.2020.2725, 2021.
Kruszka, K. (Ed.): Statystyczna Karta Historii Poznania, Poznań, ISBN 978-83-61264-01-9, 2004.
Kysely, J. and Kim, J.: Mortality during heat waves in South Korea, 1991 to 2005: How exceptional was the 1994 heat wave?, Clim. Res., 38, 105–116, https://doi.org/10.3354/cr00775, 2009.
Lai, H., Hales, S., Woodward, A., Walker, C., Marks, E., Pillai, A., Chen, R. X., and Morton, S. M.: Effects of heavy rainfall on waterborne disease hospitalizations among young children in wet and dry areas of New Zealand, Environ. Int., 145, 106136, https://doi.org/10.1016/j.envint.2020.106136, 2020.
Lajinian, S., Hudson, S., Applewhite, L., Feldman, J., and Minkoff, H. L.: An association between the heat-humidity index and preterm labor and delivery: a preliminary analysis, Am. J. Public Health, 87, 1205–1207, https://doi.org/10.2105/ajph.87.7.1205, 1997.
Landers, J.: Historical epidemiology and the structural analysis of mortality, Health Transition Review, 2, 47–75, https://www.jstor.org/stable/i40028190 (last access: 10 October 2023), 1992.
Lee, R. D.: Short-term variation: Vital rates, prices and weather , in: The Population History of England, edited by: Wrigley, E. A. and Schofield, R. S., Cambridge University Press, Cambridge, 356–401, ISBN 0-521-35688-1, 1981.
Levy, K., Shanon, M., S. and Carlton, E. J.: Climate Change Impacts on Waterborne Diseases: Moving Toward Designing Interventions, Curr. Environ. Health. Rep., 5, 272–282, https://doi.org/10.1007/s40572-018-0199-7, 2018.
Liczbińska, G.: Infant and child mortality among Catholics and Lutherans in nineteenth century Poznań, J. Biosoc. Sci., 41, 661–683, https://doi.org/10.1017/S0021932009990101, 2009a.
Liczbińska, G.: Umieralność wśród katolickiej i ewangelickiej ludności historycznego Poznania, Poznań, ISBN 978-83-61845-01-1, 2009b.
Liczbińska, G.: Ecological conditions vs. religious denomination. Mortality among Catholics and Lutherans in nineteenth- century Poznań, Hum. Ecol., 39, 795–806, https://doi.org/10.1007/s10745-011-9428-5, 2011.
Liczbińska, G.: Lutherans in the Poznań province. Biological dynamics of the Lutheran population in the 19th and early 20th centuries, Hamburg, ISBN 978-3-8300-8059-6, 2015.
Liczbińska, G.: Spatial and Social Inequalities in the Face of Death. Pilot Research on Cholera Epidemics in Poznań of the Second Half of the 19th Century, Hist. Soc. Res., 33, 37–53, https://doi.org/10.12759/hsr.suppl.33.2021.37-53, 2021.
Liczbińska, G.: Climate and disease in 19th century Poznań, V1, Mendeley Data [data set], https://doi.org/10.17632/zzxsm52dwz.1, 2024.
Lowen, A. C., Mubareka, S., Steel, J., and Palese, P.: Influenza virus transmission is dependent on relative humidity and temperature, PLoS Pathog., 3, 1470–1476, https://doi.org/10.1371/journal.ppat.0030151, 2007.
Łuczak, C.: Życie gospodarczo-społeczne w Poznaniu 1815–1918, Poznań, 1965.
Mäkinen, T. M., Juvonen, R., Jokelainen, J., Harju, T. H., Peitso, A., Bloigu, A., Silvennoinen-Kassinen, S., Leinonen, M., and Hassi, J.: Cold temperature and low humidity are associated with increased occurrence of respiratory tract infections, Respir. Med., 103, 456–462, https://doi.org/10.1016/j.rmed.2008.09.011, 2009.
Matusik, P.: Historia Poznania, Poznań, ISBN 978-83-7768-266-1, 2021.
Moors, E., Singh, T., Siderius, C. Balakrishnan, S., and Mishra A.: Climate change and waterborne diarrhoea in northern India: impacts and adaptation strategies, Sci. Total Environ., 468–469, S139–S151, https://doi.org/10.1016/j.scitotenv.2013.07.021, 2013.
Munteanu, C. and Schwartz, B.: The relationship between nutrition and the immune system, Front. Nutr., 9, 1082500, https://doi.org/10.3389/fnut.2022.1082500, 2022.
Nitschke, M., Tucker, G. R., Hansen, A. L., Williams, S., Zhang, Y., and Bi, P.: Impact of two recent extreme heat episodes on morbidity and mortality in Adelaide, South Australia: a case series analysis, Environ. Health., 42, 1–10, https://doi.org/10.1186/1476-069X-10-42, 2011.
Oliveira, M., Ribeiro, H., and Abreu, I.: Annual variation of fungal spores in atmosphere of Porto: 2003, Ann. Agr. Env. Med., 12, 309–331, 2005.
Pfister, C. and Wanner, H.: Climate and Society in Europe: The Last Thousand Years, Bern, ISBN 978-3-258-08234-9, 2021.
Piankowski, Z.: Die Cholera in Posen (Ein Beitrag zur Seuchengeschichte des 19. Jahrhunderts), PhD, Philipps-Universität Marburg, Marburg, 1987.
Polizeipräsidium Posen 5676: Die Cholera im Jahre 1866, Pozen, 1866–1868.
Poursafa, P., Keikha, M., and Kelishadi, R.: Systematic Review on Adverse Birth Outcomes of Climate Change, J. Res. Med. Sci., 20, 397–402, 2015.
R Core Team: R: A Language and Environment for Statistical Computing. Vienna, R Foundation for Statistical Computing, https://www.r-project.org/ (last access: 17 Mach 2023), 2023.
Rey, G., Jougla, E., Fouillet, A., Pavillon, G., Bessemoulin, P., Frayssinet, P., Clavel, J., and Hemón, D.: The impact of major heat waves on all-cause and cause-specific mortality in France from 1971 to 2003, Int. Arch. Occ. Env. Hea., 80, 615–626, https://doi.org/10.1007/s00420-007-0173-4, 2007.
Rooney, C., McMichael, A., Kovats, R., and Coleman, M.: Excess mortality in England and Wales, and in Greater London, during the 1995 heat wave, J. Epidemiol. Commun. H., 52, 482–486, https://doi.org/10.1136/jech.52.8.482, 1998.
Rue, H., and Held, L.: Gaussian Markov random fields: theory and applications, New York, https://doi.org/10.1201/9780203492024, 2005.
Semenza, J. C. and Menne, B.: Climate change and infectious diseases in Europe, Lancet Infect. Dis., 9, 365–375, https://doi.org/10.1016/S1473-3099(09)70104-5, 2009.
Singh, R. B., Hales, S., de Wet, N., Raj, R., Hearnden, M., and Weinstein, P.: The influence of climate variation and change on diarrheal disease in the Pacific Islands, Environ. Health Persp., 109, 155–159, https://doi.org/10.1289/ehp.01109155, 2001.
Smosarski, W.: Temperature and precipitation in Greater Poland, Poznań, 1925.
Sobczak, T.: Zakłady użyteczności publicznej, in: Historia kultury materialnej Polski. Tom VI od 1870 do 1918, edited by: Baranowski, B., Bartyś, J. and Sobczak T., Wrocław- Warszawa-Kraków-Gdańsk, 355–389, ISBN 830400433X, 1979.
Stafoggia, M., Forastiere, F., Agostini, D., Biggeri, A., Bisanti, L., Cadum, E., Coranci, N., de'Donato, F., De Lisio, S., De Maria, M., Michelozzi, P., Miqlio, R., Pandolfi, P., Picciotto, S., Rognoni, M., Russo, A., Scarnato, C., and Perucci, C. A.: Vulnerability to heat-related mortality: a multicity, population-based, case-crossover analysis, Epidemiol., 17, 315–323, https://doi.org/10.1097/01.ede.0000208477.36665.34, 2006.
Stehmann, R., Rottmayer, J., Zschaubitz, K., and Mehlhorn, G.: The tenacity of Bordetella bronchiseptica in the air, Zbl. Vet. Med. B, 39, 546–552, 1992.
Tang, J. W.: The effect of environmental parameters on the survival of airborne infectious agents, J. R. Soc. Interface, 6, S737–S746, https://doi.org/10.1098/rsif.2009.0227.focus, 2009.
Theunissen, H. J., Lemmens-den Toom, N. A., Burggraaf, A., Stolz, E., and Michel, M. F.: Influence of temperature and relative humidity on the survival of Chlamydia pneumoniae in aerosols, Appl. Environ. Microb., 59, 2589–2593, 1993.
Tong, S., Wang, X. Y., and Guo, Y.: Assessing the Short-Term Effects of Heatwaves on Mortality and Morbidity in Brisbane, Australia: Comparison of Case-Crossover and Time Series Analyses, PLoS ONE, 7, e37500, https://doi.org/10.1371/journal.pone.0037500, 2012.
Trzeciakowska, M. and Trzeciakowski, L.: W dziewiętnastowiecznym Poznaniu, Poznań, ISBN 8321005403, 1987.
Vicedo-Cabrera, A. M., Scovronick, N., Sera, F., Royé, D., Schneider, R., Tobias, A., Astrom, C., Guo, Y., Honda, Y., Hondula, D. M., Abrutzky, R., Tong, S., de Sousa Zanotti Stagliorio Coelho, M., Saldiva, P. H. N., Lavigne, E., Correa, P. M., Ortega, N. V., Kan, H., Osorio, S., Kyselý, J., Urban, A., Orru, H., Indermitte, E., Jaakkola, J. J. K., Ryti, N., Pascal, M., Schneider, A., Katsouyanni, K., Samoli, E., Mayvaneh, F., Entezari, A., Goodman, P., Zeka, A., Michelozzi, P., de'Donato, F., Hashizume, M., Alahmad, B., Diaz, M. H., De La Cruz Valencia, C., Overcenco, A., Houthuijs, D., Ameling, C., Rao, S., Ruscio, F. D., Carrasco-Escobar, G., Seposo, X., Silva, S., Madureira, J., Holobaca, I. H., Fratianni, S., Acquaotta, F., Kim, H., Lee, W., Iniguez, C., Forsberg, B., Ragettli, M. S., Guo, Y. L. L., Chen, B. Y., Li, S., Armstrong, B., Aleman, A., Zanobetti, A., Schwartz, J., Dang, T. N., Dung, D. V., Gillett, N., Haines, A., Mengel, M., Huber, V., and Gasparrini, A.: The burden of heat-related mortality attributable to recent human-induced climate change, Nat. Clim. Change, 11, 492–500, https://doi.org/10.1038/s41558-021-01058-x, 2021.
Vögele, J.: Urban mortality change in England and Germany, 1870–1913, Liverpool, ISBN 10 0853238529, 1998.
Vögele, J.: Sozialgeschichte städtischer Gesundheitsverhältnisse während der Urbanisierung, Berlin, ISBN 978-3-428-10611-0, 2001.
Vögele, J.: Has All That Has Been Done Lately For Infants Failed? 1911, Infant Mortality and Infant Welfare in Early-Twentieth Century Germany, Annales de Démographie Historique, 2, 131–146, https://https://doi.org/10.3917/adh.120.0131, 2010.
Wang, P., Goggins, W. B., and Chan, E. Y. Y.: A time-series of the association of rainfall, relative humidity, and ambient temperature with hospitalizations for rotavirus and norovirus infection among children in Hong Kong, Sci. Total Environ., 643, 414–422, https://doi.org/10.1016/j.envint.2020.106136, 2018.
Wathes, C. M., Howard, K., and Webster, A. J.: The survival of Escherichia coli in an aerosol at air temperatures of 15 and 30 degrees C and a range of humidities, J. Hyg.-Lond., 97, 489–496, 1986.
Woods, R. I., Watterson, P. A., and Woodward, J. H.: The Causes of Rapid Infant Mortality Decline in England and Wales, 1861–1921 Part I, Pop. Stud., 42, 343–366, https://doi.org/10.1080/0032472031000143516, 1988.
Woods, R. I., Watterson, P. A., and Woodward, J. H.: The Causes of Rapid Infant Mortality Decline in England and Wales, 1861–1921. Part II, Pop. Stud., 43, 113–132, https://doi.org/10.1080/0032472031000143876, 1989.
Wood, S. N.: Generalized Additive Models: An Introduction with R, 2nd ed., Boca Raton, https://doi.org/10.1201/9781315370279, 2017.
Wood, S. N., Pya, N., and Saefken, B.: Smoothing parameter and model selection for general smooth models (with discussion), J. Am. Stat. Assoc., 111, 1548–1575, https://doi.org/10.1080/01621459.2016.1180986, 2016.
Wu, D., Lewis, E., Pae, M., and Meydani, S.: Nutritional modulation of immune function: analysis of evidence, mechanisms, and clinical relevance, Front. Immunol., 9, 3160, https://doi.org/10.3389/fimmu.2018.03160, 2019.
Zhao, Q., Guo, Y., Ye, T., Gasparrini, A.,Tong, Sh., Overcenco, A., Urban, A., Schneider, A., Entezari, A., Vicedo-Cabrera, A. M., Zanobetti, A., Analitis, A., Zeka, A., Tobias, A., Nunes,B., Alahmad, B., Armstrong, B., Forsberg, BShih-Chun Pan, Sh-Ch., Íñiguez, C., Ameling, C., De la Cruz Valencia, C., Åström,Ch., Houthuijs, D., Van Dung, D., Royé, D., Indermitte, E., Lavigne, E., Mayvaneh, F., Acquaotta, F., de’Donato, F., Di Ruscio, F., Sera, F., Carrasco-Escobar, G., Kan, H., Orru, H., Kim,H., Holobaca, I-H., Kyselý, J., Madureira, J., Schwartz, J., Jaakkola, J. J. K., Katsouyanni,K., Diaz, M. H., Ragettli, M. S., Hashizume, M., Pascal, M., de Sousa Zanotti Stagliorio Coélho, M., Valdés Ortega, N., Ryti, N., Scovronick, N., Michelozzi, P., Matus Correa, P., Goodman, P., Nascimento Saldiva, P. H., Abrutzky, RR., Osorio, S., Rao, Sh., Fratianni, S., Dang, T. N., Colistro, V., Huber, V., Lee, W., Seposo, X., Honda, Y., Guo, Y. L., Bell, M. L., and Li, Sh.: Global, regional, and national burden of mortality associated with short-term temperature variability from 2000 to 2019: a three-stage modelling study, Lancet Planet. Health, 6, e410–e421, https://doi.org/10.1016/S2542-5196(21)00081-4, 2022.
- Abstract
- Introduction
- The city of Poznań in the 19th century
- Meteorological observations in 19th century Poznań
- Dataset
- Methods
- Results and discussion
- Conclusion
- Data availability
- Author contributions
- Competing interests
- Disclaimer
- Acknowledgements
- Financial support
- Review statement
- References
- Supplement