the Creative Commons Attribution 4.0 License.
the Creative Commons Attribution 4.0 License.
 | 11 Jun 2024
Local summer temperature changes over the past 440 ka revealed by the total air content in the Antarctic EPICA Dome C ice core
Dominique Raynaud
Qiuzhen Yin
Emilie Capron
Zhipeng Wu
Frédéric Parrenin
André Berger
Vladimir Lipenkov
Seasonal temperature reconstructions from ice cores are missing over glacial–interglacial timescales, preventing a good understanding of the driving factors of Antarctic past climate changes. Here the total air content (TAC) record from the Antarctic EPICA Dome C (EDC) ice core is analyzed over the last 440 ka (thousand years). While the water isotopic record, a tracer for annual mean surface temperature, exhibits a dominant ∼100 kyr cyclicity, the TAC record is associated with a dominant ∼40 kyr cyclicity. Our results show that the TAC record is anti-correlated with the mean insolation over the local astronomical summer half-year. They also show for the first time that it is highly anti-correlated with local summer temperature simulated with an Earth system model of intermediate complexity. We propose that (1) the local summer insolation controls the local summer temperature; (2) the latter, through the development of temperature gradients at the near-surface of the ice sheet (<2 m), is affecting the surface snow structure; and (3) those snow structure changes propagating down to the bottom of the firn through densification are eventually controlling the pore volume at the bubble close-off and consequently the TAC. Hence, our results suggest that the EDC TAC record could be used as a proxy for local summer temperature changes. Also, our new simulations show that the mean insolation over the local astronomical summer half-year is the primary driver of Antarctic summer surface temperature variations, while changes in atmospheric greenhouse gas (GHG) concentrations and Northern Hemisphere (NH) ice sheet configurations play a more important role in Antarctic annual surface temperature changes.
- Article
(4572 KB) - Full-text XML
-
Supplement
(501 KB) - BibTeX
- EndNote


The analysis of Antarctic ice cores provides paramount information to reconstruct and understand the climate dynamics of the past 800 ka (thousand years). Amongst the key climatic parameters that can be inferred from these deep ice cores are the local mean annual temperature reconstructed from the isotopic composition of ice (e.g., δD Dome Fuji Ice Core Project Members, 2017; Jouzel et al., 2007) and past atmospheric greenhouse gas (GHG) concentrations measured from air trapped in air bubbles (Bereiter et al., 2015; Loulergue et al., 2008; Lüthi et al., 2008). However, the climate during local summer, which is a critical season for polar regions, especially in terms of solar energy received, is seldom discussed, except through the highlighting of local insolation signatures on the ratio of trapped gas (Bender, 2002; Kawamura et al., 2007; Landais et al., 2012) and the air content in bubbles (Eicher et al., 2016; Epifanio et al., 2023; Lipenkov et al., 2011) in ice core records. In particular, there is no suitable proxy of the local summer temperature. Moreover, a debate remaining in Antarctic climate study is related to whether the Antarctic temperature variations on orbital timescales are controlled by the Northern Hemisphere (NH) insolation or by local insolation (Huybers and Denton, 2008). As the insolation over Antarctica is received mostly during summer, having a proxy of summer temperature would therefore be essential for helping to decipher the role of the NH versus local insolation and the role of other glacial boundary conditions, such as the changes in atmospheric GHG concentrations, in Southern Ocean sea ice extent and in ice sheet configuration.
An imprint of local insolation changes has been evidenced in tracers which are measured in the air trapped in polar ice cores. Indeed, air bubbles close off from the surrounding atmosphere and become trapped in ice, an airtight material resulting from the densification and diagenesis of the snow deposited at the surface. These processes of densification and diagenesis take place in the upper layer at the surface of the ice sheet (typically between 60–120 m deep), which is characterized by an open porosity to the atmosphere and by two successive stages, snow and then firn, associated with different densification regimes (Anderson and Benson, 1963). In the absence of surface melting, which is the case at the EPICA Dome C (EDC) site (75°06′ S, 123°21′ E; 3233 m a.s.l.) on the high plateau of East Antarctica, and, according to the ideal gas law, the amount of air (V) in the bubbles at close-off depends on their physical volume (Vc) and on the pressure (Pc) and temperature (Tc) of the air contained in Vc at the enclosure time (Martinerie et al., 1992). In the first approximation, Tc is equivalent to the mean annual temperature prevailing at the surface of the ice sheet, which is estimated from the isotopic composition of the ice.
Then, V can be defined as the total volume of air in unit mass of ice, measured at standard temperature T0 and pressure P0, and Vc is the pore volume per unit mass at close-off:
Furthermore, the porosity at close-off, Vc, is related to temperature.
During previous works, V (for air content) and TAC (for total air content) have been interchangeably used for designating the same property. In this work we are using TAC, following other recent studies.
Long-term high-resolution studies of TAC records obtained from several deep ice cores in central Antarctica (Lipenkov et al., 2011; Martinerie et al., 1994; Raynaud et al., 2007) revealed a long-term large variability that cannot be explained by changes in Tc or Pc. In particular at EDC, about 85 % of the variance observed in the high-resolution V record covering the last 440 ka can be explained neither by Pc, nor by Tc changes. This led us to consider that other properties, besides the mean annual temperature and barometric pressure at the surface, may also influence TAC. By using continuous wavelet transform (CWT) analysis, Raynaud et al. (2007) found that the EDC TAC record shows significant power in the obliquity and precession bands, with a dominant ∼40 ka signal, which has been assumed to reflect orbitally driven changes in local summer insolation.
To account for the observed anti-correlation between local summer insolation and TAC, a mechanism has been proposed where the local summer insolation, by controlling the near-surface (<2 m) snow temperature and temperature gradients during summertime, affects the near-surface snow structure and consequently the porosity of the firn pores at close-off, i.e., the TAC of air bubbles (Lipenkov et al., 2011; Raynaud et al., 2007). Based on such an assumption, TAC was used as an orbital dating tool to constrain ice core chronologies. TAC-based age markers have been used for the latest official chronologies for polar ice cores (AICC2012, Bazin et al., 2013; Veres et al., 2013, and AICC2023, Bouchet et al., 2023). However, the exact physical processes that lead to an imprint of the local summer insolation in the TAC record are unclear. In particular, uncertainties remain regarding the link between TAC and the surface climatic parameters such as local temperature.
In this study, we use the TAC record measured in the EDC ice core covering the last 440 ka (Raynaud et al., 2007). We compare it with a new local insolation index and with transient simulations performed with the model LOVECLIM1.3 to explore the link between insolation, Antarctic summer temperature and TAC, as well as the related mechanisms. Finally, we compare the EDC TAC record with the EDC δD record to understand the major driving factors of the summer and annual mean temperature changes in Antarctica.
2.1 TAC measurements
TAC measurements have been performed at the Institute of Environmental Geosciences (Grenoble, France) using an original barometrical method implemented with an experimental setup called STAN (Lipenkov et al., 1995). Results of the numerical data of the measurements versus depth along the EDC ice core can be found in the Appendix in Raynaud et al. (2007). The TAC data shown in Fig. 1 are plotted on the AICC2023 ice age chronology (Bouchet et al., 2023).
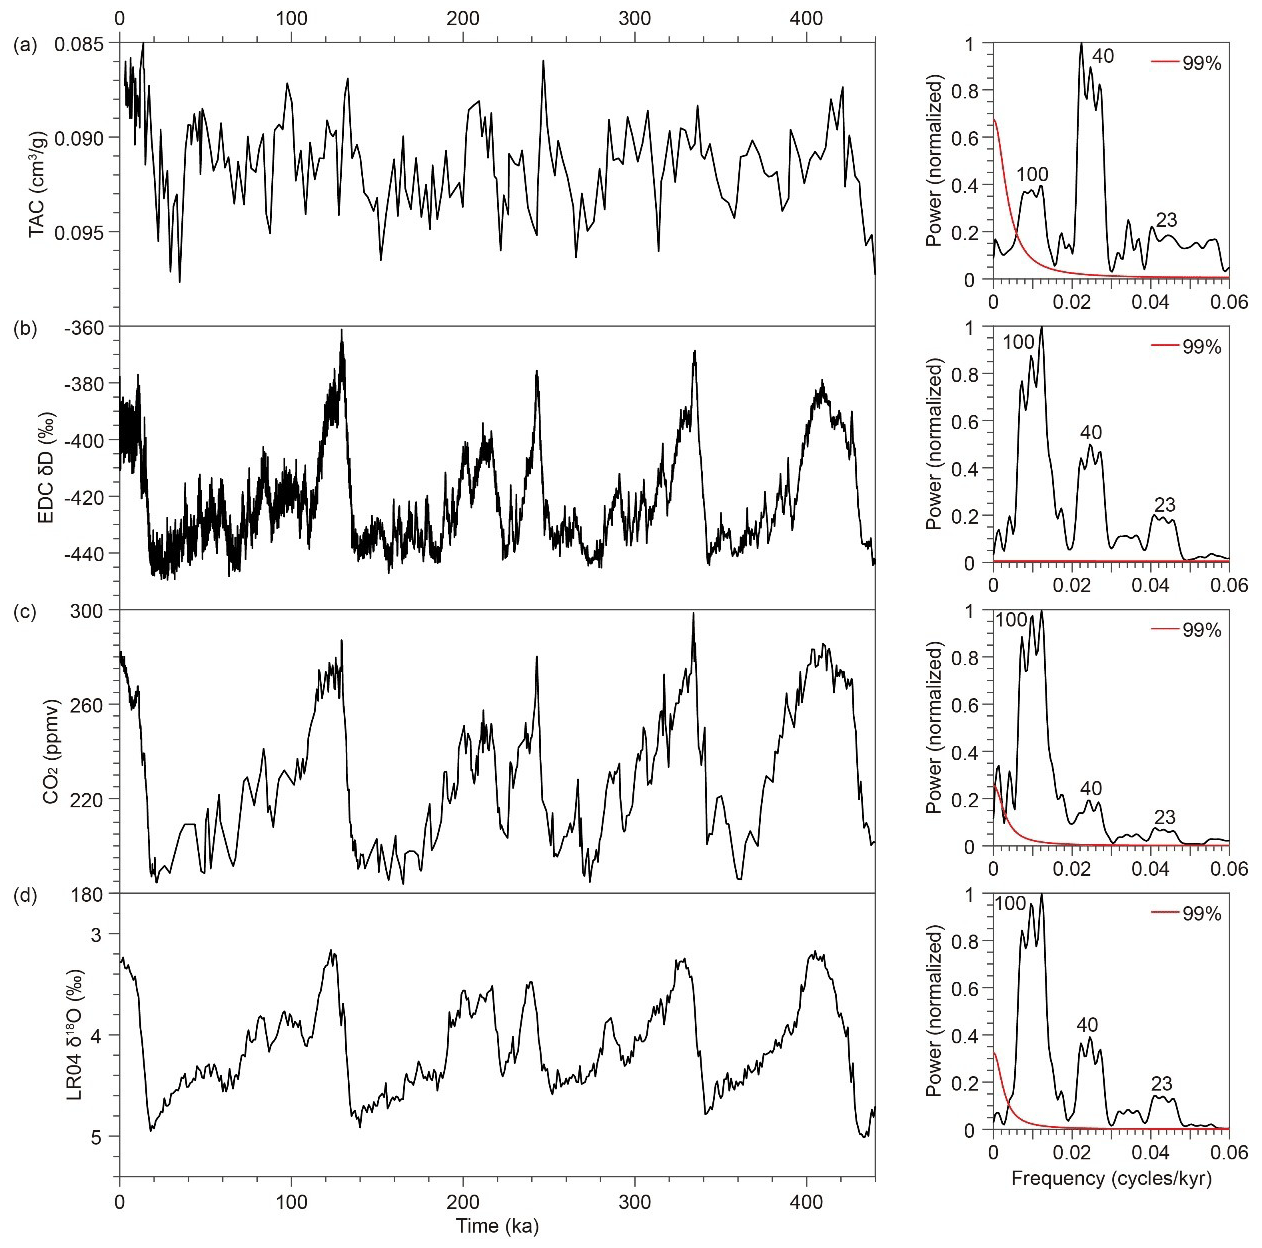
Figure 1Variations and spectra over the past 440 ka of the (a) TAC record (raw data; Raynaud et al., 2007), (b) EDC δD record (Jouzel et al., 2007), (c) CO2 concentration (Lüthi et al., 2008) and (d) benthic δ18O (Lisiecki and Raymo, 2005). The major periodicities in kyr are indicated. The EDC TAC record, δD record and CO2 concentrations are plotted on the AICC2023 chronology (Bouchet et al., 2023). The spectra are calculated using the multi-taper method (MTM), the number of tapers is set to 2 and the zero padding is set to 5, and the 99 % confidence limit is shown (red curves).
2.2 Model and simulations
The model used in this study is LOVECLIM1.3, a three-dimensional Earth system model of intermediate complexity (EMIC), with its atmosphere (ECBilt), ocean and sea ice (CLIO), and terrestrial biosphere (VECODE) components being interactively coupled (Goosse et al., 2010). The model setup is the same as the one used in Yin et al. (2021), and a detailed description can be found there. In terms of the Antarctic climate, LOVECLIM1.3 reasonably reproduces the spatial pattern and the magnitude of surface temperature over Antarctica in winter and summer and the annual mean (Fig. 2a). It is slightly cooler in West Antarctica in the model, probably related to its rough resolution. The seasonal temperature cycle at the EDC site (Fig. 2b) and the Antarctic inversion (Fig. 2c) are also well-reproduced by the model.
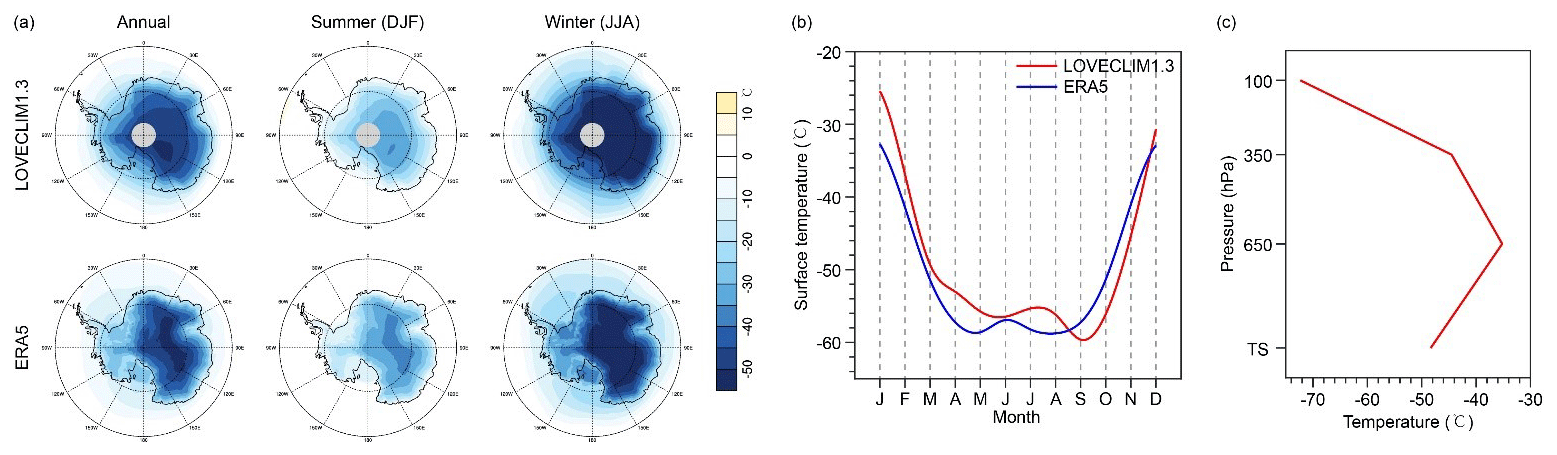
Figure 2Comparison of the 1971–2000 mean climate in Antarctica simulated by LOVECLIM1.3 and the ERA5 reanalysis (https://cds.climate.copernicus.eu/cdsapp#!/home, last access: 12 February 2024) for mean annual, summer (DJF) and winter (JJA) surface temperature (a) and for the seasonal cycle of the surface temperature at the EDC site (b), as well as the simulated vertical mean annual surface temperature profile at the EDC site.
Although LOVECLIM1.3 is classified as an EMIC model, its complexity is high for this kind of model, and its ocean component is a full general circulation model, so it remains challenging to run full transient simulations with this model. We therefore first performed a transient simulation with 10× acceleration covering the last 800 ka, which allows us to compare the simulated local summer temperature with the TAC record over the entire last 440 ka. In this simulation, the variations in orbital forcing and GHGs were considered, and the global ice sheets were fixed to their pre-industrial condition. Using the same model and the same acceleration technique, it has been shown that 10× acceleration has a significant impact on deep-ocean temperature, but it has no major impact on surface temperature (Yin and Berger, 2015). This is further confirmed in our study where the Antarctic summer and annual mean temperature changes of the 10× acceleration simulation match well with those of the non-accelerated simulations (Fig. S1 in the Supplement).
We further performed transient simulations without acceleration for some glacial–interglacial episodes of the last 440 ka to investigate the relative effects of insolation, GHGs and NH ice sheets (see Sect. 5 for simulation periods and results). Each episode includes three simulations. The first two simulations, Orb and OrbGHG, were performed in Yin et al. (2021), and a detailed description of the experiment setup can be found there. Here we only give a brief introduction. In the Orb simulation, only the change in orbital forcing (Berger and Loutre, 1991) was considered, with the GHGs and ice sheets being fixed to their pre-industrial conditions. In the OrbGHG simulation, the change in GHGs (Loulergue et al., 2008; Lüthi et al., 2008; Schilt et al., 2010) was considered in addition to the orbital forcing. In the third simulation, OrbGHGIce, the change in NH ice sheets (Ganopolski and Calov, 2011) was additionally considered, but the Southern Hemisphere (SH) ice sheets remained fixed to the pre-industrial conditions. The initial conditions were provided by a 2000-year equilibrium experiment with the NH ice sheets, GHG concentrations and astronomical parameters at the starting date of the simulated period. In the presence of land ice, albedo, topography, vegetation and surface soil types corresponding to ice-covered conditions were prescribed at corresponding model grids in LOVECLIM1.3. A detailed description of the ice sheet setup can be found in Wu et al. (2023).
The spectral analysis of the TAC record shows that its variations over the last 440 ka are dominated by the 40 kyr cycle (Fig. 1), which corresponds to the main periodicity of obliquity. It also shows the 100 kyr cycle and the 23 and 19 kyr cycles which correspond to the precession cycles (Berger, 1978), but their amplitude in the power spectrum is much weaker. Overall, this spectral characteristic illustrates that the variations in TAC are strongly correlated with the astronomical forcing and could be linked to insolation changes (Lipenkov et al., 2011; Raynaud et al., 2007).
When comparing a proxy record with insolation, it is not necessarily straightforward to decide which insolation index to choose because different insolation metrics exist, and their relationship with climate is not always clear (Berger et al., 1993, 2010). In a previous study presenting the EDC TAC record over the past 440 ka (Raynaud et al., 2007), an integrated summer insolation index (also referred to as ISI) was established and compared with the TAC record in order to find the ISI curve with variations that would most resemble the changes recorded in the TAC record. The ultimate objective of such an exercise was to identify an insolation target to infer dating constraints from TAC based on orbital tuning. The most appropriate orbital tuning target was found by tuning the precession-to-obliquity amplitude ratio of the insolation index on the corresponding spectral signature of the TAC record. It corresponds to the so-called ISI 380 curve that was obtained by summing over the year the daily insolation above a threshold of 380 W m−2. Hence, this orbital tuning heavily relies on (1) the tuning of the relative amplitudes of the precession and obliquity in the power spectra and (2) as a consequence the selected insolation threshold value. It is also based on the assumption of a time-linear (constant) response of TAC to the selected insolation threshold. To avoid these assumptions, we propose to use a simpler and independent insolation index in the present work: the mean insolation over the astronomical half-year summer at 75° S (the latitude of the EDC site).
The astronomical summer half-year in the SH, which corresponds to the astronomical winter half-year in the NH, is defined as the time interval during which the Earth travels from the fall (September) equinox to the spring (March) equinox on the ecliptic (Berger and Loutre, 1994; Berger and Yin, 2012; Berger et al., 2024). The advantage of using astronomical seasons is that they allow a change in the length of seasons. The astronomical summer half-year in the SH is the main interval during which the southern polar regions (regions within the Antarctic Circle) receive solar radiation over a year. The length of this half-year summer varies in time and is only a function of precession (Berger and Loutre, 1994; Berger and Yin, 2012; Berger et al., 2024). Over the last 440 ka, it varies between 171.3 and 194.0 d. The total solar radiation received over the half-year astronomical summer is only a function of obliquity (Berger et al., 2010). Therefore, the mean summer insolation at 75° S, which is calculated by dividing the total irradiation received during the half-year summer by its length, is a function of both obliquity and precession, with obliquity being dominant. Compared to the total summer insolation or the integrated insolation above a threshold (ISI), the mean insolation of the astronomical summer half-year (referred to as mean summer insolation hereafter) considers not only the total amount of energy received during the astronomical summer half-year but also the length of the astronomical summer half-year, which could also be important.
Figure 3 shows the comparison between TAC and the mean summer insolation. Since we focus here on the orbital-scale variations, a low-pass filter (>12 kyr) was applied to the TAC data before the comparison in order to eliminate the high-frequency signals. A good resemblance in terms of temporal structure and amplitude is observed between the two variables, and the two datasets appear well-anti-correlated with an R2 correlation coefficient of 0.39. This comparison is surprisingly good considering that TAC could also be influenced by other factors.
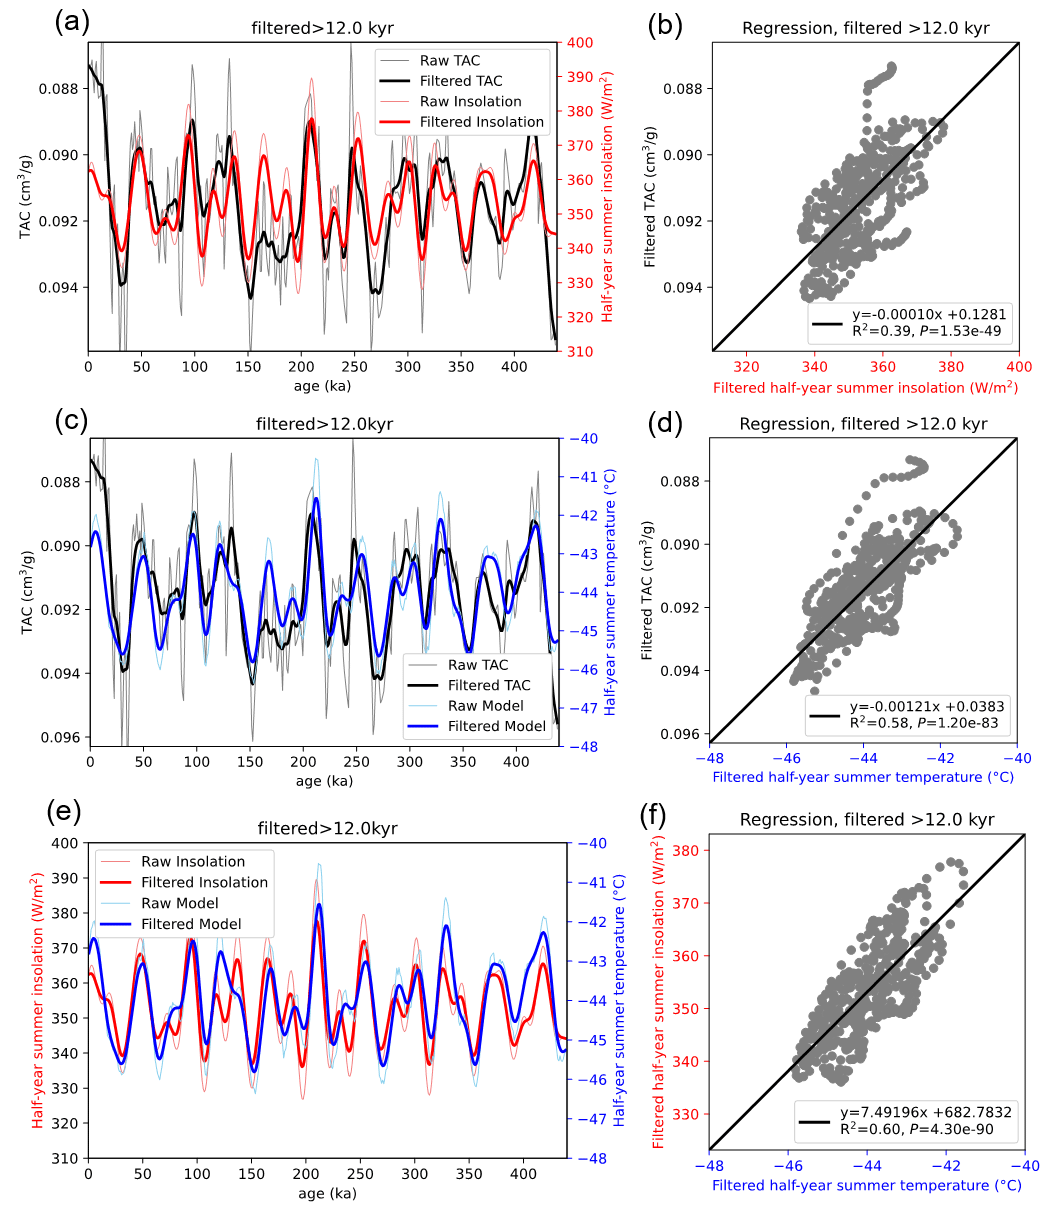
Figure 3Comparison of the TAC record with (a) mean insolation during astronomical half-year summer at 75° S calculated using the solution of Berger and Loutre (1991) and with (c) simulated mean half-year summer (October to March) temperature at the EDC site. Their corresponding linear regression analyses are shown in panels (b) and (d). (e) Comparison of half-year summer insolation with simulated mean half-year summer temperature and corresponding linear regression in panel (f). Low-pass-filtered >12 kyr is applied to the TAC, insolation and summer temperature raw data before comparison. Note that the y axis for TAC is reversed on the left panels to ease the visual comparison.
This new result implies that for dating purposes the mean summer local insolation is more appropriate than the ISI 380 curve (Raynaud et al., 2007) to be used as an orbital dating target. Indeed, it appears preferable to favor the mean summer insolation record as it is fully independent from the TAC record compared to ISI 380, although the degree of anti-correlation with the TAC record is of similar magnitude. While it is beyond the scope of this study to discuss in detail the implications for the definition of TAC-based age markers to constrain the EDC ice core dating (Bouchet et al., 2023), we present in Fig. 4 a comparison of the two insolation indexes over the past 440 ka. We observe a strong resemblance in terms of the relative amplitude and timing of changes in the two records. Following the approach described in Raynaud et al. (2007), we calculate the evolution of the phase delay between the two records filtered in the 15–46 kyr band to provide a quantification of the age differences that could be generated from the use of one curve or the other for orbital dating purposes. On average, the age difference is about 260 years and never above 650 years. These age differences should be regarded as minimal, as they do not account for other sources of age uncertainties when building a TAC-based orbitally tuned chronology. For instance, our ability to define precisely the tie points between the TAC data and the insolation index also depends on the quality of the visual resemblance between TAC and the insolation target. These matters will be fully discussed in a subsequent study.
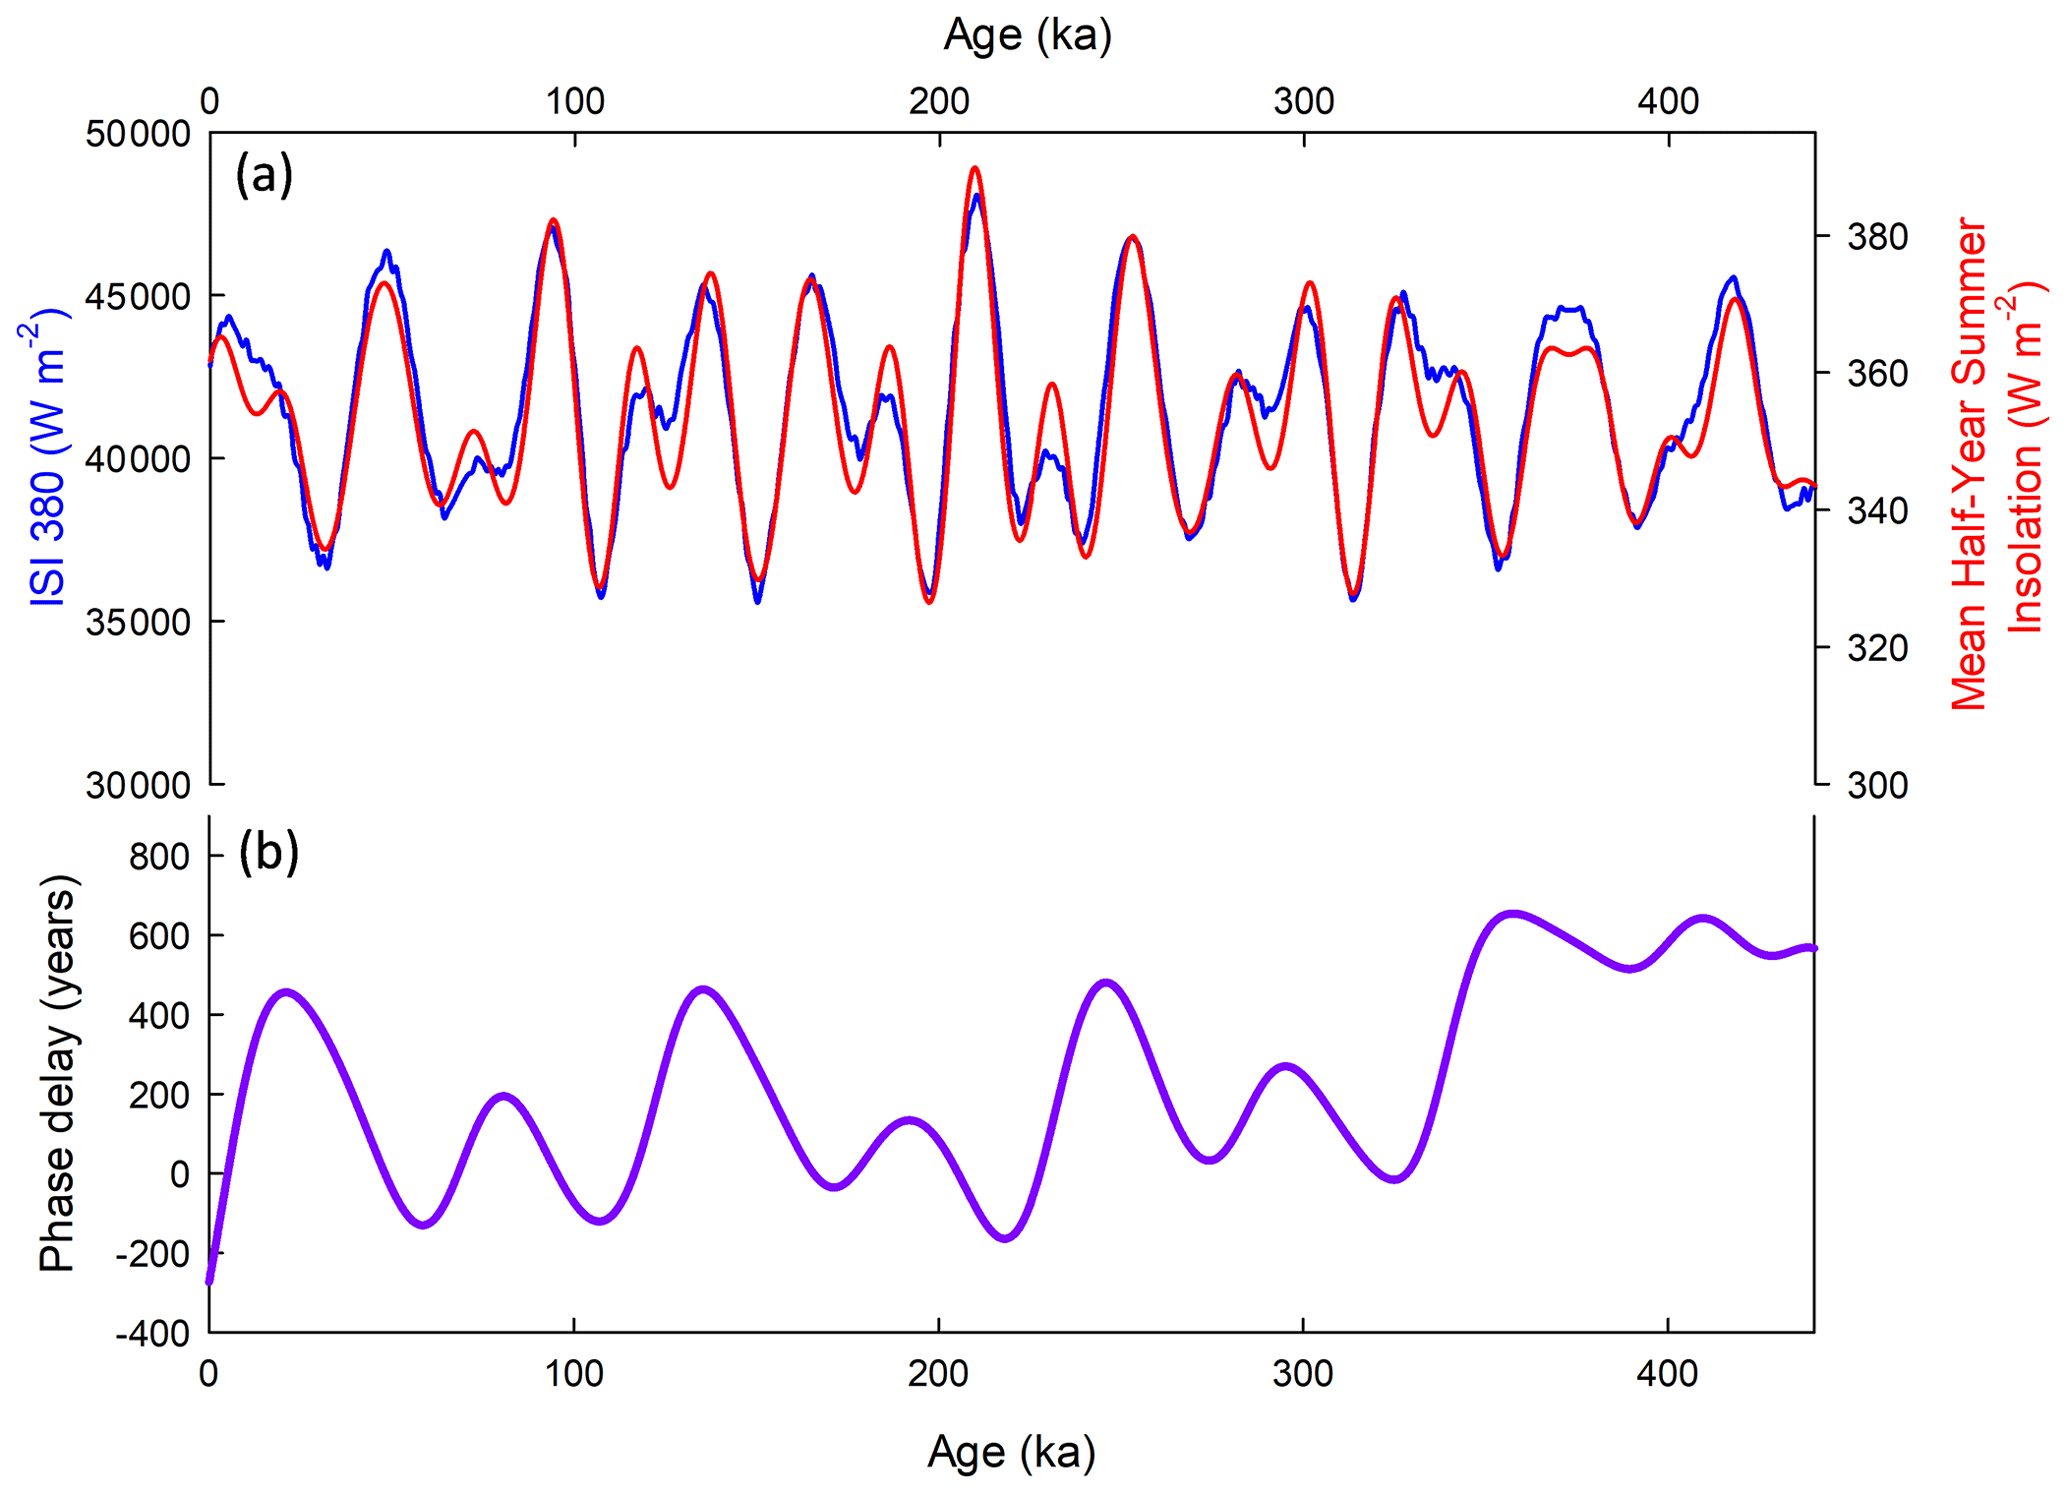
Figure 4(a) Comparison of ISI 380 (blue) with the mean insolation during astronomical half-year summer (red). (b) Evolution of the phase delay (purple) between the two insolation curves filtered in the 15–46 kyr band. ISI 380 is represented here as a flux following the definition given in Eicher et al. (2016).
While it appears that the EDC TAC record is anti-correlated with the local mean summer insolation, its relationship to seasonal surface temperature reconstructions has not been investigated yet. Recently, a quantitative reconstruction of the seasonal temperature changes in West Antarctica has been produced throughout the Holocene (Jones et al., 2023), but to our knowledge no seasonal temperature reconstructions in Antarctic ice cores are available over the longer glacial–interglacial timescale. Hence, we propose to compare the EDC TAC record with the local summer temperature changes obtained from transient simulations performed with LOVECLIM1.3. The comparison of the LOVECLIM1.3-simulated summer temperature in West Antarctica with the one reconstructed by Jones et al. (2023) shows that they compare well in both the trend and the magnitude of temperature change over the Holocene, both showing that the summer temperature in West Antarctica had an increasing trend from the early to mid-Holocene and reached a maximum at ∼4 ka BP followed by a decreasing trend (Fig. S2). This validates the LOVECLIM1.3 simulations in reproducing past summer temperature changes in West Antarctica.
Figure 3 shows that the EDC TAC values increase when the modeled local summer temperatures decrease. It also shows that there is a high and positive correlation between the simulated summer temperature and the mean summer insolation. Linear regression analysis shows that TAC and the simulated summer temperature are highly and negatively correlated. The linear coefficient of determination (R2=0.58 when a low-pass filter > 12 kyr is applied to the TAC data) indicates that about 58 % of the TAC variability observed in the EDC ice core over the last 440 ka is explained by the half-year summer temperature at the EDC, which suggests that summer temperature variations in the central part of East Antarctica can be regarded as the main driving forcing factor of TAC. The slope of the regression shows an increase of 0.0012 cm3 in TAC per gram of ice for a cooling of 1 °C of the mean half-year summer local temperature at the EDC. The regression analysis has also been evaluated by using the raw TAC data and a low-pass filter of >6 kyr. The good anti-correlation between TAC and the summer temperature is not altered, although the regression slope is slightly affected with an increase of about 0.0011 cm3 in TAC per gram of ice for a cooling of 1 °C. Hence, we propose that the link between summer insolation and TAC variations exists through the summer temperature changes (see also Sect. 6). Indeed, as proposed in previous studies (Lipenkov et al., 2011; Raynaud et al., 2007), the local summer insolation controls the near-surface snow temperature and the vertical temperature gradients in snow. In turn, the latter could affect the near-surface snow structure and consequently the porosity of the firn pores at close-off, i.e., the TAC. The good correlation between the two independent climate variables, TAC measured from ice cores and summer temperature simulated by the LOVECLIM1.3 model, indicates that the EDC TAC record can be used as a proxy for local summer temperature. The relationship between the TAC record from the EDC ice core and local summer temperature should be further investigated in other ice cores from Antarctica and Greenland.
In our study, we did not account for variations in surface elevation. In principle, during glacial periods, the reduced surface accumulation rate leads to lower surface elevation (Raynaud et al., 2007), but there are also dynamical effects which make these reconstructions of surface elevation uncertain. Surface elevation changes affect our study in two different ways. Firstly, TAC should be corrected for atmospheric pressure changes to get a record of porosity at close-off. Some of these atmospheric pressure changes are due to variations in surface elevation, and another part might be due to the change in atmospheric conditions (like the temperature of the air column). Because the reconstruction of surface elevation changes is uncertain, we have chosen not to correct for this effect. Secondly, surface elevation changes should also be ideally taken into account in our LOVECLIM1.3 simulations of summer or annual temperature changes at the EDC. Unfortunately, in our climate model, the Antarctic ice sheet is fixed, and we did not account for surface elevation changes. We could apply an a posteriori correction for surface elevation changes, but, because the temperature variations (either annual or in summer) are probably underestimated, applying this a posteriori correction would have too strong an influence. Finally, we should note that these two elevation corrections (for TAC and for the climate model) go in the same direction: during glacials, a corrected summer temperature would be warmer, and the corrected TAC of the ice would be smaller, so there is a chance that these two corrections would cancel each other out and that the overall correlation between TAC and the modeled summer temperature would not be much affected.
A wavelet analysis (Fig. 5a and b) shows that the variations in both TAC and the simulated summer temperature are dominated by the ∼40 kyr cycle throughout the last 440 ka, indicating the major role of obliquity. They also contain a ∼20 kyr cycle, but this cycle is not stable in time, with an amplitude which is relatively strong, for instance, around 100 and 200 ka in both TAC and the simulated summer temperature but weak during other periods. This may be related to the amplitude modulation of eccentricity on precession (Berger and Loutre, 1991). The eccentricity at ∼100, 200 and 300 ka was large, leading to large variations in precession and thus stronger effects of precession around these time intervals than during other times. However, the power of obliquity is generally more important than the one of precession when considering the past 440 ka, in particular around 400 ka and during the last 50 ka when eccentricity was small, leading to small variations in precession. The 100 kyr periodicity is also observed in both TAC and the simulated summer temperature but with a weak amplitude. This weak signature of the 100 kyr cycle in both the TAC and the mean half-year summer temperature must not arise from the mean summer insolation because there is no 100 kyr cycle in the mean insolation (Fig. 5c). It must arise from the glacial–interglacial boundary condition changes which are characterized by a major periodicity of 100 kyr (see Sect. 5).
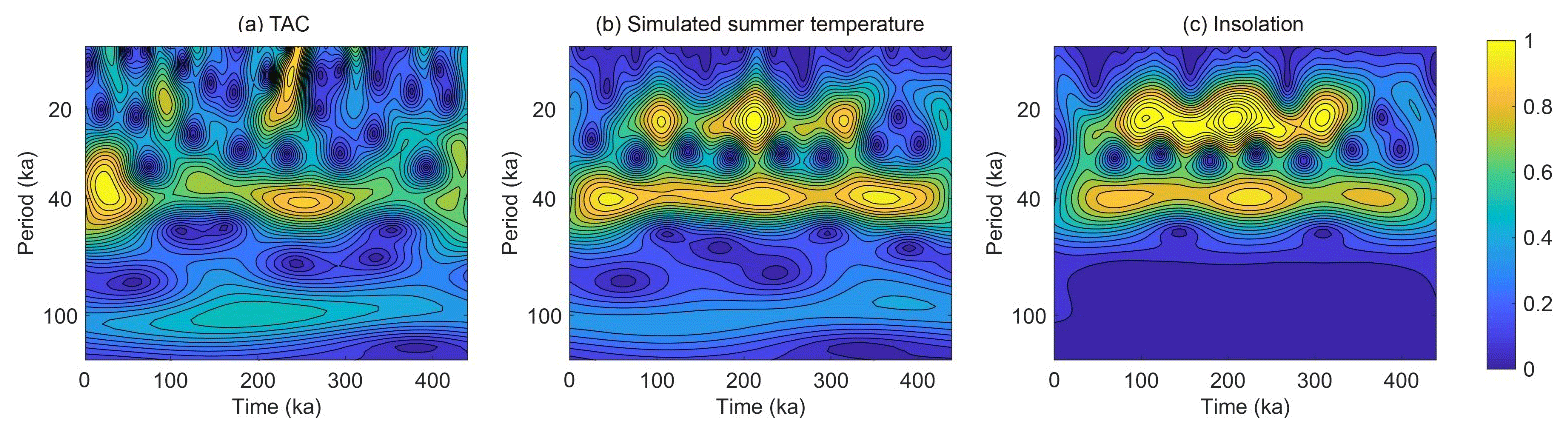
Figure 5Continuous wavelet transforms of (a) the low-pass (>12 kyr) filtered TAC record, (b) the simulated mean half-year summer temperature at the EDC site and (c) the mean insolation during astronomical summer half-year at 75° S.
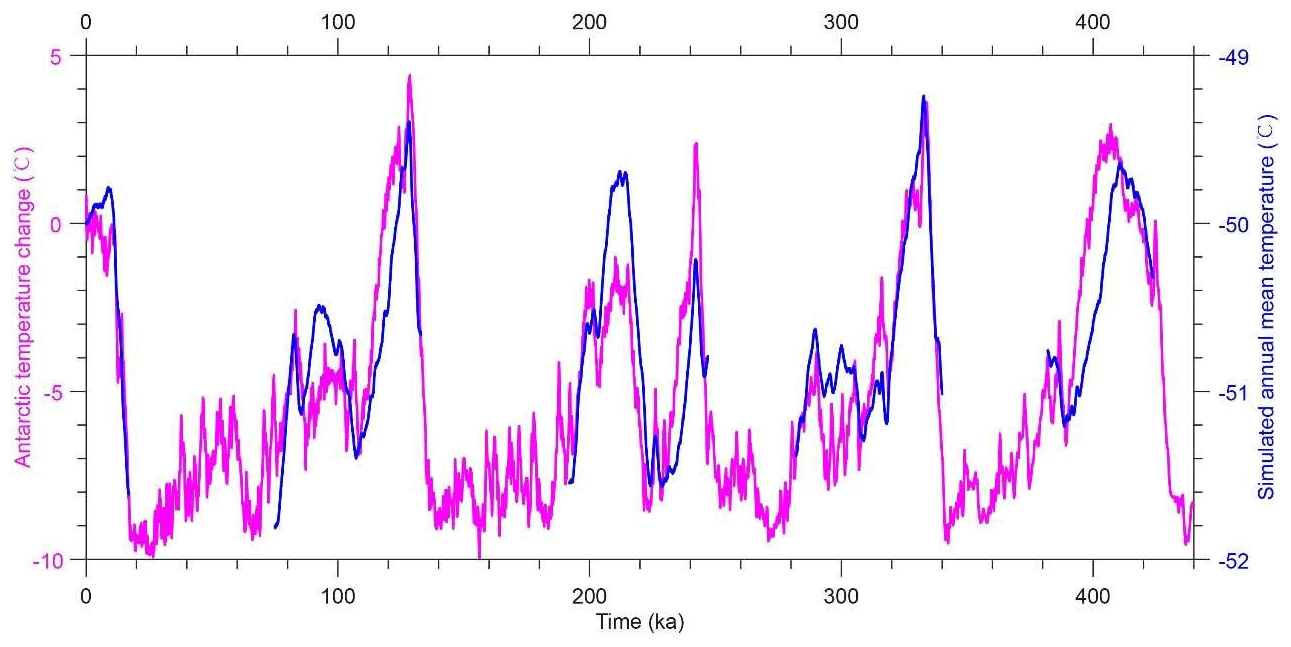
Figure 6Comparison of the EDC mean annual temperature change record (pink line; Jouzel et al., 2007) with the simulated annual mean temperature of the OrbGHGIce experiments (blue line; this study).
The δD record from Antarctic ice has been widely used as an important proxy for mean annual precipitation-weighted condensation temperature over Antarctica (Jouzel et al., 2007; Stenni et al., 2010), although it has also been suggested to be biased toward winter temperatures (Laepple et al., 2011). We use it in the present work as a record of the EDC mean annual temperature. Differently from the TAC record, which is dominated by the 40 kyr cycle, the EDC δD record is dominated by the ∼100 kyr cycle (Fig. 1). The difference in the dominant periodicities between the TAC and δD records suggests that the major driving factors for the summer and annual mean temperatures are different. As shown above, TAC is strongly linked to local summer temperature which is mainly controlled by the local summer insolation. However, the dominant 100 kyr cycle in the δD record suggests that the annual mean temperature is mainly controlled by the glacial–interglacial boundary conditions such as global ice volume and GHGs which are dominated by a strong 100 kyr cycle (Fig. 1).
To investigate the response of Antarctic climate to insolation, GHGs and ice sheets, the three sets of transient simulations (Orb, OrbGHG and OrbGHGIce; see Sect. 2) which cover the last five interglacial–glacial episodes are analyzed here. We first compare the δD-based temperature reconstruction with the simulated annual mean temperature of OrbGHGIce (Fig. 6). We observe that this comparison is quite good over the simulation periods in terms of climate variation pattern, showing the capacity of the model to simulate the orbital-scale climate variations at the EDC site. One may also note that the magnitude of the temperature change between glacial and interglacial is significantly underestimated in the model as compared to the reconstruction. In our simulation, the Antarctic ice sheet and the sea level are kept invariant, which could contribute at least partly to the underestimated amplitude of temperature change in the model. However, a recent study using borehole thermometry and firn properties suggests that the temperature reconstruction using water-stable isotopes calibrated against modern spatial gradients could generate an amplitude of glacial–interglacial temperature change that is too large (Buizert et al., 2021). For example, at the EDC site, the Last Glacial Maximum (∼26–18 ka) temperature relative to the pre-industrial time is about −9 °C according to the δD-based reconstruction (Jouzel et al., 2007), but it is only °C in a more recent reconstruction (Buizert et al., 2021). In our simulation, the EDC annual temperature at 17 ka is −1.7 °C relative to the pre-industrial era, and the largest simulated glacial–interglacial amplitude is ∼3 °C, which is within the uncertainty of the recent reconstruction (Buizert et al., 2021). Nevertheless, such small glacial–interglacial difference found in our study seems difficult to explain taking into account the relationship between snow accumulation rate and surface temperature from the saturation–vapor relationship (Cauquoin et al., 2015). However, what is essential for our study is that the model could capture the orbital-scale variability in the reconstructed temperature.
To investigate the relative effect of insolation, GHGs and NH ice sheets on the summer and annual temperatures at the EDC, we take the 133–75 ka period, which includes the last interglacial period and the glacial inception, as an example to compare the Orb, OrbGHG and OrbGHGIce experiments (Fig. 7). As expected, the annual and summer temperatures at the EDC are reduced in response to reduced GHGs and increased NH ice sheets (Fig. 7b and d), with the impact of GHGs being larger than that of the NH ice sheets for both simulated temperatures. As far as the summer temperature is concerned, the variation pattern of OrbGHG and OrbGHGICE is very similar to the one of Orb (Fig. 7b), showing the minor effect of GHGs and NH ice sheets on the temporal variations in summer temperature. Over this period, the largest summer temperature change caused by insolation is 4.4 °C, while it is 1 °C for GHGs and 0.3 °C for ice sheets. However, when the simulated annual temperature is considered (Fig. 7d), its variation pattern is largely altered in response to changes in GHGs and NH ice sheets. Over this period, the largest annual temperature change caused by insolation is 1.2 °C, while it is 1 °C for GHGs and 0.5 °C for ice sheets. These results clearly show that, as compared to insolation, GHGs and NH ice sheets have a relatively weaker effect on the summer temperature, but they have a relatively stronger effect on annual mean temperature. This, at least partly, explains why the TAC and δD records display different dominant periodicities over long timescales.
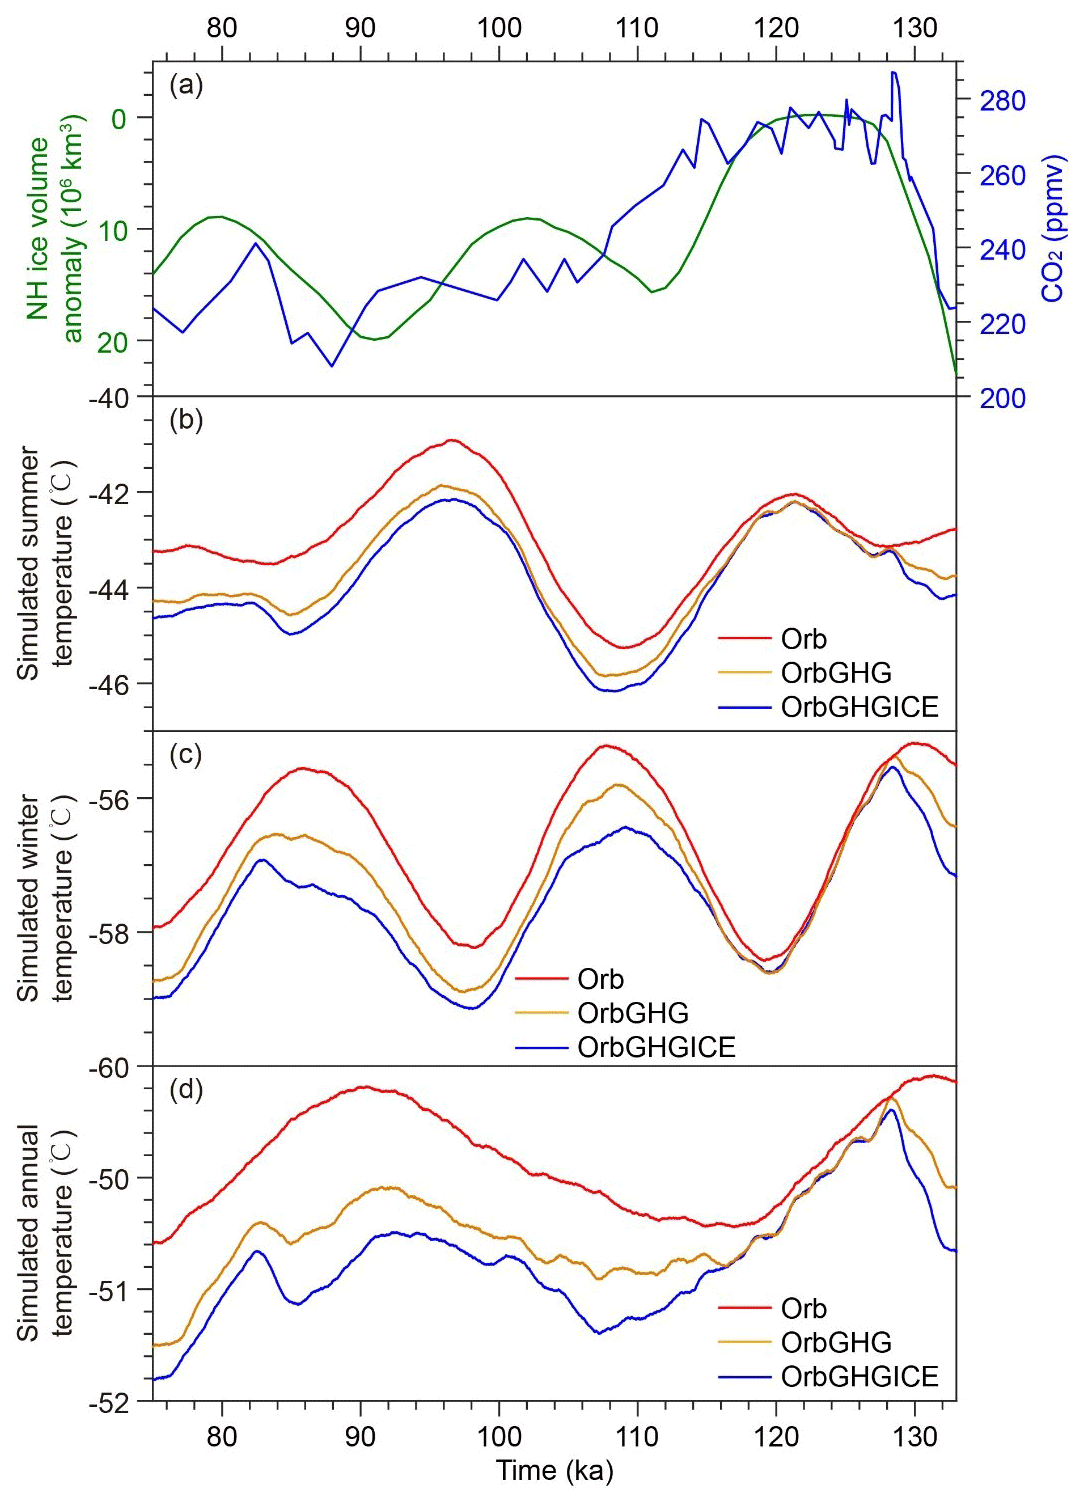
Figure 7Effect of insolation, GHGs and NH ice sheets on the summer, winter and annual temperatures at the EDC site. (a) CO2 concentration (blue; Lüthi et al., 2008) and NH ice volume anomaly as compared to pre-industry (green; Ganopolski and Calov, 2011). (b) Simulated mean half-year summer (October–March) temperature, (c) simulated mean half-year winter (April–September) temperature and (d) simulated annual mean temperature from the Orb, OrbGHG and OrbGHGICE experiments. The results of the LOVECLIM1.3 transient simulation without acceleration for the period 133–75 ka are used.
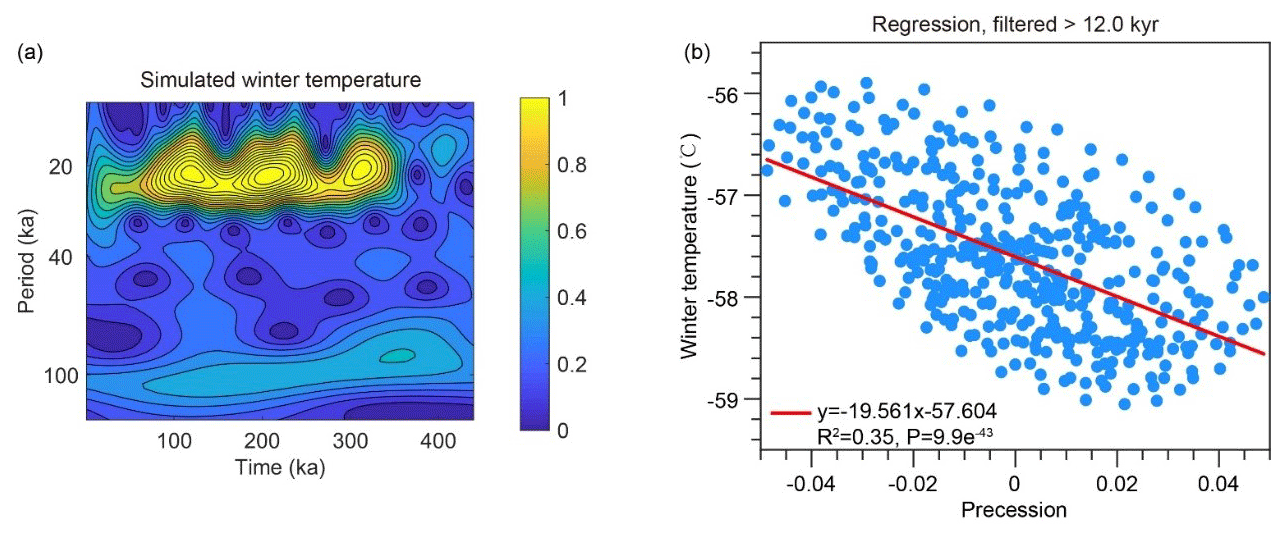
Figure 8(a) Continuous wavelet transform of the simulated mean half-year winter temperature at the EDC site from the 10× accelerated OrbGHG simulation and (b) correlation between this winter temperature and precession. Low-pass-filtered >12 kyr is applied to the winter temperature raw data.
To better understand the difference between the summer and annual mean temperatures, the simulated winter temperature is also analyzed. The wavelet analysis of the half-year winter temperature shows a very strong ∼20 kyr cycle and an obvious ∼100 kyr cycle, but the ∼40 kyr cycle is very weak (Fig. 8a). The 100 kyr cycle results are most probably from the effect of GHGs. The very strong 20 kyr cycle but very weak 40 kyr cycle is quite intriguing. As far as insolation is concerned, the low-latitude insolation is dominated by the ∼20 kyr precession cycle. As the solar energy received in Antarctica is very weak during local winter, the strong 20 kyr cycle in the simulated winter temperature could reflect a strong effect of the low-latitude climate on the Antarctica temperature during austral winter, possibly via meridional oceanic and atmospheric heat transport. Figure 8b shows a high negative correlation between the simulated EDC winter temperature and precession. This indicates that the EDC winter temperature is strongly affected by boreal summer insolation at low latitudes (small precession parameter leads to high boreal summer insolation and vice versa). It is also shown in Yin and Berger (2012) that during some interglacials such as Marine Isotope Stages 5e, 15 and 17, which are characterized by strong boreal summer insolation, a strong warming could be induced over Antarctica during austral winter, a warming which is even stronger than in many other regions due to polar amplification. Similarly to what happens to the summer temperature, orbital forcing also plays a dominant role in the winter temperature at the EDC (Fig. 7c). As explained above, the winter temperature at the EDC is actually strongly driven by precession and boreal summer insolation, so, on a precession timescale, the orbitally induced temperature variation in winter is in anti-phase with the summer temperature, which is strongly driven by austral summer insolation. This anti-phase relationship leads to a strong weakening of the orbital signal, especially the precession signal, in the mean annual temperature (Fig. 7d), making the effect of GHGs and ice sheets more pronounced and thus leading to strong glacial cycles in the mean annual temperature.
The possible mechanism by which summer temperature and near-surface-temperature gradients can affect the pore volume at close-off, Vc, has been proposed assuming a homogenous firn column and neglecting the sealing effect on the total amount of air trapped in ice (Lipenkov et al., 2011; Raynaud et al., 2007). This simplification seems to be reasonable for low-accumulation sites such as the EDC, Vostok and Dome Fuji because at those sites (1) the horizontal extent of snow layers characterized by different physical properties, as a rule, does not exceed a few meters, which suggests a patchy pattern of their spatial distribution on and below the ice sheet surface (Ekaykin et al., 2023; Fujita et al., 2009), and (2) the variability in the density (Hörhold et al., 2011) and microstructural properties (Gregory et al., 2014) of firn is relatively low, as is the stratigraphic-scale variability in the air content of ice (Lipenkov et al., 1997, 2011). In addition, the firn can be affected by layering. Pore closure in denser layers occurs at a shallower depth compared to the pore closure for layers that are less dense. However, in sites with low accumulation it was shown that, regardless of their density (denser or less dense), Vc and hence V are similar in both types of layers (Fourteau et al., 2019).
The snow metamorphism on the cold Antarctic Plateau is essentially a summertime phenomenon. It speeds up when the temperature of the uppermost layers of snow rises well above the mean annual temperature, thus increasing both the equilibrium concentration of water vapor in the snow pores and the temperature gradients in the near-surface snow. Elevated temperatures and strong temperature gradients promote the rapid growth of snow grains and the formation of a coarse-grained snow structure. Small-scale stratigraphic variations in the snow structure, which are typical in the upper few meters of the snow column, progressively disappear with depth (Alley, 1980), while the average grain size remains related to temperature conditions prevailing at the time of snow diagenesis near the ice sheet surface.
According to the model proposed by Arnaud (1997) for the Antarctic ice sheet, the pore volume at close-off, Vc, should increase with the mean annual surface temperature through the competing densification mechanisms: higher temperature leads to an increase in the relative critical density at the transition between snow and firn (at EDC the critical density is reached at a depth of about 25 m below surface), which in turn implies a greater proportion of the ice grain edges occupied by pores at close-off and hence a larger Vc. Our work (Fig. 1) shows a poor correlation and large spectral differences between TAC and mean annual surface temperatures. In contrast we observe a strong anti-correlation between TAC and the simulated mean surface summer temperature. This observation suggests that summer temperature has an inverse effect on Vc compared to the mean annual temperature. Indeed, TAC increases with the ratio of the number of pores to the number of ice crystals at close-off. This latter parameter depends on the critical density of the snow, D0, which corresponds to the transition between grain boundary sliding (GBS) and power law creep (PLC) as the dominant densification mechanism: the higher the critical density of snow, the greater the number of pores per grain and therefore the larger the TAC value at close-off (Arnaud, 1997). Since GBS decreases for larger grains (Alley, 1987), while PLC does not depend much on the grain size, D0 should also decrease when the grains are big.
Thus, time periods with a warmer local summer temperature (due to high local insolation) promote a coarser-grained snow structure and hence lower critical density of snow and reduced TAC at pore closure and vice versa. This mechanism is proposed here to explain the strong anti-correlation observed between TAC and the mean summer surface temperature. A numerical model, which takes into account the successive mechanisms involved between the surface snow and the closure of pores, is still required.
The lack of seasonal temperature reconstruction on Antarctica hampers a good understanding of the forcing and mechanism of climate changes over this climatically sensitive region. In this study, we revisit the TAC record measured in the EDC ice core covering the last 440 ka. We show that it is dominated by a 40 kyr periodicity and is anti-correlated with the local mean insolation over the astronomical half-year summer. In order to further investigate this link between local summer insolation changes and TAC variations, we look into the correlation between the EDC TAC record and simulated local summer temperature changes by the LOVECLIM1.3 model. We also evidence an anti-correlation between those two independent variables. We explain the anti-correlations between the local summer insolation and the EDC TAC, as well as between the local summer temperature and the EDC TAC, by proposing that (1) the local summer insolation controls the development of strong temperature gradients in the near-surface snow during the summer, (2) those summer temperature gradients are then modifying the surface snow structure and (3) eventually these snow structure changes propagate through the firn during the densification process down to the close-off depth where they impact the pore volume, i.e., the TAC of air bubbles (Lipenkov et al., 2011; Raynaud et al., 2007). These results point towards the fact that the EDC TAC record could be used as a unique proxy for local summer temperature. Future studies should investigate this relationship between TAC variations and local summer temperature changes in other ice core records drilled in Antarctica and Greenland.
The comparison between TAC and δD records indicates that the major driving factors for the summer and annual mean temperatures are different at the EDC. TAC is strongly linked to local summer temperature, while the annual mean temperature is strongly controlled by the glacial–interglacial boundary conditions like the global ice volume and GHGs. We show that the LOVECLIM1.3 model could capture the orbital-scale variability in the δD-based temperature reconstruction. Our transient simulation, which allows us to investigate the relative effect of insolation, atmospheric greenhouse gas concentrations and NH ice sheet volume changes, shows that, as compared to insolation, GHGs and NH ice sheets have a weak effect on the summer temperature but a strong effect on annual mean temperatures. Future modeling studies should also investigate the impact of past Antarctic ice sheet changes on local summer temperatures and consequently on TAC records. Overall, our model results confirm the hypothesis made from the spectral characteristics of the EDC TAC and δD records, explaining why these two records display different orbital periodicities.
The data used in this study are available at https://doi.org/10.5281/zenodo.11096723 (Raynaud et al., 2024).
The supplement related to this article is available online at: https://doi.org/10.5194/cp-20-1269-2024-supplement.
DR and QY designed the research. QY, ZW and AB performed the research related to the LOVECLIM1.3 simulations. DR, FP, EC and VL performed the research based on the EDC TAC record. QY, EC and DR wrote a draft of the paper with subsequent inputs from all the other authors.
At least one of the (co-)authors is a member of the editorial board of Climate of the Past. The peer-review process was guided by an independent editor, and the authors also have no other competing interests to declare.
Publisher's note: Copernicus Publications remains neutral with regard to jurisdictional claims made in the text, published maps, institutional affiliations, or any other geographical representation in this paper. While Copernicus Publications makes every effort to include appropriate place names, the final responsibility lies with the authors.
This article is part of the special issue “Ice core science at the three poles (CP/TC inter-journal SI)”. It is not associated with a conference.
The authors would like to warmly thank Jean Jouzel and Paul Duval for insightful discussions. The authors are also grateful to the two anonymous reviewers and Edward Brook for their constructive comments that helped improve this study. This work is a contribution to EPICA, a joint European Science Foundation/European Commission (EU) scientific program, funded by the EU and by national contributions from Belgium, Denmark, France, Germany, Italy, The Netherlands, Norway, Sweden, Switzerland, and the UK. The main logistical support was provided by IPEV and PNRA (at Dome C) and AWI (at Dronning Maud Land). This is EPICA publication no. 322.
The modelling part of this work was supported by the Fonds de la Recherche Scientifique-FNRS (F.R.S-FNRS) under grant nos. T.0246.23 and T.W019.23. Qiuzhen Yin is a research associate at F.R.S.-FNRS. Zhipeng Wu is supported by the F.R.S.-FNRS grant no. T.0246.23. Computational resources have been provided by the supercomputing facilities of the Université catholique de Louvain (CISM/UCL) and the Consortium des Équipements de Calcul Intensif en Fédération Wallonie Bruxelles (CÉCI) funded by the Fond de la Recherche Scientifique de Belgique (F.R.S.-FNRS) under convention 2.5020.11. The research leading to these results has received funding from the French National Research Agency under “Programme d'Investissements d'Avenir” (ANR-19-MPGA-0001) through the Make Our Planet Great Again HOTCLIM project. Emilie Capron also acknowledges financial support from the AXA Research Fund.
This paper was edited by Edward Brook and reviewed by two anonymous referees.
Alley, R. B.: Densification and Recrystallization of Firn at Dome C, East Antarctica, Institute of Polar Studies, The Ohio State University, Columbus, Ohio, https://kb.osu.edu/items/43b2d2ab-503a-5a53-a962-c433e371c064 (last access: 7 June 2024), 1980.
Alley, R. B.: Firn densification by grain boundary sliding, J. Phys. (Paris), 48, 249–256, 1987.
Anderson, D. L. and Benson, G. S.: The densification and diagenesis of snow: properties, processes and applications, in: Ice and snow: properties, processes, and applications, edited by: Kingery, V. V. D., MIT Press, Cambridge, MA, 391–411, https://authors.library.caltech.edu/records/jm9c7-3d977 (last access: 7 June 2024), 1963.
Arnaud, L.: Modélisation de la transformation de la neige en glace à la surface des calottes polaires, étude du transport des gaz dans ces milieux poreux, PhD thesis, Université Joseph Fourier, Grenoble, https://archivesic.ccsd.cnrs.fr/UNIV-GRENOBLE1/tel-00709566 (last access: 7 June 2024), 1997.
Bazin, L., Landais, A., Lemieux-Dudon, B., Toyé Mahamadou Kele, H., Veres, D., Parrenin, F., Martinerie, P., Ritz, C., Capron, E., Lipenkov, V., Loutre, M.-F., Raynaud, D., Vinther, B., Svensson, A., Rasmussen, S. O., Severi, M., Blunier, T., Leuenberger, M., Fischer, H., Masson-Delmotte, V., Chappellaz, J., and Wolff, E.: An optimized multi-proxy, multi-site Antarctic ice and gas orbital chronology (AICC2012): 120–800 ka, Clim. Past, 9, 1715–1731, https://doi.org/10.5194/cp-9-1715-2013, 2013.
Bender, M. L.: Orbital tuning chronology for the Vostok climate record supported by trapped gas composition, Earth Planet. Sc. Lett., 204, 275–289, 2002.
Bereiter, B., Eggleston, S., Schmitt, J., Nehrbass-Ahles, C., Stocker, T. F., Fischer, H., Kipfstuhl, S., and Chappellaz, J.: Revision of the EPICA Dome C CO2 record from 800 to 600 yr before present, Geophys. Res. Lett., 42, 542–549, 2015.
Berger, A.: Long-Term Variations of Daily Insolation and Quaternary Climatic Changes, J. Atmos. Sci., 35, 2362–2367, https://doi.org/10.1175/1520-0469(1978)035<2362:LTVODI>2.0.CO;2, 1978.
Berger, A. and Loutre, M. F.: Insolation values for the climate of the last 10 million years, Quaternary Sci. Rev., 10, 297–317, 1991.
Berger, A. and Loutre, M. F.: Long-term variations of the astronomical seasons, in: Topics in Atmospheric and Interstellar Physics and Chemistry. Les Ulis: Les Editions de Physique, edited by: Boutron, C., Les Editions de la physique, 33–61, ISBN 2-86883-241-5, 1994.
Berger, A. and Yin, Q. Z.: Astronomical theory and orbital forcing, in: The Sage handbook of environmental change, edited by: Matthews, J. A., Bartlein, P. J., Briffa, K. R., Dawson, A. G., de Vernal, A., Denham, T., Fritz, S. C., and Oldfield, F., SAGE, London, 405–425, https://doi.org/10.4135/9781446253045.n19, 2012.
Berger, A., Loutre, M. F., and Tricot, C.: Insolation and Earth's orbital periods, J. Geophys. Res.-Atmos., 98, 10341–10362, https://doi.org/10.1029/93JD00222, 1993.
Berger, A., Loutre, M. F., and Yin, Q.: Total irradiation during any time interval of the year using elliptic integrals, Quaternary Sci. Rev., 29, 1968–1982, 2010.
Berger, A., Yin, Q. Z., and Wu, Z. P.: Length of astronomical seasons, total and average insolation over seasons, Quaternary Sci. Rev., 334, 108620, https://doi.org/10.1016/j.quascirev.2024.108620, 2024.
Bouchet, M., Landais, A., Grisart, A., Parrenin, F., Prié, F., Jacob, R., Fourré, E., Capron, E., Raynaud, D., Lipenkov, V. Y., Loutre, M.-F., Extier, T., Svensson, A., Legrain, E., Martinerie, P., Leuenberger, M., Jiang, W., Ritterbusch, F., Lu, Z.-T., and Yang, G.-M.: The AICC2023 chronological framework and associated timescale for the EPICA Dome C ice core, EGUsphere [preprint], https://doi.org/10.5194/egusphere-2023-1081, 2023.
Buizert, C., Fudge, T. J., Roberts, W. H. G., Steig, E. J., Sherriff-Tadano, S., Ritz, C., Lefebvre, E., Edwards, J., Kawamura, K., Oyabu, I., Motoyama, H., Kahle, E. C., Jones, T. R., Abe-Ouchi, A., Obase, T., Martin, C., Corr, H., Severinghaus, J. P., Beaudette, R., Epifanio, J. A., Brook, E. J., Martin, K., Chappellaz, J., Aoki, S., Nakazawa, T., Sowers, T. A., Alley, R. B., Ahn, J., Sigl, M., Severi, M., Dunbar, N. W., Svensson, A., Fegyveresi, J. M., He, C., Liu, Z., Zhu, J., Otto-Bliesner, B. L., Lipenkov, V. Y., Kageyama, M., and Schwander, J.: Antarctic surface temperature and elevation during the Last Glacial Maximum, Science, 372, 1097–1101, 2021.
Cauquoin, A., Landais, A., Raisbeck, G. M., Jouzel, J., Bazin, L., Kageyama, M., Peterschmitt, J.-Y., Werner, M., Bard, E., and Team, A.: Comparing past accumulation rate reconstructions in East Antarctic ice cores using 10Be, water isotopes and CMIP5-PMIP3 models, Clim. Past, 11, 355–367, https://doi.org/10.5194/cp-11-355-2015, 2015.
Dome Fuji Ice Core Project Members: State dependence of climatic instability over the past 720,000 years from Antarctic ice cores and climate modeling, Sci. Adv., 3, e1600446, https://doi.org/10.1126/sciadv.1600446, 2017.
Eicher, O., Baumgartner, M., Schilt, A., Schmitt, J., Schwander, J., Stocker, T. F., and Fischer, H.: Climatic and insolation control on the high-resolution total air content in the NGRIP ice core, Clim. Past, 12, 1979–1993, https://doi.org/10.5194/cp-12-1979-2016, 2016.
Ekaykin, A. A., Lipenkov, V. Y., and Teben'kova, N. A.: Fifty years of instrumental surface mass balance observations in central Antarctica, J. Glaciol., https://doi.org/10.1017/jog.2023.53, in press, 2023.
Epifanio, J. A., Brook, E. J., Buizert, C., Pettit, E. C., Edwards, J. S., Fegyveresi, J. M., Sowers, T. A., Severinghaus, J. P., and Kahle, E. C.: Millennial and orbital-scale variability in a 54 000-year record of total air content from the South Pole ice core, The Cryosphere, 17, 4837–4851, https://doi.org/10.5194/tc-17-4837-2023, 2023.
Fourteau, K., Martinerie, P., Faïn, X., Schaller, C. F., Tuckwell, R. J., Löwe, H., Arnaud, L., Magand, O., Thomas, E. R., Freitag, J., Mulvaney, R., Schneebeli, M., and Lipenkov, V. Ya.: Multi-tracer study of gas trapping in an East Antarctic ice core, The Cryosphere, 13, 3383–3403, https://doi.org/10.5194/tc-13-3383-2019, 2019.
Fujita, S., Okuyama, J., Hori, A., and Hondoh, T.: Metamorphism of stratified firn at Dome Fuji, Antarctica: a mechanism for local insolation modulation of gas transport conditions during bubble close off, J. Geophys. Res., 114, F03023, https://doi.org/10.1029/2008JF001143, 2009.
Ganopolski, A. and Calov, R.: The role of orbital forcing, carbon dioxide and regolith in 100 kyr glacial cycles, Clim. Past, 7, 1415–1425, https://doi.org/10.5194/cp-7-1415-2011, 2011.
Goosse, H., Brovkin, V., Fichefet, T., Haarsma, R., Huybrechts, P., Jongma, J., Mouchet, A., Selten, F., Barriat, P. Y., Campin, J. M., Deleersnijder, E., Driesschaert, E., Goelzer, H., Janssens, I., Loutre, M. F., Morales, Maqueda, M. A., Opsteegh, T., Mathieu, P. P., Munhoven, G., Petterson, J. E., Renssen, H., Roche, D., Schaeffer, M., Tartinville, B., Timmermann, A., and Weber, S. L.: Description of the earth system model of intermediate complexity LOVECLIM version 1.2, Geosci. Model Dev., 3, 603–633, https://doi.org/10.5194/gmd-3-603-2010, 2010.
Gregory, S. A., Albert, M. R., and Baker, I.: Impact of physical properties and accumulation rate on pore close-off in layered firn, The Cryosphere, 8, 91–105, https://doi.org/10.5194/tc-8-91-2014, 2014.
Hörhold, M. W., Kipfstuhl, S., Wilhelms, F., Freitag, J., and Frenzel, A.: The densification of layered polar firn. J. Geophys. Res.-Earth, 116, F01001, https://doi.org/10.1029/2009JF001630, 2011.
Huybers, P. J. and Denton, G. H.: Antarctic temperature at orbital timescales controlled by local summer duration, Nat. Geosci., 1, 787–792, 2008.
Jones, T. R., Cuffey, K. M., Roberts, W. H. G., Markle, B. R., Steig, E. J., Stevens, C. M., Valdes, P. J., Fudge, T. J., Sigl, M., Hughes, A. G., Morris, V., Vaughn, B., Garland, J., Vinther, B. M., Rozmiarek, K. S., Brashear, C. A., and White, J. W. C.: Seasonal temperatures in West Antarctica during the Holocene, Nature, 613, 292–297, 2023.
Jouzel, J., Masson-Delmotte, V., Cattani, O., Dreyfus, G., Falourd, S., Hoffmann, G., Minster, B., Nouet, J., Barnola, J.-M., Fisher, H., Gallet, J.-C., Johnsen, S., Leuenberger, M., Loulergue, L., Luethi, D., Oerter, H., Parrenin, F., Raisbeck, G., Raynaud, D., Schilt, A., Schwander, J., Selmo, J., Souchez, R., Spahni, R., Stauffer, B., Steffensen, J. P., Stenni, B., Stocker, T. F., Tison, J.-L., Werner, M., and Wolff, E. W.: Orbital and millennial Antarctic climate variability over the past 800,000 years, Science, 317, 793–796, 2007.
Kawamura, K., Parrenin, F., Lisiecki, L., Uemura, R., Vimeux, F., Severinghaus, J. P., Hutterli, M. A., Nakazawa, T., Aoki, S., Jouzel, J., Raymo, M. E., Matsumoto, K., Nakata, H., Motoyama, H., Fujita, S., Goto-Azuma, K., Fujii, K.,and Watanabe, O.: Northern hemisphere forcing of climatic cyles over the past 360,000 years implied by accurately dated Antarctic ice cores, Nature, 448, 912–916, 2007.
Laepple, T., Werner, M., and Lohmann, G. S.: Synchronicity of Antarctic temperatures and local solar insolation on orbital timescales, Nature, 471, 91–94, 2011.
Landais, A., Dreyfus, G., Capron, E., Pol, K., Loutre, M. F., Raynaud, D., Lipenkov, V. Y., Arnaud, L., Masson-Delmotte, V., Paillard, D., Jouzel, J., and Leuenberger, M.: Towards orbital dating of the EPICA Dome C ice core using δO2/N2, Clim. Past, 8, 191–203, https://doi.org/10.5194/cp-8-191-2012, 2012.
Lipenkov, V., Candaudap, F., Ravoire, J., Dulac, E., and Raynaud, D.: A new device for air content measurements in polar ice, J. Glaciol., 41, 423–429, https://doi.org/10.3189/S0022143000016294, 1995.
Lipenkov, V. Y., Salamatin, A. N., and Duval, P.: Bubbly-ice densification in ice sheets: II. Applications, J. Glaciol., 43, 397–407, 1997.
Lipenkov, V. Y., Raynaud, D., Loutre, M. F., and Duval, P.: On the potential of coupling air content and O2/N2 from trapped air for establishing an ice core chronology tuned on local insolation, Quaternary Sci. Rev., 30, 3280–3289, https://doi.org/10.1016/j.quascirev.2011.07.013, 2011.
Lisiecki, L. E. and Raymo, M. E.: Plio-Pleistocene Stack of 57 Globally Distributed Benthic δ18O Records, Paleoceanography, 20, PA1003, https://doi.org/10.1029/2004PA001071, 2005.
Loulergue, L., Schilt, A., Spahni, R., Masson-Delmotte, V., Blunier, T., Lemieux, B., Barnola, J. M., Raynaud, D., Stocker, T. F., and Chappellaz, J.: Orbital and millennial-scale features of atmospheric CH4 over the past 800,000 years, Nature, 453, 383–386, 2008.
Lüthi, D., Le Floch, M., Bereiter, B., Blunier, T., Barnola, J.-M., Siegenthaler, U., Raynaud, D., Jouzel, J., Fischer, H., Kawamura, K., and Stocker, T. F.: High-resolution carbon dioxide concentration record 650,000–800,000 years before present, Nature, 453, 379–382, 2008.
Martinerie, P., Raynaud, D., Etheridge, D. M., Barnola, J.-M., and Mazaudier, D.: Physical and climatic parameters which influence the air content in polar ice, Earth Planet. Sc. Lett., 112, 1–13, https://doi.org/10.1016/0012-821X(92)90002-D, 1992.
Martinerie, P., Lipenkov, V. Y., Raynaud, D., Chappellaz, J., Barkov, N. I., and Lorius, C.: The air content paleo record in the Vostok ice core (Antarctica): a mixed record of climatic and glaciological parameters, J. Geophys. Res., 99, 10565–10576, https://doi.org/10.1029/93JD03223, 1994.
Raynaud, D., Lipenkov, V., Lemieux-Dudon, B., Duval, P., Loutre, M.-F., and Lhomme, N.: The local insolation signature of air content in Antarctic ice. A new step toward an absolute dating of ice records, Earth Planet. Sci. Lett., 261, 337–349, https://doi.org/10.1016/j.epsl.2007.06.025, 2007.
Raynaud, D., Qiuzhen, Y., and Capron, E.: Raynaud et al_Climate_of_the_Past2024_Data [Data set], Zenodo [data set], https://doi.org/10.5281/zenodo.11096723, 2024.
Schilt, A., Baumgartner, M., Schwander, J., Buiron, D., Capron, E., Chappellaz, J., Loulergue, L., Schüpbach, S., Spahni, R., Fischer, H., and Stocker, T. F.: Atmospheric nitrous oxide during the last 140,000 years, Earth Planet. Sc. Lett., 300, 33–43, 2010.
Stenni, B., Selmo, E., Masson-Delmotte, V., Oerter, H., Meyer, H., Röthlisberger, R., Jouzel, J., Cattani, O., Falourd, S., Fischer, H., Hoffmann, G., Lacumin, P., Johnsen, S. J., and Minster, B.: The deuterium excess records of EPICA Dome C and Dronning Maud Land ice cores (East Antarctica), Quaternary Sci. Rev., 29, 146–159, 2010.
Veres, D., Bazin, L., Landais, A., Toyé Mahamadou Kele, H., Lemieux-Dudon, B., Parrenin, F., Martinerie, P., Blayo, E., Blunier, T., Capron, E., Chappellaz, J., Rasmussen, S. O., Severi, M., Svensson, A., Vinther, B., and Wolff, E. W.: The Antarctic ice core chronology (AICC2012): an optimized multi-parameter and multi-site dating approach for the last 120 thousand years, Clim. Past, 9, 1733–1748, https://doi.org/10.5194/cp-9-1733-2013, 2013.
Wu, Z. P., Yin, Q. Z., Ganopolski, A., Berger, A., and Guo, Z. T.: Effect of Hudson Bay closure on global and regional climate under different astronomical configurations, Global Planet. Change, 222, 104040, https://doi.org/10.1016/j.gloplacha.2023.104040, 2023.
Yin, Q. and Berger, A.: Interglacial analogues of the Holocene and its natural near future, Quaternary Sci. Rev., 120, 28–46, 2015.
Yin, Q. Z. and Berger, A.: Individual contribution of insolation and CO2 to the interglacial climates of the past 800 000 years, Clim. Dynam., 38, 709–724., https://doi.org/10.1007/s00382-011-1013-5, 2012.
Yin, Q. Z., Wu, Z. P., Berger, A., Goosse, H., and Hodell, D.: Insolation triggered abrupt weakening of Atlantic circulation at the end of interglacials, Science, 373, 1035–1040, 2021.
- Abstract
- Introduction
- Method
- EDC TAC changes vs. local summer insolation variations over the past 440 ka
- EDC TAC changes vs. local summer temperature changes simulated by the LOVECLIM1.3 model
- Deciphering the driving forcing of past Antarctic summer and annual temperature changes
- Possible mechanisms linking TAC and local summer temperature
- Conclusions
- Data availability
- Author contributions
- Competing interests
- Disclaimer
- Special issue statement
- Acknowledgements
- Financial support
- Review statement
- References
- Supplement