the Creative Commons Attribution 4.0 License.
the Creative Commons Attribution 4.0 License.
 | 28 May 2024
Drivers of late Holocene ice core chemistry in Dronning Maud Land: the context for the ISOL-ICE project
V. Holly L. Winton
Robert Mulvaney
Joel Savarino
Kyle R. Clem
Within the framework of the Isotopic Constraints on Past Ozone Layer in Polar Ice (ISOL-ICE) project, we present initial ice core results from the new ISOL-ICE ice core covering the last millennium from high-elevation Dronning Maud Land (DML) and discuss the implications for interpreting the stable isotopic composition of nitrogen in ice core nitrate (δ15N(NO)) as a surface ultra-violet radiation (UV) and total column ozone (TCO) proxy. In the quest to derive TCO using δ15N(NO), an understanding of past snow accumulation changes, as well as aerosol source regions and present-day drivers of their variability, is required. We therefore report here the ice core age–depth model, the snow accumulation and ice chemistry records, and correlation analysis of these records with climate variables over the observational era (1979–2016). The ISOL-ICE ice core covers the last 1349 years from 668 to 2017 CE ± 3 years, extending previous ice core records from the region by 2 decades towards the present and shows excellent reproducibility with those records. The extended ISOL-ICE record of last 2 decades showed a continuation of the methane sulfonate (MSA−) increase from ∼ 1800 to present while there were less frequent large deposition events of sea salts relative to the last millennium. While our chemical data do not allow us to distinguish the ultimate (sea ice or the open ocean) source of sea salt aerosols in DML winter aerosol, our correlation analysis clearly suggests that it is mainly the variability in atmospheric transport and not the sea ice extent that explains the interannual variability in sea salt concentrations in DML. Correlation of the snow accumulation record with climate variables over the observational era showed that precipitation at ISOL-ICE is predominately derived from the South Atlantic with onshore winds delivering marine air masses to the site. The snow accumulation rate was stable over the last millennium with no notable trends over the last 2 decades relative to the last millennium. Interannual variability in the accumulation record, ranging between 2 and 20 cm a−1 (w.e.), would influence the ice core δ15N(NO) record. The mean snow accumulation rate of 6.5±2.4 cm a−1 (w.e.) falls within the range suitable for reconstructing surface mass balance from ice core δ15N(NO), highlighting that the ISOL-ICE ice core δ15N(NO) can be used to reconstruct either the surface mass balance or surface UV if the ice core δ15N(NO) is corrected for the snow accumulation influence, thereby leaving the UV imprint in the δ15N(NO) ice core record to quantify natural ozone variability.
- Article
(9467 KB) - Full-text XML
- BibTeX
- EndNote


The stratospheric ozone O3 layer shields all land-based life forms from harmful ultraviolet (UV-B) radiation. Assessing the natural variability of total column ozone (TCO) before the instrumental era is critical to put modern observations (Brönnimann et al., 2003; Bodeker et al., 2021) into historical context, but this has proven difficult owing to the lack of a well-constrained proxy. To address the lack of suitable UV radiation proxies, the Isotopic Constraints on Past Ozone Layer in Polar Ice (ISOL-ICE) project drilled a new 120 m ice core from the East Antarctic Plateau in 2017 to apply a new ice core proxy based on the fractionation observed in stable nitrogen (δ15N) and oxygen (Δ17O) isotopes of nitrate (NO) and to develop the first millennial-timescale reconstruction of past surface UV radiation (TCO) and atmospheric oxidation processes. Interpretation of the nitrate stable isotope record (δ15N and Δ17O) in terms of past UV (TCO) and atmospheric oxidation processes requires a thorough understanding of the local air transfer function and its driving parameters. The stable isotope of nitrogen 15N in NO (δ15N(NO in surface snow is highly enriched compared to atmospheric NO (e.g. Erbland et al., 2013; Cao et al., 2022; Winton et al., 2020) due to NO loss and redistribution from snow, which is driven by UV photolysis (Frey et al., 2009; Berhanu et al., 2014; Shi et al., 2019). NO isotopic fractionation is strongest at sites with very low snow accumulation rates (2–3 cm a−1 (w.e.)), such as Dome A and Dome C on the East Antarctic Plateau, due to enhanced NO post-depositional recycling which erases the source signature of δ15N(NO) due to longer exposure of surface snow layers to incoming UV radiation before burial (Shi et al., 2022a; Frey et al., 2009). Higher rates of snow accumulation rate to 6 cm a−1 (w.e.) and above is sufficient to preserve the seasonal cycle of δ15N(NO) in the snowpack (Winton et al., 2020), and enrichments in δ15N(NO) by the effects of snow accumulation superimpose those due to stratospheric ozone depletion (Cao et al., 2022; Shi et al., 2022b). The inverse relationship between the snow accumulation rate and δ15N(NO) is well constrained across Antarctica so that for ice core sites within the transition zones between the dome summits and the coast with a snow accumulation rate between 4 and 20 cm a−1 (w.e.), ice core δ15N(NO) has been proposed as proxy for surface mass balance (Akers et al., 2022).
As a first part of the ISOL-ICE project, an air–snow transfer study was carried out at the ice core drill site (Winton et al., 2020). At the ISOL-ICE ice core site located on the high East Antarctic Plateau at Kohnen Station (75°00′06′′ S, 0°04′04′′ E, 2892 m a.m.s.l.) in Dronning Maud Land (DML), the sensitivity of δ15N(NO) to changes in snow accumulation (and seasonality), TCO, and snow e-folding depth (light attenuation) was assessed using atmospheric, surface snow, and snow pit observations of δ15N(NO) supported by air–snow transfer modelling (Winton et al., 2020). The dominant factors controlling the archived δ15N(NO) signature at the ISOL-ICE site are the e-folding depth and snow accumulation rate, followed by TCO. Taking past changes in snow accumulation into account, it may be possible to reconstruct past UV and TCO on longer timescales from the δ15N(NO) signal in the ISOL-ICE ice cores, provided other factors such as the e-folding depth have remained the same within the target resolution time. Thus, in order to interpret the ice core δ15N(NO) record, the accumulation rate needs to be independently derived from annual-layer counting and volcanic horizons to account for post-depositional isotope fractionation not related to surface UV changes.
Furthermore, constraining the aerosol source regions for the ISOL-ICE ice core has implications for interpreting the ice core record of NO and its stable isotopes. The net primary sources of NO to the Antarctic atmosphere and snowpack are methyl nitrate (CH3NO3) from open ocean and sea ice and stratospheric NO (Burger et al., 2022, 2023; Mulvaney and Wolff, 1993; Savarino et al., 2007; Jacobi et al., 2000; Jones et al., 1999; Beyersdorf et al., 2010). Ice core proxies of open-ocean and sea ice aerosol include biogenic sulfur species and sea salts (Frey et al., 2020; Abram et al., 2013; Thomas et al., 2019, 2023). At some ice core sites, atmospheric transport strength, rather than aerosol source, is the dominant factor that determines the chemical signal preserved in ice cores. For example, methanesulfonic acid (MSA) is derived from the oxidation of dimethylsulfide (DMS, (CH3)2S) from marine phytoplankton emissions to the atmosphere and reflects atmospheric transport rather than sea ice conditions in coastal Weddell Sea and Dronning Maud Land ice cores (e.g. Fundel et al., 2006; Abram et al., 2007). Thus, evaluating the ISOL-ICE ice chemistry derived from oceanic sources is necessary to understand the relationships between ice core NO and its sources.
As a second step to developing the UV (TCO) ice core proxy within the framework of the ISOL-ICE project, we present the full ice core record of annual snow accumulation and ice core chemistry and the age–depth model. The ISOL-ICE ice core extends the European Program for Ice Coring in Antarctica (EPICA) Dronning Maud Land (EDML) record by 2 decades towards the present. We discuss the aerosol source regions and links to climate variability to provide context for potential NO3- sources. The development of the site-specific accumulation record provides foundational data to model the accumulation component of the δ15N(NO) record. These initial ice core results, together with the ISOL-ICE air–snow transfer study (Winton et al., 2020) set the framework for the interpretation of the 1000-year ice core record of stable nitrogen and oxygen isotopes from the high-elevation DML. The final step in developing the millennial-timescale reconstruction of past surface UV-radiation (TCO) will be to use the ice core NO concentration and accumulation records reported in this study, along with the measured ISOL-ICE ice core δ15N(NO), to model the site-specific surface conditions using the inverted TRANSITS model (Jiang et al., 2023). This will be presented in a future study.
2.1 Ice core drilling
A new ice core was drilled as part of the ISOL-ICE project at Kohnen Station, located in DML on the high-elevation East Antarctic Plateau (2892 m a.s.l.) approximately 550 km from the coast. The ISOL-ICE ice core site was located within the clean-air sector ∼1 km from the deep EDML core, which was drilled in 2001–2006 to a depth of 2761 m (Wilhelms et al., 2017). The 120 m deep ISOL-ICE ice core (core A; 74.9961° S, 0.09472° E; Fig. 1) was drilled in January 2017 using the British Antarctic Survey (BAS) shallow electromechanical ice core drill (Mulvaney et al., 2002), which produces a core with a 105 mm internal diameter in a dry borehole. Two additional 10 m firn cores (cores B and C) were recovered from the site using a stainless-steel drill with an internal diameter of 96 mm. A fourth 2 m firn core (core CF) was recovered using a carbon fibre tube with an internal diameter of 98 mm. The core sections were cut into 80 cm lengths and shipped frozen to the BAS in Cambridge, United Kingdom, and stored at −25 °C until core processing. In addition, two snow pits were sampled for soluble ions and nitrate stable isotopes. Core C was analysed for perfluorocarboxylate. Results from the snow pits and firn core C can be found in Winton et al. (2020) and Garnett et al. (2022), respectively.
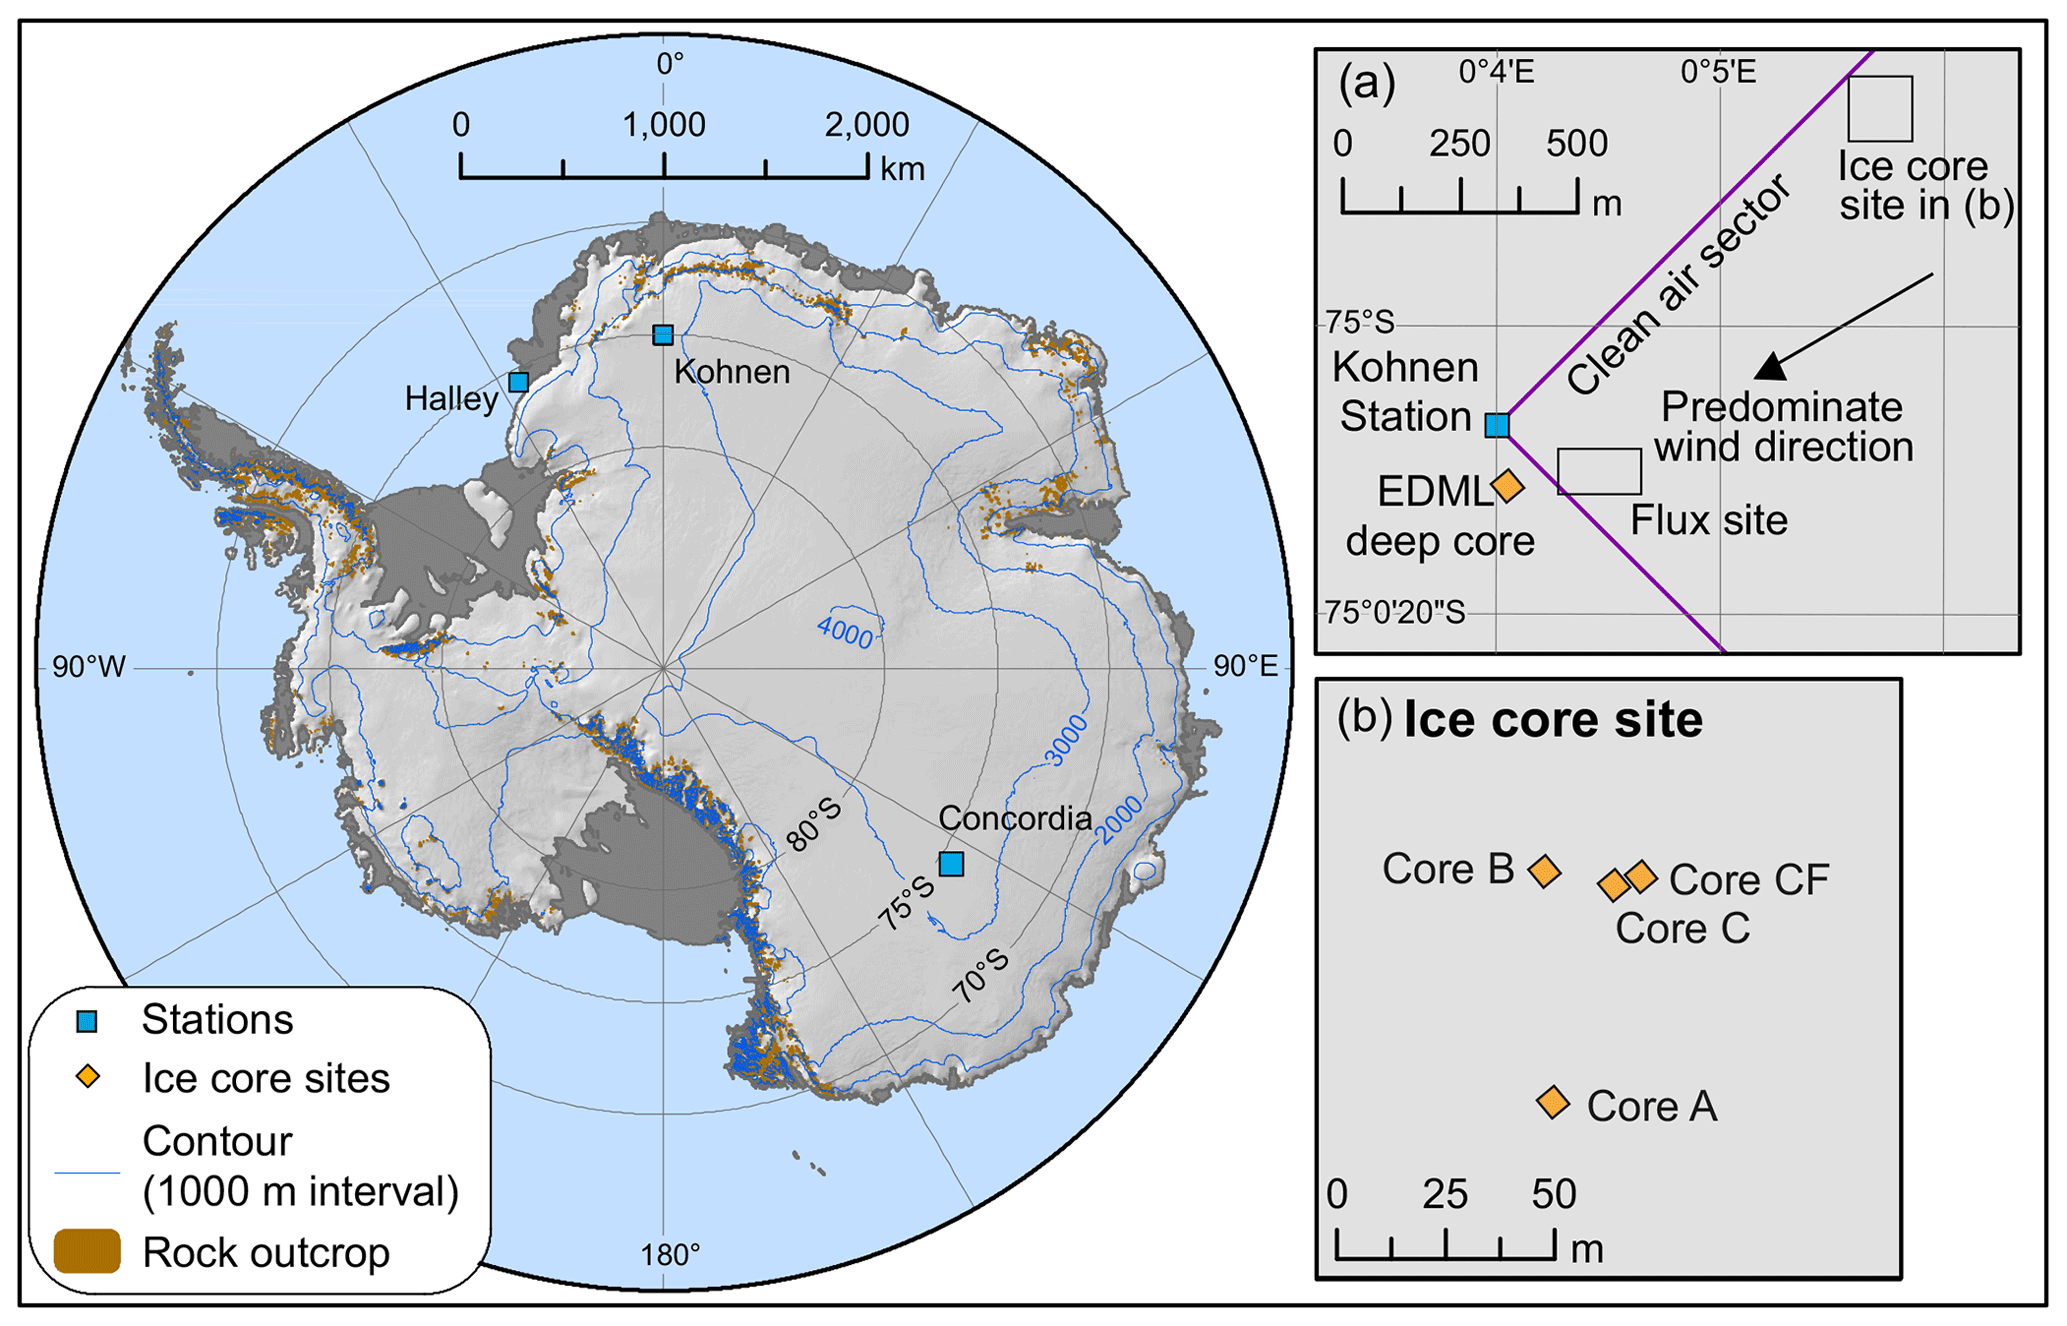
Figure 1Map of the ISOL-ICE ice core drilling site in the clean-air sector of Kohnen Station. (a) Insert of Kohnen Station in Dronning Maud Land (DML) highlighting the predominate wind direction, deep EDML ice core site, and the ISOL-ICE “ice core” and “flux” sites. The latter is described in Winton et al. (2020). (b) ISOL-ICE “ice core site” showing the main ice core (core A) and shallow firn core (cores B, C and CF) locations. Modified from Winton et al. (2020).
2.2 Ice core processing and glacio-chemical analysis
At the BAS, the main ice core (core A) was logged, analysed by dielectric profiling (DEP), and then cut into sections for continuous flow analysis (CFA), analysis of nitrate stable isotopic composition, and archiving (Fig. A1). Firn cores B and CF were also logged and analysed by DEP. Here we present initial results from the CFA and DEP analysis as a basis for interpreting the nitrate concentration, stable nitrate isotope, and insoluble particle records which will be presented in subsequent studies. The ISOL-ICE ice chemistry data are available through the Polar Data Centre (Winton et al., 2019).
Dielectric conductivity of the full ice core was determined by DEP (Oerter et al., 2000; Moore and Paren, 1987; Wilhelms et al., 1998; Hofstede et al., 2004). The DEP data were taken at 250 kHz in 5 mm increments with a 10 mm long measuring electrode. Cores were measured only after temperature equilibration in the cold laboratory to reduce the effects of temperature-dependent activation energy on the DEP and corrected for minor differences in core temperature measured by a probe inserted between the electrodes and the ice core. Repeat measurements were made on the main core A between 35 and 39 m and showed excellent reproducibility (R2=0.93, P<0.001; RMSE = 0.28 µS cm−1). Mean background differences between the DEP values in the 3 cores also reflect the different core diameters since the dielectric response measured by the DEP is proportional to the volume of ice between the measurement plates; this is evident around 40 m depth in Fig. 2c, where several metres of ice were cut with the core cutters set to a smaller diameter. The rising trend observed in Fig. 2c reflects the increasing density of the ice with depth.
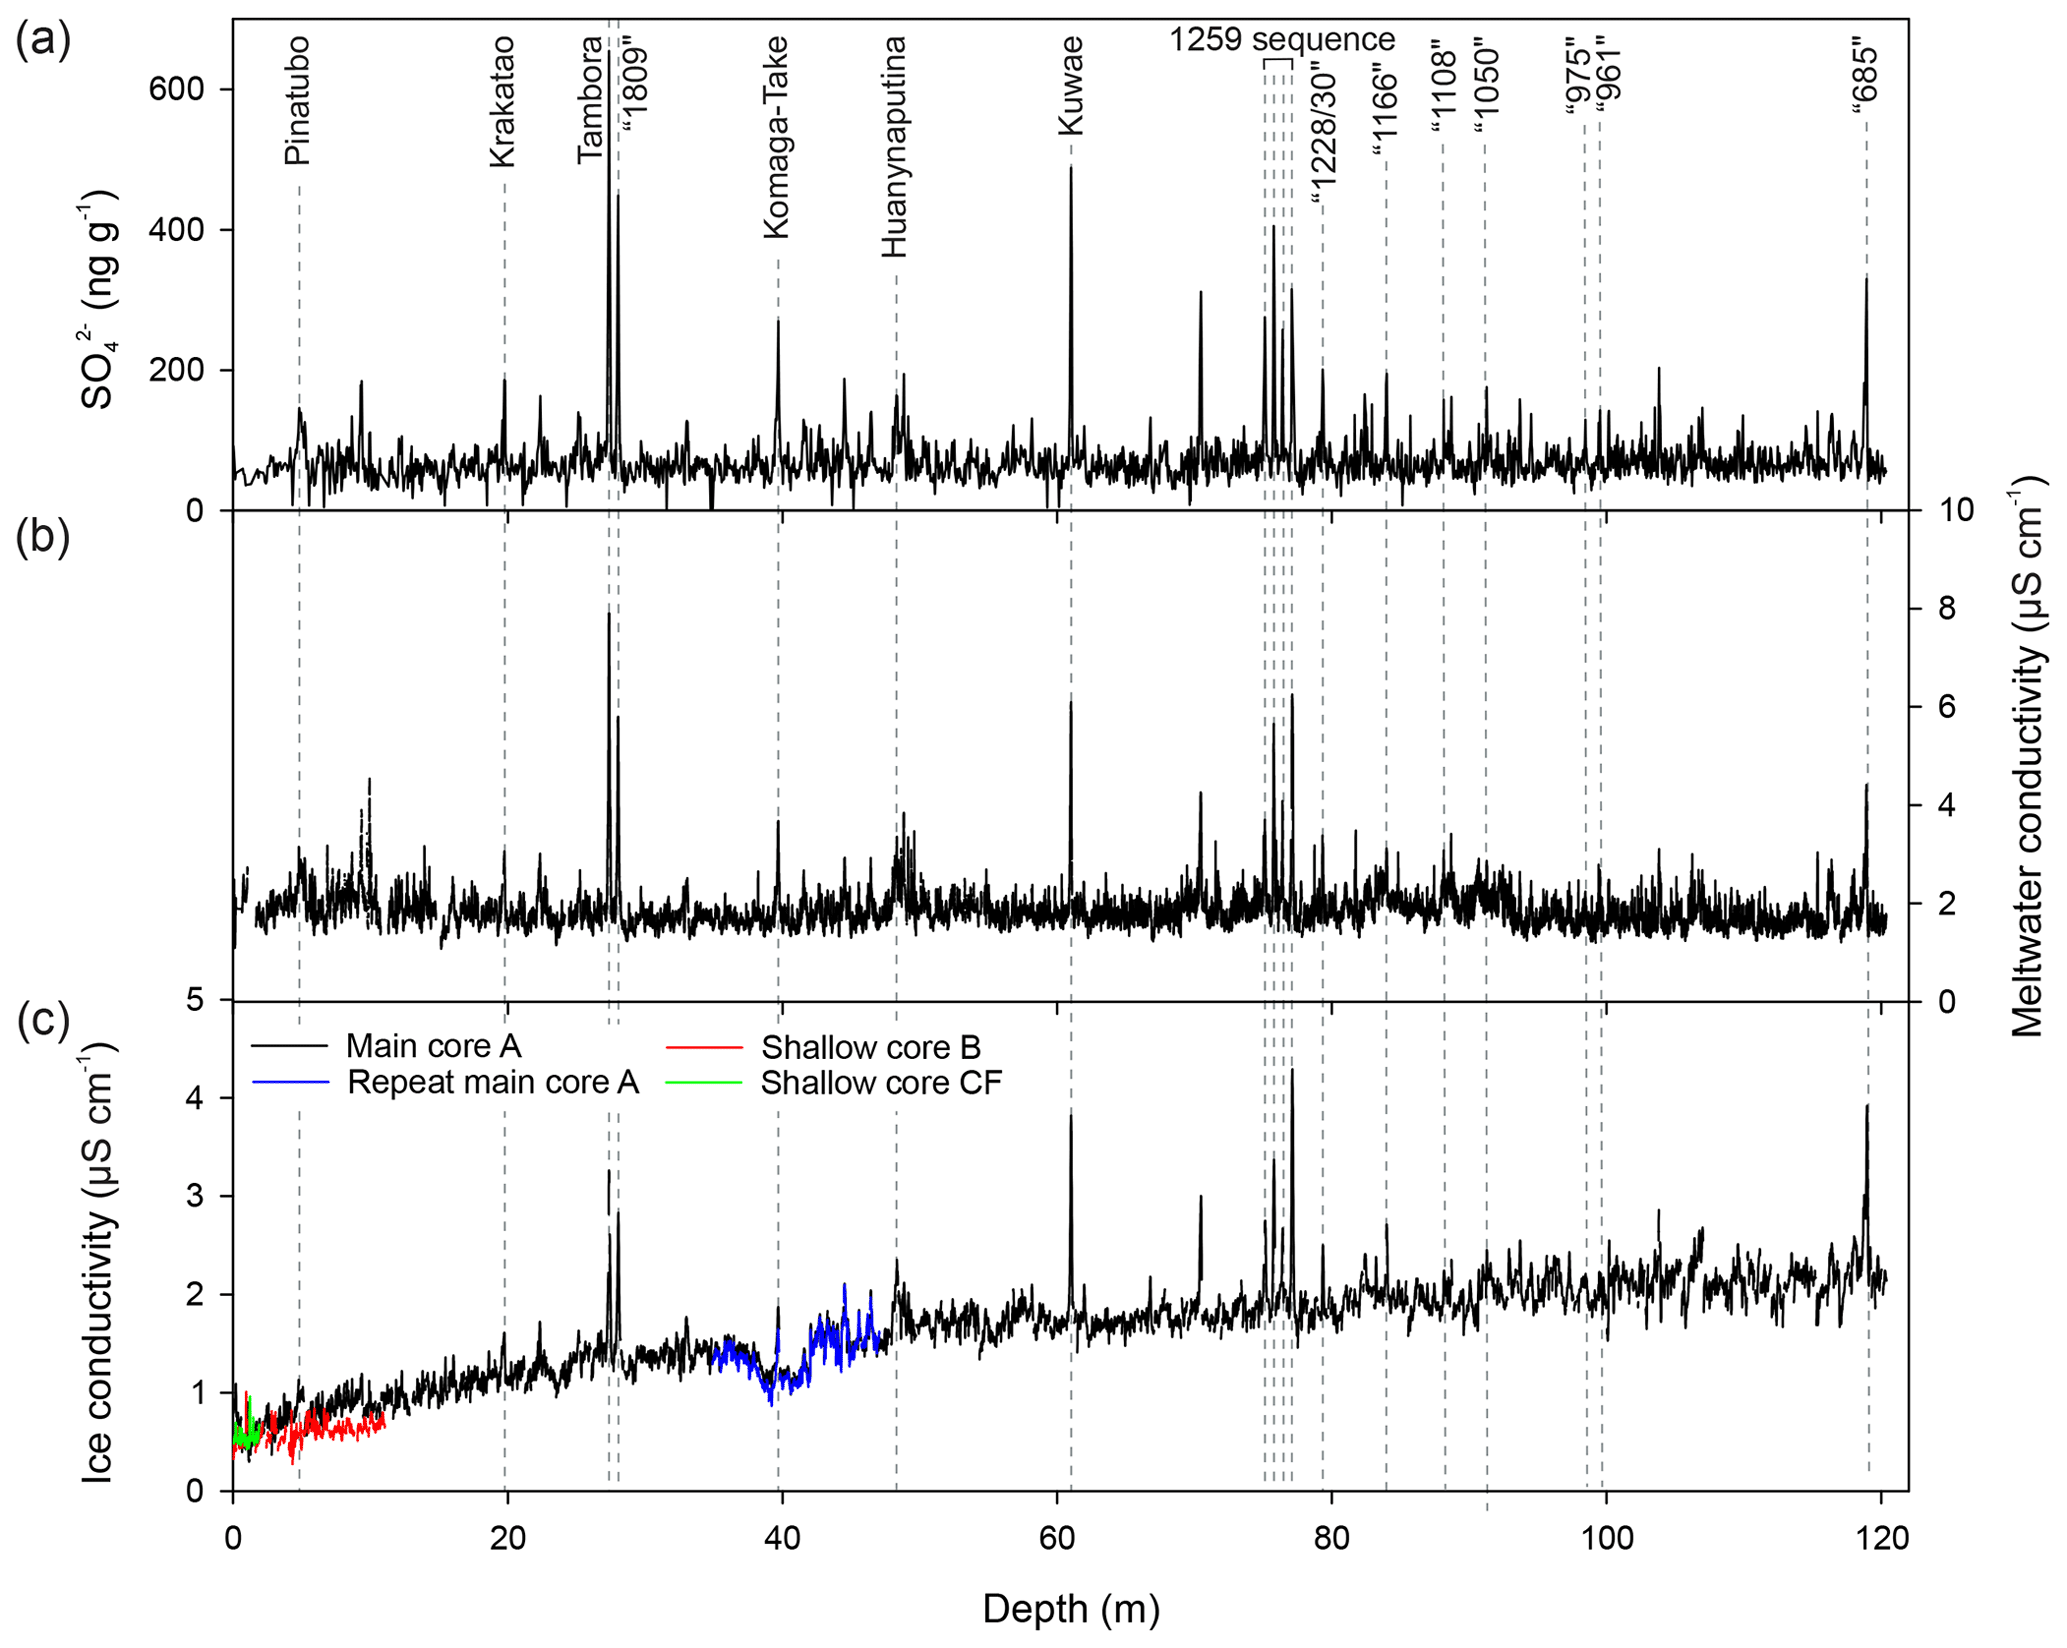
Figure 2Volcanic markers identified in the ISOL-ICE core using (a) sulfate (SO) concentrations, (b) liquid conductivity, and (c) ice conductivity (dielectric profile; DEP). The unknown volcanic eruptions are documented in the literature for ice cores in the Dronning Maud Land region. DEP data were corrected for temperature but not density. Note the diameter of the core reduced to 98 mm between 38 and 42 m, which is reflected in the lower DEP values in the repeated section of the main core A.
A stainless-steel bandsaw was used to cut a 32×32 mm ice stick for CFA of trace elements, soluble anions, hydrogen peroxide (H2O2), insoluble particles, and liquid conductivity. CFA sticks were melted vertically on a heated, gold-plated copper melt head, which consists of two rings separating the inner and outer section of the meltwater. The inner section of the CFA meltwater was used for chemical analysis ensuring no contact of the meltwater with exposed ice core surfaces. The CFA system used was an earlier version of that described by Grieman et al. (2022).
Soluble anions were measured using fast ion chromatography (FIC; ICS-3000, DionexTM). A suite of anions, including NO, chloride (Cl−), methane sulfonate (MSA−; CH3SO), and sulfate (SO), were determined using an AS15–5 µm and AERS500–4 mm suppressor. The sampling resolution of the FIC measurements was 5 cm at the top of the core and 4 cm at the bottom, resulting in an average of 2±1 measurements per year. A certified reference material (CRM; European Reference Material ERM-CA408 simulated rainwater) containing NO, SO, and Cl− was measured at the beginning, end, and during each laboratory analysis day to determine the accuracy and precision of the soluble anion measurements that are reported in Table A1.
High-resolution measurement of trace elements, including sodium (Na) and magnesium (Mg), were made using inductively coupled plasma mass spectrometry (ICP-MS; 7700 series, Agilent). A CRM (European Reference Material, ERM-CA616 groundwater) containing Na and Mg was measured at the beginning, end, and during the course of each day to determine the accuracy and precision of the trace element measurements that are reported in Table A1. Hereafter, Na and Mg measured by ICP-MS are assumed to represent their ionic form Na+ and Mg2+ (Grieman et al., 2022).
Liquid conductivity was measured in the CFA fluid line using a digital conductivity meter (DionexTM 2010i) with a flow through cell (Amber Science, Model 1056).
Insoluble particle counts were performed using a laser particle detector (Abakus, Fa.Klotz, Bad Liebenzell, Germany), which was connected to the meltwater flow with a flow rate of 1.6 mL min−1. The instrument was set to measure insoluble particles in 32 individual diameter size bins ranging between 0.9 and 50 µm. The dust mass was calculated from the measured volume assuming a spherical particle density of 2.5 g cm−3. The sampling resolution of the ICP-MS, liquid conductivity, and insoluble particle measurements was 4 cm (Grieman et al., 2022). ICP-MS has a measurement frequency equivalent to a depth interval of <1 mm, resulting in an average of 190±120 measurements per year in the top 5 m of the core and an average of 140±60 measurements per year in the bottom 5 m of the core, which is considerably higher than FIC measurements.
2.3 Ice core dating
The age–depth model of the ISOL-ICE ice core was constructed using annual-layer counting constrained by well-dated volcanic eruption horizons documented in the literature based on ice cores in the Dronning Maud Land region (e.g. Sigl et al., 2022). Annual-layer counting was based on the high-resolution Na+ and Mg2+ concentrations following previous ice core and aerosol studies in DML (Göktas et al., 2002; Garnett et al., 2022; Ming et al., 2020). Multi-year aerosol observations from Kohnen Station exhibit a narrow seasonal minimum in Na+ and Mg2+ concentrations during austral summer and a broad peak in late winter and spring (Weller and Wagenbach, 2007). Annual markers (January) were positioned at the sharp, well-defined summer Na+ and Mg2+ minima. Volcanic tie points were identified using SO concentrations, liquid conductivity, and DEP and were placed at the depths reported in Table A2 and illustrated in Fig. 2. The volcanic dates were taken from either the eruption date if known or published deposition dates used to construct age–depth models for ice cores in the DML region if unknown (e.g. Cole-Dai and Mosley-Thompson, 1999; Zielinski et al., 1994; Langway et al., 1995; Traufetter et al., 2004).
2.4 Snow accumulation rate and density
The density of each 80 cm ice core bag was calculated using the ice core mass, diameter, and length. Snow accumulation rates were derived from the density measurements and annual-layer thickness of the core. Plastic deformation associated with thinning of deeper ice layers was accounted for using the thinning model of Nye (1963), which resulted in a 10 % correction of the accumulation rate at the base of the core.
2.5 Relationships between accumulation rate, glacio-chemistry, and large-scale climate variability
To understand the transport mechanisms and source regions of moisture, snowfall, and aerosols to the ISOL-ICE site, the snow accumulation and glacio-chemistry ice core records were correlated with climate variables over the observational era (1979–2016). Correlations were performed on annual averaged data (January–December), following Thomas et al. (2023), to correspond with the annually resolved accumulation and MSA− records, and seasonally averaged data resulting from the sub-annually resolved Na+ and Mg2+ measurements. Seasonal means were grouped into austral summer–autumn (December to May average) and austral winter–spring (June to November average) for each year using linear interpolation between annual markers. Despite extreme Antarctic precipitation events and nonlinear snowfall throughout a year (Turner et al., 2019), the climatology of monthly mean Na+ and Mg2+ concentrations exhibits the same seasonal trend as aerosol observations at Kohnen Station, i.e. a narrow seasonal minimum in austral summer and a broad peak in late winter–spring (Weller and Wagenbach, 2007). These seasonal groupings reflect the known aerosol Na+ concentration peak in late winter–spring (Weller and Wagenbach, 2007), the distinct ice core Na+ concentration peak between June and September, the relatively coherent seasonal Na+ and Mg2+ concentration patterns, and the background climate patterns, e.g. the winter transition and sea ice advance season and the summer transition and sea ice retreat season, respectively. Correlations with NO concentrations were not calculated due to missing NO concentration data in the top 8 m of the record corresponding to the observational era.
The records were correlated with select climate variables from ERA5, the fifth-generation European Centre for Medium Range Weather Forecast (ECMWF) atmospheric reanalysis data (Hersbach et al., 2020), during the modern satellite observing period 1979–2016. The variables analysed include mean sea level pressure (MSLP), 10 m meridional wind (V10 M), 500 hPa geopotential height (Z500) and 500 hPa meridional winds (V500) to investigate regional and large-scale circulation patterns associated with air mass and aerosol transport. The 10 m meridional wind level was chosen to investigate regional-scale circulation patterns associated with surface air mass and marine aerosol transport. The 500 hPa level was chosen to capture broader-scale circulation and is reflective of the near-surface winds over the higher elevations of the Antarctic continent, such as at the high-elevation ISOL-ICE site, which has an average surface pressure of 675 hPa between 1997 and 2017 (Utrecht University Automatic Weather Station (AWS) at DML05/Kohnen (AWS9; https://www.projects.science.uu.nl/iceclimate/aws/files_oper/oper_20632, last access: 29 March 2017) but is less influenced by localized near-surface boundary layer features such as katabatic winds. The records were also correlated with sea ice concentration from the Met Office Hadley Centre Sea Ice and Sea Surface Temperature data set (Rayner et al., 2003; Titchner and Rayner, 2014) to investigate relationships between atmospheric transport pathways to the site and areas of sea ice anomalies. Lastly, the ISOL-ICE ice core records were correlated with several large-scale climate mode indices, including the observation-based Southern Annular Mode (SAM) index (Marshall, 2003), and for the El Niño–Southern Oscillation (ENSO) we employ the Niño 3.4 index and Southern Oscillation Index (SOI). The SAM index reflects the difference in mean sea level pressure anomalies between the southern middle latitudes and Antarctica, whereby positive (negative) SAM index values reflect positive (negative) pressure anomalies in middle latitudes, negative (positive) pressure anomalies over Antarctica, and a stronger and poleward (weaker and equatorward) mid-latitude jet. The Niño 3.4 index is the sea surface temperature anomaly in the eastern–central equatorial Pacific area averaged over the region 5° N–5° S, 170–120° W, with positive (negative) values associated with El Niño (La Niña) conditions. The SOI reflects the atmospheric component of ENSO and is the difference in mean sea level pressure anomalies between Tahiti (central tropical Pacific) and Darwin, Australia (western Pacific Warm Pool), whereby positive (negative) SOI values reflect La Niña (El Niño) conditions. The SAM index was accessed freely online at http://www.nerc-bas.ac.uk/icd/gjma/sam.html (last access: 22 July 2022), and the Niño 3.4 index and SOI are from the Climate Prediction Center and were accessed freely online at https://www.cpc.ncep.noaa.gov/data/indices (last access: 22 July 2022). Annual averages of the SAM were calculated from the monthly mean values and are based on the standard 12-month calendar year (January–December), while seasonal boundaries (June to November and January to April) reflecting the temporal cycle of ENSO were used for Niño 3.4 and SOI indices rather than a calendar year, which would split an ENSO event, as May is generally the transition month between ENSO cycles (e.g. Crockart et al., 2021). The SAM index begins in 1957, and the correlations were calculated over the common period of 1957–2016 along with the reanalysis period of 1979–2016.
3.1 Age–depth model
As with previous ice core dating studies in the high-elevation DML region, the ISOL-ICE ice core displayed clear seasonality and distinct summer Na+ and Mg2+ troughs throughout the record enabling annual-layer counting for the full 120 m record. The high-resolution Na+ and Mg2+ annual signals were evaluated simultaneously. The lower-resolution soluble anion measurements by FIC did not resolve seasonal signals usable for annual-layer counting. The H2O2 data were also evaluated for summer peaks or winter minima; however, the seasonal signal was smoothed below 2 m depth and was not suitable for annual-layer counting at the low accumulation rate site. A total of 19 volcanic time markers were identified from the SO concentrations, liquid conductivity, and DEP. All volcanic horizons were well aligned in the three records (Fig. 2). The difference between the conductivity measurements of the ice (DEP) and meltwater (liquid conductivity), i.e. the increasing trend in the firn section of the DEP record, reflects the change in density with depth compared to the meltwater conductivity measurements where there is no density effect. The conductivity values from the ice and meltwater measurements agree well below ∼75 m depth. Annual-layer counting of Na+ and Mg2+ concentrations constrained by the volcanic horizons indicates that the ISOL-ICE ice core spans the last 1349 years from 2017–668 CE, extending the EDML core by 2 decades towards the present (Ruth et al., 2007). A maximum age uncertainty in our layer counting of ±3 years is estimated between 48–61 m, corresponding to a time interval of about 150 years (1453–1601 CE), which is one of the largest intervals enclosed between documented volcanic peaks in Antarctic ice cores (Table A2).
3.2 Snow accumulation record
The ISOL-ICE snow accumulation record is presented in Fig. 3a. The mean accumulation rate for the entire core is 6.5±2.4 cm a−1 (w.e.), consistent with previous estimates of 6.0–7.1 cm a−1 (w.e.) from ice cores from the high-elevation DML region (Sommer et al., 2000; Oerter et al., 2000; Hofstede et al., 2004). The mean of the 1995–2017 extension of snow accumulation record is 6.0±2.7 cm a−1 (w.e.), indicating that the accumulation rate has been relatively stable over the last millennium. While the record does not display centennial-scale variability in the snow accumulation rate, there is significant interannual variability in the record ranging between 2 and 20 cm a−1 (w.e.).
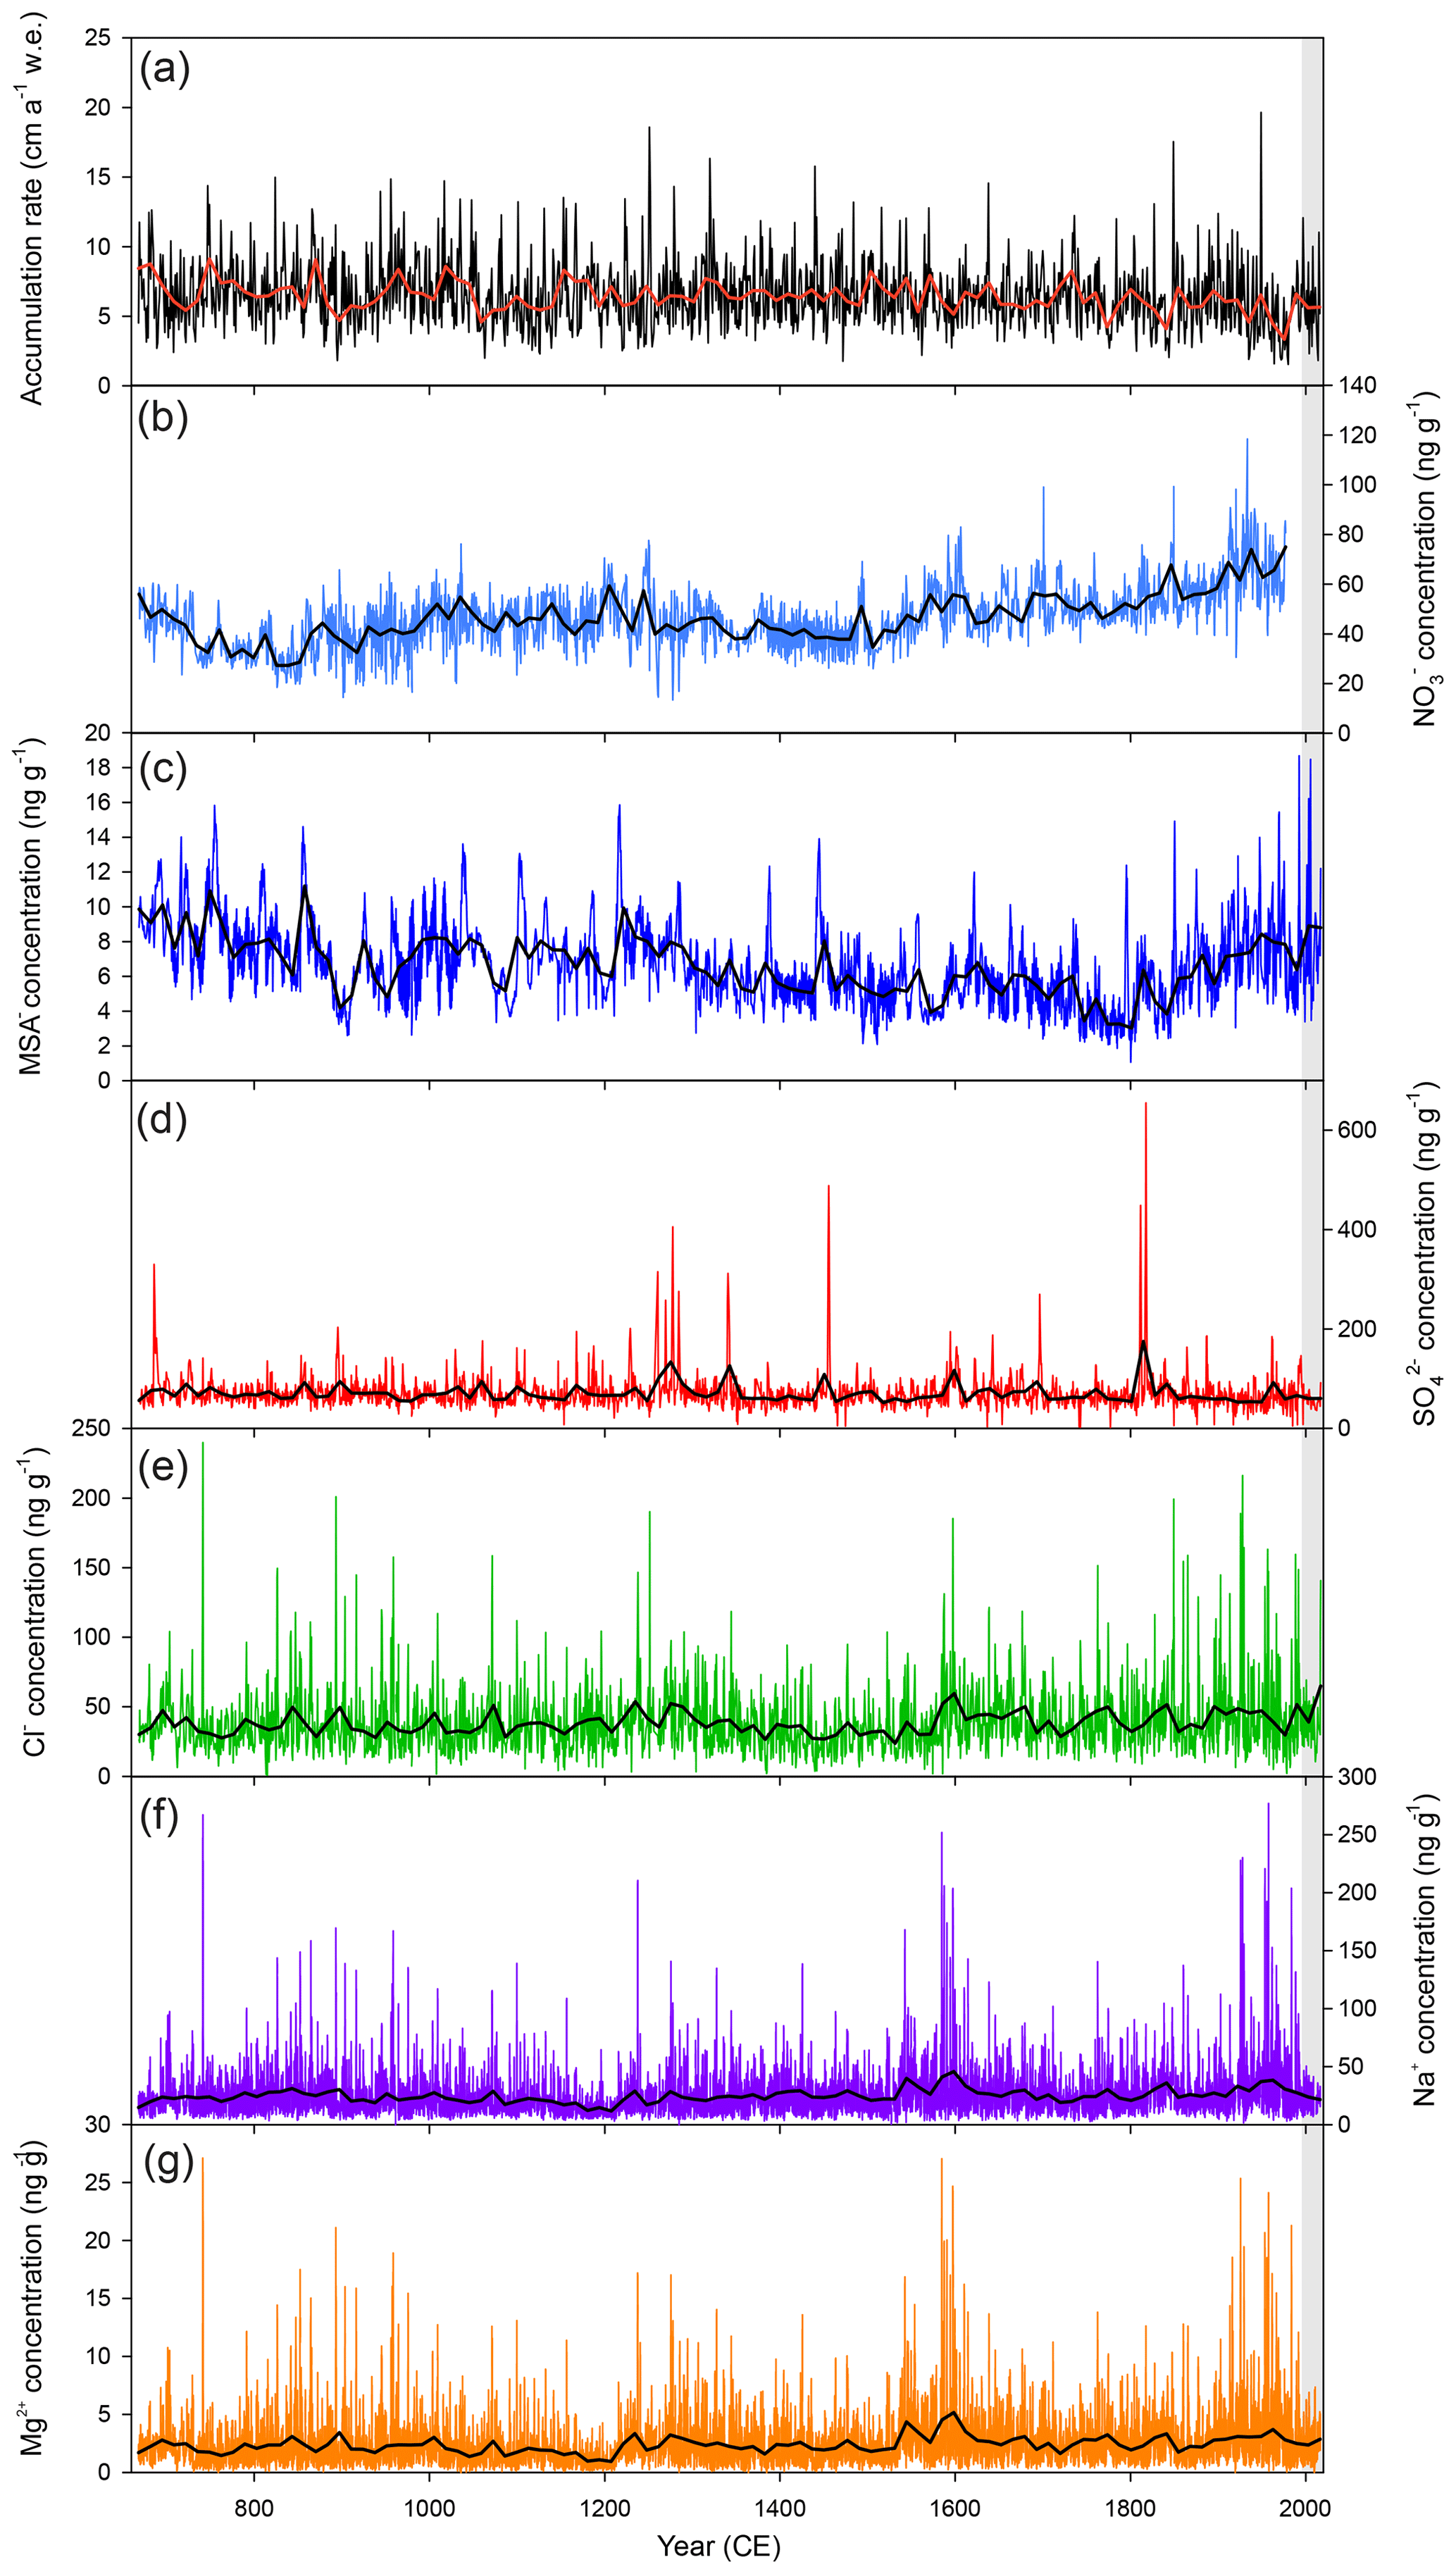
Figure 3Variability in (a) annual snow accumulation rate (b) nitrate (NO) concentration, (c) methane sulfonate (MSA−) concentration, (d) sulfate (SO) concentration, (e) chloride (Cl−) concentration, (f) sodium (Na+) concentration, and (g) magnesium (Mg2+) concentration over the last millennium from the ISOL-ICE ice core. Black lines indicate smoothed data using a 0.01 loess regression model (Cleveland and Devlin, 1988). The grey box indicates the 2-decade extension of the ice chemistry record from the Dronning Maud Land site. Water equivalent is abbreviated as w.e. Common era is abbreviated as CE.
3.3 Ice chemistry
The ISOL-ICE ice chemistry records are displayed in Fig. 3. Na+, Mg2+, and Cl− in Antarctic ice cores are derived from marine sea salt either originating from the open ocean or from sea ice sources such as blowing snow or frost flowers (e.g. Abram et al., 2013). The concentrations of Na+, Mg2+, and Cl− marine aerosols have been stable over the last millennium with mean concentration values of 25.4±18.9, 2.5±2.1, and 39.0±23.8 ng g−1, respectively. The extended ISOL-ICE record showed that there were less frequent sea salt deposition events over the most recent 2 decades relative to the last millennium. Sulfate deposited to ice cores is derived from mixed sources including marine primary production, sea salt, and volcanic eruptions (e.g. Sigl et al., 2014; Lin et al., 2022). Sulfate concentrations, with a mean value of 70.6±37.2 ng g−1, also did not display a shift in the baseline. The ISOL-ICE SO record shows excellent reproducibility with other DML ice cores (Traufetter et al., 2004; Sigl et al., 2022), where the large SO peaks are attributed to volcanic sources (Fig. 2). The sole source of MSA− is from the oxidation of dimethylsulfide (DMS, (CH3)2S) from marine phytoplankton emissions to the atmosphere. While sea salt deposition was relatively constant over the last millennium, MSA− and NO were the only analytes that displayed centennial-scale variability with a gradual decrease in concentrations from 668 to 900, stable concentrations from 900 to 1500 and a notable increase from 1800 to present for MSA− and from 1500 to present for NO. The centennial-scale temporal variability of MSA− and NO largely covaried in the ISOL-ICE ice core except between 1600 and 1800 when MSA− concentrations decreased while NO concentrations increased. Concentrations of MSA− continued to increase over the extended 2 decades towards the present of the record. The mean MSA− and NO values were 6.7±2.3 and 47±13 ng g−1, respectively.
3.4 Meteorological conditions and spatial correlations
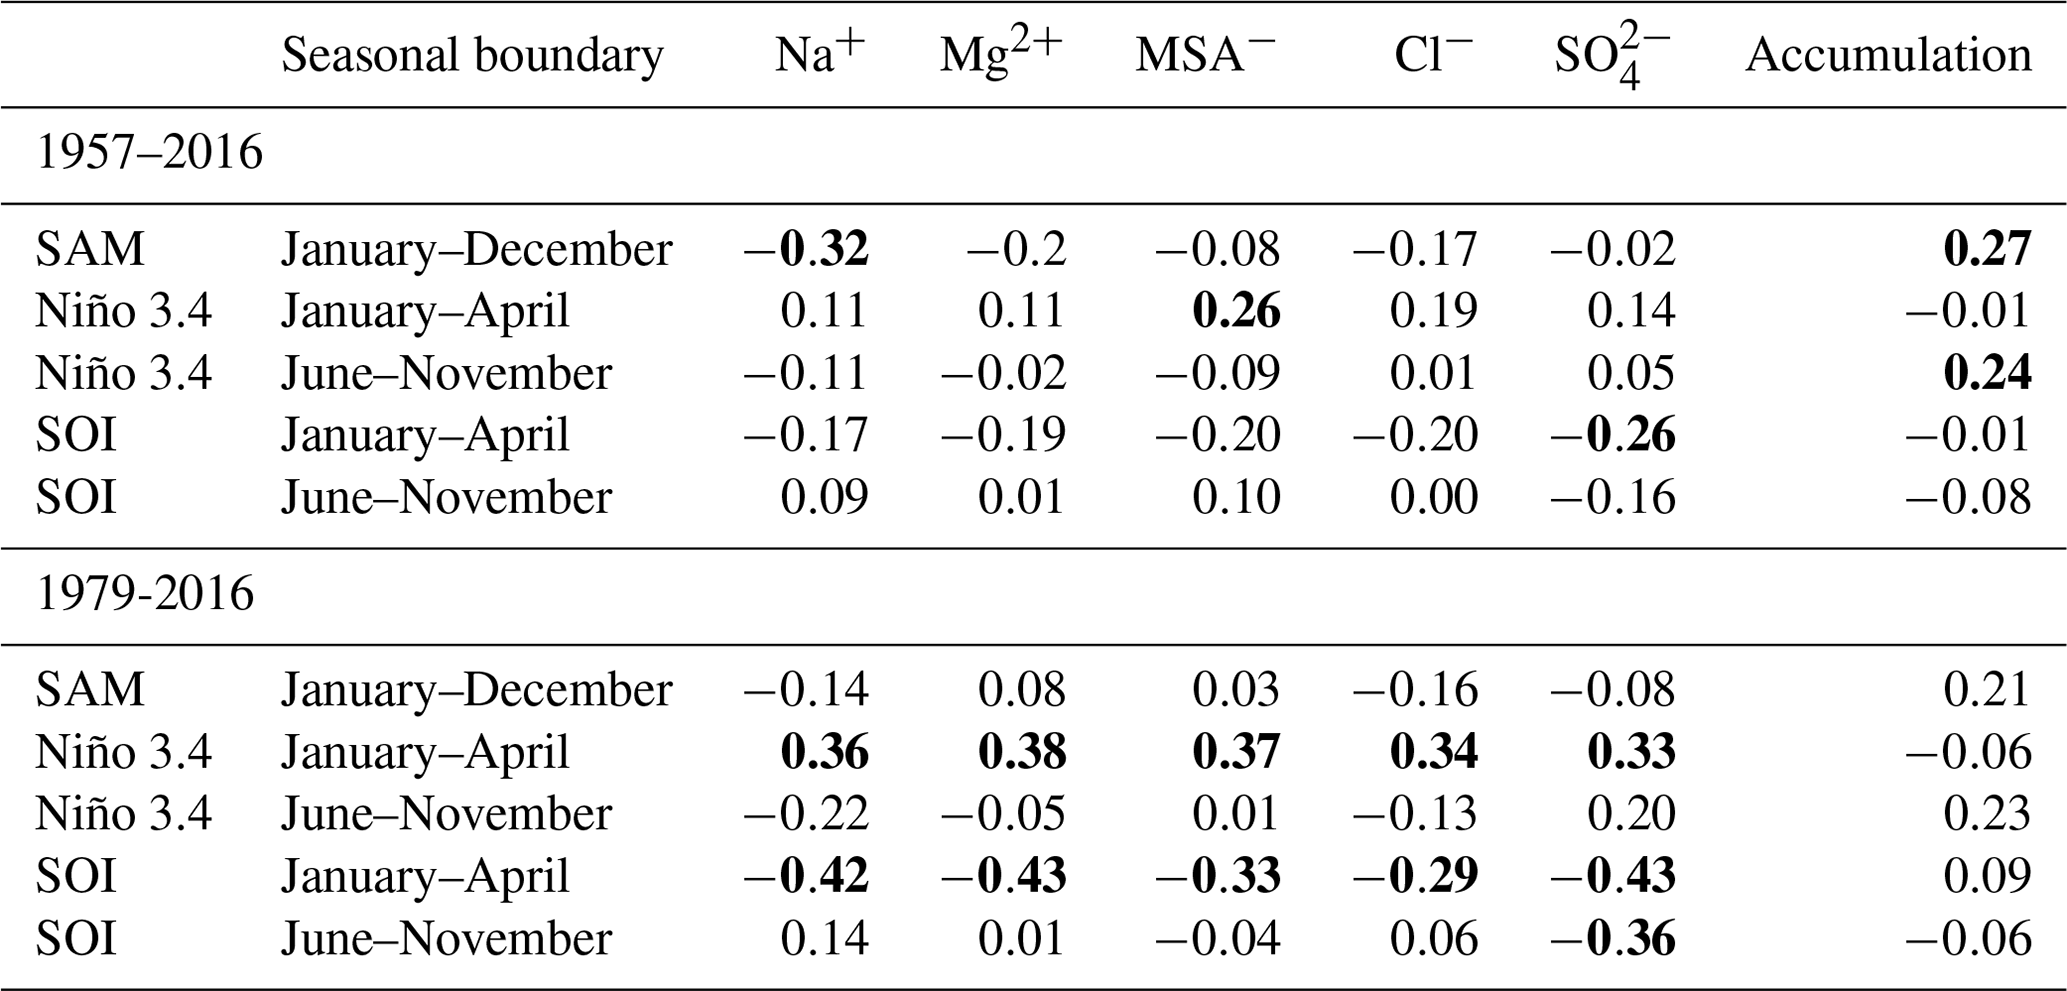
For the period 1957–2016, there are weak, but statistically significant at the 10 % level (P<0.10), annual correlations found between SAM and Na+ () and accumulation (R=0.27). In addition, there are summer–early autumn (JFMA) statistically significant correlations for the SOI and SO (, i.e. La Niña (El Niño) is associated with lower (higher) SO concentrations, Niño 3.4 and MSA− (R=0.26), and winter–spring Niño 3.4 and accumulation (R=0.24). The SAM relationships weaken and become insignificant after 1979. For the period 1979–2016, ENSO variability during summer–early autumn has moderately strong, statistically significant relationships with annual Na+, Mg2+, MSA−, Cl−, and SO variability, while the correlations are much weaker and insignificant during winter–spring (JJASON). Table A3 suggests that the underlying seasonality of the annual correlations between SO and ENSO is likely dominated by summer ENSO variability. The correlations are stronger for the shorter period of 1979–2016 compared to the longer 1957–2016 period.
Figure 4a shows the annual correlations for snow accumulation with 500 hPa geopotential height and meridional winds, 10 m meridional wind, mean sea level pressure and sea ice concentration for the period 1979–2016. Higher annual snow accumulation is associated with anomalous low pressure (anomalous cyclonic/clockwise circulation) over the Weddell Sea (significant in mean sea level pressure field) and northerly flow from the South Atlantic (significant at the 10 m level) bringing marine air masses to the site (i.e. the negative correlation between meridional wind and accumulation implies positive accumulation anomalies are associated with northerly wind anomalies). The anomalous northerly flow corresponds with negative sea ice concentration anomalies in the outer edge of the sea ice field, with significant correlations in the northern Weddell Sea. While the northerly flow would directly contribute to a decrease in sea ice in the northern Weddell Sea through melt and/or convergence, it is also possible that the increase in open water could locally enhance atmospheric moisture content and contribute to higher snowfall.
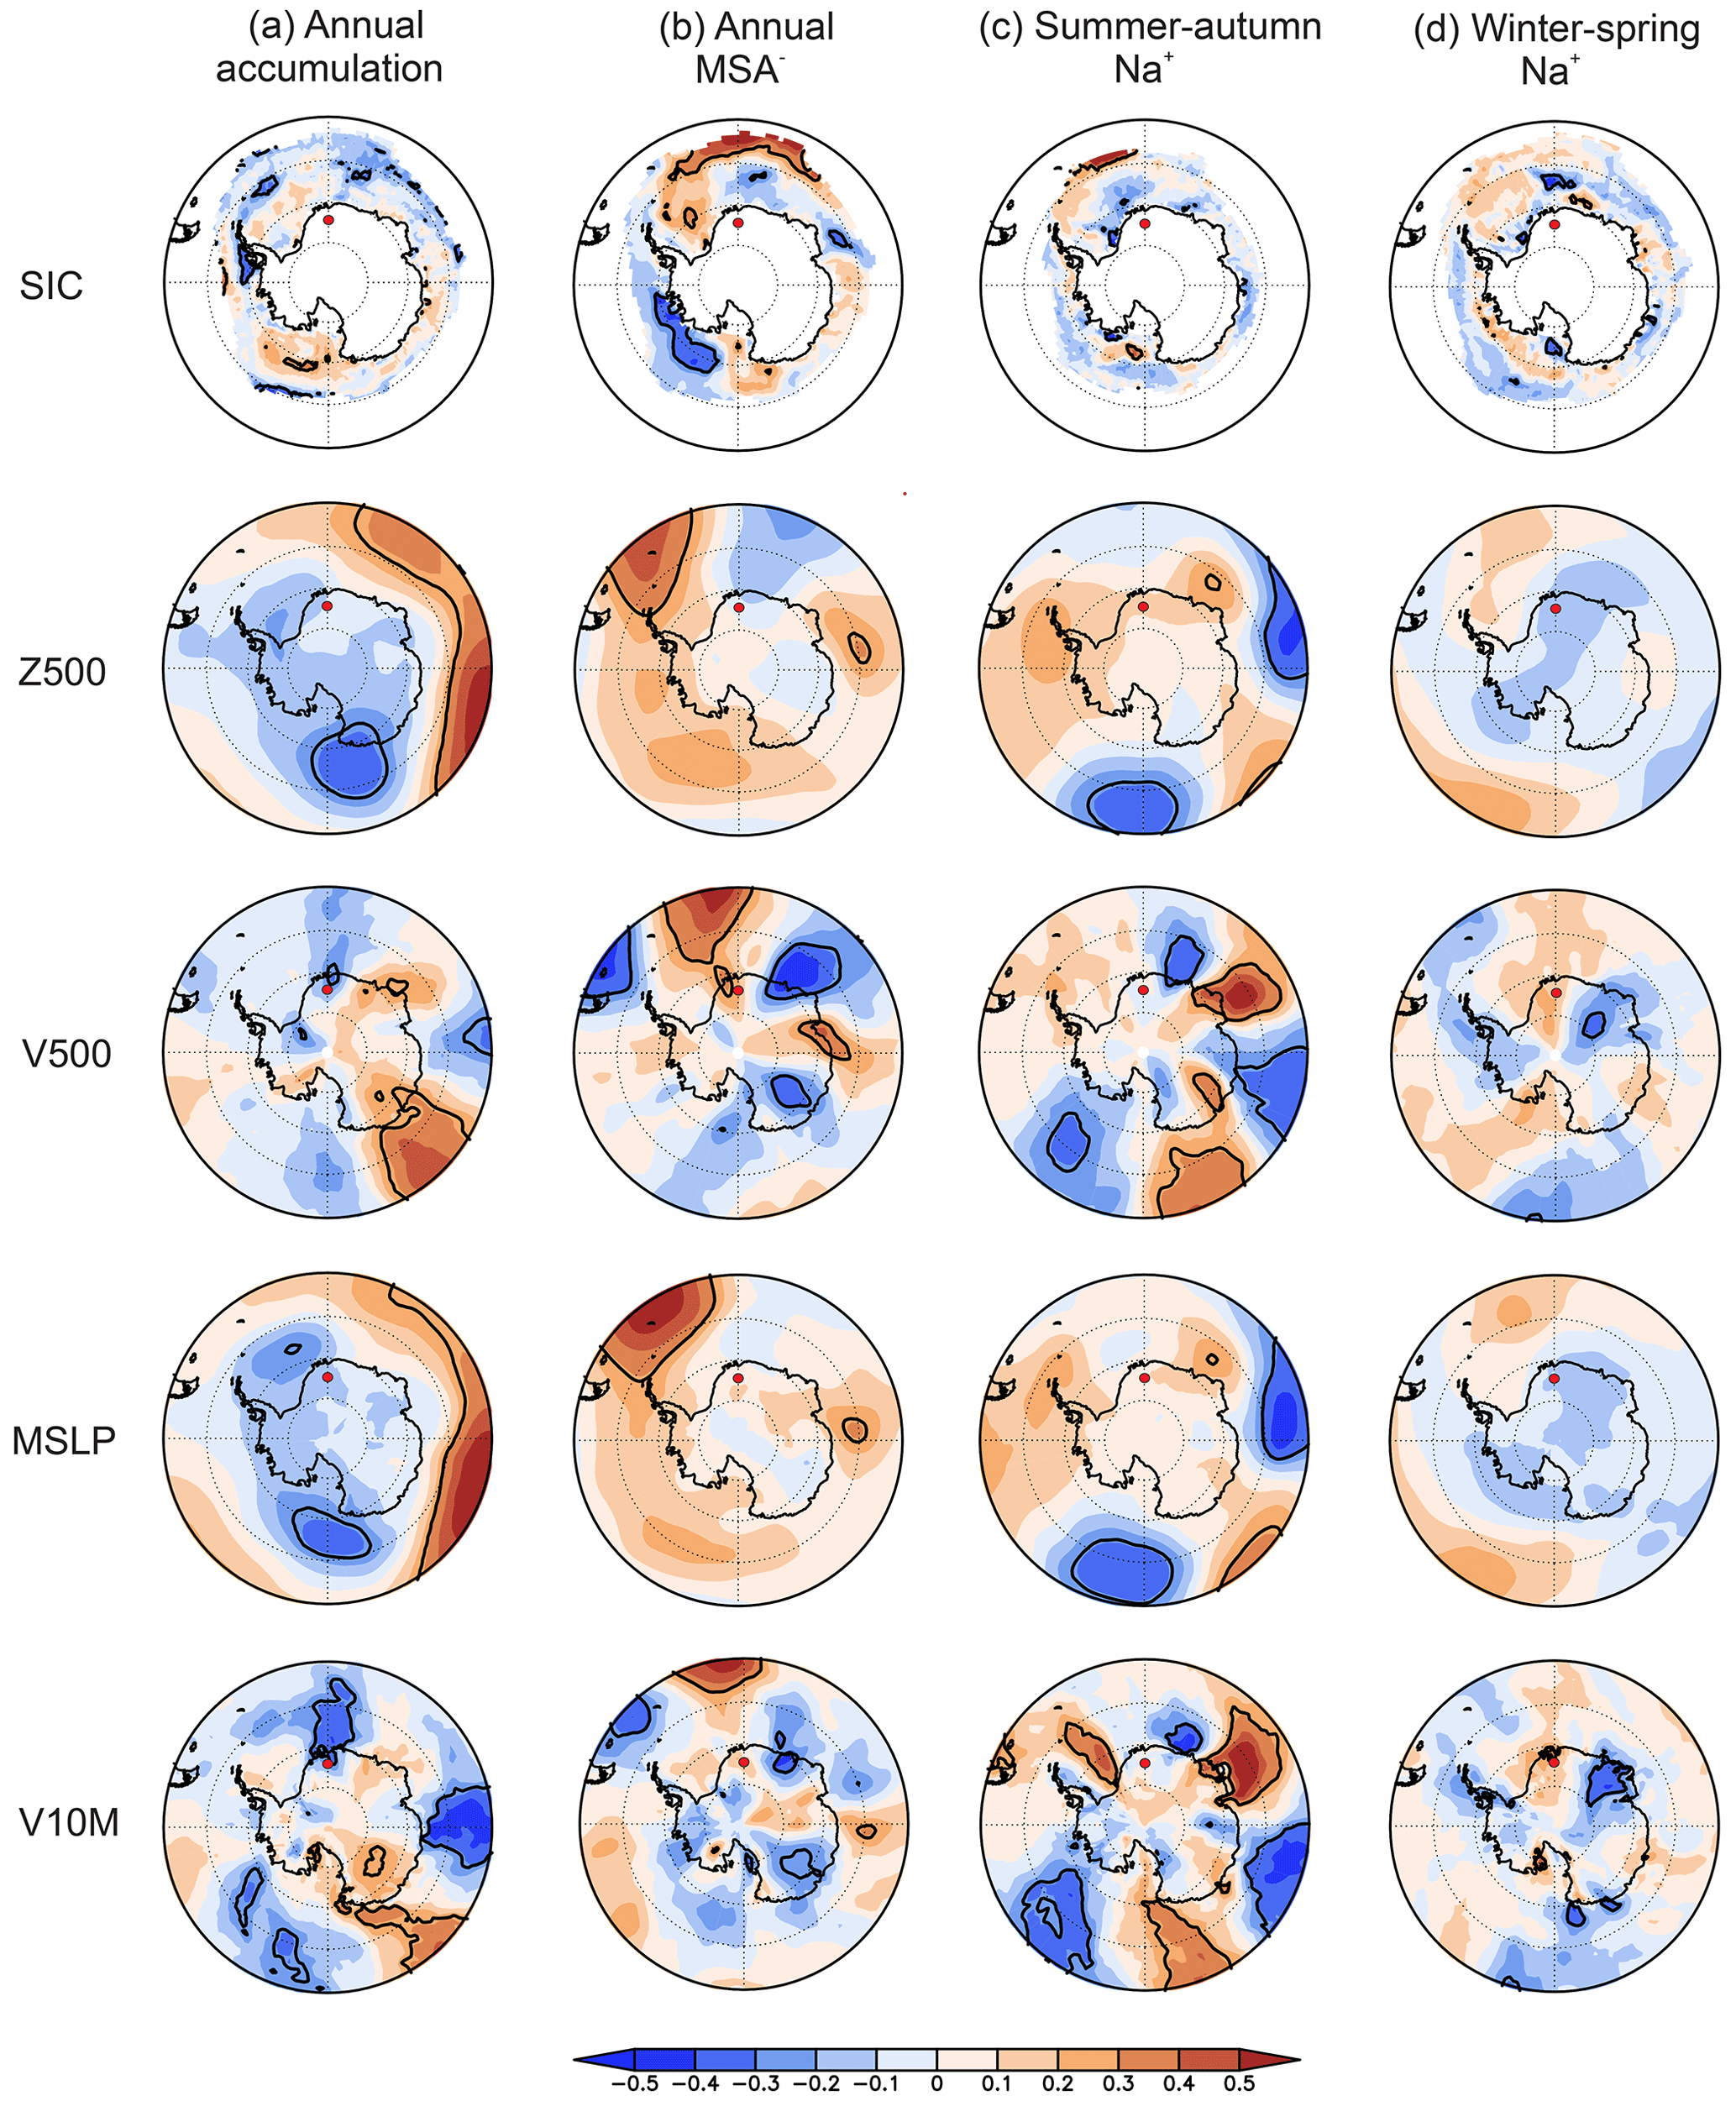
Figure 4Annual and seasonal correlations during the observational era (1979–2016) between the ISOL-ICE ice core record and sea ice concentration (SIC), 500 hPa geopotential height (Z500), 500 hPa meridional wind (V500), mean sea level pressure (MSLP), and 10 m meridional wind (V10 M). Correlations are for (a) annual accumulation, (b) annual MSA− concentration, (c) summer–autumn Na+ concentration, and (d) winter–spring Na+ concentration. The red dot is the location of the ISOL-ICE ice core site. Coloured shading shows the Pearson correlation coefficient values as indicated by the colour bar at the bottom. The bold black contours denote correlations that are significant at the 10 % level based on a two-tailed Student's t test.
Enhanced MSA− concentrations are associated with an anomalous high in the South Atlantic, an offshore low near 15° E, and an offshore high near 90° E (Fig. 4b). In between the latter two pressure anomalies there is significant northerly flow onto the ice sheet between 30–45° E that circulates clockwise and flows offshore over the ISOL-ICE site due to the strong high-pressure anomaly in the South Atlantic. This onshore and northerly flow to the northeast of the site cuts across a local region of below average sea ice concentrations within the pack ice near Prydz Bay (∼70° E), with mostly above-average sea ice concentrations over the Weddell Sea where southerly flow prevails.
Seasonal correlations for Mg2+ and Na+ are similar as they are strongly positively correlated (R=0.65 for summer–autumn and R=0.97 for winter–spring). In winter, strong correlation and similar correlation maps in Figs. 4 and A4 suggest that Na+ and Mg2+ are sea salt aerosol tracers from the open ocean or the sea ice and are advected with the same air masses (e.g. Wagenbach et al., 1998; Vega et al., 2018), whereas in summer the weaker correlation could be due to mineral dust contributions. During the summer–autumn period high Mg2+ and Na+ is associated with a circumpolar zonal wave 3 pattern (Raphael, 2004) with three high pressure–low pressure pairs encircling Antarctica. The zonal wave 3 pattern is most pronounced for Mg2+. Within this pattern, there is anomalous northerly and onshore flow between 15–30° E bringing marine air masses to the site. For Na, the onshore flow is tied to a local anticyclone just off the Enderby Land coast (near 45° E), and for Mg2+ the onshore flow is tied to a local cyclone just off the DML coast (near 0° E). There is also significant northerly flow over the South Pacific associated with a cyclone north of the Ross Sea. The northerly flow from the South Pacific appears to cut across the West Antarctic Ice Sheet and flow offshore (turns to southerly wind anomalies and positive correlations) over the eastern Ronne–Filchner Ice Shelf (near 45° W), especially for Mg2+. This transport pathway aligns with reduced sea ice concentrations in the Amundsen Sea, which could contribute to enhanced Mg2+ concentrations in summer–autumn.
During winter–spring, the large-scale circulation pattern and regional pressure anomalies associated with Na+ and Mg2+ are weaker and less coherent compared to summer–autumn. There appears to be two potential sources of onshore flow that bring marine air masses to the site in winter–spring. First, high Mg2+ and Na+ concentrations are associated with northerly flow over the Bellingshausen Sea–Antarctic Peninsula that cuts across Ellsworth Land and then flows off the continent along 0° E, which is weakly tied to an anticyclone north of the Weddell Sea and slightly lower-than-average pressure over the Amundsen Sea region. Second, similar to the annual MSA− correlations, there is a local cyclonic and clockwise circulation anomaly centred on the East Antarctic plateau near 10° E, which produces onshore northerly flow near 45° E that travels clockwise around the cyclone across the South Pole and reaches the ISOL-ICE site on southerly winds. The local southerly flow is enhanced by the weak positive pressure and anticyclonic circulation anomaly north of the Weddell Sea. There is a negative correlation between Mg2+ and Na+ concentrations and sea ice concentrations in the Weddell Sea around 0°, yet this sea salt source region would not be tied to the ISOL-ICE ice core site as it is associated with offshore and southerly flow.
4.1 Aerosol source regions
The winter sea salt peak in the ISOL-ICE ice core is dominated by a northerly atmospheric transport signal, that is northerly flow directly to the site or northerly flow in other Antarctic sectors with transport across the continent to the site, rather than an open water or sea ice source region signal. In the case of the ISOL-ICE site, direct transport of sea salt aerosol is most likely as wet deposition of aerosol is connected to lifting and adiabatic cooling of the air mass and precipitation events take 4 d to arrive at Kohnen Station from the South Atlantic Ocean consistent with the relatively short sea salt aerosol lifetime of a few days in the Southern Ocean (Landwehr et al., 2022; Reijmer et al., 2002). Comparison of ice core SO Na+ ratios with the reference seawater ratio of 0.252 (Millero et al., 2008) and those from fractionated sea ice sources (<0.252) may allow attribution of sea salt aerosol source regions assuming there are two sea salt sources from open ocean and sea ice regions (Abram et al., 2013). This approach is limited because only annual SO Na+ ratios are retrieved from the ISOL-ICE core, yet the seasonally resolved snow pit reported by Winton et al. (2020) shows that the winter Na+ maximum at the ISOL-ICE site is associated with lower SO Na+ ratios (Fig. A3). At the same time, non-sea-sulfate (nss)-SO concentrations remain positive (Figs. A3 and 3a). Thus, the ISOL-ICE winter SO Na+ ratios > 0.252 and the positive nss-SO values both indicate enrichment compared to seawater. However, in winter SO Na+ values decrease due to contributions from sea ice sources of sea salt aerosol such as blowing snow in the Antarctic (Fig. A3) (Frey et al., 2020). At coastal Antarctic sites, such as Halley Station, the winter peak in Na+ originates from sea salt aerosol production from blowing snow above sea ice in the Weddell Sea with minor contributions from sea ice production and frost flowers in coastal leads in the Weddell Sea (Frey et al., 2020; Yang et al., 2019). The evidence for a sea ice source of sea salt at inland, high-elevation sites is harder to substantiate due to the higher nss-SO background levels from other sources relative to sea salt concentrations and thus negative values of nss-SO are often not observed (Abram et al., 2013). Analysis of year-round SO and Na+ aerosol data from Kohnen Station also could not differentiate between open ocean and sea ice sources based on the fractionation of winter sea salt aerosol and its origin from a potential sea ice source, i.e. winter sea salt SO makes a minor contribution to the annual total, which is dominated by large summer nss-SO (Weller and Wagenbach, 2007). Therefore, the sea salt fractionation cannot be used as a chemical signature of sea ice source strength at the ISOL-ICE site because the nss-SO contribution to the annual mean is so large. Whereas recent changes in the proximity of the ice front to ice core sites in coastal DML highlighted the important role of elevation of an ice core site on the sea salt record, as observed from the calving of Trolltunga in 1950, which increased coastal sea salt concentrations and shifted nss-SO towards more negative values in a low-elevation ice core (Vega et al., 2018). Yet the changing sea salt source region was not reflected in a higher-elevation ice rise site in the region, showing that, even proximal to the coast, elevation plays a role in the detection of a sea salt fractionation signal in the DML region. While the source of winter Na+ at ISOL-ICE may be less certain, the correlation analysis can explain the northerly transport to the site.
In summer, sea salt deposition at the ISOL-ICE site is explained by a transport signal associated with northerly marine air masses from Enderby Land and DML and an open-water aerosol source in the Amundsen Sea with atmospheric transport across West Antarctica. The low sea salt concentrations in summer occur with more enriched SO Na+ values, and higher nss-SO and MSA− concentrations (R=0.15, P<0.01) indicating biogenic SO aerosol from open water (Fig. A3). The observed correlation is weak but statistically significant, meaning that the parameters are somehow related, but the predictive skill to estimate one parameter from the other at a given point in time is very low. Taken together, at the seasonal scale, the correlation analysis and high-resolution ice chemistry provide evidence for sea salt variability driven by year-round northerly atmospheric flow, either directly to the site or from other regions of the continent that are transported to the site, with an additional contribution from an open-ocean-derived sea salt in summer rather than a sea ice source.
Over the last millennium, unfractionated sea salt from open-ocean sources was relatively constant; SO Na+ ratios remained enriched with a mean SO Na+ of 3.7±2.7 above the seawater value of 0.252 (Fig. 5). A lack of SO depletion in the ISOL-ICE ice core from fractionated sea ice sources, likely dominated by blowing snow and contributions from frost flowers, is similarly not observed at other inland, high-elevation Antarctic ice core sites, which is attributed to the low accumulation rate and low temporal resolution smoothing of the winter signal and high summer biogenic SO overriding the depleted SO signal (Rankin et al., 2000, 2004). Furthermore, nss-SO from the open ocean does reach Kohnen Station in winter (Weller and Wagenbach, 2007). There are three notable periods in the ISOL-ICE sea salt chemistry record (Figs. 3 and 4). The first is around 1200 where there are no extreme sea salt deposition events and SO Na+ ratios become more enriched. The second is around 1600 where the frequency of sea salt deposition events increase. The third is from 1800 to present where there is an increase in the frequency of sea salt deposition events (Na+, Cl− and Mg2+ concentrations) at the same time as the increase in MSA− concentrations. Based on the sea salt–northerly wind relationship for the 1979–2016 period (Fig. 4), the increase in extreme sea salt deposition years in the ISOL-ICE record likely reflects stronger sea salt transport rather than changing open-water–sea ice conditions. We acknowledge that these relationships may change over time. For example, the SAM influence on Antarctic temperature and wind changed between 1957–1979 compared to 1979–present (Marshall et al., 2022). While the large-scale drivers of northerly wind may change, the sea salt–northerly wind relationship may hold true over the last millennium. Fundel et al. (2006) investigated MSA− variability in another core from the high-elevation Dronning Maud Land (DML05) in relation to atmospheric patterns. The authors found that over the reanalysis period (1969–1997), the Antarctic Dipole plays an important role during years of particularly high MSA− concentrations, while over the last 2000 years, periods of high MSA− concentrations are related to periods of higher sea salt aerosol reflecting the influence of transport on both species despite the different seasonality. Atmospheric transport strength, rather than sea ice conditions, was also found by Abram et al. (2007) as the dominant factor determining the MSA− signal preserved in ice cores in the Weddell Sea sector. While longer-term trends in MSA− concentrations are not coupled with SO Na+ ratios or sea salt variations throughout the ISOL-ICE record, transport clearly plays a dominant role in both records, with the Antarctic Dipole likely aiding in the efficient atmospheric transport of both sea salt and MSA− to the site during different periods, for example, from 1200 to 1600 CE.
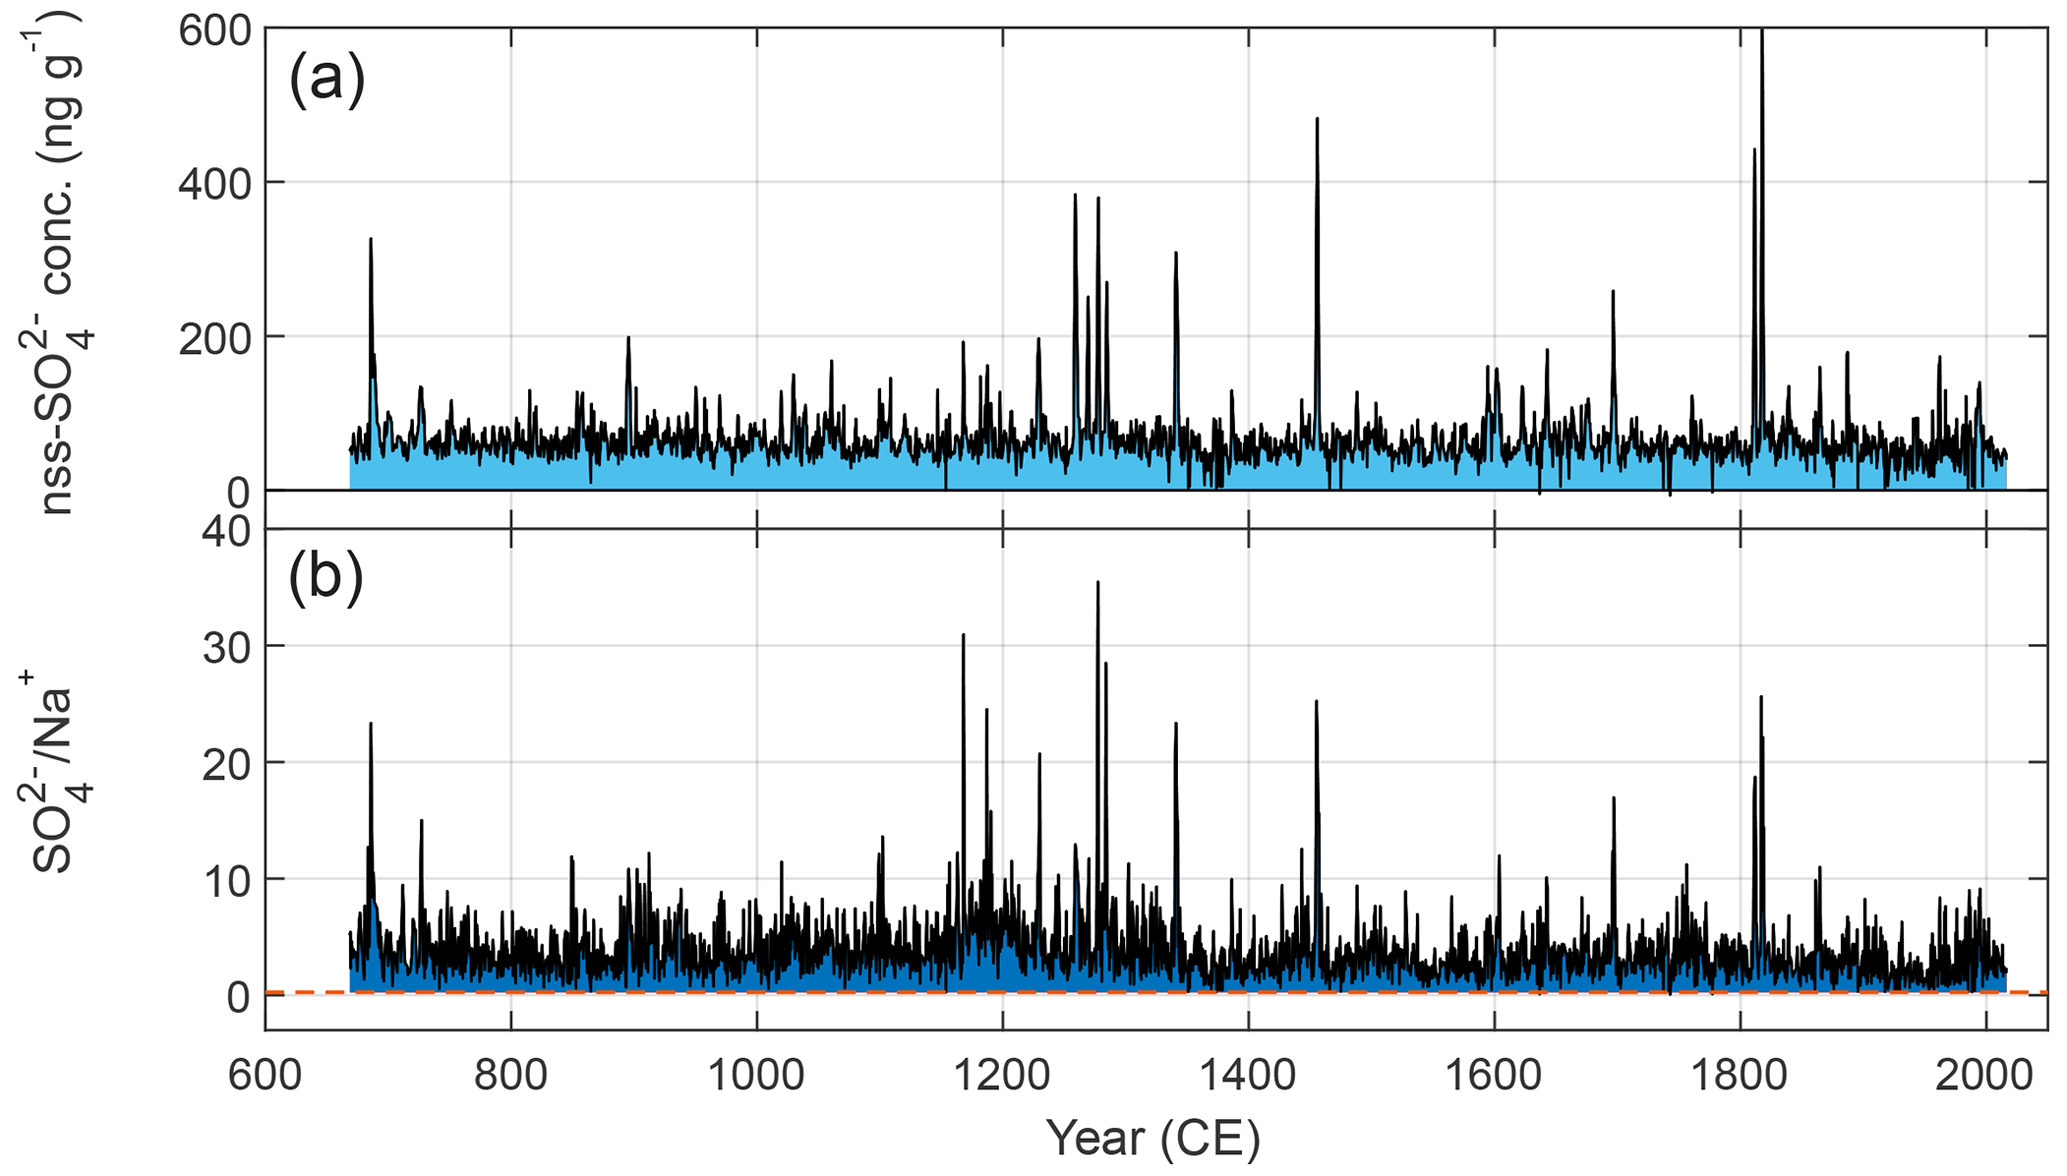
Figure 5Variability in ice core (a) non-sea-salt sulfate (nss-SO) concentration and (b) SO Na+ ratio over the last millennium from the ISOL-ICE ice core. The dashed orange line indicates the SO Na+ ratio of reference seawater. Above this line ice core SO Na+ values represent open-ocean sources in dark blue, and below the line they represent frost flower and sea ice sources of sea salt (Rankin et al., 2000). Positive nss-SO values in light blue indicate contributions from open ocean and sea ice margins, and negative values indicate contributions from sea ice sources from blowing snow and frost flowers. The nss-SO contains all the volcanic peaks identified earlier for dating the ice core. Common era is abbreviated as CE.
The ISOL-ICE core reproduces the MSA− and Cl− records from existing DML cores (Fundel et al., 2006) and extends these records by 2 decades from 2000 to 2017. The striking feature of the extended MSA− record is the continued increase in MSA− concentration over the last 2 decades starting around 1800 (Fig. 3). While MSA− concentrations continue to increase over the last 2 decades, years of extreme sea salt deposition do not. Both changes in the seasonality and extent of regional sea ice, which impact the source region and development of seasonal phytoplankton blooms in Antarctic waters (e.g. Abram et al., 2011), a change in DMS oxidation pathway from DMS to MSA and SO, and a change in atmospheric circulation strength and pathway could contribute to the MSA− increase over the last two centuries. During this same period of MSA− increase, reconstructions of sea ice conditions from Antarctic ice cores show that sea ice extent declined in the Bellingshausen–Amundsen seas region since 1850 CE (Dalaiden et al., 2021; Abram et al., 2010; Thomas et al., 2019) and the northernmost latitude of sea ice edge declined in the Weddell Sea sector (50° W–20° E) over the reconstructed period from 1900 to present (Yang et al., 2021). These recent changes call for an updated analysis of MSA−-sea ice relationships over the past 2 decades towards the present.
While previous studies found that MSA− variability in the high-elevation DML region was associated with transport strength rather the sea ice conditions (Fundel et al., 2006; Abram et al., 2007), we investigated whether the additional 2 decades of MSA− ice core data from ISOL-ICE captures local sea ice changes. Recently, Isaacs et al. (2021) and Clem et al. (2018) found that, over the period 1979–2018, ENSO impacted summer and autumn sea ice concentration around coastal DML (10–70° E) where sea ice concentration increased during a cold ENSO phase and decreased during a warm ENSO phase. Here, sea surface temperature anomalies in the tropical Pacific Ocean influenced regional circulation over the South Atlantic and encouraged meridional airflow to DML affecting sea ice thermodynamically by altering local heat transport and hence sea ice formation and melt. In the region where sea ice concentration is significantly correlated with ENSO, the sea ice concentration anomaly increased from 1979 to 2016 consistent with the pan-Antarctic sea ice concentration trend and also demonstrated that interannual variability was strongest in austral winter and spring where it was more subdued in summer and autumn when sea ice concentration was most strongly correlated with ENSO. Our correlation analysis (1979–2016) shows that ENSO variability during summer–early autumn contributes to the annual MSA− variability, that years of higher annual ice core MSA− concentrations are associated with reduced sea ice concentrations west of Prydz Bay, and that this MSA− aerosol is delivered to the ISOL-ICE ice core site by northerly distal winds. We note that the positive MSA–ENSO relationship is stronger over the shorter period of 1979–2016 compared to the 1957–2016 period, which casts uncertainty on the long-term stability of the relationship. We did not find evidence for a locally derived MSA− aerosol source in coastal DML (Fig. 4b). Thus, our updated record shows that years of increased ice core MSA− were likely driven by the transport direction with meridional winds that flow across a reduced sea ice region in the Prydz Bay region acting to synergistically reduce sea ice concentration while also increasing the delivery of MSA− to the ISOL-ICE ice core site. Assuming the MSA−–wind direction relationship holds true for the last millennium, the increase in MSA− since 1880 likely reflects stronger northerly transport over that period. Our correlation analysis, combined with our finding that sea salts do not carry a fractionated sea ice signature over the last 1300 years, shows that sea salt aerosol and MSA− concentrations continue to be primarily related to atmospheric transport over the extended 2-decade period.
While the variability of NO concentrations in the ISOL-ICE ice core will be discussed in a separate study, the significance of constraining aerosol source regions has implications for ice core NO. While NO sources at remote high-elevation Antarctic sites are not well constrained, the net primary sources in the Southern Ocean and Antarctica are peroxyacetyl nitrate (PAN) and methyl nitrate (CH3NO3) from open ocean and sea ice and stratospheric NO (Burger et al., 2022, 2023; Mulvaney and Wolff, 1993; Jones et al., 2011). The similar temporal trends of NO and MSA− compared to sea salts over the last millennium suggests a potential link between MSA− and NO through the contribution of oceanic CH3NO3 to ice core NO; i.e. the weak but statistically significant correlation between ice core NO and MSA− (R=0.10, P<0.01) is similar to nss-SO and MSA− (R=0.15, P<0.01), where the latter relationship is traditionally used to assess biogenic sulfur contributions from the ocean.
Previous studies from the Antarctic coast and Weddell Sea region provide mixed evidence for a CH3NO3 source. For example, recent studies attribute some of the atmospheric NO observed in the Weddell Sea boundary layer to oceanic alkyl nitrates including CH3NO3 (Burger et al., 2023) in addition to alkyl amide emissions from algae in the marginal sea ice zone around the Antarctic Peninsula (Brean et al., 2021; Dall'Osto et al., 2017, 2019). At Halley Station, Jones et al. (2011) observed atmospheric organic NO (PAN and CH3NO3) dominate NOy in winter, with a seasonality consistent with an oceanic source. Weller et al. (2002) showed similar seasonality of NOy at Neumayer Station, yet they did not find any significant contribution from the marine boundary layer based on trajectory analyses and radioisotope measurements. However, at Halley Station, year-round NO in surface snow correlated with inorganic NOy and not with CH3NO3 (Jones et al., 2011). The correlation may be different further from the source on the Antarctic Plateau as suggested by the MSA− and NO correlation in the ISOL-ICE ice core (full record: R=0.10, P<0.01; record excluding 1600–1800: R=0.22, P<0.01). As there are no NOy observations in high-elevation Droning Maud Land, further field measurements and modelling studies are required to understand the relationship, to confirm an oceanic alkyl nitrate and CH3NO3 contribution to ice core NO and whether these organic source changes are imprinted in the NO concentration record and to understand why the ice core MSA− and NO relationship is intermittent, i.e. between 1600–1800 when MSA− and NO do not covary (R=0.24, P<0.01). While sea salt fractionation at the ISOL-ICE ice core site cannot be used as a chemical signature of sea ice source strength, sea salt concentrations show that oceanic aerosol sources have remained stable over the last millennium and that the relationship between sea salts and reanalysis data products implies that there have been no large changes in atmospheric transport over the period. Therefore, trends in ice core NO and its stable isotopic composition likely reflect changes in atmospheric processes, such as photochemical recycling of NO between the air–snow interface.
4.2 Accumulation rate and implications for the nitrate isotope record
As local deposition influences the accumulation rate in the DML region, as shown through multiple ice core accumulation records (e.g. Oerter et al., 2000; Sommer et al., 2000), a site-specific accumulation record is required for the interpretation of the ISOL-ICE δ15N(NO) record. Snow accumulation at ISOL-ICE originates predominantly from the South Atlantic with onshore winds delivering marine air masses to the site (Fig. 4) and the majority of precipitation occurring from frontal clouds (Reijmer and Oerlemans, 2002; Welker et al., 2014). This is consistent with air mass back trajectory studies by Reijmer et al. (2002), who show that air parcels and precipitation events at the Kohnen Station site originate in the South Atlantic Ocean around 4 d prior to their arrival on the DML plateau. Assuming the relationship between annual snow accumulation and winds persisted over the last millennium, years of high snow accumulation in the ISOL-ICE record were driven by northerly atmospheric flow from the South Atlantic. The ISOL-ICE snow accumulation rate increased between 1979 and 1991, consistent with a composite accumulation record from ice cores in the region (Oerter et al., 2000). The increased accumulation rate is tied to local increases in northerly flow to the DML region associated with regional circulation changes along and offshore of the DML coast during the austral summer (December to February) and austral autumn (March to May) seasons. The broader circulation pattern trend in these two seasons resembles a zonal wave 3 pattern, especially in austral autumn. Thus, while we do not find a significant relationship between accumulation and ENSO or SAM, zonal wave 3, a well-known and prominent internal feature of the Southern Hemisphere atmospheric circulation (e.g. Raphael, 2004; Goyal et al., 2022), may be an important mechanism for producing localized northerly flow to the site that can influence accumulation variability. Also, these results reinforce earlier findings from Fig. 4a and highlight the importance of sub-annual, seasonal circulation changes and variability in driving annual accumulation variability. Furthermore, other periods of decade-long accumulation increases occur elsewhere in the record, e.g. between 1840 and 1849, which could also result from stronger synoptic circulation assuming the snow accumulation–geopotential height relationship did not change.
While the accumulation rate has been relatively stable over the last millennium and the record does not display centennial-scale variability, the significant interannual variability in the record ranging between 2 and 20 cm a−1 (w.e.) needs to be accounted for when interpreting the ice core δ15N(NO) record, which in turn is sensitive to changes in the accumulation rate and seasonality at the site (Winton et al., 2020). Air–snow transfer modelling indicates that δ15N(NO) preserved in the ISOL-ICE ice core will be less sensitive to changes in surface UV than that retrieved at the lower snow accumulation site of Dome C. However, the higher snow accumulation rate and more accurate dating of the ISOL-ICE ice core allows for higher-resolution δ15N(NO)-based reconstructions of past surface UV (TCO) (Winton et al., 2020). The 6 cm a−1 average accumulation rate at the ISOL-ICE core site is high enough to preserve the seasonal cycle of NO and δ15N(NO) near the surface in large-volume snow pit samples (Winton et al., 2020). The proportion of years in the accumulation record < 6 cm a−1 is 46 % and these low-accumulation years improve the detection of multi-year trends in TCO at the expense of temporal resolution; i.e. when annual accumulation decreases below 6 cm a−1, the seasonal NO signal is not preserved, reducing noise in NO and δ15N(NO) from the impact of accumulation on NO photolysis and concurrent isotope fractionation. Based on our age–depth model, the NO concentrations in the ISOL-ICE core (Fig. 3b), and the minimum NO requirement for δ15N(NO) using the preconcentration and denitrifier method (Morin et al., 2008), the highest-resolution δ15N(NO) record obtained from ISOL-ICE is annual rather than seasonal. This is higher resolution than what could be produced from the lower accumulation rate at Dome C (Winton et al., 2020) and is sufficient to achieve the goal of investigating the δ15N(NO) variability over the last millennium. Future work will investigate the removal of the accumulation signature of the δ15N(NO) record to reconstruct past surface UV radiation at the site using the inverse TRANSITS model, which corrects for the effects of post-depositional processing on ice core δ15N(NO) (Jiang et al., 2023).
Lastly, the ISOL-ICE accumulation rate falls within the range of 4 to 20 cm a−1 for reconstructing surface mass balance from ice core δ15N(NO) proposed by Akers et al. (2022). The proportion of years in the accumulation record < 4 cm a−1 is 12 %. At these low accumulation rates, signal preservation due to drift, wind erosion, and seasonal bias at the seasonal resolution is compromised. Therefore, a surface mass balance reconstruction based on the Akers et al. (2022) transfer function would need to remove these very low accumulation years, or if they are not statistically frequent it would need to smooth them by averaging a longer timescale.
In this study, we present the age–depth scale, accumulation rate, and initial ice chemistry data from the 120 m deep ISOL-ICE ice core drilled at Kohnen Station in DML on the high-elevation Plateau in January 2017 to set the framework for the interpretation of the ISOL-ICE ice core record of stable nitrogen and oxygen isotopes in nitrate. The age scale was derived using well-established dating techniques for ice cores in the region. The ISOL-ICE ice core spans the last 1349 years from 668 to 2017 CE ± 3 years, extending the EDML core by 20 years towards the present. The mean snow accumulation rate of 6.5±2.4 cm a−1 (w.e.) was stable over the last millennium, consistent with other ice cores in the region, with no notable changes over the last 2 decades. While the snow accumulation record does not display longer temporal trends over the last millennium, the significant interannual variability in the record needs to be accounted for when interpreting the nitrate stable isotope record, which is sensitive to changes in the accumulation rate and seasonality at the site. Correlation of the snow accumulation record with climate variables over the observational era (1979–2016) showed that snow accumulation at ISOL-ICE is predominately derived from the South Atlantic, with onshore winds delivering marine air masses to the site.
The ISOL-ICE core replicated other high-elevation DML ice chemistry records over the last millennium that were recovered decades earlier, highlighting the reproducibility of climate and aerosol records in the region. Deposition of marine sea salts (Na+, Mg2+, and Cl−) to the ISOL-ICE ice core site have remained stable over the last millennium. While the centennial-scale variability of MSA− and NO concentrations largely covaried and increased over the last few centuries. The extended ISOL-ICE record of the last 2 decades showed that MSA− continued to increase while there were less frequent deposition events of sea salts relative to the last millennium. Our correlation analysis, combined with our finding that sea salts do not carry a fractionated sea ice signature over the last 200 years, shows that sea salt aerosol and MSA− concentrations continue to be primarily related to atmospheric transport over the extended 2-decade period. A potential link with MSA− and NO ice core variability warrants future work to investigate an oceanic alkyl nitrate and CH3NO3 contribution to ice core NO. As sea salt deposition, atmospheric transport, and snow accumulation rates remained stable over the last millennium, these factors are unlikely to drive the temporal variability in the observed 1300-year ISOL-ICE ice core record of NO and its stable isotopic composition.
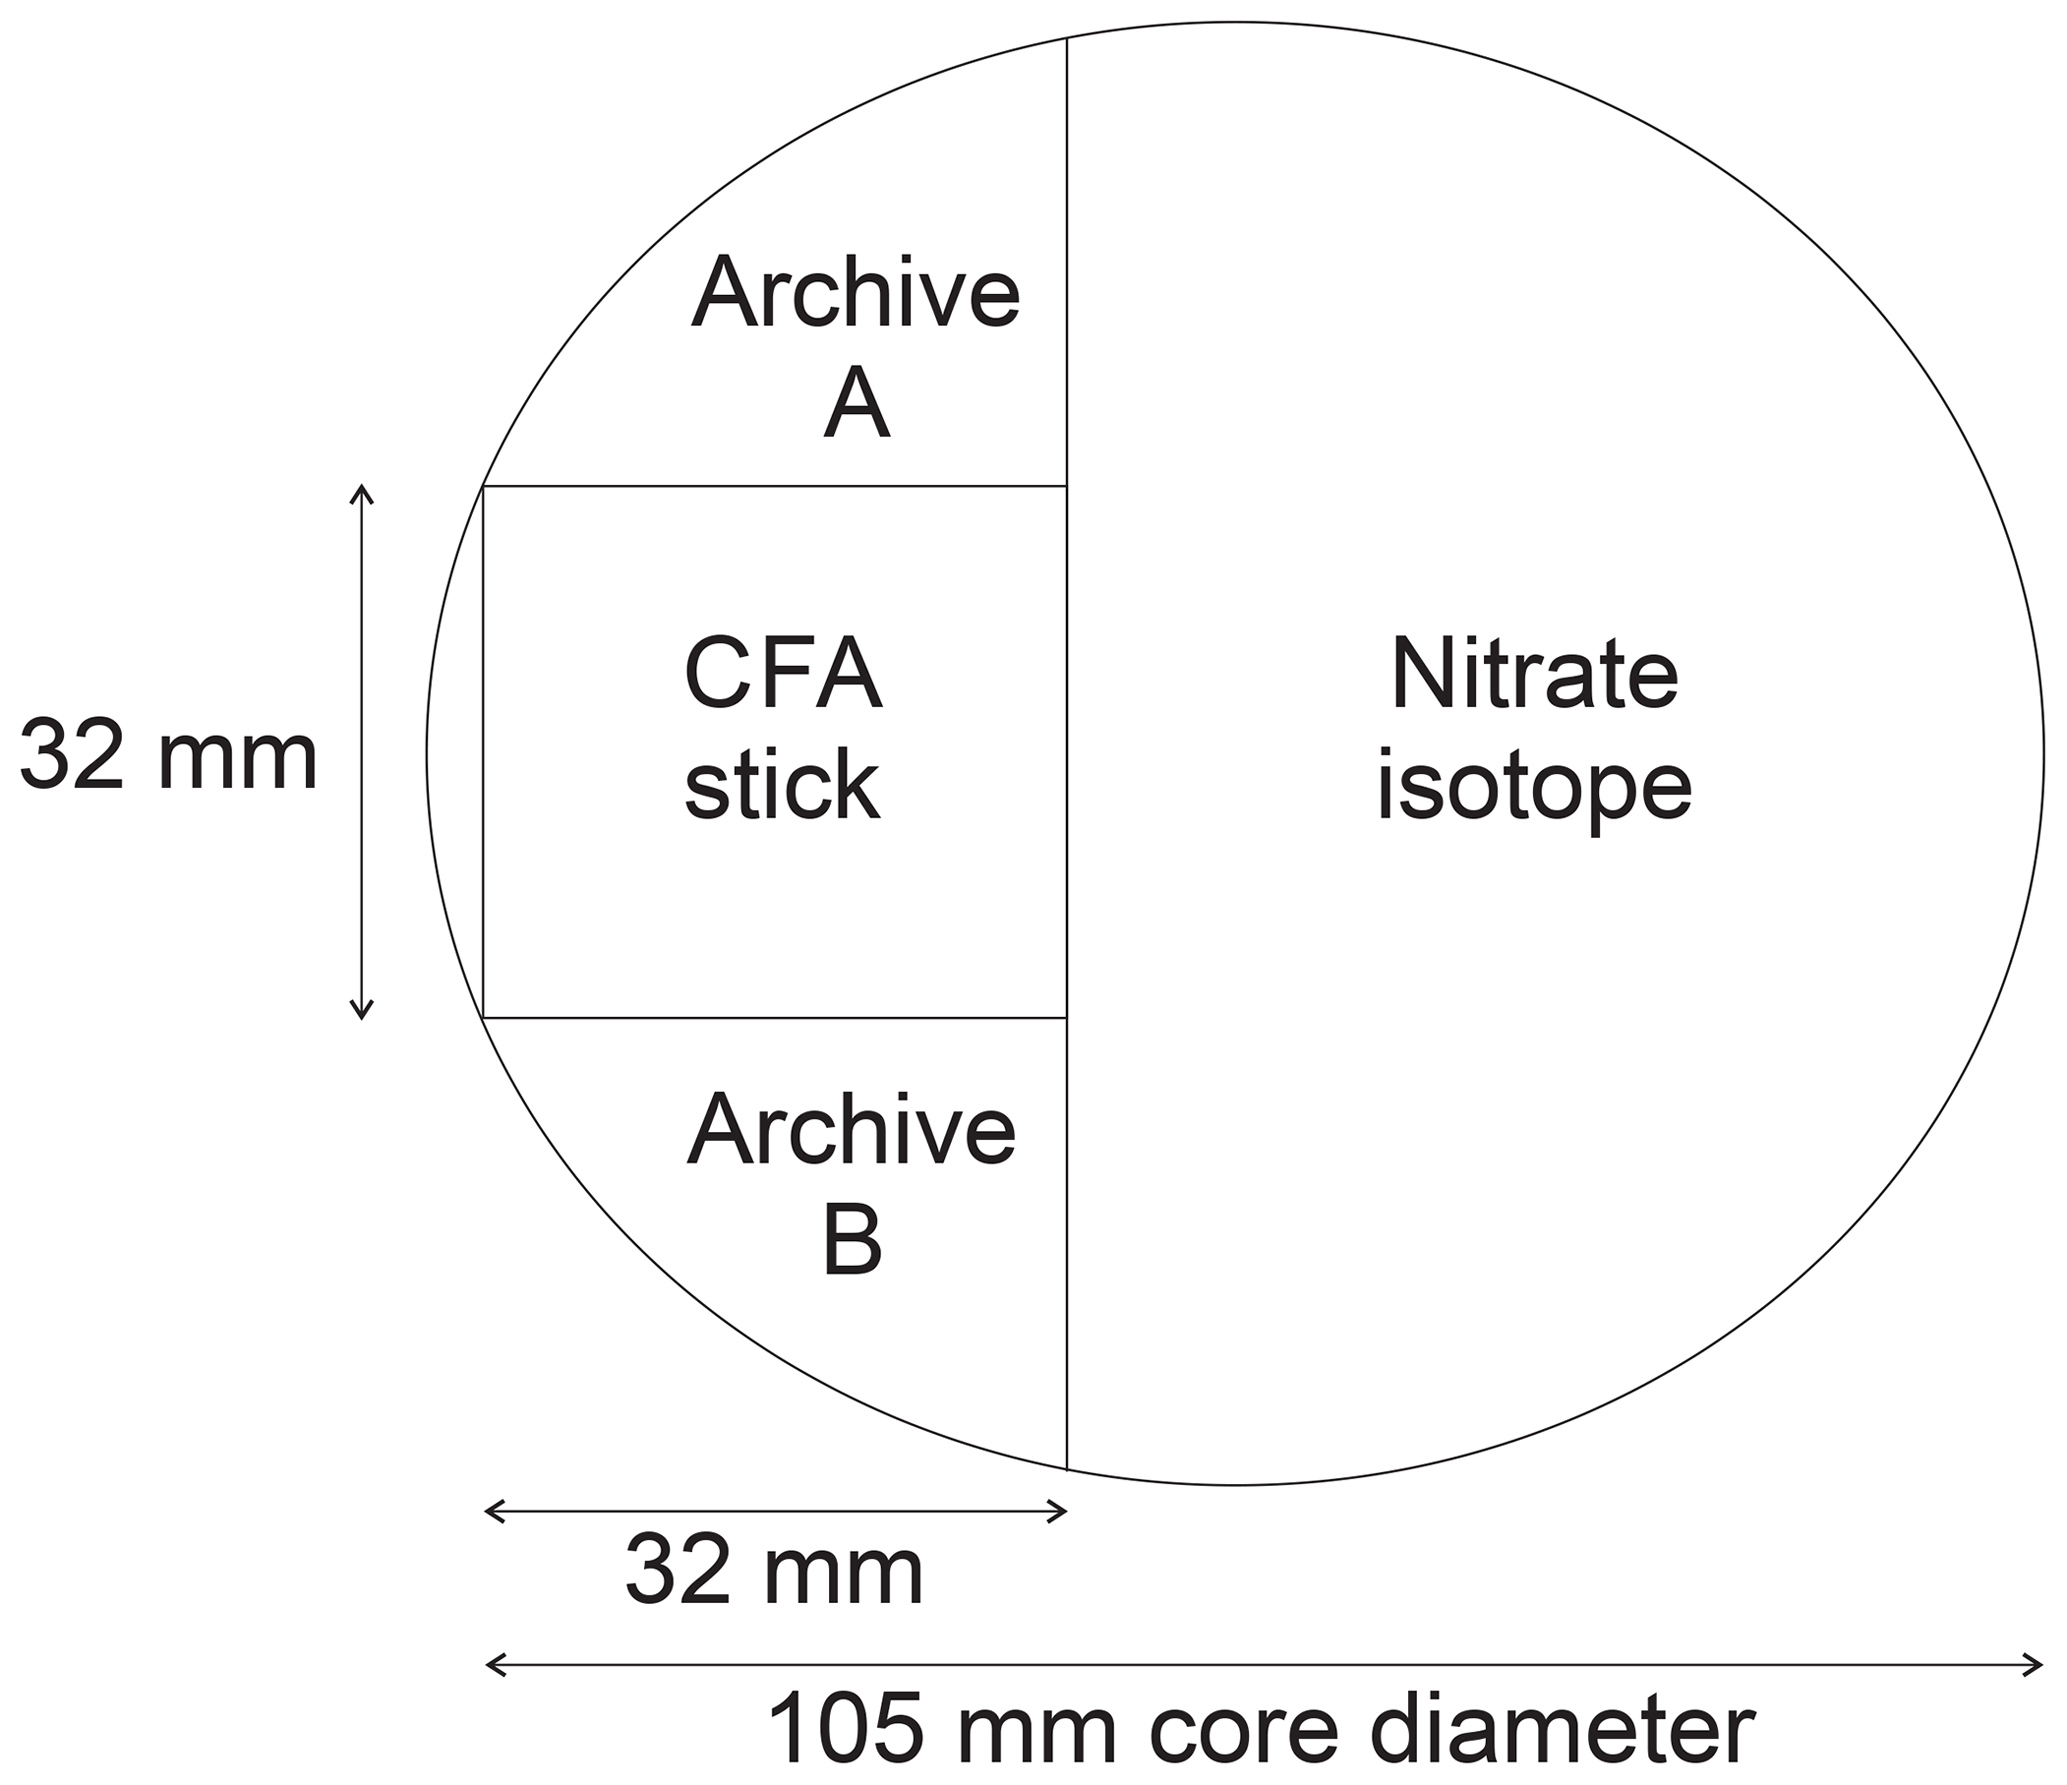
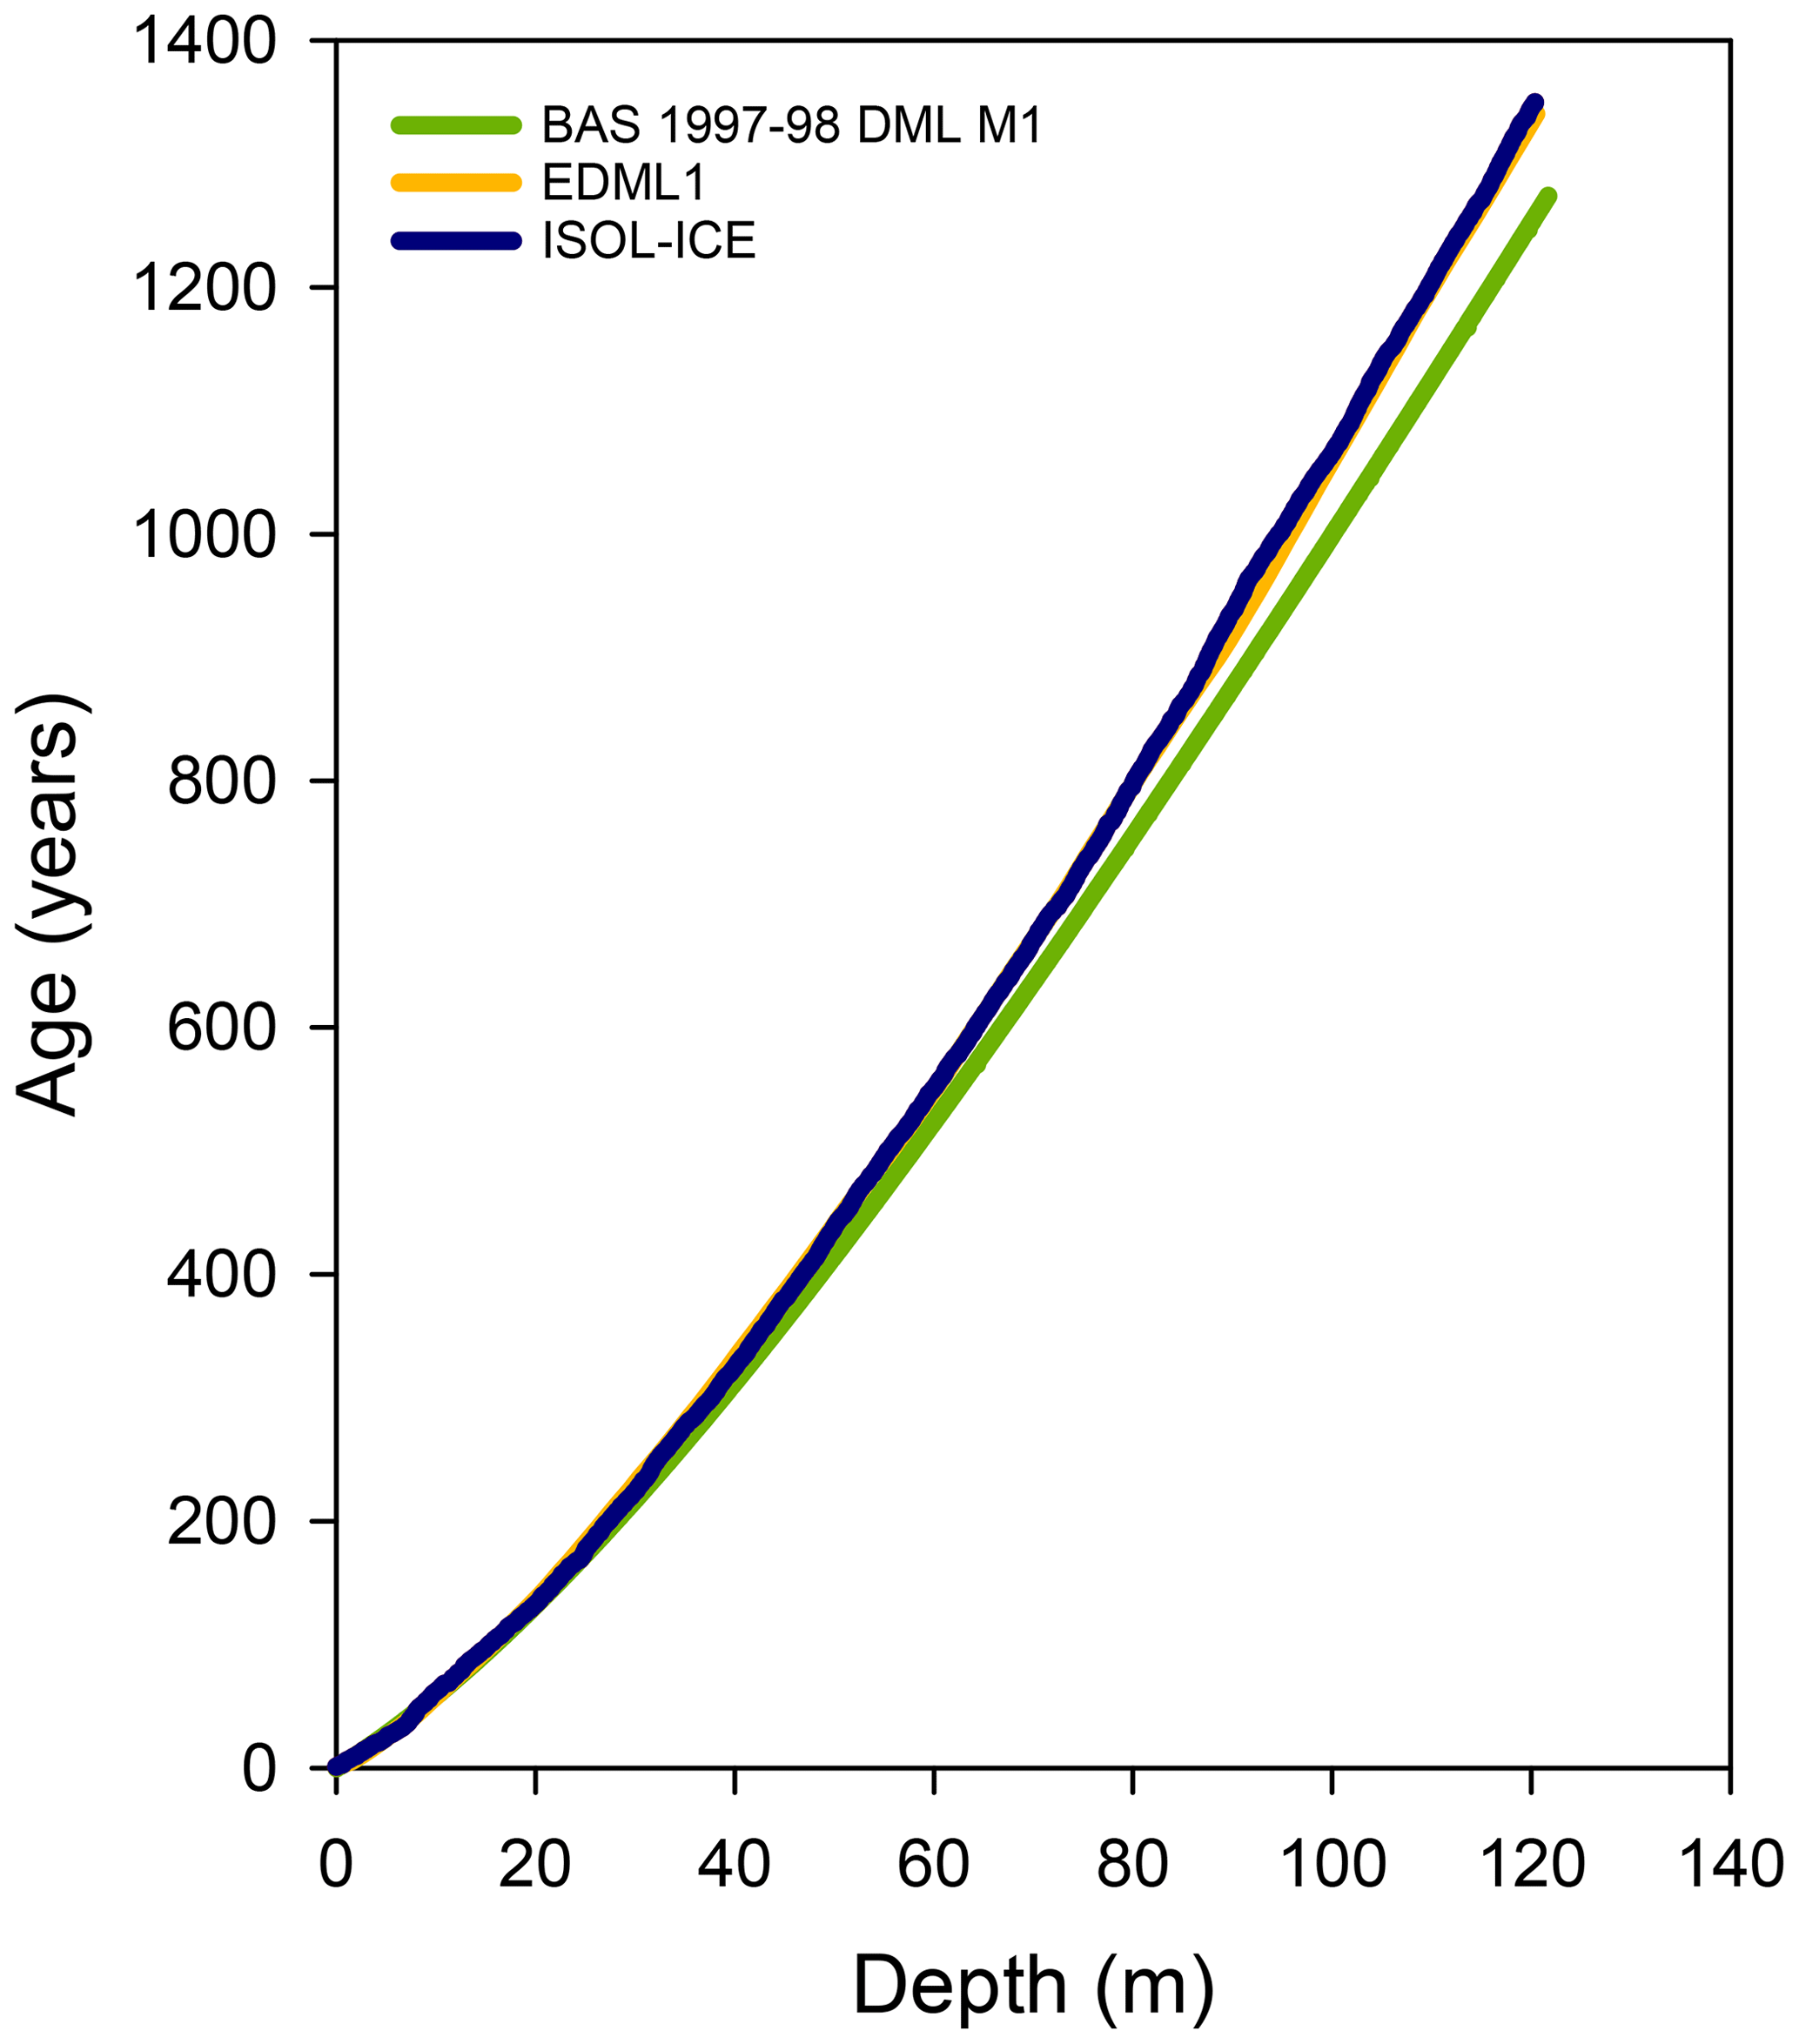
Figure A2Age–depth model of the ISOL-ICE ice core and comparison to the EDML (EDML1 chronology; Ruth et al., 2007) and M1 ice core (Hofstede et al., 2004). EDML and ISOL-ICE ice cores have the same age–depth scale as the drilling sites and are located 1 km apart. However, M1 was drilled in a slightly higher accumulation zone and thus captures fewer years for the same depth.
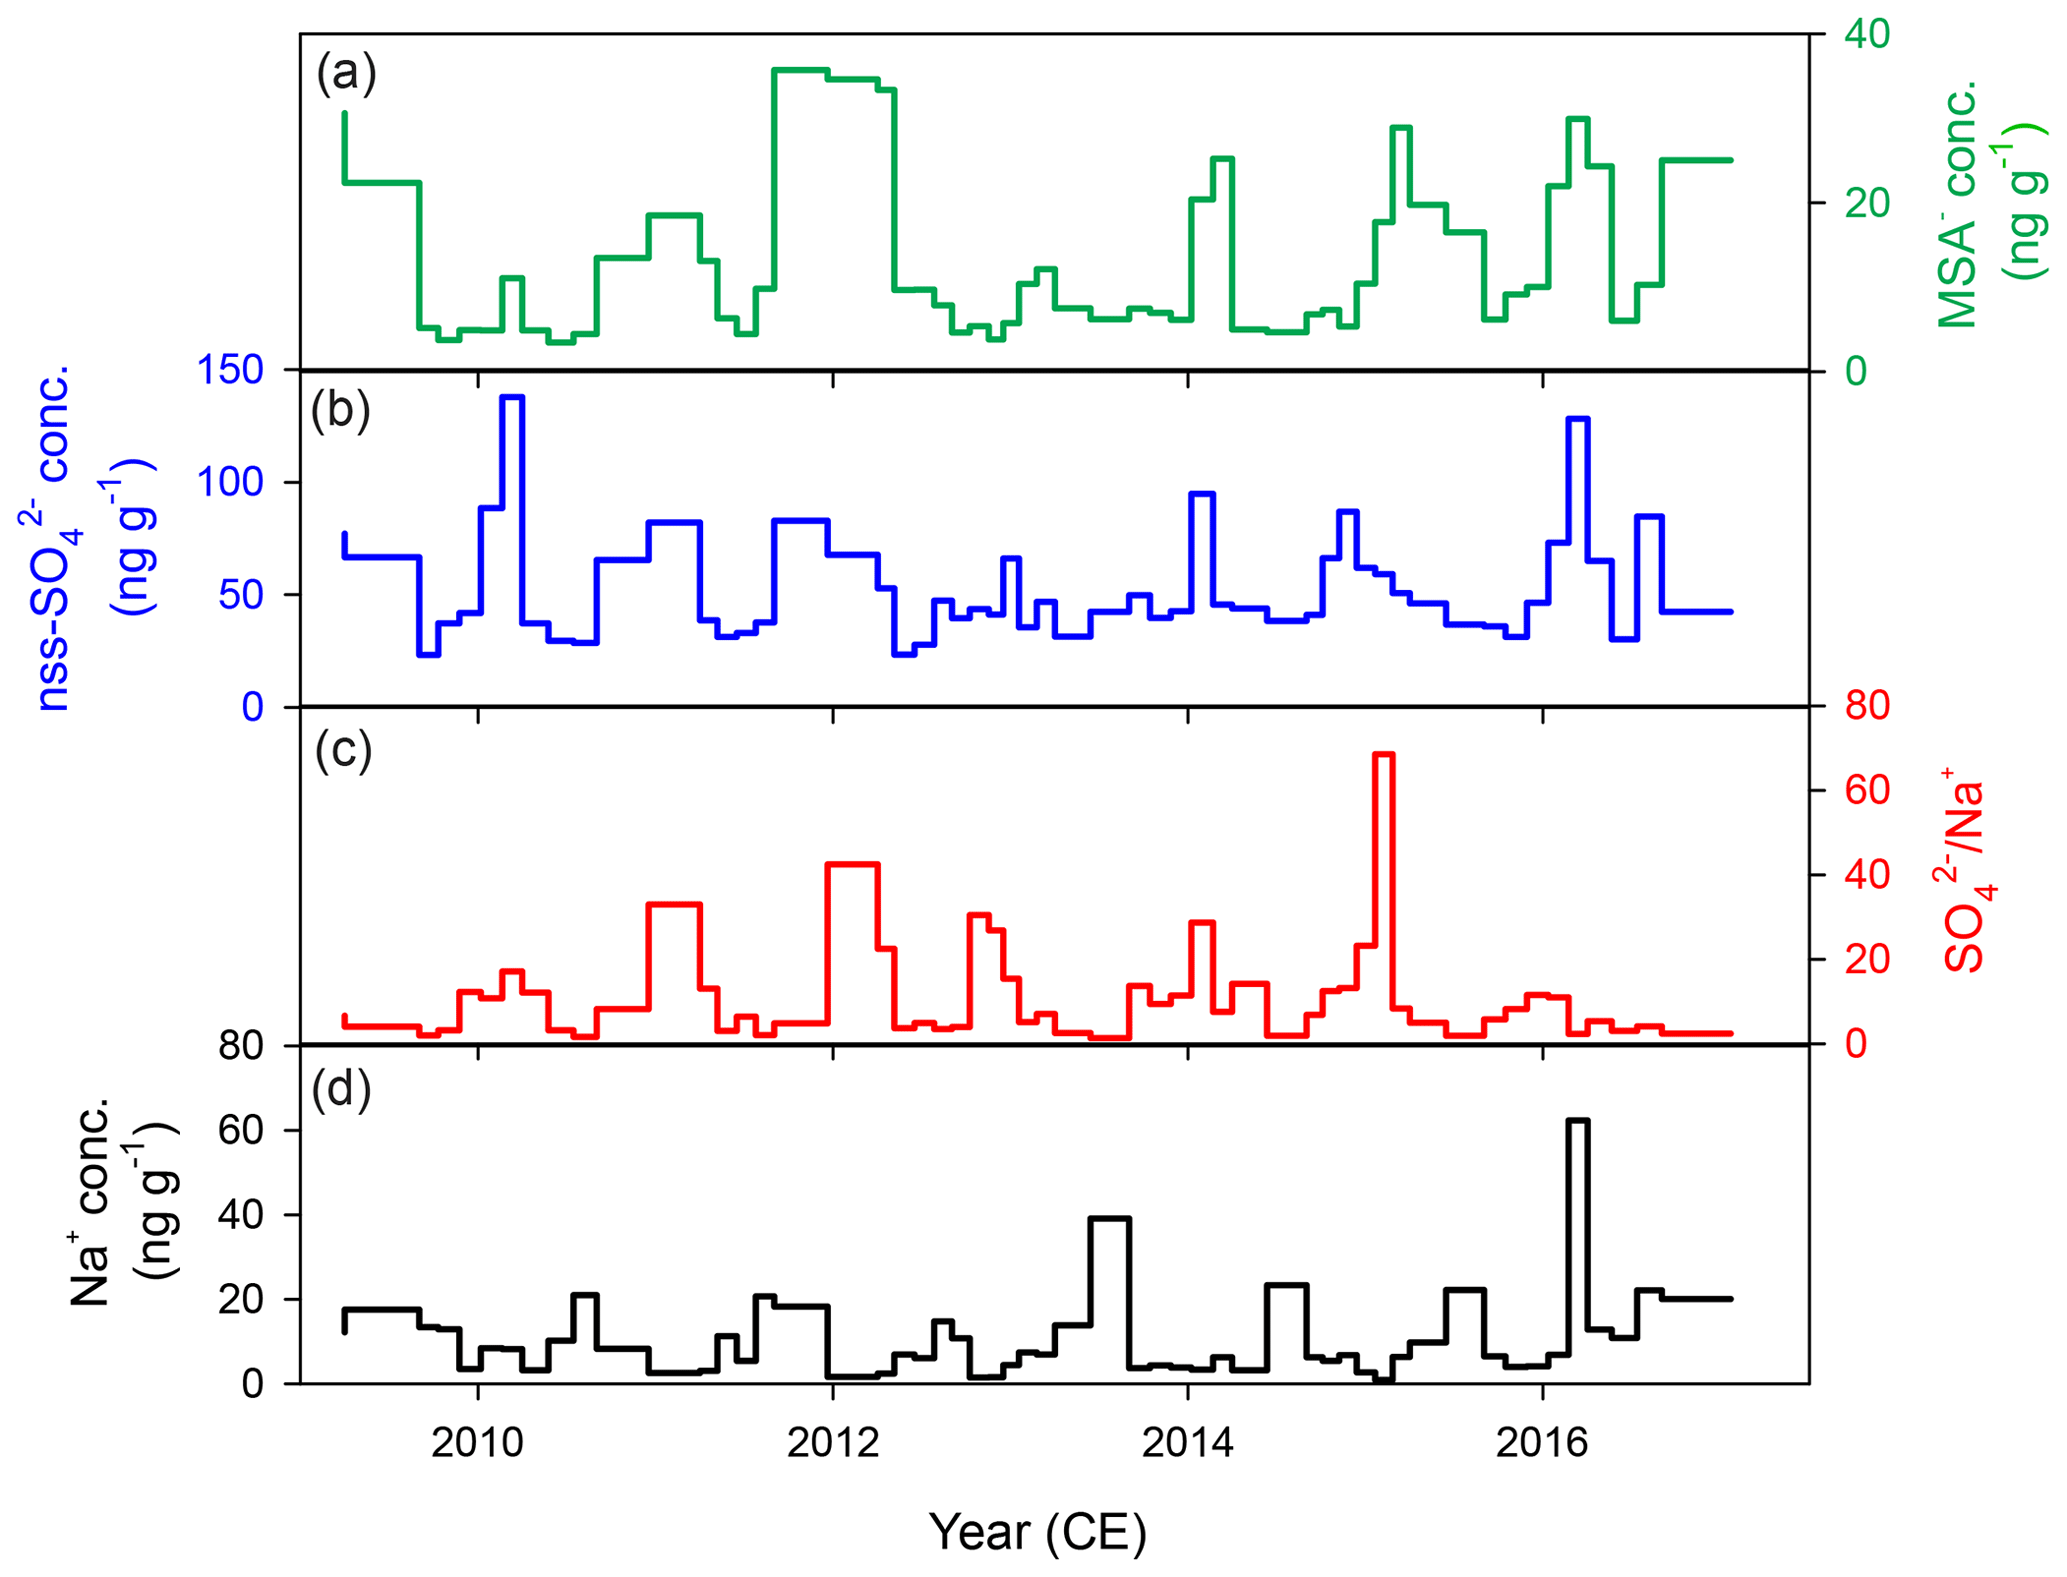
Figure A3Seasonal cycles in (a) methane sulfonate (MSA−), (b) non-sea-salt sulfate (nss-SO), (c) SO Na+ ratio, and (d) sodium (Na+) concentrations in ISOL-ICE snow pit A (Winton et al., 2020).
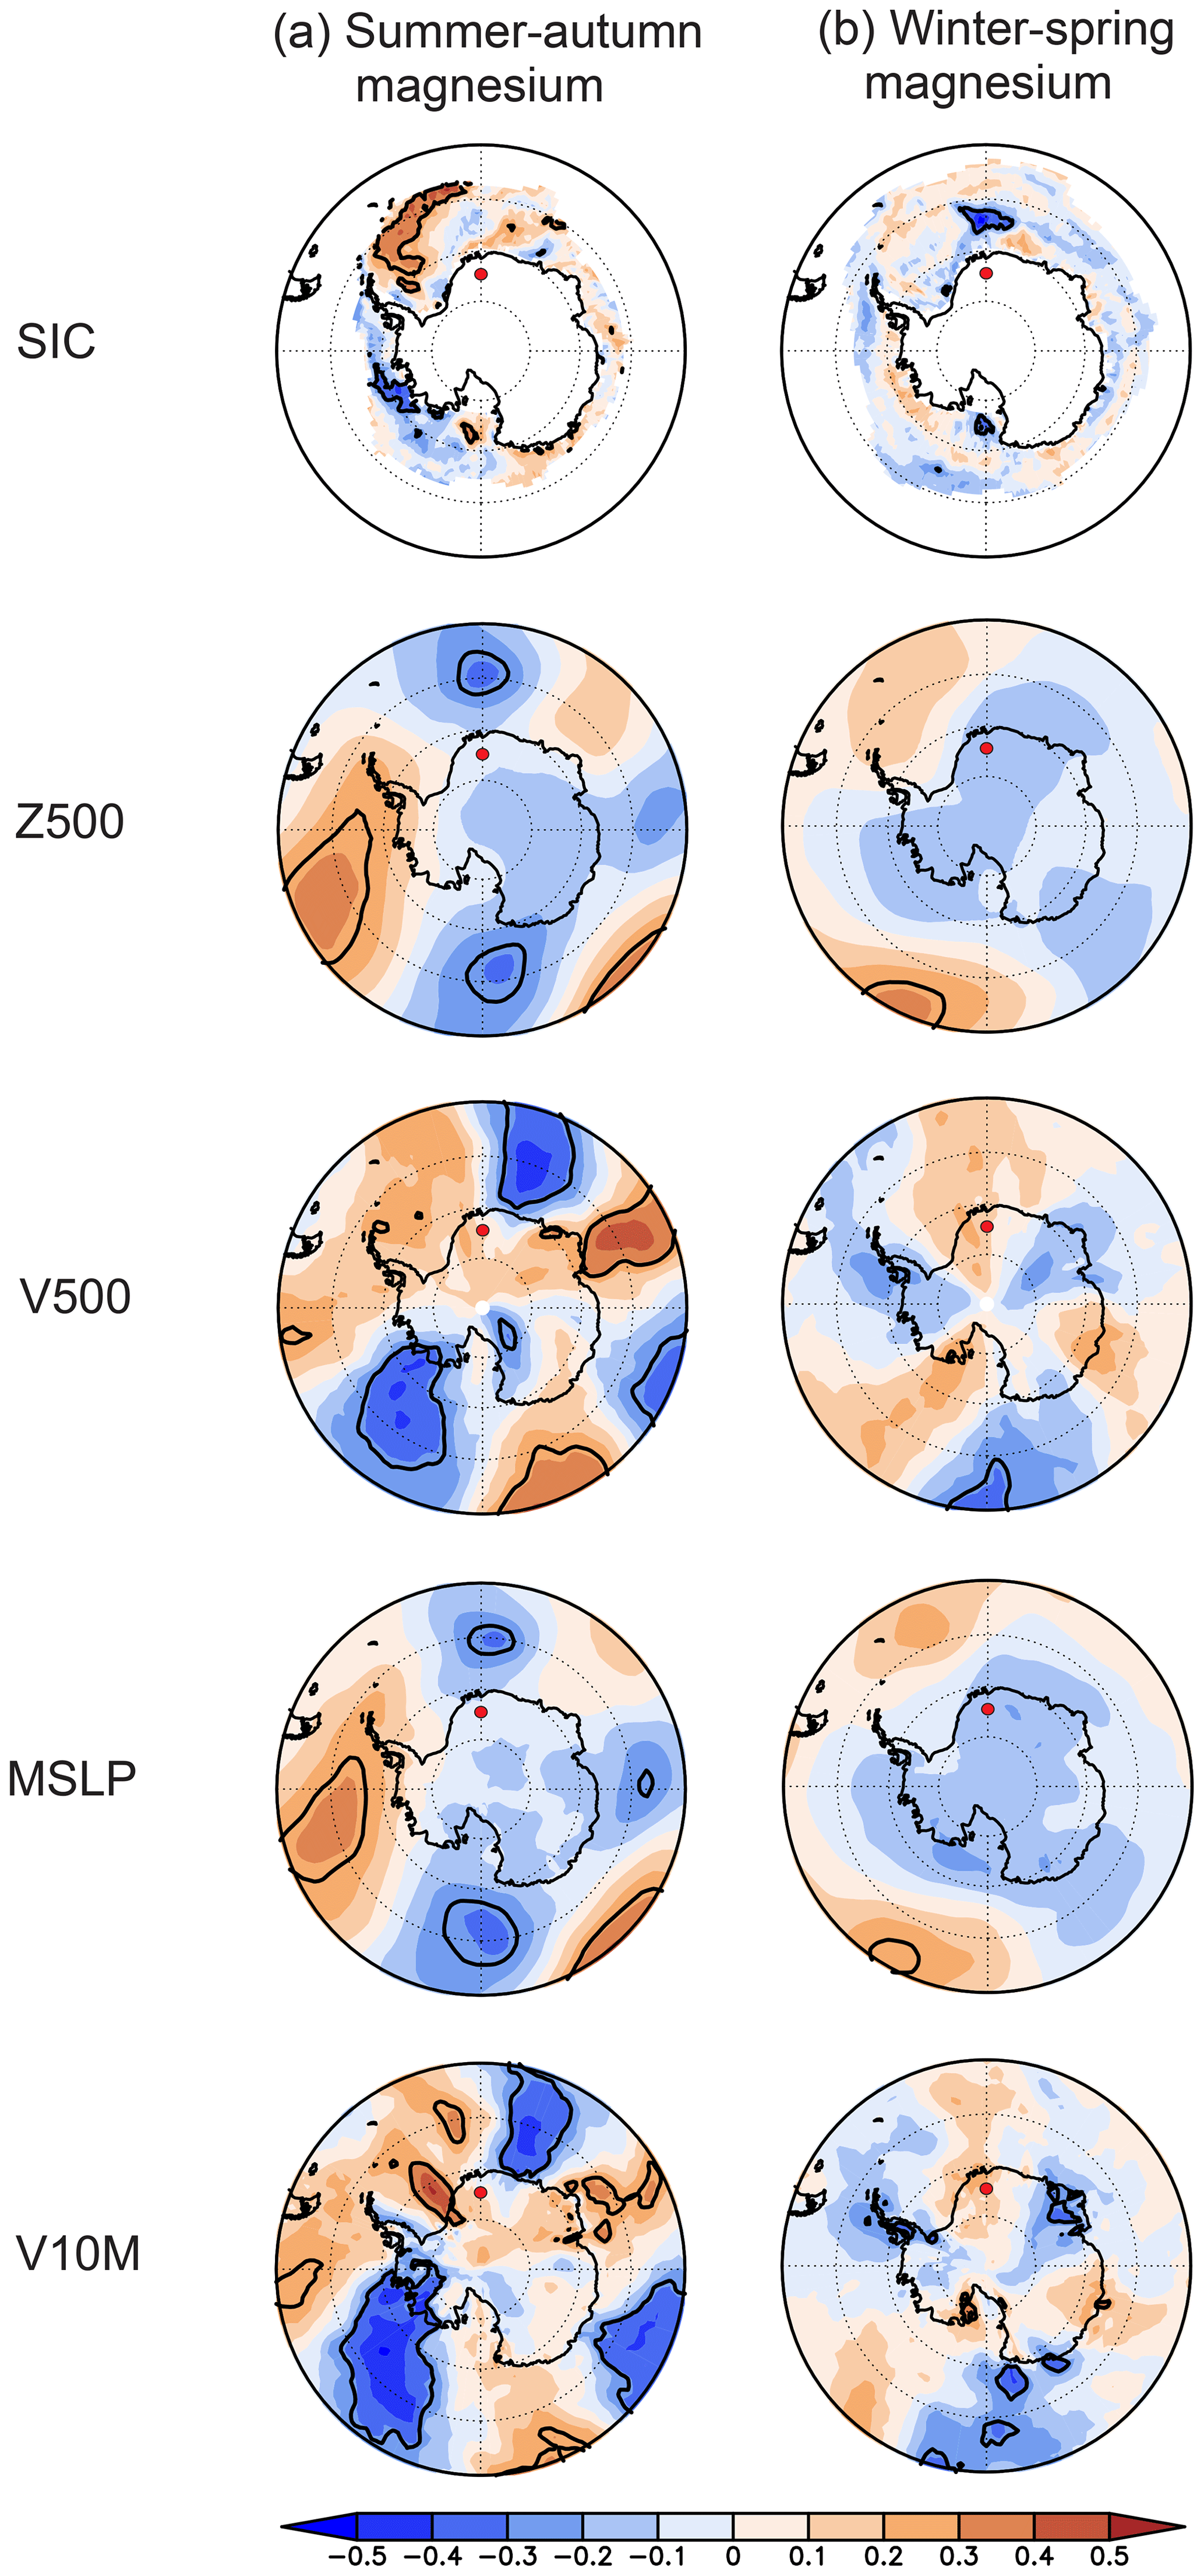
Figure A4Seasonal correlations during the observational era (1979–2016) between the ISOL-ICE ice core record and sea ice concentration (SIC), 500 hPa geopotential height (Z500), 500 hPa meridional wind (V500), mean sea level pressure (MSLP), and 10 m meridional wind (V10 M). Correlations are for (a) summer–autumn magnesium concentration and (b) winter–spring magnesium concentration. The red dot is the location of the ISOL-ICE ice core site. Coloured shading shows Pearson's correlation coefficient values as indicated by the colour bar at the bottom. The bold black contours denote correlations that are significant at the 10 % level based on a two=tailed Student's t test.
Table A1Accuracy and precision of soluble anion and trace element concentrations determined from repeated measurements of two CRMs (European Reference Material ERM-CA408 simulated rainwater and European Reference Material, ERM-CA616 groundwater). Accuracy and precision are not reported for MSA− as the CRMs does not contain that analyte. The number of CRM measurements used for the accuracy and precision calculations is also listed (n).
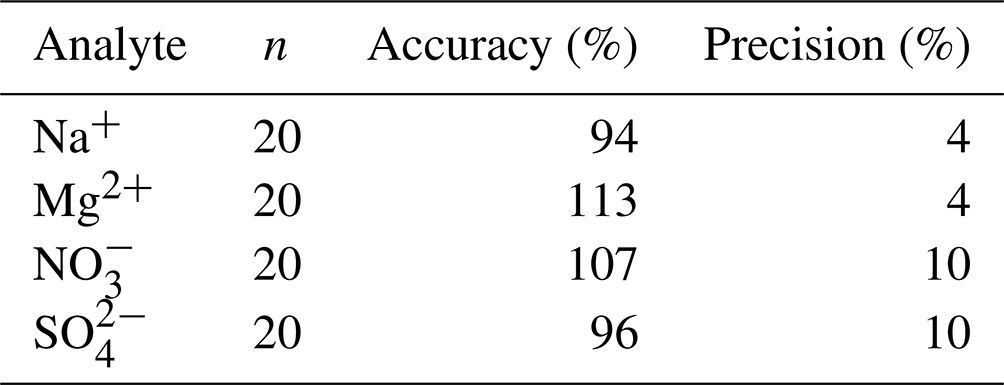
Table A2Tie points for annual-layer counting. The dates were taken from either the eruption date if known or the deposition date reported in the literature for ice cores in the DML region if unknown. ISOL-ICE deposition dates refer to the annual-layer-counted date at the identified volcanic horizon. No data is abbreviated as n.d.
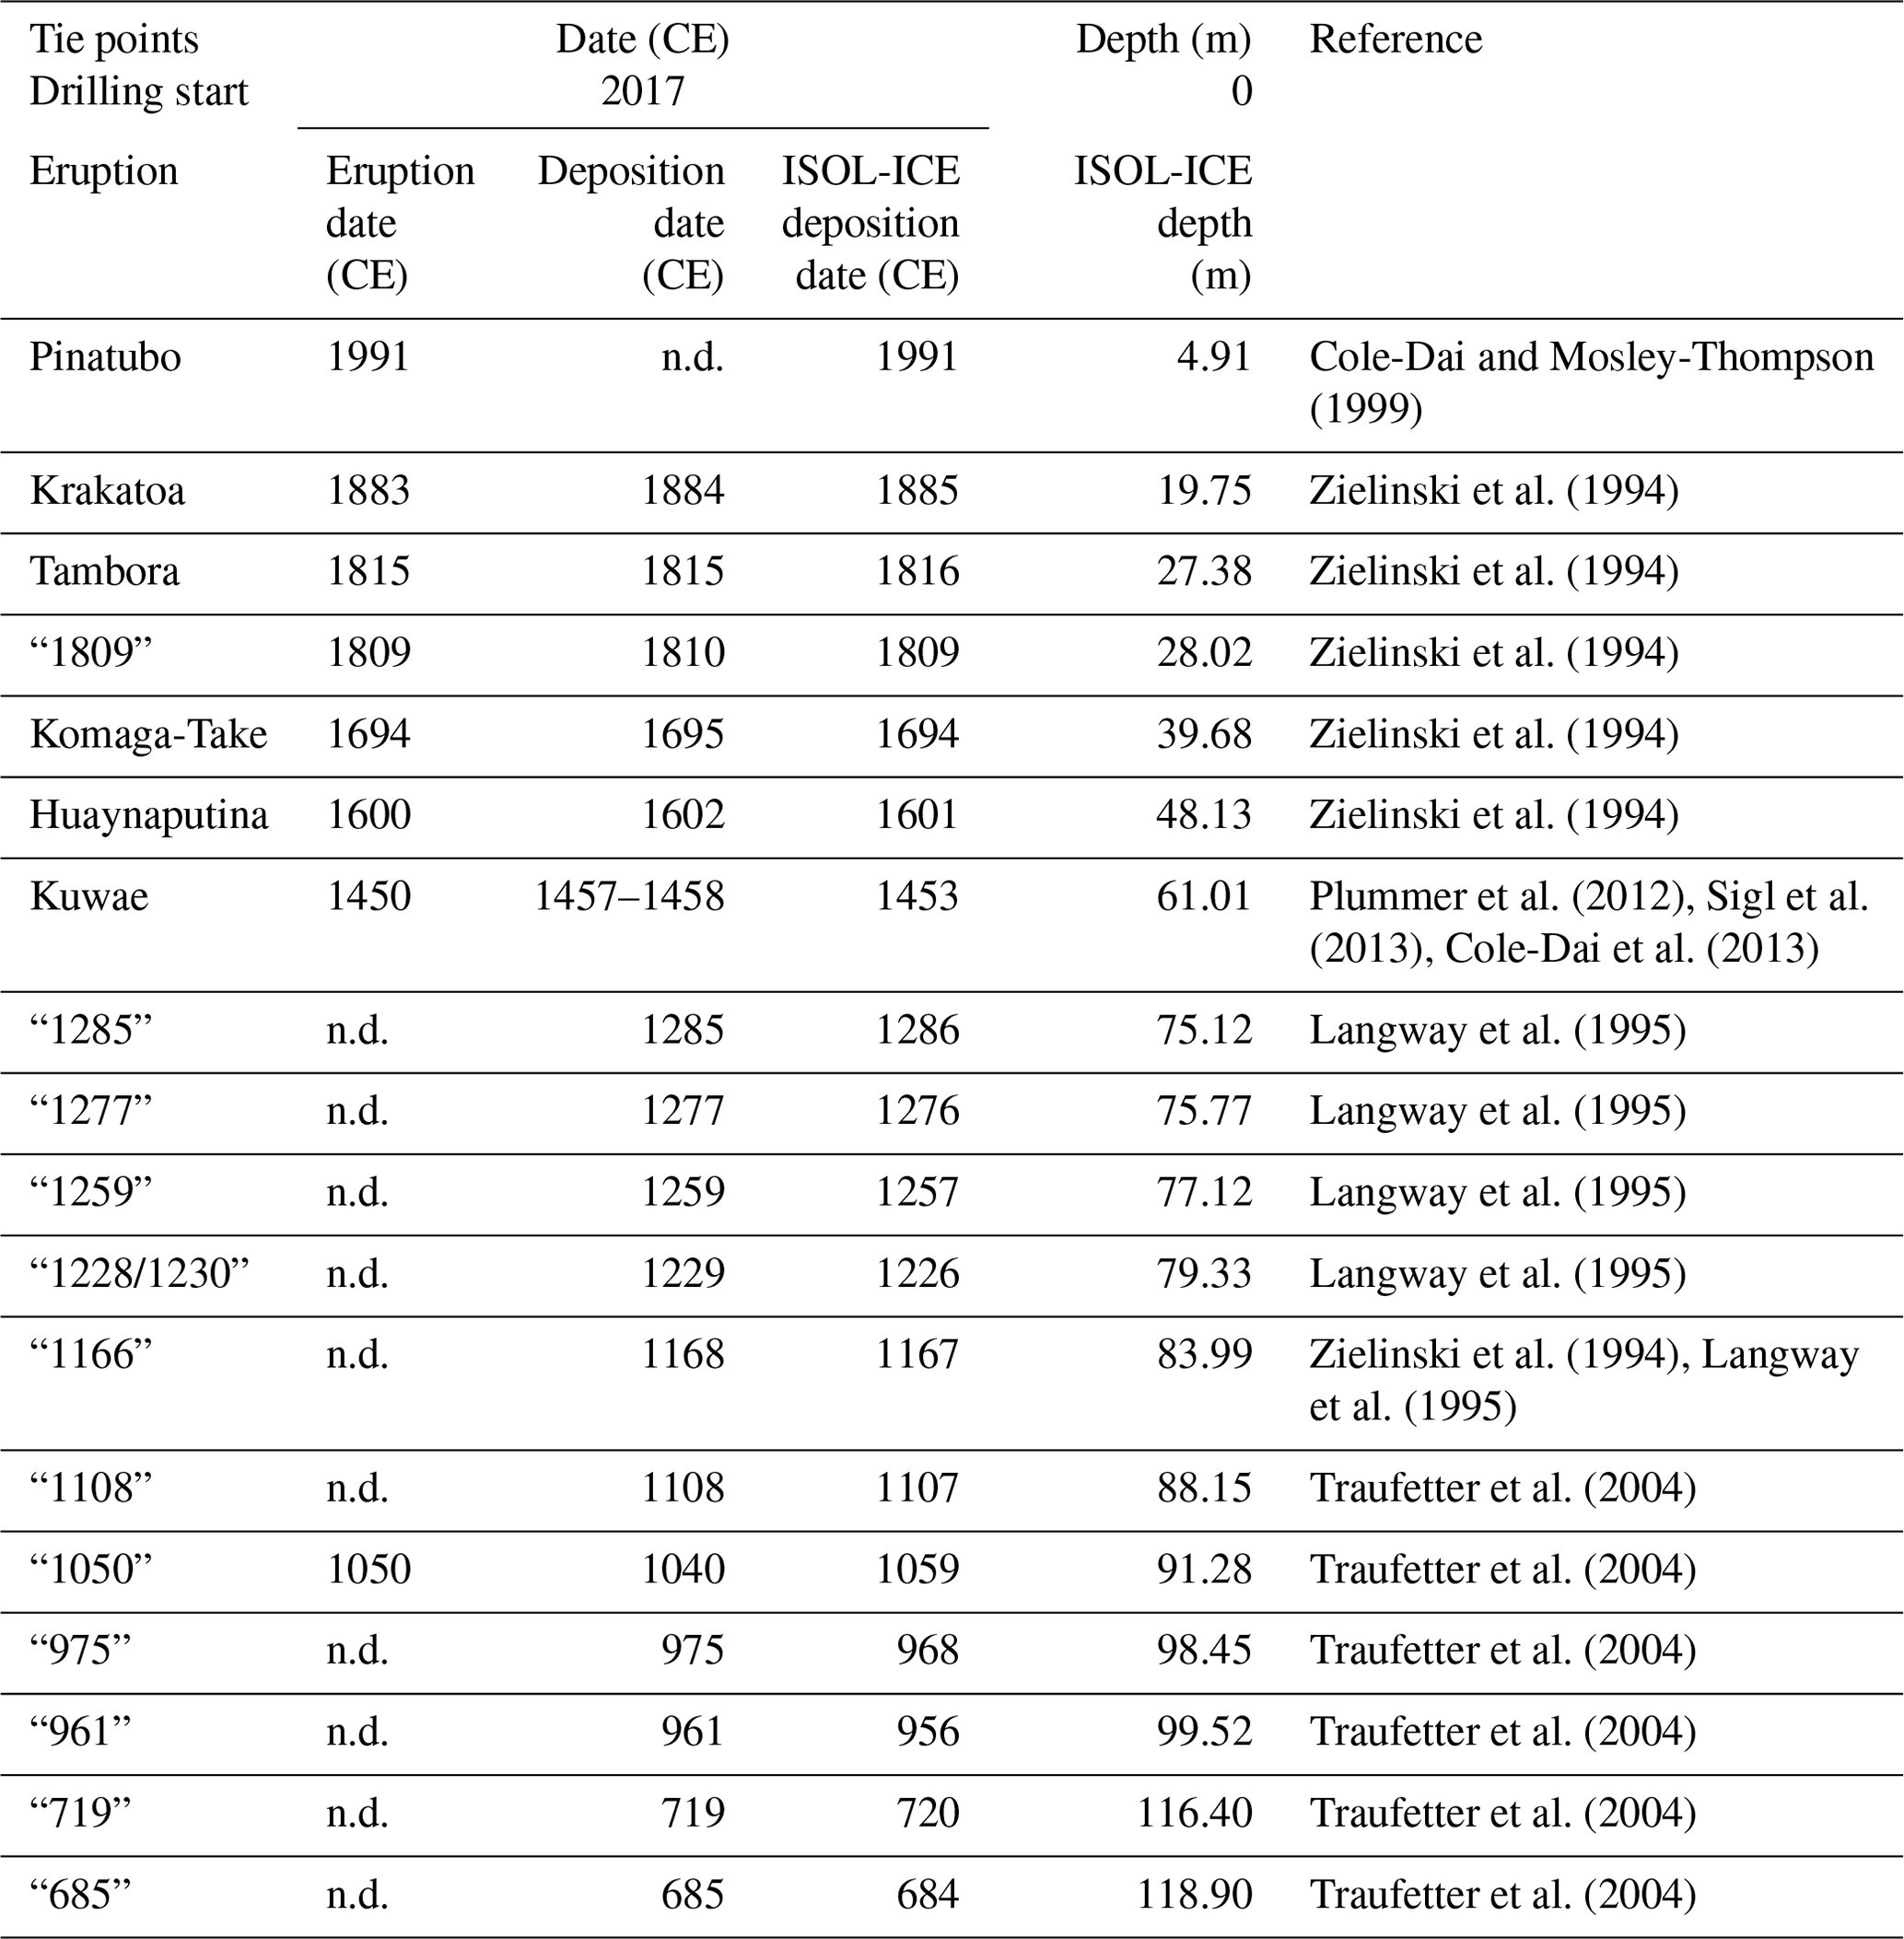
Table A3Correlation coefficients of annual ice core chemistry and snow accumulation rate with the SAM, Niño 3.4, and SOI indices over the period 1957–2016 and 1979–2016. Correlations significant at p<0.10 are given in bold. The significance is calculated based on a two-tailed Student's t test. The monthly boundaries for calculating the indices are January to December for SAM and January to April and June to November for Niño 3.4 and SOI.
The data sets for the ISOL-ICE age–depth model, accumulation rate, DEP, and ice chemistry are available through the Polar Data Centre at https://doi.org/10.5285/9c972cfb-0ffa-4144-a943-da6eb82431d2 (Winton et al., 2019).
Conceptualization: MMF, JS, and VHLW. Methodology: MMF, RM, and VHLW. Validation: VHLW. Formal analysis: VHLW. Investigation: all authors. Resources: MMF and RM. Data curation: VHLW. Writing – original draft preparation: VHLW. Writing – review and editing: all authors. Funding acquisition: MMF, JS, and RM. All authors have read and agreed to the published version of the manuscript.
The contact author has declared that none of the authors has any competing interests.
Publisher's note: Copernicus Publications remains neutral with regard to jurisdictional claims made in the text, published maps, institutional affiliations, or any other geographical representation in this paper. While Copernicus Publications makes every effort to include appropriate place names, the final responsibility lies with the authors.
This article is part of the special issue “Ice core science at the three poles (CP/TC inter-journal SI)”. It is not associated with a conference.
We would like to thank the British Antarctic Survey (BAS) and Alfred Wegener Institute (AWI) staff for their field and logistical support at Halley Station and Kohnen Station, respectively. Technical support for ice core measurements at BAS were provided by Rebecca Tuckwell, Lisa Hauge, Julius Rix, Catriona Sinclair, Emily Ludlow, and Shaun Miller. The ISOL-ICE ice core project was funded by a Natural Environment Research Council (NERC) Standard Grant (NE/N011813/1) to Markus M. Frey. V. Holly L. Winton was supported by the NERC Standard Grant and a Rutherford Foundation Postdoctoral Fellowship (RTF-VUW1801-PD) and a Rutherford Discovery Fellowship (RDF-VUW2203) administrated by the Royal Society Te Apārangi. Kyle R. Clem acknowledges support from the Royal Society Te Apārangi Marsden Fund (MFP-VUW2010). Joel Savarino thanks the French Polar Institute IPEV for its continuous support of field deployments and ice, snow, and atmospheric sampling under the CAPOXI program (grant no. 1177) and the European Union (grant no. 101054558 DOC-PAST). Views and opinions expressed are, however, those of the author(s) only and do not necessarily reflect those of the European Union or European Research Council (ERC). Neither the European Union nor the ERC can be held responsible for them. We thank Tessa Vance and an anonymous reviewer whose suggestions improved the paper.
This research has been supported by the Natural Environment Research Council (grant no. NE/N011813/1), the Royal Society Te Apārangi (grant nos. RTF-VUW1801-PD and RDF-VUW2203), the Marsden Fund (grant no. MFP-VUW2010), the European Union (grant no. 101054558 DOC-PAST), and the French Polar Institute Paul-Émile Victor (grant no. 1177).
This paper was edited by Hubertus Fischer and reviewed by Tessa Vance and one anonymous referee.
Abram, N. J., Mulvaney, R., Wolff, E. W., and Mudelsee, M.: Ice core records as sea ice proxies: An evaluation from the Weddell Sea region of Antarctica, J. Geophys. Res., 112, D15101, https://doi.org/10.1029/2006jd008139, 2007.
Abram, N. J., Thomas, E. R., McConnell, J. R., Mulvaney, R., Bracegirdle, T. J., Sime, L. C., and Aristarain, A. J.: Ice core evidence for a 20th century decline of sea ice in the Bellingshausen Sea, Antarctica, J. Geophys. Res.-Atmos., 115, D23101, https://doi.org/10.1029/2010JD014644, 2010.
Abram, N. J., Mulvaney, R., and Arrowsmith, C.: Environmental signals in a highly resolved ice core from James Ross Island, Antarctica, J. Geophys. Res.-Atmos., 116, D20116, https://doi.org/10.1029/2011JD016147, 2011.
Abram, N. J., Wolff, E. W., and Curran, M. A.: A review of sea ice proxy information from polar ice cores, Quaternary Sci. Rev., 79, 168–183, 2013.
Akers, P. D., Savarino, J., Caillon, N., Servettaz, A. P., Le Meur, E., Magand, O., Martins, J., Agosta, C., Crockford, P., and Kobayashi, K.: Sunlight-driven nitrate loss records Antarctic surface mass balance, Nat. Commun., 13, 4274, https://doi.org/10.1038/s41467-022-31855-7, 2022.
Berhanu, T. A., Meusinger, C., Erbland, J., Jost, R., Bhattacharya, S., Johnson, M. S., and Savarino, J.: Laboratory study of nitrate photolysis in Antarctic snow. II. Isotopic effects and wavelength dependence, J. Chem. Phys., 140, 244306, https://doi.org/10.1063/1.4882899, 2014.
Beyersdorf, A. J., Blake, D. R., Swanson, A., Meinardi, S., Rowland, F., and Davis, D.: Abundances and variability of tropospheric volatile organic compounds at the South Pole and other Antarctic locations, Atmos. Environ., 44, 4565–4574, 2010.
Bodeker, G. E., Nitzbon, J., Tradowsky, J. S., Kremser, S., Schwertheim, A., and Lewis, J.: A global total column ozone climate data record, Earth Syst. Sci. Data, 13, 3885–3906, https://doi.org/10.5194/essd-13-3885-2021, 2021.
Brean, J., Dall'Osto, M., Simó, R., Shi, Z., Beddows, D. C. S., and Harrison, R. M.: Open ocean and coastal new particle formation from sulfuric acid and amines around the Antarctic Peninsula, Nat. Geosci., 14, 383–388, https://doi.org/10.1038/s41561-021-00751-y, 2021.
Brönnimann, S., Staehelin, J., Farmer, S., Cain, J., Svendby, T., and Svenøe, T.: Total ozone observations prior to the IGY. I: A history, Q. J. Roy. Meteorol. Soc., 129, 2797–2817, 2003.
Burger, J. M., Granger, J., Joyce, E., Hastings, M. G., Spence, K. A. M., and Altieri, K. E.: The importance of alkyl nitrates and sea ice emissions to atmospheric NOx sources and cycling in the summertime Southern Ocean marine boundary layer, Atmos. Chem. Phys., 22, 1081–1096, https://doi.org/10.5194/acp-22-1081-2022, 2022.
Burger, J. M., Joyce, E., Hastings, M. G., Spence, K. A. M., and Altieri, K. E.: A seasonal analysis of aerosol NO3− sources and NOx oxidation pathways in the Southern Ocean marine boundary layer, Atmos. Chem. Phys., 23, 5605–5622, https://doi.org/10.5194/acp-23-5605-2023, 2023.
Cao, Y., Jiang, Z., Alexander, B., Cole-Dai, J., Savarino, J., Erbland, J., and Geng, L.: On the potential fingerprint of the Antarctic ozone hole in ice-core nitrate isotopes: a case study based on a South Pole ice core, Atmos. Chem. Phys., 22, 13407–13422, https://doi.org/10.5194/acp-22-13407-2022, 2022.
Clem, K. R., Renwick, J. A., and McGregor, J.: Autumn cooling of western East Antarctica linked to the tropical Pacific, J. Geophys. Res.-Atmos., 123, 89–107, 2018.
Cleveland, W. S. and Devlin, S. J.: Locally weighted regression: an approach to regression analysis by local fitting, J. Am. Stat. Assoc., 83, 596–610, 1988.
Cole-Dai, J. and Mosley-Thompson, E.: The Pinatubo eruption in South Pole snow and its potential value to ice-core paleovolcanic records, Ann. Glaciol., 29, 99–105, 1999.
Cole-Dai, J., Ferris, D. G., Lanciki, A. L., Savarino, J., Thiemens, M. H., and McConnell, J. R.: Two likely stratospheric volcanic eruptions in the 1450s CE found in a bipolar, subannually dated 800 year ice core record, J. Geophys. Res.-Atmos., 118, 7459–7466, 2013.
Crockart, C. K., Vance, T. R., Fraser, A. D., Abram, N. J., Criscitiello, A. S., Curran, M. A. J., Favier, V., Gallant, A. J. E., Kittel, C., Kjær, H. A., Klekociuk, A. R., Jong, L. M., Moy, A. D., Plummer, C. T., Vallelonga, P. T., Wille, J., and Zhang, L.: El Niño–Southern Oscillation signal in a new East Antarctic ice core, Mount Brown South, Clim. Past, 17, 1795–1818, https://doi.org/10.5194/cp-17-1795-2021, 2021.
Dalaiden, Q., Goosse, H., Rezsöhazy, J., and Thomas, E. R.: Reconstructing atmospheric circulation and sea-ice extent in the West Antarctic over the past 200 years using data assimilation, Clim. Dynam., 57, 3479–3503, 2021.
Dall'Osto, M., Ovadnevaite, J., Paglione, M., Beddows, D. C., Ceburnis, D., Cree, C., Cortés, P., Zamanillo, M., Nunes, S. O., and Pérez, G. L.: Antarctic sea ice region as a source of biogenic organic nitrogen in aerosols, Sci. Rep., 7, 1–10, 2017.
Dall'Osto, M., Airs, R. L., Beale, R., Cree, C., Fitzsimons, M. F., Beddows, D., Harrison, R. M., Ceburnis, D., O'Dowd, C., and Rinaldi, M.: Simultaneous detection of alkylamines in the surface ocean and atmosphere of the Antarctic sympagic environment, ACS Earth Space Chem., 3, 854–862, 2019.
Erbland, J., Vicars, W. C., Savarino, J., Morin, S., Frey, M. M., Frosini, D., Vince, E., and Martins, J. M. F.: Air–snow transfer of nitrate on the East Antarctic Plateau – Part 1: Isotopic evidence for a photolytically driven dynamic equilibrium in summer, Atmos. Chem. Phys., 13, 6403–6419, https://doi.org/10.5194/acp-13-6403-2013, 2013.
Frey, M. M., Savarino, J., Morin, S., Erbland, J., and Martins, J. M. F.: Photolysis imprint in the nitrate stable isotope signal in snow and atmosphere of East Antarctica and implications for reactive nitrogen cycling, Atmos. Chem. Phys., 9, 8681–8696, https://doi.org/10.5194/acp-9-8681-2009, 2009.
Frey, M. M., Norris, S. J., Brooks, I. M., Anderson, P. S., Nishimura, K., Yang, X., Jones, A. E., Nerentorp Mastromonaco, M. G., Jones, D. H., and Wolff, E. W.: First direct observation of sea salt aerosol production from blowing snow above sea ice, Atmos. Chem. Phys., 20, 2549–2578, https://doi.org/10.5194/acp-20-2549-2020, 2020.
Fundel, F., Fischer, H., Weller, R., Traufetter, F., Oerter, H., and Miller, H.: Influence of large-scale teleconnection patterns on methane sulfonate ice core records in Dronning Maud Land, J. Geophys. Res.-Atmos., 111, D04103, https://doi.org/10.1029/2005JD005872, 2006.
Garnett, J., Halsall, C., Winton, H., Joerss, H., Mulvaney, R., Ebinghaus, R., Frey, M., Jones, A., Leeson, A., and Wynn, P.: Increasing Accumulation of Perfluorocarboxylate Contaminants Revealed in an Antarctic Firn Core (1958–2017), Environ. Sci. Technol., 56, 11246–11255, https://doi.org/10.1021/acs.est.2c02592, 2022.
Göktas, F., Fischer, H., Oerter, H., Weller, R., Sommer, S., and Miller, H.: A glacio-chemical characterization of the new EPICA deep-drilling site on Amundsenisen, Dronning Maud Land, Antarctica, Ann. Glaciol., 35, 347–354, 2002.
Goyal, R., Jucker, M., Gupta, A. S., and England, M. H.: A new zonal wave-3 index for the Southern Hemisphere, J. Climate, 35, 5137–5149, 2022.
Grieman, M. M., Hoffmann, H. M., Humby, J. D., Mulvaney, R., Nehrbass-Ahles, C., Rix, J., Thomas, E. R., Tuckwell, R., and Wolff, E. W.: Continuous flow analysis methods for sodium, magnesium and calcium detection in the Skytrain ice core, J. Glaciol., 68, 90–100, 2022.
Hersbach, H., Bell, B., Berrisford, P., Hirahara, S., Horányi, A., Muñoz-Sabater, J., Nicolas, J., Peubey, C., Radu, R., and Schepers, D.: The ERA5 global reanalysis, Q. J. Roy. Meteorol. Soc., 146, 1999–2049, 2020.
Hofstede, C. M., van de Wal Roderik, S., Kaspers, K. A., Van Den Broeke, M. R., Karlöf, L., Winther, J.-G., Isaksson, E., Lappegard, G., Mulvaney, R., and Oerter, H.: Firn accumulation records for the past 1000 years on the basis of dielectric profiling of six cores from Dronning Maud Land, Antarctica, J. Glaciol., 50, 279–291, 2004.
Isaacs, F. E., Renwick, J. A., Mackintosh, A. N., and Dadic, R.: ENSO modulates summer and autumn sea ice variability around Dronning Maud Land, Antarctica, J. Geophys. Res.-Atmos., 126, e2020JD033140, https://doi.org/10.1029/2020JD033140, 2021.
Jacobi, H.-W., Weller, R., Jones, A., Anderson, P., and Schrems, O.: Peroxyacetyl nitrate (PAN) concentrations in the Antarctic troposphere measured during the photochemical experiment at Neumayer (PEAN'99), Atmos. Environ., 34, 5235–5247, 2000.
Jiang, Z., Alexander, B., Savarino, J., and Geng, L.: An inverse model to correct for the effects of post-depositional processing on ice-core nitrate and its isotopes: model framework and applications at Summit, Greenland and Dome C, Antarctica, EGUsphere [preprint], https://doi.org/10.5194/egusphere-2023-1054, 2023.
Jones, A., Weller, R., Minikin, A., Wolff, E., Sturges, W., McIntyre, H., Leonard, S., Schrems, O., and Bauguitte, S.: Oxidized nitrogen chemistry and speciation in the Antarctic troposphere, J. Geophys. Res.-Atmos., 104, 21355–21366, 1999.
Jones, A. E., Wolff, E. W., Ames, D., Bauguitte, S. J.-B., Clemitshaw, K. C., Fleming, Z., Mills, G. P., Saiz-Lopez, A., Salmon, R. A., Sturges, W. T., and Worton, D. R.: The multi-seasonal NOy budget in coastal Antarctica and its link with surface snow and ice core nitrate: results from the CHABLIS campaign, Atmos. Chem. Phys., 11, 9271–9285, https://doi.org/10.5194/acp-11-9271-2011, 2011.
Landwehr, S., Volpi, M., Derkani, M. H., Nelli, F., Alberello, A., Toffoli, A., Gysel-Beer, M., Modini, R. L., and Schmale, J.: Sea state and boundary layer stability limit sea spray aerosol lifetime over the southern ocean, Authorea Preprints, https://d197for5662m48.cloudfront.net/documents/publicationstatus/104987/preprint_pdf/edcca28511b1750323e1d1113a0ce9f7.pdf (last access: 3 April 2024) 2022.
Langway, C., Osada, K., Clausen, H., Hammer, C., and Shoji, H.: A 10-century comparison of prominent bipolar volcanic events in ice cores, J. Geophys. Res.-Atmos., 100, 16241–16247, 1995.
Lin, J., Svensson, A., Hvidberg, C. S., Lohmann, J., Kristiansen, S., Dahl-Jensen, D., Steffensen, J. P., Rasmussen, S. O., Cook, E., Kjær, H. A., Vinther, B. M., Fischer, H., Stocker, T., Sigl, M., Bigler, M., Severi, M., Traversi, R., and Mulvaney, R.: Magnitude, frequency and climate forcing of global volcanism during the last glacial period as seen in Greenland and Antarctic ice cores (60–9 ka), Clim. Past, 18, 485-506, https://doi.org/10.5194/cp-18-485-2022, 2022.
Marshall, G. J.: Trends in the Southern Annular Mode from observations and reanalyses, J. Climate, 16, 4134–4143, 2003.
Marshall, G. J., Fogt, R. L., Turner, J., and Clem, K. R.: Can current reanalyses accurately portray changes in Southern Annular Mode structure prior to 1979?, Clim. Dynam., 59, 3717–3740, 2022.
Millero, F. J., Feistel, R., Wright, D. G., and McDougall, T. J.: The composition of Standard Seawater and the definition of the Reference-Composition Salinity Scale, Deep-Sea Res. Pt. I, 55, 50–72, 2008.
Ming, A., Winton, V. H. L., Keeble, J., Abraham, N. L., Dalvi, M. C., Griffiths, P., Caillon, N., Jones, A. E., Mulvaney, R., Savarino, J., Frey, M., and Yang, X.: Stratospheric ozone changes from explosive tropical volcanoes: Modeling and ice core constraints, J. Geophys. Res.-Atmos., 125, e2019JD032290, https://doi.org/10.1029/2019JD032290, 2020.
Moore, J. and Paren, J.: A new technique for dielectric logging of Antarctic ice cores, Le Journal de Physique Colloques, 48, C1-155–C151–160, 1987.
Morin, S., Savarino, J., Frey, M. M., Yan, N., Bekki, S., Bottenheim, J. W., and Martins, J. M.: Tracing the origin and fate of NOx in the Arctic atmosphere using stable isotopes in nitrate, Science, 322, 730–732, 2008.
Mulvaney, R. and Wolff, E. W.: Evidence for winter/spring denitrification of the stratosphere in the nitrate record of Antarctic firn cores, J. Geophys. Res.-Atmos., 98, 5213–5220, 1993.
Mulvaney, R., Bremner, S., Tait, A., and Audley, N.: A medium-depth ice core drill, Memoirs of National Institute of Polar Research, 82–90, https://nipr.repo.nii.ac.jp/record/2432/files/KJ00000012984.pdf (last access: 28 May 2024), 2002.
Nye, J.: Correction factor for accumulation measured by the thickness of the annual layers in an ice sheet, J. Glaciol., 4, 785–788, 1963.
Oerter, H., Wilhelms, F., Jung-Rothenhäusler, F., Göktas, F., Miller, H., Graf, W., and Sommer, S.: Accumulation rates in Dronning Maud Land, Antarctica, as revealed by dielectric-profiling measurements of shallow firn cores, Ann. Glaciol., 30, 27–34, 2000.
Plummer, C. T., Curran, M. A. J., van Ommen, T. D., Rasmussen, S. O., Moy, A. D., Vance, T. R., Clausen, H. B., Vinther, B. M., and Mayewski, P. A.: An independently dated 2000-yr volcanic record from Law Dome, East Antarctica, including a new perspective on the dating of the 1450s CE eruption of Kuwae, Vanuatu, Clim. Past, 8, 1929–1940, https://doi.org/10.5194/cp-8-1929-2012, 2012.
Rankin, A., Auld, V., and Wolff, E.: Frost flowers as a source of fractionated sea salt aerosol in the polar regions, Geophys. Res. Lett., 27, 3469–3472, 2000.
Rankin, A. M., Wolff, E. W., and Mulvaney, R.: A reinterpretation of sea-salt records in Greenland and Antarctic ice cores?, Ann. Glaciol., 39, 276–282, 2004.
Raphael, M.: A zonal wave 3 index for the Southern Hemisphere, Geophys. Res. Lett., 31, L23212, https://doi.org/10.1029/2004GL020365, 2004.
Rayner, N., Parker, D. E., Horton, E., Folland, C. K., Alexander, L. V., Rowell, D., Kent, E. C., and Kaplan, A.: Global analyses of sea surface temperature, sea ice, and night marine air temperature since the late nineteenth century, J. Geophys. Rese.-Atmos., 108, 4407, https://doi.org/10.1029/2002JD002670, 2003.
Reijmer, C. and Oerlemans, J.: Temporal and spatial variability of the surface energy balance in Dronning Maud Land, East Antarctica, J. Geophys. Res.-Atmos., 107, ACL 9-1–ACL 9-12, 2002.
Reijmer, C., Van den Broeke, M., and Scheele, M.: Air parcel trajectories and snowfall related to five deep drilling locations in Antarctica based on the ERA-15 dataset, J. Climate, 15, 1957–1968, 2002.
Ruth, U., Barnola, J. M., Beer, J., Bigler, M., Blunier, T., Castellano, E., Fischer, H., Fundel, F., Huybrechts, P., Kaufmann, P., Kipfstuhl, S., Lambrecht, A., Morganti, A., Oerter, H., Parrenin, F., Rybak, O., Severi, M., Udisti, R., Wilhelms, F., and Wolff, E.: “EDML1”” a chronology for the EPICA deep ice core from Dronning Maud Land, Antarctica, over the last 150 000 years, Clim. Past, 3, 475–484, https://doi.org/10.5194/cp-3-475-2007, 2007.
Savarino, J., Kaiser, J., Morin, S., Sigman, D. M., and Thiemens, M. H.: Nitrogen and oxygen isotopic constraints on the origin of atmospheric nitrate in coastal Antarctica, Atmos. Chem. Phys., 7, 1925–1945, https://doi.org/10.5194/acp-7-1925-2007, 2007.
Shi, G., Chai, J., Zhu, Z., Hu, Z., Chen, Z., Yu, J., Ma, T., Ma, H., An, C., and Jiang, S.: Isotope fractionation of nitrate during volatilization in snow: a field investigation in Antarctica, Geophys. Res. Lett., 46, 3287–3297, 2019.
Shi, G., Hu, Y., Ma, H., Jiang, S., Chen, Z., Hu, Z., An, C., Sun, B., and Hastings, M. G.: Snow nitrate isotopes in central Antarctica record the prolonged period of stratospheric ozone depletion from ∼ 1960 to 2000, Geophys. Res. Lett., 49, e2022GL098986, https://doi.org/10.1029/2022GL098986, 2022a.
Shi, G., Li, C., Li, Y., Chen, Z., Ding, M., Ma, H., Jiang, S., An, C., Guo, J., and Sun, B.: Isotopic constraints on sources, production, and phase partitioning for nitrate in the atmosphere and snowfall in coastal East Antarctica, Earth Planet. Sc. Lett., 578, 117300, https://doi.org/10.1016/j.epsl.2021.117300, 2022b.
Sigl, M., McConnell, J. R., Layman, L., Maselli, O., McGwire, K., Pasteris, D., Dahl-Jensen, D., Steffensen, J. P., Vinther, B., and Edwards, R.: A new bipolar ice core record of volcanism from WAIS Divide and NEEM and implications for climate forcing of the last 2000 years, J. Geophys. Res.-Atmos., 118, 1151–1169, 2013.
Sigl, M., McConnell, J. R., Toohey, M., Curran, M., Das, S. B., Edwards, R., Isaksson, E., Kawamura, K., Kipfstuhl, S., and Krüger, K.: Insights from Antarctica on volcanic forcing during the Common Era, Nat. Clim. Change, 4, 693–697, 2014.
Sigl, M., Toohey, M., McConnell, J. R., Cole-Dai, J., and Severi, M.: Volcanic stratospheric sulfur injections and aerosol optical depth during the Holocene (past 11 500 years) from a bipolar ice-core array, Earth Syst. Sci. Data, 14, 3167–3196, https://doi.org/10.5194/essd-14-3167-2022, 2022.
Sommer, S., Appenzeller, C., Röthlisberger, R., Hutterli, M. A., Stauffer, B., Wagenbach, D., Oerter, H., Wilhelms, F., Miller, H., and Mulvaney, R.: Glacio-chemical study spanning the past 2 kyr on three ice cores from Dronning Maud Land, Antarctica: 1. Annually resolved accumulation rates, J. Geophys. Rese.-Atmos., 105, 29411–29421, https://doi.org/10.1029/2000jd900449, 2000.
Thomas, E. R., Allen, C. S., Etourneau, J., King, A. C., Severi, M., Winton, V. H. L., Mueller, J., Crosta, X., and Peck, V. L.: Antarctic sea ice proxies from marine and ice core archives suitable for reconstructing sea ice over the past 2000 years, Geosciences, 9, 506, https://doi.org/0.3390/geosciences9120506, 2019.
Thomas, E. R., Vladimirova, D. O., Tetzner, D. R., Emanuelsson, B. D., Chellman, N., Dixon, D. A., Goosse, H., Grieman, M. M., King, A. C. F., Sigl, M., Udy, D. G., Vance, T. R., Winski, D. A., Winton, V. H. L., Bertler, N. A. N., Hori, A., Laluraj, C. M., McConnell, J. R., Motizuki, Y., Takahashi, K., Motoyama, H., Nakai, Y., Schwanck, F., Simões, J. C., Lindau, F. G. L., Severi, M., Traversi, R., Wauthy, S., Xiao, C., Yang, J., Mosely-Thompson, E., Khodzher, T. V., Golobokova, L. P., and Ekaykin, A. A.: Ice core chemistry database: an Antarctic compilation of sodium and sulfate records spanning the past 2000 years, Earth Syst. Sci. Data, 15, 2517–2532, https://doi.org/10.5194/essd-15-2517-2023, 2023.
Titchner, H. A. and Rayner, N. A.: The Met Office Hadley Centre sea ice and sea surface temperature data set, version 2: 1. Sea ice concentrations, Journal of Geophysical Research: Atmospheres, 119, 2864-2889, 2014.
Traufetter, F., Oerter, H., Fischer, H., Weller, R., and Miller, H.: Spatio-temporal variability in volcanic sulphate deposition over the past 2 kyr in snow pits and firn cores from Amundsenisen, Antarctica, J. Glaciol., 50, 137–146, 2004.
Turner, J., Phillips, T., Thamban, M., Rahaman, W., Marshall, G. J., Wille, J. D., Favier, V., Winton, H., Thomas, E., and Wang, Z.: The Dominant Role of Extreme Precipitation Events in Antarctic Snowfall Variability, Geophys. Res. Lett., 46, 3502–3511, https://doi.org/10.1029/2018GL081517, 2019.
Vega, C. P., Isaksson, E., Schlosser, E., Divine, D., Martma, T., Mulvaney, R., Eichler, A., and Schwikowski-Gigar, M.: Variability of sea salts in ice and firn cores from Fimbul Ice Shelf, Dronning Maud Land, Antarctica, The Cryosphere, 12, 1681–1697, https://doi.org/10.5194/tc-12-1681-2018, 2018.
Wagenbach, D., Ducroz, F., Mulvaney, R., Keck, L., Minikin, A., Legrand, M., Hall, J., and Wolff, E.: Sea-salt aerosol in coastal Antarctic regions, J. Geophys. Res.-Atmos., 103, 10961–10974, 1998.
Welker, C., Martius, O., Froidevaux, P., Reijmer, C. H., and Fischer, H.: A climatological analysis of high-precipitation events in Dronning Maud Land, Antarctica, and associated large-scale atmospheric conditions, J. Geophys. Res.-Atmos., 119, 11932–11954, 2014.
Weller, R. and Wagenbach, D.: Year-round chemical aerosol records in continental Antarctica obtained by automatic samplings, Tellus B, 59, 755–765, 2007.
Weller, R., Jones, A., Wille, A., Jacobi, H. W., McIntyre, H., Sturges, W., Huke, M., and Wagenbach, D.: Seasonality of reactive nitrogen oxides (NOy) at Neumayer Station, Antarctica, J. Geophys. Res.-Atmos., 107, ACH 2-1–ACH 2-11, 2002.
Wilhelms, F., Kipfstuhl, J., Miller, H., Heinloth, K., and Firestone, J.: Precise dielectric profiling of ice cores: a new device with improved guarding and its theory, J. Glaciol., 44, 171–174, 1998.
Wilhelms, F., Miller, H., Gerasimoff, M. D., Drücker, C., Frenzel, A., Fritzsche, D., Grobe, H., Hansen, S. B., Hilmarsson, S. Æ., Hoffmann, G., Hörnby, K., Jaeschke, A., Jakobsdóttir, S. S., Juckschat, P., Karsten, A., Karsten, L., Kaufmann, P. R., Karlin, T., Kohlberg, E., Kleffel, G., Lambrecht, A., Lambrecht, A., Lawer, G., Schärmeli, I., Schmitt, J., Sheldon, S. G., Takata, M., Trenke, M., Twarloh, B., Valero-Delgado, F., and Wilhelms-Dick, D.: The EPICA Dronning Maud Land deep drilling operation, Ann. Glaciol., 55, 355–366, https://doi.org/10.3189/2014AoG68A189, 2017.
Winton, V. H. L., Ming, A., Caillon, N., Hauge, L., Jones, A. E., Savarino, J., Yang, X., and Frey, M. M.: Deposition, recycling, and archival of nitrate stable isotopes between the air–snow interface: comparison between Dronning Maud Land and Dome C, Antarctica , Atmos. Chem. Phys., 20, 5861–5885, https://doi.org/10.5194/acp-20-5861-2020, 2020.
Winton, V. H. L. W., Caillon, N., Hauge, L., Mulvaney, R., Rix, J., Tuckwell, R., Savarino, J., and Frey, M.: Ice core chemistry, density, conductivity, dust, snow accumulation rate, and stable nitrate isotopic composition of the 120 m ISOL-ICE ice core, Dronning Maud Land, Antarctica (Version 1.0) [Data set], UK Polar Data Centre, Natural Environment Research Council, UK Research & Innovation [data set], https://doi.org/10.5285/9c972cfb-0ffa-4144-a943-da6eb82431d2, 2019.
Yang, J., Xiao, C., Liu, J., Li, S., and Qin, D.: Variability of Antarctic sea ice extent over the past 200 years, Sci. Bull., 66, 2394–2404, https://doi.org/10.1016/j.scib.2021.07.028, 2021.
Yang, X., Frey, M. M., Rhodes, R. H., Norris, S. J., Brooks, I. M., Anderson, P. S., Nishimura, K., Jones, A. E., and Wolff, E. W.: Sea salt aerosol production via sublimating wind-blown saline snow particles over sea ice: parameterizations and relevant microphysical mechanisms, Atmos. Chem. Phys., 19, 8407–8424, https://doi.org/10.5194/acp-19-8407-2019, 2019.
Zielinski, G. A., Mayewski, P. A., Meeker, L. D., Whitlow, S., Twickler, M. S., Morrison, M., Meese, D. A., Gow, A. J., and Alley, R. B.: Record of volcanism since 7000 BC from the GISP2 Greenland ice core and implications for the volcano-climate system, Science, 264, 948–952, 1994.