the Creative Commons Attribution 4.0 License.
the Creative Commons Attribution 4.0 License.
 | 22 May 2023
Methane, ethane, and propane production in Greenland ice core samples and a first isotopic characterization of excess methane
Jochen Schmitt
Barbara Seth
James E. Lee
Jon S. Edwards
Edward J. Brook
Thomas Blunier
Hubertus Fischer
Air trapped in polar ice provides unique records of the past atmospheric composition ranging from key greenhouse gases such as methane (CH4) to short-lived trace gases like ethane (C2H6) and propane (C3H8). Recently, the comparison of CH4 records obtained using different extraction methods revealed disagreements in the CH4 concentration for the last glacial in Greenland ice. Elevated methane levels were detected in dust-rich ice core sections measured discretely, pointing to a process sensitive to the melt extraction technique. To shed light on the underlying mechanism, we performed targeted experiments and analyzed samples for methane and the short-chain alkanes ethane and propane covering the time interval from 12 to 42 kyr. Here, we report our findings of these elevated alkane concentrations, which scale linearly with the amount of mineral dust within the ice samples. The alkane production happens during the melt extraction step of the classic wet-extraction technique and reaches 14 to 91 ppb of CH4 excess in dusty ice samples. We document for the first time a co-production of excess methane, ethane, and propane, with the observed concentrations for ethane and propane exceeding their past atmospheric background at least by a factor of 10. Independent of the produced amounts, excess alkanes were produced in a fixed molar ratio of approximately , indicating a shared origin. The measured carbon isotopic signature of excess methane is () ‰ and its deuterium isotopic signature is () ‰. With the co-production ratios of excess alkanes and the isotopic composition of excess methane we established a fingerprint that allows us to constrain potential formation processes. This fingerprint is not in line with a microbial origin. Moreover, an adsorption–desorption process of thermogenic gas on dust particles transported to Greenland does not appear very likely. Instead, the alkane pattern appears to be indicative of abiotic decomposition of organic matter as found in soils and plant leaves.
- Article
(7047 KB) - Full-text XML
- BibTeX
- EndNote


Atmospheric air entrapped in polar ice represents a unique archive of the past atmospheric composition including not only the concentration of greenhouse gases like carbon dioxide (CO2), methane (CH4), and nitrous oxide (N2O) but also short-lived trace gases such as ethane (C2H6) and propane (C3H8). The ongoing anthropogenic increase in the atmospheric concentrations of these gases makes a detailed understanding of their preindustrial variations and biogeochemical cycling of paramount importance, and only polar ice cores are able to provide this information. However, to interpret reconstructions of the atmospheric composition from polar ice cores requires that archived atmospheric trace gases are not altered within the ice itself. Furthermore, the air must be extracted from the ice sample without altering the original composition. Thus, the comparison of ice core records obtained using different extraction techniques and from different ice cores requires careful consideration and interpretation.
Not all drill sites or specific time intervals are equally suitable for deriving pristine atmospheric trace gas records. For example, CO2 data from Greenland ice are subject to CO2 in situ production due to impurities in the ice (Anklin et al., 1995; Smith et al., 1997). In situ production is also observed for N2O, for example, in glacial Antarctic ice core samples characterized by higher dust content (Schilt et al., 2010). In contrast, CH4 in polar ice cores, in the absence of melt layers, was considered to be not affected by in situ processes. However, more recent results from Greenland ice showing elevated CH4 concentrations in glacial dust-rich ice (Lee et al., 2020) and high-amplitude CH4 spikes in Holocene ice (Rhodes et al., 2013, 2016) question this assumption.
This becomes especially worrisome as atmospheric methane shows a significant north–south gradient, reflecting the predominance of Northern Hemisphere sources. Ice cores from Greenland and Antarctica have been used to quantify this inter-polar difference (IPD) in past CH4 concentrations (Chappellaz et al., 1997; Baumgartner et al., 2012; Beck et al., 2018) to derive the relative contribution of northern and southern hemispheric sources to the overall CH4 changes. The Holocene IPD is on the order of several tens of parts per billion, i.e., 1 order of magnitude smaller than the past atmospheric CH4 concentration. Thus, any small CH4 bias on the order of a few parts per billion to tens of parts per billion strongly impacts the conclusions drawn from this IPD, while the influence on the total radiative forcing by such small biases is negligible. In summary, existing results of CH4 concentrations from Greenland and Antarctic ice cores have to be carefully scrutinized for such effects.
A first step in this direction has been made in previous work by Lee et al. (2020), for example by comparing CH4 records derived using different measurement techniques. Past CH4 concentrations ([CH4]) are retrieved by measurements of Greenland and Antarctic ice cores using traditional discrete and relatively new continuous melt extraction techniques. While discrete ice measurements deliver one single value for each sample, continuous-flow analysis (CFA) gradually melts a thin stick of the ice core providing a continuous record for this section. Although in both techniques the ice sample is melted, the CFA technique separates air from the meltwater stream in about 1–2 min providing only a short time for any reaction in the water, while for the discrete technique the contact time is typically 15–30 min. Comparing [CH4] histories from several Greenland ice cores measured discretely (NGRIP, GISP2, GRIP) with the continuous Greenland NEEM and the continuous Antarctic WAIS records over the last glacial period, higher [CH4] can be found in the discrete Greenland measurements for specific time intervals (Lee et al., 2020, Fig. 1 therein), where dust concentrations are especially high.
Looking at the NGRIP methane hydrogen isotope (δD-CH4) record (Bock et al., 2010b), which was also measured with a discrete melt extraction technique (Bock et al., 2010a), it turns out that in the high-dust ice sections, the isotopic values are also affected. Several negative δD-CH4 excursions with a maximum depletion of 16 ‰ (per mill) prior to the onset of Dansgaard–Oeschger (DO) event 8 were identified (Bock et al., 2010b). At the time of that publication there was no straightforward explanation for these δD-CH4 depletions during times of a relatively stable climate. Using ice from Antarctica, much smaller δD-CH4 variations (3 ‰–4 ‰) during this interval were found in measurements performed at the University of Bern (unpublished data), again questioning the atmospheric origin of these δD-CH4 depletions prior to the DO onset.
All these observations in Greenland ice give reason to assume that a hitherto unknown process exists that produces or releases additional methane in some time intervals in Greenland ice cores (from here on referred to as “excess methane” or CH4(xs)). This process is related to the extraction technique (only found in records obtained by discrete melt extractions) and has only been observed in glacial Greenland ice with high mineral dust concentrations.
A first attempt to characterize CH4(xs) was made by Lee et al. (2020), who analyzed [CH4] in discrete ice samples with different impurity compositions and concentrations from several ice cores (GISP2, NEEM, WAIS, SPICE) using a multiple melt–refreeze technique. They were able to quantify CH4(xs) contributions of up to 30–40 ppb for Greenland samples. Sequential melt–refreeze extractions showed that the process leading to CH4(xs) is slow and not completed during the first melt–refreeze cycle (i.e., within around 30 min). A set of samples was analyzed with the admixture of a HgCl2 solution to suppress microbial activity in the meltwater. No difference in the measured [CH4] was observed between the poisoned samples and replicates without HgCl2, excluding a microbial CH4 production after melting. In addition, Lee et al. (2020) used the NGRIP [CH4] (Baumgartner et al., 2014) and δD-CH4 records (Bock et al., 2010b) to estimate the deuterium isotopic signature of the CH4(xs). Assuming a two-component mixture of atmospheric methane and excess methane, their model led to a best estimate of () ‰ for δD-CH4(xs).
A straightforward explanation for CH4(xs) may be that CH4 is either produced in the meltwater, or it was produced beforehand and only released during the melt extraction. With respect to this, Lee et al. (2020) reviewed several mechanisms that could account for the observed variations in Greenland ice core records. None perfectly matched all their observations, but, lastly, three of the proposed mechanisms were short-listed by Lee et al. (2020): (1) an adsorption process on dust particles prior to the deposition on the ice sheet; (2) an in situ production in the ice; or (3) an abiotic reaction during melt extraction.
Here we resume the work by Lee et al. (2020) and shed more light upon the potential formation processes using a targeted and more comprehensive study to quantify CH4(xs). We analyzed specific NGRIP and GRIP ice core samples discretely with two different wet-extraction systems. With our δ13C-CH4 device we are able to measure [methane], [ethane], [propane], and δ13C-CH4 on a single ice sample in two subsequent extractions. With our second device we add experimental information on δD-CH4. In Sect. 2, we provide information on our sampling strategy and measurement techniques. With our new experimental results, presented in Sect. 3, we provide quantitative data for CH4(xs) in NGRIP and GRIP samples and extend our observations to other “excess alkanes” (ethane and propane), which are revealed to be co-produced during the excess CH4 production. The observed molar ratios between methane, ethane, and propane are evaluated, and their relation to the abundance of mineral dust (Ca2+) within the ice samples is quantified. A second extraction of the meltwater enables us to estimate the temporal dynamics of excess alkane production. Using a Keeling-plot approach to our isotopic results, we calculate the carbon and deuterium isotopic signature of excess CH4 (δ13C-CH4(xs) and δD-CH4(xs)). Based on our new and improved observations, we finally come back to the discussion of the hypotheses proposed by Lee et al. (2020) in Sect. 4 and offer potential mechanisms that could explain the excess alkanes in ice core samples. For readers not interested in all the experimental details, we recommend jumping straight to Sect. 4 to see the discussion.
2.1 Ice core samples
Mixing ratios of alkanes (methane, ethane, and propane) and the stable carbon (δ13C-CH4) and hydrogen (δD-CH4) isotope ratios of methane were measured on ice core samples from the North Greenland Ice Core Project (NGRIP) ice core. For this study, 19 NGRIP ice core samples were measured for δ13C-CH4 and alkane concentrations and nine NGRIP ice samples for δD-CH4 covering the depth between 1795.84 and 1933.25 m. The NGRIP samples are from the late glacial Marine Isotope Stages (MIS) 3 and 2 (22.6 to 30.6 kyr BP). These time intervals are characterized by sharp atmospheric CH4 increases in parallel to rapid warmings, the so-called Dansgaard–Oeschger events, but we mostly sampled intervals with stable CH4 concentrations. From the same time period, we also investigate measurements of 41 NGRIP and 12 GRIP ice core samples, which were carried out in 2011 and 2018, respectively, and which have not previously been published. See Fig. 1 for an overview of all analyzed NGRIP and GRIP ice core samples over time.
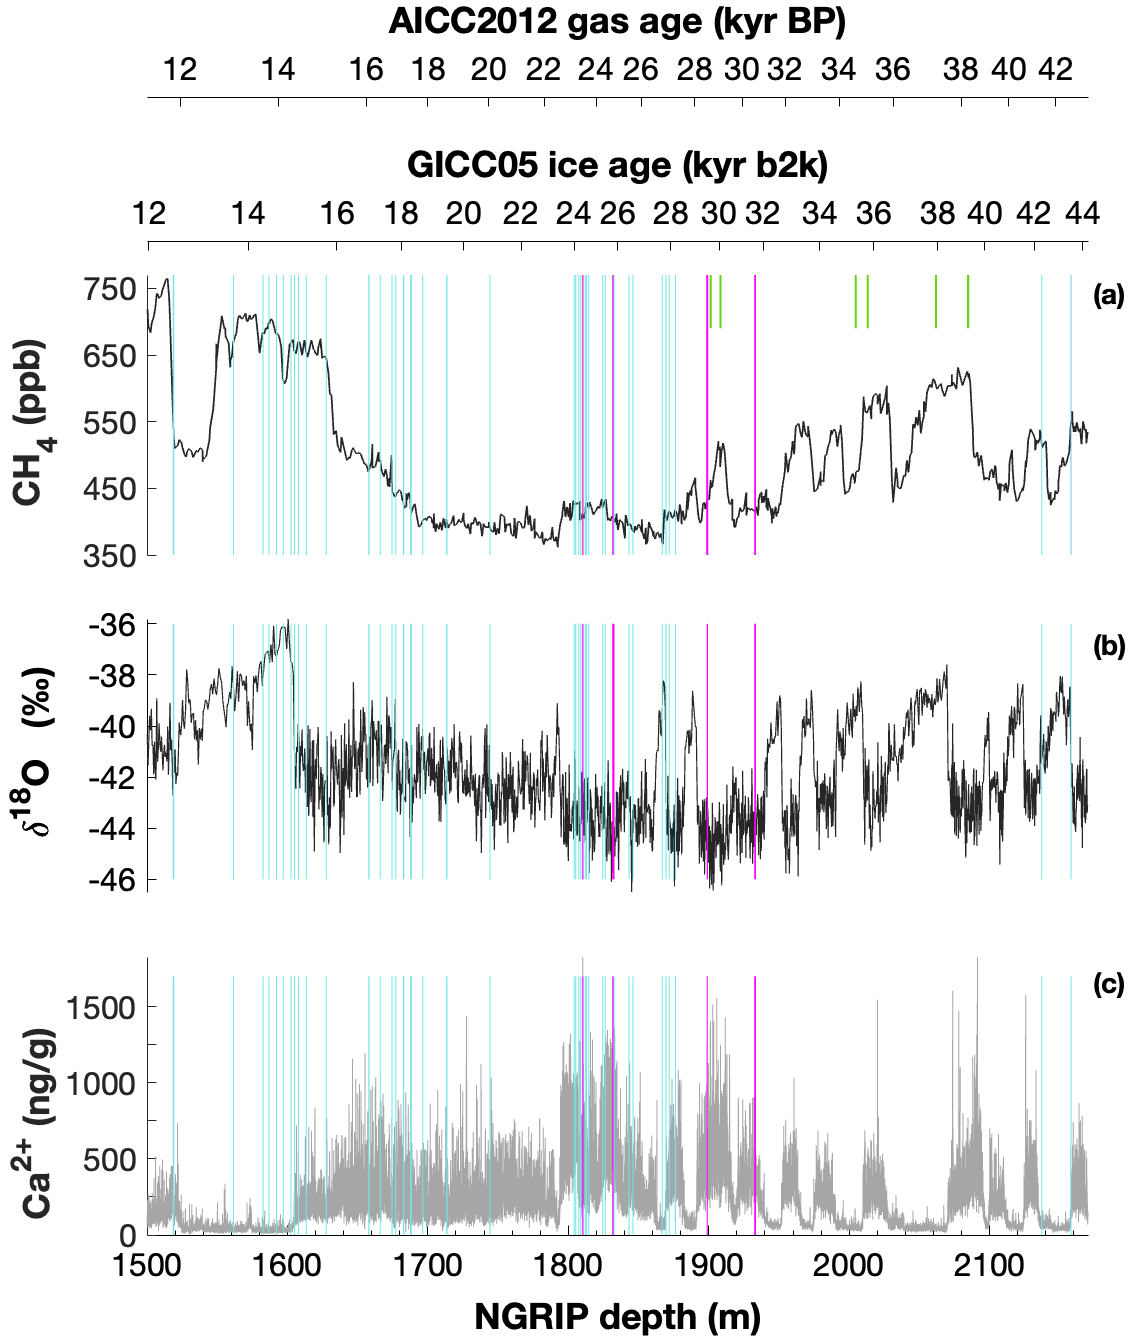
Figure 1Overview of the analyzed NGRIP and GRIP samples over time. All analyzed NGRIP and GRIP ice core samples are indicated on the NGRIP depth (m) on the bottom axis. To indicate an age for the gas and ice records, both the AICC2012 gas age (kyr BP) and the GICC05 ice age (kyr b2k) scale are provided on the upper axes. Note that for the purpose of describing the excess CH4 production in a certain ice sample the age is not important, and we provide all records on depths throughout this paper. NGRIP samples measured from the five main bags (3292, 3331 and 3332, 3453, 3515) for the Keeling-plot approach are indicated with vertical lines in pink, NGRIP samples measured in 2011 and individual NGRIP ice core samples measured in 2019–2020 (not included in the Keeling-plot analyses) in turquoise, and GRIP ice core samples in green. (a) [CH4] record measured by wet extraction from NGRIP samples from Baumgartner et al. (2012, 2014). (b) δ18O record from North Greenland Ice Core Project members (2004). (c) Ca2+ record from Erhardt et al. (2022).
We also included 22 ice core samples from the European Project for Ice Coring in Antarctica (EPICA) ice core from Dome C (MIS 4), which are not affected by a measurable excess CH4 production and which we use as long-term monitoring ice for the system performance and to quantify the blank contribution of the analytical system (see Appendix B).
The late glacial period, which includes the age of most of the measured NGRIP samples, is characterized by an overall high impurity and dust content and low atmospheric methane concentrations. For our analysis, we have selected ice core bags (where for NGRIP and GRIP ice cores, a bag is a 55 cm long ice core section) in which we expect the same atmospheric CH4 concentration but see a high range of mineral dust content (Ca2+). In this way, we can compare neighboring samples with the same low stadial CH4 levels due to stable atmospheric concentrations and temporal smoothing by the slow bubble enclosure process, but they are expected to vary in measured concentrations due to contributions of excess alkanes. Ca2+ content across our NGRIP samples ranges from 307 to 1311 ng g−1. This sample selection is critical to quantify the isotope signature of the CH4(xs) produced using the Keeling-plot approach (Keeling, 1958). The underlying assumptions of this mass balance approach are (1) that there is only a two-component mixture (atmospheric methane and excess methane) and (2) that the isotopic ratio of the mixture changes only by a varying input of the second source (CH4(xs)).
To select the samples, we use high-resolution mineral dust records measured using an Abakus laser attenuation device (Klotz, Germany) for particulate dust (Ruth et al., 2003) as well as Ca2+ concentrations (Erhardt et al., 2022) as dissolved mineral dust tracer derived from the Bern Continuous Flow Analysis System (Kaufmann et al., 2008). In principle, particulate dust and the soluble dust tracer Ca2+ are strongly correlated. However, depending on the acidity of the ice (mainly due to H2SO4 and HNO3), variable amounts of CaCO3 are converted into soluble CaSO4 and Ca(NO3)2, leading to a variable ratio (Legrand and Delmas, 1988). As an example, Fig. 2 shows the Ca2+ and mineral dust concentration of the NGRIP bag 3292 which we used to select the individual samples and the relevant parameters measured for each sample of this bag. The data overview for all other measured NGRIP bags can be found in Appendix A.

Figure 2Detailed data overview for NGRIP bag 3292. Bag-specific overview of several parameters measured for each sample in this bag at a given depth: methane, ethane, propane, Ca2+, mineral dust mass, TAC (total air content), and δ13C-CH4. At the top the AICC2012 gas age (upper top axis) and the GICC05 ice age (lower top axis) of the respective depth are indicated. The mineral dust record is taken from Ruth et al. (2003) and the Ca2+ record from Erhardt et al. (2022). The data overview for all further measured NGRIP bags can be found in Appendix A.
2.2 CH4, C2H6, C3H8, and δ13C-CH4 analysis of ice core samples
The short-chain alkanes and δ13C-CH4 were measured at the University of Bern using the discrete wet-extraction technique described in Schmitt et al. (2014). With this method, it is possible to measure mixing ratios of methane, ethane, and propane as well as the methane carbon isotopic signature and other trace gases on a single ice core sample of about 150 g.
Briefly, ice core samples are placed in a glass vessel locked by a stainless-steel flange which is attached to the vacuum line to evacuate laboratory air (see Fig. 3, step a). Before melting the ice sample, the leak tightness of the vacuum extraction line is tested with a so-called He blank. The ice sample is then melted under vacuum with the help of infrared radiation for ∼35 min to release the enclosed air (step b). The released air is continuously removed from the sample vessel by a pressure gradient towards an adsorbing AirTrap (activated carbon), collecting all relevant air components at −180 ∘C. After melting is completed, the temperature of the meltwater is stabilized close to 0 ∘C, but the meltwater does not refreeze again. Afterwards, He is sparged with 4 mL min−1 at standard temperature and pressure (equivalent to 100–400 mL at the varying low pressure in the headspace) through the meltwater for ∼14 min through a capillary at the bottom of the vessel to transfer any remnant gas species dissolved in the meltwater onto the AirTrap (step c). The sample vessel is then isolated by closing the inlet and outlet valves (step d). Consecutively, the AirTrap is warmed up in two steps, first to remove N2 and O2 and in a second step to release the gases of interest which, after a cryofocus step, are then sent to the gas chromatograph (GC) for separation and quantification using an isotope ratio mass spectrometer (Isoprime 100, Elementar).
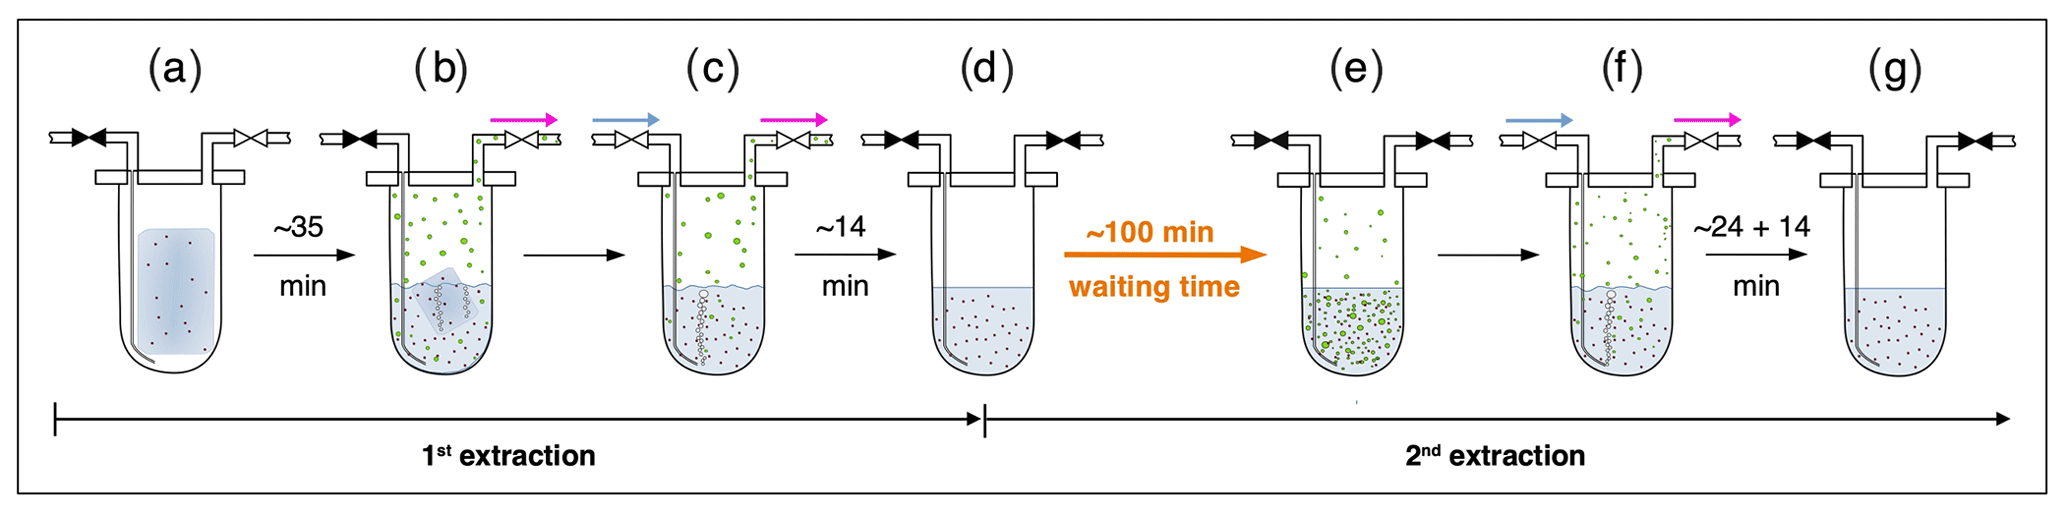
Figure 3Sequential steps (a–g) happening in the ice core sample vessel during the first and the second extraction in the δ13C-CH4 extraction line. The scheme illustrates the subsequent steps as described in detail in the text. Brownish spots indicate dust particles in the ice and/or meltwater. Green circles indicate gas species (methane, ethane, and propane) in the meltwater or in the headspace of the vessel. Closed valves are indicated in black, open vales in white. Blue arrows indicate the He flow through the inlet capillary into the sample vessel; pink arrows indicate the flow direction from the sample vessel towards the AirTrap.
The precision of this method for CH4 is about 8 ppb and 0.1 ‰ for δ13C-CH4 based on the reproducibility of the first extraction of ice core samples where isotopic data are expressed using the δ notation on the international Vienna Pee Dee Belemnite (VPDB) scale. For C2H6, the precision is 0.02 ppb or 1 %; for C3H8, it is 0.03 ppb or 5 % (whatever is higher) based on the reproducibility of standard air samples, which are by definition not subject to excess production (Schmitt et al., 2014). Blank levels for these species based on melted artificial (gas-free) ice samples are 1–2 ppb for CH4, 0.3 ppb for C2H6, and 0.2 ppb for C3H8 (Schmitt et al., 2014), which are below the values measured on Antarctic ice, where excess production is minimal compared to glacial Greenland samples (see Appendix B for details).
With their experimental investigations, Lee et al. (2020) were already able to demonstrate that production and/or release of CH4(xs) is time-dependent. We therefore conclude that this process does not have to be completed in the time available for the gas extraction described above. We continued the analyses of excess alkane production with an additional extraction step (here referred to as second extraction; steps d–g in Fig. 3) following the normal ice extraction routine. After all sample air is collected in the first extraction, the meltwater is left in the isolated sample vessel (the vessel is closed and not connected to the carbon trap) and held at temperatures close to 0 ∘C for ∼100 min (step d). After this “waiting time” of ∼100 min, He is purged through the meltwater for ∼24 min to extract the gases that have been accumulated during this time interval simulating the extraction time of the first extraction, followed by another ∼14 min of He purging to mimic the last step of the ice extraction when the sample had completely melted (step f). The gases from this second extraction are collected and measured following the same trapping and separation steps as in the first extraction. Note that the procedure of the second extraction can be repeated any number of times (e.g., third extraction).
The amount of gases that we obtain from the first extraction comprises the atmospheric amount, a possible contribution by in situ production, and a potential time-dependent production and/or release in the meltwater (in extractu). The second extraction, however, targets only the in extractu fraction. The system blank for the second extraction was estimated using the second extraction of Antarctic ice (Talos Dome, EDC) and was 2, 0.3, and 0.3 ppb for CH4, C2H6, and C3H8, respectively, assuming an ice core sample air volume of 14 mL at standard temperature and pressure, which is the typical ice sample size of 150 g with a total air content of 0.09 mL g−1. For CH4 this is <1 % of the amount of extracted species in the first extraction of glacial Greenland ice. Due to the small amount of CH4 analyzed in this second extraction (about a factor of 20 to 50 less than for an ice core sample), the precision for the δ13C analysis is much lower than for the first (ice sample) extraction, and we estimate the precision of δ13C-CH4 to be 2 ‰ and that for [CH4] to be 2 ppb or 10 % (based on the reproducibility of second extractions of Antarctic EDC samples). For C2H6 and C3H8, the precision is comparable to the first extraction. Note that throughout the paper we do not perform blank corrections (neither for the measured alkane concentrations nor for the isotopic values). The only exception is for the calculation of the temporal dynamics of excess ethane production (see Appendix C) as the blank contribution would otherwise bias the samples with a low Ca2+ content.
2.3 δD-CH4 analysis of ice core samples
All δD-CH4 data presented here were measured at the University of Bern using the discrete wet-extraction technique described in Bock et al. (2010a, 2014). This δD-CH4 device allows us to measure the concentration of methane and its deuterium isotopic signature (δD-CH4) on a single ice core sample of about 300 g.
Briefly, ice core samples are melted after evacuation of the headspace using a warm water bath at 40 ∘C for 25–30 min to release the enclosed air into the sample vessel headspace. Once all the ice is melted, the warm water bath is replaced by an ice-water bath to keep the meltwater temperature and water vapor pressure low but without refreezing. In contrast to the δ13C-CH4 method, the inlet and outlet valves are closed during the melting process. The released air leads to an increased pressure in the sample vessel headspace enhancing the solubility of gases in water. After the melting is complete, the inlet and outlet valves are opened and He is purged for ∼40 min with a flow of 360 mL min−1 to transfer the accumulated air in the headspace and bubble He through the meltwater to strip dissolved gases. Just like for the δ13C-CH4 method, the air is collected on an activated carbon trap followed by further purification steps including GC separation. Note that compared to the δ13C-CH4 device, we performed only one extraction with the δD-CH4 device.
For both methods, we assume that the time for an in extractu production during the ice extraction procedure starts with the first presence of meltwater until He purging is stopped. Note that this time is considerably longer for the δD-CH4 analysis (∼60 min) compared to the time of the first extraction in the δ13C-CH4 analysis (∼35 min).
Using this method we can measure [CH4] and δD-CH4 with a precision of about 15 ppb and 3 ‰ (based on standard ice sample measurements), where isotopic data are expressed using the δ notation on the international Standard Mean Ocean Water (SMOW) scale.
3.1 Methane, ethane, and propane concentrations
As described in detail in Sect. 2.2, a full ice sample measurement includes the regular ice sample extraction (first extraction) and, after the waiting time of ∼100 min, a second gas extraction in the meltwater. Gas from the first extraction comprises atmospheric air, a possible contribution from in situ production, a potential time-dependent contribution by an in extractu process, and any contribution from the device itself (blank). For the gas species discussed here (methane, ethane, propane), these individual fractions are very different in magnitude. For polar ice core samples, the atmospheric air is the major fraction of methane even in dust-rich, glacial ice from Greenland prone to CH4(xs) production (see below). The opposite is expected for ethane and propane, which are dominated by the in extractu component in dust-rich Greenland ice. To establish a better knowledge of alkanes in Greenland ice, we evaluated the measured concentrations of methane, ethane, and propane, their ratios to each other, and the relation to the content of mineral dust in the ice for both the first and the second extraction.
Note that different units to indicate concentrations of the trace gases of interest are used throughout this study. By using mixing ratios in units of [ppb], as typically used for atmospheric concentrations, the concentration of trace gases is related to the amount of air extracted from the ice. Ice core samples with a low air content cause higher mixing ratio values for any additional molecules produced in situ or in extractu compared to ice core samples with a high air content, and the interpretation might be biased. Alternatively, for any additional molecules produced in situ or in extractu, [mol absolute per sample] denotes the absolute amount of trace gases and is independent of the ice core air content. In the following, both units are used, and great care has to be taken to avoid misinterpretation of the results with respect to the different units.
3.1.1 Excess alkanes in the first extraction
Figures 4 and 5 show results from the first extraction of our NGRIP and GRIP ice core samples. For dust-rich samples, ethane ranges between 2 and 12 ppb and propane concentrations between 1 and 5 ppb. In contrast, low-dust samples from both GRIP and NGRIP have much lower concentration (ca. 0.5 ppb for ethane and 0.3 ppb for propane) consistent with estimates of past atmospheric ethane and propane concentrations from the 15th to 19th century of the common era being about 0.4 ppb in Greenland ice (Nicewonger et al., 2016) and lower for propane (Helmig et al., 2014). Emissions of ethane and propane were likely reduced during the glacial (Bock et al., 2017; Nicewonger et al., 2016; Dyonisius et al., 2020); thus, 0.5 ppb appears to be an upper limit of past atmospheric concentrations of ethane and propane. This estimate of past atmospheric ethane concentrations is an order of magnitude smaller than the values we obtained from our dust-rich ice core samples from the first extraction, pointing to a strong additional source of these alkanes for dust-rich samples. Thus, the unusually high mixing ratios indicate that ethane and propane in glacial ice extracted using our melt technique on discrete samples do not represent atmospheric levels.
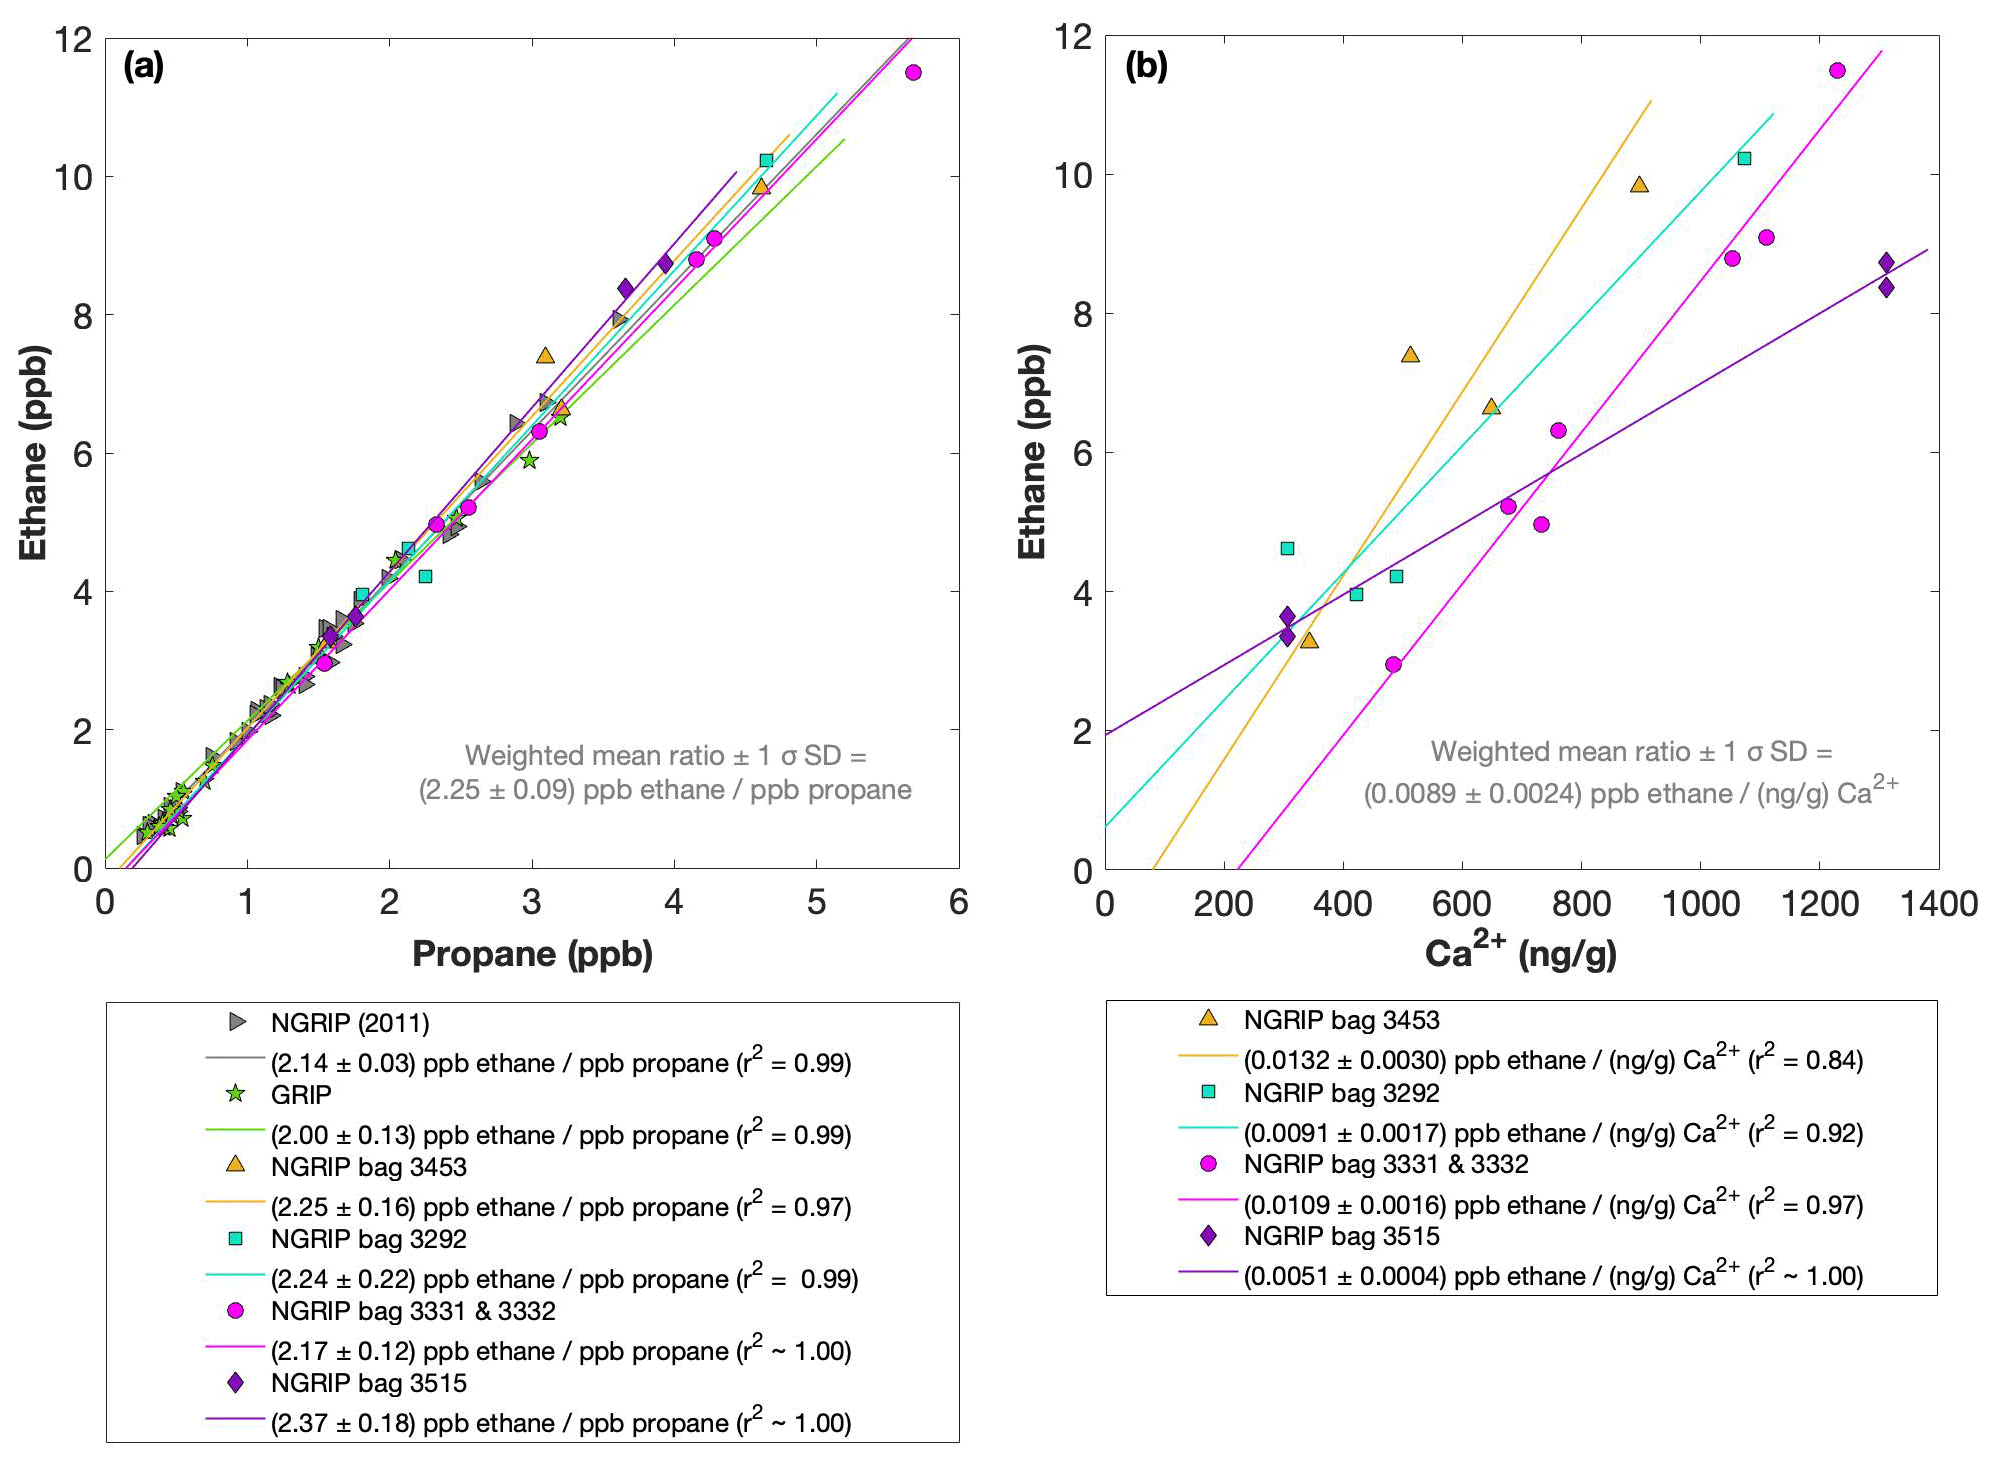
Figure 4NGRIP and GRIP results of ethane and propane from the first extraction. (a) Concentrations of ethane and propane and their ratios to each other for NGRIP and GRIP samples measured in the first extraction of the δ13C-CH4 device. Colors and symbols indicate the different NGRIP bags or cores used. (b) Bag-specific production ratios of ethane in relation to the Ca2+ concentration for NGRIP samples. Note that for bag 3515 there is a data gap in the Ca2+ record and an anomaly of the Ca2+-to-dust-mass ratio for the replicate sample at 1932.7 m. Thus, the Ca2+ concentration for these two data points is likely overestimated (see Fig. A3).
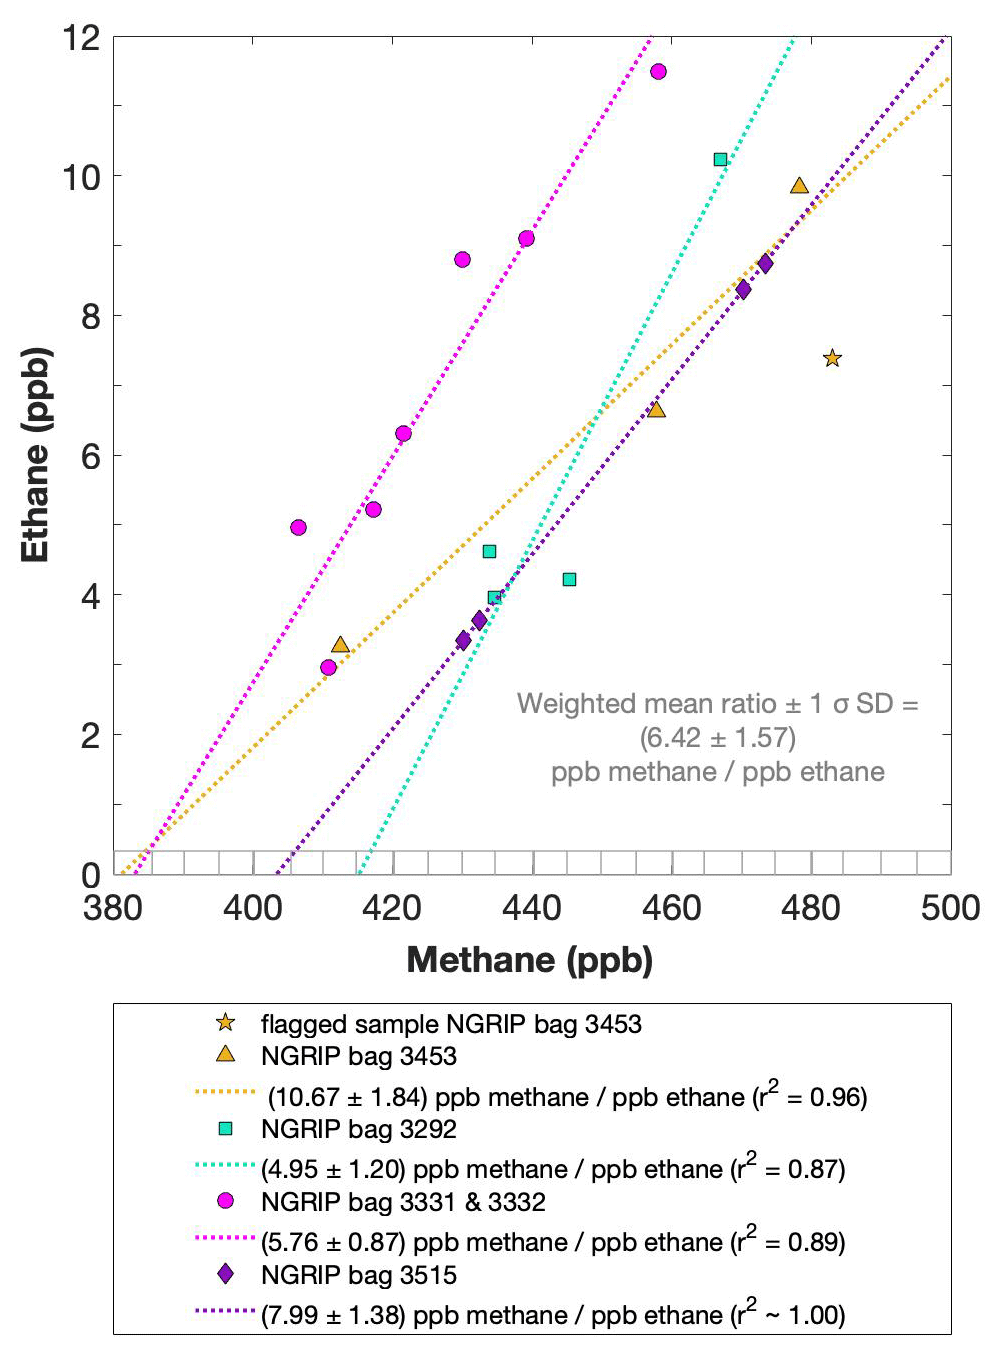
Figure 5NGRIP results of methane and ethane from the first extraction. Concentrations of methane (ppb) and ethane (ppb) and their ratios to each other for NGRIP samples measured in the first extraction of the δ13C-CH4 device. Different colors and symbols indicate the different NGRIP bags used for our analysis. Note that there is a flagged sample for CH4 in bag 3453 as indicated with a yellow asterisk, which is not included in the ratio of bag 3453. The gray hatched area indicates past atmospheric ethane concentrations of a maximum of 0.39 ppb as estimated by Nicewonger et al. (2016).
As illustrated in Fig. 4a, the ethane and propane concentrations are highly correlated, pointing to a common production of excess ethane and excess propane. The weighted mean ratio and its weighted standard deviation (both weighted according to the number of samples measured per bag) is (2.25±0.09) ppb ethane per 1 ppb propane. Note that all regression lines are calculated by following the method of York (1968) and York et al. (2004). York's analytical solution to the best-fit line accounting for normally distributed errors both in x and y is widely used to determine an isotopic mixing line and has been proven as the least biased method (Wehr and Saleska, 2017; Hoheisel et al., 2019). Throughout the paper we use the 1σ standard deviation to express uncertainties. In Fig. 4, where the individual bags studied are color-coded, we can clearly see that the ratio is essentially the same between the individual bags and that the correlation is also very high within each bag (although, for the significance of this correlation, we have to consider that the number of samples per bag is very low). This indicates that for NGRIP ice, ethane and propane are found in a fixed ratio. Accordingly, excess ethane and propane production can be represented well by the weighted mean ratio, and ethane and propane are produced in a ratio of approximately 2:1. Very similar results were also observed in NGRIP samples measured in 2011 and in GRIP samples revealing an ethane-to-propane ratio of 2.14±0.03 (r2=0.99) and 2.00±0.13 (r2=0.99) (see Fig. 4a).
Methane concentrations range from 407 to 476 ppb and are predominantly of atmospheric origin (see Fig. 5). The amount of CH4(xs) is the difference between the measured methane concentration and the atmospheric background concentration. To quantify CH4(xs) we use the fact that due to the low-pass filtering of the bubble enclosure process, all samples within one bag should have the same atmospheric CH4 concentration. This also ensures that any physical processes that potentially influence the atmospheric alkanes in our samples (gravitational enrichment, thermodiffusion, disequilibrium effects on CH4 isotopes) are the same for all samples within one bag. The only difference between these samples is, thus, the degree of CH4(xs) production which can be estimated from the linear fit between the measured CH4 concentration and the concentration of another species (e.g., ethane, propane, mineral dust, or Ca2+), which serves as a proxy for CH4(xs) production. The closest relationship was found for [C2H6], and quantifying CH4(xs) was done by extrapolating the linear regression between ethane and methane to an ethane concentration of 0.39 ppb, the assumed atmospheric [C2H6]. This leads to an estimate of the true atmospheric [CH4] value within the respective bag, a value that can then be subtracted from the measured CH4 concentration to obtain the CH4(xs) in each sample. The uncertainty in the calculated CH4(xs) is typically 8 ppb.
Using the relation of ethane to methane this approach translates into CH4(xs) in the range of 14 to 91 ppb for these five NGRIP bags with a mean excess of 39 ppb. Equivalent calculations can be made using propane, dust, or Ca2+ as a proxy for CH4(xs) production; however, the relationship between dust parameters and CH4(xs) is more variable and does not lead to equally precise values for CH4(xs). Nevertheless, the obtained mean CH4(xs) using the relation of mineral dust or Ca2+ to methane is similar in size to the one obtained by ethane.
We find a constant production ratio between all three excess alkanes for all bags investigated. The weighted mean production ratio and its weighted standard deviation was calculated to be (6.42±1.57) ppb methane per 1 ppb ethane and (14.3±3.7) ppb methane per 1 ppb propane for the samples of the five main NGRIP bags and (2.25±0.09) ppb ethane per 1 ppb propane (also including NGRIP2011 and GRIP here). Note that there is a flagged sample for CH4 in bag 3453 (yellow asterisk in Fig. 5), where one vent (V6) was unintentionally open during the measurement, which may have compromised the result. We therefore excluded the production ratio determined from bag 3453.
In summary, we can characterize the excess alkane production in our measured NGRIP samples by an overall methane ethane propane ratio of approximately . This constant relationship between different alkanes suggests that excess alkanes are produced in a fixed ratio by a common production process.
Another important observation is the close relationship between excess alkanes and the content of mineral dust within the ice core samples. Using measurements on GISP2 and NEEM ice core samples, Lee et al. (2020) reported for the first time the close relationship of CH4(xs) to chemical impurities with the highest correlation with Ca2+. This is supported by our measurements on NGRIP and GRIP samples revealing an overall increase in CH4(xs), ethane, and propane with increasing Ca2+ (see for example the ethane–Ca2+ relationship in Fig. 4b). Although the connection between ethane and Ca2+ is more variable than for ethane and propane between the different bags, the slopes of the linear regressions in Fig. 4b are still the same within the 2σ uncertainty, and the weighted mean ratio of all NGRIP samples amounts to (0.0089±0.0024) ppb ethane per (ng g−1) Ca2+. However, this weighted mean value is likely biased low due to the relatively low ethane Ca2+ slope of bag 3515. Due to a data gap at 1932.7 m in the Ca2+ record, the corresponding Ca2+ concentration for two of the samples of this bag is subject to a large interpolation error and overestimated Ca2+ (see Fig. A3).
The results agree with results from GRIP and earlier NGRIP (2011) measurements, revealing an ethane Ca2+ ratio of 0.0105±0.0029 (r2=0.76) and 0.0090±0.0006 (r2=0.91), respectively.
Based on the fixed ratio of CH4(xs) and ethane described above this translates into a weighted mean excess CH4 Ca2+ ratio of (0.0529±0.0111) ppb methane per (ng g−1) Ca2+.
3.1.2 Excess alkanes in the second extraction
With the second extraction of the δ13C-CH4 analyses we can evaluate the temporal dynamics of excess alkane production, assuming that all alkanes extracted in the second extraction were produced after the first extraction was completed.
For our Greenland samples we measured a range of about 0.2 to 2.4 pmol for ethane and a range of 0.1 to 1.2 pmol for propane in the second extraction (Fig. 6b). These values in picomole are equivalent to 0.2 to 4.8 ppb of ethane and 0.2 to 2 ppb of propane assuming that the amount of excess alkanes was added to 14 mL of ice core air (which is the typical ice sample size of 150 g with a total air content of 0.09 mL g−1). The measured amount of methane ranges between 3 and 20 pmol (Fig. 6a).
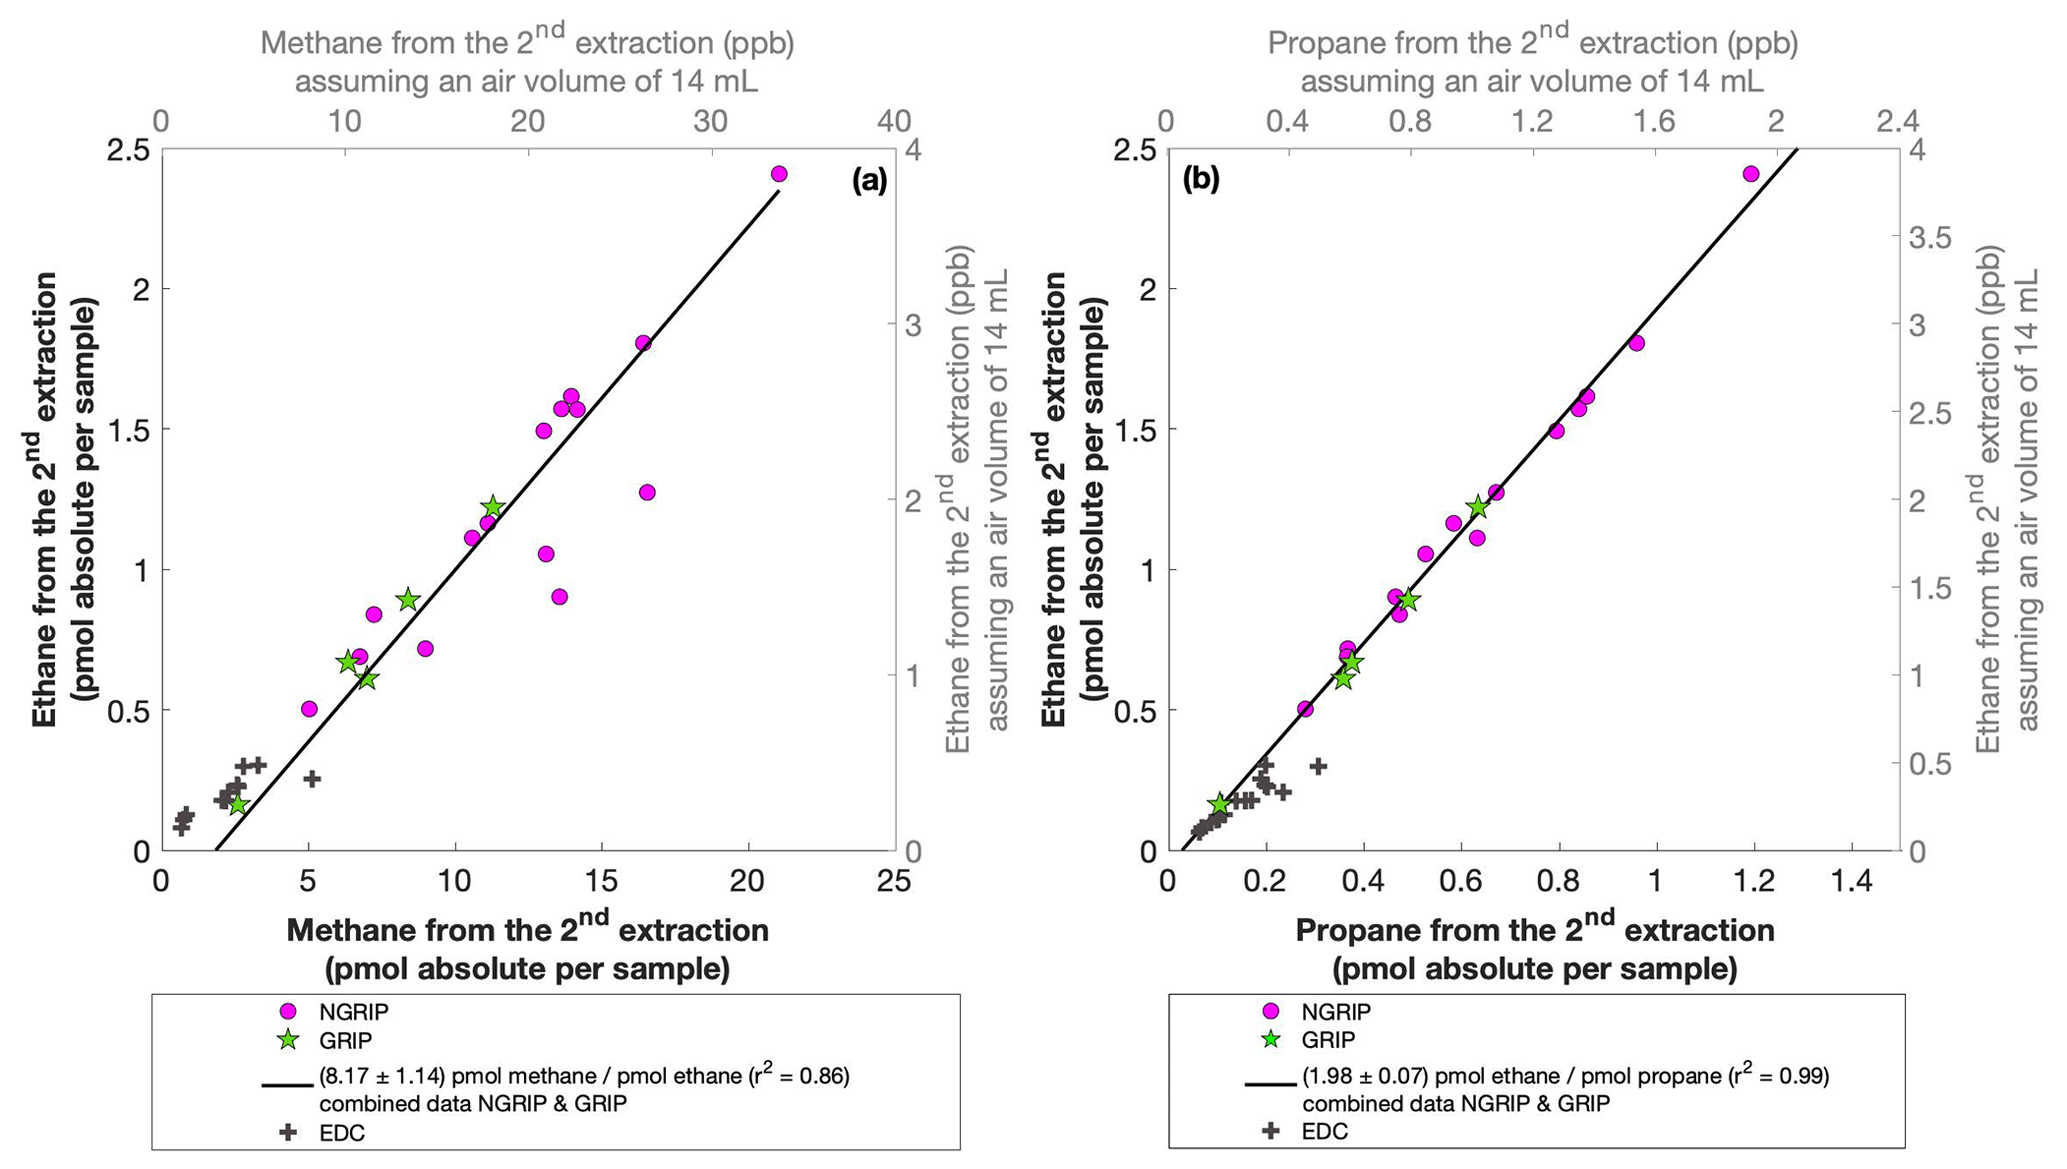
Figure 6NGRIP and GRIP results of excess methane, ethane, and propane from the second extraction. (a) Concentrations of methane and ethane and their ratios to each other. (b) Concentrations of propane and ethane and their ratios to each other. Units are given as picomole absolute per sample on the primary axis in black and in parts per billion assuming an air volume of 14 mL of the ice core sample on the secondary axis in gray. Crosses indicate the blank level of the system estimated from second extractions of EDC ice core samples.
The ratio of the measured amount for the individual species between the first and the second extraction amounts to 3.6±0.85 (r2=0.78) for ethane (Fig. 7b), 3.3±0.33 (r2=0.78) for propane (combined data of NGRIP and GRIP), and 3.8±1.62 (r2=0.33) for methane (only NGRIP data), where the uncertainty for CH4 is again much larger. Thus, we can conclude that the amount of alkanes produced during the waiting time after the first extraction until the second extraction was finished was approximately 30 % of the amount produced during the first extraction. Results from the second extraction also demonstrate that this process is slow and not completed during the first extraction. We can thereby confirm the results of Lee et al. (2020), but we are able to show for the first time that this process also leads to the production of excess ethane and propane.
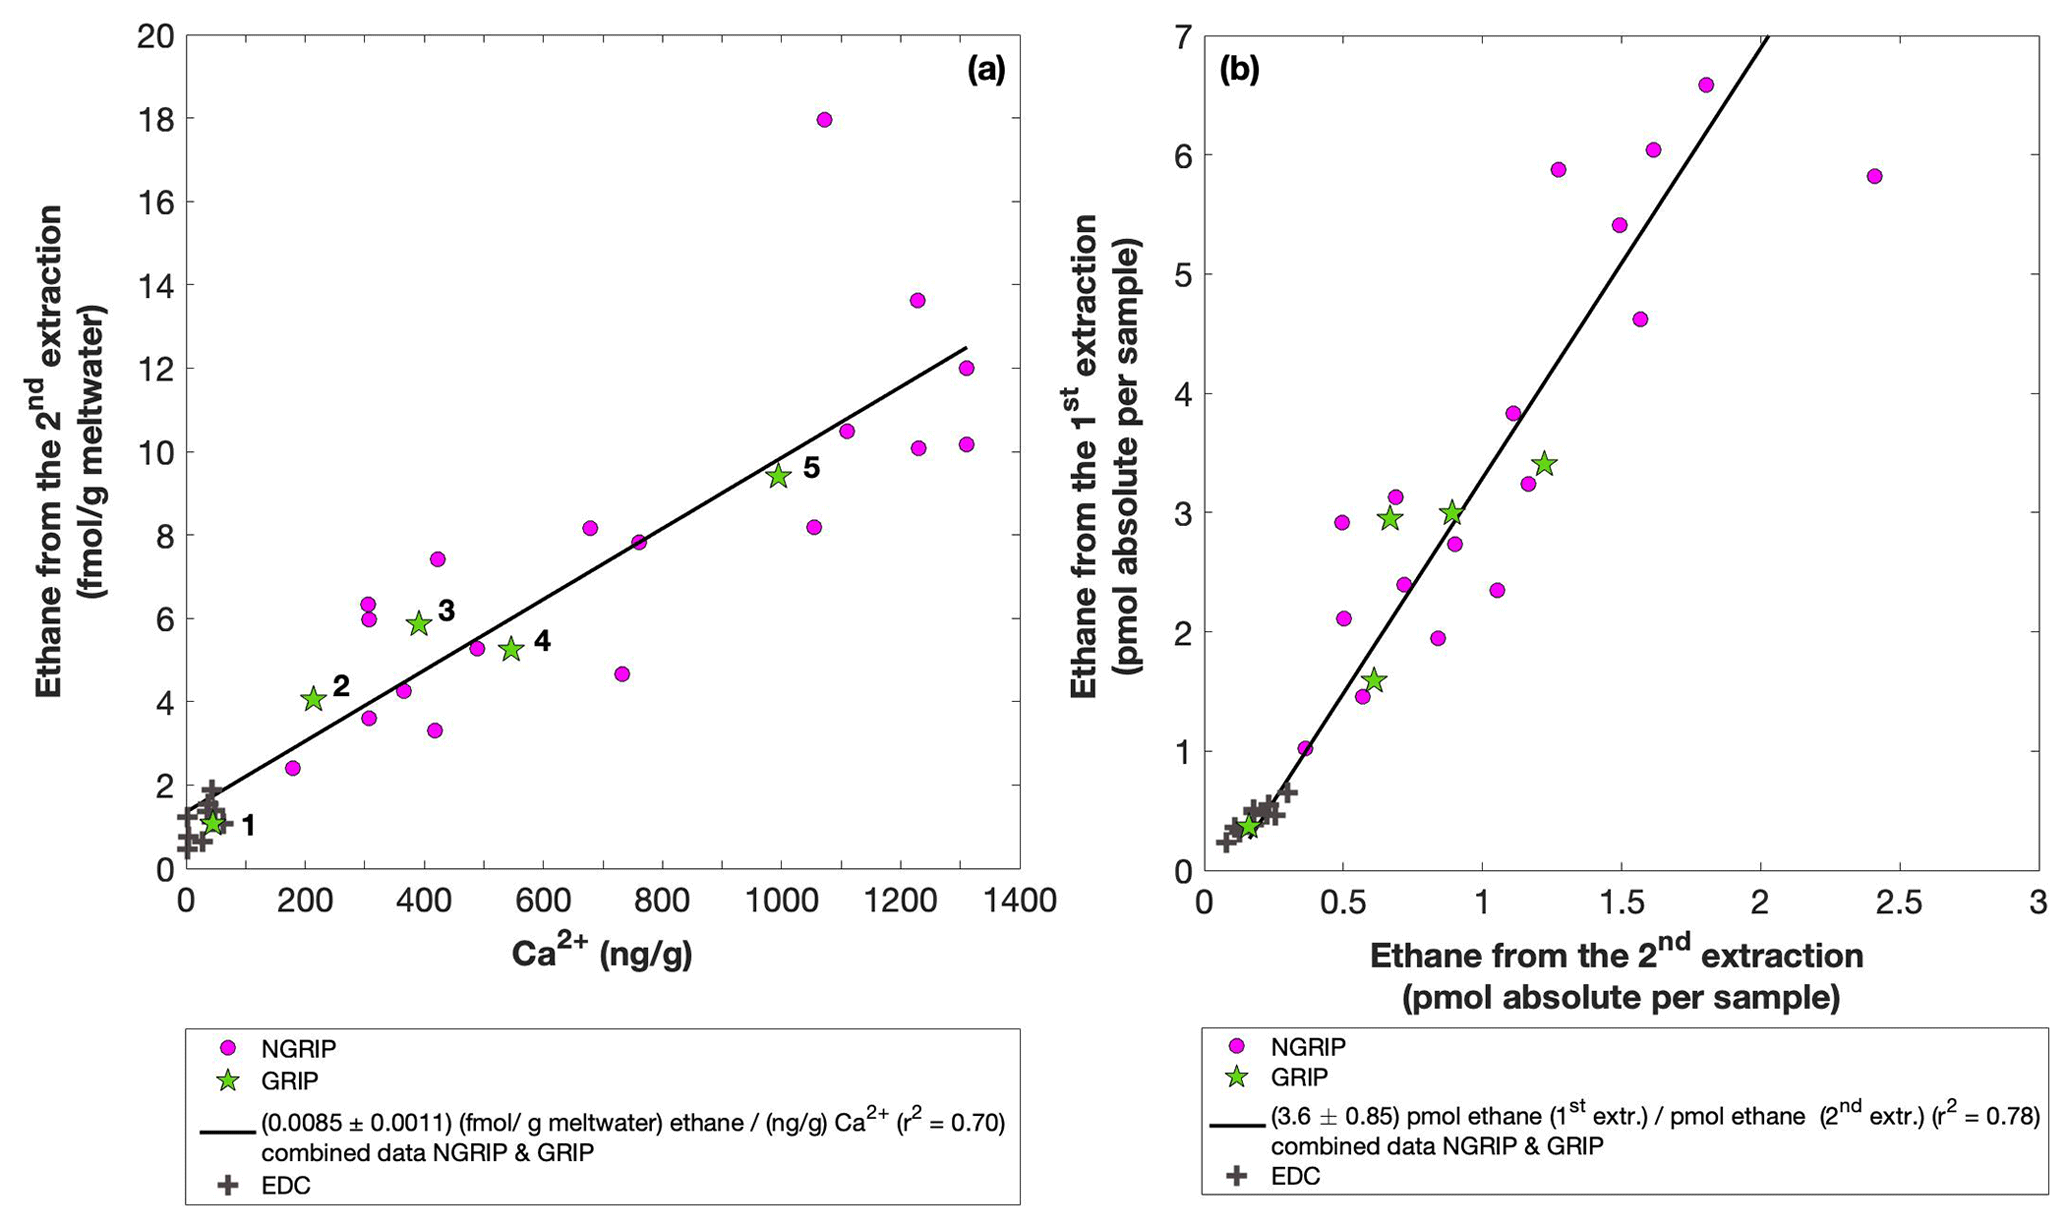
Figure 7GRIP and GRIP results of ethane from the second extraction in relation to the Ca2+ concentration and to the first extraction. (a) Produced amount of ethane in the meltwater (fmol g−1 meltwater) in relation to the Ca2+ concentration in the ice core samples. The numbered GRIP samples are used in Fig. C1 to evaluate the temporal dynamics. Crosses indicate the blank level of the system estimated from second extractions of EDC ice core samples. (b) Relation of the amount of ethane (pmol) measured in the first and second extraction.
For a better estimate of the temporal reaction kinetics of the underlying process, we can relate the measured amount of the individual species to the time available for a potential reaction in the meltwater during each extraction. For the five GRIP samples that were measured with a second and third extraction (see Sect. 2.2 for details) we take the cumulative production amount (where the first data point is the amount produced in the first extraction, the second data point is the sum of the first and second extraction, and the third data point is the sum of the first, second, and third extraction). In the example shown for ethane (Fig. C1), we can see the assumed first-order reaction kinetics with a decreasing ethane accumulation over time providing a good model for our measurements (details on the calculation can be found in Appendix C). With that, we can estimate the half-life time (τ) of the production to be approximately 30 min. Note that this long half-life also has an implication for a potential excess production of CH4 in continuous-flow techniques, where the time before the air is separated from the liquid water stream is only 1–2 min. Thus, only 5 %–10 % of the in extractu production found in our first extraction can be expected in such continuous-flow techniques, which is difficult to detect.
The goodness of fit of the ratios of the measured concentrations between the first and the second extraction is r2=0.78 for both ethane and propane, indicating that the production and/or release in the first extraction in relation to the second extraction is correlated well for both species (see Fig. 7b for ethane). Thus, samples that produced higher excess alkanes during the first extraction also produced more excess alkanes in the second extraction, suggesting that the production is dependent on the amount of some reactant present in the samples from which excess alkanes are produced. Again, for CH4 this relationship is more variable, which is likely related to the higher uncertainty in measuring CH4 for the second extraction.
The ratio of ethane to propane of all measured Greenland samples in the second extraction is 1.98±0.07 (r2=0.99). The ratio of methane to ethane is 8.17±1.14 (r2=0.86). Accordingly, the overall relationship between methane, ethane, and propane in the second extraction can be characterized by a ratio of approximately . However, comparing the ratios of ethane propane and methane ethane between the first and the second extraction, there is no significant difference within the 2σ uncertainties from 2.25±0.09 to 1.98±0.07 and from 6.42±1.57 to 8.17±1.14. We can conclude that within the error limits, the production ratios stayed the same, suggesting that the same in extractu process is at play during both extractions.
In the second extraction, we can again observe the relation between excess alkanes and the amount of mineral dust. Figure 7a shows the correlation of ethane (fmol g−1 meltwater) to Ca2+ (ng g−1) in all measured NGRIP and GRIP samples in the second extraction revealing a production of 0.0085 fmol g−1 meltwater ethane per ng g−1 Ca2+ with r2=0.70. For methane, we observe a production ratio of (0.0556±0.01513) fmol (g meltwater) methane per (ng g−1) Ca2+ with a correlation of r2=0.47 (data not shown).
Overall, excess alkane concentrations increase with increasing Ca2+ concentrations, in both the first and the second extraction. The total alkane production and/or release, however, decreased in the second extraction, suggesting the progressive exhaustion over time of some reactant necessary for the in extractu process. We propose that this reactant co-varies with Ca2+ and particulate dust, where Ca2+ is of course not a reactant itself and only represents a proxy for higher in extractu production.
3.2 Isotopic composition of excess methane
In this section we characterize the isotopic signature of excess methane and explore how we can use this parameter to better identify its source or production pathway. The evaluation of the carbon and deuterium isotopic signature of excess methane (δ13C-CH4(xs) and δD-CH4(xs)) is based on the Keeling-plot approach (Keeling, 1958, 1961; Köhler et al., 2006).
3.2.1 δ13C-CH4 isotopic signature of excess methane
Figure 8a shows the δ13C-CH4 results of the first extraction. The carbon isotopic signature of excess CH4 from the first extraction of the ice core sample measurements within one NGRIP bag are obtained from the y intercept of the Keeling plot, representing the excess δ13C-CH4 value for this bag. Note that the two NGRIP bags 3331 and 3332 are neighboring bags and were therefore combined into one Keeling y intercept. As the individual samples in these two bags span less than 10 years between each other, they are the same within the age distribution, and the assumptions for the Keeling-plot approach (see Sect. 2.1) are met. All bags show agreement in δ13C-CH4 signature (y intercepts) within 2σ uncertainties. The weighted mean isotopic signature is () ‰, with weights assigned by the number of samples that constrained each individual Keeling-plot regression line.
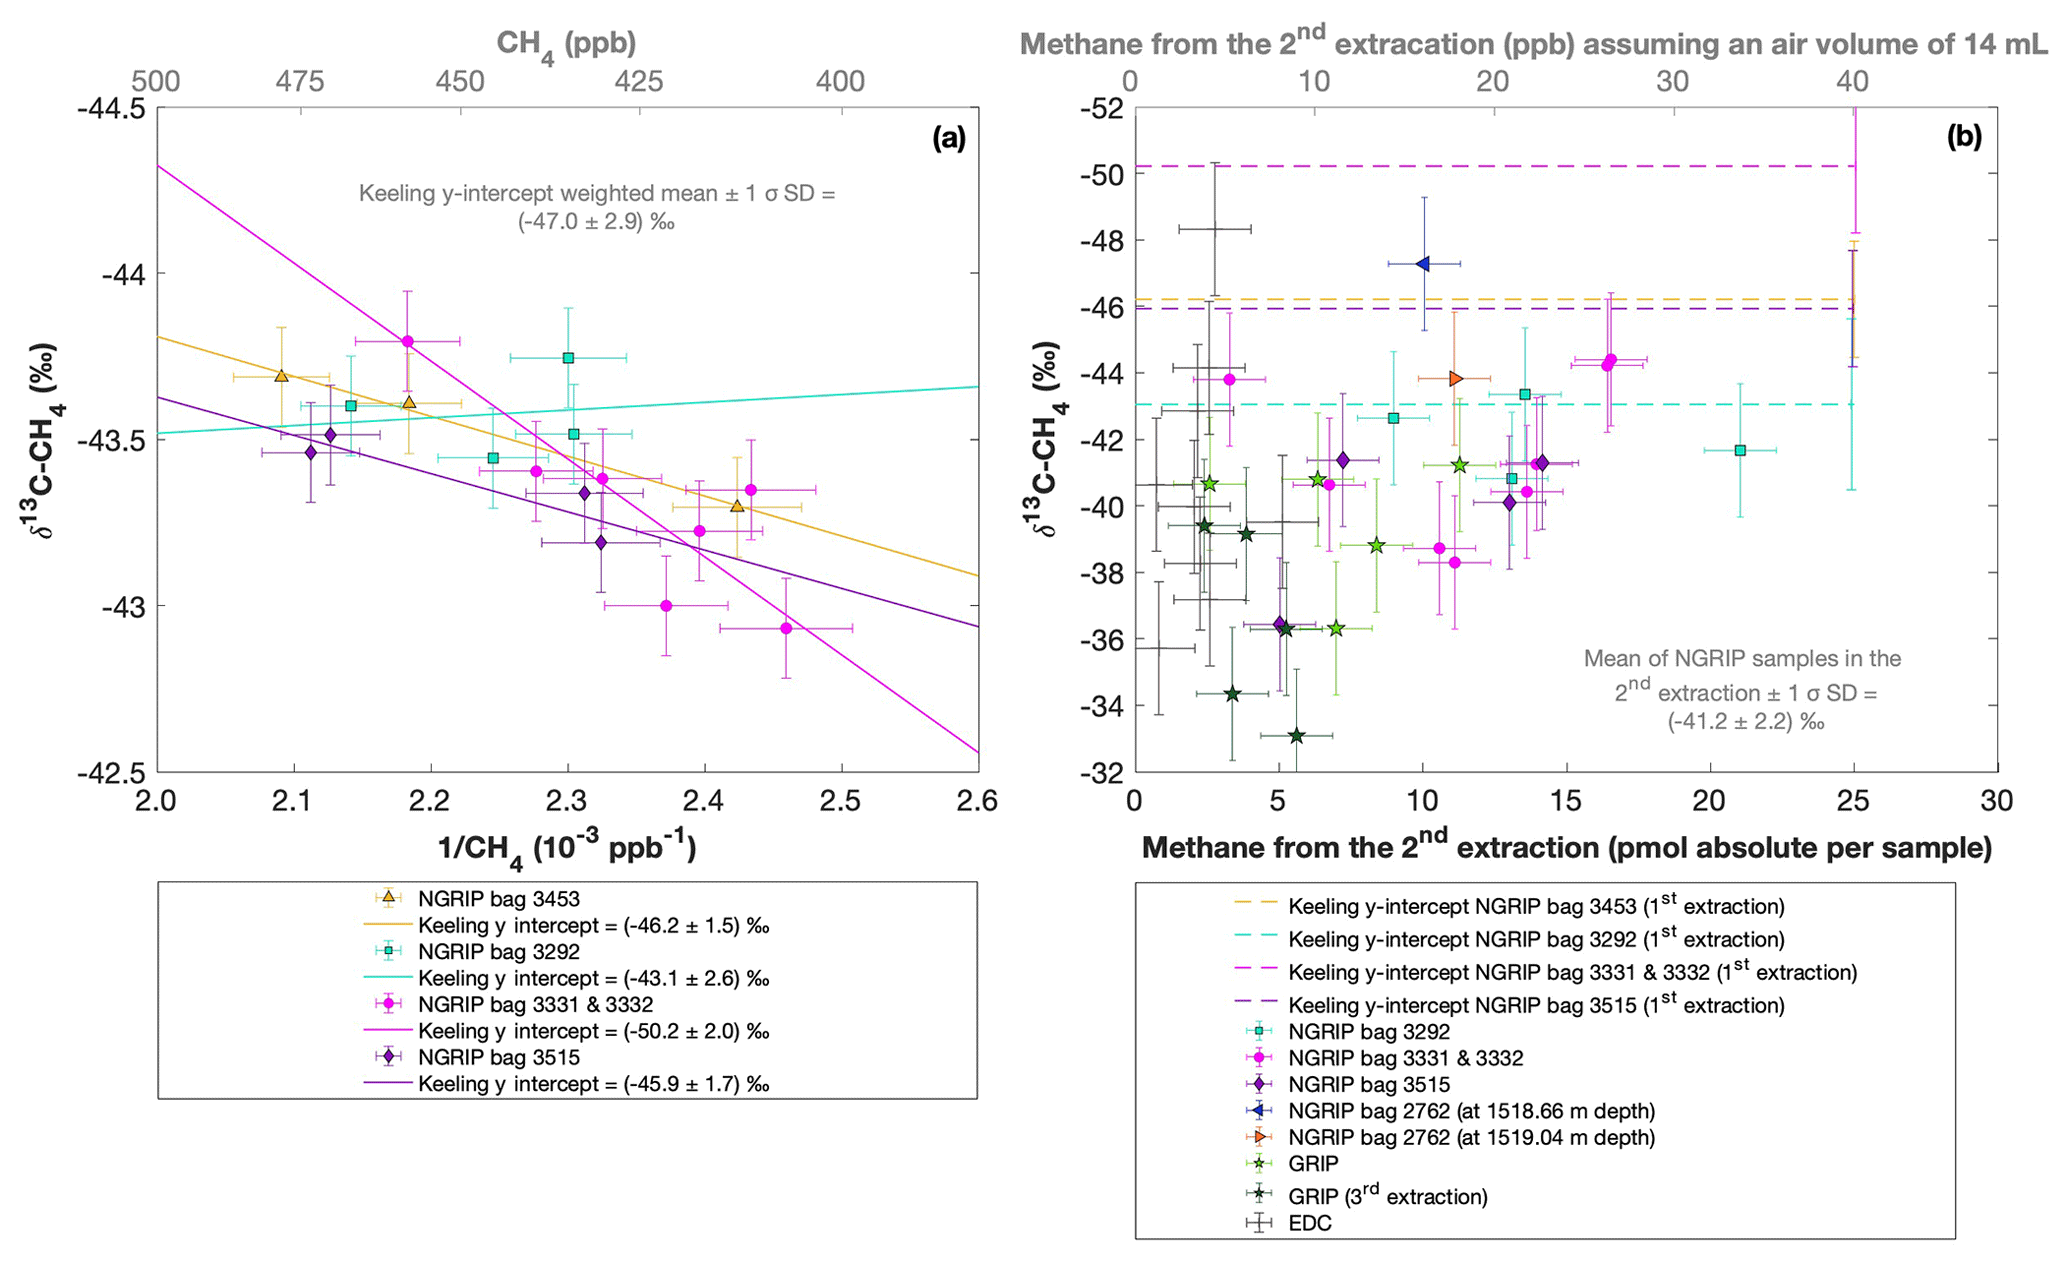
Figure 8NGRIP (and GRIP) δ13C-CH4 results of the first and second extraction measured with the δ13C-CH4 device. (a) Keeling plot of δ13C-CH4 for NGRIP samples from the five main bags (3292, 3331 and 3332, 3453, 3515) measured in the first extraction. Colors and symbols indicate individual measurements of the respective bags. Colored lines indicate the corresponding Keeling regression line of each individual bag. (b) δ13C-CH4 (‰) values in relation to the amount of methane measured for the second extraction. Units for CH4 are given as picomole absolute per sample on the primary axis in black and in parts per billion assuming an air volume of 14 mL of an ice core sample on the secondary axis in gray. Colors and symbols indicate individual measurements of the respective bags. Color-coded lines indicate the corresponding Keeling y intercept of each individual bag as measured in the first extraction. Gray crosses indicate the blank level of the system estimated from second extractions of EDC ice core samples.
With the small number of samples that go into the determination of the y intercept and its error in the Keeling plot for each individual bag, the estimates of the y intercepts and their error have to be regarded as statistically uncertain. However, comparing the results for the individual bags, they all agree within each bag within the estimated errors. In order to get a more representative value for the isotopic signature of excess CH4 and its error, we calculate a weighted average for all bags for the y intercept and its error. Nevertheless, this weighted error may still not be entirely representative because of the small sample number, and the true error may likely be somewhat higher.
Figure 8 shows the isotopic results in relation to the amount of CH4 produced during the second extraction. No atmospheric CH4 is present during the second extraction and the individual isotopic values in Fig. 8b are the directly measured values of excess CH4 without applying the Keeling-plot approach. For a better comparison, the produced CH4 is shown both in picomole (lower axis in Fig. 8b) and on a mixing ratio CH4 scale (ppb). The Keeling y-intercept values of the first extraction are added in Fig. 8b.
The δ13C-CH4 values of the second extraction range between −34 ‰ and −48 ‰ with the mean being () ‰. This value appears isotopically somewhat heavier compared to the weighted mean of () ‰ inferred from the Keeling analysis; however, it is still the same within the 2σ error limits. We note that the measured peak areas for the second extractions are very small and lie outside of the typical range of our gas chromatography mass spectrometry analysis for δ13C-CH4, and we cannot exclude some bias in these results. However, we mimicked these small peak areas with injections of small amounts of standard air and observed no significant bias in the measured δ13C-CH4 values given that the precision of such small peaks is around 2 ‰.
Another caveat is the considerable blank contribution for CH4 that we observe for the second extraction. Since Antarctic ice cores do not show a sizable in extractu production (Fig. 7, crosses for EDC), we measured EDC samples with the same protocol of a second extraction as for our Greenland samples to provide an upper boundary of this blank. Hence the second extraction of the EDC samples are a conservative blank estimate, while the true system blank is lower. As can be seen in Fig. 8b the amount of CH4 measured for these EDC samples (crosses) is on average about 2 pmol (equivalent to about 3 ppb). For comparison, our ice samples from Greenland show a range of about 5 to 20 pmol, indicating a considerable blank contribution in the second extraction.
To estimate the influence of the blank on the isotopic signature that occurs during the second extraction, we used the values from our EDC measurements and applied an isotope mass balance approach. The δ13C-CH4 blank signature obtained from these EDC samples is −39.0 ‰, hence a few ‰ heavier than the mean δ13C-CH4 signature of the excess CH4 from this second extraction for the Greenland samples. On average, the correction would shift our NGRIP values towards lighter (more negative) values by 0.31 ‰. This systematic correction is thus small compared to the typical measurement precision obtained both from the Keeling-plot approach and the direct measurement of the CH4(xs) with the second extraction. As the δ13C-CH4 signature of the blank is close to the NGRIP values, performing a blank correction has only little leverage. Considering these analytical limitations of our second extraction for δ13C-CH4, these findings suggest that CH4(xs) produced during the first and second extraction has the same δ13C-CH4 isotopic signature within the 2σ error limits and is likely produced/released by the same process in both extractions.
3.2.2 δD-CH4 isotopic signature of excess methane
Figure 9 shows the results of the δD-CH4 analyses. Due to the larger sample size required for the δD-CH4 analyses and the sample availability restrictions, only two bags could be measured for δD-CH4. The individual δD-CH4 results obtained from the ice core sample measurements within one NGRIP bag are again combined into one Keeling y intercept, representing the δD-CH4 value for this bag. NGRIP bag 3460 (orange) reveals a Keeling y-intercept δD-CH4 value of () ‰. The two NGRIP bags 3266 and 3267 (purple) are neighboring bags and were combined into one Keeling y intercept revealing a δD-CH4 value of () ‰. The difference between the two Keeling y intercepts is within the error limits. Accordingly, we combine the two values to a weighted mean and weighted uncertainty of () ‰. As stated above, with the small number of samples that go into the determination of the y intercept and its error in the Keeling plot for each bag, the estimates of the y intercepts and their error have to be regarded as statistically uncertain.
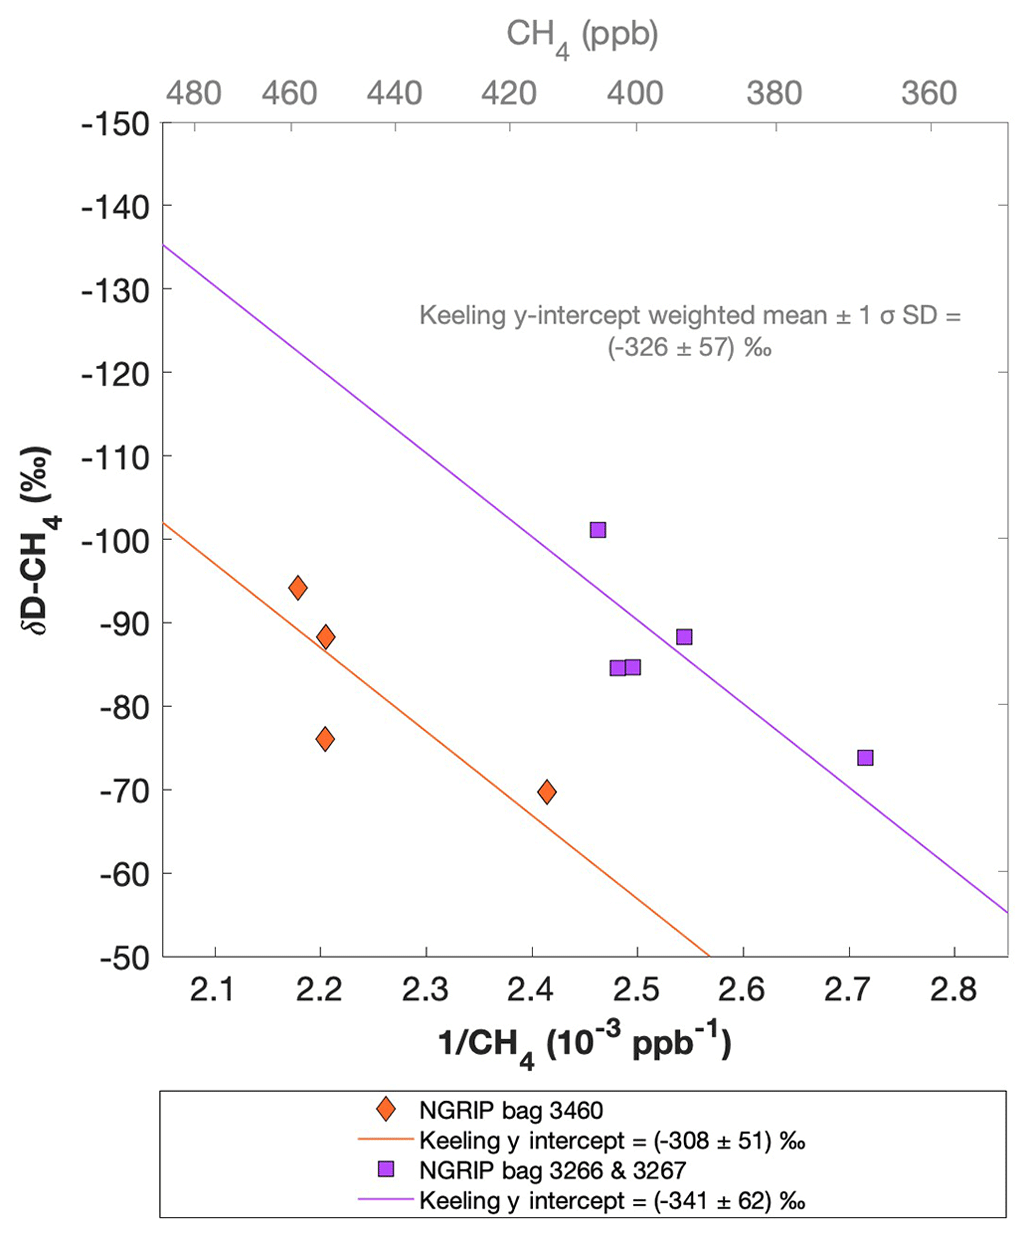
Figure 9NGRIP δD-CH4 results. Keeling plot of δD-CH4 of NGRIP samples measured with the δD-CH4 device. Colors and symbols indicate individual measurements of the respective bags and lines indicate the corresponding regression of each bag.
Our results are consistent with the findings of Lee et al. (2020), who used the NGRIP δD-CH4 record of Bock et al. (2010b) and the NGRIP [CH4] record of Baumgartner et al. (2014) to estimate the δD-CH4(xs) signature in these samples. Assuming a two-component mixture of atmospheric methane and excess methane in their model led to a best estimate of () ‰ for δD-CH4(xs), which is within the error limits of our Keeling-plot results.
In Sect. 3 several pieces of evidence for the production and/or release of excess alkanes in Greenland ice core samples were collected:
-
We can confirm the observations of Lee et al. (2020) on excess methane in different Greenland ice cores and its co-variance with the amount of mineral dust in the ice. Despite the different extraction techniques applied (multiple melt–refreeze method in Lee et al., 2020, versus two subsequent wet extractions in our study), we can further corroborate that the temporal dynamics of the production and/or release are on the order of hours and production and/or release occurs when liquid water is present during extraction.
-
We document for the first time a co-production and/or release of excess methane, ethane, and propane, with the observed values for ethane and propane exceeding by far their estimated past atmospheric background concentrations.
-
Excess alkanes (methane, ethane, propane) are produced and/or released in a fixed molar ratio of approximately , indicating a common origin.
-
We further characterize the isotopic composition of excess CH4 of δ13C-CH4(xs) and δD-CH4(xs) to be () ‰ and () ‰ in NGRIP ice core samples, respectively. Within the error limits, our δD-CH4(xs) results are consistent with the calculated best estimate of () ‰ by Lee et al. (2020).
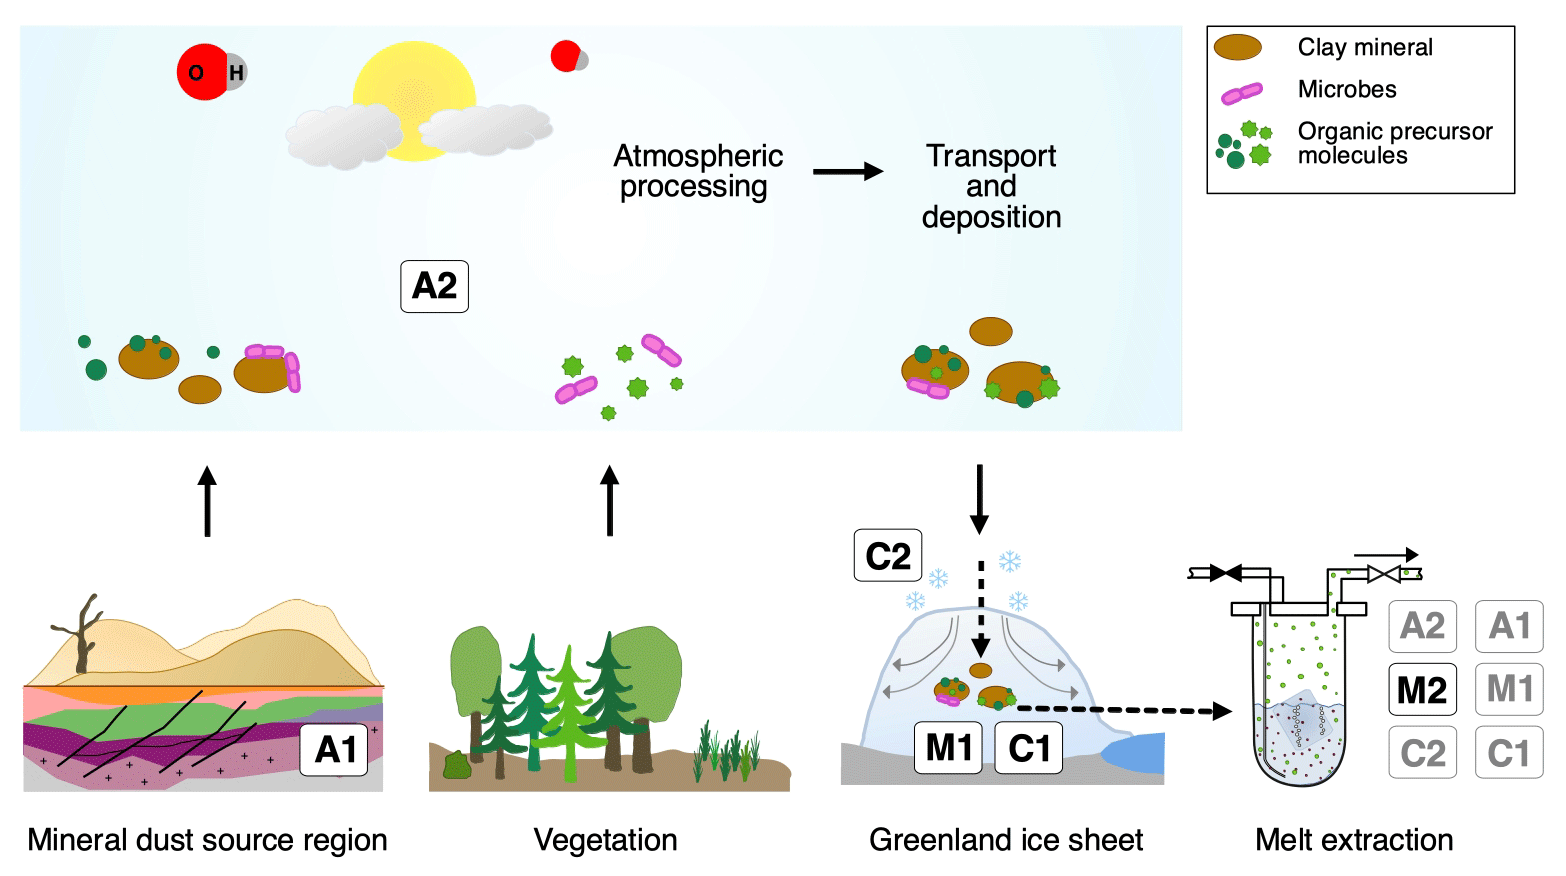
Figure 10Overview of the different possibilities explaining excess alkanes in dust-rich Greenland ice. Processes labeled A depict an adsorption process of alkanes on mineral particles, either from natural gas seeps within the sediment (A1) or from the atmosphere (A2) prior to their deposition on the Greenland ice sheet. This gas is then desorbed during melting in the laboratory. Processes labeled M depict a microbial production of excess alkanes, either in the ice (in situ), followed by adsorption on dust particles in the ice and a subsequent slow desorption process during melting (M1), or a microbial production in the meltwater (in extractu) (M2). Processes labeled C depict the abiotic and/or chemical production of excess alkanes, either in the ice (in situ) followed by adsorption on dust particles after production in the ice and a subsequent slow desorption during the melting process (C1) or an abiotic production in the meltwater (in extractu) (C2).
Table 1Overview of the different hypotheses explaining the possible sources for excess alkanes (as illustrated in Fig. 10) in relation to our experimental observations. A checkmark indicates that the observation is in line with the respective mechanism, a cross indicates that the observation is in not line with the respective mechanism. An empty field means that this observation does not apply or does not affect the respective mechanism.
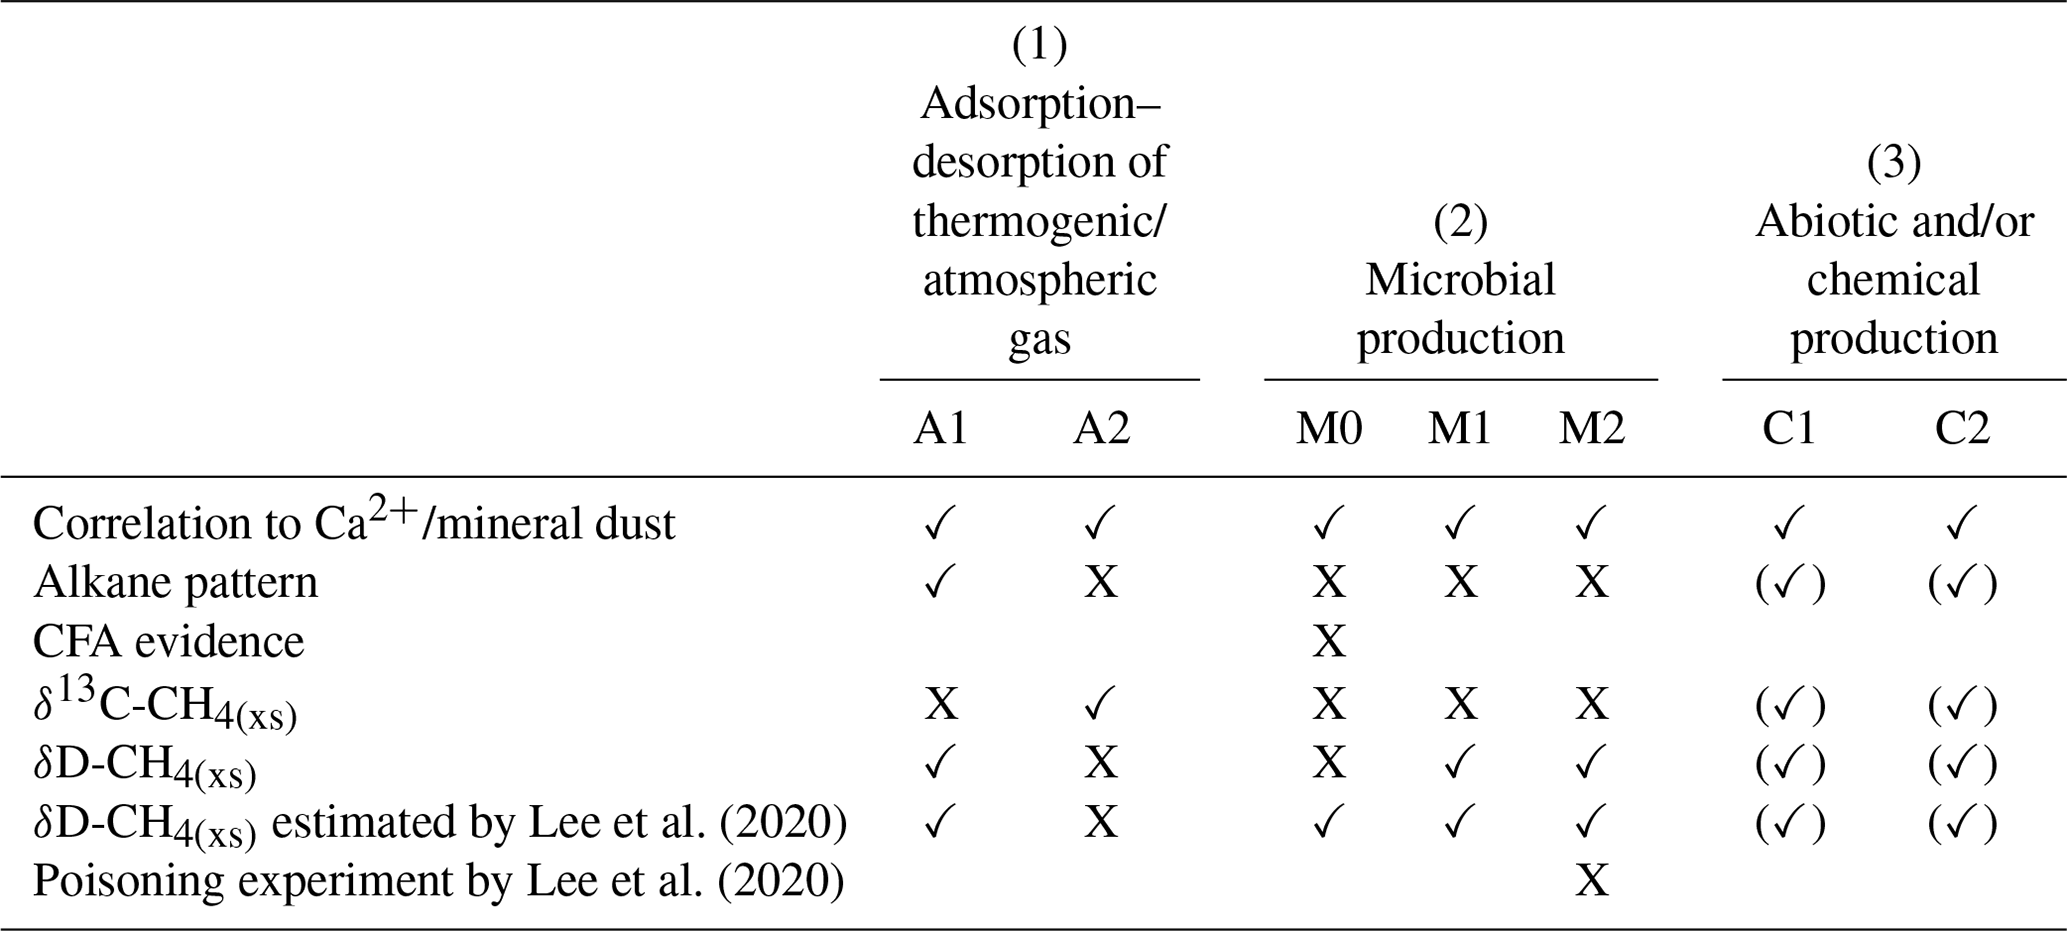
In the Introduction we presented the hypotheses proposed by Lee et al. (2020) explaining their observations on CH4(xs). Here we resume the discussion of the original hypotheses and refine them in light of our new data from NGRIP and GRIP measurements. An overview of the possible sources explaining excess alkanes is illustrated in Fig. 10 and Table 1. We discuss in the following three options for the origin of the observed excess alkanes:
-
Excess alkanes could be adsorbed on mineral dust particles prior to their deposition on the Greenland ice sheet and released in the laboratory during the prolonged melting process. The adsorption step could happen in the mineral dust source region (East Asian deserts), thereby adsorbing the alkanes from natural gas seeps within the sediment (process marked as A1; see Fig. 10). Alternatively, adsorption of atmospheric alkanes on dust particles can happen anytime starting from the soil surface in the dust source region, during atmospheric transport to the Greenland ice sheet, or within the firn layer before pores are closed off (A2). The desorption of the adsorbed alkanes happens during the melting process for both cases.
-
Excess alkanes could be produced microbially in two ways. The production happens either in the ice (in situ), with the alkanes being adsorbed on dust particles in the ice and then slowly released during the melting phase in the laboratory (M1). Alternatively, the microbial production happens in the meltwater during the melting process (in extractu) (M2). A microbial in situ production in the ice without an adsorption–desorption process was already deemed unlikely by Lee et al. (2020) since it is not compatible with the lack of CH4(xs) in the CFA CH4 concentration records.
-
Excess alkanes are produced abiotically, e.g., by the decomposition of labile organic compounds. This chemical reaction can happen either in the ice (in situ), where excess alkanes are then adsorbed on dust particles and subsequently released during the melting process (C1), or in the meltwater during extraction (in extractu) (C2). An abiotic in situ production in the ice without an adsorption–desorption process can also be ruled out with the CFA evidence.
We now discuss these mechanisms in detail and evaluate the viability of the different hypotheses in light of our new experimental observations.
(1) Adsorption and desorption of alkanes on mineral dust particles
Depending on where the adsorption occurs, the mineral particles might adsorb alkanes of different origin and composition. One possibility is that the adsorption already takes place within the sediment or soil of the dust source region, thus before mineral dust deflation (erosion of loose material by winds from flat and dry areas; A1). As proposed by Lee et al. (2020), the major source region of mineral dust arriving in Greenland during the glacial (Taklimakan, Tarim Basin) are also regions where natural gas seeps reach the surface (Etiope and Klusman, 2002; Etiope et al., 2008). In this case, the measured excess alkanes should reflect the seep's isotopic and alkane composition. Alternatively, adsorption of atmospheric alkanes on the particles can happen anytime starting from the soil surface, during transport en route to the Greenland ice sheet after deflation, and within the firn layer before pores are closed off (A2). For the scenario A2 the fingerprint (isotopic composition and ratio of alkanes) of the adsorbed alkanes depends on the past atmospheric composition but could be modulated by selective fractionation processes during adsorption and desorption.
To be a viable mechanism for our problem, it requires that the adsorbed alkanes stay strongly bound to the dust particles while desorption is minor both during the atmospheric transport and during the several hundred years the dust particles spend in the porous firn (age of the firn at bubble close-off). During the melting procedure the adsorbed alkanes would then be released from their mineral dust carrier, which in case of Greenland ice from glacial times predominately consist of clay minerals from the Taklimakan (and partly also Gobi) Desert (Biscaye et al., 1997; Svensson et al., 2000; Ruth et al., 2003). However, additional dust sources exist with their relative contribution varying with climate conditions (Han et al., 2018; Lupker et al., 2010).
Several experimental studies showed that clay minerals have a high adsorption capacity and retention potential for alkanes (Sugimoto et al., 2003; Cheng and Huang, 2004; Dan et al., 2004; Pires et al., 2008; Ross and Bustin, 2009; Ji et al., 2012; Liu et al., 2013; Tian et al., 2017). The influencing parameters for an adsorption–desorption process are mainly pressure, temperature, clay mineral type, micropore size, surface area, organic carbon content, and water and/or moisture content (Sugimoto et al., 2003; Cheng and Huang, 2004; Dan et al., 2004; Pires et al., 2008; Ross and Bustin, 2009; Ji et al., 2012; Liu et al., 2013; Tian et al., 2017). Most interestingly for us, studies by Sugimoto et al. (2003) and Dan et al. (2004) on the adsorption of CH4 in micropores on the surface of clay minerals in dried and fresh lake sediment showed that dried sediment still retains CH4 and that dried and degassed sediment re-adsorbs ambient CH4 at standard pressure and room temperature. The amount of CH4 adsorbed in their samples strongly depends on pressure and temperature, while increasing temperatures and decreasing pressure lead to stronger desorption. The addition of water and/or moisture leads to a rapid desorption of already adsorbed gases (Sugimoto et al., 2003; Dan et al., 2004; Pires et al., 2008; Ji et al., 2012; Liu et al., 2013).
These observations support the possibility of an adsorption–desorption process for our glacial NGRIP and GRIP ice core samples, where alkanes (from fossil seeps or atmosphere) would be adsorbed on dust particles and desorbed during the extraction when liquid water is present. Independent of the origin of the alkanes (A1 or A2), the amount of alkanes adsorbed on dust deposited onto the Greenland ice sheet by this process would be diminished if the dust particles were already in contact with liquid water during the long-range transport, which may lead to a loss of previously adsorbed alkanes. This water contact could occur, for example, already at the dust source, as it is known that the deserts in the Tarim Basin receive regular input from water from the surrounding mountain regions that also provide the minerals to the basin that are blown out of the desert afterwards (Ruth et al., 2007).
To explain the constant ratio of methane, ethane, and propane of in our samples with an adsorption mechanism, we need to discuss the potential origins of the adsorbed alkanes. First, we find very high relative excess contributions of ethane and propane in our samples, while we see a small excess contribution for methane compared to the atmospheric background. This is not in line with the past atmospheric CH4 (C2H6 + C3H8) ratio where past atmospheric ethane concentrations by Nicewonger et al. (2016) are an order of magnitude smaller (and propane concentrations even less) than the measured concentrations in dust-rich Greenland ice core samples.
In contrast, the ratio of methane, ethane, and propane for our samples of approximately translates into a CH4 (C2H6 + C3H8) ratio of ∼5, which is most consistent with a thermogenic origin (see Fig. 11a). However, due to the different adsorption capacity of mineral dust particles, a fractionation of the three alkanes is also to be expected during the adsorption process, which could alter the thermogenic signature.
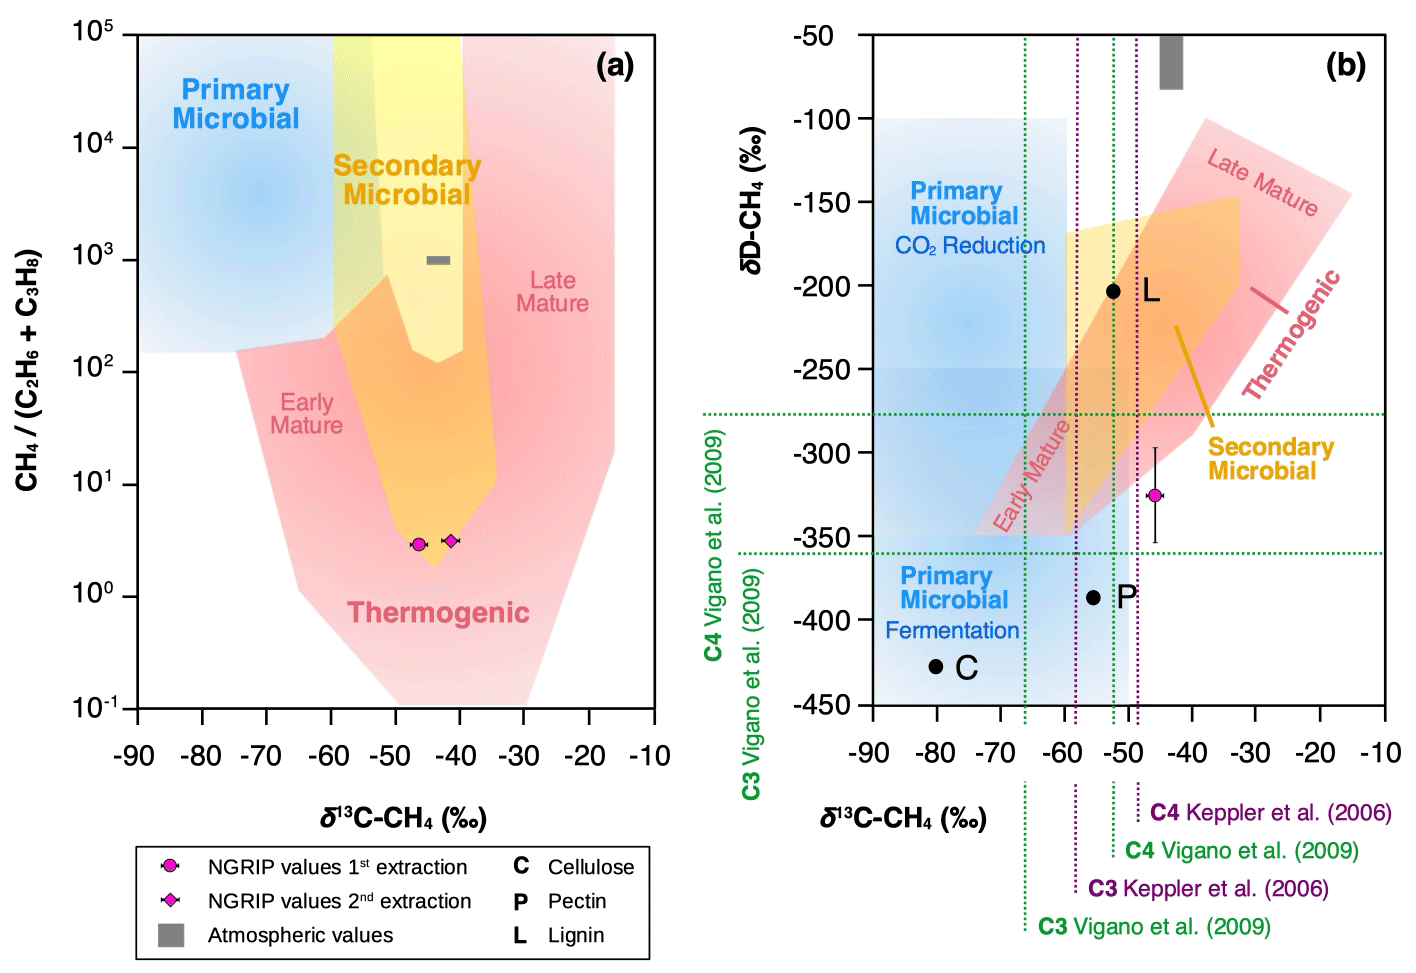
Figure 11Diagrams of genetic fields for natural gas adopted from Milkov and Etiope (2018). (a) Genetic diagram of δ13C-CH4 versus CH4 (C2H6 + C3H8). Typical atmospheric values are indicated by a gray-shaded area and NGRIP values obtained from the first and second extraction from this study with a pink dot. (b) Methane genetic diagram of δ13C-CH4 versus δD-CH4. Values for cellulose (C), lignin (L), and pectin (P) are added from Vigano et al. (2009) and mean values for C3 and C4 plants, respectively, from studies by Keppler et al. (2006) and Vigano et al. (2009).
To further evaluate the adsorption theory in light of our experimental results, we now include the carbon and deuterium isotopic signature of CH4(xs) in our samples. Our NGRIP samples reveal a δ13C-CH4(xs) value (Keeling y-intercept weighted mean) of () ‰, which is within the error consistent with contemporaneous atmospheric values or with emissions from seeping reservoirs of natural gas. In contrast, our δD-CH4(xs) measurements on NGRIP samples reveal a very light value (Keeling y-intercept weighted mean) of () ‰ and slightly outside of the field of a thermogenic origin (see Fig. 11). The value is similar to the estimate by Lee et al. (2020), which, however, lies inside the field of a thermogenic origin (see Fig. 11). While both the low CH4 (C2H6 + C3H8) ratio and the δ13C-CH4(xs) could be indicative of a thermogenic source (A1), the light δD-CH4(xs) signature is far away from the atmospheric δD-CH4 value and is borderline in line with typical δD-CH4 values of a thermogenic origin. Hence, our δD-CH4(xs) values exclude the atmospheric adsorption scenario A2 and put a question mark after the seep adsorption scenario A1.
For the seep adsorption scenario A1 to work, the dust particles on which the thermogenic gas adsorbed are not allowed to experience any contact with liquid water prior to the analysis in the lab. In other words, if the particles come into contact with liquid water after the adsorption step, the adsorbed alkanes would desorb from the particles as they do in the laboratory during melting. Given the occurrence of wet–dry cycles in the source area (Ruth et al., 2007), we question the plausibility of scenario A1. Moreover, we expect the characteristic desorption time to differ among the three alkanes, which would be in contradiction to the observation that the alkane ratios in the first and second extraction are the same within the error limits.
(2) Microbial production
The second process that we take into consideration is the microbial production of excess alkanes through methanogenic microbes. Here we must again differentiate between two scenarios: microbial production can either take place in the ice sheet (in situ) by extremophile microbes, with this process requiring that in situ produced excess alkanes are then adsorbed onto dust particles in the ice and subsequently slowly desorbed during melting when in contact with liquid water (M1), or the production takes place during the melt extraction when methanogens can metabolize in liquid water (in extractu; M2). Lee et al. (2020) already excluded a “simple” in situ production of excess CH4 (microbial in situ production in the ice without an adsorption–desorption process; M0), and this option will therefore not be discussed further here.
Our ratios of excess methane ethane propane in NGRIP and GRIP samples add another piece of corroborating evidence that excess alkanes are not produced microbially. The main microbial production process of methane, the decomposition of organic precursors in an anaerobic environment by archaea, also co-produces ethane and propane, however only in marginal amounts. The typical methanogenesis yields > 200 times more methane than ethane and propane (Bernard et al., 1977; Milkov and Etiope, 2018), while we find a molar ratio of methane to ethane to propane of in our samples. This renders a microbial production pathway (in situ and in extractu, i.e., M1 and M2) unlikely. Moreover, a microbial production of CH4 is unlikely in view of the δ13C-CH4(xs) signature, which is too heavy for microbial CH4.
Apart from these quantitative limitations of microbial CH4 in situ production in ice, there is evidence from the “microbial inhibition experiment” by Lee et al. (2020) against microbial production of alkanes during the melt extraction. Lee et al. (2020) tested whether biological CH4(xs) production in the meltwater was inhibited when the ice core samples were treated with HgCl2. As CH4(xs) was still observed in the poisoned samples, and as it seems unlikely that microbes are resistant to HgCl2, this experiment questions the hypothesis of microbially produced CH4(xs) also during extraction (in extractu).
We conclude that regardless of the location of the production, in situ or in extractu, the fingerprint of the excess alkanes in our samples (heavy δ13C-CH4(xs) signature and low CH4 (C2H6 + C3H8) ratio) essentially rules out a microbial source, and another (abiotic?) process for excess alkane production is likely to exist.
(3) Abiotic and/or chemical production
In this last section we consider an abiotic or chemical process to be responsible for the observed excess alkanes, where excess alkanes would be produced through the abiotic decomposition of labile organic compounds in the meltwater (C2). We question an abiotic in situ production in the ice (C1) as it would require the quantitative adsorption of the in situ produced alkanes onto mineral dust particles but not the atmospheric CH4 that is available in the ice otherwise. However, as the location of an in situ excess CH4 production in the ice is not the same as the location of the bubble or clathrates in the ice, this argument is not able to exclude this hypothesis. However, given the age of the ice that allows for permeation of gases on the grain scale and the recrystallization of the ice during that time, which could both bring the atmospheric CH4 into contact with the dust particles, we feel this process is less plausible than a potential C2 mechanism. Moreover (as mentioned before), in view of the expected different desorption characteristics of the three alkanes, we would expect different alkane ratios in the first and second extraction, which is not the case. Accordingly, a direct abiotic production during melting appears to be more likely than a desorption process.
Organic precursors for this abiotic production during extraction could be any organic matter (either microbial or plant-derived). As the amount of excess alkanes is tightly coupled to the amount of dust, we assume that these organic compounds are attached to dust particles. This “docking” of the organic precursor onto the mineral dust could already happen in the dust source region involving organic material available at the surface. Or it could happen by volatile organic molecules or secondary organic aerosols from the atmosphere adhering to the mineral dust aerosol either before deflation at the source region or during transport to Greenland.
We consider this pathway plausible, as in recent years the prevailing paradigm that methane is only produced by methanogenic archaea under strictly anaerobic conditions has been challenged. Several experimental studies demonstrated that methane can also be released from dried soils (Hurkuck et al., 2012; Jugold et al., 2012; Wang et al., 2013; Guo et al., 2016), fresh plant matter and dry leaf litter (Keppler et al., 2006; Vigano et al., 2008, 2009, 2010; Bruhn et al., 2009; Derendorp et al., 2010, 2011), different kinds of living eukaryotes (plants, animals and fungi) (Liu et al., 2015), and single organic structural components (McLeod et al., 2008; Messenger et al., 2009; Althoff et al., 2014) and in fact under aerobic conditions. Most of these studies focused on methane; however, there is also evidence for simultaneous formation of other short-chain hydrocarbons like ethane and propane (McLeod et al., 2008; Derendorp et al., 2010, 2011). At least three mechanisms have been identified to be relevant: (i) photo-degradation, (ii) thermal degradation, or (iii) degradation by the reaction with a reactive oxygen species (ROS) (Schade et al., 1999; Wang et al., 2017). Common to all three pathways is a functional group (for example a methyl or ethyl group) that is cleaved from the organic precursor molecule. Key parameters that control the production of abiotic methane are mainly temperature, UV radiation, water and/or moisture, and the type of organic precursor material (Vigano et al., 2008; Derendorp et al., 2010, 2011; Hurkuck et al., 2012; Jugold et al., 2012; Wang et al., 2013, 2017).
Recent findings demonstrated the large variety of potential organic precursors for abiotic trace gas formation. For methane formation, the plant structural components pectin and lignin have been identified in many studies as a precursor in different plant materials. Pectin and lignin contain methoxyl groups in two different chemical types: ester methoxyl (present in pectin) and ether methoxyl (present in lignin) (Keppler et al., 2006, 2008; McLeod et al., 2008; Messenger et al., 2009; Bruhn et al., 2009; Vigano et al., 2008; Hurkuck et al., 2012; Liu et al., 2015; Wang et al., 2017). Ester methyl groups of pectin were also discovered as a precursor for ethane formation (McLeod et al., 2008). Overall, pectin makes up a large fraction of the primary cell wall mass of many plants, thus representing a large reservoir available as a precursor for abiotic alkane formation (Keppler et al., 2006; Mohnen et al., 2008; Vigano et al., 2008, 2010; McLeod et al., 2008), and may be present in sufficient quantities in our ice core samples attached to mineral dust particles. CH4 production was also detected from cellulose even though it does not contain methoxyl groups suggesting that other carbon moieties of polysaccharides might allow abiotic CH4 formation (Keppler et al., 2006; Vigano et al., 2008). In addition, poly-unsaturated fatty acids in plant membranes are suggested to play a key role not only in the formation of methane but also for ethane and propane (John and Curtis, 1977; Dumelin and Tappel, 1977; Derendorp et al., 2010, 2011). Further, sulfur-bound methyl groups of methionine are an important precursor for abiotic CH4 formation in fungi (Althoff et al., 2014).
Considerably different emission rates were found for the same amount but different type of organic substances, leading to the conclusion that abiotic emissions are strongly dependent on the type of organic precursor material or single structural components (Keppler et al., 2006; McLeod et al., 2008; Vigano et al., 2008; Messenger et al., 2009; Hurkuck et al., 2012). Other factors such as leaf and cell wall structure (McLeod et al., 2007; Watanabe et al., 2012; Liu et al., 2015) and the organic carbon content (Hurkuck et al., 2012) are suggested to influence this process, too.
To explain the observed excess alkanes in dust-rich Greenland ice core samples by an abiotic production through the decomposition of labile organic compounds requires adequate quantities of organic precursors within the ice core samples. Certainly, such material is present in Greenland ice, but currently, there is no record of the amount and type of organic substances available. We have some limited information from occasional Greenland ice core samples in which different types of organic substances were detected (Giorio et al., 2018, and references therein), but it does not allow for an overarching interpretation for our ice samples. An NGRIP record of formaldehyde and a GRIP record of acetate and formate exists (Fuhrer et al., 1997), which suggest lower levels during the glacial, but as we do not know which organic precursors lead to the excess CH4 productions, this observation is only of limited value.
We may also question whether a perfect record of eligible precursor molecules could exist at all. As we observe that precursor substances are labile and quickly decompose when in contact with liquid water, a direct measurement of these substances might not be possible but only for similar, non-reactive substances, which are then not qualified as precursors for the reaction observed. The problems of sampling, analysis and interpretation of organic material in polar ice are well summarized and expounded in Giorio et al. (2018).
In any case, it appears likely that the mineral dust carries along soil organic matter or plant residues or accumulates organic aerosols as a result of organic aerosol aging during transport. In our data we see a relationship between the amount of mineral dust within the ice core samples and the amount of excess alkanes. As the amount of excess alkanes per Ca2+ (or mass of dust) is variable, this suggests that mineral dust is just a carrier for (a variable amount of) organic substances but does not account for the production of excess alkanes itself. The dust content within the ice core sample can only serve as a rough estimate of organic precursor availability and whether an abiotic production from organic precursor substances is likely to occur during extraction.
Again, our experiments can shed some light on the viability of this pathway for excess alkane production. If we assume that the dust-related organic matter in the ice represents a reservoir available for abiotic production, then the decomposition continues until all functional groups are cleaved from their organic precursor molecules and released as excess alkanes. Once the reservoir is emptied, excess alkane production ceases (Derendorp et al., 2010, 2011). In line with this, we interpret that the decrease in the amount of measured excess alkanes from the first to the second extraction may result from an exhaustion of the precursor reservoir. The reaction time is slow enough to allow for the continuing production during the second extraction but too slow for a detectable production during continuous-flow analysis of CH4, where the water phase is present only for less than 2 min before gas extraction. The significantly reduced production during the second extraction in our samples shows that the timescale for this process is hours (see Fig. C1) until the reservoir of functional groups is depleted. We note that this implies that the amount of excess alkanes is strongly dependent on the time span when liquid water is in contact with the dust, which varies among the methods used for CH4 analyses. Thus, any excess CH4 in measurements from different labs performed under different conditions may differ.
To explain an abiotic alkane production, certain conducive boundary conditions must be met. The most important parameters that control non-microbial trace gas formation are temperature and UV radiation. This was demonstrated in many field and laboratory experiments (Keppler et al., 2006; McLeod et al., 2008; Vigano et al., 2008, 2009; Messenger et al., 2009; Bruhn et al., 2009; Derendorp et al., 2010, 2011; Hurkuck et al., 2012; Jugold et al., 2012; Wang et al., 2017). Generally, increasing temperatures lead to exponentially increasing CH4 emissions (Vigano et al., 2008; Bruhn et al., 2009; Wang et al., 2013; Liu et al., 2015). The same behavior was observed for ethane and propane with very low emissions at ambient temperatures (20–30 ∘C) and a maximum at 70 ∘C (McLeod et al., 2008; Derendorp et al., 2010, 2011). At constant temperatures emission rates decreased over time, which is on the timescale of hours at high temperatures and on that of months at ambient temperatures. Even after months, some production was observed, pointing to a slowly depleting reservoir of organic precursors (Derendorp et al., 2010, 2011). Increasing emissions observed at temperatures > 40 ∘C were also used as an indicator to exclude the possibility of enzymatic activity, as the denaturation of enzymes would lead to rapidly declining emissions at higher temperatures (Keppler et al., 2006; Derendorp et al., 2011; Liu et al., 2015). We note that our sample extraction takes place at 0 ∘C or a few degrees Celsius above; hence, temperature conditions during the extraction are not conducive to the type of abiotic alkane production observed in the studies listed above. Whether the cool temperature of the meltwater during extraction inhibits abiotic reaction is difficult to say. Derendorp et al. (2010, 2011) observed a much lower temperature dependency of C2–C5 hydrocarbon emissions from ground leaves than whole leaves, which might also apply to our samples with very fine fragments of organic substances attached to dust particles.
Besides the strong relationship to temperature, UV irradiation also seems to have a substantial effect on abiotic production. Studies on irradiated samples (dry and fresh plant matter, plant structural components) showed a linear increase in methane emissions, while UV-B irradiation seems to have a much stronger effect on the release compared to UV-A (Vigano et al., 2008; McLeod et al., 2008; Bruhn et al., 2009; Jugold et al., 2012). The influence of visible light (400–700 nm), however, seems controversial (Keppler et al., 2006; Bruhn et al., 2009; Austin et al., 2016). Further, samples that were heated and irradiated show a different emission curve than just heated samples, indicating that irradiation changes the temperature dependency, in turn pointing to the fact that different chemical pathways exist (Vigano et al., 2008).
In dark experiments on plant material at different temperatures CH4 emissions were still observed, while higher temperatures again revealed much higher emissions, emphasizing the strong temperature dependency also without UV irradiation (Vigano et al., 2008; Wang et al., 2008; Bruhn et al., 2009). The release of ethane along with methane from pectin was also stimulated under UV radiation (McLeod et al., 2008).
Regarding our measurements, the sample vessel in the δ13C-CH4 device is encased by a UV blocker foil absorbing the shortwave (<600 nm) emissions from the heating bulbs when melting the ice sample, while in the δD-CH4 device, the sample vessel is completely shielded from light (Sect. 2.2 and 2.3). Two NGRIP ice core samples were measured with the δ13C-CH4 device in the dark (“dark extraction”), showing the same amount of excess alkanes as the regular measurements during daylight. This indicates that light >600 nm has no influence on an in extractu reaction during our measurements.
We stress that although we can exclude a direct UV effect during melting, it is possible that UV irradiation during dust aerosol transport to Greenland and within the upper snow layer after deposition until the snow is buried into deeper layers may precondition organic precursors attached to dust to allow for alkane production to occur during the melt extraction. In particular, the first step of the reaction (excitation of the homolytic bond of a precursor compound) may start already in the atmosphere or in the snow where UV radiation is available. Within the ice sheet the reaction may be paused (“frozen reaction”), and the total reaction pathway is only completed during the melting process when liquid water is present.
Finally, we consider the role of reactive oxygen species in an abiotic production pathway. ROS are widely produced in metabolic pathways during biological activity but also during photochemical reactions with mineral oxides (Apel and Hirt, 2004; Messenger et al., 2009; Georgiou et al., 2015). Through their high oxidative potential, ROS can cleave functional groups from precursor compounds. Several studies have demonstrated this mechanism for the production of abiotic CH4 in soils and plant matter (McLeod et al., 2008; Messenger et al., 2009; Althoff et al., 2010, 2014; Jugold et al., 2012; Wang et al., 2011, 2013) and for other trace gases such as CO2, ethane, and ethylene from plant pectins (McLeod et al., 2008). UV radiation or thermal energy has no direct influence on the degradation process by the reaction with ROS; however, it might also be a stimulating factor and evoke further indirect reactions. For instance, UV radiation can lead to changes in plants which in turn lead to ROS generation (Liu et al., 2015). It was demonstrated that UV radiation induces the formation of organic photosensitizers or photo-catalysts which increase CH4 emissions from pectin (Messenger et al., 2009) and clay minerals. For example, the formation of hydroxyl radicals from montmorillonite and other clay minerals upon UV (and visible light) irradiation shows that clays might play a significant role in the oxidation of organic compounds on their surface (Katagi, 1990; Wu et al., 2008; Kibanova et al., 2011).
It has been proven that the species type and the overall amount of ROS available for or involved in a reaction has a significant effect on the amount of emissions through such a process (Jugold et al., 2012; Wang et al., 2013, 2017). For the production of methane (and ethane), hydrogen peroxide (H2O2) and hydroxyl radicals have been proven to be the prominent species (Messenger et al., 2009; Althoff et al., 2010; Wang et al., 2011, 2013; Jugold et al., 2012; McLeod et al., 2008). Such ROS could be already present in the snow and ice or being produced in the meltwater. For example, H2O2 can be unambiguously detected in Greenland Holocene ice using CFA; however, H2O2 in dusty glacial ice is mostly below the detection limit, likely due to oxidation reactions in the ice sheet or during melt extraction.
In summary, we believe that in our case of excess alkane production and/or release in the meltwater at low temperatures and without any UV irradiation, the ROS-induced mechanism appears possible. In experiments with plant pectin McLeod et al. (2008) observed not only CH4 but also ethane and found a methane-to-ethane production ratio of around 5, which is similar to our value of around 7. Accordingly, we see that an ROS-induced production pathway has the potential to explain excess alkanes in our samples; however, little is known about ROS chemistry in ice in particular for reactions with organic precursors, and more research is needed to understand the role of ROS in organic decomposition in ice. Another alternative to the two-stage reaction pathway with ROS would be a reaction catalyzed in the meltwater by dust-derived transition metals. This has been observed, for example, for the oxidation of SO2 in water-activated aerosol particles (Harris et al., 2013), but to our knowledge it has not been described in the literature for alkane production via organic precursors so far. Accordingly, we can only speculate on this pathway at the moment.
Another key parameter influencing all abiotic pathways might be the presence of liquid water or moisture. In experiments testing the hypothesis of non-microbial CH4 formation in different soil samples, it was demonstrated that adding water and/or moisture led to an up to 8-fold increase in CH4 emissions (Hurkuck et al., 2012; Jugold et al., 2012; Wang et al., 2013). It is hypothesized that the presence of liquid water or moisture (in addition to heating or UV radiation) stimulates the cleaving process of a functional group from the primary precursor and therefore increases the production of CH4. With respect to our observations on NGRIP and GRIP samples the presence of water seems to be a fundamental parameter influencing the second step of a frozen-reaction in extractu process, where the duration of water presence plays an important role.
A final piece of the puzzle of a possible abiotic methane production comes from our dual isotopic fingerprints of the excess CH4. As illustrated in Fig. 11b our δD-CH4(xs) signature lies well within the distribution of the hydrogen isotopic composition of CH4 produced from potential organic precursors. For δ13C our values lie outside and on the heavier side of the carbon isotope signature spectrum.
We conclude that despite our inability to pinpoint the exact organic precursors that lead to abiotic excess alkane production during the melt extraction of our ice samples, both the ratio of the excess alkanes as well as the isotopic signature of excess CH4 is generally in line with this pathway. Thus, without further contradicting evidence from targeted studies on organic precursors in ice core samples and their chemical degradation, we believe that the ROS-induced production pathway is, to date, the most likely explanation for the observed excess alkanes during extraction. However, we cannot completely rule out an adsorption–desorption process of thermogenic gas on dust particles.
The comparison of methane records from ice cores samples measured with different melt extraction techniques requires careful consideration and interpretation. Non-atmospheric methane contributions to the total methane concentration were discovered in specific Greenland ice core sections pointing to a process occurring during the wet extraction. To better assess this finding, we measured new records of [methane], [ethane], [propane], δD-CH4, and δ13C-CH4 on discrete NGRIP and GRIP ice core samples using two different wet-extraction systems. With our new data we confirm the production of CH4(xs) in the meltwater and quantify its dual isotopic signature. With the simultaneous detection of ethane and propane we discovered that these short-chain alkanes are co-produced in a fixed molar ratio pointing to a common production pathway. With our second extraction we constrained the temporal dynamics of this process, which occurs on the timescale of hours.
Based on our new experimental data we provide an improved assessment of potential mechanisms that could explain the observed variations in NGRIP and GRIP ice samples. A microbial CH4 production represents an obvious candidate, but regardless of whether this CH4 is produced in situ or in extractu, several lines of evidence gained from our measurements (low CH4 (C2H6 + C3H8) ratio, heavy δ13C-CH4(xs) signature) demonstrate that the fingerprint of the produced excess alkanes is unlikely of microbial origin. Also, an adsorption–desorption process of atmospheric or thermogenic CH4 on dust particles does not match many of our observations and is therefore unlikely. However, with the current knowledge we cannot definitely exclude such an adsorption of thermogenic gas as responsible for the observed excess alkane levels in our samples.
At present we favor explaining the formation of excess alkanes by the abiotic decomposition of organic precursors during prolonged wet extraction. Such an abiotic source for methane and other short-chain alkanes was discovered previously in other studies (Keppler et al., 2006; Vigano et al., 2008, 2009, 2010; Messenger et al., 2009; Hurkuck et al., 2012; Wang et al., 2013, and others listed above) using different organic samples, e.g., from plant or soil material; however, this process has not been connected to excess CH4 production during ice core analyses. This process matches many of our observations, and such a mechanism can be responsible for excess alkanes in Greenland ice core samples. To better assess a potential abiotic production process in ice analyses, the most important questions to solve in the future are the following: what are the specific precursor substances? Which parameters control an abiotic production during wet extractions? How does the fixed molar ratio between methane, ethane, and propane come about in this process? And finally, in which way is this excess alkane production causally related to the amount of mineral dust within the ice sample?
Identifying a specific reaction pathway that leads to the short-chain alkanes with their observed ratios would certainly benefit from identifying targeted organic precursor substances in the ice. However, detecting these postulated organic precursors in the ice core is inherently difficult as these compounds are very labile in water as our experiments demonstrated that after about 30 min only a fraction of these compounds remains in the meltwater, while the majority has already reacted to excess alkanes. Future studies may also focus on further isotope measurements (δ13C-CH4 and δD-CH4) including isotope labeling experiments providing an option to unambiguously detect methane produced during the measurement procedure in a commonly used wet-extraction technique and, again, to uncover potential reaction mechanisms for CH4(xs) production.
To better assess the viability of the alternative hypothesis of a release of previously adsorbed alkanes from dust particles (scenario A1 and A2) during the extraction, dust particles from the Taklimakan or Gobi Desert need to be tested to establish whether they contain relevant amounts of adsorbed alkanes that are released when in contact with liquid water. A second step could be to expose such dust samples to high levels of alkanes to mimic the adsorption process of natural gas seeps. It also needs to be shown that the adsorbed alkanes stay adsorbed on the dust particles for a prolonged time (months, ideally years) after exposing the particles to ambient air and that droplet and ice nucleation during aerosol transport does not lead to a loss of the previously adsorbed CH4. To quantify any isotopic fractionation involved with the ad- and desorption step, δ13C-CH4 and δD-CH4 analyses will be most valuable.
Finally, our studies clearly show that the published Greenland ice core CH4 record is biased high for selected (glacial, dust-rich) time intervals and needs to be corrected for the excess CH4 contribution. This is particularly important for studies of the IPD in CH4 and stable isotope ratios of methane. Methodological ways to remedy excess methane (and ethane and propane) in future measurements of atmospheric [CH4] from air trapped in ice cores could be to use continuous online CH4 measurements, which apparently avoid sizable CH4(xs) production. But dry-extraction methods and sublimation techniques for discrete samples, which are expected to avoid in extractu production by evading the melting phase, could also be used. Finally, our own δ13C-CH4 device, which allows us to measure δ13C-CH4 as well as methane, ethane, and propane concentrations from the same sample, can be used to correct the measured CH4 values making use of the co-production of the other two alkanes.
CH4(xs) needs to be corrected for when interpreting the already existing discrete CH4 records and its stable isotopes in dust-rich intervals in Greenland ice core samples. The impact of CH4(xs) on interpreting past atmospheric [CH4] will only slightly affect radiative forcing reconstructions; however, it will have a significant effect on the assessment of the global CH4 cycle and in particular on the hemispheric CH4 source distribution, which is based on the IPD. We observe that in some intervals, CH4(xs) is in the same range as the previously reconstructed IPD, implying that correcting for CH4(xs) will lower the IPD considerably and hence also lower the relative contribution of northern hemispheric sources at those times. We see that there is an urgent need to reliably revisit Greenland ice core CH4 records for the excess CH4 contribution. In future work we aim to establish an applicable correction for excess methane (CH4(xs), δ13C-CH4(xs), δD-CH4(xs)) in existing records using the co-production ratios of methane, ethane, and propane, the isotope mass balance of excess and atmospheric CH4 in ice core samples, and the overall correlation of excess CH4 with the mineral dust content in the ice.

Figure A1Detailed data overview for the neighboring NGRIP bags 3331 and 3332. Bag-specific overview of several parameters measured for each sample in this bag: methane, ethane, propane, Ca2+, mineral dust mass, TAC (total air content), and δ13C-CH4, indicated at the NGRIP depth (bottom axis) and the AICC2012 gas age (upper top axis) and the GICC05 ice age (lower top axis). The mineral dust record is taken from Ruth et al. (2003) and the Ca2+ record from Erhardt et al. (2022).

Figure A2Detailed data overview for NGRIP bag 3453. Bag-specific overview of parameters measured for each sample in this bag: methane, ethane, propane, Ca2+, mineral dust mass, TAC (total air content), and δ13C-CH4, indicated at the NGRIP depth (bottom axis) and the AICC2012 gas age (upper top axis) and the GICC05 ice age (lower top axis). The mineral dust record is taken from Ruth et al. (2003) and the Ca2+ record from Erhardt et al. (2022).
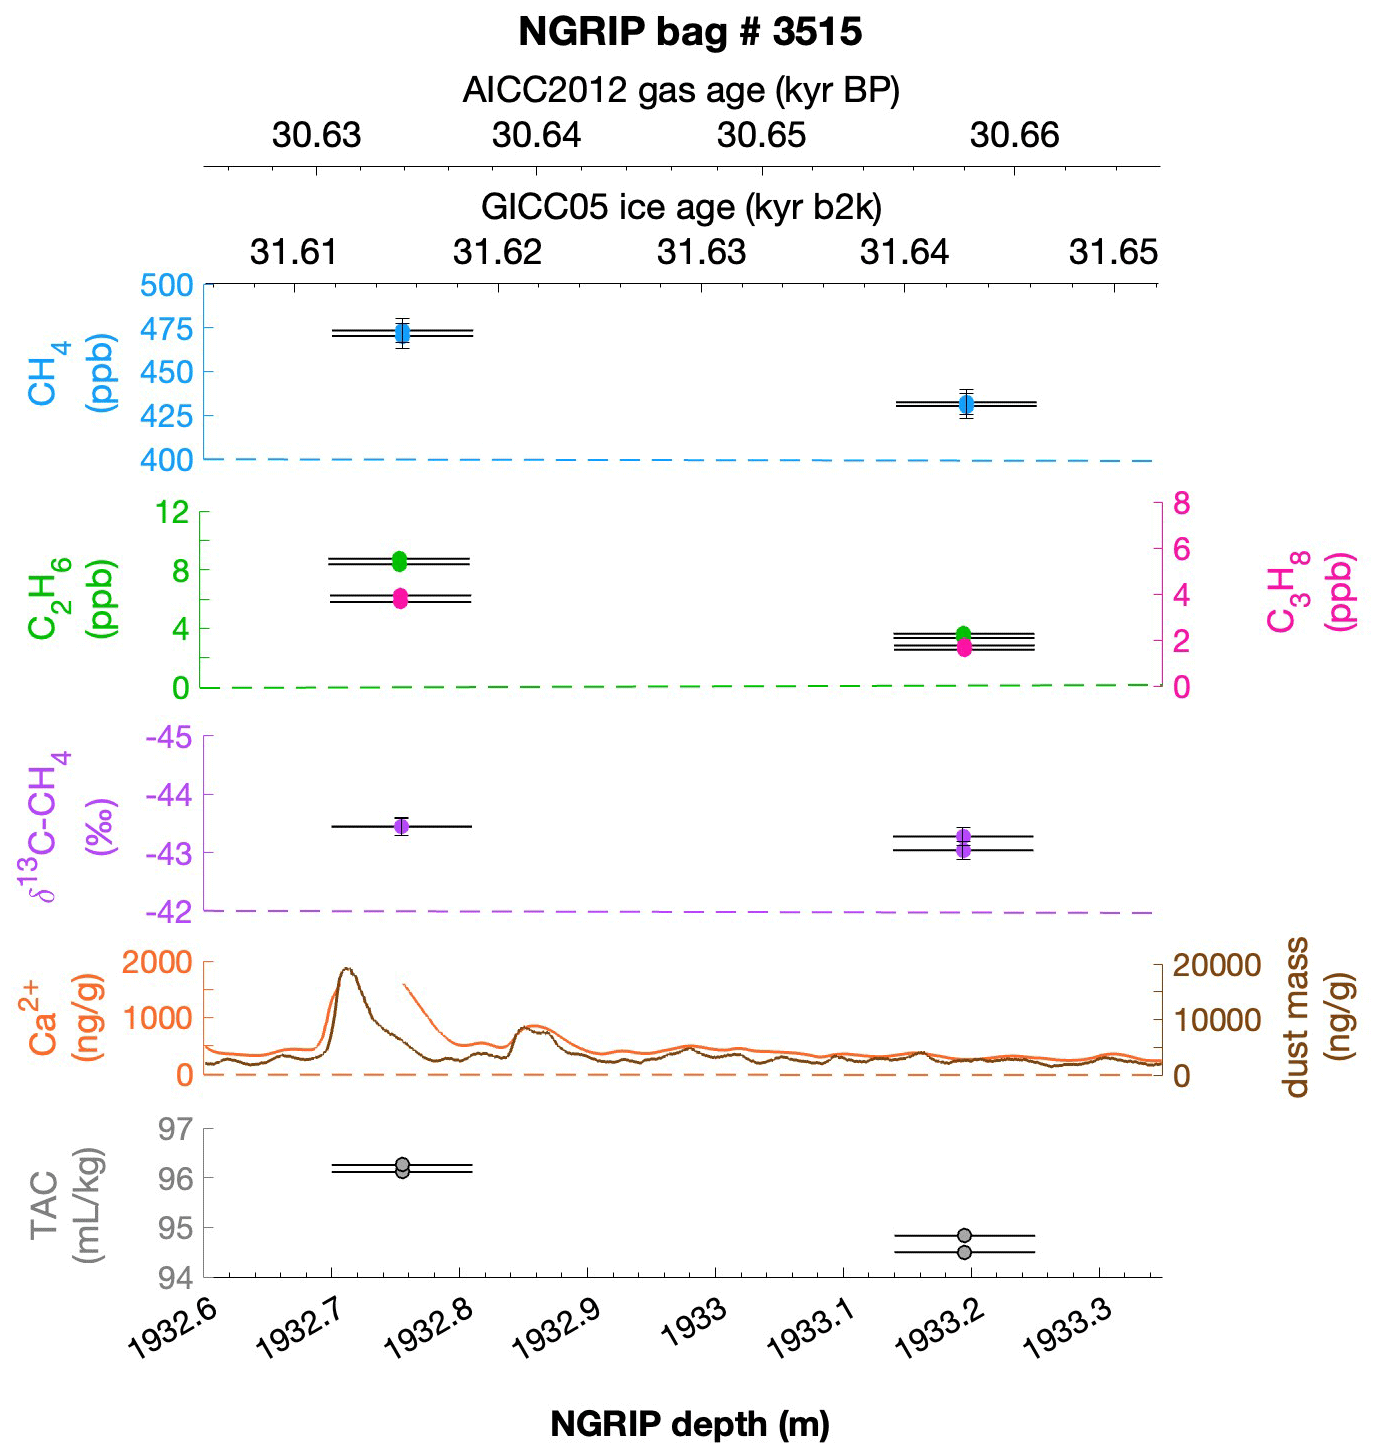
Figure A3Detailed data overview for NGRIP bag 3515. Bag-specific overview of parameters measured for each sample in this bag: methane, ethane, propane, Ca2+, mineral dust mass, TAC (total air content), and δ13C-CH4, indicated at the NGRIP depth (bottom axis) and the AICC2012 gas age (upper top axis) and the GICC05 ice age (lower top axis). The mineral dust record is taken from Ruth et al. (2003) and the Ca2+ record from Erhardt et al. (2022). Note that there is a gap in the Ca2+ record, which was corrected by a fill routine for the analysis of the two measured samples at this depth.
In this section we provide background information on how we determined the blank contributions for our alkane measurements for the different measurement modes. Overall, our strategy is similar to the measurements which were published earlier in 2014 (Schmitt et al., 2014). Here we include more measurements performed since then with our δ13C-CH4 device. Following the classic usage, blank contributions are related to the measurement device itself rather than to the sample; thus we report the measured values of the species as absolute amount in picomole with respect to a measurement procedure (sample run). To compare these absolute values with the classic units of species concentration in the air for an ice sample in parts per billion, Fig. B1 has secondary axes (gray) for the species concentrations in parts per billion for an assumed sample size of air of 14 mL STP (our typical ice core sample size).
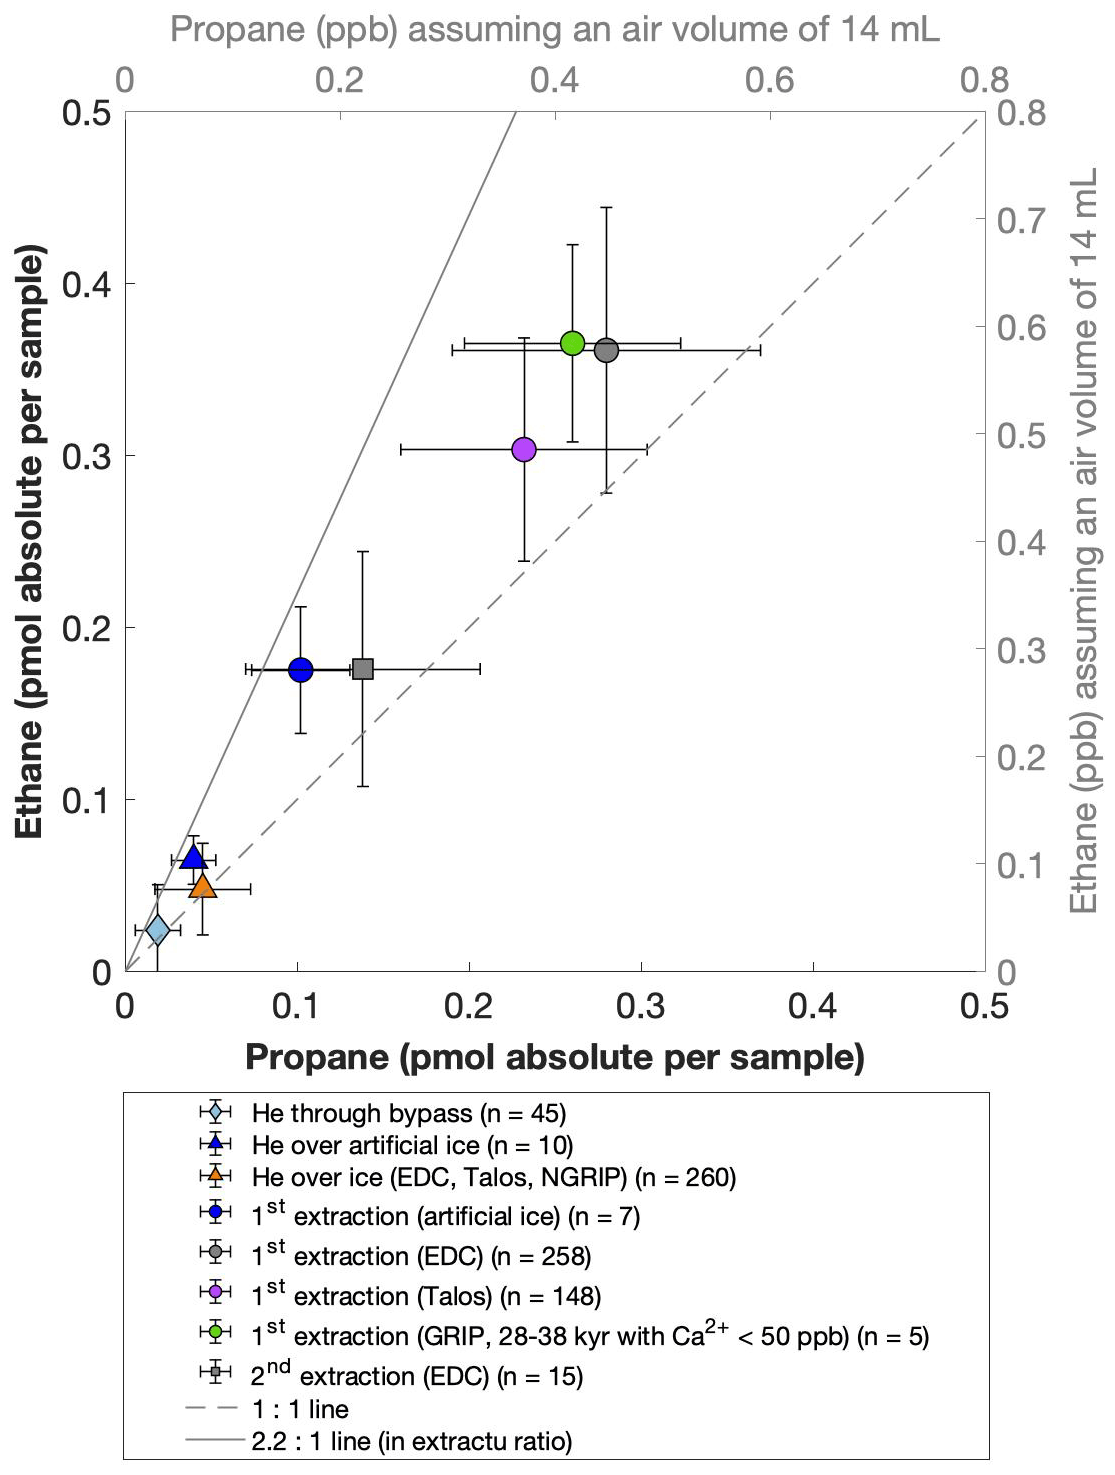
Figure B1Collection of different measurement modes and ice core sample locations to estimate individual blank contributions. The mode “He through bypass” (diamond) refers to a measurement type where helium is injected into our system but without flowing through our extraction vessel. “He over ice” (triangles) refers to helium injections over the unmelted ice core sample. Results from the first extraction are shown for different ice cores (artificial gas-free ice, Talos Dome, EDC, GRIP; colored circles). The second extraction of the Antarctic EDC ice core is marked as a gray square. Lines with ethane propane ratios are for orientation only.
Since our extraction device is at vacuum conditions, a blank contribution from leaks that allow ambient air with relatively high ethane and propane concentrations to be collected together with our sample seems the most straightforward risk. To quantify this leak contribution, we routinely perform so-called “He over ice” runs, where a helium flow is passed over the unmelted ice core sample and the species are trapped on the cold activated carbon trap (see details in Schmitt et al., 2014). The trapping duration is the same as for the first extraction; thus this He over ice run mimics the contribution for the first extraction. As can be seen in Fig. B1, for ethane this “leak contribution” is typically <0.1 ppb and is thus small compared to concentrations we see for dust-rich Greenland ice samples with about 6 ppb (see Fig. 5). However, this He over ice does not capture the actual melting process of the ice sample and represents the lowest blank boundary for our ice core samples. To mimic the full procedure an ice core samples experiences, we run a limited number of artificial gas-free ice samples (blue circles in Fig. B1). The ethane values obtained for these artificial ice sample is around 0.3 ppb and thus considerably higher than for the procedure without melting. This indicates that the presence of liquid water may lead to a desorption or production of alkanes from the inner walls of our extraction vessel. Alternatively, our artificial ice still contains traces of alkanes. So far, we could not solve this issue and more experiments are needed. A much larger data set on the upper boundary of the extraction blank comes from routine measurements of Antarctic ice core samples with the primary target of stable isotope analyses of CH4 and N2O. These Antarctic samples cover glacial and interglacial time intervals and the measured ethane values are typically around 0.55 ppb. Since the reconstructed atmospheric background for ethane in Antarctic ice is lower with values in the range of 0.1–0.15 ppb for the Late Holocene (Nicewonger et al., 2018), a realistic blank contribution for our first extraction is on the order of 0.4 to 0.5 ppb. An additional constraint comes from five stadial GRIP samples from the time interval 28–38 kyr (green circle in Fig. B1) that have very low Ca2+ content (<50 ppb) and thus likely have a negligible contribution from a dust-related in extractu component. The measured ethane concentration from these GRIP samples is very similar to the Antarctic ice core samples. One possible explanation would be that the atmospheric ethane concentration during the glacial was similar and low for both hemispheres. Regardless of the individual contributions, for our considerations of dust-related in extractu production in Greenland ice cores, the upper estimate for the sum of atmospheric background and blank contribution is about 0.55 ppb (about 0.35 pmol) for ethane. Since the ethane-to-propane ratio for these non-dust contributions is about 1.5, the corresponding propane values are lower by that value. Importantly, since the ethane-to-propane ratio for our dust-related production is, at 2.2, rather similar, its impact on the calculated ethane-to-propane ratio (e.g., Fig. 4) is very minor and small within the error estimate. For that reason, we did not correct our Greenland measurements for any blank contribution and showed the values as measured along with measurements of Antarctic ice cores samples which serve as first-order blank estimates.
The general equation to describe a first-order chemical reaction or exponential decay process (e.g., release of adsorbed gas from the adsorbent) is Eq. (C1):
with N0 being the total amount of substance (reactant) at the start of the reaction. N(t) equals the remaining amount of the reactant at time t, with t being time of reaction and τ the mean lifetime of the reaction. In our case, we cannot determine N(t) nor do we know N0, but we experimentally determined the cumulative amount of the product, Pcum(t), at three different times as our observable quantity. Thus, in Eq. (C2) we define Pcum(t) as the difference between N0 and N(t).
Replacing N(t) in Eq. (C1) with our definition in Eq. (C2), we obtain Eq. (C3), which contains two fit parameters, N0 and τ, as well as our observable parameter Pcum(t), i.e., the cumulative amount of alkane for a certain time step.
For the five GRIP samples we have three consecutive measurements each: the first, second, and third extraction. The time-dependent Pcum(t) values are as follows: is defined as 0, representing the state of the unmelted ice sample before liquid water is present. is the measured amount from the first extraction (ice extraction) minus the estimated contribution from the atmosphere and minus the blank contribution for the first extraction. is the sum of and the value from the second extraction minus the blank contribution of the second extraction. Similarly, is the sum of and the value from the third extraction minus the blank for the third extraction.
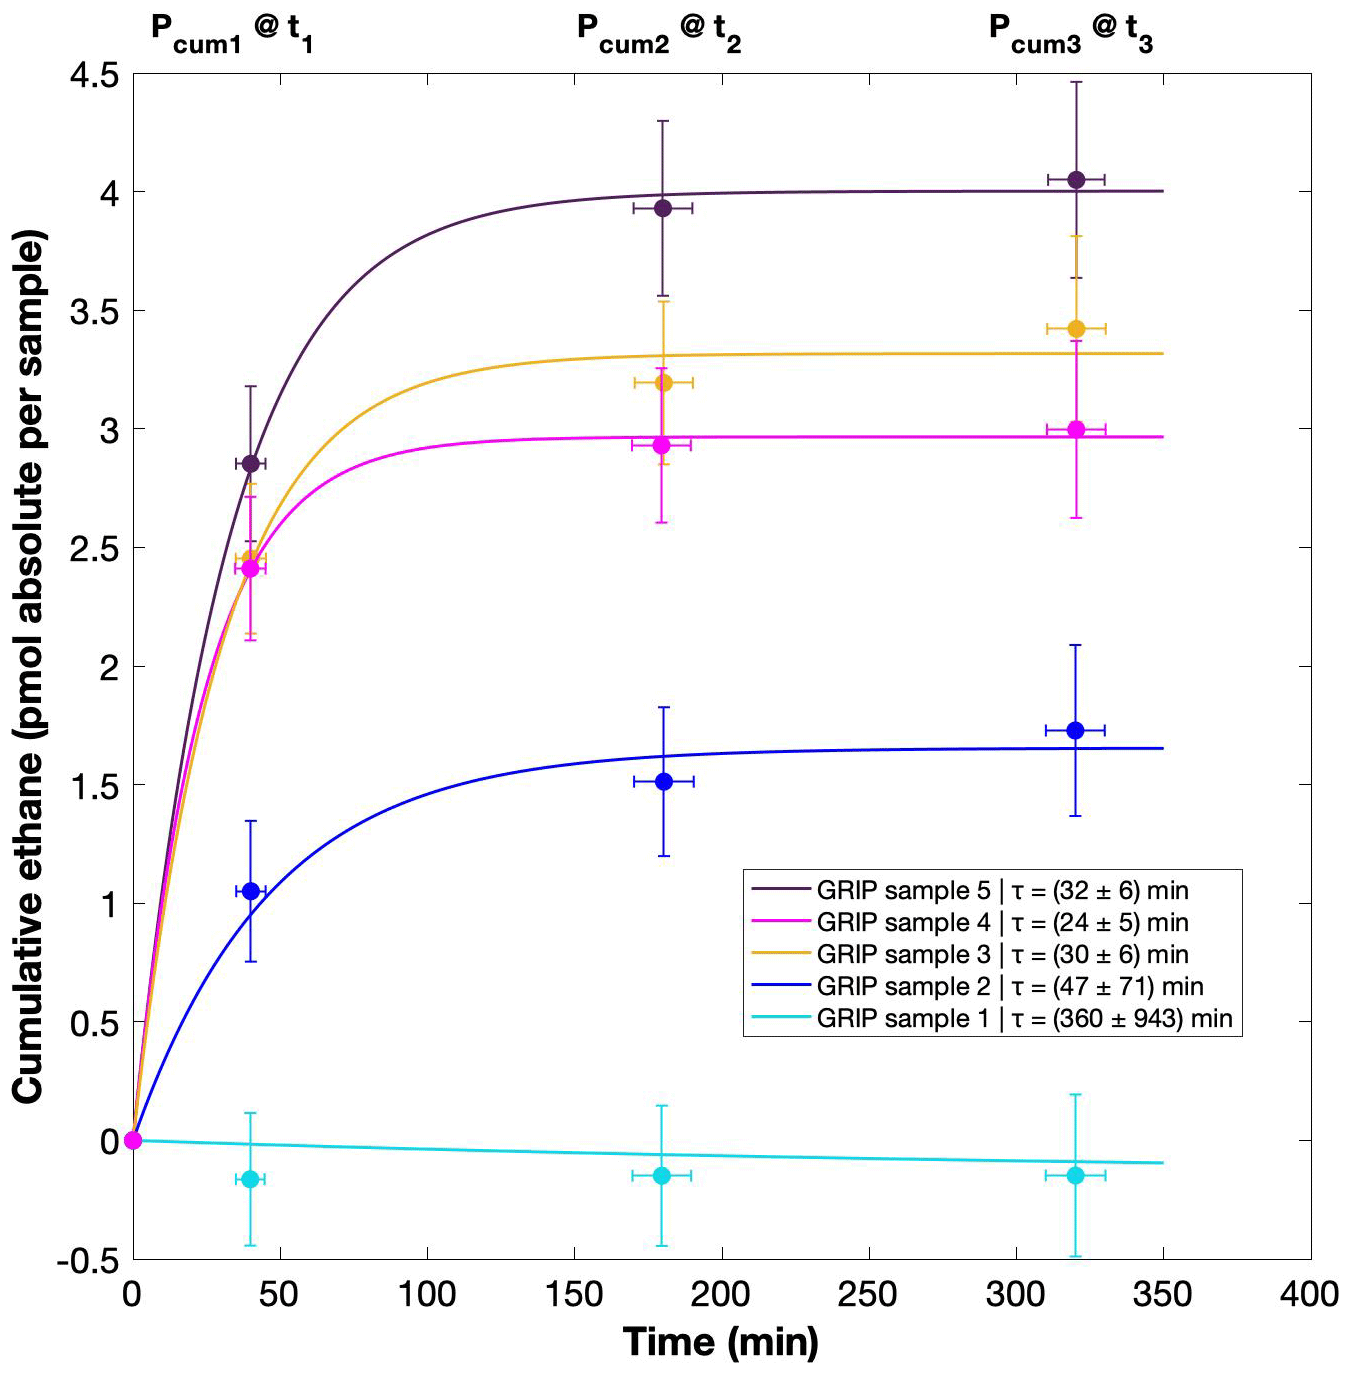
Figure C1Temporal dynamics of excess ethane production in GRIP ice core samples. Cumulative ethane amount from the first, second, and third extraction in relation to the time available for a potential reaction in the meltwater during each extraction. We assume a first-order reaction kinetic as a model for our observations where the mean half-life time (τ) and standard deviations are calculated for each GRIP sample from the compilation of all 1000 iterations of our Monte Carlo approach. The numbered samples can also be found in Fig. 7a.
To account for the uncertainties in the involved measurements and corrections, we added normally distributed errors to the following parameters (measured value ± 5 %; blank ± 20 %; atmospheric contribution ± 50 %), and we also assigned an uncertainty of 5 min to the time to account for variations in the melting speed of the ice and delays between the individual measurements (first, second, third).
For the fitting procedure we used the MATLAB built-in nonlinear least-squares solver called “lsqcurvefit” and performed 1000 runs where we varied the above-mentioned input parameters. The output of the function are the two fit parameters, i.e., N0 and τ. From the 1000 runs we calculated the mean and the 1σ standard deviation of the lifetime.
Note, this approach can only be suitably applied to ethane and propane as the past atmospheric contribution for these gases in the first extraction is typically small against the excess contribution for dust-rich samples. Of our five GRIP samples, where we have three consecutive extractions, four samples are considered “dust-rich” and are suitable for providing robust estimates for τ. In contrast, one sample is from an interstadial period with very low dust content and thus shows a negligible production of alkanes in all three extractions. While this sample is not suited to providing robust estimates for τ, it allows us to assess the first-order plausibility of the blank correction and the assumed atmospheric background for ethane for the first extraction (sample number 1, bottom-most sample). For a sample without any in extractu production, the cumulative curve should be flat at around 0, which is the case within our error estimates.
Data are provided on request to the authors.
The experimental approach was defined by JS, HF, and MM. MM and BS performed the measurements; MM and JS analyzed the data; MM wrote the paper draft with contributions by JS and HF; JL, JE, and EB provided input on excess methane production; TB provided ice samples for this study; all co-authors provided comments on the paper.
The contact author has declared that none of the authors has any competing interests.
Publisher's note: Copernicus Publications remains neutral with regard to jurisdictional claims in published maps and institutional affiliations.
This article is part of the special issue “Ice core science at the three poles (CP/TC inter-journal SI)”. It is not associated with a conference.
We thank Murat Aydin and the second reviewer for very helpful review comments. This work is a contribution to the NorthGRIP ice core project, which is directed and organized by the Department of Geophysics at the Niels Bohr Institute for Astronomy, Physics and Geophysics, University of Copenhagen. It is supported by funding agencies in Denmark (SNF), Belgium (FNRS-CFB), France (IFRTP and NSU/CNRS), Germany (AWI), Iceland (RannIs), Japan (MEXT), Sweden (SPRS), Switzerland (SNF), and the United States (NSF).
This research has been supported by the Schweizerischer Nationalfonds zur Förderung der Wissenschaftlichen Forschung (grant nos. 200020_172506 and 200020B_200328).
This paper was edited by Alexis Lamothe and reviewed by Murat Aydin and one anonymous referee.
Althoff, F., Jugold, A., and Keppler, F.: Methane formation by oxidation of ascorbic acid using iron minerals and hydrogen peroxide, Chemosphere, 80, 286–292, https://doi.org/10.1016/j.chemosphere.2010.04.004, 2010.
Althoff, F., Benzing, K., Comba, P., McRoberts, C., Boyd, D. R., Greiner, S., and Keppler, F.: Abiotic methanogenesis from organosulphur compounds under ambient conditions, Nat. Commun., 5, 4205, https://doi.org/10.1038/ncomms5205, 2014.
Anklin, M., Barnola, J.-M., Schwander, J., Stauffer, B., and Raynaud, D.: Processes affecting the CO2 concentrations measured in Greenland ice, Tellus, 47, 461–470, https://doi.org/10.1034/j.1600-0889.47.issue4.6.x, 1995.
Apel, K. and Hirt, H.: Reactive Oxygen Species: Metabolism, Oxidative Stress, and Signal Transduction, Annu. Rev. Plant Biol., 55, 373–399, https://doi.org/10.1146/annurev.arplant.55.031903.141701, 2004.
Austin, A. T., Méndez, M. S., and Ballaré, C. L.: Photodegradation alleviates the lignin bottleneck for carbon turnover in terrestrial ecosystems, P. Natl. Acad. Sci. USA, 13, 4392–4397, https://doi.org/10.1073/pnas.1516157113, 2016.
Baumgartner, M., Schilt, A., Eicher, O., Schmitt, J., Schwander, J., Spahni, R., Fischer, H., and Stocker, T. F.: High-resolution interpolar difference of atmospheric methane around the Last Glacial Maximum, Biogeosciences, 9, 3961–3977, https://doi.org/10.5194/bg-9-3961-2012, 2012.
Baumgartner, M., Kindler, P., Eicher, O., Floch, G., Schilt, A., Schwander, J., Spahni, R., Capron, E., Chappellaz, J., Leuenberger, M., Fischer, H., and Stocker, T. F.: NGRIP CH4 concentration from 120 to 10 kyr before present and its relation to a δ15N temperature reconstruction from the same ice core, Clim. Past, 10, 903–920, https://doi.org/10.5194/cp-10-903-2014, 2014.
Beck, J., Bock, M., Schmitt, J., Seth, B., Blunier, T., and Fischer, H.: Bipolar carbon and hydrogen isotope constraints on the Holocene methane budget, Biogeosciences, 15, 7155–7175, https://doi.org/10.5194/bg-15-7155-2018, 2018.
Bernard, B., Brooks, J. M., and Sackett, W. M.: A geochemical model for characterization of hydrocarbon gas sources in marine sediments, in: 9th Annual Offshore Technology Conference, May 1977, Houston, Texas, 435–438, OTC 2934, https://doi.org/10.4043/2934-MS, 1977.
Biscaye, P. E., Grousset, F. E., Revel, M., Van der Gaast, S., Zielinski, G. A., Vaars, A., and Kukla, G.: Asian provenance of Glacial dust (stage 2) in the Greenland Ice Sheet Project 2 Ice Core, Summit, Greenland, J. Geophys. Res., 102, 26765–26781, 1997.
Bock, M., Schmitt, J., Behrens, M., Möller, L., Schneider, R., Sapart, C., and Fischer, H.: A gas chromatography/pyrolysis/isotope ratio mass spectrometry system for high-precision dD measurements of atmospheric methane extracted from ice cores, Rapid Commun. Mass Spectrom., 24, 621–633, https://doi.org/10.1002/rcm.4429, 2010a.
Bock, M., Schmitt, J., Blunier, T., Fischer, H., Möller, L., and Spahni, R.: Hydrogen Isotopes Preclude Marine Hydrate CH4 Emissions at the Onset of Dansgaard–Oeschger Events, Science, 328, 1686–1689, https://doi.org/10.1126/science.1187651, 2010b.
Bock, M., Schmitt, J., Beck, J., Schneider, R., and Fischer, H.: Improving accuracy and precision of ice core δD(CH4) analyses using methane pre-pyrolysis and hydrogen post-pyrolysis trapping and subsequent chromatographic separation, Atmos. Meas. Tech., 7, 1999–2012, https://doi.org/10.5194/amt-7-1999-2014, 2014.
Bock, M., Schmitt, J., Beck, J., Seth, B., Chappellaz, J., and Fischer, H.: Glacial/ interglacial wetland, biomass burning, and geologic methane emissions constrained by dual stable isotopic CH4 ice core records, P. Natl. Acad. Sci. USA, 114, E5778–E5786, https://doi.org/10.1073/pnas.1613883114, 2017.
Bruhn, D., Mikkelsen, T. N., Øbro, J., Willats, W. G. T., and Ambus, P.: Effects of temperature, ultraviolet radiation and pectin methyl esterase on aerobic methane release from plant material, Plant Biol., 11, 43–48, https://doi.org/10.1111/j.1438-8677.2009.00202.x, 2009.
Chappellaz, J., Blunier, T., Kints, S., Dällenbach, A., Barnola, J. M., Schwander, J., Raynaud, D., and Stauffer, B.: Changes in the atmospheric CH4 gradient between Greenland and Antarctica during the Holocene, Geophys. Res. Let., 102, 15987–15997, https://doi.org/10.1029/97JD01017, 1997.
Cheng, A.-L. and Huang, W.-L.: Selective adsorption of hydrocarbon gases on clays and organic matter, Org. Geochem., 35, 413–423, https://doi.org/10.1016/j.orggeochem.2004.01.007, 2004.
Dan, J., Kumai, T., Sugimoto, A., and Murase, J.: Biotic and abiotic methane releases from Lake Biwa sediment slurry, Limnology, 5, 149–154, https://doi.org/10.1007/s10201-004-0124-7, 2004.
Derendorp, L., Holzinger, R., Wishkerman, A., Keppler, F., and Röckmann, T.: VOC emissions from dry leaf litter and their dependence on temperature, Biogeosciences Discuss., 7, 823–854, https://doi.org/10.5194/bgd-7-823-2010, 2010.
Derendorp, L., Holzinger, R., Wishkerman, A., Keppler, F., and Röckmann, T.: Methyl chloride and C2–C5 hydrocarbon emissions from dry leaf litter and their dependence on temperature, Atmos. Environ., 45, 3112–3119, https://doi.org/10.1016/j.atmosenv.2011.03.016, 2011.
Dumelin, E. E. and Tappel, A. L.: Hydrocarbon gases produced during in vitro peroxidation of polyunsaturated fatty acids and decomposition of preformed hydroperoxides, Lipids, 12, 894, https://doi.org/10.1007/BF02533308, 1977.
Dyonisius, M. N., Petrenko, V. V., Smith, A. M., Hua, Q., Yang, B., Schmitt, J., Beck, J., Seth, B., Bock, M., Hmiel, B., Vimont, I., Menking, J. A., Shackleton, S. A., Baggenstos, D., Bauska, T. K., Rhodes, R., Sperlich, P., Beaudette, R., Harth, C., Kalk, M., Brook, E. J., Fischer, H., Severinghaus, J. P., and Weiss, R. F.: Old carbon reservoirs were not important in the deglacial methane budget, Science, 367, 907–910, https://doi.org/10.1126/science.aax0504, 2020.
Erhardt, T., Bigler, M., Federer, U., Gfeller, G., Leuenberger, D., Stowasser, O., Röthlisberger, R., Schüpbach, S., Ruth, U., Twarloh, B., Wegner, A., Goto-Azuma, K., Kuramoto, T., Kjær, H. A., Vallelonga, P. T., Siggaard-Andersen, M.-L., Hansson, M. E., Benton, A. K., Fleet, L. G., Mulvaney, R., Thomas, E. R., Abram, N., Stocker, T. F., and Fischer, H.: High-resolution aerosol concentration data from the Greenland NorthGRIP and NEEM deep ice cores, Earth Syst. Sci. Data, 14, 1215–1231, https://doi.org/10.5194/essd-14-1215-2022, 2022.
Etiope, G. and Klusman, R. W.: Geologic emissions of methane to the atmosphere, Chemosphere, 49, 8, 777–789, https://doi.org/10.1016/S0045-6535(02)00380-6, 2002.
Etiope, G., Lassey, K. R., Klusman, R. W., and Boschi, E.: Reappraisal of the fossil methane budget and related emission from geologic sources, Geophys. Res. Lett., 35, L09307, https://doi.org/10.1029/2008GL033623, 2008.
Fuhrer, K. and Legrand, M.: Continental biogenic species in the Greenland Ice Core Project ice core: Tracing back the biomass history of the North American continent, J. Geophys. Res., 102, 26735–26745, https://doi.org/10.1029/97JC01299, 1997.
Georgiou, C. D., Sun, H. J., McKay, C. P., Grintzalis, K., Papapostolou, I., Zisimopoulos, D., Panagiotidis, K., Zhang, G., Koutsopoulou, E., Christidis, G. E., and Margiolaki, I.: Evidence for photochemical production of reactive oxygen species in desert soils, Nat. Commun., 6, 7100, https://doi.org/10.1038/ncomms8100, 2015.
Giorio, C., Kehrwald, N., Barbante, C., Kalberer, M., King, A. C. F., Thomas, E. R., Wolff, E. W., and Zennaro, P.: Prospects for reconstructing paleoenvironmental conditions from organic compounds in polar snow and ice, Quaternary Sci. Rev., 183, 1–22, https://doi.org/10.1016/j.quascirev.2018.01.007, 2018.
Guo, Q., Chang, S. X., Wang, Z.-P., Feng, J.-C., Chen, Q.-S., and Han, X.-G.: Microbial versus non-microbial methane releases from fresh soils at different temperatures, Geoderma, 284, 178–184, https://doi.org/10.1016/j.geoderma.2016.08.027, 2016.
Han, C., Do Hur, S., Han, Y., Lee, K., Hong, S., Erhard, T., Fischer, H., Svensson, A. M., Steffensen, J. P., and Vallelonga, P.: High-resolution isotopic evidence for a potential Saharan provenance of Greenland glacial dust, Sci. Rep., 8, 15582, https://doi.org/10.1038/s41598-018-33859-0, 2018.
Harris, E., Sinha, B., van Pinxteren, D., Tilgner, A., Wadinga Fomba, K., Schneider, J., Roth, A., Gnauk, T., Fahlbusch, B., Mertes, S., Lee, T., Collett, J., Foley, S., Borrmann, S., Hoppe, P., and Herrmann, H.: Enhanced Role of Transition Metal Ion Catalysis During In-Cloud Oxidation of SO2, Science, 340, 727–730, https://doi.org/10.1126/science.1230911, 2013.
Helmig, D., Petrenko, V., Martinerie, P., Witrant, E., Röckmann, T., Zuiderweg, A., Holzinger, R., Hueber, J., Thompson, C., White, J. W. C., Sturges, W., Baker, A., Blunier, T., Etheridge, D., Rubino, M., and Tans, P.: Reconstruction of Northern Hemisphere 1950–2010 atmospheric non-methane hydrocarbons, Atmos. Chem. Phys., 14, 1463–1483, https://doi.org/10.5194/acp-14-1463-2014, 2014.
Hoheisel, A., Yeman, C., Dinger, F., Eckhardt, H., and Schmidt, M.: An improved method for mobile characterisation of δ13CH4 source signatures and its application in Germany, Atmos. Meas. Tech., 12, 1123–1139, https://doi.org/10.5194/amt-12-1123-2019, 2019.
Hurkuck, M., Althoff, F., Jungkunst, H. F., Jugold, A., and Keppler, F.: Release of methane from aerobic soil: An indication of a novel chemical natural process?, Chemosphere, 86, 684–689, https://doi.org/10.1016/j.chemosphere.2011.11.024, 2012.
Ji, L., Zhang, T., Milliken, K. L., Qu, J., and Zhang, X.: Experimental investigation of main controls to methane adsorption in clay-rich rocks, Appl. Geochem., 27, 2533–2545, https://doi.org/10.1016/j.apgeochem.2012.08.027, 2012.
John, W. W. and Curtis, R. W.: Isolation and Identification of the Precursor of Ethane in Phaseolus vulgaris L., Plant Physiol., 59, 521–522, https://doi.org/10.1104/pp.59.3.521, 1977.
Jugold, A., Althoff, F., Hurkuck, M., Greule, M., Lenhart, K., Lelieveld, J., and Keppler, F.: Non-microbial methane formation in oxic soils, Biogeosciences, 9, 5291–5301, https://doi.org/10.5194/bg-9-5291-2012, 2012.
Katagi, T.: Photoinduced Oxidation of the organophosphorus Fungicide Tolclofs-methyl on Clay Minerals, J. Agric. Food Chem., 38, 1595–1600, 1990.
Kaufmann, P. R., Federer, U., Hutterli, M. A., Bigler, M., Schüpbach, S., Ruth, U., Schmitt, J., and Stocker, T. F.: An Improved Continuous Flow Analysis System for High-Resolution Field Measurements on Ice Cores, Environ. Sci. Technol., 42, 8044–8050, https://doi.org/10.1021/es8007722, 2008.
Keeling, C. D.: The concentration and isotopic abundance of carbon dioxide in rural areas, Geochim. Cosmochim. Ac., 13, 322–334, https://doi.org/10.1016/0016-7037(58)90033-4, 1958.
Keeling, C. D.: The concentration and isotopic abundance of carbon dioxide in rural and marine air, Geochim. Cosmochim. Ac., 24, 277–298, https://doi.org/10.1016/0016-7037(61)90023-0, 1961.
Keppler, F., Hamilton, J. T. G., Braß, M., and Röckmann, T.: Methane emissions from terrestrial plants under aerobic conditions, Nature, 439, 187–191, https://doi.org/10.1038/nature04420, 2006.
Keppler, F., Hamilton, J. T. G., McRoberts, W. C., Vigano, I., Braß, M., and Röckmann, T.: Methoxyl groups of plant pectin as a precursor of atmospheric methane: evidence from deuterium labelling studies, New Phytol., 178, 808–814, https://doi.org/10.1111/j.1469-8137.2008.02411.x, 2008.
Kibanova, D., Trejo, M., Destaillats, H., and Cervini-Silva, J.: Photocatalytic activity of kaolinite, Catalys. Commun., 12, 698–702, https://doi.org/10.1016/j.catcom.2010.10.029, 2011.
Köhler, P., Fischer, H., Schmitt, J., and Munhoven, G.: On the application and interpretation of Keeling plots in paleo climate research – deciphering δ13C of atmospheric CO2 measured in ice cores, Biogeosciences, 3, 539–556, https://doi.org/10.5194/bg-3-539-2006, 2006.
Lee, L. E., Edwards, J. S., Schmitt, J., Fischer, H., Bock, M., and Brook, E. J.: Excess methane in Greenland ice cores associated with high dust concentrations, Geochim. Cosmochim. Ac., 270, 409–430, https://doi.org/10.1016/j.gca.2019.11.020, 2020.
Legrand, M. and Delmas, R.: Soluble Impurities in Four Antarctic Ice Cores Over the Last 30 000 Years, Ann. Glaciol., 10, 116–120, https://doi.org/10.3189/S0260305500004274, 1988.
Liu, D., Yuan, P., Liu, H., Li, T., Tan, D., Yuan, W., and He, H.: High-pressure adsorption of methane on montmorillonite, kaolinite and illite, Appl. Clay Sci., 85, 25–30, https://doi.org/10.1016/j.clay.2013.09.009, 2013.
Liu, J., Chen, H., Zhu, Q., Shen, Y., Wang, X., Wang, M., and Peng, C.: A novel pathway of direct methane production and emission by eukaryotes including plants, animals and fungi: An overview, Atmos. Environ., 115, 26–35, https://doi.org/10.1016/j.atmosenv.2015.05.019, 2015.
Lupker, M., Aciego, S. M., Bourdon, B., Schwander, J., and Stocker, T. F.: Isotopic tracing (Sr, Nd, U and Hf) of continental and marine aerosols in an 18th century section of the Dye-3 ice core (Greenland), Earth Planet. Sc. Lett., 295, 277–286, https://doi.org/10.1016/j.epsl.2010.04.010, 2010.
McLeod, A. R., Newsham, K. K., and Fry, S. C.: Elevated UV-B radiation modifies the extractability of carbohydrates from leaf litter of Quercus robur, Soil Biol. Biochem., 39, 116–126, https://doi.org/10.1016/j.soilbio.2006.06.019, 2007.
McLeod, A. R., Fry, S. C., Loake, G. J., Messenger, D. J., Reay, D. S., Smith, K. A., and Yun, B.-W.: Ultraviolet radiation drives methane emissions from terrestrial plant pectins, New Phytol., 180, 124–132, https://doi.org/10.1111/j.1469-8137.2008.02571.x, 2008.
Messenger, D. J., McLeod, A. R., and Fry, S. C.: The role of ultraviolet radiation, photosensitizers, reactive oxygen species and ester groups in mechanisms of methane formation from pectin, Plant Cell Environ., 32, 1–9, https://doi.org/10.1111/j.1365-3040.2008.01892.x, 2009.
Milkov, A. V. and Etiope, G.: Revised genetic diagrams for natural gases based on a global dataset of samples, Org. Geochem., 125, 109–120, https://doi.org/10.1016/j.orggeochem.2018.09.002, 2018.
Mohnen, D.: Pectin structure and biosynthesis, Curr. Opin. Plant Biol., 11, 266–277, https://doi.org/10.1016/j.pbi.2008.03.006, 2008.
Nicewonger, M. R., Verhulst, K. R., Aydin, M., and Saltzman, E. S.: Preindustrial atmospheric ethane levels inferred from polar ice cores: A constraint on the geologic sources of atmospheric ethane and methane, Geophys. Res. Lett., 43, 214–221, https://doi.org/10.1002/2015GL066854, 2016.
Nicewonger, M. R., Aydin, M., Prather, M. J., and Saltzman, E. S.: Large changes in biomass burning over the last millennium inferred from paleoatmospheric ethane in polar ice cores, P. Natl. Acad. Sci. USA, 115, 12413–12418, https://doi.org/10.1073/pnas.1807172115, 2018.
North Greenland Ice Core Project members: High-resolution record of Northern Hemisphere climate extending into the last interglacial period, Nature, 431, 147–151, https://doi.org/10.1038/nature02805, 2004.
Pires, J., Bestilleiro, M., Pinto, M., and Gil, A.: Selective adsorption of carbon dioxide, methane and ethane by porous clays heterostructures, Separat. Purific. Technol., 61, 161–167, https://doi.org/10.1016/j.seppur.2007.10.007, 2008.
Rhodes, R. H., Faïn, X., Stowasser, C., Blunier, T., Chappellaz, C., McConnell, J. R., Romanini, D., Mitchell, L. E., and Brook, E. J.: Continuous methane measurements from a late Holocene Greenland ice core: Atmospheric and in situ signals, Earth Planet. Sc. Lett., 368, 9–19, https://doi.org/10.1016/j.epsl.2013.02.034, 2013.
Rhodes, R. H., Faïn, X., Brook, E. J., McConnell, J. R., Maselli, O. J., Sigl, M., Edwards, J., Buizert, C., Blunier, T., Chappellaz, J., and Freitag, J.: Local artifacts in ice core methane records caused by layered bubble trapping and in situ production: a multi-site investigation, Clim. Past, 12, 1061–1077, https://doi.org/10.5194/cp-12-1061-2016, 2016.
Ross, D. J. K. and Bustin, R. M.: The importance of shale composition and pore structure upon gas storage potential of shale gas reservoirs, Mar. Petrol. Geol., 26, 916–927, https://doi.org/10.1016/j.marpetgeo.2008.06.004, 2009.
Ruth, U., Wagenbach, D., Steffensen, J. P., and Bigler, M.: Continuous record of microparticle concentration and size distribution in the central Greenland NGRIP ice core during the last glacial period, J. Geophys. Res., 108, 4098, https://doi.org/10.1029/2002JD002376, 2003.
Ruth, U., Bigler, M., Röthlisberger, R., Siggaard-Andersen, M.-L., Kipfstuhl, S., Goto-Azuma, K., Hansson, M. E., Johnsen, S. J., Lu, H., and Steffensen, J. P.: Ice core evidence for a very tight link between North Atlantic and east Asian glacial climate, Geophys. Res. Lett., 34, L03706, https://doi.org/10.1029/2006GL027876, 2007.
Schade, G. W., Hofmann, R.-M., and Crutzen, P. J.: CO emissions from degrading plant matter, Tellus B, 51, 889–908, https://doi.org/10.3402/tellusb.v51i5.16501, 1999.
Schilt, A., Baumgartner, M., Blunier, T., Schwander, J., Spahni, R., Fischer, H., and Stocker, T. F.: Glacial–interglacial and millennial-scale variations in the atmospheric nitrous oxide concentration during the last 800,000 years, Quaternary Sci. Rev., 29, 182–192, https://doi.org/10.1016/j.quascirev.2009.03.011, 2010.
Schmitt, J., Seth, B., Bock, M., and Fischer, H.: Online technique for isotope and mixing ratios of CH4, N2O, Xe and mixing ratios of organic trace gases on a single ice core sample, Atmos. Meas. Tech., 7, 2645–2665, https://doi.org/10.5194/amt-7-2645-2014, 2014.
Smith, H. J., Wahlen, M., Mastroianni, D., and Taylor, K. C.: The CO2 concentration of air trapped in GISP2 ice from the Last Glacial Maximum-Holocene transition, Geophys. Res. Lett., 24, 1–4, https://doi.org/10.1029/96GL03700, 1997.
Sugimoto, A., Dan, J., Kumai, T., and Murase, J.: Adsorption as a methane storage process in natural lake sediment, Geophys. Res. Lett. 30, 2080, https://doi.org/10.1029/2003GL018162, 2003.
Svensson, A., Biscaye, P. E., and Grousset, F. E.: Characterization of late glacial continental dust in the Greenland Ice Core Project ice core, J. Geophys. Res.-Atmos., 105, 4637–4656, https://doi.org/10.1029/1999JD901093, 2000.
Tian, Y., Yan, C., and Jin, Z.: Characterization of Methane Excess and Absolute Adsorption in Various Clay Nanopores from Molecular Simulation, Sci. Rep., 7, 12040, https://doi.org/10.1038/s41598-017-12123-x, 2017.
Vigano, I., van Weelden, H., Holzinger, R., Keppler, F., McLeod, A., and Röckmann, T.: Effect of UV radiation and temperature on the emission of methane from plant biomass and structural components, Biogeosciences, 5, 937–947, https://doi.org/10.5194/bg-5-937-2008, 2008.
Vigano, I., Röckmann, T., Holzinger, R., van Dijk, A., Keppler, F., Greule, M., Brand, W. A., Geilmann, H., and van Weelden, H.: The stable isotope signature of methane emitted from plant material under UV irradiation, Atmos. Environ., 43, 5637–5646, https://doi.org/10.1016/j.atmosenv.2009.07.046, 2009.
Vigano, I., Holzinger, R., Keppler, F., Greule, M., Brand, W. A., Geilmann, H., van Weelden, H., and Röckmann, T.: Water drives the deuterium content of the methane emitted from plants, Geochim. Cosmochim. Ac.,74, 3865–3873, https://doi.org/10.1016/j.gca.2010.03.030, 2010.
Wang, B., Hou, L., Liu, W., and Wang, Z.: Non-microbial methane emissions from soils, Atmos. Environ., 80, 290–298, https://doi.org/10.1016/j.atmosenv.2013.08.010, 2013.
Wang, B., Lerdau, M., and He, Y.: Widespread production of nonmicrobial greenhouse gases in soils, Global Change Biol., 23, 4472–4482, https://doi.org/10.1111/gcb.13753, 2017.
Wang, Z.-P., Han, X.-G., Wang, G. G., Song, Y., and Gulledge, J.: Aerobic methane emission from plants in the Inner Mongolia steppe, Environ. Sci. Technol., 42, 62–68, https://doi.org/10.1021/es071224l, 2008.
Wang, Z.-P., Xie, Z.-Q., Zhang, B.-C., Hou, L.-Y., Zhou, Y.-H., Li, L.-H., and Han, X.-G.: Aerobic and Anaerobic Nonmicrobial Methane Emissions from Plant Material, Environ. Sci. Technol., 45, 9531–9537, https://doi.org/10.1021/es2020132, 2011.
Watanabe, M., Watanabe, Y., Kim, Y. S., and Koike, T.: Dark aerobic methane emission associated to leaf factors of two Acacia and five Eucalyptus species, Atmos. Environ., 54, 277–281, https://doi.org/10.1016/j.atmosenv.2012.02.012, 2012.
Wehr, R. and Saleska, S. R.: The long-solved problem of the best-fit straight line: application to isotopic mixing lines, Biogeosciences, 14, 17–29, https://doi.org/10.5194/bg-14-17-2017, 2017.
Wu, F., Li, J., Peng, Z., and Deng, N.: Photochemical formation of hydroxyl radicals catalyzed by montmorillonite, Chemosphere, 72, 407–413, https://doi.org/10.1016/j.chemosphere.2008.02.034, 2008.
York, D.: Least squares fitting of a straight line with correlated errors, Earth Planet. Sc. Lett., 5, 320–324, https://doi.org/10.1016/S0012-821X(68)80059-7, 1968.
York, D., Evensen, N. M., Martínez, M. L., and De Basabe Delgado, J.: Unified equations for the slope, intercept, and standard errors of the best straight line, Am. J. Phys., 72, 367–375, https://doi.org/10.1119/1.1632486, 2004.
- Abstract
- Introduction
- Ice core samples and measurements
- Characterization of excess alkanes in ice cores
- Testing the hypotheses explaining excess alkanes
- Conclusions and outlook
- Appendix A
- Appendix B
- Appendix C
- Data availability
- Author contributions
- Competing interests
- Disclaimer
- Special issue statement
- Acknowledgements
- Financial support
- Review statement
- References