the Creative Commons Attribution 4.0 License.
the Creative Commons Attribution 4.0 License.
 | 04 May 2023
Atlantic circulation changes across a stadial–interstadial transition
Claire Waelbroeck
Jerry Tjiputra
Chuncheng Guo
Kerim H. Nisancioglu
Eystein Jansen
Natalia Vázquez Riveiros
Samuel Toucanne
Frédérique Eynaud
Linda Rossignol
Fabien Dewilde
Elodie Marchès
Susana Lebreiro
Silvia Nave
We combine consistently dated benthic carbon isotopic records distributed over the entire Atlantic Ocean with numerical simulations performed by a glacial configuration of the Norwegian Earth System Model with active ocean biogeochemistry in order to interpret the observed Cibicides δ13C changes at the stadial–interstadial transition corresponding to the end of Heinrich Stadial 4 (HS4) in terms of ocean circulation and remineralization changes. We show that the marked increase in Cibicides δ13C observed at the end of HS4 between ∼2000 and 4200 m in the Atlantic can be explained by changes in nutrient concentrations as simulated by the model in response to the halting of freshwater input in the high-latitude glacial North Atlantic. Our model results show that this Cibicides δ13C signal is associated with changes in the ratio of southern-sourced (SSW) versus northern-sourced (NSW) water masses at the core sites, whereby SSW is replaced by NSW as a consequence of the resumption of deep-water formation in the northern North Atlantic and Nordic Seas after the freshwater input is halted. Our results further suggest that the contribution of ocean circulation changes to this signal increases from ∼40 % at 2000 m to ∼80 % at 4000 m. Below ∼4200 m, the model shows little ocean circulation change but an increase in remineralization across the transition marking the end of HS4. The simulated lower remineralization during stadials compared to during interstadials is particularly pronounced in deep subantarctic sites, in agreement with the decrease in the export production of carbon to the deep Southern Ocean during stadials found in previous studies.
- Article
(3566 KB) - Full-text XML
-
Supplement
(5779 KB) - BibTeX
- EndNote


During the last glacial period, surface temperatures above Greenland and in the North Atlantic region shifted between cold (stadial) and warm (interstadial) phases. Previous studies have shown that these rapid changes in surface climatic conditions were accompanied by rapid changes in ocean circulation characterized by reduced Atlantic meridional overturning circulation (AMOC) during stadials (Vidal et al., 1997; Gottschalk et al., 2015; Waelbroeck et al., 2018; Toucanne et al., 2021). However, the precise geometry and extent of Atlantic circulation changes are still under debate due to the scarcity of available observations and the large dating uncertainties of marine sediment records.
Among the proxy data that can be used to reconstruct past changes in ocean circulation, benthic foraminiferal oxygen (δ18O, expressed as an anomaly relative to a standard in ‰ versus Vienna Pee Dee Belemnite, VPDB) and carbon (δ13C, expressed in ‰ versus VPDB) isotopes offer the best spatial and temporal coverage. However, these proxies do not solely record ocean circulation changes and depend on several factors that complicate their interpretation. At present, the extraction of the ocean circulation signals out of benthic δ18O and δ13C records remains a relevant objective which has the potential to significantly improve our understanding of the ocean processes at play during the rapid climate changes of the last glacial and deglaciation periods.
Over the past 25 years, it has been shown that a decrease in benthic δ13C took place in the Atlantic Ocean during Heinrich stadials, whose amplitude depends on the location and water depth of the cores. This decrease in benthic δ13C has been classically interpreted as a reflection of a decrease in northern-sourced water (NSW) formation and a concomitant increase in the southern-sourced water (SSW) fraction (Willamowski and Zahn, 2000; Elliot et al., 2002; Skinner and Shackleton, 2006; Peck et al., 2006, 2007). However, more recent studies also suggested that this decrease in benthic δ13C could be due to a decrease in NSW δ13C preformed value (Waelbroeck et al., 2011; Crocker et al., 2016; Lund et al., 2015) or an increase in organic matter remineralization (Hoogakker et al., 2007; Lacerra et al., 2017; Voigt et al., 2017) or a combination of these factors and of an increase in the SSW fraction (Oppo et al., 2015).
Other ocean circulation proxies include sedimentary Pa/Th, sortable silt, neodymium isotopic composition, benthic foraminiferal Ba/Ca, and Cd/Ca (Lynch-Stieglitz and Marchitto, 2014). However, caveats about each of these proxies, combined with the scarcity of well-resolved records of the last glacial millennial changes, have not permitted the reconstruction of 3-D changes in ocean water masses distribution associated with the rapid climate changes of the last glacial.
In such a context, isotope-enabled models appear to be extremely useful tools for disentangling the different factors that influence the benthic δ13C signal and for producing 3-D pictures of the ocean circulation changes. Such models have been mainly used to simulate pre-industrial (PI) (Schmittner et al., 2013; Menviel et al., 2015) or Last Glacial Maximum (LGM; Menviel et al., 2017, 2020; Muglia et al., 2018; Muglia and Schmittner, 2021; Morée et al., 2021) conditions. A few studies with isotope-enabled models have addressed ocean circulation changes induced by hosing experiments mimicking stadial–interstadial transitions under PI boundary conditions (Schmittner and Lund, 2015; Missiaen et al., 2020). To our knowledge, there has been only one study using a transient simulation with carbon isotopes initialized under glacial conditions (Gu et al., 2021). This study focused on the mid-depth (1500–2500 m) Atlantic δ13C decrease observed across the transition from the LGM to Heinrich Stadial 1 and concluded that this decrease is mainly explained by increased remineralization due to AMOC slowdown, while the water mass mixture change only plays a minor role (Gu et al., 2021).
Here, we combine consistently dated benthic carbon isotopic records distributed over the Atlantic Ocean with numerical simulations performed by a glacial configuration of the Norwegian Earth System Model (NorESM) with active ocean biogeochemistry, and we investigate the changes observed in the Cibicides δ13C records across the stadial–interstadial transition corresponding to the end of Heinrich Stadial 4 (HS4). This climate transition, dated at 38.17±0.73 ka, is characterized by a rapid increase in Greenland and North Atlantic surface temperatures, leading from HS4 to Greenland Interstadial 8 (GI8) conditions (Rasmussen et al., 2014; Waelbroeck et al., 2019). This transition is particularly interesting because it is the largest and best-expressed transition in the Cibicides δ13C records prior to the last deglaciation. It thus offers a case study of a rapid and large climatic transition away from large changes in insolation and greenhouse gases. Therefore, one can assume that the recorded climate and ocean circulation changes across the HS4-to-GI8 transition are not driven by changes in the radiative forcing. This reduces the dynamical complexity and makes the use of a hosing experiment under constant radiative forcing adequate to interpret the observed changes in the proxy records.
Our study provides a 3-D picture of the ocean circulation changes across this stadial–interstadial transition anchored in Cibicides δ13C observations distributed between 2000 and 5000 m depth. We decompose the non-sea-air component of the δ13C change across the HS4-to-GI8 transition into a fraction due to remineralization changes and the remaining fraction due to changes in water mass origin and geometry. Our results show that the non-sea-air δ13C change across the HS4-to-GI8 transition due to remineralization changes decreases with increasing water depth and that, below ∼3000 m, the replacement of SSW by NSW plays a dominant role.
2.1 Observations
2.1.1 Benthic carbon isotopes
The δ13C isotopic ratio of the epifaunal benthic foraminifer genus Cibicides (noted as Cib. hereafter) has been shown to record the δ13C of bottom-water dissolved inorganic carbon (DIC), δ13C-DIC, with minor isotopic fractionation (Duplessy et al., 1984; Zahn et al., 1986; Schmittner et al., 2017). The initial DIC isotopic composition of a given water mass is governed by surface productivity in its formation region (i.e., the preferential consumption of 12C by primary productivity, thereby increasing dissolved δ13C), as well as by temperature-dependent air–sea exchanges (Lynch-Stieglitz et al., 1995). The δ13C-DIC subsequently decreases as deep water ages due to the progressive remineralization at depth of relatively 13C-depleted biogenic material. As a result, δ13C-DIC largely follows water mass structure and circulation in the modern ocean, and Cib. δ13C has been used to trace water masses and as a proxy of bottom-water ventilation (Duplessy et al., 1988, and numerous subsequent studies).
In short, δ13C-DIC is driven by the biological activity (i.e., photosynthesis and remineralization) on the one hand and by thermodynamic fractionation during air–sea exchanges on the other hand.
A recent reconstruction of the pre-industrial δ13C-DIC distribution and of its partitioning into biological and thermodynamic components shows that the former term prevails below 2000 m, with the air–sea δ13C component ranging from −0.4 ‰ VPDB in the North Atlantic to +0.2 ‰ in the Southern Ocean, which is in contrast to the biological δ13C component that ranges from +1.4 ‰ PDB in the North Atlantic to +0.4 ‰ in the Southern Ocean (Eide et al., 2017).
2.1.2 Cibicides δ13C time series
A set of 110 consistently dated foraminifer isotopic records was built during the ACCLIMATE project making use of the PARIS database structure (Lougheed et al., 2022). Among these 110 cores, 92 could be directly dated according to the approach described in Waelbroeck et al. (2019), but the age models of the remaining cores had to be established by alignment to some of the directly dated cores, thereby introducing additional dating uncertainties.
For the purposes of the present study, the dated Cib. δ13C records were screened in order to retain only sufficiently well-resolved (average time step of 100 to 500 years in most cases and smaller than 750 years in two cases) and well-dated Cib. δ13C records in the vicinity of the HS4-to-GI8 stadial–interstadial transition. Therefore, only cores with relatively precise chronological information at the end of HS4 were retained – that is, cores that presented a radiocarbon date or an alignment tie point at the end of HS4, whose calendar age has a 1σ dating uncertainty lower than 1000 years.
Applying this screening criteria to the 110 ACCLIMATE cores, we are left with only 18 Cib. δ13C records (Table S1 in the Supplement). Among the selected 18 Cib. δ13C records, 6 are new records which were generated during the ACCLIMATE project (Sect. S1 in the Supplement). In terms of dating, six cores could not be directly dated but were aligned to one of the previously published cores (Waelbroeck et al., 2019) taken as a reference. Also, the age models of 4 of the remaining 12 cores have been improved with respect to the age model published in 2019. The reader is referred to Sect. S2 for detailed information on the dating.
2.2 Numerical experiment
In this study, we took advantage of a fast version of NorESM, NorESM1-F (Guo et al., 2019a), which features a horizontal resolution of about 2∘ in the atmosphere and nominal 1∘ in the ocean and sea ice. The computational efficiency of the model allows the experiments to be integrated for multiple millennia within a reasonable wall clock time. The NorESM1-F model with active ocean biogeochemistry has been used in several studies to investigate changes in the ocean circulation and carbon cycle (Kessler et al., 2018; Galaasen et al., 2020).
The NorESM glacial simulations reported in this study are based on previous work by Guo et al. (2019b) and Jansen et al. (2020). To briefly summarize, we performed an equilibrium simulation of the last glacial period forced by the boundary conditions of 38 ka, which corresponds to the beginning of GI8. The boundary conditions are different from the present day in terms of orbital forcing, greenhouse gases (CO2, CH4, and N2O), land–sea mask, and the height and extent of the global ice sheets. Details of the configuration and simulation results of the physical climate are documented in Guo et al. (2019b).
The physical climate reached a stable interstadial state after 2500 model years, as shown by Guo et al. (2019b). From this point, we activated the full coupling of the physical components of NorESM1-F with its ocean biogeochemical (BGC) component (HAMOCC; Tjiputra et al., 2020) that is initialized from present-day climatology (including PO4, NO3, oxygen, dissolved inorganic carbon, and alkalinity; Key et al., 2004; Garcia et al., 2010a, b). Due to the long equilibration timescales of BGC tracers and the difference between glacial and present-day climate states, we continued the integration for another 2510 years (e.g., until model year 5010) to ensure that the BGC tracers are in a satisfactory quasi-equilibrium state. This ∼2500-year length of the simulation with the BGC component activated is a compromise between demanding computing time and the relatively long time period (e.g., multiple millennia) required for ocean physics and BGC fields to reach a quasi-equilibrium state. More specifically, we consider the quasi-equilibrium state of the BGC fields to be satisfactory when the residual BGC drift is substantially smaller than the signal induced by freshwater forcing (on the order of a few percent).
Next, we branched off from the simulation above and applied a freshwater-hosing method to force the interstadial climate state into a cold stadial state. The freshwater is evenly distributed between 50 and 70∘ N, with an injection of 0.33 Sv (1 Sv = 106 m3 s−1) for 800 years (i.e., until model year 5810), during which time a full stadial-like state (with a weak and shallow AMOC and an extensive sea ice cover in the North Atlantic) is achieved in the early phase of the simulation with freshwater forcing. We subsequently stopped the freshwater input to study the cold-to-warm transition process of the climate system. The model simulation of recovery (i.e., without freshwater forcing) lasted for another 400 years (i.e., until model year 6210).
The freshwater simulation and transition process of the physical climate system is partly documented by Jansen et al. (2020). Note that the freshwater input lasted for only 500 years in that study; however, the dynamics of the physical climate processes during the transition are quite similar with the two forcing time lengths. In this study, we extend the forcing length to 800 years in order to (1) better match the observed length of HS4 (Wolff et al., 2010; Waelbroeck et al., 2019) and (2) achieve a better-equilibrated deep Atlantic Ocean during the stadial state.
As shown by Jansen et al. (2020), NorESM1-F provides a robust representation of the HS4-to-GI8 transition process, both in terms of the magnitude (∼10 ∘C) and rate (nearly 1 ∘C per decade) of temperature change when comparing to Greenland ice core records (see Fig. 3 of Jansen et al., 2020). The transition process takes about 100 years to complete, after which the climate returns to an interstadial state close to the pre-hosing period. Further dynamical processes and sequences of events in the climate system that occurred during the transition, including favorable agreement with sea surface and subsurface temperature and sea ice records in the Nordic Seas and North Atlantic, will be presented in a more detailed study (Guo, 2023). The focus of the present study is on the change in ocean circulation as revealed by the observed and simulated distribution of nutrient and BGC tracers.
2.3 Simulated tracers
As explained above, δ13C-DIC can be decomposed into biological and air–sea exchange components. Using the approach of Broecker and Maier-Reimer (1992), we can compute the biological component (termed δ13C-BIO hereafter) of the δ13C-DIC as a linear function of the simulated phosphate concentration, PO4:
where α_photo is the carbon isotopic fractionation during photosynthesis; is the ocean mean carbon-to-phosphorus ratio; and δ13Cmean o, DICmean o, and PO4 mean o are the mean ocean δ13C, DIC, and PO4, respectively.
We take α_photo = −19 ‰ (Broecker and Maier-Reimer, 1992) and (Takahashi et al., 1985), both of which can be assumed to be constant in time. We take δ13Cmean o=0.14 ‰ VPDB, as estimated for the glacial ocean (Gebbie et al., 2015). We apply DICmean o=2188.4 µmol kg−1 and PO4 mean o=1.7483 µmol kg−1, taken as the long-term mean values of the MIS3 model simulation.
The NorESM1-F model is not isotope-enabled, so in this study, we focus on water depths below 2000 m and use δ13C-BIO as an approximation of δ13C-DIC. At the pre-industrial, this approximation yields slightly overestimated δ13C-DIC values in the North Atlantic (by 0.0 ‰–0.4 ‰) and slightly underestimated δ13C-DIC values in the Southern Ocean (by 0.0 ‰–0.2 ‰; Eide et al., 2017). So, not surprisingly, we find offsets between the simulated δ13C-BIO and observed Cib. δ13C values (Fig. S1 in the Supplement). Were the model perfect, these offsets would correspond to the air–sea component of δ13C-DIC during the simulated interstadial and subsequent hosing experiment.
In this study, we circumvent the existence of these offsets by comparing the simulated change in δ13C-BIO to the observed change in Cib. δ13C across the HS4-to-GI8 transition rather than the computed δ13C-BIO and the observed Cib. δ13C values during the HS4 and GI8 time intervals, respectively. Furthermore, we minimize the errors resulting from the non-inclusion of the air–sea component of δ13C-DIC by retaining only core sites located below 2000 m.
In addition to nutrients and carbon tracers, the NorESM1-F model provides preformed tracers, such as the preformed phosphate (PO), DIC, or dissolved oxygen (Guo et al., 2019a; Tjiputra et al., 2020). The preformed concentration of a tracer is defined as the concentration of this tracer in a parcel of water the last time this parcel was at the ocean surface. A tracer can thus be separated into its preformed concentration and its regenerated concentration, i.e., the concentration resulting from biological remineralization in the interior of the ocean (Duteil et al., 2012; Bernardello et al., 2014). For instance, preformed phosphate reflects the amount of phosphate returning to the ocean interior by physical processes (Duteil et al., 2012).
At any location below the ocean mixed layer, the total PO4 concentration can thus be expressed as the sum of two terms as follows:
where PO is the amount of PO4 locally produced by organic matter remineralization.
In the NorESM1-F model, preformed tracers are set to their respective total values in the ocean mixed layer (i.e., the upper two levels of the ocean model) at each time step. Below, the preformed tracers are advected as passive (i.e., conservative) tracers by the ocean circulation (Tjiputra et al., 2020). They can thus be used to track changes in ocean circulation and water mass geometry below the surface ocean.
In this study, we use the preformed PO4 computed by NorESM1-F to deconvolve the GI8–HS4 δ13C-BIO change, Δδ13C-BIO, into a fraction resulting from remineralization changes and the remainder, i.e., changes in primary production (PP) in the surface ocean and changes in ocean circulation. Importantly, in what follows, we use the term ocean circulation changes to refer to all the ocean circulation changes that are reflected by water mass tracers – that is, the changes in water mass origin and geometry but not the changes in water mass flow rate. The latter are reflected in the computed ideal age of the water mass, defined as the time since the water mass last made contact with the surface (Guo et al., 2019b).
Combining Eqs. (1) and (2) and subtracting HS4 values from GI8 values, we obtain
where (Δδ13C-BIO)circ+PP is the portion of Δδ13C-BIO resulting from ocean circulation and surface PP changes, and (Δδ13C-BIO)rem is the portion of Δδ13C-BIO resulting from remineralization changes in the ocean interior.
In order to compare the simulated GI8–HS4 change in δ13C-BIO with the observed change in Cib. δ13C, we compute the mean observed and simulated values just before and just after the transition. Model outputs are averaged over a 100-year pre-transition stadial period and a 100-year post-transition interstadial period, respectively defined as model years 5700–5800 of the simulation with freshwater forcing and model years 5950–6050 of the simulation in which the freshwater input has been halted. These two time intervals correspond to relatively stable conditions, as attested by the low standard deviations of the simulated values within each interval (Table S2).
Due to the much-lower temporal resolution of the Cib. δ13C proxy records compared to the yearly model output, we average the Cib. δ13C records over 500-year periods to increase the number of records included in the study. Hence, HS4 and GI8 Cib. δ13C are averaged over the 38.5–39.0 and 37.5–38.0 ka intervals, respectively (Table 1). We estimate the uncertainty associated with these HS4 and GI8 Cib. δ13C values by combining the uncertainty resulting from the dispersion of the Cib. δ13C measurements within the 500-year intervals and the dating uncertainty (see Sect. S3 for more details).
Table 1Partitioning of computed δ13C-BIO changes across the HS4–GI8 transition, Δδ13C-BIO, into (Δδ13C-BIO)circ+PP and (Δδ13C-BIO)rem components (Eq. 3).

* Cores are ordered by increasing water depths and are separated into two groups: above and below 4200 m (see text). Green indicates a good trend, but the computed GI8-HS4 δ13C-BIO is smaller than the observed amplitude; red indicates model–data disagreement; bolding indicates significant changes.
Among the 18 selected sites (Figs. 1 and S1, Table 1), we obtain a strict agreement between the change in simulated δ13C-BIO and the observed Cib. δ13C in 10 out of 18 sites within ±1σ (blue symbols in Fig. 1). In five out of the remaining eight sites, the simulated trend in δ13C-BIO is consistent with that in Cib. δ13C, but the model underestimates the GI8–HS4 Cib. δ13C change (green symbols in Fig. 1). Finally, simulated δ13C-BIO and observed Cib. δ13C changes disagree in three sites (red symbols in Fig. 1). A regression analysis of Δδ13C-BIO versus ΔCib. δ13C values for (i) all sites, (ii) only sites depicted in blue and green, and (iii) only sites depicted in blue shows that the linear regressions are all highly significant, with probabilities of no linear correlation lower than 0.007 in all three cases and correlation coefficients (Pearson's) ranging from 0.63 to 0.82 from case (i) to (iii) (Fig. S2).
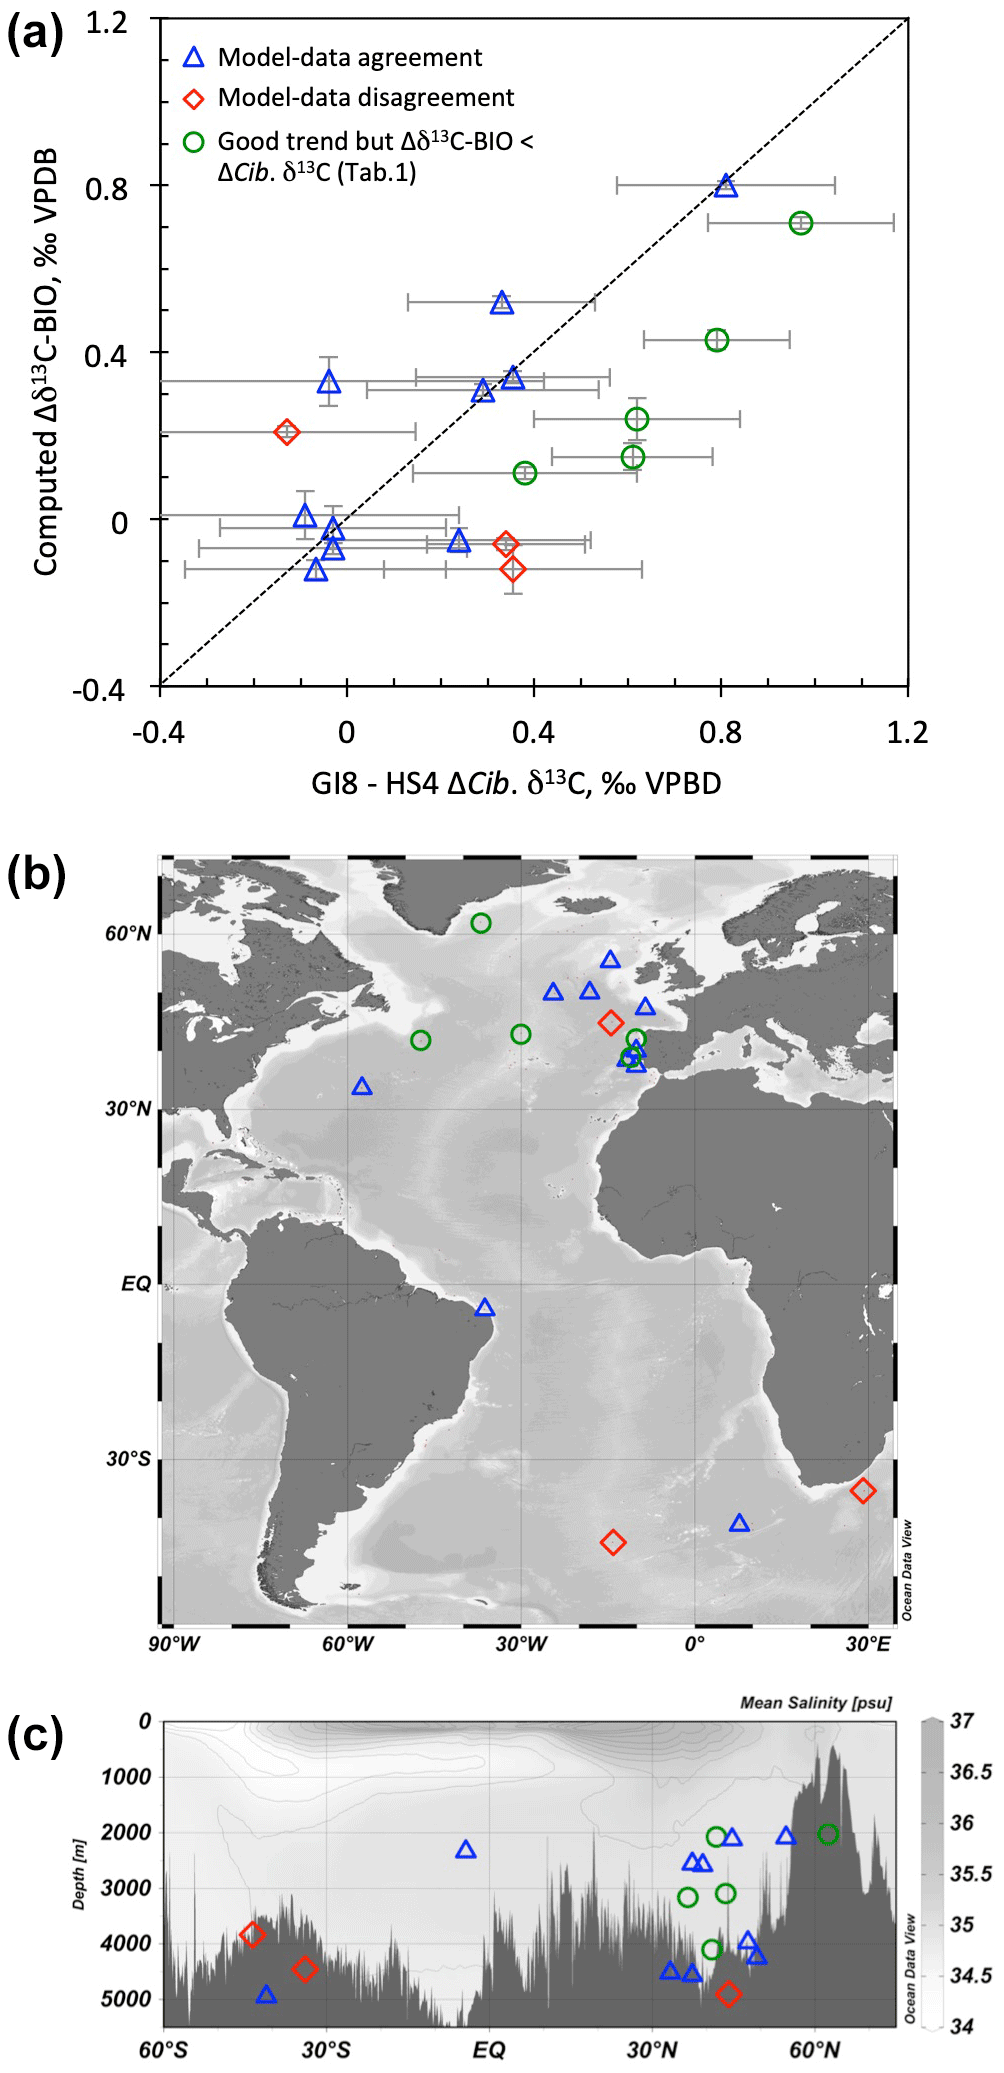
Figure 1(a) Change in δ13C-BIO simulated by NorESM1-F versus observed change in Cib. δ13C across the HS4-to-GI8 transition. Plotted error bars are ±1σ. (b, c) Position of the different core sites.
Among the three sites exhibiting model–data disagreement (red symbols), two are from the southeast Atlantic (Fig. 1). It is noteworthy that the southeast Atlantic Ocean is a problematic region for epibenthic isotopic time series for the following two reasons: (i) dating is difficult due to variable surface reservoir ages and the lack of sharp temperature changes in the Antarctic ice core records that can serve as alignment targets for sea surface temperature records; and (ii) the glacial δ13C value of the epibenthic genus Cibicides has been shown to be much lower for the species Cibicides kullenbergi than for the species Cibicides wuellerstorfi in certain instances (Gottschalk et al., 2016b), pointing to different habitat preferences for these two species and the presence of local phytodetritus layers on the sediment–water interface, possibly with very low δ13C-DIC values (Mackensen et al., 1993). The third site where observed and computed δ13C amplitudes disagree, CAR13-05, is located in the northeast Atlantic (Table 1). Although it passed the screening test for dating quality, its sedimentation rate is relatively low over the studied time interval (6 to 10 cm kyr−1; Fig. S3). The closest core in terms of latitude, longitude, and water depth, MD03-2698 (Table 1), has a sedimentation rate of about 50 cm kyr−1 (Fig. S3) and shows an excellent data–model agreement. Since marine sediment core age model precision and reliability are much improved for higher sedimentation rates, we may consider it to be that the GI8–HS4 Cib. δ13C change obtained for core MD03-2698 is more reliable than that obtained for core CAR13-05.
From the modeling point of view, the 1∘ spatial resolution of the NorESM1-F model is not sufficient to correctly simulate a number of physical processes, like the coastal upwelling or deep overflows, with potential consequences for the simulated ocean circulation. Similarly, 1∘ ocean models cannot resolve the leaking Agulhas rings, which are crucial for the heat and salinity budget in the southeast Atlantic region. The Antarctic Circumpolar Current region is also prone to model bias (Beadling et al., 2020), and spurious open-ocean convection near the Weddell Sea (Heuzé, 2021) can lead to water mass biases in the Southern Ocean and beyond. In addition to these physical uncertainties, some uncertainties could also arise from the application to the glacial period of the BGC module with the same ecosystem parameterization as for the present, whereas there is evidence that some parameters, like the remineralization rate, should be temperature dependent (Brewer and Peltzer, 2017).
However, even though two of the three sites exhibiting model–data disagreement (red symbols) are located in the southeast Atlantic, no firm conclusion can be drawn regarding possible data or model biases due to the limited number of observations in the South Atlantic. When examining the geographical distribution of the three categories of sites, we find (i) model–data agreement (blue symbols) distributed over all latitudes, longitudes, and water depths; (ii) underestimated simulated changes (green symbols) in the North Atlantic, both along the western boundary current and the mid-Atlantic ridge and on the Iberian margin, at various water depths; and (iii) model–data disagreement (red symbols) below 3700 m in the North and South Atlantic, together with several blue sites and one green site. Therefore, the different categories of model–data agreement and/or disagreement do not correspond to any geographical pattern. This lack of geographical pattern points to the absence of obvious biases in the model results, at least in the North Atlantic.
To summarize, we obtain an overall good agreement between the change in δ13C-BIO simulated by NorESM1-F and the observed change in Cib. δ13C across the HS4-to-GI8 transition below 2000 m in the North Atlantic and equatorial West Atlantic (Fig. 1, Table 1).
This overall good model–data agreement suggests that the model successfully reproduces the changes in ocean nutrients across a stadial–interstadial transition below 2000 m in the Atlantic Ocean. Moreover, it warrants the use of NorESM1-F simulations to examine what caused the observed changes in Cib. δ13C in that portion of the world ocean.
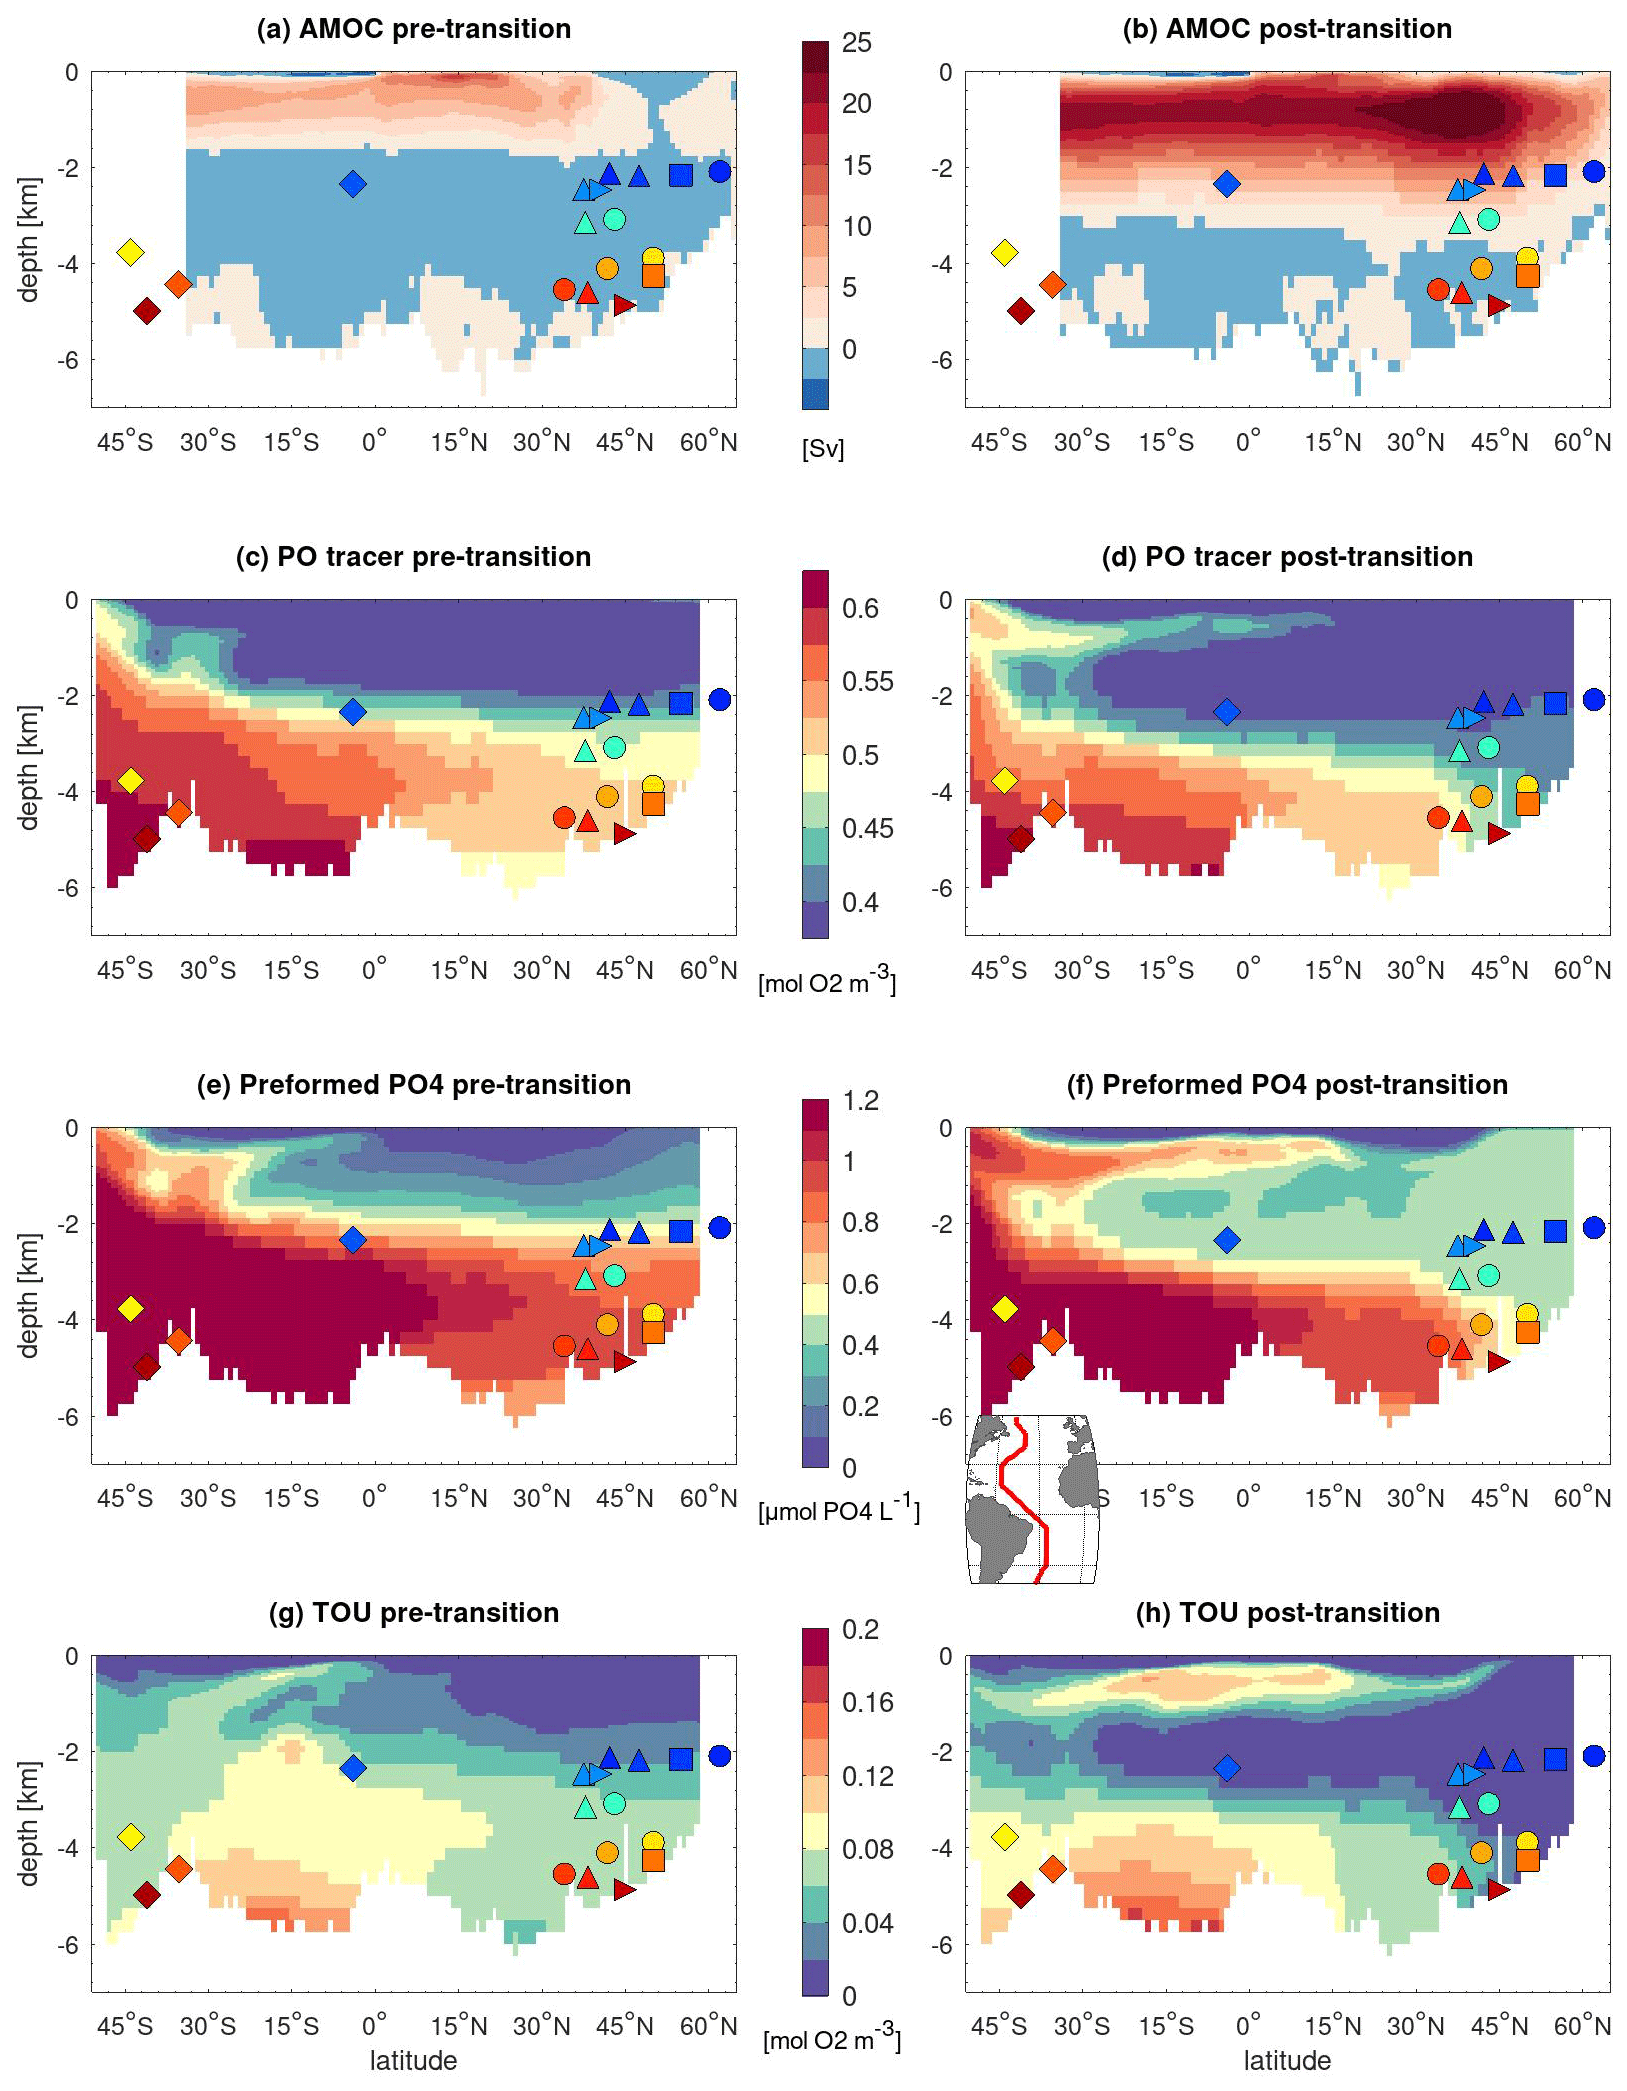
Figure 2NorESM1-F simulated changes in Atlantic ocean circulation and nutrients across the HS4-to-GI8 transition. Pre- and post-transition values respectively correspond to 100-year averages over model years 5700–5800 of the simulation with freshwater forcing and model years 5950–6050 of the simulation in which the freshwater input has been halted. (a, b) Zonally integrated stream function. (c–h) Section plots along the western Atlantic section depicted in the inset. Colored symbols indicate the core sites as plotted in Fig. S1 and defined in Table 1.
Prior to the stadial–interstadial transition, the simulated AMOC stream function is weak, with an upper overturning cell restrained to the upper 2000 m and a maximum overturning strength of about 10 Sv (Figs. 2a and S4). After the transition, the model results exhibit a strong overturning regime, with active deep-water formation in the northern North Atlantic and Nordic Seas leading to an upper overturning cell reaching down to ∼3000 m depth and a maximum overturning strength larger than 25 Sv (Figs. 2b and S4). This evolution of the simulated AMOC stream function is in agreement with the changes in overturning strength derived from the sedimentary Pa/Th records covering the HS4-to-GI8 transition (Henry et al., 2016; Waelbroeck et al., 2018). Moreover, even though the change in benthic δ18O across the HS4-to-GI8 transition is very small and not significant for most sites, the simulated bottom-water-density decrease resulting from a slight bottom-water warming is in agreement with the observed benthic δ18O decrease at the deep northeast Atlantic site U1308 (Sect. S4).
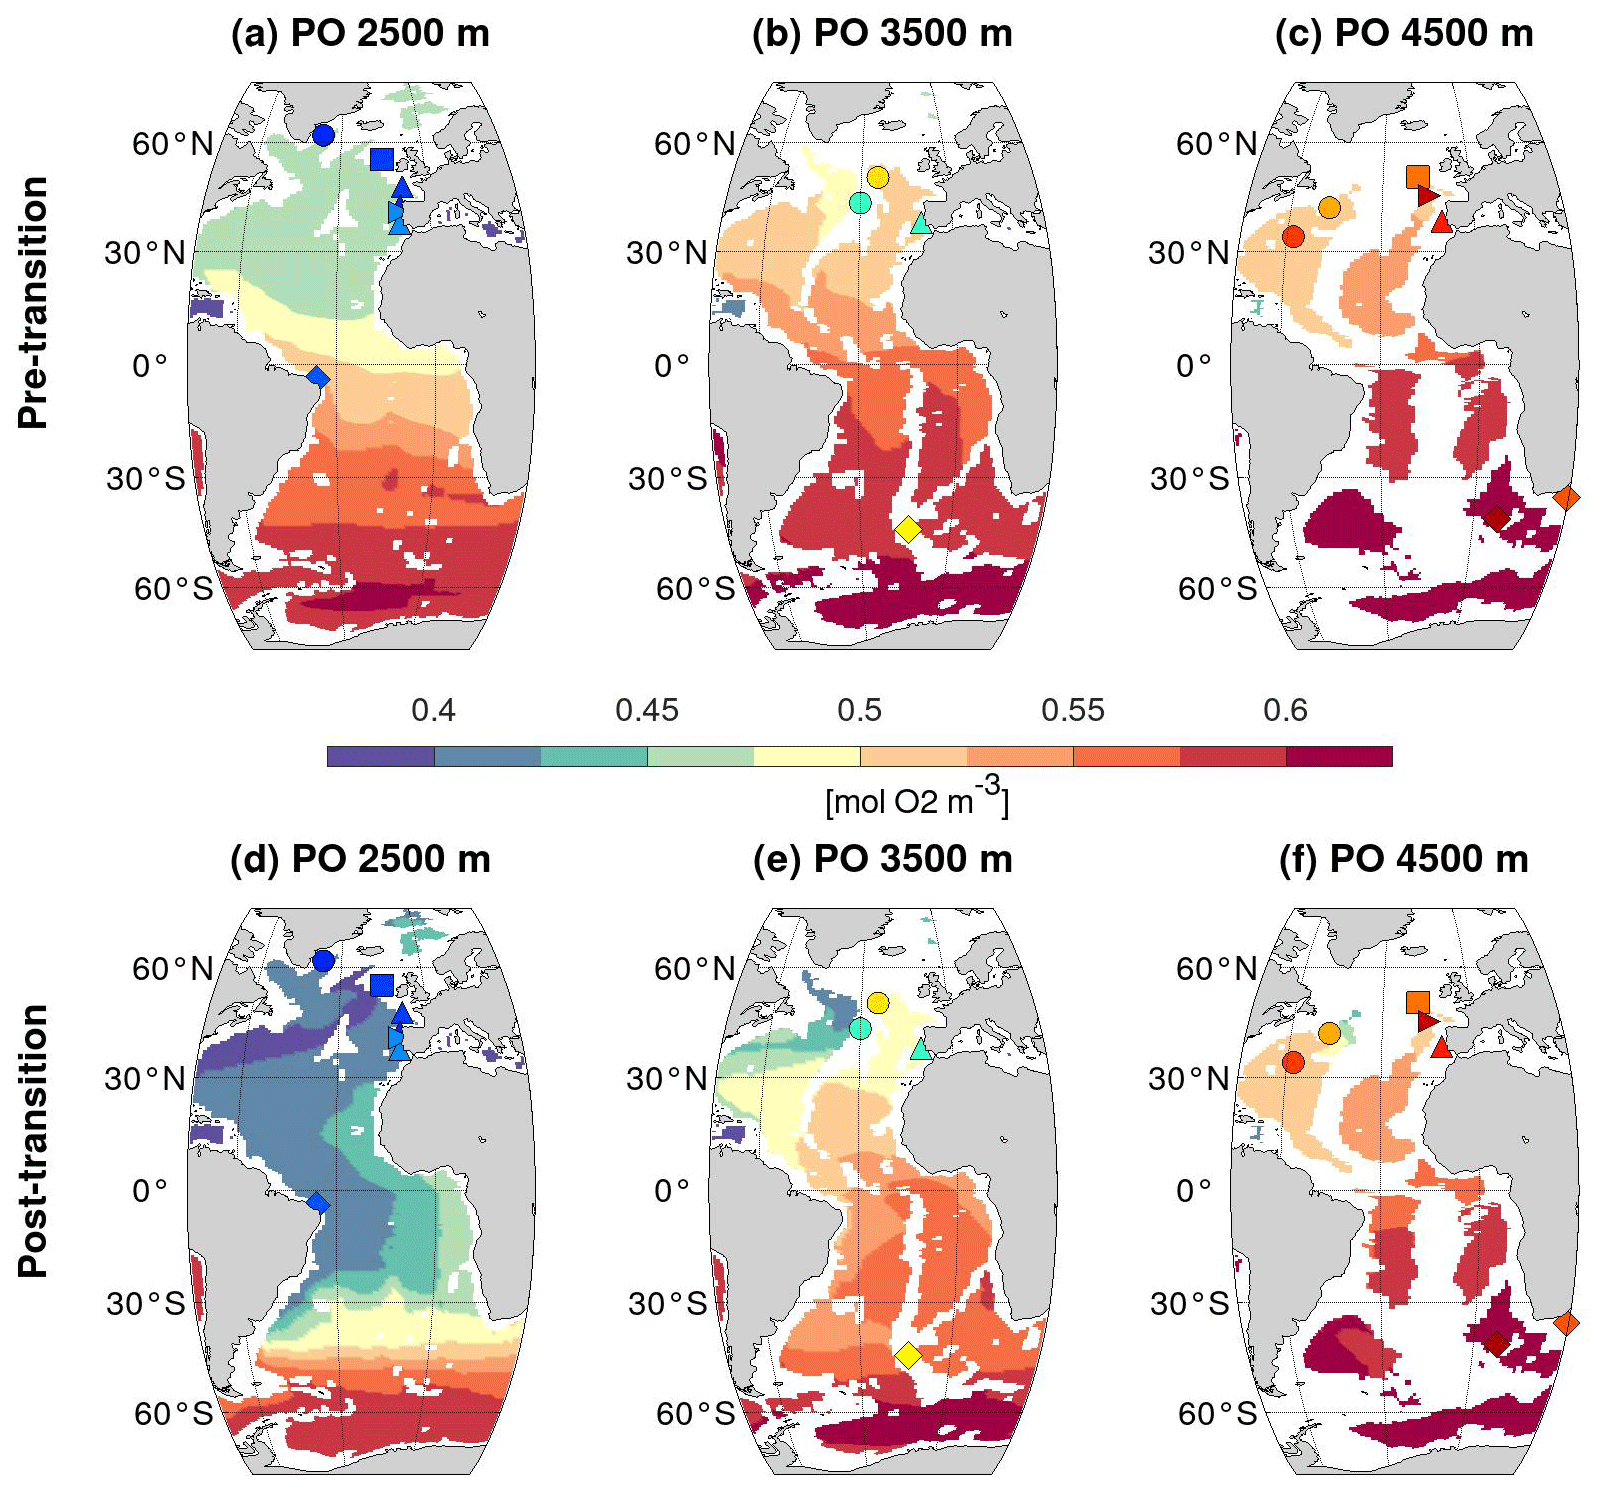
Figure 3Same as Fig. 2 but for simulated PO tracer [mol O2 m−3] at 2500, 3500, and 4500 m depth in the Atlantic Ocean.
We use the simulated PO tracer defined as (Luo et al., 2018), similarly to the NO tracer first defined by Broecker (1974), to track the water mass origin. The PO tracer combines O2 and PO4 in such proportions that the increase in PO4 by respiration is canceled, which makes this tracer nearly conservative. Given the difference in the preformed phosphate content of dense water produced in the northern and southern high latitudes of the Atlantic Ocean, SSWs and NSWs are characterized by high and low PO values, respectively. In our simulations of HS4 and GI8 ocean circulation, SSWs correspond to PO values above ∼0.55 mol O2 m−3, and NSWs correspond to PO values below ∼0.45 mol O2 m−3 (Fig. 2c and d).
Vertical sections of the PO tracer along the western basin before and after the HS4-to-GI8 transition show that NSWs were confined to the upper 2000 m before the transition, whereas active deep-water formation in the northern North Atlantic and Nordic Seas is clearly visible after the transition, with low PO values delimiting a North Atlantic Deep Water (NADW)-like water mass (Fig. 2c and d). This is further illustrated in horizontal PO maps at different water depths (Fig. 3), where the resumption of the southward-flowing deep western boundary current in the North Atlantic is reflected by low PO values down to 3500 m depth in the post-transition sections (Fig. 3e–h).
Importantly, as expected, changes in the spatial distribution of the PO tracer across the HS4-to-GI8 transition are remarkably similar to those of the preformed PO4, both vertically (Fig. 2c–f) and horizontally (Figs. 3 and S5). This constitutes a validation of our use of PO to assess the portion of the change in δ13C-BIO resulting from changes in ocean circulation and surface PP and further indicates that the changes in surface PP do not lead to a visible imprint on the interior ocean δ13C-BIO distribution. The simulated PP increase in some regions across the HS4-to-GI8 transition is indeed too weak to significantly draw down the PO values and is not sufficient to prevent PO from increasing in the same regions across the transition (Fig. S6). For simplicity, here, we thus simply interpret PO in terms of changes in ocean circulation – that is, changes in water mass origin and geometry.
In addition, the NorESM1-F model computes the total oxygen utilization (TOU; Figs. 2g, h and 4), that is, the total oxygen consumed by organic matter remineralization, which translates into the amount of PO4 locally produced by remineralization, PO (Eq. 2). Increases in TOU or PO thus correspond to decreases in δ13C-BIO. Although the spatial distribution of the TOU before and after the HS4-to-GI8 transition is imprinted by the low TOU values of the NSW in the North Atlantic, it is markedly different from that of ocean circulation changes shown by PO or the PO tracer in the South Atlantic (Figs. 2–4).
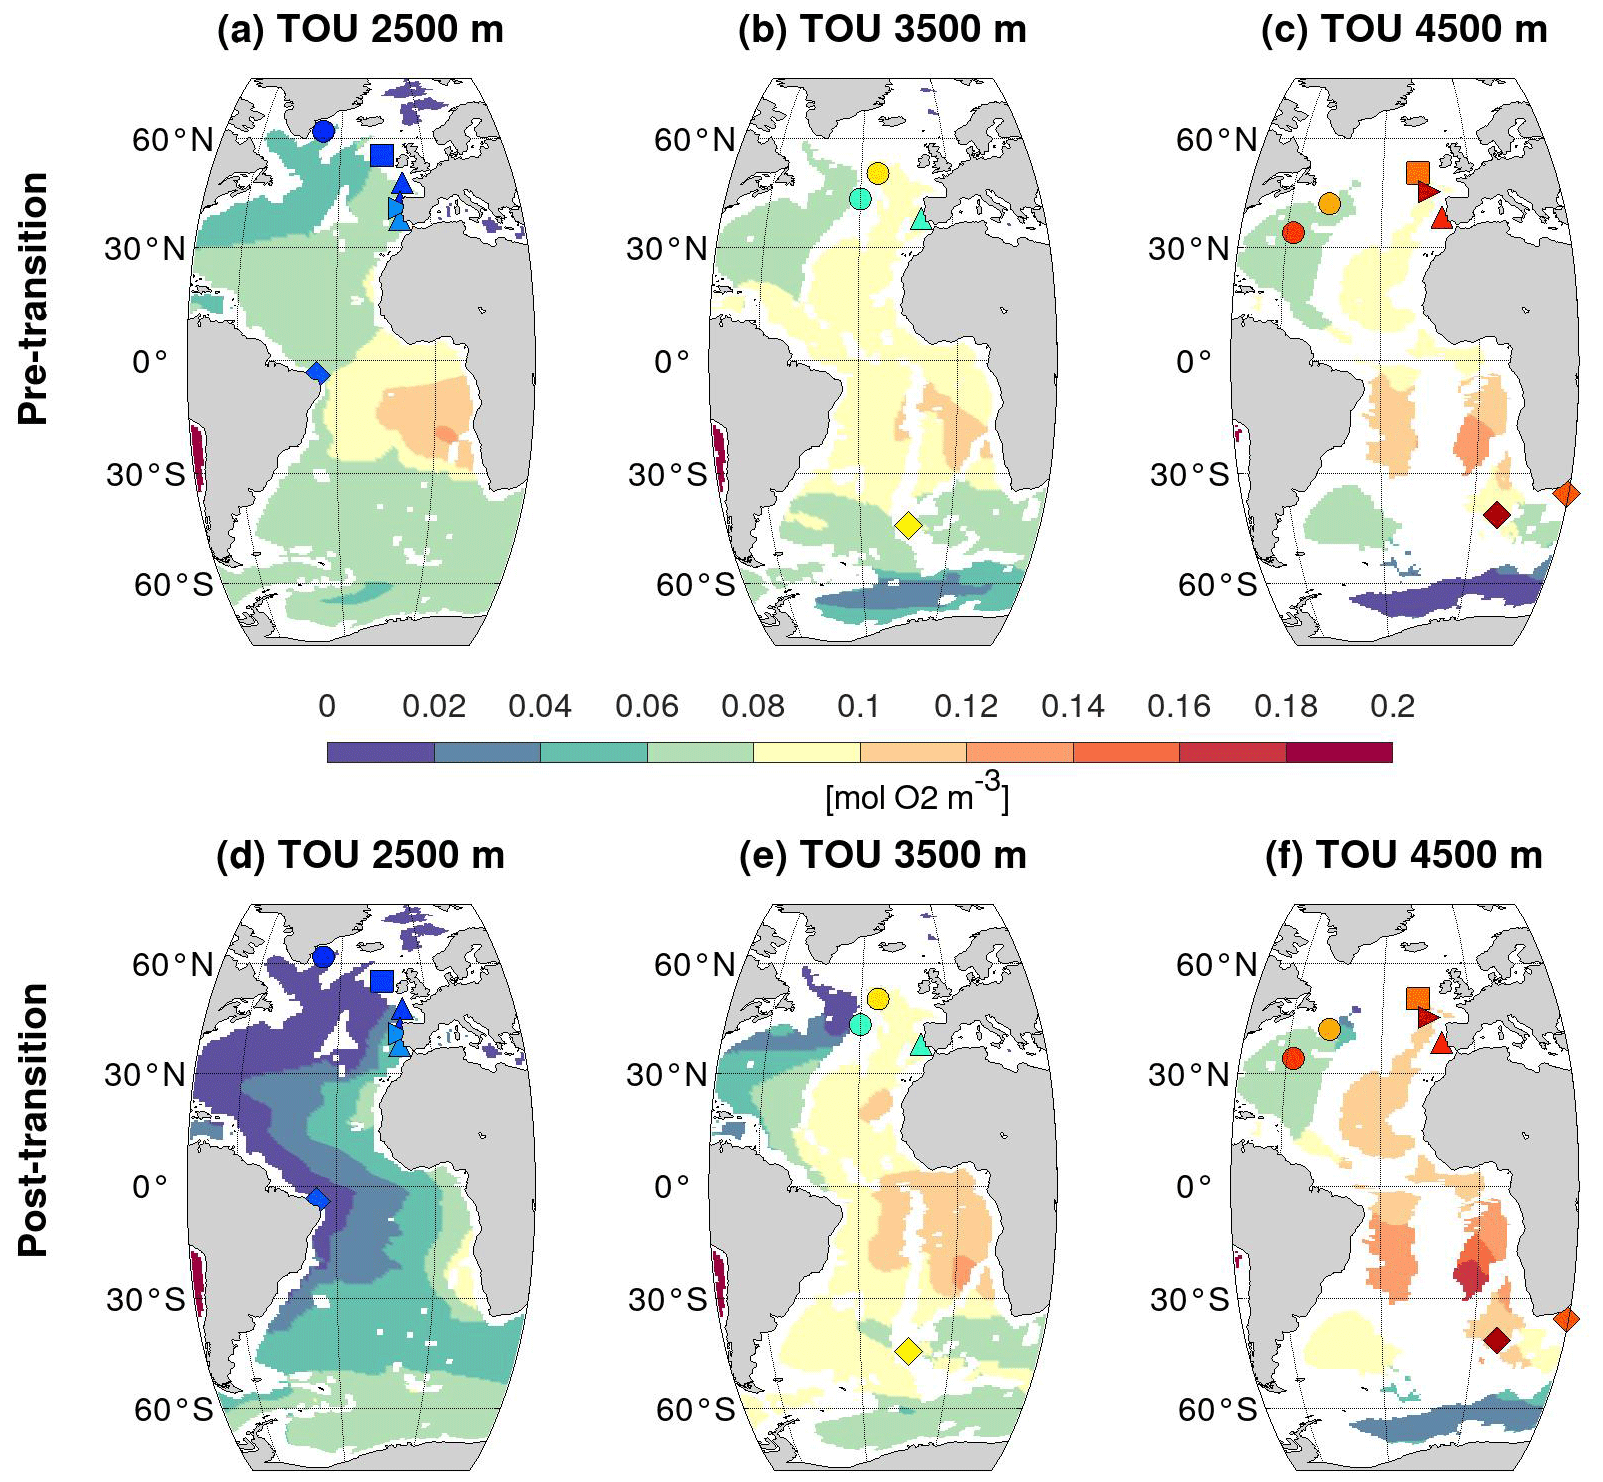
Figure 4Same as Fig. 3 but for simulated total oxygen utilization (mol O2 m−3) at 2500, 3500, and 4500 m depth in the Atlantic Ocean.
To summarize, PO (or the PO tracer) on the one hand and PO (or TOU) on the other hand give us access to the partitioning of the δ13C-BIO change across the HS4-to-GI8 transition into the following two constituents: (i) the fraction change resulting from changes in water mass origin and geometry, and (ii) the complementary fraction caused by changes in remineralization (Eq. 3).
Based on the simulated PO averaged over the previously defined HS4 and GI8 100-year intervals, we compute the portion of the GI8–HS4 δ13C-BIO change due to ocean circulation changes, (Δδ13C-BIO)circ+PP, at the 18 selected sites. We find that the 11 sites located above 4200 m that exhibit significant GI8–HS4 δ13C-BIO changes all show an increase in δ13C-BIO across the transition. In these sites, (Δδ13C-BIO)circ+PP forms 30 % to 90 % of the total GI8–HS4 δ13C-BIO increase (Table 1). Furthermore, we find a loose, but significant (R2=0.64), linear correlation, whereby the fraction change resulting from ocean circulation changes increases from ∼40 % at 2000 m to ∼80 % at 4000 m (Fig. S7). (Δδ13C-BIO)rem thus forms 10 % to 70 % of the total GI8–HS4 δ13C-BIO increase in these 11 sites (Table 1), with this fraction increasing with depth from ∼20 % at 4000 m to ∼60 % at 2000 m. The model results further show that the increase in δ13C-BIOrem across the transition results from a decrease in remineralization explained by the stronger overturning circulation during GI8 than during HS4, which translates into shorter water mass residence times at these 11 sites, as shown by the decrease in ideal age at these sites across the transition (Fig. S8).
This increase in δ13C-BIOcirc+PP at the core sites located above 4200 m corresponds to an increase in the ratio of NSW versus SSW, as illustrated by the PO maps (Fig. 3). The largest changes occur in sites where SSW is replaced by NSW as a result of the resumption of deep-water formation in the northern high latitudes and the penetration of NADW-like NSW down to 3500 m in the northwest Atlantic and toward 30∘ S in the South Atlantic around 2500 m (Fig. 3).
Contrary to the δ13C-BIO increase of up to 0.80 ‰ found in sites above 4200 m, δ13C-BIO decreases by 0.02 ‰ to 0.12 ‰ across the HS4-to-GI8 transition in the six sites located below 4200 m (Fig. S9). At these deep sites, remineralization increases across the HS4-to-GI8 transition, leading to a 0.04 ‰ to 0.18 ‰ decrease in δ13C-BIOrem (Eq. 3, Table 1). In contrast, the change in δ13C-BIOcirc+PP at these six deep sites is very small and barely significant (within −0.03 ‰ to +0.02 ‰), except in two southeast Atlantic sites, where it reaches +0.06 ‰ and +0.08 ‰but is counteracted by larger decreases in the δ13C-BIOrem component, reaching −0.18 ‰ and −0.14 ‰, respectively (Table 1). Such a decrease in δ13C-BIOrem results from an increase in respired PO4 and hence in organic matter export from the euphotic zone to the deep ocean during GI8 with respect to HS4. In particular, in our two subantarctic sites located below 4200 m, NorESM1-F simulates higher remineralization during interstadials than during stadials, which is consistent with an increased export production from the upper ocean to the deep Southern Ocean during interstadials, as demonstrated in a number of studies (e.g., Gottschalk et al., 2016a; Martínez-García et al., 2014).
In addition to the above discussion of our model results at the selected 18 sites, the simulated maps of Δδ13C-BIO and of its partitioning into (Δδ13C-BIO)circ+PP and (Δδ13C-BIO)rem provide acceptable approximations of the change in Cib. δ13C and of its partitioning into a circulation and surface PP term on one hand and a remineralization term on the other hand anywhere below 2000 m in the Atlantic Ocean (Fig. S10).
It is tempting to compare our results with a recent study of the LGM-to-HS1 transition by Gu et al. (2021), who concluded that the δ13C-DIC decrease observed at mid-depth is mainly explained by increased remineralization due to AMOC slowdown, while the water mass mixture change plays only a minor role. However, Gu et al. (2021) used a transient simulation of the last deglaciation to examine the causes of the mid-depth Atlantic δ13C-DIC decrease observed across the transition from the LGM into the HS1 stadial, whereas we use a hosing experiment under constant radiative forcing to examine the transition from the HS4 stadial to the GI8 interstadial, away from the last deglaciation and its large changes in radiative forcing. The results of the two studies can thus hardly be compared. Despite these different settings, both studies show that the remineralization changes due to ventilation changes are the main factor contributing to the observed Atlantic δ13C-DIC change at about 2000 m water depth. But this agreement does not hold at greater depths, where our results suggest that water mass mixture change is the main factor of the Atlantic δ13C-DIC change between ∼2500 and 4000 m.
We show that the observed Cib. δ13C changes across the HS4-to-GI8 stadial–interstadial transition can be successfully approximated by the computed change in dissolved inorganic carbon δ13C, Δδ13C-BIO, assuming no change in air–sea exchanges and using the nutrient fields simulated by the NorESM1-F model across a stadial–interstadial transition.
The model results can then be used to gain insight into the causes of the observed Cib. δ13C change across the HS4-to-GI8 transition and to assess the fraction of the change resulting from changes in water mass origin and geometry on the one hand and that associated with changes in organic matter remineralization in the interior ocean on the other hand. Above ∼4200 m, a large fraction of the computed δ13C-BIO increase results from the replacement of SSW by NSW subsequent to the resumption of deep-water formation in the northern high latitudes after the freshwater input is halted. This fraction exhibits a loose linear relationship with depth, increasing from ∼40 % at 2000 m to ∼80 % at 4000 m. Conversely, the δ13C-BIO increase resulting from the decrease in remineralization across the HS4-to-GI8 transition in response to the faster flow rates during GI8 than during HS4 represents ∼60 % of the δ13C-BIO increase at 2000 m but only ∼20 % of the δ13C-BIO increase at 4000 m.
Below ∼4200 m, the model shows little change in δ13C-BIO resulting from changes in water mass origin and geometry but an increase in remineralization across the HS4-to-GI8 transition. The simulated lower remineralization during stadials than during interstadials is particularly pronounced in our deep subantarctic sites, which is in agreement with the decrease in the biological export production during stadials found in the Southern Ocean in previous studies.
Data related to this article are available on Seanoe: https://doi.org/10.17882/91130 (Waelbroeck et al., 2022).
The supplement related to this article is available online at: https://doi.org/10.5194/cp-19-901-2023-supplement.
CW, JT, CG, and KN designed the research. CG performed the model run. JT contributed expert knowledge on the biogeochemical model component. JT and CW made the figures. NVR contributed expert advice to an earlier version of this paper. ST, FE, SL, and SN provided sedimentology expertise and access to cores MD13-3438 and MD03-2698. FD supervised and quality-controlled all the ACCLIMATE isotopic data. LR performed the planktonic foraminifera census counts on core MD13-3438. EM performed the grain size analysis on core CAR2013-PQP-CAR05. CW, JT, and CG wrote the paper, with contributions from all the co-authors.
The contact author has declared that none of the authors has any competing interests.
Publisher's note: Copernicus Publications remains neutral with regard to jurisdictional claims in published maps and institutional affiliations.
The research leading to these results derives from exchanges and collaborations between participants in the ACCLIMATE ERC project (FP7/2007-2013 grant agreement no. 339108) and ice2ice ERC project (FP7/2007-2013 grant agreement no. 610055). We are indebted to Gulay Isguder for her micropaleontological expertise and her help in sample preparation. We acknowledge Nicolas Smialkowski, Lucile Mauclair, and Laetitia Leroy for processing the samples. We thank the French Paul Emile Victor Institute (IPEV) and the crew of the research vessel Marion-Dufresne for collecting core MD16-3511Q. We also thank Patrick Guyomard for having given us access to core CAR2013-PQP-CAR05 in the SHOM core repository. We are grateful to David A. Hodell for sharing the reflectance data of core DSDP609. We thank Christoph Heinze for his comments on an earlier version of the article and for his precious advice. Chuncheng Guo acknowledges support from the RCN-funded project ABRUPT (project no. 325333). Susana Lebreiro acknowledges funding from project CTM2017-84113-R. Jerry Tjiputra acknowledges RCN project INES (project no. 270061).
This research has been supported by the Research Council of Norway (RNC – KLIMAFORSK contract no. 326603/E10 and Coordination and Support Activity contract no. 310328/E10).
This paper was edited by Alberto Reyes and reviewed by two anonymous referees.
Beadling, R. L., Russell, J., Stouffer, R., Mazloff, M., Talley, L., Goodman, P., Sallée, J.-B., Hewitt, H., Hyder, P., and Pandde, A.: Representation of Southern Ocean properties across coupled model intercomparison project generations: CMIP3 to CMIP6, J. Climate, 33, 6555–6581, 2020.
Bernardello, R., Marinov, I., Palter, J. B., Sarmiento, J. L., Galbraith, E. D., and Slater, R. D.: Response of the ocean natural carbon storage to projected twenty-first-century climate change, J. Climate, 27, 2033–2053, 2014.
Brewer, P. G. and Peltzer, E. T.: Depth perception: the need to report ocean biogeochemical rates as functions of temperature, not depth, Philos. T. Roy. Soc. A, 375, 20160319, https://doi.org/10.1098/rsta.2016.0319, 2017.
Broecker, W. S.: `NO', a conservative water mass tracer, Earth Planet Sc. Lett., 23, 100–107, 1974.
Broecker, W. S. and Maier-Reimer, E.: The influence of air and sea exchange on the carbon isotope distribution in the sea, Global Biogeochem. Cy., 6, 315–320, 1992.
Crocker, A. J., Chalk, T. B., Bailey, I., Spencer, M. R., Gutjahr, M., Foster, G. L., and Wilson, P. A.: Geochemical response of the mid-depth Northeast Atlantic Ocean to freshwater input during Heinrich events 1 to 4, Quaternary Sci. Rev., 151, 236–254, 2016.
Duplessy, J.-C., Shackleton, N. J., Matthews, R. K., Prell, W., Ruddiman, W. F., Caralp, M., and Hendy, C. H.: 13C record of benthic foraminifera in the last interglacial ocean: implications for the carbon cycle and the global deep water circulation, Quatern. Res., 21, 225–243, 1984.
Duplessy, J.-C., Shackleton, N. J., Fairbanks, R. G., Labeyrie, L., Oppo, D., and Kallel, N.: Deepwater source variations during the last climatic cycle and their impact on the global deepwater circulation, Paleoceanography, 3, 343–360, 1988.
Duteil, O., Koeve, W., Oschlies, A., Aumont, O., Bianchi, D., Bopp, L., Galbraith, E., Matear, R., Moore, J. K., Sarmiento, J. L., and Segschneider, J.: Preformed and regenerated phosphate in ocean general circulation models: can right total concentrations be wrong?, Biogeosciences, 9, 1797–1807, https://doi.org/10.5194/bg-9-1797-2012, 2012.
Eide, M., Olsen, A., Ninnemann, U. S., and Johannessen, T.: A global ocean climatology of preindustrial and modern ocean δ13C, Global Biogeochem. Cy., 31, 515–534, 2017.
Elliot, M., Labeyrie, L., and Duplessy, J. C.: Changes in North-Atlantic deep-water formation associated with the Dansgaard-Oeschger temperature oscillations (60–10 ka), Quaternary Sci. Rev., 21, 1153–1165, 2002.
Galaasen, E. V., Ninnemann, U. S., Kessler, A., Irvalı, N., Rosenthal, Y., Tjiputra, J., Bouttes, N., Roche, D. M., Kleiven, H. F., and Hodell, D. A.: Interglacial instability of North Atlantic deep water ventilation, Science, 367, 1485–1489, 2020.
Garcia, H., Locarnini, R., Boyer, T., Antonov, J., Zweng, M., Baranova, O., and Johnson, D.: Dissolved oxygen, apparent oxygen utilization, and oxygen saturation, in: World Ocean Atlas 2009, edited by: Levitus, S., NOAA Atlas NESDIS 70, US Government Printing Office, Washington, DC, USA, 344 pp., https://www.ncei.noaa.gov/sites/default/files/2020-04/woa09_vol3_text.pdf (last access: 2 May 2023), 2010a.
Garcia, H., Locarnini, R., Boyer, T., Antonov, J., Zweng, M., Baranova, O., and Johnson, D.: Nutrients (phosphate, nitrate, silicate), in: World Ocean Atlas 2009, edited by: Levitus, S., NOAA Atlas NESDIS 71, US Government Printing Office, Washington, DC, USA, 398 pp., https://www.ncei.noaa.gov/sites/default/files/2020-04/woa09_vol4_text.pdf (last access: 2 May 2023), 2010b.
Gebbie, G., Peterson, C. D., Lisiecki, L. E., and Spero, H. J.: Global-mean marine δ13C and its uncertainty in a glacial state estimate, Quaternary Sci. Rev., 125, 144–159, 2015.
Gottschalk, J., Skinner, L. C., Misra, S., Waelbroeck, C., Menviel, L., and Timmermann, A.: Abrupt changes in the southern extent of North Atlantic Deep Water during Dansgaard–Oeschger events, Nat. Geosci., 8, 950–954, https://doi.org/10.1038/ngeo2558, 2015.
Gottschalk, J., Skinner, L. C., Lippold, J., Vogel, H., Frank, N., Jaccard, S. L., and Waelbroeck, C.: Biological and physical controls in the Southern Ocean on past millennial-scale atmospheric CO2 changes, Nat. Commun., 7, 11539, https://doi.org/10.1038/ncomms11539, 2016a.
Gottschalk, J., Vázquez Riveiros, N., Waelbroeck, C., Skinner, L. C., Michel, E., Duplessy, J. C., Hodell, D., and Mackensen, A.: Carbon isotope offsets between benthic foraminifer species of the genus Cibicides (Cibicidoides) in the glacial sub-Antarctic Atlantic, Paleoceanography, 31, 1583–1602, 2016b.
Gu, S., Liu, Z., Oppo, D. W., Lynch-Stieglitz, J., Jahn, A., Zhang, J., Lindsay, K., and Wu, L.: Remineralization dominating the δ13C decrease in the mid-depth Atlantic during the last deglaciation, Earth Planet. Sc. Lett., 571, 117106, https://doi.org/10.1016/j.epsl.2021.117106, 2021.
Guo, C.: Arctic circulation changes at the transition from a Heinrich stadial to a Greenland interstadial, in preparation, 2023.
Guo, C., Bentsen, M., Bethke, I., Ilicak, M., Tjiputra, J., Toniazzo, T., Schwinger, J., and Otterå, O. H.: Description and evaluation of NorESM1-F: a fast version of the Norwegian Earth System Model (NorESM), Geosci. Model Dev., 12, 343–362, https://doi.org/10.5194/gmd-12-343-2019, 2019a.
Guo, C., Nisancioglu, K. H., Bentsen, M., Bethke, I., and Zhang, Z.: Equilibrium simulations of Marine Isotope Stage 3 climate, Clim. Past, 15, 1133–1151, https://doi.org/10.5194/cp-15-1133-2019, 2019b.
Henry, L., McManus, J. F., Curry, W. B., Roberts, N. L., Piotrowski, A. M., and Keigwin, L. D.: North Atlantic ocean circulation and abrupt climate change during the last glaciation, Science, 353, 470–474, https://doi.org/10.1126/science.aaf5529, 2016.
Heuzé, C.: Antarctic Bottom Water and North Atlantic Deep Water in CMIP6 models, Ocean Sci., 17, 59–90, https://doi.org/10.5194/os-17-59-2021, 2021.
Hoogakker, B., McCave, I., and Vautravers, M.: Antarctic link to deep flow speed variation during Marine Isotope Stage 3 in the western North Atlantic, Earth Planet. Sc. Lett., 257, 463–473, 2007.
Jansen, E., Christensen, J. H., Dokken, T., Nisancioglu, K. H., Vinther, B. M., Capron, E., Guo, C., Jensen, M. F., Langen, P. L., and Pedersen, R. A.: Past perspectives on the present era of abrupt Arctic climate change, Nat. Clim. Change, 10, 714–721, 2020.
Kessler, A., Galaasen, E. V., Ninnemann, U. S., and Tjiputra, J.: Ocean carbon inventory under warmer climate conditions – the case of the Last Interglacial, Clim. Past, 14, 1961–1976, https://doi.org/10.5194/cp-14-1961-2018, 2018.
Key, R. M., Kozyr, A., Sabine, C. L., Lee, K., Wanninkhof, R., Bullister, J. L., Feely, R. A., Millero, F. J., Mordy, C., and Peng, T. H.: A global ocean carbon climatology: Results from Global Data Analysis Project (GLODAP), Global Biogeochem. Cy., 18, 1–23, 2004.
Lacerra, M., Lund, D., Yu, J., and Schmittner, A.: Carbon storage in the mid-depth Atlantic during millennial-scale climate events, Paleoceanography, 32, 780–795, 2017.
Lougheed, B. C., Waelbroeck, C., Smialkowski, N., Vazquez Riveiros, N., and Obrochta, S. P.: A Simplified Palaeoceanography Archiving System (PARIS) and GUI for Storage and Visualisation of Marine Sediment Core Proxy Data vs Age and Depth, Open Quatern., 8, 1–11, https://doi.org/10.5334/oq.101, 2022.
Lund, D., Tessin, A., Hoffman, J., and Schmittner, A.: Southwest Atlantic water mass evolution during the last deglaciation, Paleoceanography, 30, 477–494, 2015.
Luo, Y., Tjiputra, J., Guo, C., Zhang, Z., and Lippold, J.: Atlantic deep water circulation during the last interglacial, Sci. Rep., 8, 1–8, 2018.
Lynch-Stieglitz, J. and Marchitto, T. M.: Tracers of past ocean circulation, in: The Oceans and Marine Geochemistry, edited by: Mottl, M. and Elderfield, H., Elsevier, Amsterdam, 433–451, https://doi.org/10.1016/B978-0-08-095975-7.00616-1, 2014.
Lynch-Stieglitz, J., Stocker, T., Broecker, W. S., and Fairbanks, R. G.: The influence of air-sea exchange on the isotopic composition of oceanic carbon: Observations and modeling, Global Biogeochem. Cy., 9, 653–665, 1995.
Mackensen, A., Hubberten, H. W., Bickert, T., Fischer, G., and Fütterer, D.: The δ13C in benthic foraminiferal tests of Fontbotia wuellerstorfi (Schwager) relative to the δ13C of dissolved inorganic carbon in southern ocean deep water: implications for glacial ocean circulation models, Paleoceanography, 8, 587–610, 1993.
Martínez-García, A., Sigman, D. M., Ren, H., Anderson, R. F., Straub, M., Hodell, D. A., Jaccard, S. L., Eglinton, T. I., and Haug, G. H.: Iron fertilization of the Subantarctic Ocean during the last ice age, Science, 343, 1347–1350, 2014.
Menviel, L., Mouchet, A., Meissner, K. J., Joos, F., and England, M. H.: Impact of oceanic circulation changes on atmospheric δ13CO2, Global Biogeochem. Cy., 29, 1944–1961, 2015.
Menviel, L., Yu, J., Joos, F., Mouchet, A., Meissner, K., and England, M. H.: Poorly ventilated deep ocean at the Last Glacial Maximum inferred from carbon isotopes: A data-model comparison study, Paleoceanography, 32, 2–17, 2017.
Menviel, L., Spence, P., Skinner, L., Tachikawa, K., Friedrich, T., Missiaen, L., and Yu, J.: Enhanced Mid-depth Southward Transport in the Northeast Atlantic at the Last Glacial Maximum Despite a Weaker AMOC, Paleoceanogr. Paleoclim., 35, e2019PA003793, https://doi.org/10.1029/2019PA003793, 2020.
Missiaen, L., Bouttes, N., Roche, D. M., Dutay, J.-C., Quiquet, A., Waelbroeck, C., Pichat, S., and Peterschmitt, J.-Y.: Carbon isotopes and response to forced circulation changes: a model perspective, Clim. Past, 16, 867–883, https://doi.org/10.5194/cp-16-867-2020, 2020.
Morée, A. L., Schwinger, J., Ninnemann, U. S., Jeltsch-Thömmes, A., Bethke, I., and Heinze, C.: Evaluating the biological pump efficiency of the Last Glacial Maximum ocean using δ13C, Clim. Past, 17, 753–774, https://doi.org/10.5194/cp-17-753-2021, 2021.
Muglia, J. and Schmittner, A.: Carbon isotope constraints on glacial Atlantic meridional overturning: strength vs depth, Quaternary Sci. Rev., 257, 106844, https://doi.org/10.1016/j.quascirev.2021.106844, 2021.
Muglia, J., Skinner, L. C., and Schmittner, A.: Weak overturning circulation and high Southern Ocean nutrient utilization maximized glacial ocean carbon, Earth Planet. Sc. Lett., 496, 47–56, 2018.
Oppo, D. W., Curry, W. B., and McManus, J. F.: What do benthic δ13C and δ18O data tell us about Atlantic circulation during Heinrich Stadial 1?, Paleoceanography, 30, 353–368, 2015.
Peck, V. L., Hall, I. R., Zahn, R., Elderfield, H., Grousset, F., Hemming, S. R., and Scourse, J. D.: High resolution evidence for linkages between NW European ice sheet instability and Atlantic Meridional Overturning Circulation, Earth Planet. Sc. Lett., 243, 476–488, 2006.
Peck, V. L., Hall, I. R., Zahn, R., and Scourse, J. D.: Progressive reduction in NE Atlantic intermediate water ventilation prior to Heinrich events: Response to NW European ice sheet instabilities?, Geochem. Geophy. Geosy., 8, Q01N10, https://doi.org/10.1029/2006GC001321, 2007.
Rasmussen, S. O., Bigler, M., Blockley, S. P., Blunier, T., Buchardt, S. L., Clausen, H. B., Cvijanovic, I., Dahl-Jensen, D., Johnsen, S. J., and Fischer, H.: A stratigraphic framework for abrupt climatic changes during the Last Glacial period based on three synchronized Greenland ice-core records: refining and extending the INTIMATE event stratigraphy, Quaternary Sci. Rev., 106, 14–28, 2014.
Schmittner, A. and Lund, D. C.: Early deglacial Atlantic overturning decline and its role in atmospheric CO2 rise inferred from carbon isotopes (δ13C), Clim. Past, 11, 135–152, https://doi.org/10.5194/cp-11-135-2015, 2015.
Schmittner, A., Gruber, N., Mix, A. C., Key, R. M., Tagliabue, A., and Westberry, T. K.: Biology and air–sea gas exchange controls on the distribution of carbon isotope ratios (δ13C) in the ocean, Biogeosciences, 10, 5793–5816, https://doi.org/10.5194/bg-10-5793-2013, 2013.
Schmittner, A., Bostock, H. C., Cartapanis, O., Curry, W. B., Filipsson, H. L., Galbraith, E. D., Gottschalk, J., Herguera, J. C., Hoogakker, B., Jaccard, S. L., Lisiecki, L. E., Lund, D. C., Martínez-Méndez, G., Lynch-Stieglitz, J., Mackensen, A., Michel, E., Mix, A. C., Oppo, D. W., Peterson, C. D., Repschläger, J., Sikes, E. L., Spero, H. J., and Waelbroeck, C.: Calibration of the carbon isotope composition (δ13C) of benthic foraminifera, Paleoceanography, 32, 512–530, https://doi.org/10.1002/2016PA003072, 2017.
Skinner, L. and Shackleton, N.: Deconstructing Terminations I and II: revisiting the glacioeustatic paradigm based on deep-water temperature estimates, Quaternary Sci. Rev., 25, 3312–3321, 2006.
Takahashi, T., Broecker, W. S., and Langer, S.: Redfield ratio based on chemical data from isopycnal surfaces, J. Geophys. Res.-Oceans, 90, 6907–6924, https://doi.org/10.1029/JC090iC04p06907, 1985.
Tjiputra, J. F., Schwinger, J., Bentsen, M., Morée, A. L., Gao, S., Bethke, I., Heinze, C., Goris, N., Gupta, A., He, Y.-C., Olivié, D., Seland, Ø., and Schulz, M.: Ocean biogeochemistry in the Norwegian Earth System Model version 2 (NorESM2), Geosci. Model Dev., 13, 2393–2431, https://doi.org/10.5194/gmd-13-2393-2020, 2020.
Toucanne, S., Soulet, G., Vázquez Riveiros, N., Boswell, S. M., Dennielou, B., Waelbroeck, C., Bayon, G., Mojtahid, M., Bosq, M., and Sabine, M.: The North Atlantic Glacial Eastern Boundary Current as a Key Driver for Ice-Sheet – AMOC Interactions and Climate Instability, Paleoceanogr. Paleoclimatol., 36, e2020PA004068, https://doi.org/10.1029/2020PA004068, 2021.
Vidal, L., Labeyrie, L., Cortijo, E., Arnold, M., Duplessy, J. C., Michel, E., Becqué, S., and van Weering, T. C. E.: Evidence for changes in the North Atlantic Deep Water linked to meltwater surges during the Heinrich events, Earth Planet. Sc. Lett., 146, 13–26, 1997.
Voigt, I., Cruz, A., Mulitza, S., Chiessi, C., Mackensen, A., Lippold, J., Antz, B., Zabel, M., Zhang, Y., and Barbosa, C.: Variability in mid-depth ventilation of the western Atlantic Ocean during the last deglaciation, Paleoceanography, 32, 948–965, 2017.
Waelbroeck, C., Skinner, L. C., Labeyrie, L., Duplessy, J.-C., Michel, E., Vazquez Riveiros, N., Gherardi, J.-M., and Dewilde, F.: The timing of deglacial circulation changes in the Atlantic, Paleoceanography, 26, PA3213, https://doi.org/10.1029/2010PA002007, 2011.
Waelbroeck, C., Pichat, S., Böhm, E., Lougheed, B. C., Faranda, D., Vrac, M., Missiaen, L., Vazquez Riveiros, N., Burckel, P., Lippold, J., Arz, H. W., Dokken, T., Thil, F., and Dapoigny, A.: Relative timing of precipitation and ocean circulation changes in the western equatorial Atlantic over the last 45 ky, Clim. Past, 14, 1315–1330, https://doi.org/10.5194/cp-14-1315-2018, 2018.
Waelbroeck, C., Lougheed, B. C., Vazquez Riveiros, N., Missiaen, L., Pedro, J., Dokken, T., Hajdas, I., Wacker, L., Abbott, P., Dumoulin, J.-P., Thil, F., Eynaud, F., Rossignol, L., Fersi, W., Albuquerque, A. L., Arz, H., Austin, W. E. N., Came, R., Carlson, A. E., Collins, J. A., Dennielou, B., Desprat, S., Dickson, A., Elliot, M., Farmer, C., Giraudeau, J., Gottschalk, J., Henderiks, J., Hughen, K., Jung, S., Knutz, P., Lebreiro, S., Lund, D. C., Lynch-Stieglitz, J., Malaizé, B., Marchitto, T., Martínez-Méndez, G., Mollenhauer, G., Naughton, F., Nave, S., Nürnberg, D., Oppo, D., Peck, V., Peeters, F. J. C., Penaud, A., Portilho-Ramos, R. d. C., Repschläger, J., Roberts, J., Rühlemann, C., Salgueiro, E., Sanchez Goni, M. F., Schönfeld, J., Scussolini, P., Skinner, L. C., Skonieczny, C., Thornalley, D., Toucanne, S., Rooij, D. V., Vidal, L., Voelker, A. H. L., Wary, M., Weldeab, S., and Ziegler, M.: Consistently dated Atlantic sediment cores over the last 40 thousand years, Scient. Data, 6, 165, https://doi.org/10.1038/s41597-019-0173-8, 2019.
Waelbroeck, C., Tjiputra, J., Guo, C., Nisancioglu, K. H., Jansen, E., Vazquez Riveiros, N., Toucanne, S., Eynaud, F., Rossignol, L., Dewilde, F., Marches, E., Lebreiro, S., and Nave, S.: Atlantic circulation changes across a stadial-interstadial transition, SEANOE [data set], https://doi.org/10.17882/91130, 2022.
Willamowski, C. and Zahn, R.: Upper ocean circulation in the glacial North Atlantic from benthic foraminiferal isotopie and trace element fingerprinting, Paleoceanography, 15, 515–527, 2000.
Wolff, E. W., Chappellaz, J., Blunier, T., Rasmussen, S. O., and Svensson, A.: Millennial-scale variability during the last glacial: The ice core record, Quaternary Sci. Rev., 29, 2828–2838, 2010.
Zahn, R., Winn, K., and Sarnthein, M.: Benthic foraminiferal δ13C and accumulation rates of organic carbon: Uvigerina peregrina group and Cibicidoides wuellerstorfi, Paleoceanography, 1, 27–42, 1986.