the Creative Commons Attribution 4.0 License.
the Creative Commons Attribution 4.0 License.
 | 15 Mar 2023
The new Kr-86 excess ice core proxy for synoptic activity: West Antarctic storminess possibly linked to Intertropical Convergence Zone (ITCZ) movement through the last deglaciation
Christo Buizert
Sarah Shackleton
Jeffrey P. Severinghaus
William H. G. Roberts
Alan Seltzer
Bernhard Bereiter
Kenji Kawamura
Daniel Baggenstos
Anaïs J. Orsi
Ikumi Oyabu
Benjamin Birner
Jacob D. Morgan
Edward J. Brook
David M. Etheridge
David Thornton
Nancy Bertler
Rebecca L. Pyne
Robert Mulvaney
Ellen Mosley-Thompson
Peter D. Neff
Vasilii V. Petrenko
Here we present a newly developed ice core gas-phase proxy that directly samples a component of the large-scale atmospheric circulation: synoptic-scale pressure variability. Surface pressure changes weakly disrupt gravitational isotopic settling in the firn layer, which is recorded in krypton-86 excess (86Krxs). The 86Krxs may therefore reflect the time-averaged synoptic pressure variability over several years (site “storminess”), but it likely cannot record individual synoptic events as ice core gas samples typically average over several years. We validate 86Krxs using late Holocene ice samples from 11 Antarctic ice cores and 1 Greenland ice core that collectively represent a wide range of surface pressure variability in the modern climate. We find a strong spatial correlation (, p<0.01) between site average 86Krxs and time-averaged synoptic variability from reanalysis data. The main uncertainties in the analysis are the corrections for gas loss and thermal fractionation and the relatively large scatter in the data. Limited scientific understanding of the firn physics and potential biases of 86Krxs require caution in interpreting this proxy at present. We show that Antarctic 86Krxs appears to be linked to the position of the Southern Hemisphere eddy-driven subpolar jet (SPJ), with a southern position enhancing pressure variability.
We present a 86Krxs record covering the last 24 kyr from the West Antarctic Ice Sheet (WAIS) Divide ice core. Based on the empirical spatial correlation of synoptic activity and 86Krxs at various Antarctic sites, we interpret this record to show that West Antarctic synoptic activity is slightly below modern levels during the Last Glacial Maximum (LGM), increases during the Heinrich Stadial 1 and Younger Dryas North Atlantic cold periods, weakens abruptly at the Holocene onset, remains low during the early and mid-Holocene, and gradually increases to its modern value. The WAIS Divide 86Krxs record resembles records of monsoon intensity thought to reflect changes in the meridional position of the Intertropical Convergence Zone (ITCZ) on orbital and millennial timescales such that West Antarctic storminess is weaker when the ITCZ is displaced northward and stronger when it is displaced southward. We interpret variations in synoptic activity as reflecting movement of the South Pacific SPJ in parallel to the ITCZ migrations, which is the expected zonal mean response of the eddy-driven jet in models and proxy data. Past changes to Pacific climate and the El Niño–Southern Oscillation (ENSO) may amplify the signal of the SPJ migration. Our interpretation is broadly consistent with opal flux records from the Pacific Antarctic zone thought to reflect wind-driven upwelling.
We emphasize that 86Krxs is a new proxy, and more work is called for to confirm, replicate, and better understand these results; until such time, our conclusions regarding past atmospheric dynamics remain speculative. Current scientific understanding of firn air transport and trapping is insufficient to explain all the observed variations in 86Krxs. A list of suggested future studies is provided.
- Article
(10877 KB) - Full-text XML
- BibTeX
- EndNote


1.1 Motivation and objectives
Proxy records from around the globe show strong evidence for past changes in Earth's atmospheric circulation and hydrological cycle that often far exceed those seen in the relatively short instrumental period.
For example, low-latitude records of riverine discharge captured in ocean sediments (Peterson et al., 2000) and isotopic composition of meteoric water captured in dripstone calcite (Cheng et al., 2016) suggest large variations in tropical hydrology and monsoon strength, commonly interpreted as meridional migrations of the Intertropical Convergence Zone or ITCZ (Chiang and Friedman, 2012; Schneider et al., 2014). Such ITCZ movement is seen in response to insolation changes linked to planetary orbit (Cruz et al., 2005) as well as in response to the abrupt millennial-scale Dansgaard–Oeschger (D–O) and Heinrich cycles of the North Atlantic (Kanner et al., 2012; Wang et al., 2001); the organizing principle is that the ITCZ follows the thermal Equator and therefore migrates towards the warmer (or warming) hemisphere (Broccoli et al., 2006; Chiang and Bitz, 2005).
As a second example, the intensity of the El Niño–Southern Oscillation (ENSO), the dominant mode of global interannual climate variability, has changed through time. A variety of proxy data suggest that ENSO activity in the 20th century was much stronger than in preceding centuries (Emile-Geay et al., 2015; Fowler et al., 2012; Gergis and Fowler, 2009; Thompson et al., 2013). The vast majority of data and model studies suggest weakened ENSO strength in the middle and early Holocene, likely in response to stronger orbitally driven NH summer insolation at that time (Braconnot et al., 2012; Cane, 2005; Clement et al., 2000; Driscoll et al., 2014; Koutavas et al., 2006; Liu et al., 2000, 2014; Moy et al., 2002; Rein et al., 2005; Tudhope et al., 2001; Zheng et al., 2008); yet other studies suggest there may not be such a clear trend and simply more variability (Cobb et al., 2013). Intensification of ENSO (or perhaps a more El Niño-like mean state) may have occurred during the North Atlantic cold phases of the abrupt D–O and Heinrich cycles (Braconnot et al., 2012; Merkel et al., 2010; Stott et al., 2002; Timmermann et al., 2007). Overall, understanding past and future ENSO variability remains extremely challenging (Cai et al., 2015).
As a last example, the strength and meridional position of the Southern Hemisphere westerlies (SHWs) are thought to have changed in the past, which, via Southern Ocean wind-driven upwelling, has potential implications for the global overturning circulation (Marshall and Speer, 2012) and for carbon storage in the abyssal ocean (Anderson et al., 2009; Russell et al., 2006; Toggweiler et al., 2006). The SHWs are thought to have been shifted equatorward (Kohfeld et al., 2013) during the Last Glacial Maximum (LGM), a shift on which climate models disagree (Rojas et al., 2009; Sime et al., 2013). During the abrupt D—O and Heinrich cycles, the SHWs move in parallel with the aforementioned migrations of the ITCZ in both data (Buizert et al., 2018; Marino et al., 2013; Markle et al., 2017) and models (Lee et al., 2011; Pedro et al., 2018; Rind et al., 2001).
As these examples clearly illustrate, evidence of past changes to the large-scale atmospheric circulation is widespread. However, proxy evidence of such past changes is typically indirect – for example via isotopes in precipitation, sea surface temperature, ocean frontal positions, windblown dust, or ocean upwelling – complicating their interpretation. Here we present a newly developed noble-gas-based ice core proxy, Kr-86 excess (86Krxs), that directly samples a component of the large-scale atmospheric circulation: synoptic-scale pressure variability. Owing to the firn air residence time of several years (Buizert et al., 2013) and the gradual bubble trapping process, each ice core sample contains a distribution of gas ages rather than a single age. Therefore, 86Krxs does not record the passing of individual weather systems, but rather the time-averaged intensity of synoptic-scale barometric variability.
Here we provide the first complete description of this new proxy. We validate and calibrate 86Krxs using late Holocene ice core samples from locations around Antarctica and Greenland that represent a wide range of pressure variability in the modern climate. We discuss the difficulties in using this proxy (analytical precision, surface melt, corrections for sample gas loss and thermal fractionation). Next, we use reanalysis data to better understand the drivers of surface pressure variability in Antarctica. Last, we present 86Krxs records from the Antarctic WAIS Divide ice core through the last deglaciation.
1.2 Gravitational disequilibrium and Kr-86 excess
The upper 50–100 m of the ice sheet accumulation zone consists of firn, the unconsolidated intermediate stage between snow and ice. An interconnected pore network exists within the firn, in which gas transport is dominated by molecular diffusion (Schwander et al., 1993). Diffusion in this stagnant air column results in gravitational enrichment in heavy gas isotopic ratios such as –N2, , and (Schwander, 1989; Sowers et al., 1992). In gravitational equilibrium, all these gases attain the same degree of isotopic enrichment per unit mass difference:
with Δm the isotopic mass difference ( kg mol−1), g the gravitational acceleration, z the depth, R the gas constant, and T the temperature in Kelvin.
Besides molecular diffusion, firn air is mixed and transported via three other processes: downward advection with the sinking ice matrix, convective mixing (used in the firn air literature as an umbrella term to denote vigorous air exchange with the atmosphere via, e.g., wind pumping and seasonal convection), and dispersive mixing. These last three transport processes are all driven by large-scale air movement that does not distinguish between isotopologues, and we refer to them collectively as macroscopic air movement. Of particular interest for our proxy is dispersive mixing, which is driven by surface pressure variations. When a low-pressure (high-pressure) system moves into the site, firn air at all depth levels is forced upwards (downwards) to reach hydrostatic equilibrium with the atmosphere – a process called barometric pumping. One can think of the firn layer “breathing” in and out in response to a rising and falling barometer, respectively. Because firn has a finite dispersivity (Schwander et al., 1988), this air movement mixes the interstitial firn air. Note that an upward air movement also exists in the firn column relative to the overall downward advection of the ice, which is caused by the slow reduction of porosity with depth (Rommelaere et al., 1997). This upward airflow due to gradual pore closure (around 10−9 to 10−8 m s−1) is orders of magnitude smaller than the flows driven via barometric pumping (around 10−6 m s−1) and therefore neglected here (Buizert and Severinghaus, 2016).
Any type of macroscopic air movement disturbs the gravitational settling, reducing isotopic enrichment below δgrav. Let δ86Kr, δ40Ar, and δ15N refer to deviations of , , and , respectively, from their ratios in the well-mixed atmosphere. Gases that diffuse faster (such as N2) will always be closer to gravitational equilibrium than gases that diffuse slower (such as Kr), and in the absence of thermal fractionation . The isotopic differences – and –δ15N thus reflect the degree of gravitational disequilibrium. The magnitudes of the isotopic disequilibria scale in a predictable way following the molecular diffusion coefficients (Birner et al., 2018); because the diffusion coefficients of N2 and Ar are very similar, their disequilibria are comparable in magnitude. We define Kr-86 excess using the Kr and Ar isotopic difference:
where the “corr” subscript denotes a correction for gas loss (Appendix A1) and thermal fractionation (Appendix A2). The rationale for including a normalization in the denominator is discussed below. An alternative Kr-86 excess definition is possible using δ15N instead of δ40Ar:
Note that both definitions rely on having measurements of three isotope ratios (δ86Kr, δ40Ar, and δ15N), as the thermal correction requires δ40Ar and δ15N to be known. The 86Krxs40 definition is preferred because per unit mass difference δ40Ar is less sensitive to thermal fractionation than δ15N is (Grachev and Severinghaus, 2003a, b); this makes it more suitable for interpreting time series. Unless explicitly stated otherwise, we use 86Krxs40 as our definition of Kr-86 excess. The 86Krxs15 does provide a way to check the validity of 86Krxs40 time series, and indeed we find good correspondence between both definitions for the WDC deglacial time series (compare, for example, Figs. A3 and A4). Because the disequilibrium signal is small, we express 86Krxs in units of per meg (parts per million) of gravitational disequilibrium per per mil of gravitational enrichment. This unit (per meg ‰−1) is mathematically identical to per mil, but we use it to emphasize the normalization in the denominator.
In the (theoretical) case of full gravitational equilibrium (and no gas loss or thermal fractionation), , and therefore 86Krxs=0. Any type of macroscopic mixing will cause , and thus 86Krxs<0. In this sense 86Krxs is a quantitative measure for the degree of gravitational disequilibrium in the firn layer (Birner et al., 2018; Buizert and Severinghaus, 2016).
Kawamura et al. (2013) first describe this gravitational disequilibrium (or kinetic) fractionation effect at the Megadunes site (Severinghaus et al., 2010), where deep firn cracking leads to a 23 m thick convective zone. They suggest that the isotopic disequilibrium can be used to estimate past convective zone thickness. We show here that sites with small convective zones can nevertheless have very negative 86Krxs, and instead we suggest that the ice core 86Krxs is dominated by dispersive mixing driven by barometric pumping from time-averaged synoptic-scale pressure variability.
The principle behind 86Krxs is illustrated with idealized firn model experiments in Fig. 1. In the absence of dispersive mixing (Fig. 1a, left panel), all isotope ratios approach δgrav and δ86Kr–δ40Ar is close to zero – but not exactly zero owing to downward air advection. Next, we replace a fraction f of the molecular diffusion with dispersive mixing. With dispersive mixing at f=0.1 and f=0.2 of total mixing (middle and right panels, respectively), isotopic enrichment is progressively reduced below δgrav (dashed line), making δ86Kr–δ40Ar (and consequently 86Krxs) increasingly negative.

Figure 1Idealized firn air transport model experiments of 86Krxs. Firn density is calculated using Herron and Langway (1980) and the diffusivity using Schwander (1989). (a) Simulations using a fraction of dispersive mixing of f=0 (left panel), f=0.1 (middle panel), and f=0.2 (right panel) for a hypothetical site with an accumulation rate of A=2 cm a−1 ice equivalent and mean annual temperature ∘C. At dispersive fraction f, effective molecular diffusivity of all gases is multiplied by (1-f) and dispersive mixing for all gases is set equal to f times the effective molecular diffusivity of CO2. (b) Isotopic disequilibrium as a function of dispersive mixing intensity at two different firn thicknesses of around 100 m (dashed, A=2 cm a−1 and ∘C) and 50 m (solid, A=2 cm a−1 and ∘C). We compare isotopic disequilibrium without (blue, left axis) and with (orange, right axis) normalization. (c) Simulations at 10 % dispersive mixing, with each dot representing different climatic conditions. The accumulation rate is A=2 cm a−1 ice equivalent, and mean annual temperature is changed from −60 to −30 ∘C in steps of 5 ∘C.
The ratio of macroscopic over diffusive transport is expressed via the dimensionless Péclet number, given here for advection and dispersion:
where PeX is the Péclet number for gas X, wair the (downward) advective air velocity, L a characteristic length scale, DX the diffusion coefficient for gas X, and Ddisp the dispersion coefficient (Buizert and Severinghaus, 2016). In agreement with earlier studies (Birner et al., 2018; Kawamura et al., 2013), we find that δ86Kr–δ40Ar is maximized when molecular mixing and dispersive mixing are equal in magnitude (f=0.5, Fig. 1b), corresponding to PeX≈1. Note that 86Krxs responds more linearly to f than δ86Kr–δ40Ar does due to δ40Ar in the denominator of Eq. (2).
In a last idealized experiment, we keep the fraction of dispersion fixed at f=0.1 while we reduce the thickness of the firn column by increasing the site temperature (Fig. 1c). We find that δ86Kr–δ40Ar scales linearly with firn thickness, here represented by δ40Ar on the x axis. However, 86Krxs remains essentially constant due to the normalization by δ40Ar in the denominator of Eq. (2). The normalization step is thus necessary to enable meaningful comparison between different sites and time periods that all have different firn thicknesses. For this reason, the definition of 86Krxs used here has been updated from the original definition by Buizert and Severinghaus (2016).
Note that these highly idealized experiments assume dispersive mixing to be a fixed fraction of total transport throughout the firn column, equivalent to a constant Péclet number in the diffusive zone (a convective zone is absent in these simulations). In reality, the Péclet number varies greatly on all spatial scales. On the macroscopic scale (>1 m), Pe reflects the various transport regimes (Sowers et al., 1992), being highest in the convective and lock-in zones. On the microscopic scale (<1 cm), hydraulic conductance scales as ∝r4 (with r the pore radius), whereas the diffusive conductance scales as ∝r2. This means that the Darcy flow associated with barometric pumping will concentrate in the widest pores and pathways, leading to a range of effective Péclet numbers within a single sample of firn. At intermediate spatial scales of a few centimeters, firn density layering introduces strong heterogeneity in transport properties. It is unclear at present whether the competition between diffusive and non-diffusive transport, which occurs at the microscopic pore level, can be accurately represented in macroscopic firn air models via a linear parameterization as is the current practice.
2.1 Ice core sites
In this study we use ice samples from 11 ice cores drilled in Antarctica and 1 in Greenland. The Antarctic sites are the West Antarctic Ice Sheet (WAIS) Divide core (WDC06A, or WDC), Siple Dome (SDM), James Ross Island (JRI), Bruce Plateau (BRP), Law Dome DE08, Law Dome DE08-OH, Law Dome DSSW20K, Roosevelt Island Climate Evolution (RICE), Dome Fuji (DF), EPICA (European Project for Ice Coring in Antarctica) Dome C (EDC), and South Pole Ice Core (SPC14, or SP). Ice core locations in Antarctica are shown in Fig. 2a. In Greenland, we use samples from the Greenland Ice Sheet Project 2 (GISP2).
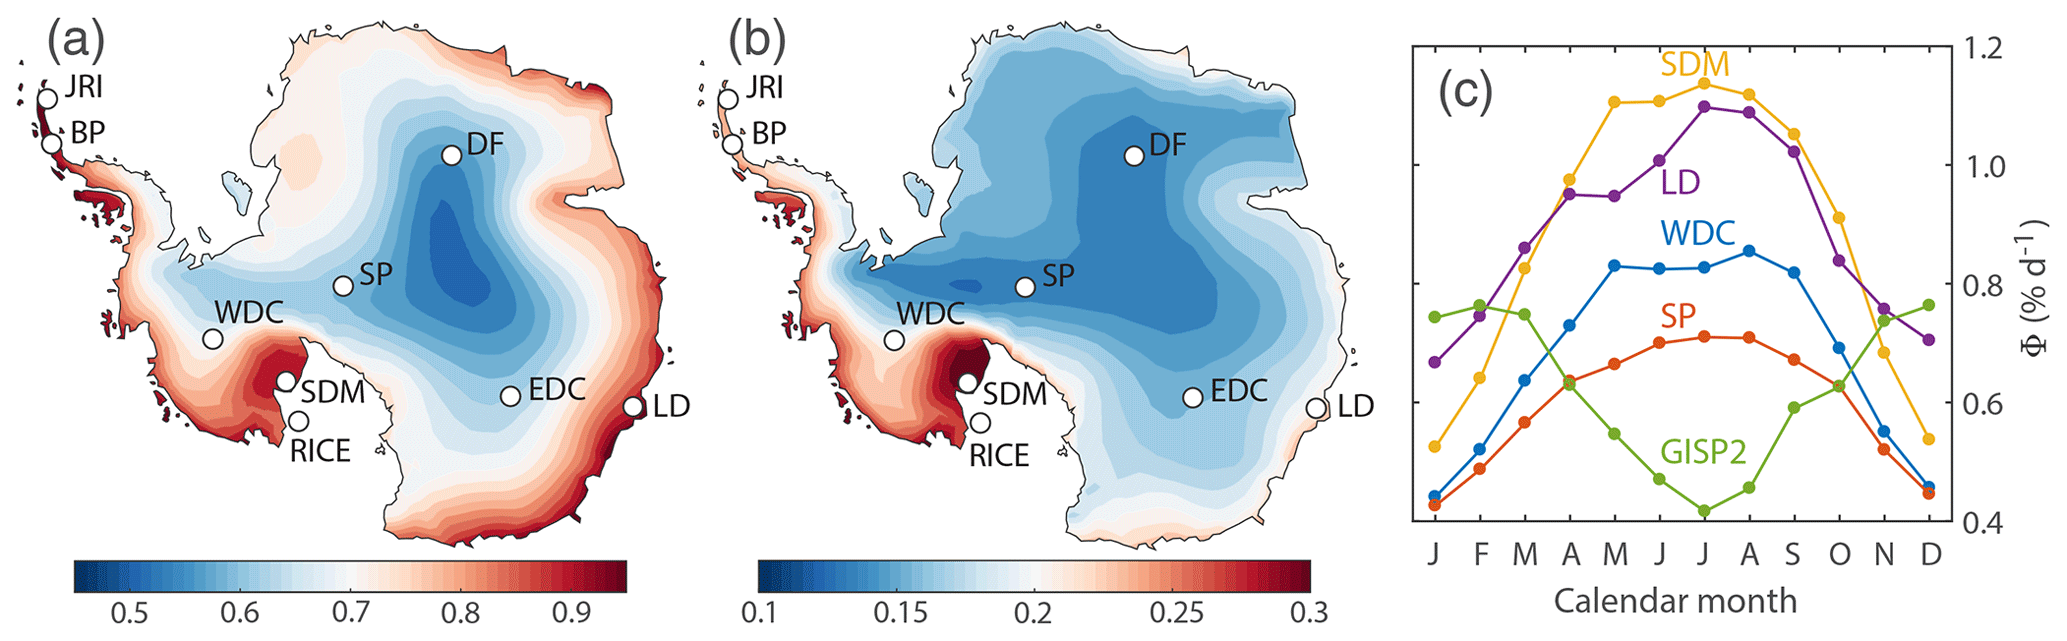
Figure 2Calibrating Kr-86 excess. (a) Annual mean Φ in Antarctica over 1979–2017 in units of percent per day (% d−1). (b) Interannual variability (1σ standard deviation) of annual mean Φ over 1979–2017 in units of percent per day (% d−1). (c) Annual cycle in Φ for 1979–2017 for the indicated site.
We shall refer to late Holocene data from these sites as the calibration dataset, analogous to a core-top dataset in the sediment coring literature. Site characteristics, coordinates, and number of samples included in the calibration dataset are given in Table 1. The DE08-OH site is a recent revisit of the Law Dome DE08 site. The DE08-OH core was measured at sub-annual resolution to understand centimeter-scale 86Krxs variations due to, for example, layering in firn density and bubble trapping (Appendix B). In addition to the calibration dataset, we present a record of Kr-86 excess going back to the LGM from WDC.
Table 1Ice core sites used in this study, with N the number of samples included in the calibration study. See the main text for acronyms.
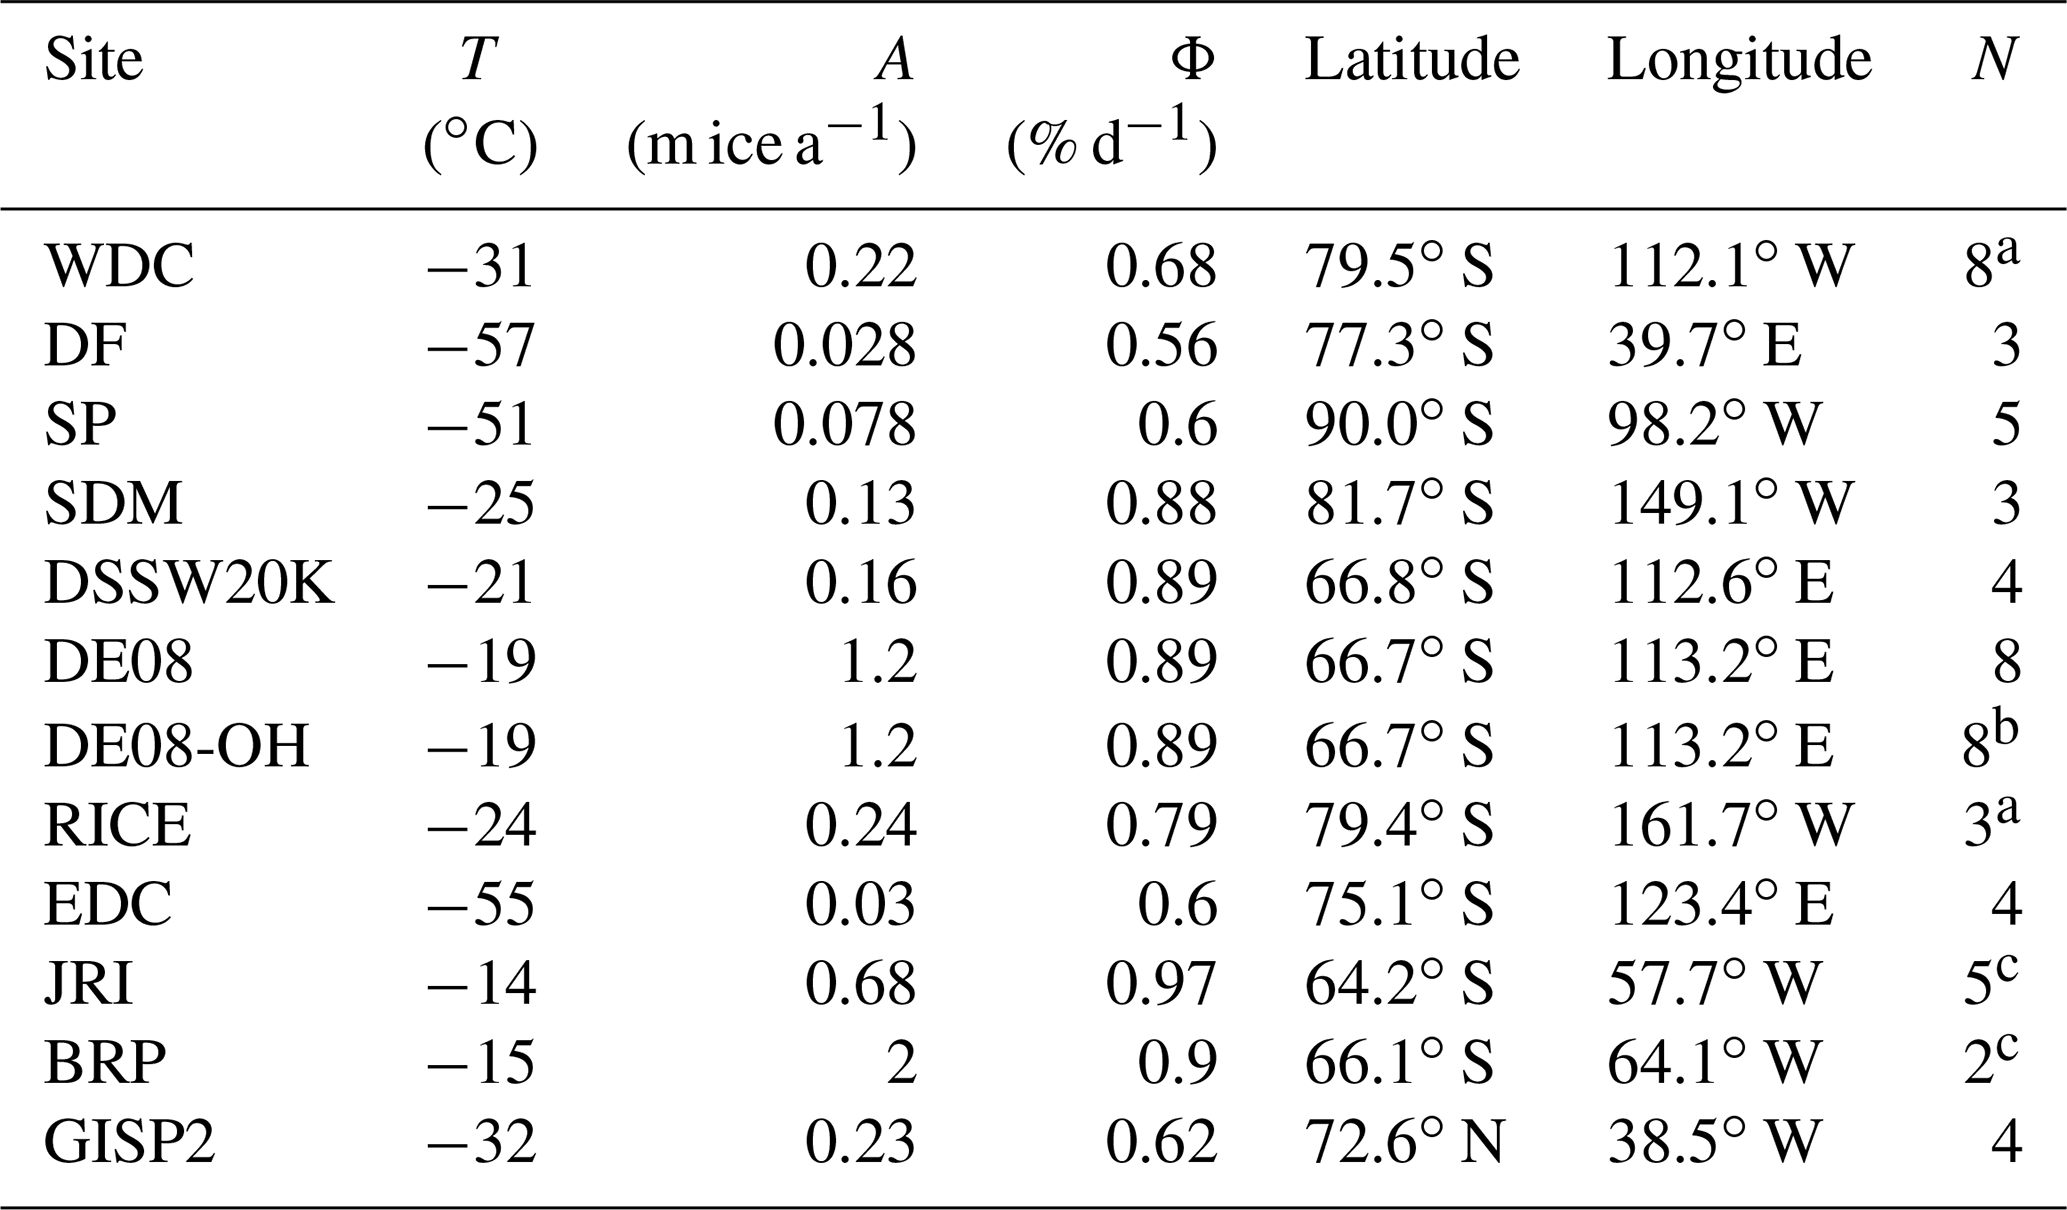
a Not including one sample rejected due to technical problems. b Only shallow samples due to strong gas loss in deeper samples attributed to warm storage conditions. c Refrozen meltwater present as indicated by elevated ratio.
2.2 Ice sample analysis
We broadly follow analytical procedures described elsewhere (Bereiter et al., 2018a, b; Headly and Severinghaus, 2007; Severinghaus et al., 2003). In short, an 800 g ice sample, its edges trimmed with a band saw to expose fresh surfaces, is placed in a chilled vacuum flask that is then evacuated for 20 min using a turbomolecular pump. Air is extracted from the ice by melting the sample while stirring vigorously with a magnetic stir bar, led through a water trap, and cryogenically trapped in a dip tube immersed in liquid He. Next, the sample is split into two unequal fractions. The smaller fraction (about 2 % of total air) is analyzed for δ15N–N2, δ18O–O2, , and on a 3 kV Thermo Finnigan Delta V plus dual inlet IRMS (isotope ratio mass spectrometer). In the larger fraction, noble gases are isolated via hot gettering to remove reactive gases. The purified noble gases are then analyzed for , , , , , , and on a 10 kV Thermo Finnigan MAT253 dual-inlet IRMS. We reject one sample from RICE due to incomplete sample transfer and one sample from WDC due to problems with the water trap. Calibration is done for each measurement campaign by running samples of La Jolla pier air.
All calibration (core-top) data were measured using Method 2 as described by Bereiter et al. (2018a), with a longer equilibration time during the splitting step than used in that study to improve isotopic equilibration between the fractions. The exception is the DE08-OH site, where the ice sample (rather than the extracted gas sample) was split into two fractions – the advantage of this approach is that it does not require a gas splitting step that is time-consuming and may fractionate the isotopes; the downside is that the samples may have slightly different isotopic composition due to the stochastic nature of bubble trapping and the different gas loss histories of the ice pieces.
Measurements of the WDC downcore dataset were performed over five separate measurement campaigns that occurred in February–April 2014, February–April 2015, August 2015, August 2020, and August 2021. The first three campaigns are described by Bereiter et al. (2018b), in which the 86Krxs data are a by-product of measuring for reconstructing global mean ocean temperature. Campaigns 1 and 2 are in good agreement, whereas campaign 3 appears offset from the other two by an amount that exceeds the analytical precision (offset around 35 per meg ‰−1). To validate the main features in the record, we performed two additional campaigns (4 and 5), in which all the gas extracted from each ice sample was quantitatively gettered and only analyzed for Ar and Kr isotopic composition. The downcore record, as well as the five analytical campaigns, is discussed in detail in Sect. 5.1. Data from the bubble–clathrate transition zone (here 1000 to 1600 m depth, or ∼4 ka to 7 ka) are excluded owing to the potential for artifacts; the depth range of the bubble–clathrate transition zone is based on observed positive anomalies in in WDC ice.
All samples were analyzed at the Scripps Institution of Oceanography, USA, with the exception of the EDC samples, which were analyzed at University of Bern, Switzerland (Baggenstos et al., 2019). Some of the EDC samples analyzed had clear evidence of drill liquid contamination, which acts to artifactually lower 86Krxs via isobaric interference on mass 82; the late Holocene data used here were not flagged for drill liquid contamination (Baggenstos et al., 2019).
The 2σ analytical precision of the δ15N, δ40Ar, and δ86Kr measurements is around 3, 5, and 26 per meg, respectively, based on the reproducibility of La Jolla air measurements. Via standard error propagation, this results in a ∼22 per meg ‰−1 (2σ) analytical uncertainty for both 86Krxs40 and 86Krxs15 at a site like WDC where δ40Ar≈1.2 ‰. We have no true (same-depth) replicates to assess the reproducibility of 86Krxs measurements experimentally. The measured isotope ratios are corrected for gas loss () and thermal fractionation (, , ) before interpretation; details on these corrections are given in Appendix A. For the core-top calibration study, the average magnitude of the gas loss and thermal fractionation corrections is +14 and −15 per meg ‰−1 in 86Krxs, respectively. Note that these two corrections both involve the δ40Ar isotopic ratio, and therefore they are not independent from each other and not additive – in other words, the total correction is not simply the sum of the two individual corrections.
Our study includes two ice cores from the Antarctic Peninsula: BRP (two ice samples) and JRI (five ice samples). Measured ratios (and to a lesser extent the ratios) in all samples from both locations are significantly elevated above the expected gravitational enrichment signal (Fig. A1a), which is clear evidence for the presence of refrozen meltwater in these samples (Orsi et al., 2015). Like xenon, krypton is highly soluble in (melt)water, and therefore 86Krxs cannot be reliably measured in these samples; we reject all samples from the BRP and JRI sites. It is notable that all samples from both sites show evidence of refrozen meltwater, given that the high-accumulation BRP core is nearly entirely free of visible melt layers and that we carefully selected samples without visible melt features at JRI. Visible ice lenses form only when meltwater pools and refreezes on top of low-permeability layers such as wind crusts; our observations suggest meltwater can also refreeze throughout the firn in a way that cannot be detected visually.
The 86Krxs proxy for synoptic activity was first proposed on theoretical grounds by Buizert and Severinghaus (2016) – here we provide the first experimental validation of this proxy using a core-top calibration of 86Krxs using late Holocene ice core samples from nine locations around Antarctica and one in Greenland that represent a wide range of pressure variability in the modern climate (here: 1979–2017 CE).
3.1 Spatial variation in synoptic-scale pressure variability
Kr-86 excess is sensitive to air movement (both upward and downward), which in turn is controlled by the magnitude of relative air pressure change. Let pi be a time series of (synoptic-scale) site surface pressure with N data points, time resolution Δt, and mean value . The time series can span a month, year, or multi-year period, with potentially different for each month or year. We define the parameter Φ as
which we express here in convenient units of percent per day (% d−1). Φ reflects the intensity of barometric pumping in the firn column. Note that Δt should be larger than ∼1 h, which is the timescale for the entire firn column to equilibrate with the surface pressure (Buizert and Severinghaus, 2016), and smaller than about a day in order to adequately resolve synoptic-scale pressure events. Here we use ERA-Interim reanalysis data from 1979–2017 with Δt=6 h (Dee et al., 2011), from which we calculate monthly and annual Φ values using Eq. (5). A map of annual mean Φ across Antarctica is given in Fig. 2a. At all sites considered, Φ has a strong seasonal cycle with pressure variability and storminess being strongest in the local winter season (Fig. 2c). Interannual differences in Φ are greatest along the Siple coast and coastal West Antarctica (Fig. 2b), mainly reflecting the influence of central Pacific (ENSO, Pacific Decadal Oscillation – PDO) climate variability (Sect. 4).
3.2 Kr-86 excess proxy calibration
Present-day Antarctica has a wide range of Φ (Fig. 2a), which allows us to validate and calibrate 86Krxs. In Fig. 3a we plot the site mean 86Krxs40 (with ±1σ error bars) as a function of Φ (averaged over full 1979–2017 period). We find a Pearson correlation coefficient of when using site mean 86Krxs40 and when using the 86Krxs40 of individual samples (p<0.01). Note that in this particular case the site mean 86Krxs40 and 86Krxs15 are identical (because by design, after thermal correction ); the error bars are different, though.

Figure 3Calibrating Kr-86 excess. (a) 86Krxs as a function of Φ for the calibration dataset. Circles give the site mean, and the error bars denote the ±1σ standard deviation between samples (uncertainty in corrections and measurements not included). The number of samples at each site is given in Table 1. The Pearson correlation coefficient is when considering site data means and when considering all individual samples. Data are corrected for gas loss using (Appendix A1) and corrected for thermal fractionation using site mean 15N excess (Appendix A2). The calibration curve for 86Krxs15 is identical in this case, with slightly larger error bars. (b) Correlation of the calibration curve as a function of the gas loss correction scaling parameter ε40. The solid line gives the correlation for both site mean 86Krxs15 and 86Krxs40 (identical); the dashed lines show the correlation using individual samples for 86Kxs40 (blue) and 86Krxs15 (orange). Triangles denote the ε40 estimate from the Byrd, Siple, and GISP2 ice cores (Fig. A2; Kobashi et al., 2008a; Severinghaus et al., 2003).
The 86Krxs data have been corrected for gas loss (Appendix A1) and thermal fractionation (Appendix A2), with the gas loss correction being the more uncertain component. Figure 3b shows the correlations of the calibration curve as a function of the gas loss scaling parameter ε40. We find a good correlation over a wide range of ε40 values, proving our calibration is not dependent on the choice of ε40. When using uncorrected 86Krxs40 data the site mean correlation is ; when applied individually, both the gas loss and thermal correction each improve the correlation to and , respectively (Fig. A3, all p<0.05). Based on these tests we conclude that the observed relationship is not an artifact of the applied corrections. The applied corrections improve the correlation, which increases confidence in the method. The calibration results for 86Krxs15 are shown in Fig. A4.
Notably, there is a large spread in 86Krxs across samples from any single site, particularly at the high-Φ sites of SDM and RICE (Fig. 3a, note the ±1σ error bars). This spread is larger than the measurement uncertainty, and we believe this variance reflects a signal that is truly present in the ice. The Siple coast and Roosevelt Island experience the largest Φ interannual differences in Antarctica (Fig. 2b), and it is therefore likely that our coarse sampling is aliasing the true 86Krxs signal. The variance in 86Krxs may also contain climate information.
Both theoretical considerations and observations thus suggest 86Krxs is a proxy for time-averaged barometric surface pressure variability at the site, and in the remainder of this paper we will interpret it as such.
3.3 Discussion of the Kr-86 excess proxy
Our interpretation of 86Krxs as a proxy for time-averaged pressure variability is somewhat complicated by the possibility of deep convective zones, which have the same 86Krxs signature as barometric pumping. This was discovered at the Megadunes (MD) site, central East Antarctica; at this zero-accumulation site deep cracks form in the firn layer that facilitate a 23 m deep convection zone (Severinghaus et al., 2010). In fact, this observation led earlier work to suggest that noble gas gravitational disequilibrium may be used as a proxy for convective zone thickness (Kawamura et al., 2013) rather than synoptic-scale pressure variability as suggested here. Although megadunes and zero-accumulation zones are ubiquitous and cover 20 % of the Antarctic Plateau (Fahnestock et al., 2000), ice cores are seldom drilled in these areas and it is safe to assume that they never formed at sites like WAIS Divide that had relatively high accumulation rates even during the last glacial period. Performing the corrections for thermal and size-dependent fractionation is challenging at MD, and we suggest that the MD 86Krxs is in the range of −2 to −55 per meg ‰−1; even at the larger limit, this is still smaller in magnitude than 86Krxs anomalies at several modern-day sites with small convective zones (such as SDM, RICE, and the Law Dome sites), suggesting barometric pumping is capable of producing larger 86Krxs signals than even the most extreme observed case of convective surface mixing. Having 86Krxs measured in MD ice core (rather than firn air) samples would be valuable for a more meaningful comparison to the ice core sample measurements presented here. Windy sites can have substantial convective zones of ∼14 m (Kawamura et al., 2006), and future studies of 86Krxs at such sites would be valuable.
Currently, 1-D and 2-D firn air transport model simulations underestimate the magnitude of the 86Krxs signal compared to measurements in mature ice samples (Birner et al., 2018), complicating scientific understanding of the proxy. In these models, the effective molecular diffusivity of each gas is scaled linearly to its free air diffusivity. The ratio of krypton to argon free air diffusivity is 0.78. This ratio, which directly sets the magnitude of the simulated 86Krxs, may actually be smaller than 0.78 in real firn, as krypton is more readily adsorbed onto firn surfaces, retarding its movement (similar to gases moving through a gas chromatography column). This may be one explanation for why models simulate too little 86Krxs.
Another likely explanation for the model–data mismatch is that certain critical sub-grid processes (such as the aforementioned pore size dependence of the Péclet number) are not adequately represented in these models. Barometric pumping may further actively shape the pore network through the movement of water vapor, thereby keeping certain preferred pathways connected and open below the density at which percolation theory would predict their closure (Schaller et al., 2017). The fate of a pore restriction is determined by the balance between the hydrostatic pressure (that acts to close it) and vapor movement away from its convex surfaces (that acts to keep it open); we speculate that barometric Darcy airflow keeps high-flow channels connected longer by eroding convex surfaces. This enhances the complexity (and therefore dispersivity) of the deep firn pore network and possibly creates a nonlinear 86Krxs response to barometric pumping. The hypothesized channel formation in deep firn is driven by a positive feedback on flow volume and somewhat reminiscent of erosion-driven stream network formation in fluvial geomorphology.
Firn models predict that, after correcting for thermal fractionation, the deviation from gravitational equilibrium for the elemental ratios (such as ) should be proportional to that deviation in isotopic ratios. However, the observations suggest that the former is usually smaller than would be expected from the latter. As before, adsorption of Kr onto firn grain surfaces may contribute to the observed discrepancy, and laboratory tests of this process are called for. Further, the impacts of gas loss are greater on elemental ratios than on the isotopic ratios, which may also contribute. Including measurements of xenon isotopes and elemental ratios in future measurement campaigns may be able to provide additional constraints to better understand this discrepancy.
Measurements on firn air samples, where available, suggest a smaller 86Krxs anomaly in firn air than found in ice core samples from the same site. We attribute this in part to a seasonal bias that is introduced by the fact that firn air sampling always takes place during the summer months, whereas the synoptic variability that drives the Kr-86 excess anomalies is largest during the winter (Fig. 2c); consequently, firn air observations are biased towards weaker 86Krxs. Further, in the deep firn where 86Krxs anomalies are largest, firn air pumping may not yield a representative air sample, but rather be biased towards the well-connected porosity at the expense of poorly connected cul-de-sac-like pore clusters. Since barometric pumping ventilates this well-connected pore space with low-86Krxs air from shallower depths, the firn air sampling may not capture a representative 86Krxs value of the full firn air content. These explanations are all somewhat speculative, and a definitive understanding of the firn–ice differences is lacking at this stage.
Gas loss and thermal corrections are critical to the interpretation of 86Krxs. The thermal correction is applied to account for thermal gradients in the firn (ΔT, defined here as the temperature at the top minus the temperature at the base of the firn), which are chiefly caused by geothermal heat or surface temperature changes at the site. At low-accumulation sites geothermal heating leads to ΔT<0. We use 15N excess (δ15N–) to estimate the thermal gradient in the firn (Appendix A2). Because nitrogen and argon have similar diffusivities but different thermal diffusion coefficients, δ15N–δ40Ar is relatively insensitive to barometric pumping yet sensitive to thermal fractionation, allowing estimating ΔT.
Besides the actual thermal gradients in the firn, the isotopic composition may also be impacted by seasonal rectifier effects. If the firn air transport properties differ between the seasons (for example due to thermal contraction cracks, convective instabilities, or seasonality in wind pumping), this can result in a thermal fractionation of isotopic ratios in the absence of a thermal gradient ΔT in mean annual temperature (Morgan et al., 2022).
For the WDC, DSS, and GISP2 sites we obtain ΔT values close to zero as expected for these high-accumulation sites; for the SP, SDM, RICE, and DF sites we find ΔT ranging from −0.76 to −1.18 ∘C, in agreement with the effect of geothermal heat. The high-accumulation DE08 and DE08-OH sites both have an unexpectedly large ΔT of −1.6 ∘C; the good agreement between the sites suggests that it is likely a real signal, yet we can rule out geothermal heat as the cause. This may suggest that the Law Dome DE08 site is subject to a seasonal rectifier effect or a recent climatic cooling. Last, the EDC site shows an unexpected positive ∘C. Three possible explanations are the following (1) the aforementioned drill liquid contamination for this core (Baggenstos et al., 2019); (2) a summertime-biased seasonal rectifier; or (3) an overcorrection of δ40Ar for gas loss, which could occur, for example, if natural gas loss and post-coring fugitive gas loss fractionate δ40Ar differently and EDC samples were impacted mostly by the former type (our correction is mostly based on measurements of the latter type).
For the Law Dome DE08-OH site we observe large (5-fold) sub-annual variations in 86Krxs (Fig. B1). The magnitude of the 86Krxs layering is truly remarkable. The isotopic enrichment of each gas (δ15N, δ40Ar, δ86Kr) can be converted to an effective diffusive column height (DCH). For the samples with the smallest (greatest) 86Krxs magnitude, this DCH is around 1 m (6 m) shorter for δ86Kr than it is for δ15N. The firn air transport physics that may explain such phenomena are beyond our current scientific understanding. The sub-annual variations may be related to the seasonal cycle in storminess, though that seems improbable to us at present as the gas age distribution at the depth of bubble closure has a width of several years (Schwander et al., 1993). Another reason may be seasonal layering in firn properties – such as density, grain size, and pore connectivity – that control the degree of disorder and dispersive mixing occurring in the firn and lead to a staggered firn trapping and seasonal variations in Δage (Etheridge et al., 1992; Rhodes et al., 2016). The sample air content estimated from the IRMS inlet pressure is similar for all measurements, making it unlikely that the variations in 86Krxs are caused by remnant open porosity in lower-density layers. In any case it is remarkable that such large variations in gas composition can arise and persist on such small length scales, given the relatively large diffusive, dispersive, and advective transport length scales of the system. More work is needed to establish the origin of the sub-annual variations in ice core 86Krxs. At all other sites analyzed here, the sample length exceeds the annual layer thickness; this will remove some, but not all, of the effects of the sub-annual variations.
Another puzzling observation is the positive 86Krxs at the Dome Fuji (DF) site; theoretical considerations suggest it should always be negative. In part this may be due to an overcorrection of δ40Ar for gas loss, which would act to bias 86Krxs in the positive direction. This correction is largest at DF owing to the very negative and (Fig. A1); while we base our correction on published work, it is conceivable that we overestimate the true correction (Appendix A1). In particular, our gas loss correction is based on observations of artifactual post-coring gas loss, which may fractionate δ40Ar differently than natural fugitive gas loss during bubble close-off. Omitting the gas loss correction indeed makes 86Krxs at DF negative (Fig. A3c and d). Another hypothesis is that the positive 86Krxs signal is an artifact of the seasonal rectifier that Morgan et al. (2022) identify at DF. In this work we assume a linear approach in which the effect of the rectifier can be described by a single ΔT value that is the same for isotopic pairs. In reality, there may be nonlinear interactions between thermal fractionation and firn advection that impact the isotopic values of the various gases in a more complex way than captured in our approach.
The 86Krxs is also correlated with other site characteristics besides Φ. For site elevation we find r=0.96 (0.84) and for mean annual temperature (−0.76); the number in parentheses gives the correlation when using all the individual samples rather than site mean 86Krxs. The listed correlations all have p<0.01. For site accumulation we do not find a statistically significant correlation at the 90 % confidence level. The correlations with elevation and temperature are comparable to those we find for Φ; this is no surprise given that elevation, Φ, and T are all strongly correlated with one another, mainly because elevation directly impacts both T (via the lapse rate) and Φ (via its topographic influence on the position of storm tracks). To our knowledge there are no mechanisms through which either elevation or annual mean temperature could drive kinetic isotopic fractionation in the firn layer. Perhaps other unexamined site characteristics (such as the degree of density layering or the magnitude of the annual temperature cycle) could also provide good correlations, suggesting additional hidden controls on 86Krxs. The data needed to assess such hidden controls are not available for most sites.
The calibration of the 86Krxs proxy is based on spatial regression. In applying the proxy relationship to temporal records, we make the implicit assumption that proxy behavior in the temporal and spatial dimensions is at least qualitatively similar. This assumption may prove incorrect. In particular, changes in insolation are known to impact firn microstructure and bubble close-off characteristics, which in turn impacts gas records of and total air content (Bender, 2002; Raynaud et al., 2007). Since 86Krxs is linked to the dispersivity of deep firn, it seems probable that insolation also has a direct impact on 86Krxs via the firn microstructure. We will revisit this issue in our interpretation of the WDC 86Krxs record (Sect. 5). Overall, we anticipate 86Krxs to be a qualitative proxy for synoptic variability yet want to caution against quantitative interpretation based on the spatial regression slope.
The observations presented in this section clearly highlight the fundamental shortcomings of our current understanding of firn air transport, hinting at the existence of complex interactions, presumably at the pore scale, that are not being represented. Percolation theory finds that near the critical point (presumably the lock-in depth) a network becomes fractal in its nature; we suggest that this fractal nature of the pore network likely contributes to nonlinear pore-scale interactions that give rise to the 86Krxs observations in ice. While the observed correlation in Fig. 3a is highly encouraging, further work is critical to understand this proxy. Examples of such future studies are the following: (1) additional high-resolution records that can resolve the true variations that exist in a single ice core, similar to the DE08-OH record; (2) 3-D firn air transport model studies; (3) improvements to the gas loss correction; (4) additional coring sites to extend the spatial calibration and further confirm the validity of the proxy; (5) adding xenon isotopic constraints (136Xe excess) as an additional marker of isotopic disequilibrium; (6) numerical simulations of pore-scale air transport in large-scale firn networks; (7) experimental studies of dispersion and noble gas adsorption in firn samples; (8) percolation theory approaches to study the fractal nature of the pore network of the lock-in zone; and (9) replication of the WDC deglacial 86Krxs record in nearby ice cores such as RICE.
In this section we investigate the large-scale patterns of climate variability in the Southern Hemisphere that could affect Φ and therefore 86Krxs over Antarctica. We begin by investigating the patterns in the wind field that are associated with changes in Φ at ice core sites, before examining how more canonical patterns of Southern Hemisphere climate variability, such as the southern annular mode (SAM), might affect Φ over the whole of Antarctica.
We use ERA-Interim reanalysis data for the 1979–2017 period (Dee et al., 2011) to evaluate the present-day controls on synoptic-scale pressure variability in Antarctica. Kr-86 excess in an ice core sample averages over several years of pressure variability, and therefore we focus on annual mean correlation in our analysis. The annual mean Φ is calculated from the 6-hourly reanalysis data using Eq. (5). Note that we let the year run from April to March to avoid dividing single El Niño and La Niña events across multiple years.
At all Antarctic sites investigated, a similar pattern exists; four representative locations are shown in Fig. 4, where we regress the zonal wind in the lower (850 hPa, color shading) and upper troposphere (200 hPa, contours) onto our surface pressure variability parameter Φ. We find that synoptic pressure variability at these sites is linked to zonal winds along the southern margin of the eddy-driven subpolar jet (SPJ), which extends from the surface to the upper troposphere (Nakamura and Shimpo, 2004; Trenberth, 1991). Sites near the ice sheet margin (Fig. 4a, b and d) are most sensitive to the SPJ edge in their sector of Antarctica, whereas interior sites (Fig. 4c) appear to be sensitive to the overall strength and position of the SPJ. Note that strengthening, broadening, or southward shifting of the SPJ can all in principle enhance site Φ.
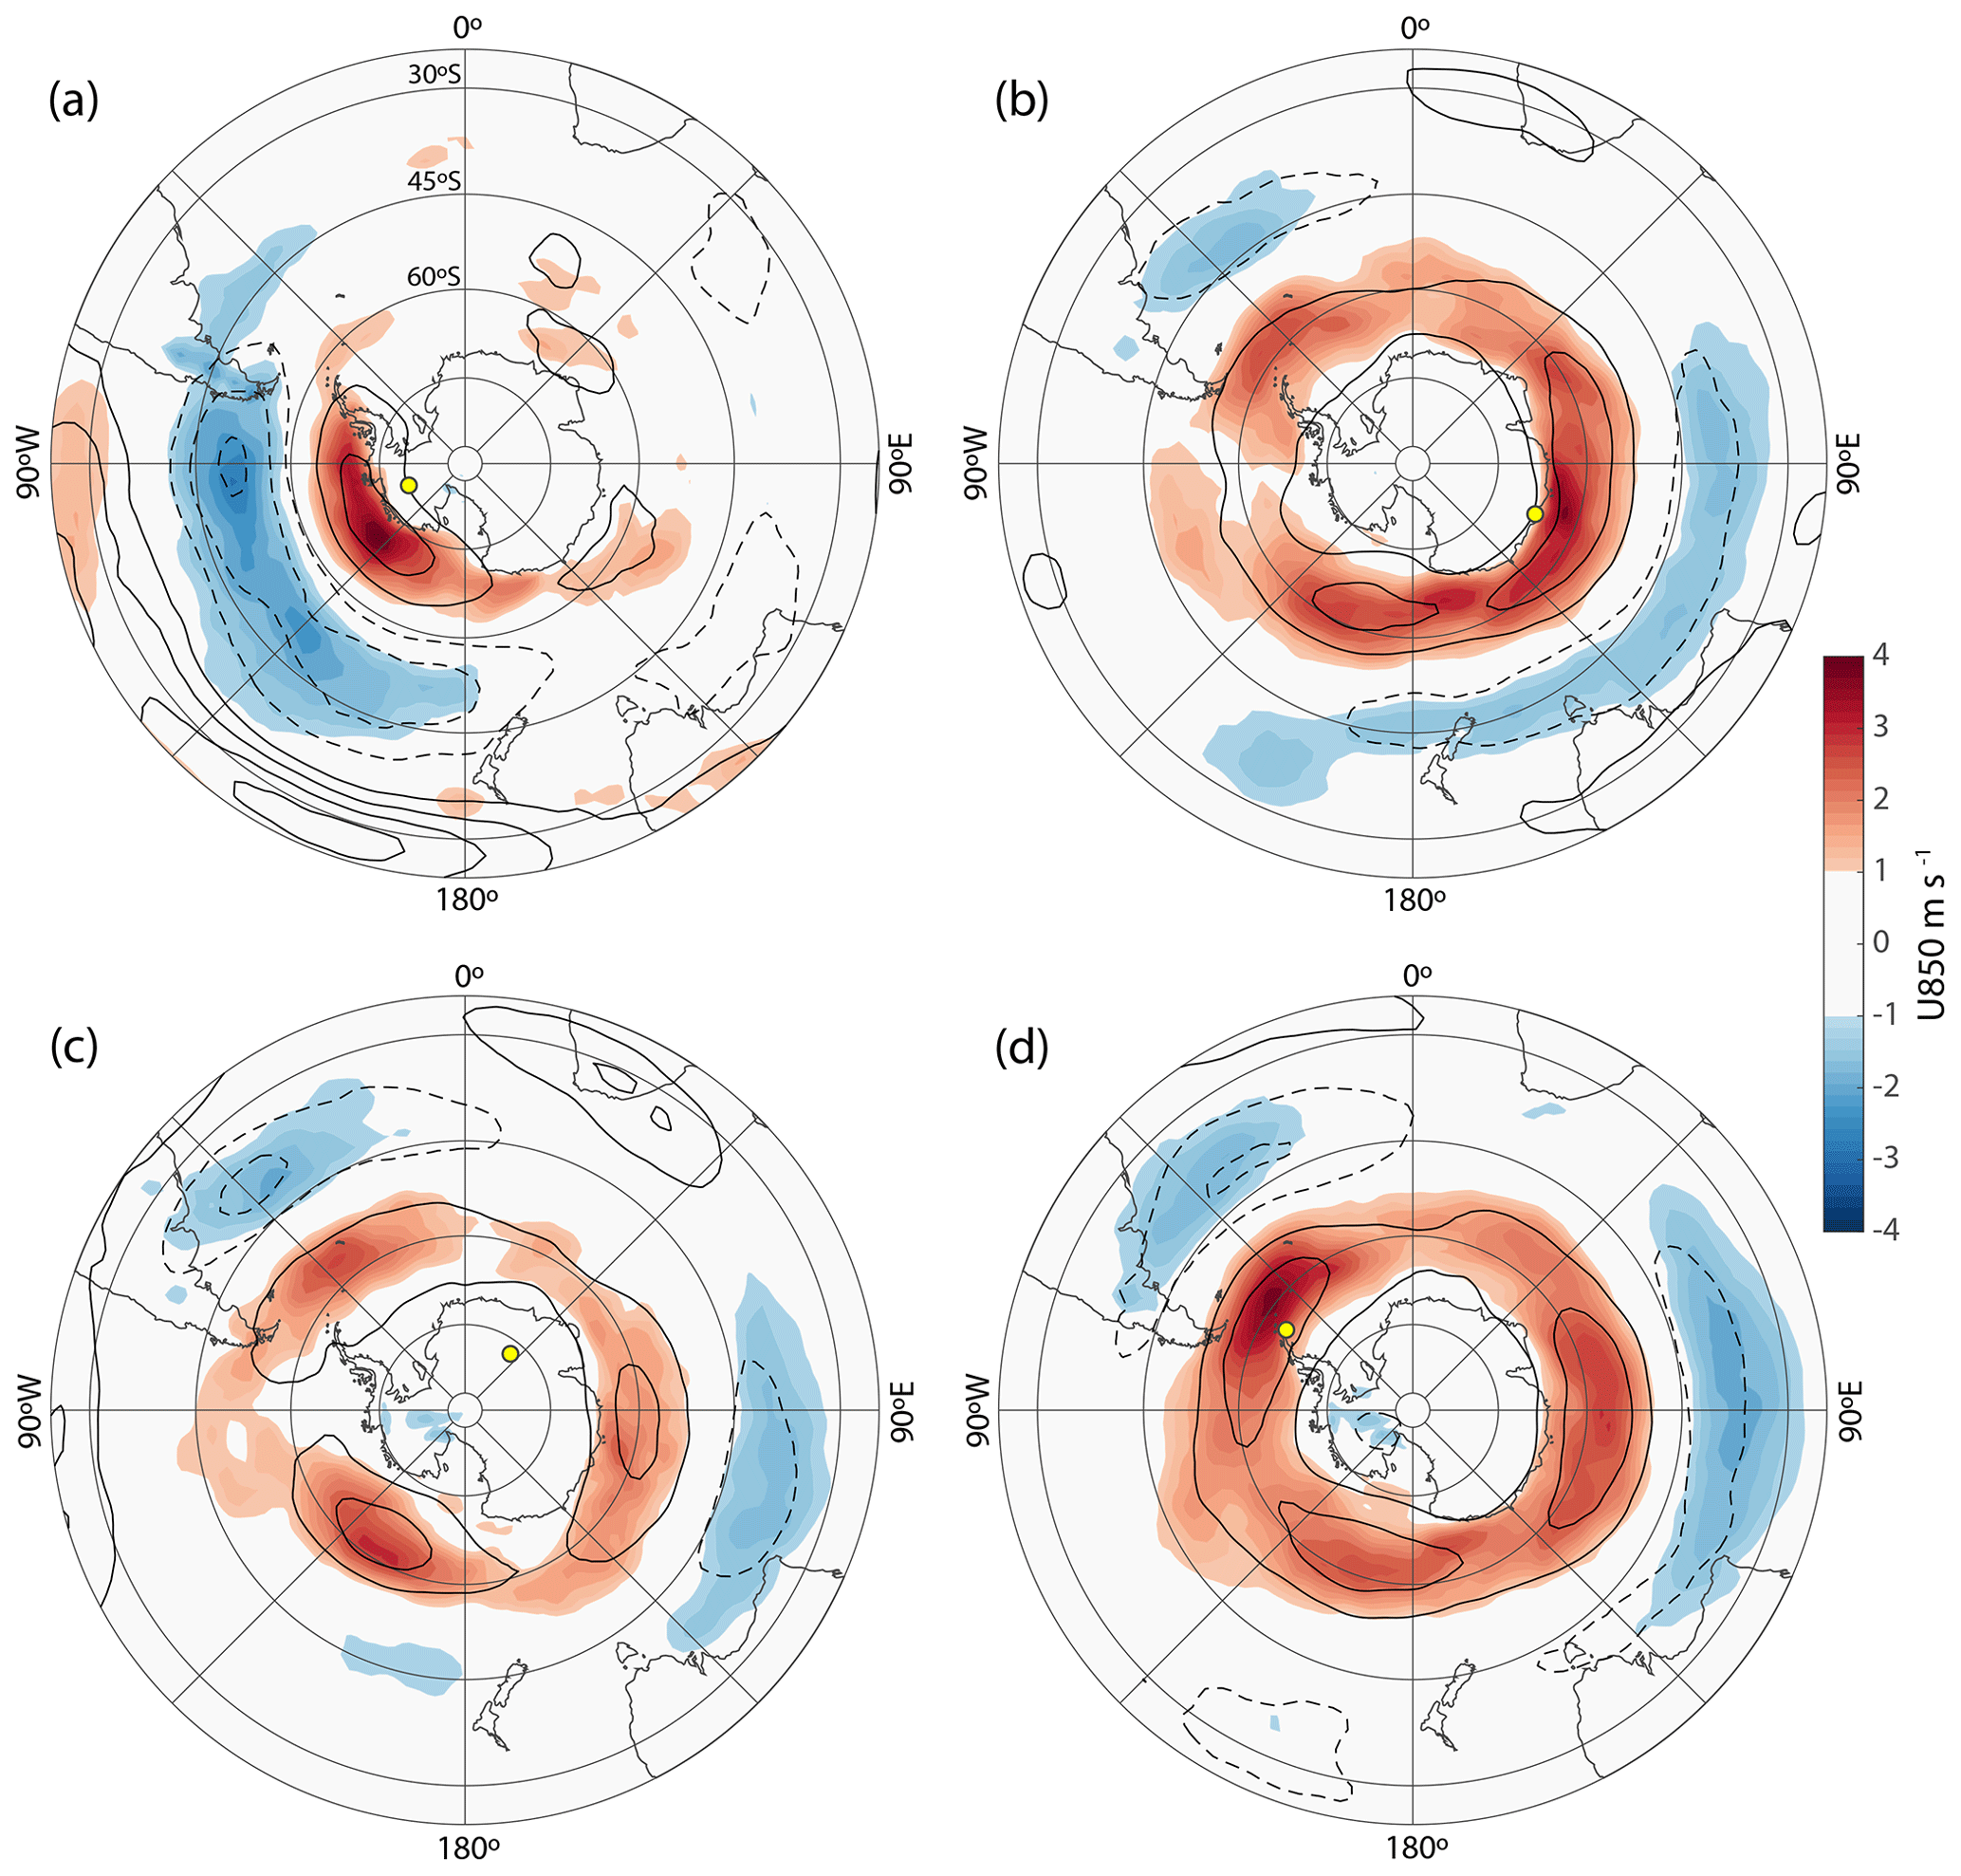
Figure 4Zonal wind speed at 850 hPa (color shading, see scale bar) and 200 hPa (2 m s−1 contours) regressed onto surface synoptic activity Φ at the Antarctic ice core sites of (a) WAIS Divide, (b) Law Dome (DE08, DE08-OH, and DSSW20K), (c) Dome Fuji, and (d) James Ross Island. Yellow dots mark the ice core locations.
Pressure variability at WDC is furthermore correlated with the strength of the Pacific subtropical jet (STJ) aloft (solid contour lines centered around 30∘ S in the Pacific in Fig. 4a), forming an upper troposphere wind pattern that resembles the wintertime South Pacific split jet (Bals-Elsholz et al., 2001; Nakamura and Shimpo, 2004); this agrees with the finding that a strengthening of the split jet enhances storminess over West Antarctica (Chiang et al., 2014).
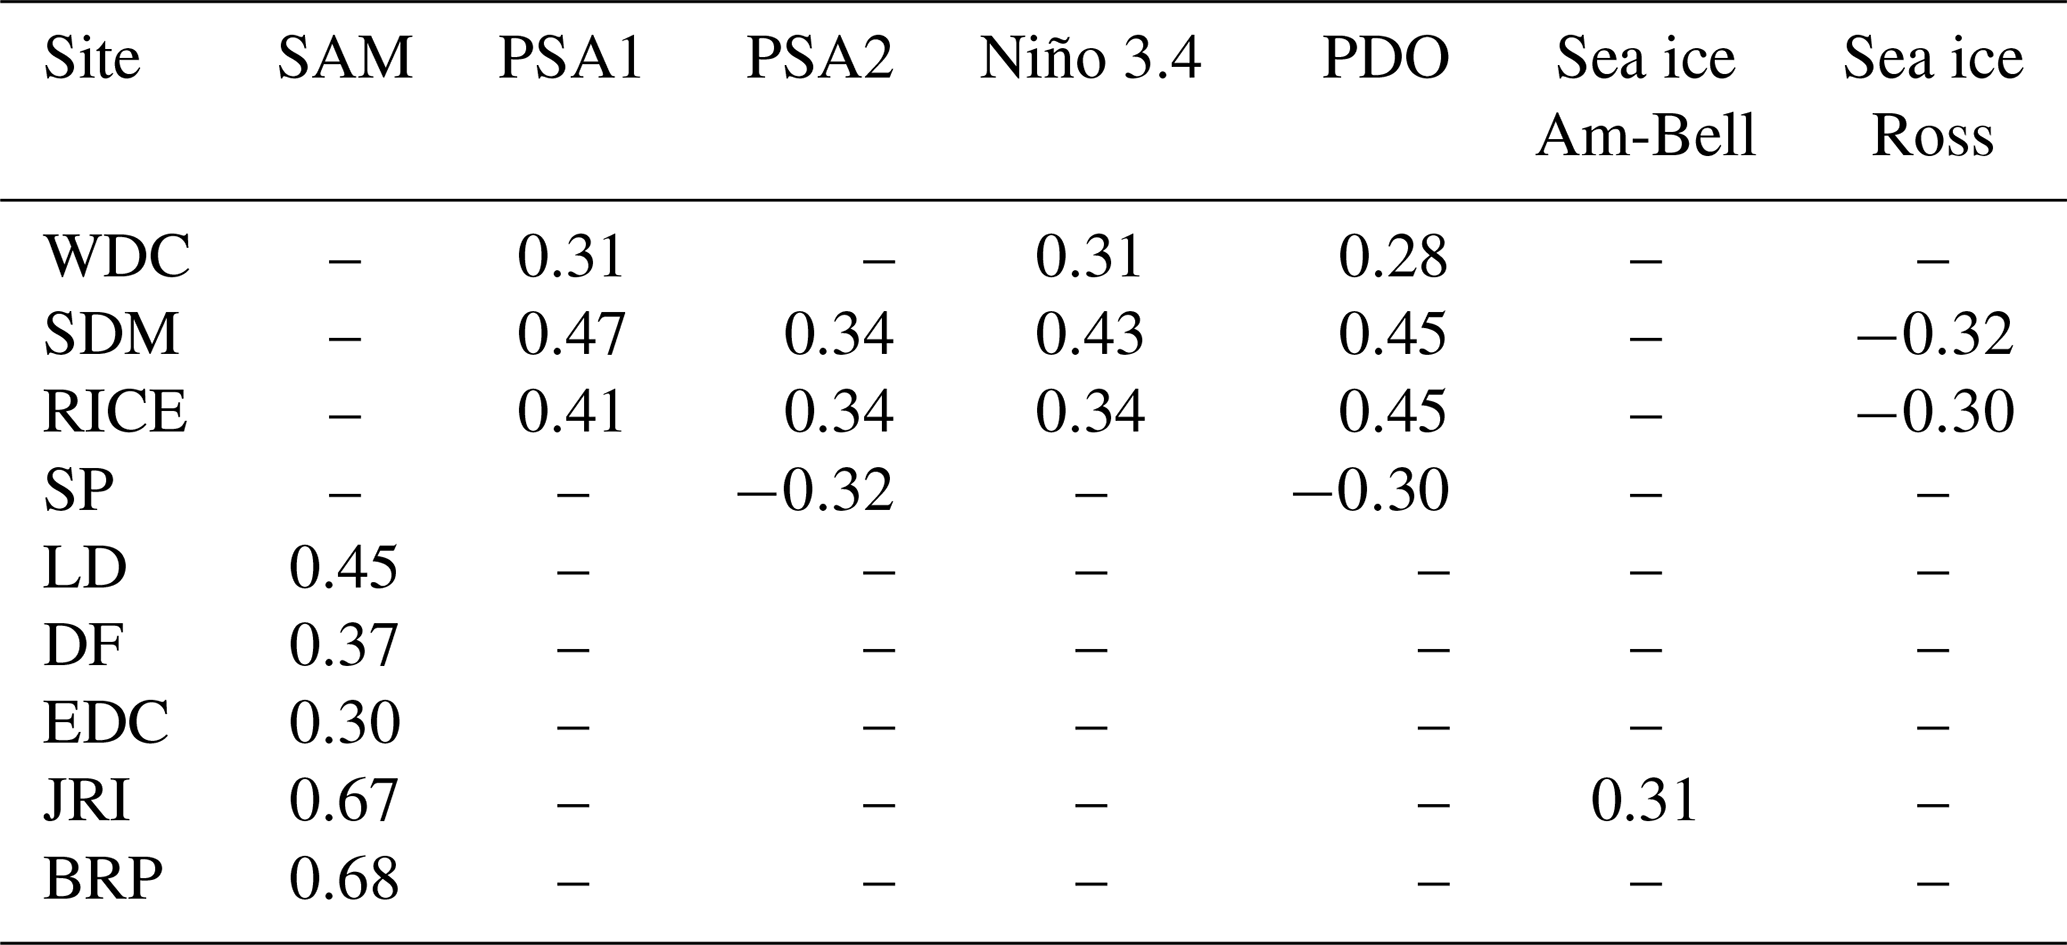
Next, we investigate how the well-known patterns of large-scale atmospheric variability, such as SAM and ENSO, impact pressure variability in Antarctica. Figure 5 shows the correlation of Φ with the three leading modes of SH extra-tropical atmospheric variability; the correlation with various indices and modes for individual ice core locations is given in Table 2. Most teleconnection patterns have a specific season during which they are strongest; here we do not differentiate between seasons because 86Krxs in ice core samples averages over all seasons.
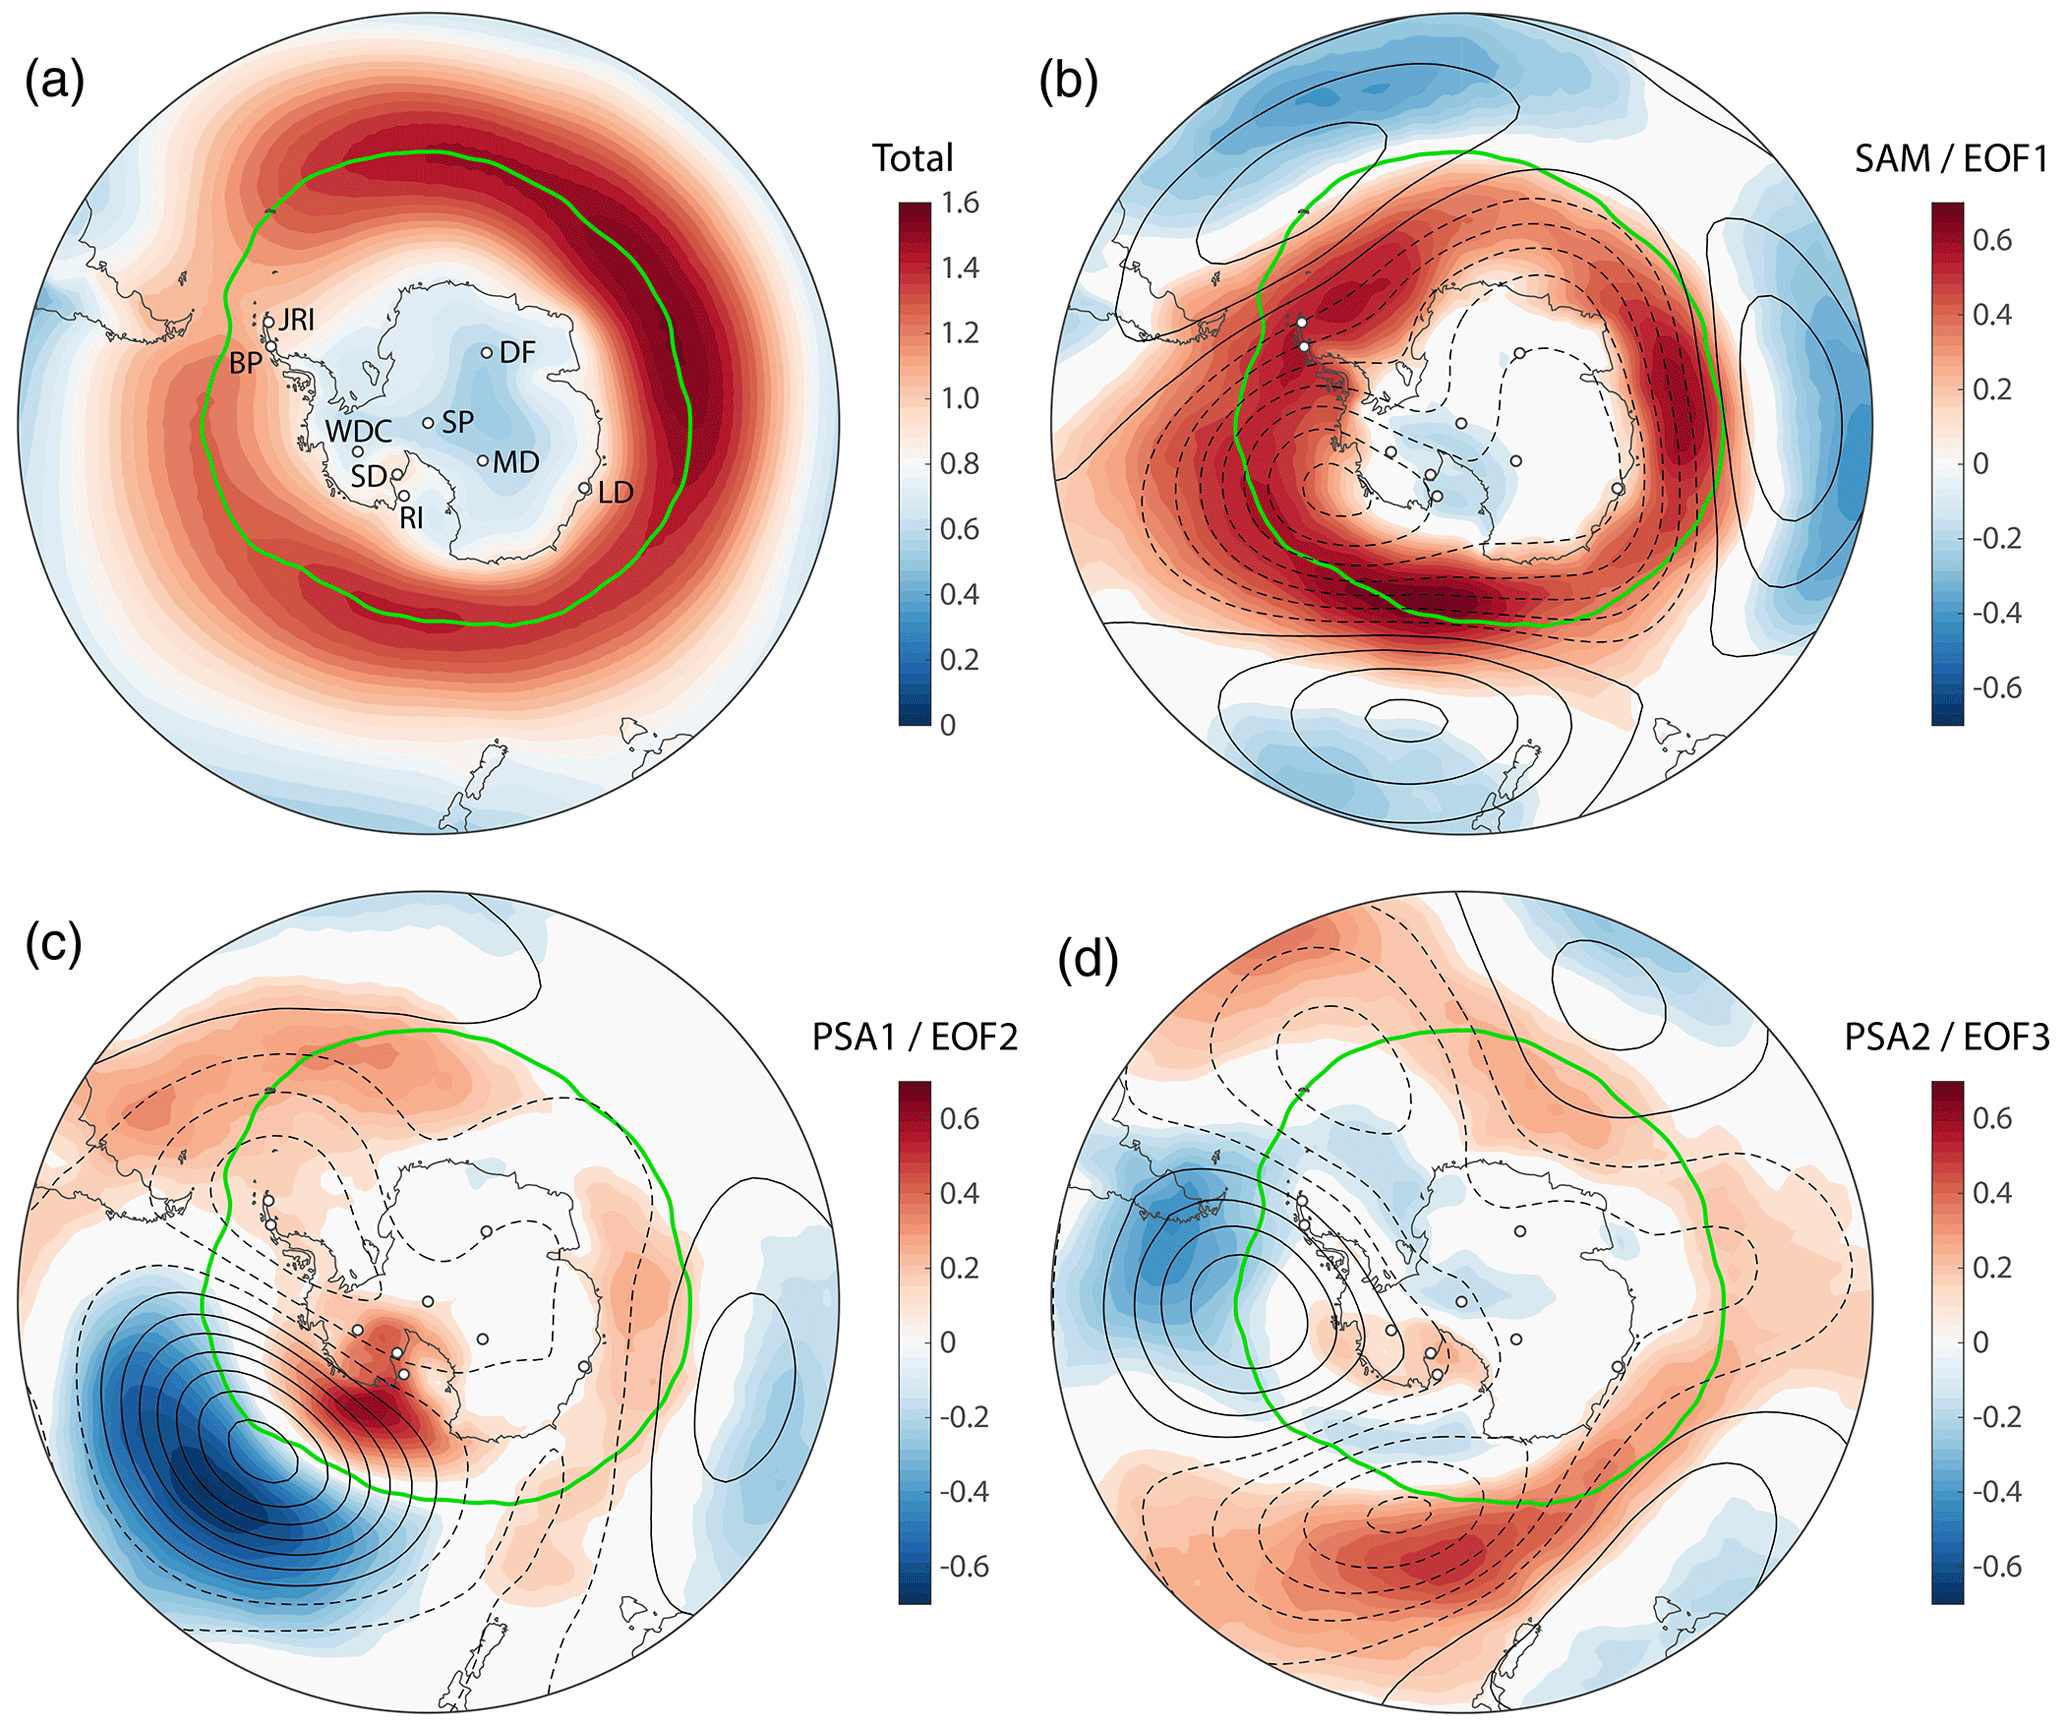
Figure 5Modes of SH extratropical atmospheric variability and their link to synoptic-scale surface pressure variability in Antarctica. (a) Annual mean Φ in units of percent per day (% d−1). (b) Colors show correlation between Φ and the southern annular mode (SAM) index, with the 500 hPa geopotential height anomalies superimposed in 10 m contours (positive contours solid, negative contours dashed). (c) As panel (b), but for the Pacific–South American Pattern 1 (PSA1). (d) As panel (b), but for the Pacific–South American Pattern 2 (PSA2). SAM, PSA1, and PSA2 are defined as the first, second, and third EOFs (empirical orthogonal functions), respectively, of the 500 hPa geopotential height anomalies in 20–90∘ S monthly values in the 1979–2017 ERA-Interim reanalysis (Dee et al., 2011). In all panels the latitude of maximum Φ is denoted by the green line.
Table 2Pearson correlation between Φ at the ice coring sites and large-scale atmospheric circulation. Correlations are calculated using annual mean data (all months, April–March). We only list the statistically significant correlations (p<0.1). The Niño 3.4 is calculated over 5∘ S–5∘ N, 190–240∘ E using SST from Huang et al. (2014); the PDO index is from Mantua and Hare (2002).
Globally, annual mean Φ is highest over the Southern Ocean (Fig. 5a), a region of enhanced baroclinicity associated with the eddy-driven SPJ (Nakamura and Shimpo, 2004). The green line denotes the latitude of maximum Φ, roughly corresponding to the latitude with the highest storm track density (57.8∘ S on average).
The dominant mode of atmospheric variability in the SH extratropics is the southern annular mode, representing the vacillation of atmospheric mass between the middle and high latitudes (Thompson and Wallace, 2000). Figure 5b shows 500 hPa geopotential height (Z500) anomalies associated with the SAM as contours, with the color shading giving the correlation between Φ and the SAM index. During the positive SAM phase (negative Z500 over Antarctica) we find that the storm tracks and maximum synoptic activity are displaced towards Antarctica (positive Φ correlation poleward of the green line in Fig. 5b). This is associated with a strengthening and poleward displacement of the SH westerly winds that occurs during a positive SAM phase. More locally, Φ on the Antarctic Peninsula is positively correlated with the SAM index (Table 2); Φ at the other sites is not meaningfully impacted. This suggests that the variations associated with the SAM (as commonly defined) do not extend far enough poleward to meaningfully impact Antarctica with the exception of the peninsula. Enhanced synoptic variability on the peninsula during positive SAM phases is consistent with observations of enhanced snowfall at those times (Thomas et al., 2008).
The second mode of SH extratropical variability is the Pacific–South American Mode 1 (PSA1), which reflects a Rossby wave response to sea surface temperature (SST) anomalies over the central and eastern equatorial Pacific (Mo and Paegle, 2001) and is therefore closely linked to ENSO on interannual timescales (we find a correlation of r=0.77 between the annual mean PSA1 and Niño 3.4 indices). Φ in the Amundsen and Ross Sea sectors (WDC, SDM, and RICE) is positively correlated with the PSA1 and Niño 3.4 SST, suggesting larger synoptic activity during El Niño phases and low activity during La Niña phases. The PSA2 pattern, also linked to SST anomalies in the tropical Pacific (Mo and Paegle, 2001), is likewise correlated with Φ in the Amundsen and Ross Sea sectors (Fig. 5c and Table 2). While all the correlations listed are statistically significant, they explain only a fraction of the total variability.
Next, we consider anomalies in sea ice area and extent (Parkinson and Cavalieri, 2012). We focus on the Ross and Amundsen–Bellingshausen seas where impacts on the WAIS Divide may be expected. At the 90 % confidence level we do not find significant correlations with sea ice area or extent at most core locations (Table 2). Correlations with sea ice extent are (even) weaker than those for sea ice area and consequently not shown. We performed a lead–lag study of the correlations between Φ and sea ice area as well as extent in the various sectors and find that in all cases maximum correlations occur for the sea ice changes lagging 0 to 4 months behind Φ; we interpret this to mean that the sea ice is responding to changes in atmospheric circulation rather than driving them.
Overall, we find that synoptic activity at WAIS Divide, the site of most interest here, is controlled by the position and/or strength of the storm tracks at the southern edge of the SPJ in the Pacific sector of the Southern Ocean (Ross, Amundsen, and Bellingshausen seas), with little sensitivity to the SPJ behavior in the other sectors. Owing to its remote southern location, WDC is only weakly impacted by the commonly defined large-scale modes of atmospheric variability. Most notably, WDC has a modest influence from the tropical Pacific climate, as shown by a correlation around r≈0.3 with the PSA1, Niño 3.4, and PDO indices (Table 2). We further find statistically significant correlations (up to r=0.44) between WDC Φ and SST in broad regions of the central and eastern tropical Pacific (not shown). We suggest that ENSO weakly impacts storminess at WDC (around 10 % of variance explained) via its impact on the SPJ in the South Pacific.
5.1 The 0–24 ka WAIS Divide Kr-86 excess record
The WAIS Divide downcore 86Krxs dataset we present here was produced during five separate measurement campaigns that occurred in February–April 2014, February–April 2015, August 2015, August 2020, and August 2021. Campaigns 1–3 were reported previously (Bereiter et al., 2018a, b), and campaigns 4 and 5 were meant to resolve conflicts between the 86Krxs datasets from these earlier campaigns. Three slightly different measurement approaches were used. Campaign 1 uses Method 1 from Bereiter et al. (2018a), in which the air sample splitting is done in a water bath for over 12 h to equilibrate the sample. Campaigns 2 and 3 use Method 2 from Bereiter et al. (2018a), in which a bellows is used to split the air samples for over 4 to 6 h. Campaigns 4 and 5 do not involve splitting of the air sample and only analyzed the Kr and Ar isotopic ratios. During campaign 4 a glass bead from the water trap got stuck in the tubing, restricting the flow and likely resulting in incomplete air extraction from the meltwater.
Figure 6 compares 86Krxs40 (Fig. 6a) and 86Krxs15 (Fig. 6b) from the five campaigns. Campaign 1 is the only campaign that spans the full age range of the record, making it the most valuable of the three campaigns. Campaigns 2 and 3 are mostly restricted to the Pleistocene and Holocene periods, respectively, with little overlap between them. Campaigns 4 and 5 aimed to reproduce some of the most salient features in the earlier three. For ease of visual comparison, a Gaussian smoothing spline to the combined data from the two most extensive campaigns (1 and 2) is added (details below).
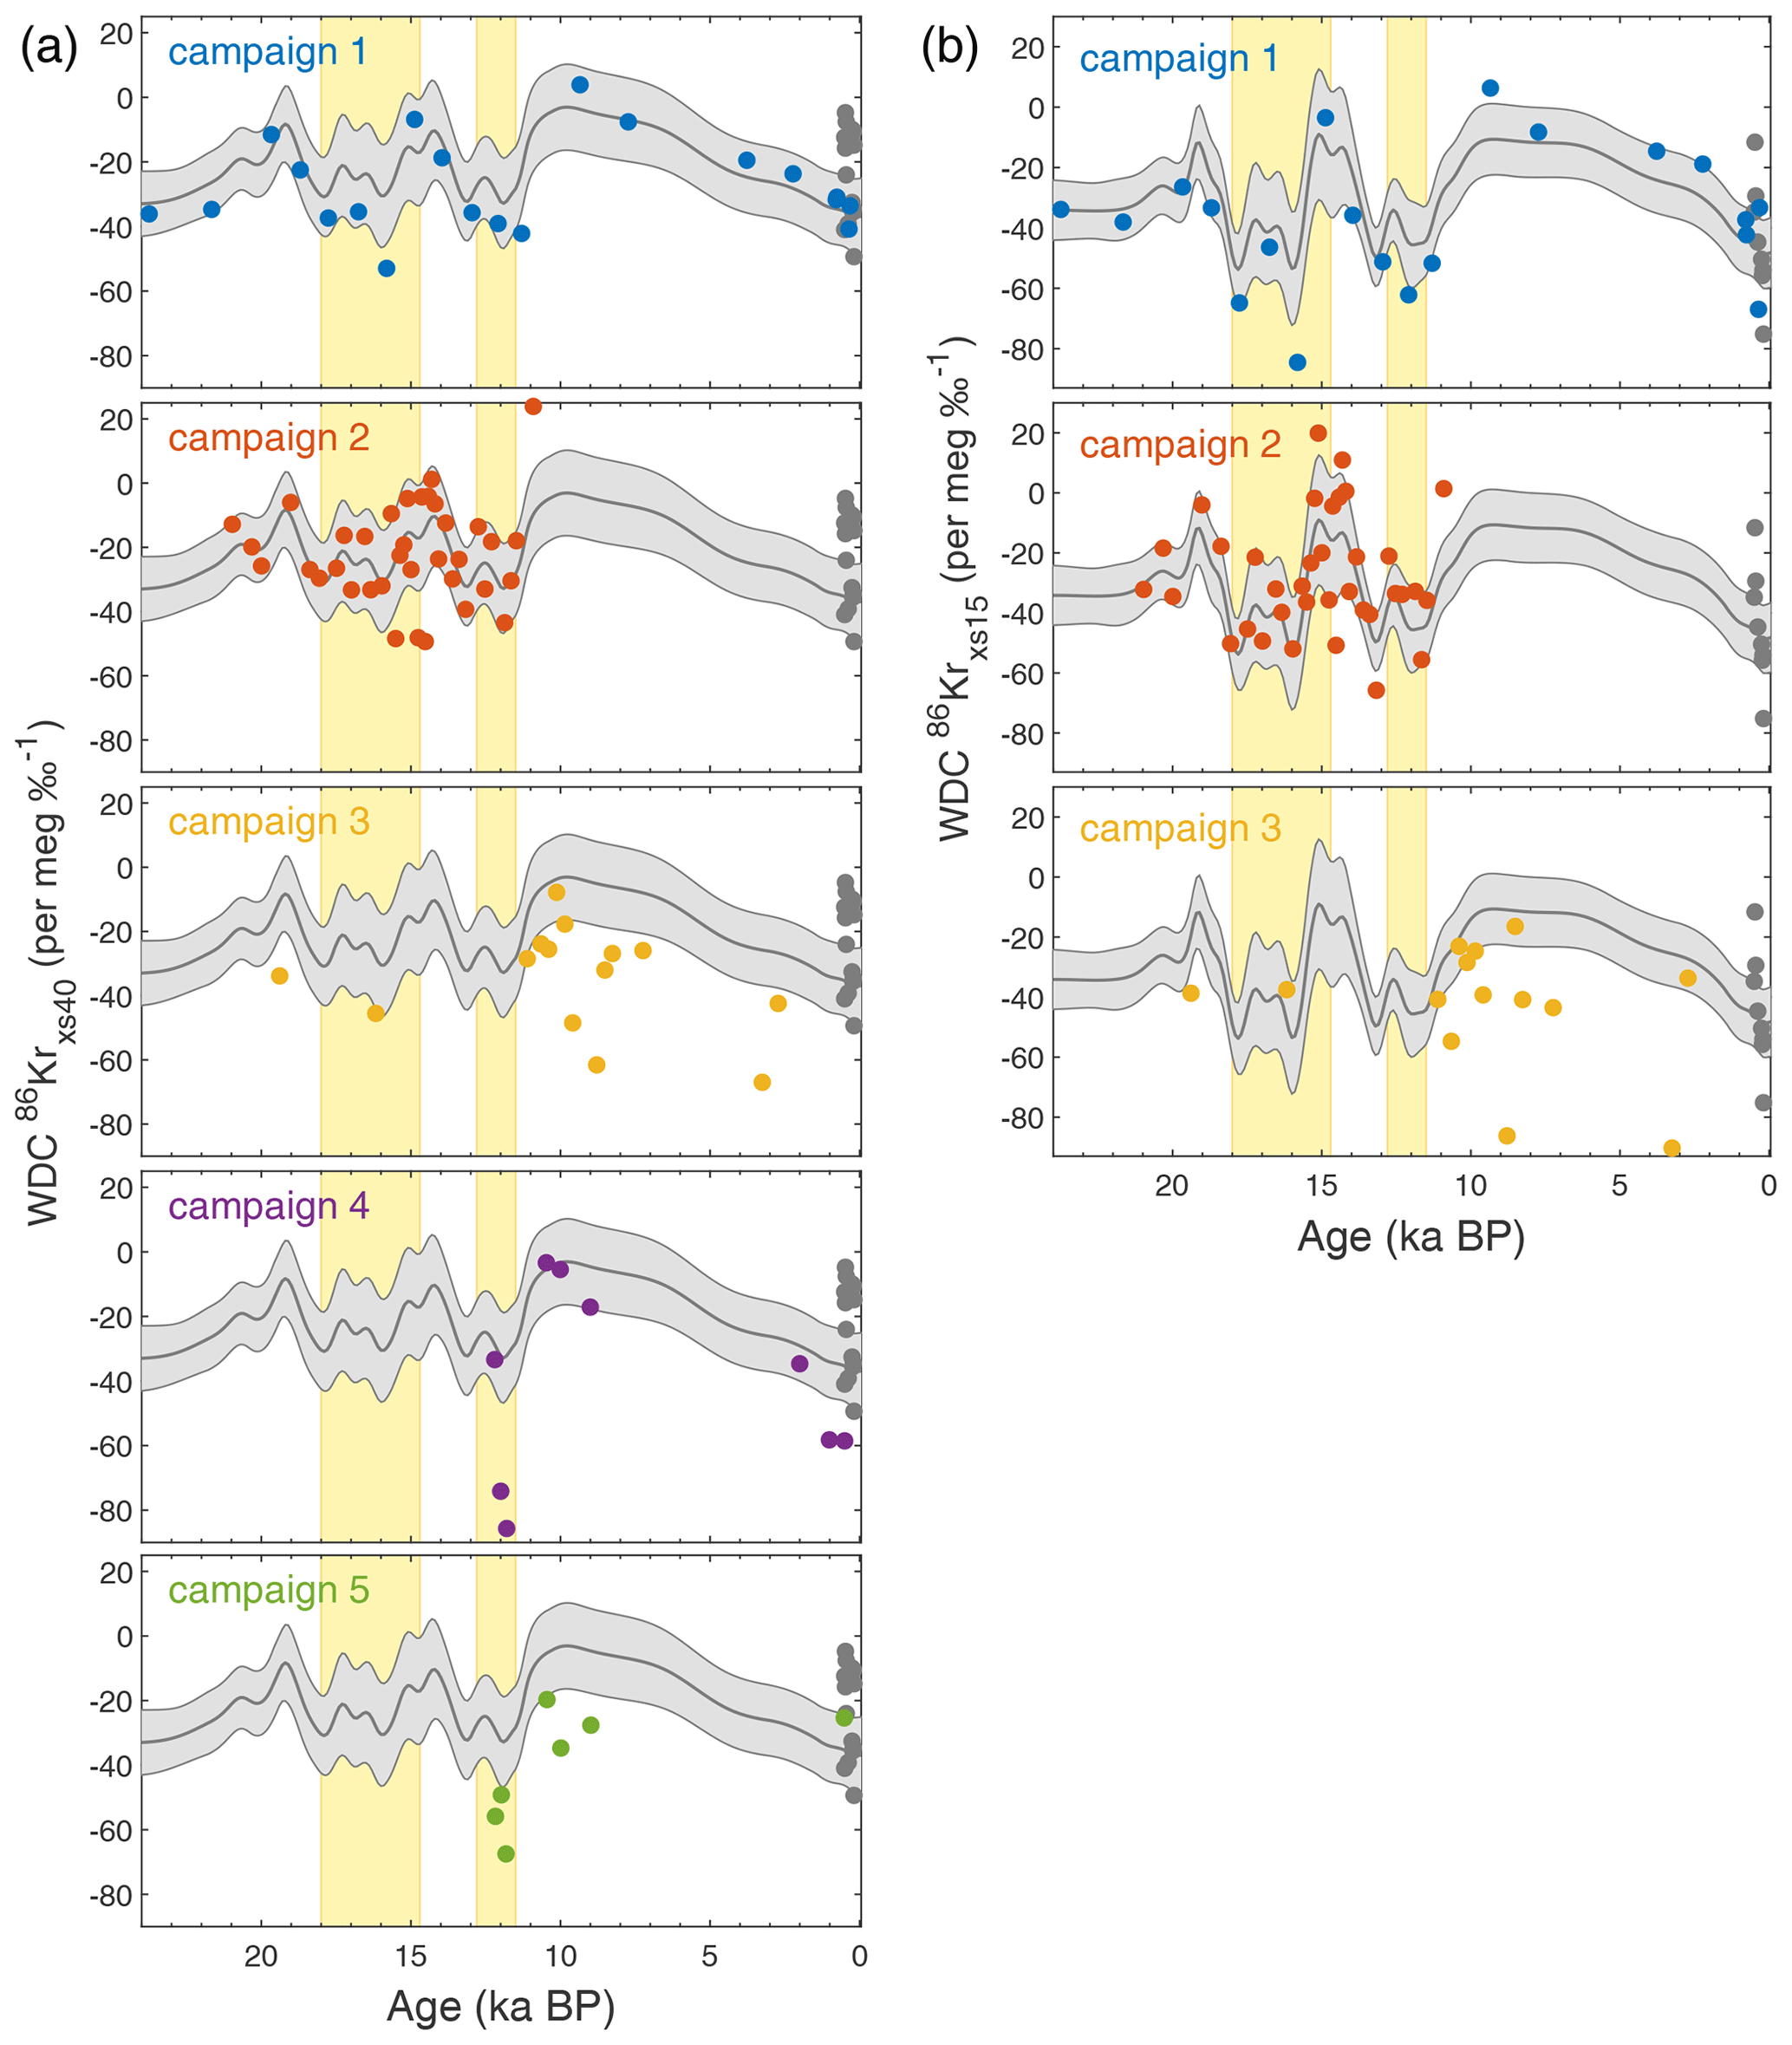
Figure 6WAIS Divide Kr-86 excess records through the last deglaciation. (a) WDC 86Krxs40 data from the five measurement campaigns. The gray curve shows a Gaussian smoothing curve to the combined data from the first two campaigns; the light gray shaded area shows the ±1σ uncertainty envelope based on a 10 000-iteration Monte Carlo sampling of the errors and uncertainties. The WDC calibration data are shown as gray circles for comparison. (b) As in panel (a), but for 86Krxs15. For campaigns 4 and 5 the sample was not split, and no δ15N data are available. The Heinrich Stadial 1 and Younger Dryas North Atlantic cold periods are marked in yellow. Thermal corrections in the WDC 86Krxs records are based on firn model simulations; gas loss correction is based on a third-order polynomial fit to the WDC gravity-corrected (Fig. A5).
Visual inspection suggests that campaigns 1 and 2 agree well for both 86Krxs definitions. Campaign 3 has more scatter and is visibly offset (more negative) for both 86Krxs definitions. Campaign 4 has several data points that agree well with the spline, yet also several fliers with very negative 86Krxs40. Campaign 5 appears to be overall more negative in 86Krxs40. No true replicate samples were analyzed between the campaigns, in part because the large sample size requirement precludes this. This precludes a direct assessment of campaign offsets. Instead we rely on linear interpolation. First, we linear interpolate the 86Krxs values of campaign 1 onto the sample depths of campaign 2, and vice versa, allowing us to estimate the offsets. In this way, during their period of overlap we estimate offsets of 6 and 13 per meg ‰−1 between campaigns 1 and 2 for 86Krxs40 and 86Krxs15, respectively. This is within the analytical precision (22 per meg), suggesting these two campaigns are in good agreement. Data from campaign 2 appear to have more scatter, possibly reflecting the shorter equilibration time during sample splitting.
We combine data from the first two campaigns and evaluate their offset to data from the other three campaigns again using the linear interpolation method. For campaigns 3, 4, and 5 we find an offset of −32, −22, and −23 per meg ‰−1 in 86Krxs40, respectively. For campaign 3 the offset is −34 per meg ‰−1 in 86Krxs15. It is remarkable that all three later campaigns are more negative in 86Krxs than the first two. Campaign 3 shows the greatest offset (greater than analytical precision) and has more scatter in both 86Krxs (Fig. 6) and 15N excess, possibly because for this campaign less care was taken that the IRMS conditions were stable. The offset of campaign 4 may be attributed to the incomplete sample transfer due to the bead stuck in the line; note that for this campaign the offset is caused by two very negative data points. The offset in campaign 5 is hard to explain. The more negative 86Krxs of campaigns 4 and 5 may reflect sample storage effects, as these were measured 5–6 years after campaign 1 and 2. However, this would not explain the negative values of campaign 3. The good 86Krxs agreement between DE08 and DE08-OH, drilled 32 years apart, would also argue against large storage effects. For campaigns 4 and 5 only Ar and Kr isotope ratios were measured, so we lack typical tracers of gas loss ( and ) that can be analyzed.
In the remainder of this paper we will interpret the combined data from campaigns 1 and 2, but with the caveat that there is a persistent offset with later campaigns. However, the features we interpret are corroborated by the later campaigns if one takes the offset into account. To aid interpretation of the data, we apply a Gaussian smoothing spline with a smoothing filter width that varies depending on the data density (from 250-year width in the deglaciation itself for which the data density is high to 1750 years in the Holocene and LGM for which data density is low). To estimate the uncertainty in the smoothing spline we use a Monte Carlo approach that considers uncertainty in following: (1) the gas loss correction by randomly sampling ε40 in the range of 0 to −0.016 as well as by randomly adding an offset in the range of −1 ‰ to +1 ‰ to the gas loss indicator (–), (2) the thermal correction by randomly scaling the thermal scenario (Fig. A5) by a factor ranging from 0 to 2, and (3) analytical errors by adding random errors to individual data points drawn from a normal distribution with a 2σ width of 22 per meg. The ±1σ uncertainty range and mean value are shown as the gray envelope and center line in Fig. 6. We believe the following observations to be robust.
-
The Holocene shows a trend towards increasingly negative 86Krxs, suggesting a gradual increase in synoptic activity toward the present. Minimum synoptic activity in West Antarctica occurs during the early Holocene around 10 ka; the Monte Carlo study suggests 86Krxs40 in the early Holocene (8 ka–10 ka) is 30.5±18 per meg ‰−1 (±2σ) below the late Holocene value (last 2 ka). Using the slope of our core-top calibration (Fig. 3), we estimate that early Holocene WDC synoptic activity Φ is ∼17 % weaker than it is today. This change is comparable to the 2σ magnitude of interannual variations in annual mean Φ at the site today (or about half the peak-to-peak variations thereof). This Holocene trend is seen in the data from campaigns 1, 3, and 4. Campaign 5 does not suggest a trend but has only one late Holocene data point, making it less robust. The trend in campaign 3 is less robust due to the greater scatter in the data.
-
The most pronounced change occurs at the Younger Dryas (YD)–Holocene transition, where 86Krxs becomes more positive (by 30.1±16 per meg ‰−1, comparing YD and early Holocene), implying a decrease in synoptic activity. This transition is observed in campaigns 1, 2, 4, and 5 that cover this time period (the third campaign does not cover it) and represents a ∼17 % drop in synoptic activity (Φ).
-
During the Last Glacial Maximum (LGM), WDC synoptic activity was perhaps slightly weaker than at present, but not significantly so (86Krxs40 more positive by 11±13 per meg ‰−1). The West Antarctic Ice Sheet elevation was likely higher during the LGM, and a 300 m elevation increase would by itself increase 86Krxs40 by 10 per meg ‰−1, all else being equal (Appendix A3); this is within the analytical error of our observations. This feature is seen in campaign 1 and not covered by the other campaigns.
-
The deglaciation itself has enhanced synoptic activity, in particular during the two North Atlantic cold stages Heinrich Stadial 1 (HS1) and the YD as highlighted with yellow bars in Figs. 6 and 7. Synoptic activity during these periods is enhanced relative to the adjacent LGM and early Holocene yet comparable to today. This feature is seen in campaigns 1 and 2 as well as in 4 and 5 for the transition into the Holocene.
Below we will interpret the deglacial WDC 86Krxs record in terms of time-averaged barometric variability. Before doing so we want to emphasize that firn processes may have also been imprinted onto the record, in particular on orbital timescales on which firn microstructure responds to local (summer) insolation intensity (Bender, 2002). High summer insolation results in more depleted and reduced air content, likely via stronger layering and a delayed pore close-off process (Fujita et al., 2009).
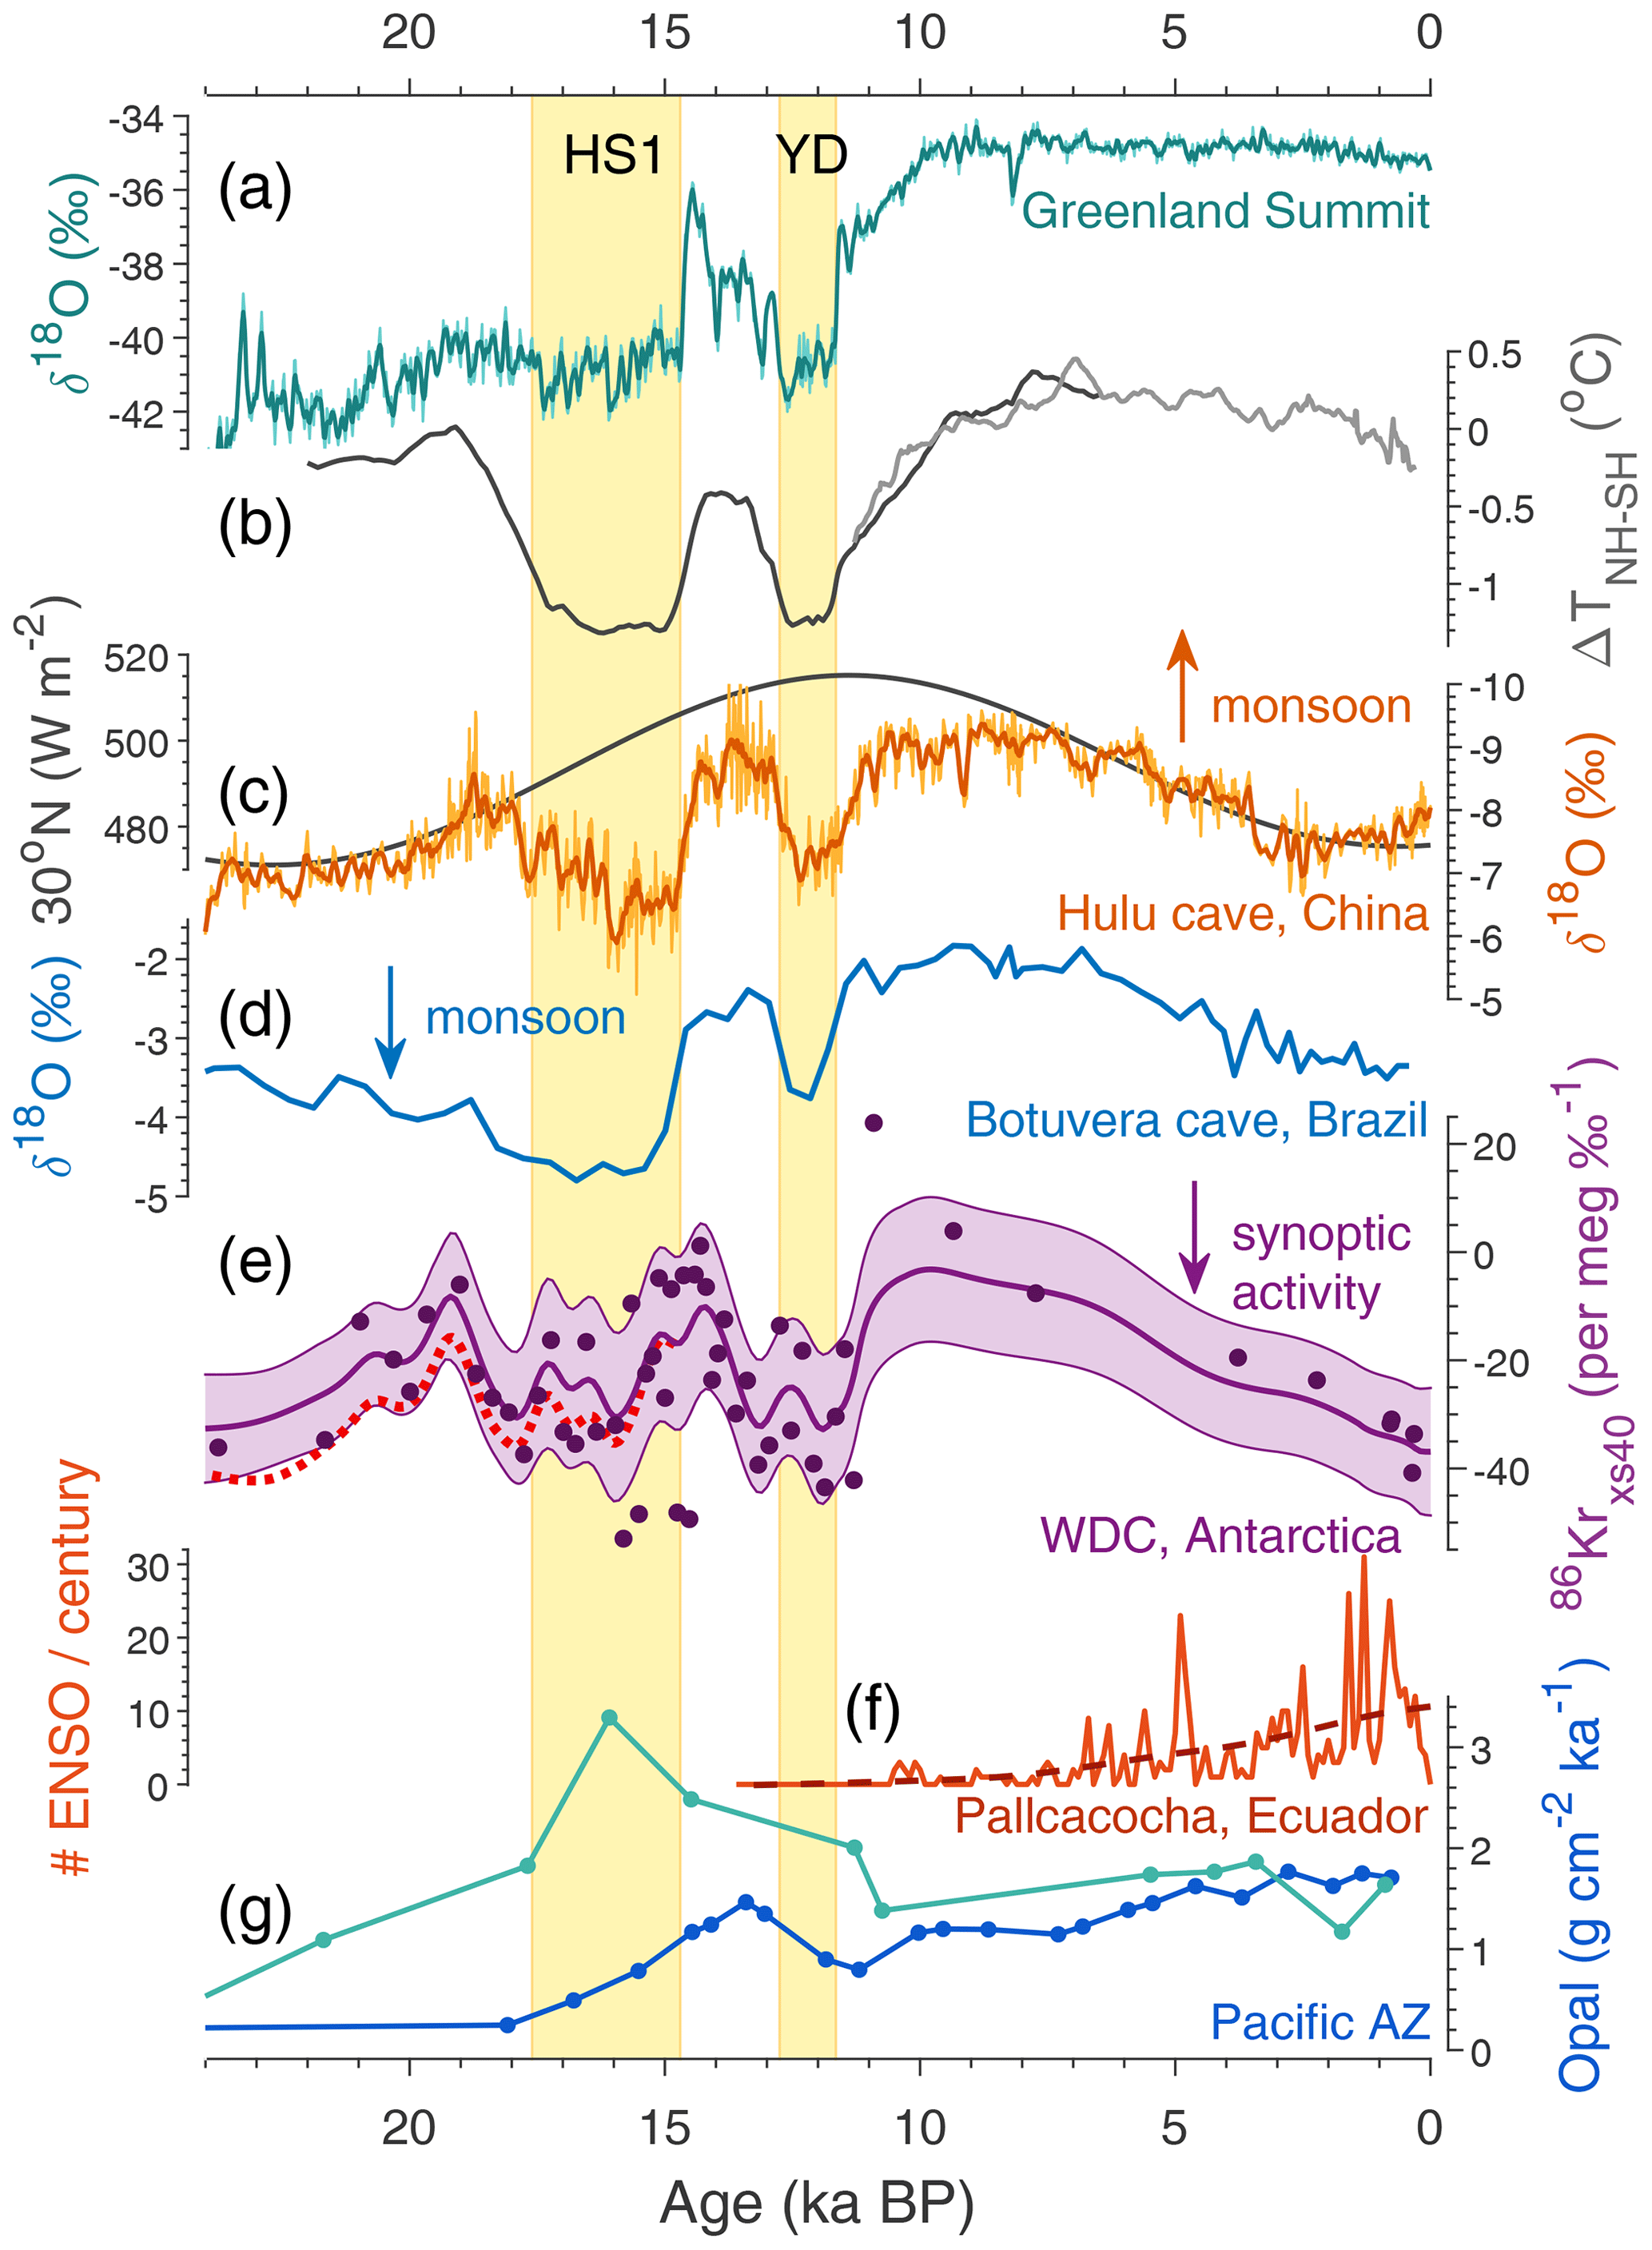
Figure 7Climate records through the last deglaciation with the Heinrich Stadial 1 (HS1) and Younger Dryas (YD) North Atlantic cold periods marked in yellow. (a) Greenland Summit ice core stable water isotope ratio δ18O, here the average of the GISP2 and GRIP ice cores (Grootes et al., 1993). (b) Hemispheric temperature difference (McGee et al., 2014) based on global proxy compilations for the Holocene (Marcott et al., 2013) and last deglaciation (Shakun et al., 2012). (c) Speleothem calcite δ18O from Hulu and Dongge caves, China, as a proxy for East Asian summer monsoon strength (Dykoski et al., 2005; Wang et al., 2001). Superimposed is summer solstice (21 June) insolation at 30∘ N. (d) Speleothem calcite δ18O from Botuvera cave, southern Brazil, as a proxy for South American summer monsoon strength (Cruz et al., 2005; Wang et al., 2007). (e) Kr-86 excess record from WAIS Divide (this study), corrected for gas loss and thermal fractionation (Appendix A). The center line and shaded envelope show the mean and ±1σ uncertainty interval of a 10 000-iteration Monte Carlo smoothing exercise (see text). The dotted red line equals the center line with a correction for elevation change applied (Appendix A) using a simulated elevation history (Golledge et al., 2014). (f) Number of El Niño events per century from laminations in sediments from Laguna Pallcacocha, Ecuador (Moy et al., 2002). (g) Th-normalized opal flux in the Pacific Antarctic zone (south of the polar front) from cores NBP9802-6PC1 (turquoise; 169.98∘ W, 61.88∘ S) and PS75/072-4 (blue; 151.22∘ W, 57.56∘ S), reflecting local productivity and (wind-driven) upwelling (Chase et al., 2003; Studer et al., 2015). All water isotope data in this figure are on the Vienna Standard Mean Ocean Water (V-SMOW) scale. Arrows show the direction of increased monsoon strength and synoptic activity.
Local summer solstice insolation in Antarctica increases through the Holocene, with the highest values in the late Holocene. This may impact 86Krxs, although it is not a priori clear what the sign of this relationship would be. The sense of the Holocene temporal trends is that a more negative 86Krxs coincides with more negative . Note that this is opposite to the trends seen in the spatial calibration, for which sites with the most negative (DF, SP, EDC) have the most positive 86Krxs. For now, the impact of local insolation on 86Krxs via firn microstructure remains unknown, which is an important caveat in interpreting the orbital-scale changes in WDC 86Krxs. The abrupt 86Krxs increase at the Holocene onset is too abrupt to be caused by insolation changes, and thus we can interpret that change with more confidence.
The scatter in the late Holocene WDC 86Krxs data exceeds the stated analytical precision. Potential explanations include (1) an underestimation of the true analytical precision, (2) interannual to decadal variations in storminess at WDC, and (3) aliasing of centimeter-scale variations in ice core 86Krxs linked to layering in firn microstructural properties. Understanding the cause of this relatively high scatter in the 86Krxs records will require more work, in particular measurements of several high-resolution 86Krxs records in various sectors of Antarctica.
5.2 Barometric variability at WAIS Divide during the last deglaciation
In the present day, synoptic-scale pressure variability at WAIS Divide is correlated with zonal wind strength along the southern margin of the SPJ (Sect. 4). In our interpretation, a more negative 86Krxs reflects a strengthening or southward shift of the SPJ in the Pacific sector. Here we provide a climatic interpretation of the deglacial WDC 86Krxs record and suggest that variations in synoptic variability at WDC are linked to meridional movement of the ITCZ on millennial and orbital timescales.
The main features of the deglacial WDC 86Krxs record listed in Sect. 5.1 resemble similar features seen in records of (sub)tropical hydrology and monsoon strength, such as the speleothem calcite δ18O records from Hulu Cave, China (Fig. 7c), and from Botuvera cave, southern Brazil (Fig. 7d), which are thought to reflect the intensity of the East Asian and South American summer monsoons, respectively (Cruz et al., 2005; Wang et al., 2001, 2007). These two monsoon records are anticorrelated, showing opposing rainfall trends between the NH and SH on both orbital and millennial timescales. This pattern is commonly attributed to displacement of the mean meridional position of the ITCZ (Chiang and Friedman, 2012; McGee et al., 2014; Schneider et al., 2014), driven by hemispheric temperature differences (Fig. 7b). On orbital timescales such ITCZ migration has a strong precessional component, moving towards the hemisphere with more intense summer peak insolation; on millennial timescales the ITCZ responds to abrupt North Atlantic climate change associated with the D–O and Heinrich cycles (Broccoli et al., 2006; Chiang and Bitz, 2005; Wang et al., 2001), which are in turn linked to changes in meridional heat transport by the Atlantic meridional overturning circulation, or AMOC (Lynch-Stieglitz, 2017; Rahmstorf, 2002).
Changes in mean ITCZ position have a strong influence on the structure and strength of the SH jets. During periods when the NH is relatively cold (such as D–O stadials or periods with negative orbital precession index) the ITCZ is displaced southward and the SH Hadley cell is weakened, thereby also weakening the SH upper-tropospheric subtropical jet (Ceppi et al., 2013; Chiang et al., 2014). The reverse is also true, with the ITCZ shifted northward during NH warmth, associated with a strengthening of the SH Hadley cell and STJ. In a range of model simulations (Ceppi et al., 2013; Lee and Kim, 2003; Lee et al., 2011; Pedro et al., 2018) the weakening of the SH STJ (as during NH cold) is furthermore accompanied by a strengthening and/or southward shift of the SPJ as well as the eddy-driven jet and SH westerly winds. Recently, ice core observations have confirmed that in-phase shifts in the position of the SHWs occur during the D–O cycle in parallel to those of the ITCZ (Buizert et al., 2018; Markle et al., 2017). Marine records of fluvial sediment runoff off the Chilean coast suggest precession-phased movement of the South Pacific SPJ, again in parallel to the ITCZ movement (Lamy et al., 2019).
The SAM index reflects the meridional position of the SHWs and eddy-driven jet. During positive SAM phases the SHWs are displaced poleward and during negative phases equatorward. Present-day month-to-month changes in the SAM index represent a mode of internal variability, with anomalies persisting for only weeks to months – the timescale is longest in late spring and early summer, reflecting a stronger planetary wave–mean flow interaction (Simpson et al., 2011; Thompson and Wallace, 2000). By contrast, shifts in the ITCZ and SH jet structure on millennial and orbital timescales have a much longer lifetime and different dynamics, being driven from the tropics via hemispherically asymmetric changes in Hadley cell and STJ strength. Therefore, present-day SAM internal variability is not expected to be a good analog for past changes in SHW position. We find that the present-day SAM month-to-month internal variability mainly impacts synoptic variability over the Southern Ocean and does not have a statistically significant impact at WDC (Table 2). Such variability is likely to have also occurred during other climatic regimes, possibly just centered around a mean SHW position that is displaced meridionally relative to today. At first glance it may appear contradictory to state, as we do, that synoptic activity at WDC is not sensitive to the SAM while also suggesting that during the last deglaciation synoptic activity at WDC is linked to changes in the position of the SH eddy-driven jet and westerlies. Based on the considerations above, both claims may be true without contradiction.
Besides secular changes to the SPJ position and strength linked to meridional ITCZ movement, WDC 86Krxs may also have imprints from ENSO and tropical Pacific climate. Our analysis suggests a weak but statistically significant link to common ENSO indicators (Table 2). Increased synoptic activity at WDC is linked to enhanced convection in the central and eastern tropical Pacific, which may be due to enhanced frequency or intensity of El Niño events or a mean climate state that is more El Niño-like; it seems likely that the Pacific mean state and ENSO variability are strongly linked (Salau et al., 2012), and the distinction may be irrelevant.
The key features of the WDC 86Krxs record are compatible with paleo-ENSO changes commonly described in the literature. A majority of Holocene ENSO reconstructions (Conroy et al., 2008; Driscoll et al., 2014; Koutavas et al., 2006; Moy et al., 2002; Riedinger et al., 2002; Sadekov et al., 2013) and a wide range of climate model simulations (Braconnot et al., 2012; Cane, 2005; Clement et al., 2000; Liu et al., 2000, 2014; Zheng et al., 2008) all suggest weakened ENSO activity during the early and mid-Holocene, a time with reduced WDC synoptic activity. For example, Fig. 7f shows the number of El Niño events per century (with trend line) reconstructed from inorganic clastic laminae in sediments from Laguna Pallcacocha, Ecuador, a region strongly affected by ENSO (Moy et al., 2002). Likewise, it has been suggested that the SST gradient between the western Pacific warm pool and eastern Pacific cold tongue was enhanced during the mid-Holocene, perhaps indicating a more La Niña-like mean climate state (Koutavas et al., 2002; Sadekov et al., 2013).
Going from the early Holocene to the Younger Dryas (YD), we observe a large increase in WDC synoptic activity. Enhanced ENSO activity during Heinrich stadials is generally supported by climate model simulations (Braconnot et al., 2012; Merkel et al., 2010; Timmermann et al., 2007) and by limited proxy evidence for stadial periods more broadly (Stott et al., 2002). Enhanced ENSO variability during the deglaciation is also found by Sadekov et al. (2013), although their record lacks the temporal resolution to resolve the individual stages. The zonal SST gradient in the equatorial Pacific further reaches a minimum during HS1, also consistent with higher El Niño intensity (Sadekov et al., 2013).
The observed variations in 86Krxs and implied changes in WDC synoptic activity may thus have two contributions: (1) ITCZ-driven changes to the South Pacific SPJ position and (2) changes to ENSO activity. Based on previous work, we argue these two amplify one another in driving WDC storminess, yet we expect the former to make the larger contribution. To disentangle zonally uniform changes to the SPJ from changes specific to the Pacific sector (such as ENSO and the split jet), 86Krxs records from different sectors of Antarctica are needed. Replication of the deglacial and Holocene WDC 86Krxs record presented here is also a high priority at both the WDC itself and the nearby SDM and RICE cores to validate that the signals we describe and interpret here are indeed real and regional in scale.
The position of the SHWs during the LGM has been a topic of much scientific inquiry. Proxy data have been interpreted to show a northward LGM shift of the SHWs – with other scenarios, including no change at all, not excluded by the data (Kohfeld et al., 2013). Such a shift is not supported by most climate models (Rojas et al., 2009; Sime et al., 2013). Our 86Krxs record suggests LGM synoptic activity in West Antarctica to be comparable to today after accounting for site elevation effects (the elevation effect on 86Krxs is within the analytical error). This would be consistent with a Pacific SPJ position similar to today. Note that our site is mostly sensitive to the position of the southern edge of the SPJ and cannot meaningfully constrain changes to the seasonality, width, and/or northern edge of the storm tracks. Therefore, it is not a priori clear whether our observations can be extrapolated to more general statements about SHW position and strength during the LGM. Our data suggest that SPJ movement follows insolation and the ITCZ position, and hence the LGM period may not be a good target for studying SHW movement in the first place given that it has a precession index similar to the present day.
Changes to the SPJ and its associated westerly surface winds have implications for ocean circulation and marine productivity in the Southern Ocean via wind-driven upwelling. Opal flux records from the Antarctic zone (Fig. 7g), reflecting diatom productivity, are commonly interpreted as a proxy for such upwelling – with enhanced upwelling during southward displacement of the SHWs (Anderson et al., 2009). Here we only show records from the Pacific sector, given that we find WDC 86Krxs to reflect purely local SPJ dynamics (Fig. 4a). Both published records suggest enhanced upwelling during the deglaciation (Fig. 7g), consistent with a southward-shifted Pacific SPJ and enhanced storminess at WDC. The record from core PS75/072-4 (blue curve) further indicates an increasing productivity trend through the Holocene (Studer et al., 2018), which is accompanied by a rise in surface nitrogen availability (reconstructed from diatom-bound nitrogen isotopic composition, not shown); this Holocene trend matches our finding of increasing WDC storminess and, by inference, an increasingly southern position of the Pacific SPJ and SHWs. We thus conclude that our interpretation of WDC 86Krxs reflecting SPJ movement in parallel with the ITCZ is broadly consistent with indicators of wind-driven upwelling in the Pacific Antarctic zone.
Here we present a new gas-phase ice core climate proxy, Kr-86 excess, that reflects time-averaged surface pressure variability at the site driven by synoptic activity. Surface pressure variability weakly disturbs the gravitational settling and enrichment of the noble gas isotope ratios δ86Kr and δ40Ar via barometric pumping. Owing to its higher diffusion coefficient, argon is less affected by this process than krypton is, and therefore the difference δ86Kr–δ40Ar is a measure of synoptic activity.
This interpretation is supported by a calibration study in which we measure 86Krxs in late Holocene ice core samples from 11 Antarctic ice cores and 1 Greenland ice core that represent a wide range of synoptic activity in the modern climate. Two of the Antarctic cores were rejected due to clear evidence of refrozen meltwater. We find a strong correlation ( when using site mean data and when using individual samples, p<0.01) between ice core 86Krxs and barometric variability at the site.
Current limitations of the new 86Krxs proxy are the following: (1) it requires relatively large and nontrivial corrections for gas loss and thermal fractionation; (2) it is moderately sensitive to changes in convective zone thickness; (3) firn air transport models cannot simulate the magnitude of 86Krxs anomalies measured in ice samples; (4) firn air samples show smaller 86Krxs anomalies than ice samples from the same site do; (5) it may be sensitive to the degree of density layering at the site, as a comparison of the nearby Law Dome DE08 and DSSW20K cores suggests; (6) it does not work for warm sites that experience frequent melt; (7) the measurement is challenging (with offsets observed between measurement campaigns), time-consuming, and needs large ice samples; and (8) long-term sample storage may impose data offsets. Due to these limitations, we caution that any interpretation of temporal 86Krxs changes remains speculative at present.
Using atmospheric reanalysis data, we show that synoptic-scale barometric variability in Antarctica is primarily linked to the position and/or strength of the southern edge of the eddy-driven subpolar jet (SPJ, also called the polar front jet) with a southward SPJ displacement enhancing synoptic-scale surface pressure variability in Antarctica. The commonly defined modes of large-scale atmospheric variability, such as the southern annular mode and the Pacific–South American Pattern, impact Antarctic only weakly as they are weighted towards the midlatitudes; the exception is the Antarctic Peninsula, where synoptic activity is well-correlated with the southern annular mode (r=0.68). Sites in the Amundsen and Ross Sea sectors are weakly linked to tropical Pacific climate and ENSO (r=0.31 to r=0.43).
We present a new record of 86Krxs from the WAIS Divide ice core in West Antarctica that covers the last 24 kyr including the LGM, deglaciation, and Holocene. West Antarctic synoptic activity is slightly below modern levels during the Last Glacial Maximum (LGM), increases during the Heinrich Stadial 1 and Younger Dryas North Atlantic cold period, weakens abruptly at the Holocene onset, remains low during the early and mid-Holocene (up to ∼17 % below modern), and gradually increases to its modern value. The WDC 86Krxs record resembles records of tropical hydrology and monsoon intensity that are commonly thought to reflect the meridional position of the ITCZ; the sense of the correlation is that WDC synoptic activity is weak when the ITCZ is in its northward position, and vice versa. We interpret the record to reflect migrations of the eddy-driven SPJ in parallel with those of the ITCZ (Ceppi et al., 2013). Secondary influences may come from tropical Pacific climate and ENSO activity. Our 86Krxs record is consistent with weakened ENSO activity (or a more La Niña-like mean state) during the middle and early Holocene and enhanced ENSO activity during NH stadial periods – both these features have been described in the paleo-ENSO literature. The inferred changes to the SPJ are broadly consistent with proxies that indicate enhanced wind-driven upwelling in the Pacific Antarctic zone during NH cold stadial periods.
Kr-86 excess is a new and potentially useful ice core proxy with the ability to enhance our understanding of past atmospheric circulation. More work to better understand this proxy is warranted, and presently the conclusions of this paper should be considered tentative. In particular, replication of the deglacial Kr-86 excess record presented here in nearby cores is needed before these results can be interpreted with confidence. A full list of suggested follow-up studies is given in Sect. 3.3. Despite the many challenges of Kr-86 excess, its further development is worthwhile owing to the dearth of available proxies for reconstructing SH extratropical atmospheric circulation.
A1 Gas loss correction
Gas loss processes artificially enrich the δ40Ar isotopic ratio used to calculate 86Krxs (Kobashi et al., 2008b; Severinghaus et al., 2003, 2009). Figure A1b shows the relationships between the two most common gas loss proxies, and , for all samples in the calibration dataset. We find a slope close to the 2:1 slope commonly reported in the literature (Bender et al., 1995); the exception is the DE08-OH site where the data fall on a 1:1 slope. Depletion in fugitive gases (such as O2 and Ar) represents the sum of losses during bubble closure in the firn (Bender, 2002; Huber et al., 2006; Severinghaus and Battle, 2006) and those during drilling, handling, storage, and analysis of the samples (Ikeda-Fukazawa et al., 2005). The patterns are inconsistent with storage conditions alone – for example, the DF and EDC cores were stored very cold and SP drilled very recently; yet all three have strong and depletion. Natural gas loss from the firn and artifactual loss during drilling likely dominate the signal. The DE08-OH samples were dry-drilled and suffered from poor ice quality for the most depleted samples, which may explain the alternate 1:1 slope at the site (Appendix B); note though that a recent work suggests a slope for post-coring gas loss (Oyabu et al., 2021). The DE08-OH samples were also analyzed differently from those at other sites, with and measurements performed on a separate smaller ice piece (see Sect. 2.2); the greater surface-to-volume ratio of such small samples may result in greater gas fractionation while evacuating the sample flasks in the laboratory.
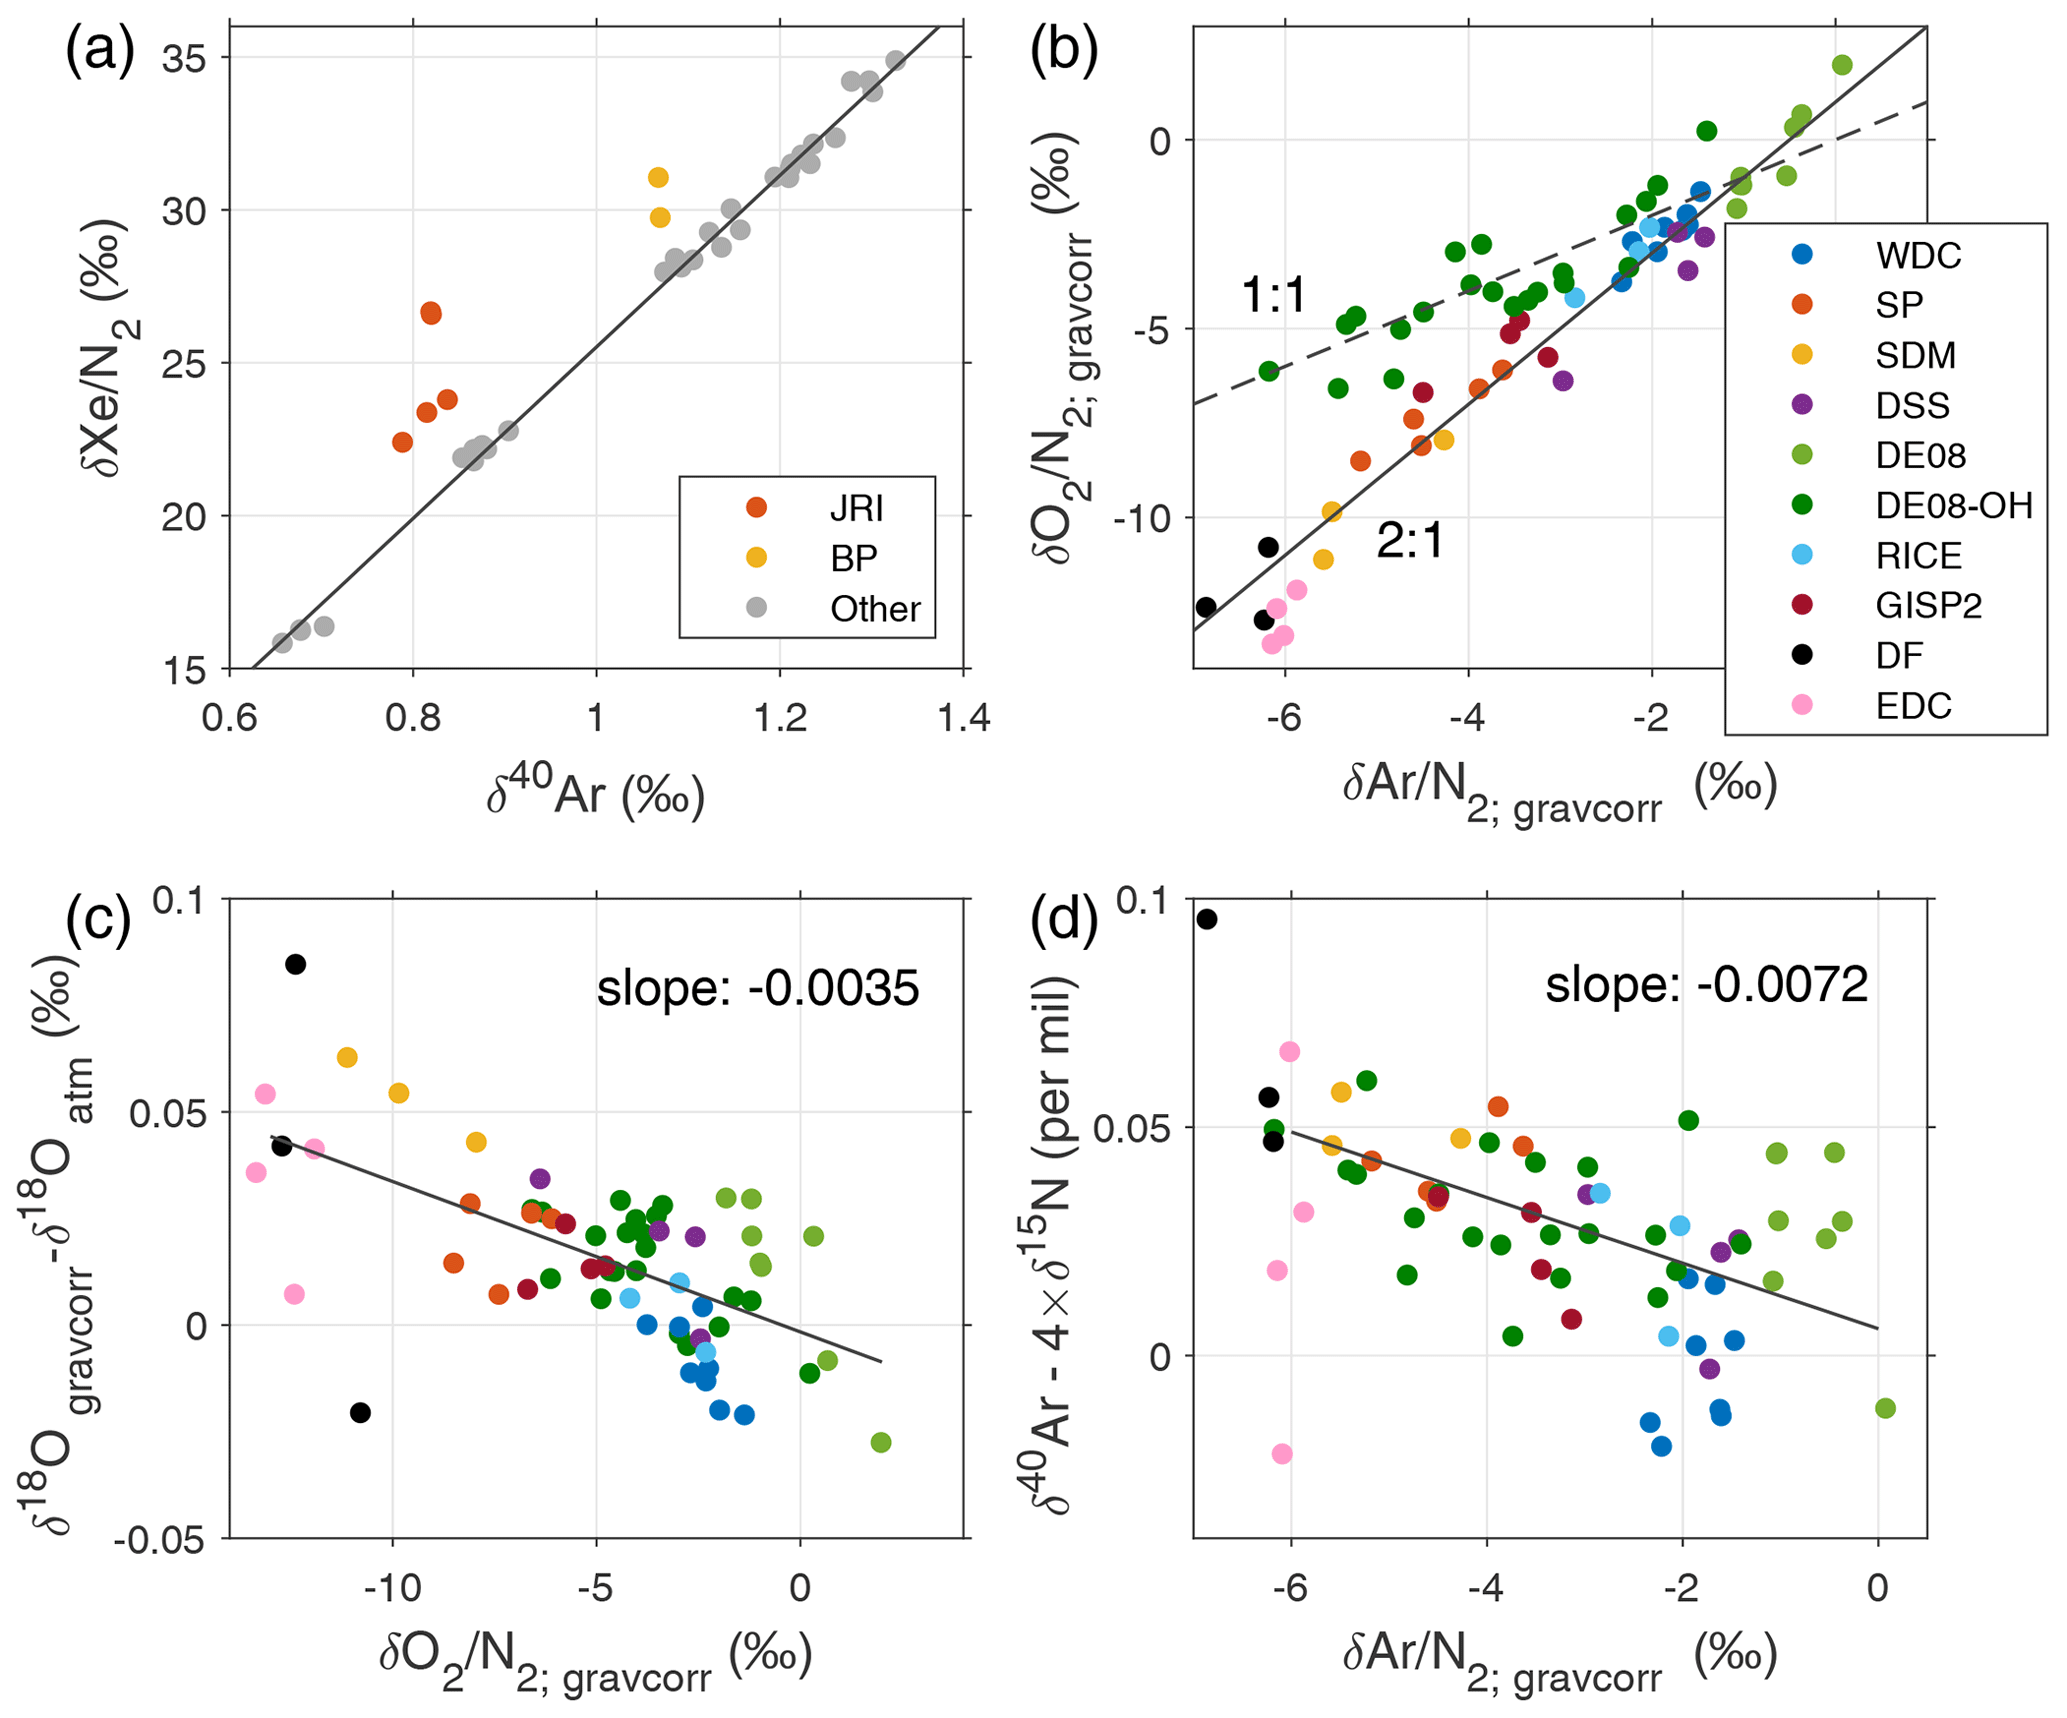
Figure A1Elemental ratios in the 11-site calibration study of late Holocene samples. (a) vs. δ40Ar in all ice core samples. δ40Ar is used solely to illustrate gravitational enrichment, and a similar picture arises when plotted against any isotopic pair. Refrozen meltwater (elevated ) was seen in all samples from the Antarctic Peninsula (James Ross Island and Bruce Plateau sites), despite selecting samples free of visible melt features. (b) The relationship between the commonly used gas loss proxies and corrected for gravity. (c) Enrichment in δ18O (corrected for gravity and atmospheric δ18Oatm) plotted against gravity-corrected . (d) δ40Ar enrichment plotted against gravity-corrected . In all panels gravitational correction is applied by subtracting δ15N times the atomic mass unit difference.
Severinghaus et al. (2009) hypothesize that the apparent 2:1 slope of to depletion is a combination of two mechanisms: size-dependent fractionation during diffusion through the ice lattice and mass-dependent fractionation (such as molecular or Knudsen diffusion) within ice fractures. In this interpretation, the exact slope would depend on the relative contribution of each process to the total gas loss. It is improbable that both processes would occur in the same ratio at such a wide variety of sites; the 2:1 slope is thus more likely an attribute of the gas diffusion rate of gases through ice itself, which is strongly size-dependent and weakly mass-dependent (Battle et al., 2011).
Gas loss is well-known to enrich ice samples in δ18O–O2, and following Severinghaus et al. (2009) we plot δ18O (corrected for gravity and small atmospheric δ18Oatm variations) against gravitationally corrected in Fig. A1c. We find a slope of 3.5 per meg enrichment in δ18O per ‰ of gas loss. This is less than values reported elsewhere (Severinghaus et al., 2009) but provides further evidence for mass-dependent fractionation during gas loss. Our core-top dataset further suggests a correlation between (a measure of δ40Ar enrichment impacted by both thermal fractionation and gas loss) and gravitationally corrected (Fig. A1d), suggesting Ar loss leads to enrichment of the remaining δ40Ar.
Following Severinghaus et al. (2009), we assume that the δ40Ar correction scales with gas loss indicator (–):
with the isotopic gas loss correction on δ40Ar and ε40 a scaling parameter. Note that gravitationally corrected and data are used. Here we rely on data from the Antarctic Byrd ice core for a best estimate of ε40 (Fig. A2); some samples from this core suffered extreme gas loss with (–) as low as −100 ‰. This dataset suggests , or 8 per meg δ40Ar enrichment per ‰ of (–) gas loss. Because of the 2:1 slope between and , we find that – and therefore the coefficient ε40 would have a similar slope when regressed against instead of (–).
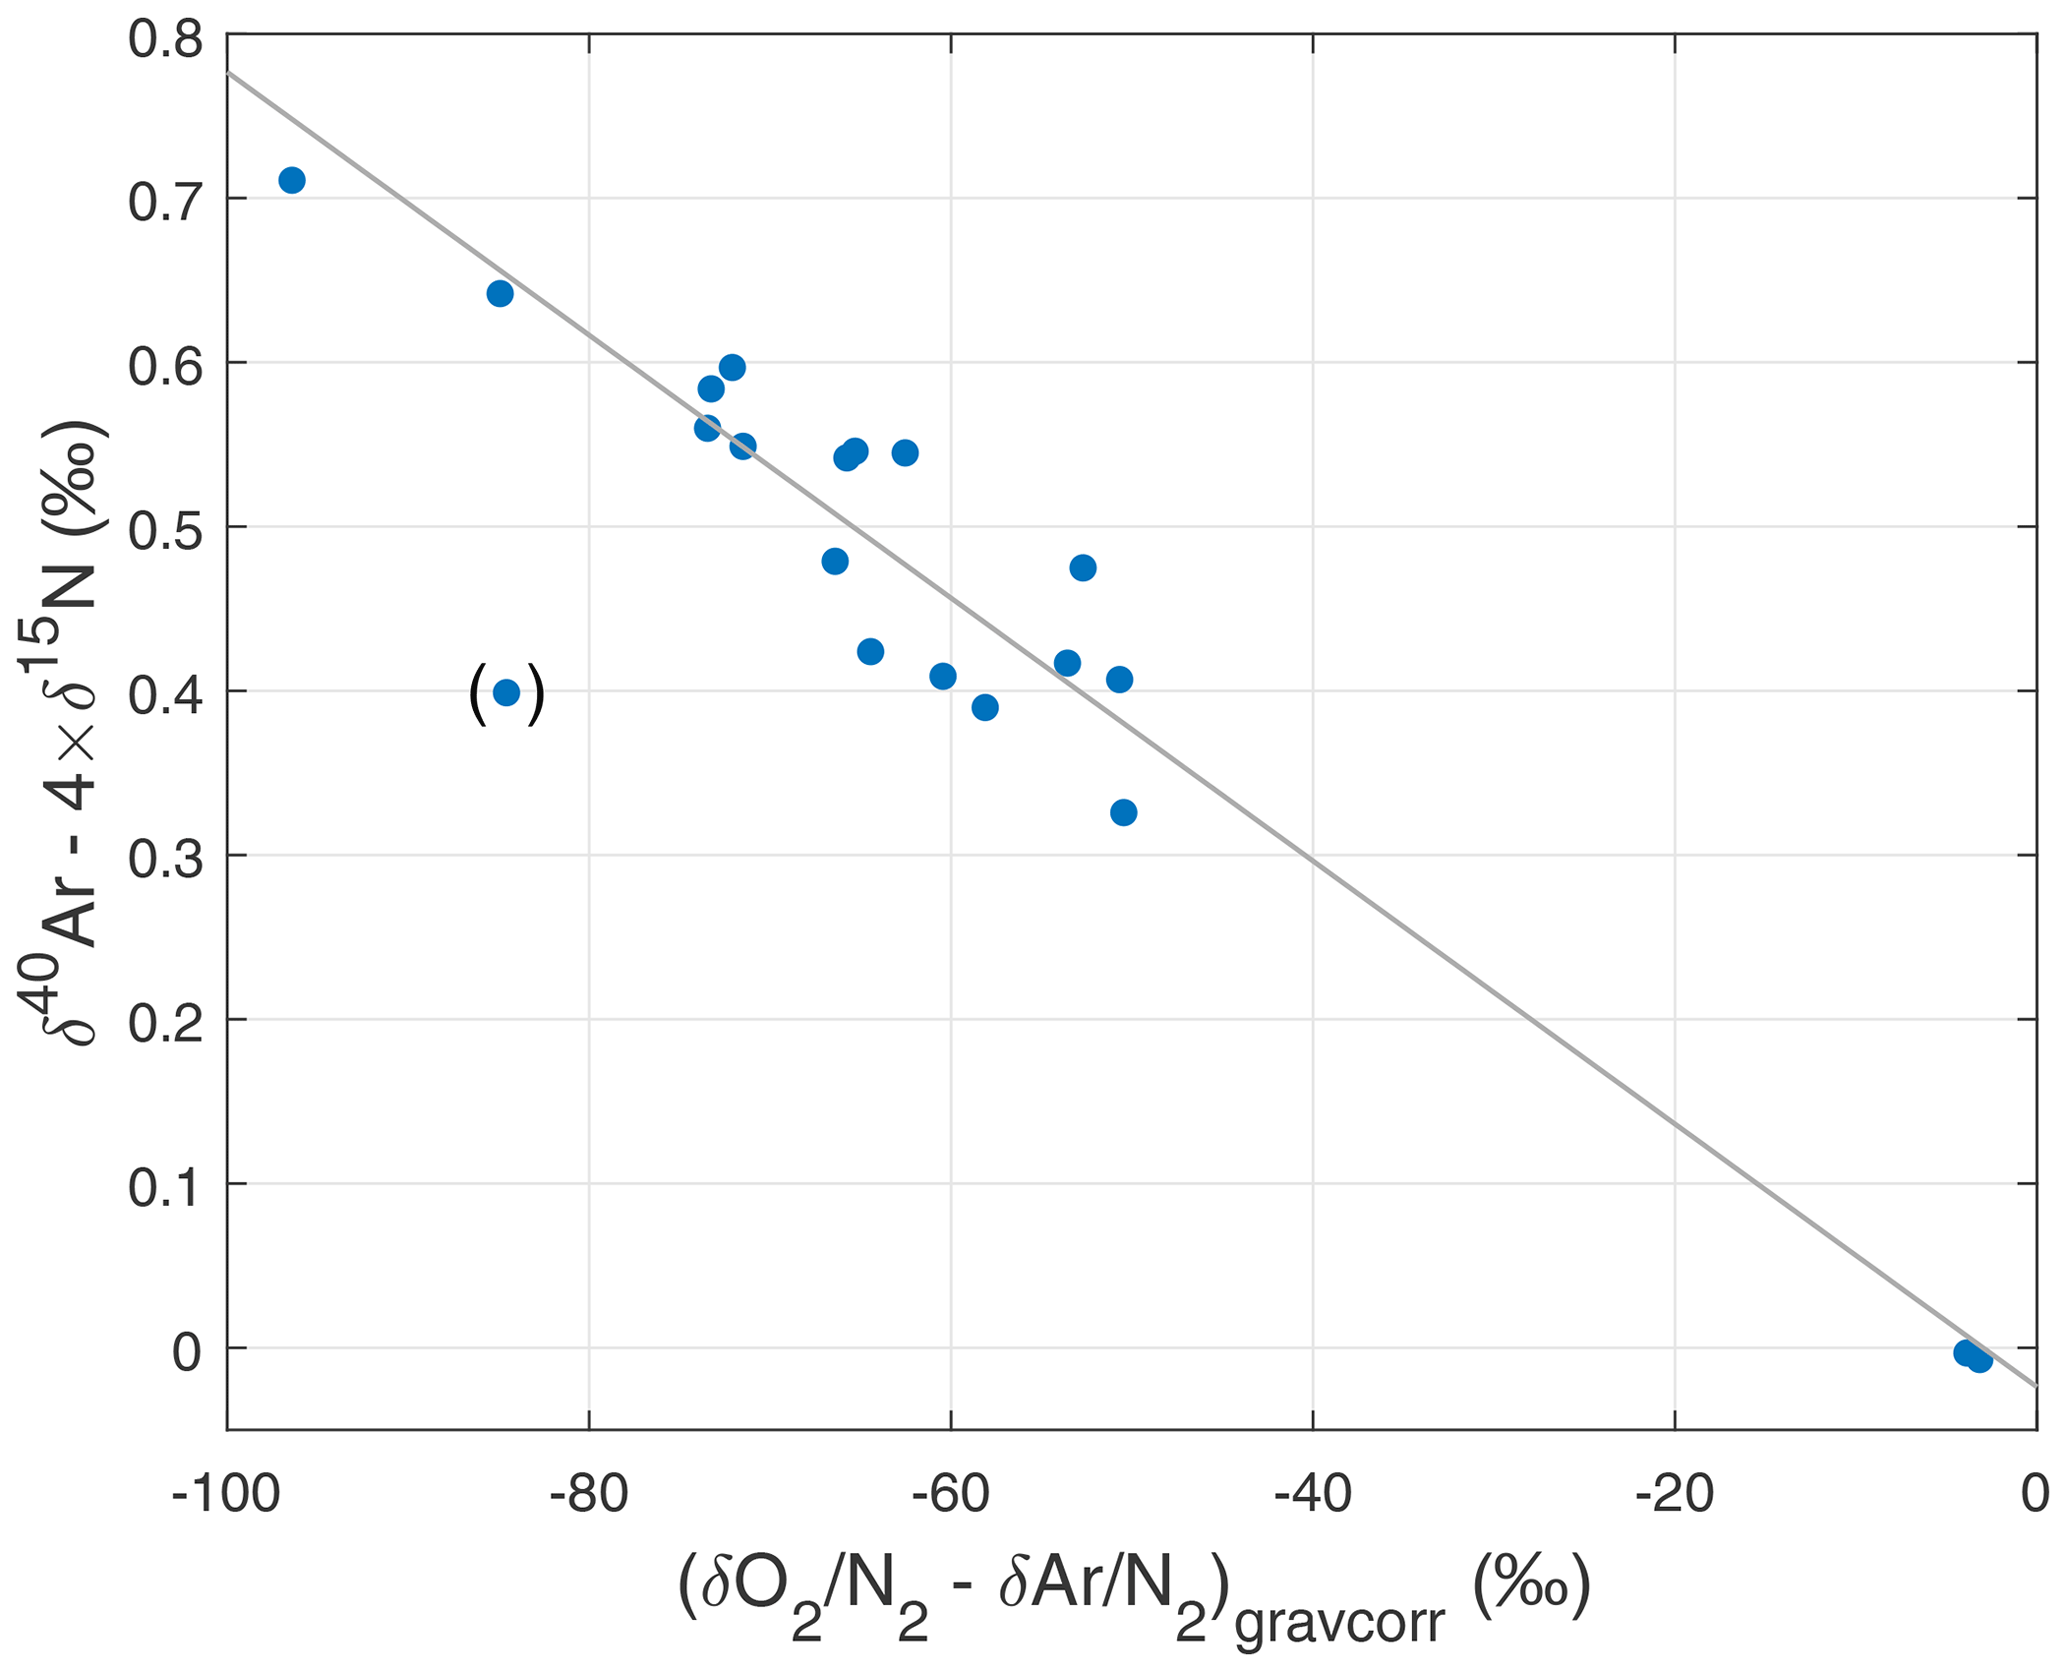
Figure A2Argon isotopic enrichment due to gas loss in the Byrd core used to determine the δ40Ar gas loss correction (Appendix A1). The enrichment in δ40Ar plotted as a function of gravitationally corrected (–) measured in the deep Antarctic Byrd ice core, which suffered heavy gas loss. Ice samples were analyzed in the Bender Lab at the University of Rhode Island by Jeff Severinghaus in 1997. The slope of the least-square fit is . The data point in parentheses is treated as an outlier and excluded from the fitting.
The value of agrees reasonably well with other studies. Kobashi et al. (2008b) compare replicate sample pairs to back-out gas loss and find (statistically significant) correlations between δ40Ar enrichment and (again, which is similar to –). Kobashi et al. (2008b) find ε40 values of −0.006, −0.005, and +0.007, depending on the depth range and analytical campaign evaluated. The positive value is surprising given that most observations, as well as theory, suggest ε40 should be negative – we consider this a spurious result given the weak δ40Ar– correlation in that particular dataset. The other two values of ε40 are in reasonable agreement with the Byrd value. For the Siple Dome ice core (Severinghaus et al., 2003), regressing δ40Ar against gives a slope of +0.007; this implies , in good agreement with our findings. Last, our core-top data suggest δ40Ar enrichment with an ε40 value of −0.0072 (Fig. A1d), also in good agreement with Byrd.
Given the uncertainty in the gas loss parameter, we verify that our results are valid for a wide range of ε40 values (Fig. 3b).
The downcore WDC 86Krxs was measured over five separate measurement campaigns, with and data available only for the first three campaigns.
In order to provide a consistent gas loss correction to the five measurement campaigns, including campaigns 4 and 5 for which no or data are available, we fit a third-order polynomial to all available gravitationally corrected WDC – data (Fig. A5a). We can then calculate the expected WDC – at any given age, also in the absence of and data. For consistency, we use this correction method for all data seen in Fig. 6. Note that the WDC – values are small for all ages and that the gas loss correction is therefore small for this site.
A2 Thermal correction
In the presence of a temperature gradient, thermal diffusion causes isotopic enrichment towards the colder location. The thermal diffusion sensitivity Ω in units of ‰ K−1 for the various gases is given as (Grachev and Severinghaus, 2003a, b; Kawamura et al., 2013) follows.
We estimate the thermal gradient ΔT in the firn using N-15 excess (Severinghaus et al., 1998):
with the δ40Ar gas loss correction from Eq. (A1). Positive values of ΔT indicate that the surface is warmer than the firn–ice transition. The ΔT then in turn allows us to estimate the thermal corrections.
The samples from the calibration dataset are from the climatically stable late Holocene period and typically close together in depth; the uncertainty in the ΔT estimation for individual samples therefore exceeds the temporal variability in ΔT. To reduce the uncertainty in the thermal correction we estimate ΔT for individual samples using Eq. (A2) and for each site average the available data to get a site average firn temperature gradient . The thermal correction is then given by the following.
The two methods are compared in Figs. A3c (individual sample ΔT) and Fig. A3d (site mean ); it is clear that the approach reduces the spread in 86Krxs (error bars), but not its mean (white dots). The ΔT estimates in individual samples are subject to errors in the isotopic measurements; some of these errors will cancel out in the .
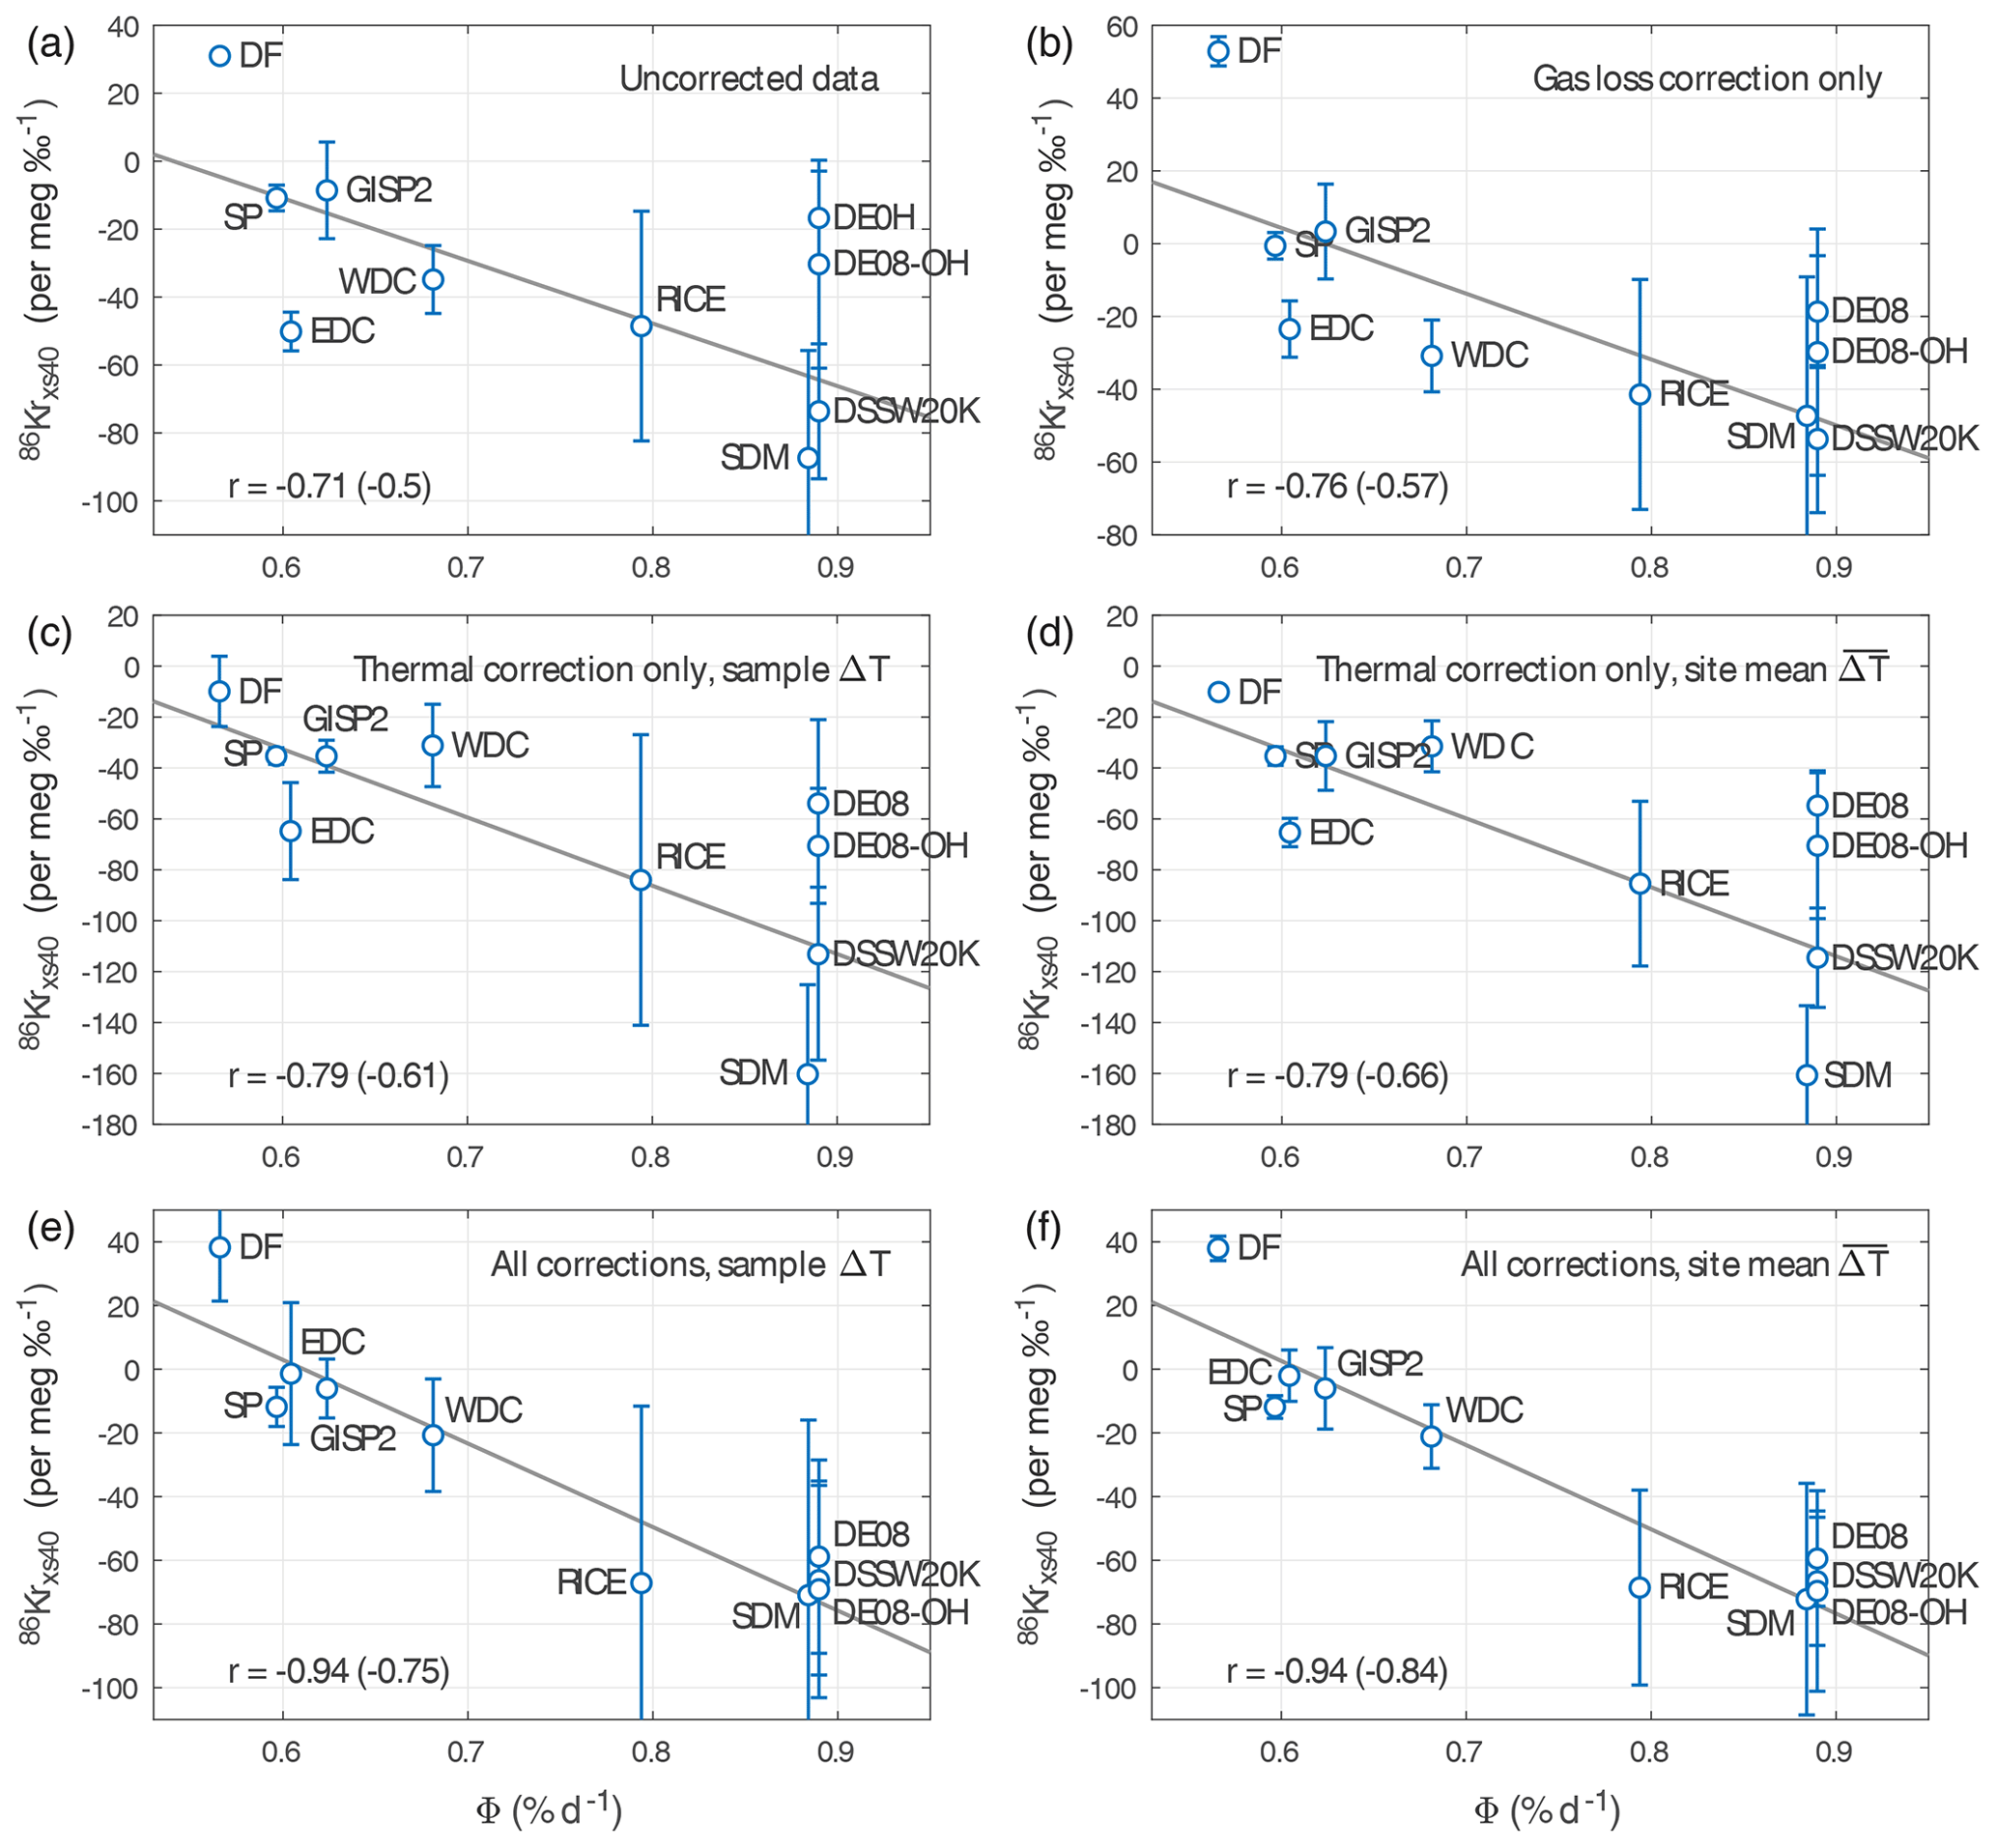
Figure A3Influence of gas loss and thermal correction on the 86Krxs40 calibration. We plot 86Krxs40 as a function of Φ (a) without any data corrections applied, (b) with only the gas loss correction applied (), (c) with only the thermal correction applied using individual sample ΔT, (d) with only the thermal correction applied using individual site mean , (e) with both gas loss and thermal corrections applied using individual sample ΔT, and (f) with both gas loss and thermal corrections applied using site mean . In each panel the correlations with Φ are listed for the site average and individual sample with the latter in parentheses. For all correlations p<0.05.
For the downcore WDC record through the deglaciation we can no longer assume a stationary ΔT; we instead rely on dynamic firn densification model simulations of ΔT (Buizert et al., 2015). A comparison of the simulated and data-based ΔT is shown in Fig. A5 for WDC. The data clearly show a lot more scatter and variability than the simulations do. We interpret this mainly as analytical noise in the δ15N and δ40Ar measurements; however, the gas loss correction (Appendix A1) also impacts the ΔT estimation in individual samples. The comparison suggests that the scatter in the ΔT estimates actually exceeds the magnitude of the simulated thermal signals. Using ΔT of the individual samples would thus introduce a high amount of scatter in the (thermally corrected) 86Krxs records, and we choose to use the modeled ΔT instead.
A3 Elevation correction
To correct the deglacial WAIS Divide record for elevation changes, here we estimate the 86Krxs dependence on site elevation using the calibration dataset. Note that elevation and synoptic activity are strongly correlated for the investigated sites (), with synoptic activity decreasing with elevation because the cyclonic systems do not penetrate deeply into the Antarctic interior. Figure A6 shows the result of this exercise. We find a slope of 34 per meg ‰−1 of 86Krxs per 1000 m of elevation change, with a correlation of r=0.96 when considering site mean 86Krxs and r=0.86 when considering individual samples. Note that the GISP2 site is not included in the analysis because it is in Greenland where the elevation–86Krxs relationship may be different from Antarctica – it does, however, fit the Antarctic trend rather well. We further use the simulated WAIS Divide elevation history (Golledge et al., 2014), which simulates an LGM elevation of around 300 m higher than at present at WAIS Divide.
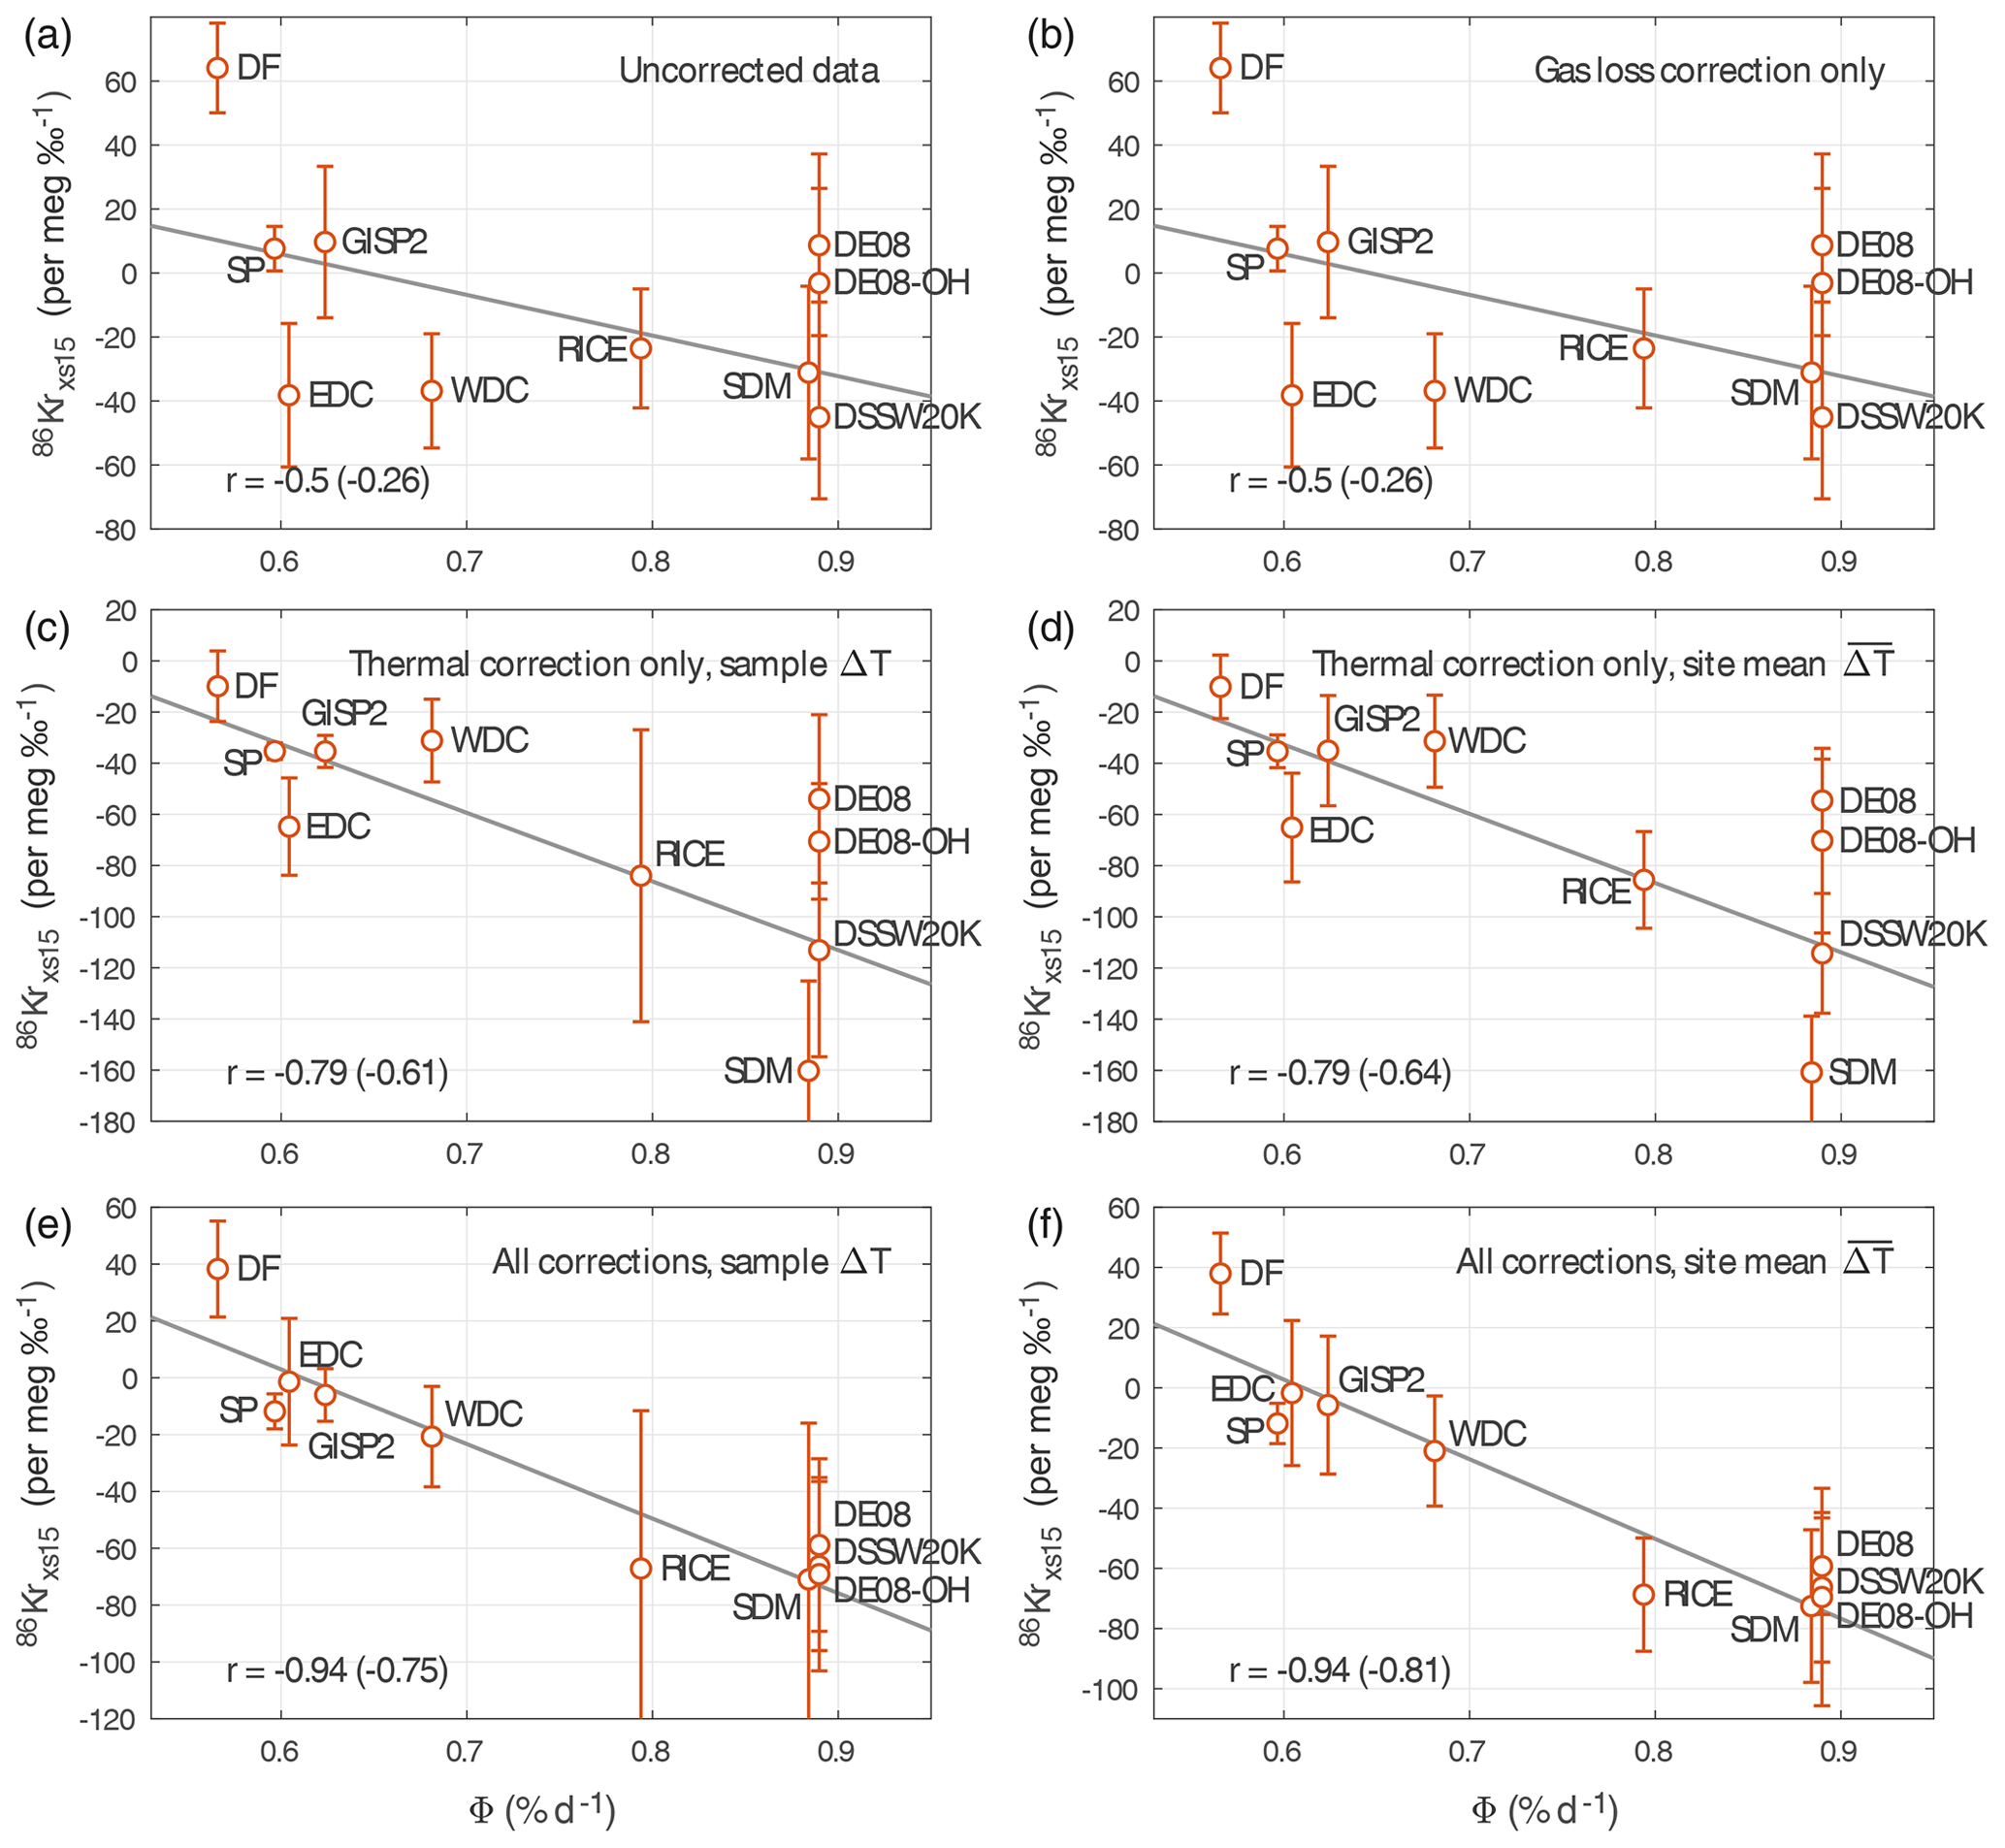
Figure A4Same as Fig. A3, but for 86Krxs15. Note that the gas loss correction (b) does not impact 86Krxs15. For all correlations p<0.05, except for panels (a) and (b) for which p=0.16 for the site average correlation.
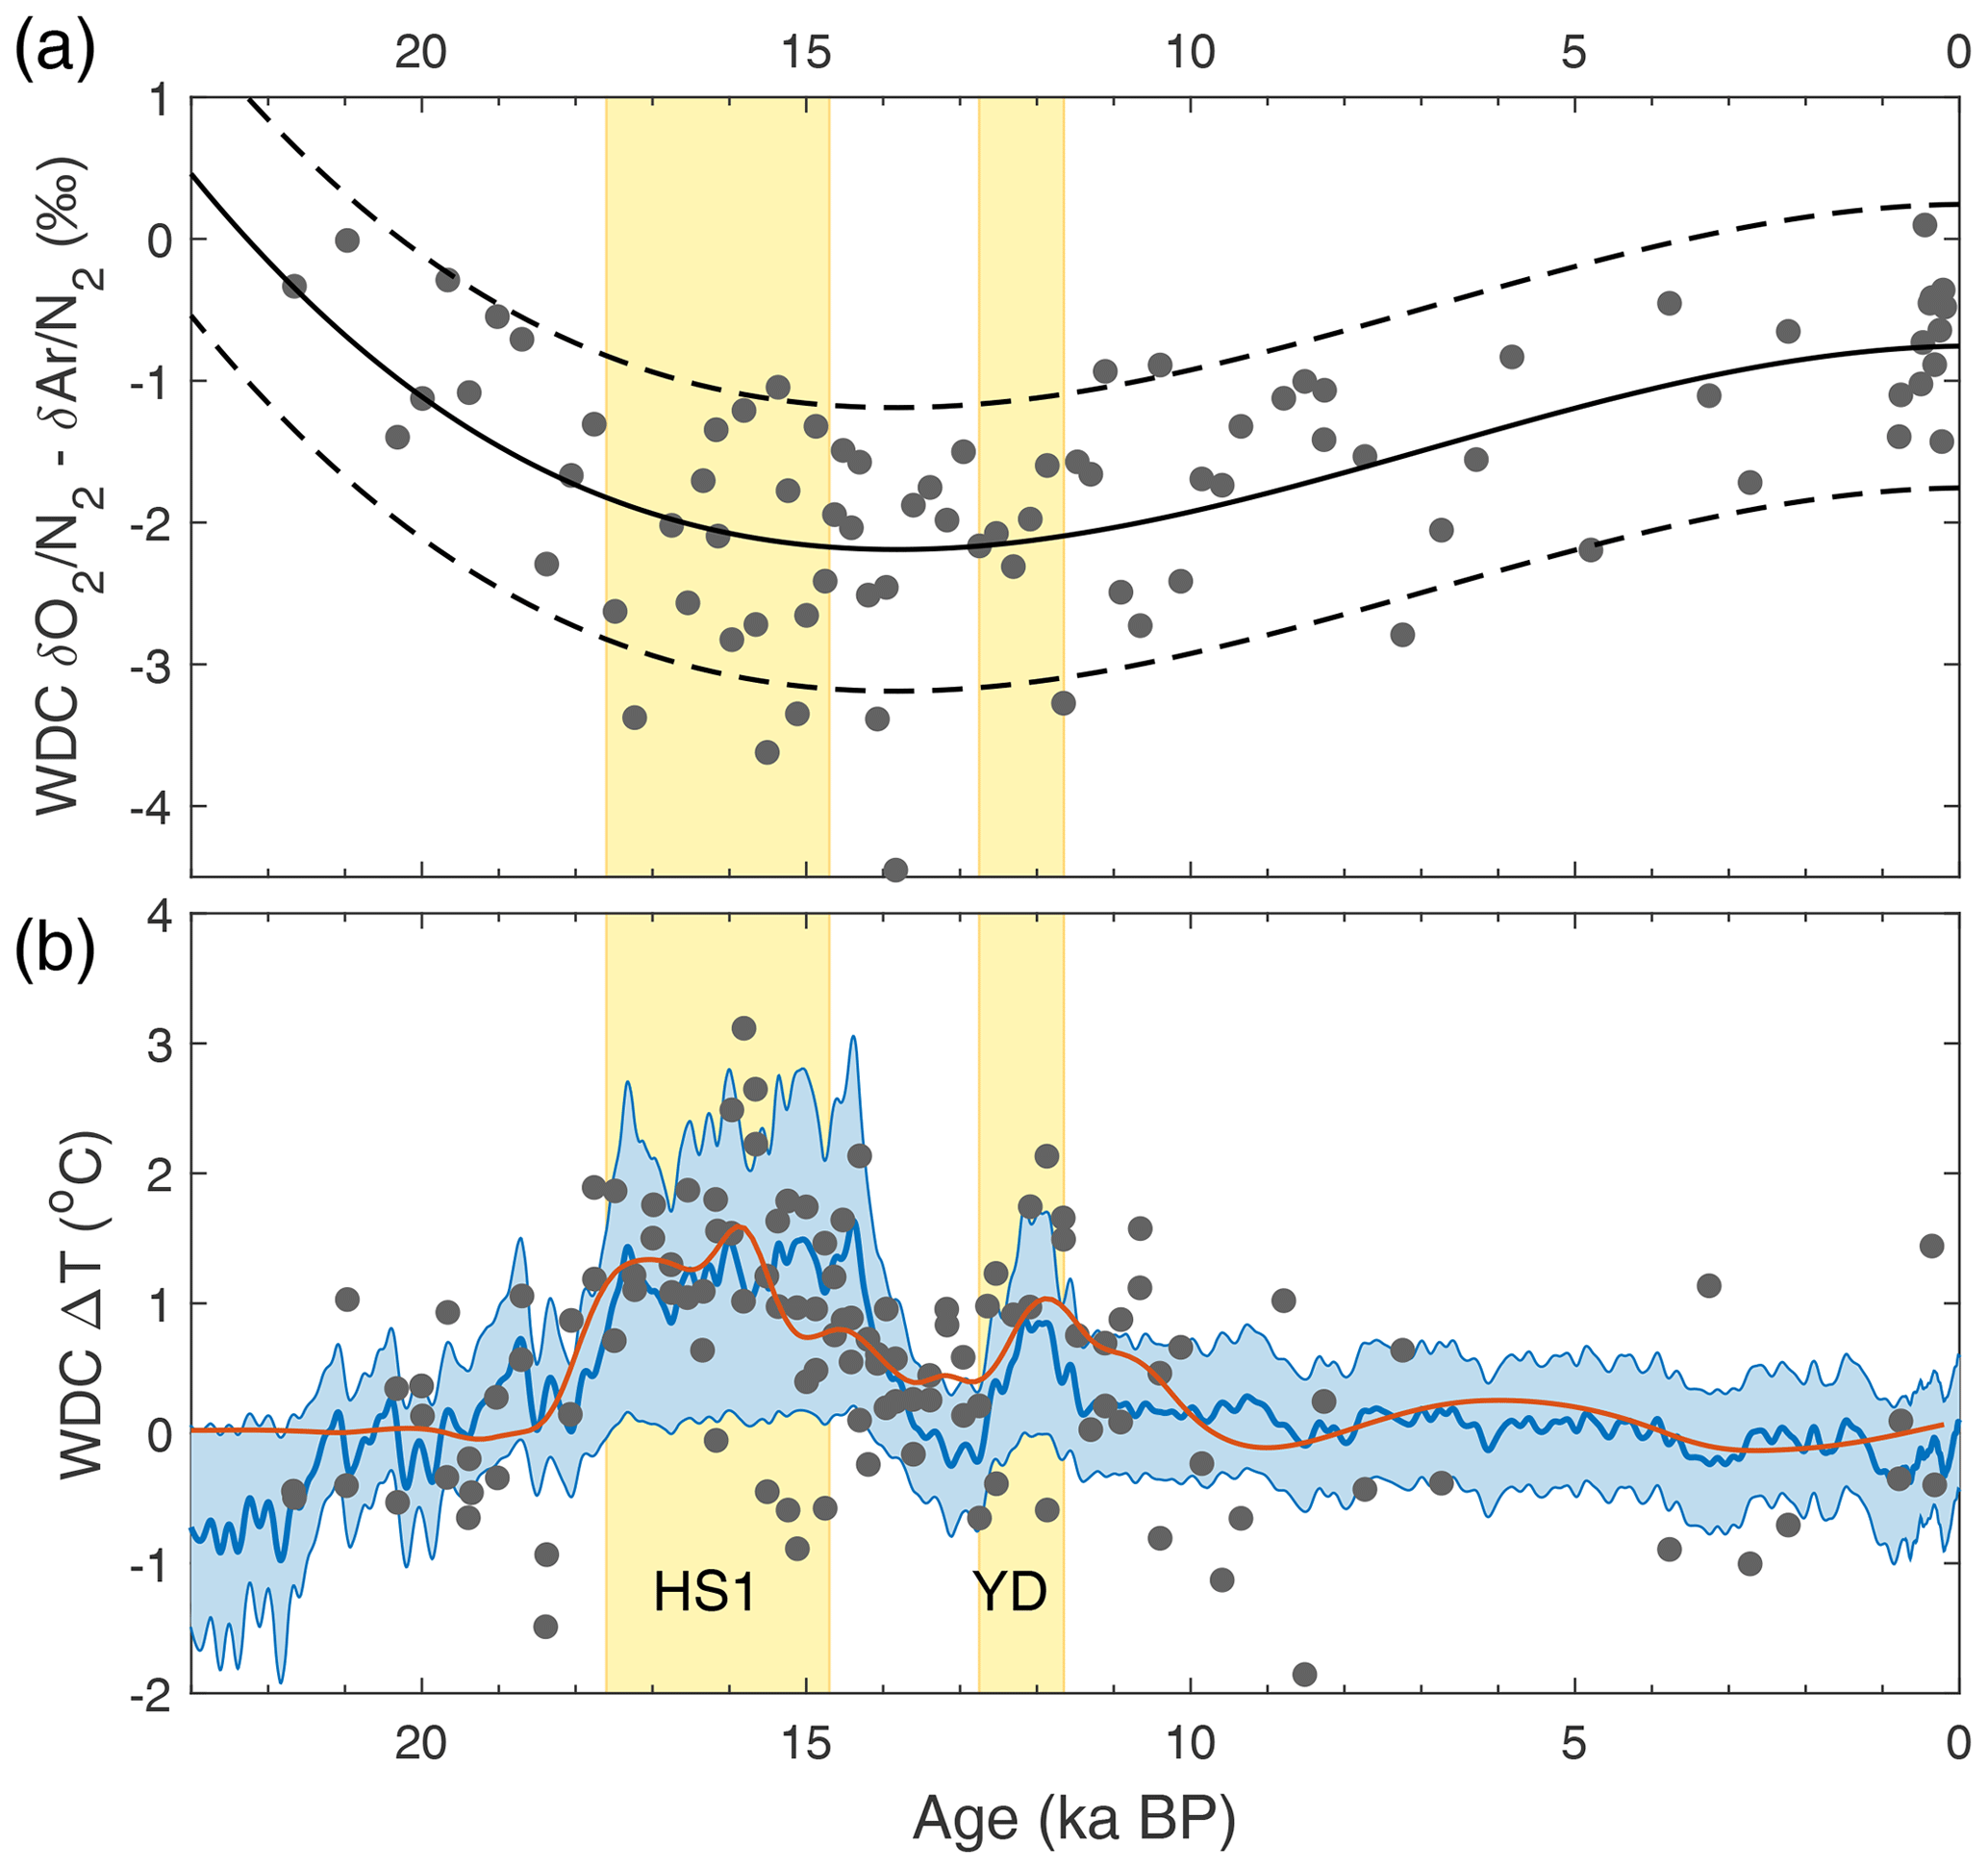
Figure A5Gas loss and thermal corrections for the WDC time series. (a) WDC gravity-corrected – as a measure of gas loss. The solid line is a third-order polynomial fit to the data; the dashed lines give a ±1 ‰ range around the fit, which captures the majority of the data. (b) The ΔT correction applied to the downcore records. The blue envelope shows the ±2σ range of thermal correction scenarios in the Monte Carlo sampling, together with the mean (blue line). Gray dots show WDC ΔT estimates from available 15N excess data, with the red curve being a Gaussian smoothing function to the data.
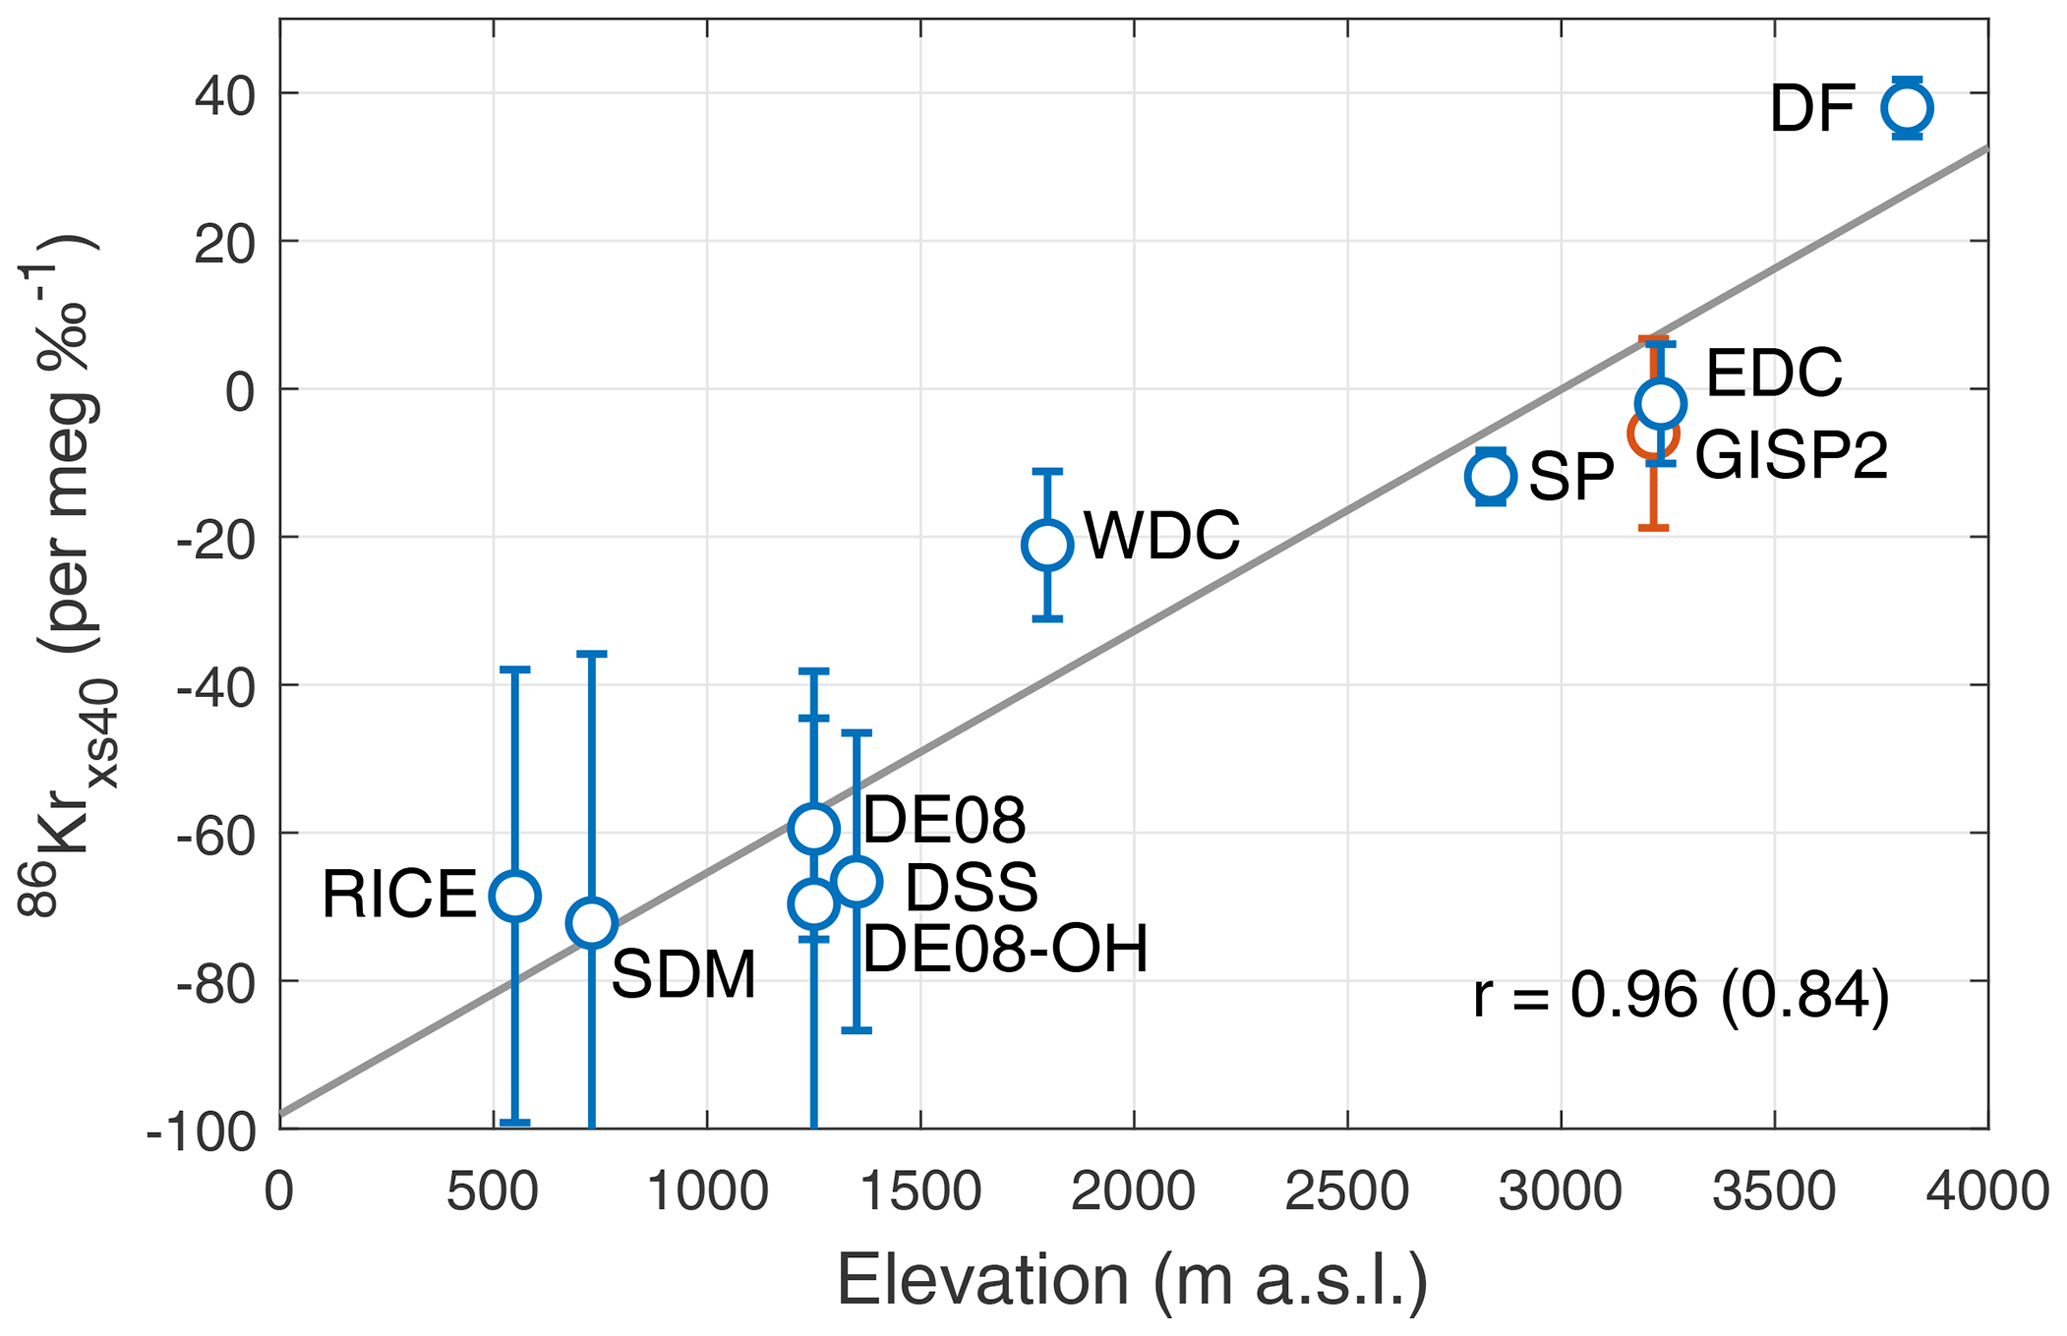
Figure A6Kr-86 excess dependence on site elevation. The vertical axis is the 86Krxs. The linear fit has a slope of 34 per meg ‰−1 per 1000 m elevation.
The Law Dome DE08-OH site is a revisit of the DE08 site, drilled in the 2018–2019 austral summer Antarctic field season. We have samples from two separate cores: (1) 13 24 cm long samples from a 10 cm diameter core going from 97 to 193 m depth at ∼8 m sample spacing and (2) 8 6 cm long samples from a 24 cm diameter core going from 97.6 to 99.8 m depth at 30 cm sample spacing. The purpose of the first set was to determine possible long-term variations in 86Krxs; the purpose of the second set was to assess whether there are sub-annual variations in 86Krxs due to the seasonality in firn properties and bubble trapping.
Both cores were dry-drilled (i.e., no drill liquid was used). The 10 cm diameter core used was drilled at the beginning of the field season and the 24 cm diameter core at the end of the field season. Prior to shipment off the continent, both cores were stored in a chest freezer at Casey Station; due to a miscommunication this freezer was set to −20 ∘C rather than −26 ∘C, yet the ice is believed to have stayed below −18 ∘C.
Both DE08-OH cores experienced more gas loss than the original DE08 core that we also sampled (Fig. A1b). In particular, the samples from the 10 cm diameter core were strongly depleted in , with the most extreme gas loss seen for the deepest samples for which the ice quality was poorest.
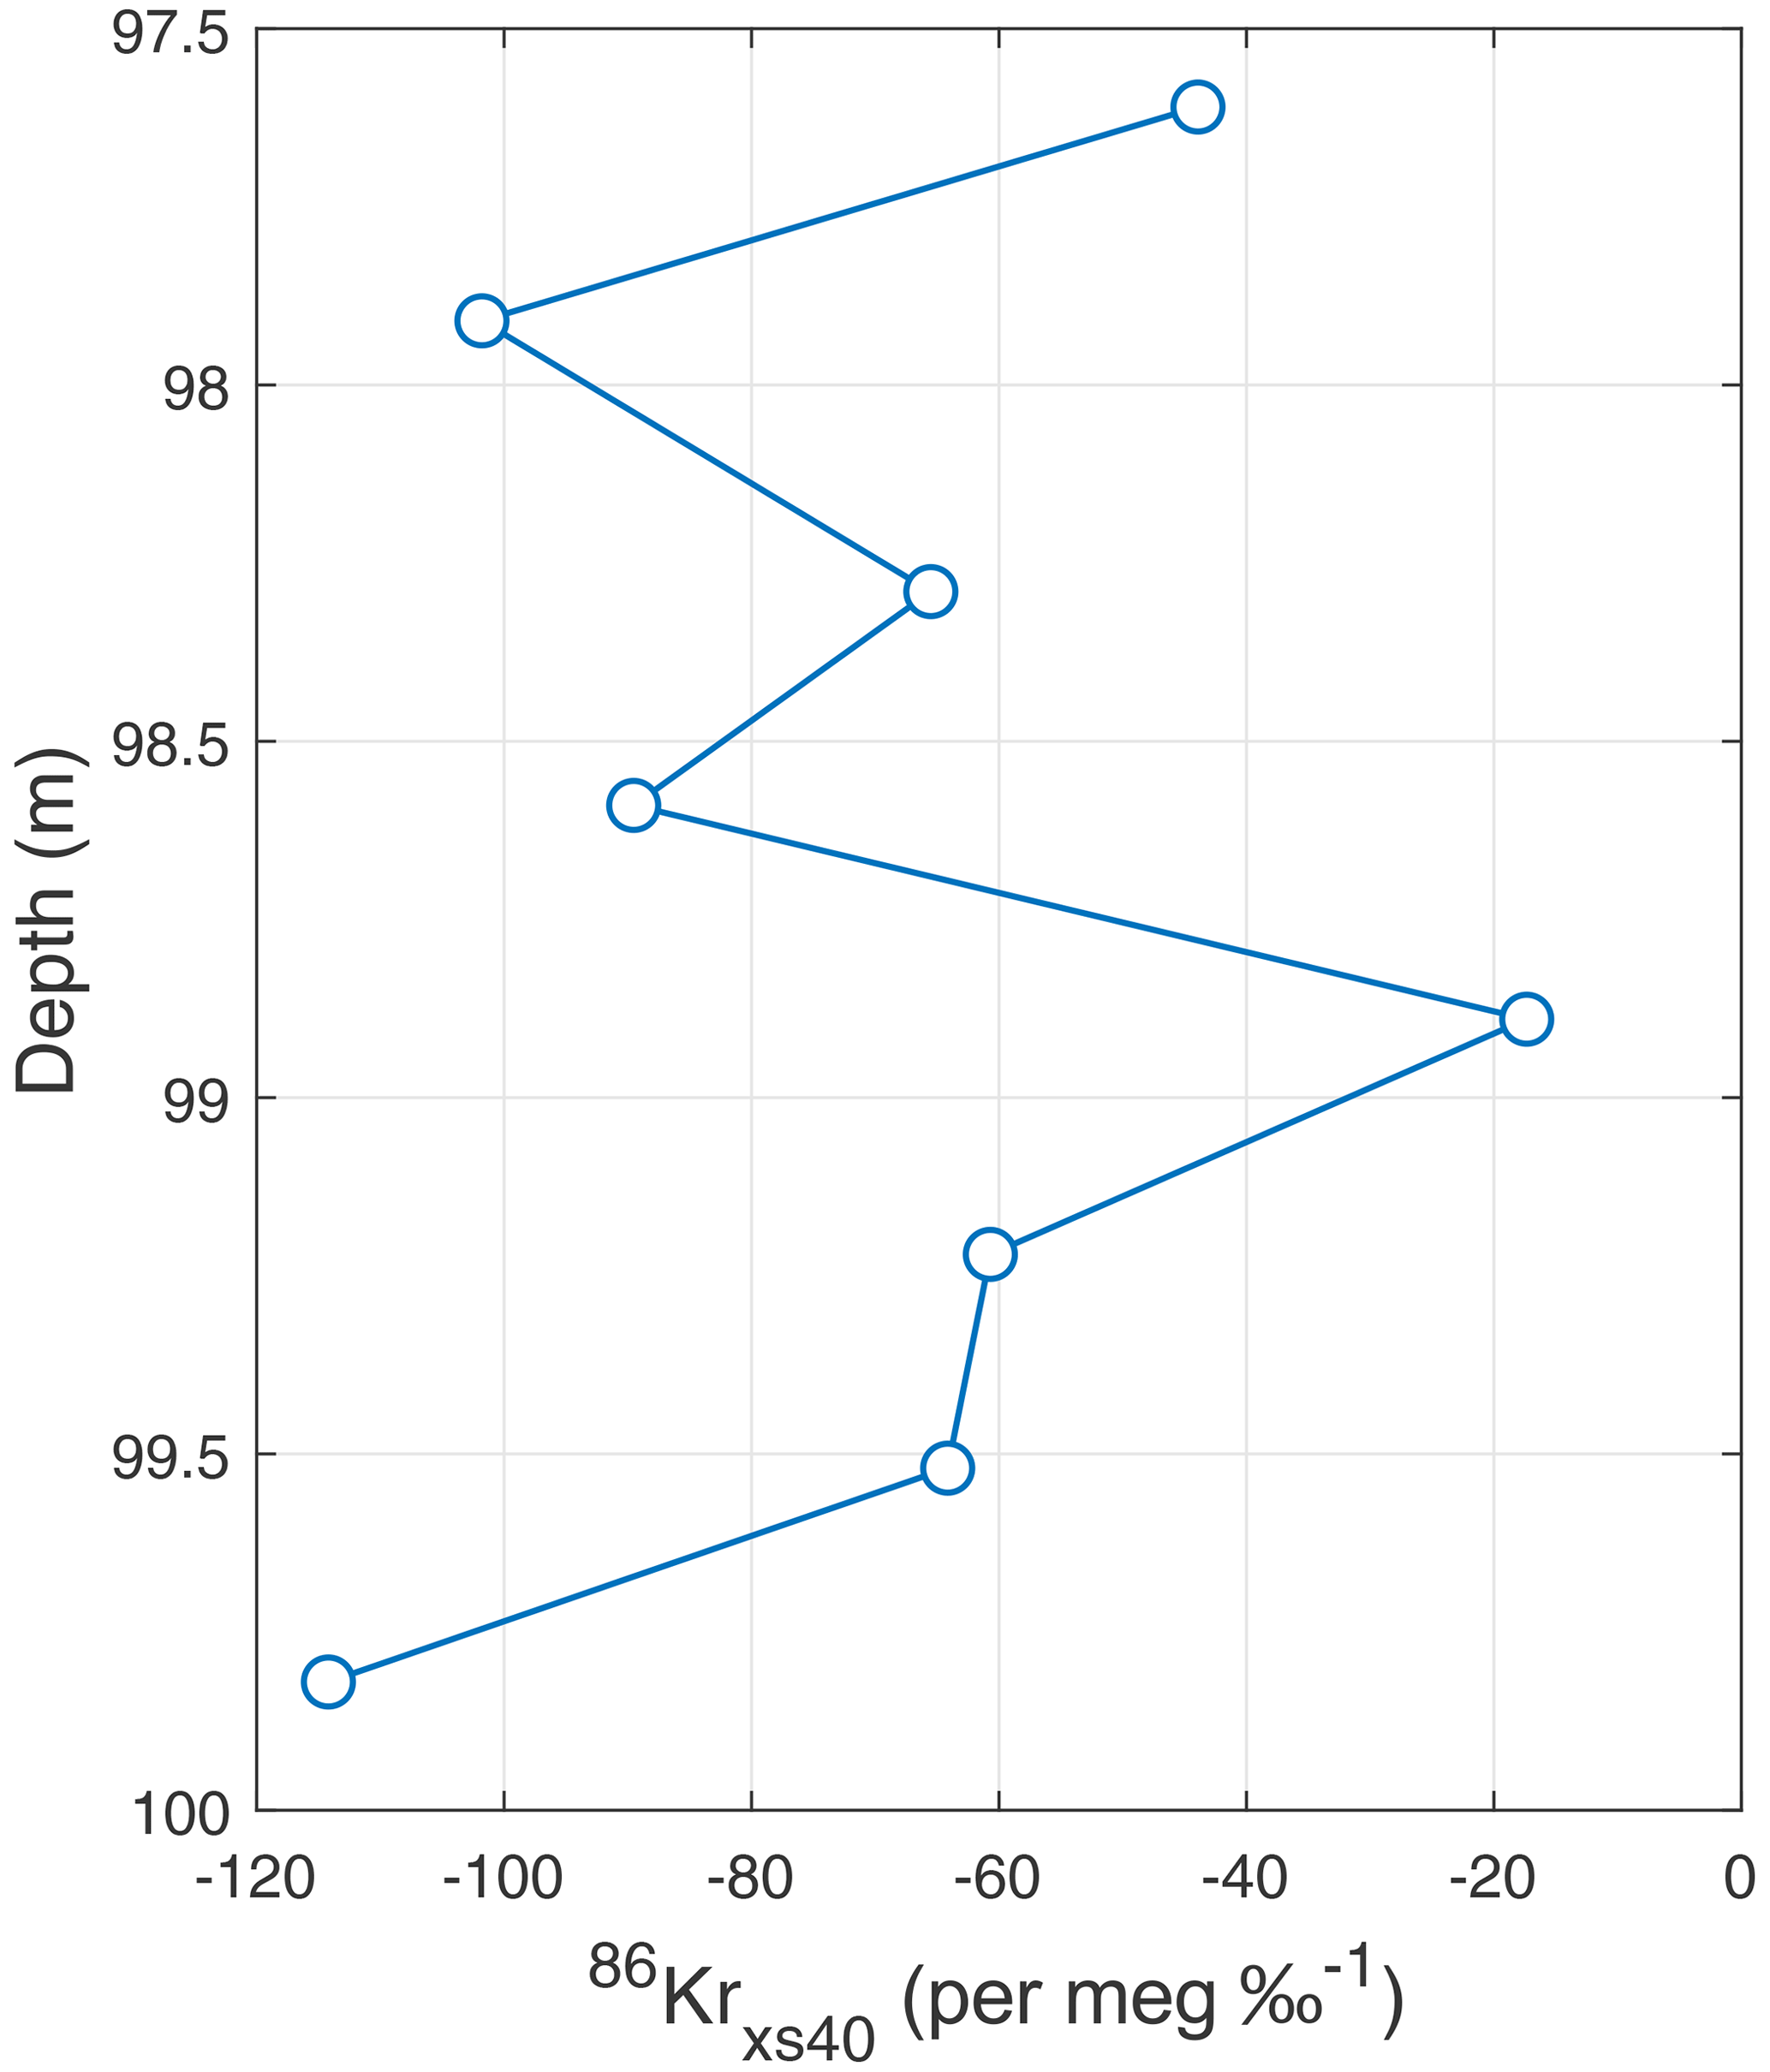
Figure B1High-resolution sub-annual sampling of 86Krxs40 at the DE08-OH site. The annual layer thickness at this depth is around 1.3 m.
Figure B1 shows the high-resolution sub-annual DE08-OH sampling. The data were corrected for gas loss and thermal fractionation using a site mean temperature gradient of ∘C, possibly related to a rectifier effect (Morgan et al., 2022). We find strong (5-fold) variations in 86Krxs on sub-annual timescales. With an expected annual layer thickness of around 1.3 m at this depth, it appears as though there may be an annual-scale variation in 86Krxs; the dataset has insufficient length to establish this firmly.
We refrain from interpreting the long-term variations in 86Krxs in the 10 cm diameter core for two reasons. First, given the strong sub-annual variations seen in the high-resolution sampling, it is unavoidable that we are aliasing the underlying signal in the core. Second, the 10 cm diameter core suffers from strong gas loss (depleted ). We attribute this primarily to the dry drilling and imperfect sample storage conditions. Perhaps the greater stresses during drilling a 10 cm core (compared to the 24 cm diameter core) result in more microfractures and gas loss.
Data are available at https://www.usap-dc.org/view/project/p0010037 (USAP-DC, 2023).
CB, JS, AJO, and EJB designed research; SS, AS, BB, KK, DB, AJO, JDM, and IO contributed measurements; KK, DME, NB, RLP, RM, EMT, PDN, DT, and VVP contributed ice core samples; CB and WHGR analyzed reanalysis data; CB, AJO, and BB performed firn modeling; CB drafted the paper with input from all authors.
The contact author has declared that none of the authors has any competing interests.
Publisher's note: Copernicus Publications remains neutral with regard to jurisdictional claims in published maps and institutional affiliations.
This article is part of the special issue “Ice core science at the three poles (CP/TC inter-journal SI)”. It is not associated with a conference.
The idea for the Kr-86 excess proxy came out of discussions at the 2014 WAIS Divide Ice Core Science Meeting held at the Scripps Institution of Oceanography in La Jolla, CA. The authors want to thank John Chiang, Justin Wettstein, Zanna Chase, Bob Anderson, Tyler Jones, and Eric Steig for useful discussions, data sharing, and paper feedback, the NSF ice core facility (NSF-ICF, formerly the National Ice Core Laboratory) for curating and distributing ice core samples, the European Centre for Medium-Range Weather Forecasts (ECMWF) for making ERA-Interim reanalysis datasets publicly available, and the US ice drilling program for coordinating ice core drilling in Antarctica. Ice drilling and field support at Law Dome and sample handling in Hobart were provided by the Australian Antarctic Science Program, the Australian Antarctic Division, and (at DE08-OH) the US National Science Foundation.
This research has been supported by the National Science Foundation (grant nos. ANT-0944343, ANT-1543267, ANT-1543229, ANT-1643716, and ANT-1643669), the New Zealand Ministry of Business, Innovation and Employment (grant nos. RDF-VUW-1103, 15-VUW-131, and 540GCT32), and the Japan Society for the Promotion of Science KAKENHI grants (grant nos. 17H06320 and 15KK0027).
This paper was edited by Hubertus Fischer and reviewed by two anonymous referees.
Anderson, R. F., Ali, S., Bradtmiller, L. I., Nielsen, S. H. H., Fleisher, M. Q., Anderson, B. E., and Burckle, L. H.: Wind-Driven Upwelling in the Southern Ocean and the Deglacial Rise in Atmospheric CO2, Science, 323, 1443–1448, 2009.
Baggenstos, D., Häberli, M., Schmitt, J., Shackleton, S. A., Birner, B., Severinghaus, J. P., Kellerhals, T., and Fischer, H.: Earth's radiative imbalance from the Last Glacial Maximum to the present, P. Natl. Acad. Sci. USA, 116, 14881–14886, https://doi.org/10.1073/pnas.1905447116, 2019.
Bals-Elsholz, T. M., Atallah, E. H., Bosart, L. F., Wasula, T. A., Cempa, M. J., and Lupo, A. R.: The Wintertime Southern Hemisphere Split Jet: Structure, Variability, and Evolution, J. Climate, 14, 4191–4215, 2001.
Battle, M. O., Severinghaus, J. P., Sofen, E. D., Plotkin, D., Orsi, A. J., Aydin, M., Montzka, S. A., Sowers, T., and Tans, P. P.: Controls on the movement and composition of firn air at the West Antarctic Ice Sheet Divide, Atmos. Chem. Phys., 11, 11007–11021, https://doi.org/10.5194/acp-11-11007-2011, 2011.
Bender, M., Sowers, T., and Lipenkov, V.: On the concentrations of O2, N2, and Ar in trapped gases from ice cores, J. Geophys. Res., 100, 18651–18660, 1995.
Bender, M. L.: Orbital tuning chronology for the Vostok climate record supported by trapped gas compositionc, Earth Planet. Sc. Lett., 204, 275–289, 2002.
Bereiter, B., Kawamura, K., and Severinghaus, J. P.: New methods for measuring atmospheric heavy noble gas isotope and elemental ratios in ice core samples, Rapid Commun. Mass Spectrom., 32, 801–814, 2018a.
Bereiter, B., Shackleton, S., Baggenstos, D., Kawamura, K., and Severinghaus, J.: Mean global ocean temperatures during the last glacial transition, Nature, 553, 39–44, https://doi.org/10.1038/nature25152, 2018b.
Birner, B., Buizert, C., Wagner, T. J. W., and Severinghaus, J. P.: The influence of layering and barometric pumping on firn air transport in a 2-D model, The Cryosphere, 12, 2021–2037, https://doi.org/10.5194/tc-12-2021-2018, 2018.
Braconnot, P., Luan, Y., Brewer, S., and Zheng, W.: Impact of Earth's orbit and freshwater fluxes on Holocene climate mean seasonal cycle and ENSO characteristics, Clim. Dynam., 38, 1081–1092, 2012.
Broccoli, A. J., Dahl, K. A., and Stouffer, R. J.: Response of the ITCZ to Northern Hemisphere cooling, Geophys. Res. Lett., 33, L01702, https://doi.org/10.1029/2005gl024546, 2006.
Buizert, C. and Severinghaus, J. P.: Dispersion in deep polar firn driven by synoptic-scale surface pressure variability, The Cryosphere, 10, 2099–2111, https://doi.org/10.5194/tc-10-2099-2016, 2016.
Buizert, C., Sowers, T., and Blunier, T.: Assessment of diffusive isotopic fractionation in polar firn, and application to ice core trace gas records, Earth Planet. Sc. Lett., 361, 110–119, 2013.
Buizert, C., Cuffey, K. M., Severinghaus, J. P., Baggenstos, D., Fudge, T. J., Steig, E. J., Markle, B. R., Winstrup, M., Rhodes, R. H., Brook, E. J., Sowers, T. A., Clow, G. D., Cheng, H., Edwards, R. L., Sigl, M., McConnell, J. R., and Taylor, K. C.: The WAIS Divide deep ice core WD2014 chronology – Part 1: Methane synchronization (68–31 ka BP) and the gas age–ice age difference, Clim. Past, 11, 153–173, https://doi.org/10.5194/cp-11-153-2015, 2015.
Buizert, C., Sigl, M., Severi, M., Markle, B. R., Wettstein, J. J., McConnell, J. R., Pedro, J. B., Sodemann, H., Goto-Azuma, K., Kawamura, K., Fujita, S., Motoyama, H., Hirabayashi, M., Uemura, R., Stenni, B., Parrenin, F., He, F., Fudge, T. J., and Steig, E. J.: Abrupt ice-age shifts in southern westerly winds and Antarctic climate forced from the north, Nature, 563, 681–685, 2018.
Cai, W., Santoso, A., Wang, G., Yeh, S.-W., An, S.-I., Cobb, K. M., Collins, M., Guilyardi, E., Jin, F.-F., Kug, J.-S., Lengaigne, M., McPhaden, M. J., Takahashi, K., Timmermann, A., Vecchi, G., Watanabe, M., and Wu, L.: ENSO and greenhouse warming, Nat. Clim. Change, 5, 849–859, 2015.
Cane, M. A.: The evolution of El Niño, past and future, Earth Planet. Sc. Lett., 230, 227–240, 2005.
Ceppi, P., Hwang, Y.-T., Liu, X., Frierson, D. M. W., and Hartmann, D. L.: The relationship between the ITCZ and the Southern Hemispheric eddy-driven jet, J. Geophys. Res., 118, 5136–5146, 2013.
Chase, Z., Anderson, R. F., Fleisher, M. Q., and Kubik, P. W.: Accumulation of biogenic and lithogenic material in the Pacific sector of the Southern Ocean during the past 40,000 years, Deep-Sea Res. Pt. II, 50, 799–832, 2003.
Cheng, H., Edwards, R. L., Sinha, A., Spötl, C., Yi, L., Chen, S., Kelly, M., Kathayat, G., Wang, X., Li, X., Kong, X., Wang, Y., Ning, Y., and Zhang, H.: The Asian monsoon over the past 640,000 years and ice age terminations, Nature, 534, 640–646, 2016.
Chiang, J. C. and Friedman, A. R.: Extratropical cooling, interhemispheric thermal gradients, and tropical climate change, Annu. Rev. Earth Planet. Sci., 40, 383–412, 2012.
Chiang, J. C. H. and Bitz, C. M.: Influence of high latitude ice cover on the marine Intertropical Convergence Zone, Clim. Dynam., 25, 477–496, 2005.
Chiang, J. C. H., Lee, S.-Y., Putnam, A. E., and Wang, X.: South Pacific Split Jet, ITCZ shifts, and atmospheric North–South linkages during abrupt climate changes of the last glacial period, Earth Planet. Sc. Lett., 406, 233–246, 2014.
Clement, A. C., Seager, R., and Cane, M. A.: Suppression of El Niño during the Mid-Holocene by changes in the Earth's orbit, Paleoceanography, 15, 731–737, 2000.
Cobb, K. M., Westphal, N., Sayani, H. R., Watson, J. T., Di Lorenzo, E., Cheng, H., Edwards, R. L., and Charles, C. D.: Highly Variable El Niño–Southern Oscillation Throughout the Holocene, Science, 339, 67–70, 2013.
Conroy, J. L., Overpeck, J. T., Cole, J. E., Shanahan, T. M., and Steinitz-Kannan, M.: Holocene changes in eastern tropical Pacific climate inferred from a Galápagos lake sediment record, Quaternary Sci. Rev., 27, 1166–1180, 2008.
Cruz, F. W., Burns, S. J., Karmann, I., Sharp, W. D., Vuille, M., Cardoso, A. O., Ferrari, J. A., Dias, P. L. S., and Viana, O.: Insolation-driven changes in atmospheric circulation over the past 116,000 years in subtropical Brazil, Nature, 434, 63–66, 2005.
Dee, D. P., Uppala, S. M., Simmons, A. J., Berrisford, P., Poli, P., Kobayashi, S., Andrae, U., Balmaseda, M. A., Balsamo, G., Bauer, P., Bechtold, P., Beljaars, A. C. M., van de Berg, L., Bidlot, J., Bormann, N., Delsol, C., Dragani, R., Fuentes, M., Geer, A. J., Haimberger, L., Healy, S. B., Hersbach, H., Hólm, E. V., Isaksen, L., Kållberg, P., Köhler, M., Matricardi, M., McNally, A. P., Monge-Sanz, B. M., Morcrette, J. J., Park, B. K., Peubey, C., de Rosnay, P., Tavolato, C., Thépaut, J. N., and Vitart, F.: The ERA-Interim reanalysis: configuration and performance of the data assimilation system, Q. J. Roy. Meteorol. Soc., 137, 553–597, 2011.
Driscoll, R., Elliot, M., Russon, T., Welsh, K., Yokoyama, Y., and Tudhope, A.: ENSO reconstructions over the past 60 ka using giant clams (Tridacna sp.) from Papua New Guinea, Geophys. Res. Lett., 41, 6819–6825, 2014.
Dykoski, C. A., Edwards, R. L., Cheng, H., Yuan, D. X., Cai, Y. J., Zhang, M. L., Lin, Y. S., Qing, J. M., An, Z. S., and Revenaugh, J.: A high-resolution, absolute-dated Holocene and deglacial Asian monsoon record from Dongge Cave, China, Earth Planet. Sc. Lett., 233, 71–86, 2005.
Emile-Geay, J., Cobb, K. M., Carré, M., Braconnot, P., Leloup, J., Zhou, Y., Harrison, S. P., Corrège, T., McGregor, H. V., Collins, M., Driscoll, R., Elliot, M., Schneider, B., and Tudhope, A.: Links between tropical Pacific seasonal, interannual and orbital variability during the Holocene, Nat. Geosci., 9, 168–173, https://doi.org/10.1038/ngeo2608, 2015.
Etheridge, D. M., Pearman, G. I., and Fraser, P. J.: Changes in tropospheric methane between 1841 and 1978 from a high accumulation-rate Antarctic ice core, Tellus, 44, 282–294, 1992.
Fahnestock, M. A., Scambos, T. A., Shuman, C. A., Arthern, R. J., Winebrenner, D. P., and Kwok, R.: Snow megadune fields on the East Antarctic Plateau: Extreme atmosphere-ice interaction, Geophys. Res. Lett., 27, 3719–3722, 2000.
Fowler, A. M., Boswijk, G., Lorrey, A. M., Gergis, J., Pirie, M., McCloskey, S. P. J., Palmer, J. G., and Wunder, J.: Multi-centennial tree-ring record of ENSO-related activity in New Zealand, Nat. Clim. Change, 2, 172–176, https://doi.org/10.1038/nclimate1374, 2012.
Fujita, S., Okuyama, J., Hori, A., and Hondoh, T.: Metamorphism of stratified firn at Dome Fuji, Antarctica: A mechanism for local insolation modulation of gas transport conditions during bubble close off, J. Geophys. Res., 114, F03023, https://doi.org/10.1029/2008jf001143, 2009.
Gergis, J. L. and Fowler, A. M.: A history of ENSO events since A.D. 1525: implications for future climate change, Climatic Change, 92, 343–387, 2009.
Golledge, N. R., Menviel, L., Carter, L., Fogwill, C. J., England, M. H., Cortese, G., and Levy, R. H.: Antarctic contribution to meltwater pulse 1A from reduced Southern Ocean overturning, Nat. Commun., 5, 5107, https://doi.org/10.1038/ncomms6107, 2014.
Grachev, A. M. and Severinghaus, J. P.: Determining the thermal diffusion factor for in air to aid paleoreconstruction of abrupt climate change, J. Phys. Chem. A, 107, 4636–4642, 2003a.
Grachev, A. M. and Severinghaus, J. P.: Laboratory determination of thermal diffusion constants for N-29(2)/N-28(2) in air at temperatures from −60 to 0 degrees C for reconstruction of magnitudes of abrupt climate changes using the ice core fossil-air paleothermometer, Geochim. Cosmochim. Ac., 67, 345–360, 2003b.
Grootes, P. M., Stuiver, M., White, J. W. C., Johnsen, S., and Jouzel, J.: Comparison of oxygen isotope records from the GISP2 and GRIP Greenland ice cores, Nature, 366, 552–554, 1993.
Headly, M. A. and Severinghaus, J. P.: A method to measure ratios in air bubbles trapped in ice cores and its application in reconstructing past mean ocean temperature, J. Geophys. Res., 112, D19105, https://doi.org/10.1029/2006jd008317, 2007.
Herron, M .M. and Langway, C. C.: Firn densification: An empirical model, J. Glaciol., 25, 373–385, 1980.
Huang, B., Banzon, V. F., Freeman, E., Lawrimore, J., Liu, W., Peterson, T. C., Smith, T. M., Thorne, P. W., Woodruff, S. D., and Zhang, H.-M.: Extended Reconstructed Sea Surface Temperature Version 4 (ERSST.v4). Part I: Upgrades and Intercomparisons, J. Climate, 28, 911–930, 2014.
Huber, C., Beyerle, U., Leuenberger, M., Schwander, J., Kipfer, R., Spahni, R., Severinghaus, J. P., and Weiler, K.: Evidence for molecular size dependent gas fractionation in firn air derived from noble gases, oxygen, and nitrogen measurements, Earth Planet. Sc. Lett., 243, 61–73, 2006.
Ikeda-Fukazawa, T., Fukumizu, K., Kawamura, K., Aoki, S., Nakazawa, T., and Hondoh, T.: Effects of molecular diffusion on trapped gas composition in polar ice cores, Earth Planet. Sc. Lett., 229, 183–192, 2005.
Kanner, L. C., Burns, S. J., Cheng, H., and Edwards, R. L.: High-Latitude Forcing of the South American Summer Monsoon During the Last Glacial, Science, 335, 570–573, 2012.
Kawamura, K., Severinghaus, J. P., Ishidoya, S., Sugawara, S., Hashida, G., Motoyama, H., Fujii, Y., Aoki, S., and Nakazawa, T.: Convective mixing of air in firn at four polar sites, Earth Planet. Sc. Lett., 244, 672–682, 2006.
Kawamura, K., Severinghaus, J. P., Albert, M. R., Courville, Z. R., Fahnestock, M. A., Scambos, T., Shields, E., and Shuman, C. A.: Kinetic fractionation of gases by deep air convection in polar firn, Atmos. Chem. Phys., 13, 11141–11155, https://doi.org/10.5194/acp-13-11141-2013, 2013.
Kobashi, T., Severinghaus, J. P., and Barnola, J. M.: 4±1.5 degrees C abrupt warming 11,270 yr ago identified from trapped air in Greenland ice, Earth Planet. Sc. Lett., 268, 397–407, 2008a.
Kobashi, T., Severinghaus, J. P., and Kawamura, K.: Argon and nitrogen isotopes of trapped air in the GISP2 ice core during the Holocene epoch (0–11,500 B.P.): Methodology and implications for gas loss processes, Geochim. Cosmochim. Ac., 72, 4675–4686, 2008b.
Kohfeld, K. E., Graham, R. M., de Boer, A. M., Sime, L. C., Wolff, E. W., Le Quéré, C., and Bopp, L.: Southern Hemisphere westerly wind changes during the Last Glacial Maximum: paleo-data synthesis, Quaternary Sci. Rev., 68, 76–95, 2013.
Koutavas, A., Lynch-Stieglitz, J., Marchitto, T. M., and Sachs, J.P.: El Niño-Like Pattern in Ice Age Tropical Pacific Sea Surface Temperature, Science, 297, 226–230, 2002.
Koutavas, A., deMenocal, P. B., Olive, G. C., and Lynch-Stieglitz, J.: Mid-Holocene El Ninño–Southern Oscillation (ENSO) attenuation revealed by individual foraminifera in eastern tropical Pacific sediments, Geology, 34, 993–996, 2006.
Lamy, F., Chiang, J. C. H., Martínez-Méndez, G., Thierens, M., Arz, H. W., Bosmans, J., Hebbeln, D., Lambert, F., Lembke-Jene, L., and Stuut, J.-B.: Precession modulation of the South Pacific westerly wind belt over the past million years, P. Natl. Acad. Sci. USA, 116, 23455–23460, https://doi.org/10.1073/pnas.1905847116, 2019.
Lee, S. and Kim, H.-K.: The Dynamical Relationship between Subtropical and Eddy-Driven Jets, J. Atmos. Sci., 60, 1490–1503, 2003.
Lee, S. Y., Chiang, J. C., Matsumoto, K., and Tokos, K. S.: Southern Ocean wind response to North Atlantic cooling and the rise in atmospheric CO2: Modeling perspective and paleoceanographic implications, Paleoceanography, 26, PA1214, https://doi.org/10.1029/2010PA002004, 2011.
Liu, Z., Kutzbach, J., and Wu, L.: Modeling climate shift of El Nino variability in the Holocene, Geophys. Res. Lett., 27, 2265–2268, 2000.
Liu, Z., Lu, Z., Wen, X., Otto-Bliesner, B. L., Timmermann, A., and Cobb, K. M.: Evolution and forcing mechanisms of El Nino over the past 21,000 years, Nature, 515, 550–553, 2014.
Lynch-Stieglitz, J.: The Atlantic Meridional Overturning Circulation and Abrupt Climate Change, Annu. Rev. Mar. Sci., 9, 83–104, 2017.
Mantua, N. J. and Hare, S. R.: The Pacific Decadal Oscillation, J. Oceanogr., 58, 35–44, 2002.
Marcott, S. A., Shakun, J. D., Clark, P. U., and Mix, A. C.: A Reconstruction of Regional and Global Temperature for the Past 11,300 Years, Science, 339, 1198–1201, 2013.
Marino, G., Zahn, R., Ziegler, M., Purcell, C., Knorr, G., Hall, I. R., Ziveri, P., and Elderfield, H.: Agulhas salt-leakage oscillations during abrupt climate changes of the Late Pleistocene, Paleoceanography, 28, 599–606, 2013.
Markle, B. R., Steig, E. J., Buizert, C., Schoenemann, S. W., Bitz, C. M., Fudge, T. J., Pedro, J. B., Ding, Q., Jones, T. R., White, J. W. C., and Sowers, T.: Global atmospheric teleconnections during Dansgaard-Oeschger events, Nat. Geosci., 10, 36–40, 2017.
Marshall, J. and Speer, K.: Closure of the meridional overturning circulation through Southern Ocean upwelling, Nat. Geosci., 5, 171–180, 2012.
McGee, D., Donohoe, A., Marshall, J., and Ferreira, D.: Changes in ITCZ location and cross-equatorial heat transport at the Last Glacial Maximum, Heinrich Stadial 1, and the mid-Holocene, Earth Planet. Sc. Lett., 390, 69–79, 2014.
Merkel, U., Prange, M., and Schulz, M.: ENSO variability and teleconnections during glacial climates, Quaternary Sci. Rev., 29, 86–100, 2010.
Mo, K. C. and Paegle, J. N.: The Pacific–South American modes and their downstream effects, Int. J. Climatol., 21, 1211–1229, 2001.
Morgan, J. D., Buizert, C., Fudge, T. J., Kawamura, K., Severinghaus, J. P., and Trudinger, C. M.: Gas isotope thermometry in the South Pole and Dome Fuji ice cores provides evidence for seasonal rectification of ice core gas records, The Cryosphere, 16, 2947–2966, https://doi.org/10.5194/tc-16-2947-2022, 2022.
Moy, C. M., Seltzer, G. O., Rodbell, D. T., and Anderson, D. M.: Variability of El Niño/Southern Oscillation activity at millennial timescales during the Holocene epoch, Nature, 420, 162–165, https://doi.org/10.1038/nature01194, 2002.
Nakamura, H. and Shimpo, A.: Seasonal Variations in the Southern Hemisphere Storm Tracks and Jet Streams as Revealed in a Reanalysis Dataset, J. Climate, 17, 1828–1844, 2004.
Orsi, A. J., Kawamura, K., Fegyveresi, J. M., Headly, M. A., Alley, R. B., and Severinghaus, J. P.: Differentiating bubble-free layers from melt layers in ice cores using noble gases, J. Glaciol., 61, 585–594, 2015.
Oyabu, I., Kawamura, K., Uchida, T., Fujita, S., Kitamura, K., Hirabayashi, M., Aoki, S., Morimoto, S., Nakazawa, T., Severinghaus, J. P., and Morgan, J. D.: Fractionation of and in the Antarctic ice sheet during bubble formation and bubble–clathrate hydrate transition from precise gas measurements of the Dome Fuji ice core, The Cryosphere, 15, 5529–5555, https://doi.org/10.5194/tc-15-5529-2021, 2021.
Parkinson, C. L. and Cavalieri, D. J.: Antarctic sea ice variability and trends, 1979–2010, The Cryosphere, 6, 871–880, https://doi.org/10.5194/tc-6-871-2012, 2012.
Pedro, J. B., Jochum, M., Buizert, C., He, F., Barker, S., and Rasmussen, S. O.: Beyond the bipolar seesaw: Toward a process understanding of interhemispheric coupling, Quaternary Sci. Rev., 192, 27–46, 2018.
Peterson, L. C., Haug, G. H., Hughen, K. A., and Röhl, U.: Rapid Changes in the Hydrologic Cycle of the Tropical Atlantic During the Last Glacial, Science, 290, 1947–1951, 2000.
Rahmstorf, S.: Ocean circulation and climate during the past 120,000 years, Nature, 419, 207–214, 2002.
Raynaud, D., Lipenkov, V., Lemieux-Dudon, B., Duval, P., Loutre, M. F., and Lhomme, N.: The local insolation signature of air content in Antarctic ice. A new step toward an absolute dating of ice records, Earth Planet. Sc. Lett., 261, 337–349, 2007.
Rein, B., Lückge, A., Reinhardt, L., Sirocko, F., Wolf, A., and Dullo, W.-C.: El Niño variability off Peru during the last 20,000 years, Paleoceanography, 20, PA4003, https://doi.org/10.1029/2004PA001099, 2005.
Rhodes, R. H., Faïn, X., Brook, E. J., McConnell, J. R., Maselli, O. J., Sigl, M., Edwards, J., Buizert, C., Blunier, T., Chappellaz, J., and Freitag, J.: Local artifacts in ice core methane records caused by layered bubble trapping and in situ production: a multi-site investigation, Clim. Past, 12, 1061–1077, https://doi.org/10.5194/cp-12-1061-2016, 2016.
Riedinger, M. A., Steinitz-Kannan, M., Last, W. M., and Brenner, M.: A ∼6100 14C yr record of El Niño activity from the Galápagos Islands, J. Paleolimnol., 27, 1–7, 2002.
Rind, D., Russell, G., Schmidt, G., Sheth, S., Collins, D., Demenocal, P., and Teller, J.: Effects of glacial meltwater in the GISS coupled atmosphere-ocean model: 2. A bipolar seesaw in Atlantic Deep Water production, J. Geophys. Res.-Atmos., 106, 27355–27365, 2001.
Rojas, M., Moreno, P., Kageyama, M., Crucifix, M., Hewitt, C., Abe-Ouchi, A., Ohgaito, R., Brady, E. C., and Hope, P.: The Southern Westerlies during the last glacial maximum in PMIP2 simulations, Clim. Dynam., 32, 525–548, 2009.
Rommelaere, V., Arnaud, L., and Barnola, J. M.: Reconstructing recent atmospheric trace gas concentrations from polar firn and bubbly ice data by inverse methods, J. Geophys. Res., 102, 30069–30083, 1997.
Russell, J. L., Dixon, K. W., Gnanadesikan, A., Stouffer, R. J., and Toggweiler, J. R.: The Southern Hemisphere Westerlies in a Warming World: Propping Open the Door to the Deep Ocean, J. Climate, 19, 6382–6390, 2006.
Sadekov, A. Y., Ganeshram, R., Pichevin, L., Berdin, R., McClymont, E., Elderfield, H., and Tudhope, A. W.: Palaeoclimate reconstructions reveal a strong link between El Niño-Southern Oscillation and Tropical Pacific mean state, Nat. Commun., 4, 2692, https://doi.org/10.1038/ncomms3692, 2013.
Salau, O., Schneider, B., Park, W., Khon, V., and Latif, M.: Modeling the ENSO impact of orbitally induced mean state climate changes, J. Geophys. Res., 117, C05043, https://doi.org/10.1029/2011JC007742, 2012.
Schaller, C. F., Freitag, J., and Eisen, O.: Critical porosity of gas enclosure in polar firn independent of climate, Clim. Past, 13, 1685–1693, https://doi.org/10.5194/cp-13-1685-2017, 2017.
Schneider, T., Bischoff, T., and Haug, G. H.: Migrations and dynamics of the intertropical convergence zone, Nature, 513, 45–53, 2014.
Schwander, J.: The transformation of snow to ice and the occlusion of gases in: The Environmental record in glaciers and ice sheets, edited by: Oescher, H. and Langway, C. C., John Wiley, New York, 53–67, ISBN 0471921858, 1989.
Schwander, J., Stauffer, B., and Sigg, A.: Air mixing in firn and the age of the air at pore close-off, Ann. Glaciol., 10, 141–145, https://doi.org/10.3189/S0260305500004328, 1988.
Schwander, J., Barnola, J. M., Andrie, C., Leuenberger, M., Ludin, A., Raynaud, D., and Stauffer, B.: The age of the air in hte firn and the ice at Summit, Greenland, J. Geophys. Res., 98, 2831–2838, 1993.
Severinghaus, J. P. and Battle, M. O.: Fractionation of gases in polar ice during bubble close-off: New constraints from firn air Ne, Kr and Xe observations, Earth Planet. Sc. Lett., 244, 474–500, 2006.
Severinghaus, J. P., Sowers, T., Brook, E. J., Alley, R. B., and Bender, M. L.: Timing of abrupt climate change at the end of the Younger Dryas interval from thermally fractionated gases in polar ice, Nature, 391, 141–146, 1998.
Severinghaus, J. P., Grachev, A., Luz, B., and Caillon, N.: A method for precise measurement of argon and krypton argon ratios in trapped air in polar ice with applications to past firn thickness and abrupt climate change in Greenland and at Siple Dome, Antarctica, Geochim. Cosmochim. Ac., 67, 325–343, 2003.
Severinghaus, J. P., Beaudette, R., Headly, M. A., Taylor, K., and Brook, E. J.: Oxygen-18 of O2 Records the Impact of Abrupt Climate Change on the Terrestrial Biosphere, Science, 324, 1431–1434, 2009.
Severinghaus, J. P., Albert, M. R., Courville, Z. R., Fahnestock, M. A., Kawamura, K., Montzka, S. A., Muhle, J., Scambos, T. A., Shields, E., Shuman, C. A., Suwa, M., Tans, P., and Weiss, R. F.: Deep air convection in the firn at a zero-accumulation site, central Antarctica, Earth Planet. Sc. Lett., 293, 359–367, 2010.
Shakun, J. D., Clark, P. U., He, F., Marcott, S. A., Mix, A. C., Liu, Z., Otto-Bliesner, B., Schmittner, A., and Bard, E.: Global warming preceded by increasing carbon dioxide concentrations during the last deglaciation, Nature, 484, 49–54, 2012.
Sime, L. C., Kohfeld, K. E., Le Quéré, C., Wolff, E. W., de Boer, A. M., Graham, R. M., and Bopp, L.: Southern Hemisphere westerly wind changes during the Last Glacial Maximum: model-data comparison, Quaternary Sci. Rev., 64, 104–120, 2013.
Simpson, I. R., Hitchcock, P., Shepherd, T. G., and Scinocca, J. F.: Stratospheric variability and tropospheric annular-mode timescales, Geophys. Res. Lett., 38, L20806, https://doi.org/10.1029/2011GL049304, 2011.
Sowers, T., Bender, M., Raynaud, D., and Korotkevich, Y. S.: δ15N of N2 in air trapped in polar ice: A tracer of gas transport in the firn and a possible constraint on ice age-gas age differences, J. Geophys. Res., 97, 15683–15697, 1992.
Stott, L., Poulsen, C., Lund, S., and Thunell, R.: Super ENSO and Global Climate Oscillations at Millennial Time Scales, Science, 297, 222–226, 2002.
Studer, A. S., Sigman, D. M., Martínez-García, A., Benz, V., Winckler, G., Kuhn, G., Esper, O., Lamy, F., Jaccard, S. L., Wacker, L., Oleynik, S., Gersonde, R., and Haug, G. H.: Antarctic Zone nutrient conditions during the last two glacial cycles, Paleoceanography, 30, 845–862, 2015.
Studer, A. S., Sigman, D. M., Martínez-García, A., Thöle, L. M., Michel, E., Jaccard, S. L., Lippold, J. A., Mazaud, A., Wang, X. T., Robinson, L. F., Adkins, J. F., and Haug, G. H.: Increased nutrient supply to the Southern Ocean during the Holocene and its implications for the pre-industrial atmospheric CO2 rise, Nat. Geosci., 11, 756–760, 2018.
Thomas, E. R., Marshall, G. J., and McConnell, J. R.: A doubling in snow accumulation in the western Antarctic Peninsula since 1850, Geophys. Res. Lett., 35, L01706, https://doi.org/10.1029/2007GL032529, 2008.
Thompson, D. W. J. and Wallace, J. M.: Annular Modes in the Extratropical Circulation. Part I: Month-to-Month Variability, J. Climate, 13, 1000–1016, 2000.
Thompson, L. G., Mosley-Thompson, E., Davis, M. E., Zagorodnov, V. S., Howat, I. M., Mikhalenko, V. N., and Lin, P.-N.: Annually Resolved Ice Core Records of Tropical Climate Variability over the Past ∼1800 Years, Science, 340, 945–950, 2013.
Timmermann, A., Okumura, Y., An, S. I., Clement, A., Dong, B., Guilyardi, E., Hu, A., Jungclaus, J. H., Renold, M., Stocker, T. F., Stouffer, R. J., Sutton, R., Xie, S. P., and Yin, J.: The Influence of a Weakening of the Atlantic Meridional Overturning Circulation on ENSO, J. Climate, 20, 4899–4919, 2007.
Toggweiler, J. R., Russell, J. L., and Carson, S. R.: Midlatitude westerlies, atmospheric CO2, and climate change during the ice ages, Paleoceanography, 21, PA2005, https://doi.org/10.1029/2005PA001154, 2006.
Trenberth, K. E.: Storm Tracks in the Southern Hemisphere, J. Atmos. Sci., 48, 2159–2178, 1991.
Tudhope, A. W., Chilcott, C. P., McCulloch, M. T., Cook, E. R., Chappell, J., Ellam, R. M., Lea, D. W., Lough, J. M., and Shimmield, G. B.: Variability in the El Niño-Southern Oscillation through a glacial-interglacial cycle, Science, 291, 1511–1517, 2001.
USAP-DC – US Antarctic Program Data Center: Collaborative research: Kr-86 as a proxy for barometric pressure variability and movement of the SH westerlies during the last deglaciation, USAP-DC [data set], https://www.usap-dc.org/view/project/p0010037, last access: 7 March 2023.
Wang, X., Auler, A. S., Edwards, R. L., Cheng, H., Ito, E., Wang, Y., Kong, X., and Solheid, M.: Millennial-scale precipitation changes in southern Brazil over the past 90,000 years, Geophys. Res. Lett., 34, L23701, https://doi.org/10.1029/2007GL031149, 2007.
Wang, Y. J., Cheng, H., Edwards, R. L., An, Z. S., Wu, J. Y., Shen, C. C., and Dorale, J. A.: A High-Resolution Absolute-Dated Late Pleistocene Monsoon Record from Hulu Cave, China, Science, 294, 2345–2348, 2001.
Zheng, W., Braconnot, P., Guilyardi, E., Merkel, U., and Yu, Y.: ENSO at 6 ka and 21 ka from ocean–atmosphere coupled model simulations, Clim. Dynam., 30, 745–762, 2008.
- Abstract
- Introduction
- Methods
- Calibrating Kr-86 excess
- Present-day controls on Kr-86 excess in Antarctica
- Barometric variability in West Antarctica during the last deglaciation
- Conclusions
- Appendix A: Data corrections
- Appendix B: Sub-annual 86Krxs variations at DE08-OH
- Data availability
- Author contributions
- Competing interests
- Disclaimer
- Special issue statement
- Acknowledgements
- Financial support
- Review statement
- References