the Creative Commons Attribution 4.0 License.
the Creative Commons Attribution 4.0 License.
 | 27 Feb 2023
On the importance of moisture conveyor belts from the tropical eastern Pacific for wetter conditions in the Atacama Desert during the mid-Pliocene
Mark Reyers
Patrick Ludwig
Christoph Böhm
Volker Wennrich
Yaping Shao
Geomorphic and sedimentologic data indicate that the climate of today's hyper-arid Atacama Desert (northern Chile) was more humid during the mid-Pliocene to Late Pliocene. The processes, however, leading to increased rainfall in this period are largely unknown. To uncover these processes we use both global and regional kilometre-scale model experiments for the mid-Pliocene (3.2 Ma). We found that the PMIP4–CMIP6 (Paleoclimate Modelling Intercomparison Project–Coupled Model Intercomparison Project) model CESM2 (Community Earth System Model 2) and the regional model WRF (Weather Research and Forecasting) used in our study simulate more rainfall in the Atacama Desert for the mid-Pliocene in accordance with proxy data, mainly due to stronger extreme rainfall events in winter. Case studies reveal that these extreme winter rainfall events during the mid-Pliocene are associated with strong moisture conveyor belts (MCBs) originating in the tropical eastern Pacific. For present-day conditions, in contrast, our simulations suggest that the moisture fluxes rather arise from the subtropical Pacific region and are much weaker. A clustering approach reveals systematic differences between the moisture fluxes in the present-day and mid-Pliocene climates, both in strength and origins. The two mid-Pliocene clusters representing tropical MCBs and occurring less than 1 d annually on average produce more rainfall in the hyper-arid core of the Atacama Desert south of 20∘ S than what is simulated for the entire present-day period. We thus conclude that MCBs are mainly responsible for enhanced rainfall during the mid-Pliocene. There is also a strong sea-surface temperature (SST) increase in the tropical eastern Pacific and along the Atacama coast for the mid-Pliocene. It suggests that a warmer ocean in combination with stronger mid-tropospheric troughs is beneficial for the development of MCBs leading to more extreme rainfall in a +3 ∘C warmer world like in the mid-Pliocene.
- Article
(2180 KB) - Full-text XML
-
Supplement
(1101 KB) - BibTeX
- EndNote


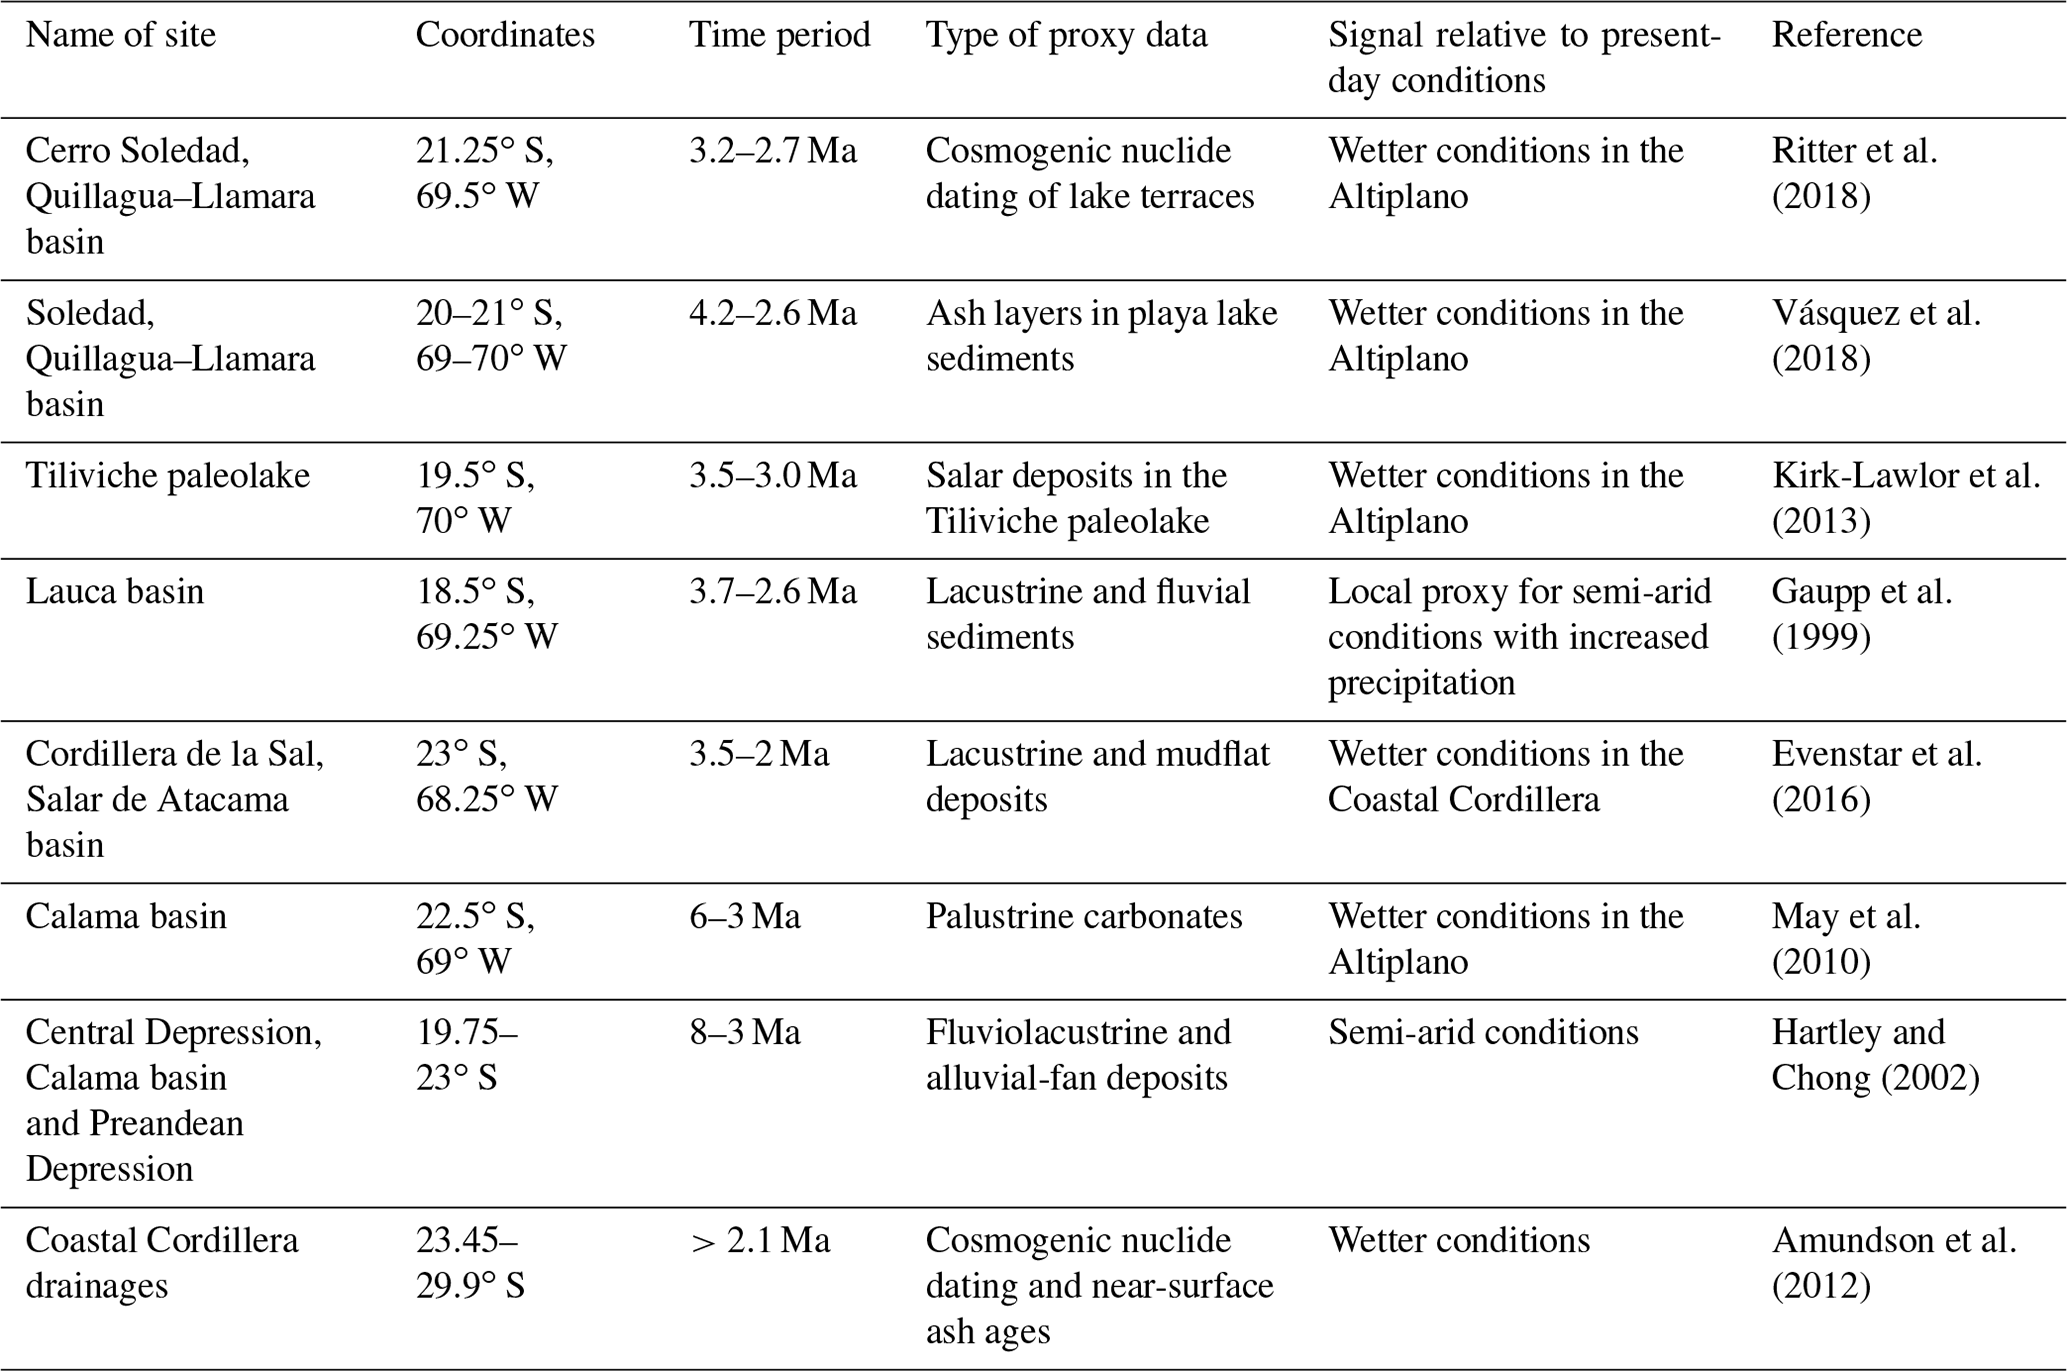
The Atacama Desert in northern Chile (19–26∘ S) is considered to be one of the driest deserts on Earth, with a mean annual rainfall of only a few millimetres in the hyper-arid core and along the Coastal Cordillera (e.g. Houston, 2006; Reyers et al., 2021). Due to its special geographic position, the aridity in the Atacama Desert is long-lasting, with its onset likely dating back to the Oligocene (ca. 33.9–23 Ma), thus making it also one of the oldest deserts (e.g. Dunai et al., 2005; Evenstar et al., 2017). Paleoclimate records and geomorphic studies from various sites of the Atacama Desert, however, indicate variations in the overall aridity over time, which was repeatedly punctuated by more humid phases on millennial and orbital timescales (Ritter et al., 2019; Diederich et al., 2020). Based on geomorphic and sedimentologic data, Amundson et al. (2012) and Hartley and Chong (2002) postulated that nowadays dominantly hyper-arid conditions commenced during the Late Pliocene (ca. 3–2 Ma). This shift to overall hyper-aridity postdates a period of more humid or even semi-arid conditions in the Atacama Desert during the mid-Pliocene to Late Pliocene, which is illustrated in the widespread occurrence of lake, salar and fluvial deposits in many parts of the desert (e.g. Gaupp et al., 1999; Kirk-Lawlor et al., 2013; Jordan et al., 2014; Evenstar et al., 2016; Ritter et al., 2018; Vásquez et al., 2018). While such proxy records provide a reliable picture of the timing and magnitude of past pluvial phases, the mechanisms controlling these climate shifts and in particular the involved atmospheric processes are hard to derive from them and are thus not well understood. Intervals of increased rainfall in the southern Atacama Desert are mostly attributed to a northward displacement of mid-latitudinal westerlies and accompanied extratropical winter cyclones (Vuille and Ammann, 1997; Stuut and Lamy, 2004; Bartz et al., 2020), which suggest a southwestern moisture source. Past rainfall variations in the northern Atacama Desert and the Andes have been linked to latitudinal shifts of the extratropical westerlies in the Southern Hemisphere (Amidon et al., 2017). For the warmer mid-Pliocene climate, the multi-model mean of the PlioMIP2 (Pliocene Model Intercomparison Project) models for instance indicates that the Hadley cell was shifted northward and the Walker circulation was shifted westward (e.g. Han et al., 2021). Also, cutoff lows as seen in March 2015 have been proposed as a possible mechanism for wetter conditions in the past (Jordan et al., 2019). Wetter conditions during the warm Pliocene are furthermore attributed to a mean state more similar to today's El Niño conditions, and according to this the onset of the hyper-aridity concurrently occurred with the change to the present-day El Niño–Southern Oscillation (ENSO) variability (Amundson et al., 2012). Hartley and Chong (2002) concluded that the shift from semi-arid to hyper-arid conditions in the Atacama Desert was controlled by global cooling rather than by local factors, like the cold Humboldt Current.
Another perspective on potential drivers for wetter paleoclimate episodes can be inferred from the mechanisms involved in the March 2015 extreme rainfall event that caused severe damage in the Atacama Desert. The event was associated with a mid-tropospheric cutoff low and anomalously warm tropical sea-surface temperatures (SSTs) along the Atacama coast, paired with transport of large amounts of water vapour from the tropical eastern Pacific to the Atacama Desert at the foreside of the low-pressure system (Bozkurt et al., 2016). Based on the characteristic isotopic composition of rainwater (e.g. Herrera and Custodio, 2014) from the March 2015 event, Jordan et al. (2019) proposed that the processes involved in this event might also play an important role in increased paleoclimate rainfall in the Atacama Desert.
Böhm et al. (2021, hereafter B2021) systematically investigated moisture conveyor belts (MCBs) in the Atacama Desert for the present-day climate that also occurred during the March 2015 event. MCBs are elongated bands of strong poleward water vapour fluxes in the free troposphere (e.g. Knippertz and Martin, 2007), which often originate in tropical latitudes and occur in connection with troughs or cutoff lows. Based on different datasets for the recent past, B2021 indicate that moisture transport associated with MCBs is decoupled from the maritime boundary layer. Despite their rareness of about four regional MCBs per year which make landfall in the Atacama Desert, MCBs produce 40 %–80 % of the total rainfall in the hyper-arid core and along the Coastal Cordillera for modern climate conditions (B2021).
The aim of the present study is to assess to what extent MCBs act as drivers of rainfall activity in the Atacama Desert on geological timescales, specifically during the relatively wet and warm mid-Pliocene period. If MCBs played an important role in that period, this would imply that in addition to the previously suggested regions southwest or east of the Atacama Desert (Stuut and Lamy, 2017; Bartz et al., 2020; Amidon et al., 2017) also the tropical southeastern Pacific northwest of the desert could be a potential moisture source for increased humidity in the mid-Pliocene, like assessments of the regional rainfall under present-day climate suggest (Bozkurt et al., 2016; Jordan et al., 2019; Böhm et al., 2021). However, the past and present constellations of the global atmospheric and oceanic circulations are substantially different. The Atacama Desert is characterized by a complex topography, including a steep coastal cliff and the western slopes of the Andes, as shown in Fig. 1. As a consequence, strong rainfall gradients occur, in particular in the west-to-east direction (Houston, 2006; Reyers et al., 2021). Due to the rather coarse horizontal resolution of global climate models, the kilometre-scale changes in the orography and rainfall patterns cannot be adequately simulated by design (e.g. Ludwig et al., 2019; Fiedler et al., 2020). We therefore perform kilometre-scale simulations for a limited-area domain over the Atacama Desert for the mid-Pliocene at around 3.2 Ma. Section 2 gives an overview of the datasets and methods used in our study. Section 3 consists of two subsections, where we present large-scale and regional paleoclimate changes as obtained by global and downscaled PMIP4–CMIP6 (Paleoclimate Modelling Intercomparison Project–Coupled Model Intercomparison Project) models (Sect. 3.1) and a potential key driver for the detected rainfall changes (Sect. 3.2). A summary and discussion close this paper (Sect. 4).
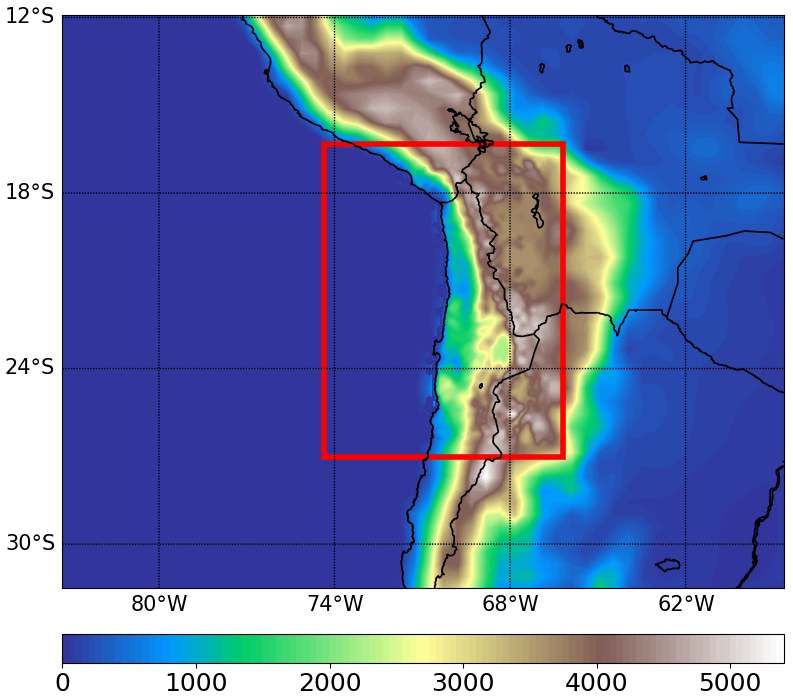
Figure 1Map showing the outer (50 km×50 km resolution) and inner WRF model domain (red box, 10 km×10 km resolution) and the topographic heights (shading, in m).
2.1 Model simulations
We use global climate model (GCM) output from the fourth phase of the Paleoclimate Modelling Intercomparison Project, which is endorsed by the sixth phase of the Coupled Model Intercomparison Project (PMIP4–CMIP6; Kageyama et al., 2018). Here, we examine the output of a mid-Pliocene warm-period experiment (3.2 Ma), as part of the Pliocene Model Intercomparison Project Phase 2 (PlioMIP2; Haywood et al., 2016). In the PlioMIP2 simulations, the CO2 concentration is set to 400 ppm, while other greenhouse-gas concentrations and the orbital parameters are as for the pre-industrial period (1850) to be consistent with the setup of PlioMIP2 experiments. Paleoenvironmental reconstructions from the Pliocene Research, Interpretation and Synoptic Mapping project Phase 4 (PRISM4) are used as paleogeography boundary conditions, e.g. topography, bathymetry, ice sheets and vegetation cover. A significant feature of these reconstructions is the strong reduction of the Greenland and Antarctic ice sheets compared to today. Dowsett et al. (2016) describes PRISM4 in detail.
From PlioMIP2 we select simulations from the Community Earth System Model 2 (CESM2) of the National Center for Atmospheric Research (NCAR) (Danabasoglu et al., 2020) for our study. This choice has been made based on the availability of boundary data and the validation results of GCMs participating in PlioMIP2 assessed previously (e.g. Feng et al., 2020; Pontes et al., 2020; Han et al., 2021). In addition to CESM2, two other PlioMIP2–CMIP6 models are analysed, namely IPSL-CM6A-LR (Boucher et al., 2018) from the Institut Pierre-Simon Laplace and GISS-E2.1-G (Bauer et al., 2020) from NASA. Only for these models are the historical and the mid-Pliocene experiment available. Our PlioMIP2 intercomparison for the Atacama Desert revealed the following:
- i.
CESM2 reproduces the increased rainfall for the Atacama region compared to the present day in accordance with proxy data (Sect. 3.1).
- ii.
CESM2 shows an expected SST increase for the mid-Pliocene, which qualitatively agrees with reconstructions (Sect. 3.1).
This makes the CESM2 output the most useful amongst the three GCMs from PlioMIP2 to perform the high-resolution simulations for the Atacama Desert.
For the atmosphere CESM2 has a horizontal resolution of in the longitudinal and latitudinal direction, respectively. The horizontal resolution of the ocean is constant in the zonal direction (1.125∘) and varies from 0.27 to 0.64∘ in the meridional direction. We select a 30-year period in the mid-Pliocene experiment of CESM2 that includes a strong ENSO and rainfall variability (model years 231–260) to represent internal variability. To quantify changes relative to the present day, we further use a 30-year time slice of the CMIP6 historical experiment (years 1985–2014) of CESM2.
The output of CESM2 is used as initialization and boundary data for simulations with the Weather Research and Forecasting model version 3.9 (WRF; Skamarock et al., 2008). The lateral boundary fields are 6-hourly updated. We yield a horizontal resolution of 10 km×10 km via a double one-way nesting, with the first nesting from to 50 km×50 km and the second nesting from 50 km×50 km to 10 km×10 km. The outer and inner model domains for our WRF simulations are depicted in Fig. 1. For our analysis we use the output of both nesting steps (i.e. WRF simulations with 50 and 10 km, respectively).
Reyers et al. (2021) demonstrate that the WRF model reproduces present-day rainfall in the Atacama Desert when driven with reanalysis data, despite the complexity of the terrain. We therefore use the same model setup in terms of the physical parameterizations for this study on the mid-Pliocene climate. The WRF simulation uses prescribed time-varying SSTs from CESM2 that are updated every 24 h. The same 30-year mid-Pliocene (mP) and historical (hist) periods as used for the analysis of the global CESM2 model are simulated with WRF (hereafter WRFmP and WRFhist). For the WRFmP simulation the greenhouse-gas concentrations and the orbital parameters are prescribed as in the global PlioMIP2 simulations (see above). Paleorecords reveal that the land cover strongly changed during the Pliocene on global scales, but a reconstruction for South America is difficult due to the sparse data coverage (Dowsett et al., 2016). As a consequence, reconstructed land cover for the Atacama Desert is implausible. To avoid uncertainties arising from artefacts in reconstructed land-cover changes and for a better comparability of our WRF simulations, we therefore prescribe the same present-day vegetation mask in all WRF simulations. For an additional evaluation of the WRF simulations for the Atacama Desert, rainfall of WRFhist is compared to the present-day validation simulation with WRF from Reyers et al. (2021), which was driven by ERA-Interim reanalysis data (WRFera).
2.2 Analysis strategy
For the assessment of the dynamical processes involved in rainfall in the Atacama Desert we first quantify atmospheric moisture fluxes from the WRF simulations. This is done by computing the integrated water vapour flux (IWVF), which consists of a zonal (IWVFu) and a meridional (IWVFv) component:
where q is the specific humidity, z is the height, and u and v are the zonal and the meridional wind components, respectively. B2021 demonstrate that MCBs are associated with elevated moisture transport decoupled from the maritime boundary layer. To take this into account we compute IWVF for low levels between 0 and 2000 m above ground level (a.g.l.) and for upper levels above 2000 m a.g.l. separately.
For the classification of MCBs in our study area, we apply machine learning techniques to the IWVF over the offshore region of western central South America. Due to the rareness of MCBs in the Atacama Desert for the present-day climate (B2021), we choose a method that can detect outliers. This is a combination of self-organizing maps (SOMs, Kohonen, 2001) and k-means clustering (e.g. Hartigan and Wong, 1979). This combined method has already been applied successfully in climate research (e.g. Ohba et al., 2016). SOMs are a machine learning technique often used for pattern recognition. In this technique, high-dimensional data are projected onto a visually interpretable two-dimensional grid by mapping similar input vectors close to each other. As input vectors we use 12-hourly IWVF patterns as diagnosed from our WRF simulations. IWVF values below a certain threshold are set to zero before the SOM clustering. This threshold-based methodology is inspired by approaches which are used to identify low-level atmospheric rivers (e.g. Rutz et al., 2014) and ensures that aside from the strength of the MCBs also information about their shape is provided for the clustering. For WRFhist an IWVF threshold of 250 is chosen. Due to the fact that during the warmer mid-Pliocene the atmosphere is generally moister, the threshold for WRFmP is set to a higher value of 350 . Sensitivity tests indicate that slight differences in the thresholds yield similar results from the clustering, although the choice of these threshold values is somewhat arbitrary. The input vectors are projected on a 7×7 grid SOM, thus resulting in 49 IWVF classes. To further reduce these data, the 49 IWVF classes are processed via k-means clustering, which is an iterative algorithm that obtains an optimal partition of the input data (here, the 49 IWVF classes from the SOM) into k clusters. The algorithm computes so-called cluster centroids, and an optimal solution is found when the squared distances between the cluster members and their respective cluster centroids are minimized. The resulting cluster centroids represent the final clusters. For a better comparability, we aim for the same number of final clusters for WRFhist and WRFmP. Nine final clusters are optimal, since the squared distances between the centroids converge towards a minimum value for more than nine clusters for both WRFhist and WRFmP. Note that the order of clusters is arbitrary.
For the identification of mid-tropospheric troughs off the Atacama coast we adopt the automated identification of Knippertz (2004). A grid point P is defined as a trough point, where the west-to-east gradient in the 500 hPa geopotential height exceeds a threshold of 25 gpm (geopotential metres) per 10∘. Here, we apply the detection algorithm to the CESM2 data instead of the regionally limited WRF output since a larger spatial coverage is needed for identifying synoptic-scale troughs. The 500 hPa geopotential height is interpolated to a regular horizontal grid first. The interpolation is done for consistency with the coarse reanalysis data used in the original development of the detection algorithm.
3.1 Mid-Pliocene against present-day climate
The Pliocene is considered to be the most recent period in Earth history with globally sustained temperatures higher by several degrees Celsius and thus a potential analogue for the conditions projected by CMIP6 scenarios for the future. During the stable mid-Pliocene period between 3.264 and 3.025 Ma the global annual mean temperature is, based on climate models, assumed to be up to more than 3 ∘C warmer than the present day (Haywood et al., 2013; Haywood and Valdes, 2014). The model results are supported by proxy data indicating a global SST anomaly for the mid-Pliocene vs. pre-industrial levels of 2.3 and 3.2–3.4 ∘C based on foraminifera and alkenones or alkenones only, respectively (McClymont et al., 2020). Specifically in the upwelling regions at the Peruvian margin, Dekens et al. (2007) reconstructed a Pliocene–modern SST change of 2.9 ∘C. Figure 2a shows the mean annual near-surface air temperature changes for the mid-Pliocene against the present day (historical experiment) from CESM2. A strong polar amplification is visible over Antarctica, with mid-Pliocene temperatures being partly more than 10 ∘C warmer than for present-day conditions. A particular strong warming is also revealed in the tropical eastern Pacific and along the western coast of South America, which is associated with changes in the SST in the tropical eastern Pacific and in the upwelling zone off the Chilean coast. Here, the SST is simulated to be up to 5 ∘C warmer during the mid-Pliocene (Fig. 2b). This SST difference pattern qualitatively agrees with the PRISM reconstructions for this area (Dowsett et al., 2013; see their Fig. 5). A strong precipitation increase is found for the Altiplano region, where mean annual rainfall in the mid-Pliocene is up to 400 mm higher than in the historical experiment (Fig. 2c). More rainfall is also simulated for the Atacama Desert. These results for more rainfall are broadly consistent with proxy records for the wetter conditions in the mid-Pliocene compared to present-day conditions in the region, as listed in Table 1.
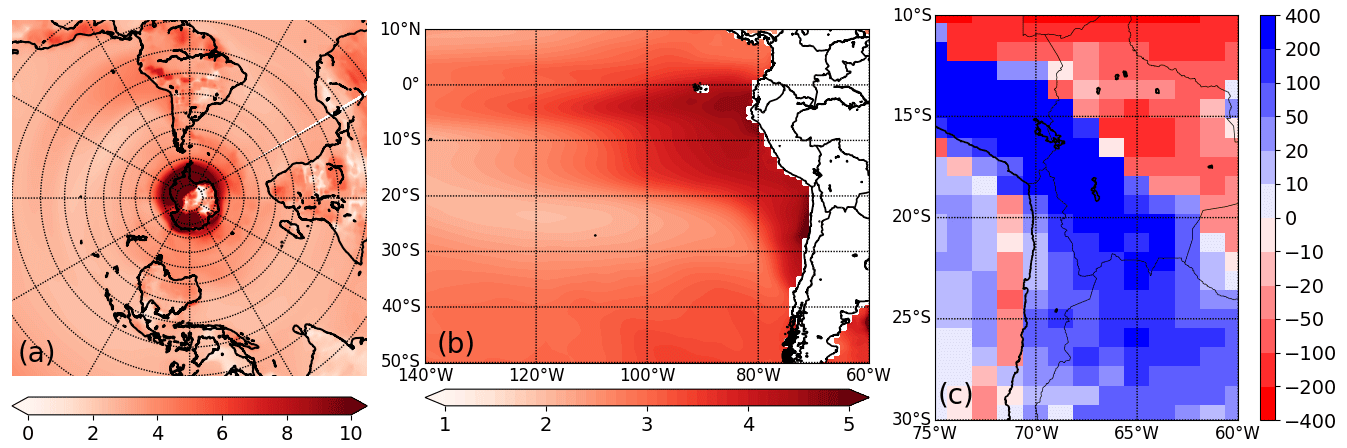
Figure 2Changes (mid-Pliocene minus historical) for mean annual (a) near-surface air temperature (at 2 m above ground in ∘C), (b) sea-surface temperature (in ∘C) and (c) rainfall (in mm yr−1) as simulated by the global CESM2 model.
Table 1Proxy data for wetter conditions in the region of the Atacama Desert that fall into the mid-Pliocene.
In contrast, IPSL-CM6A-LR and GISS-E2.1-G simulate drier conditions in the Atacama Desert for the mid-Pliocene compared to the present day (see Figs. S1c and S2c in the Supplement). Both models also exhibit a strong polar amplification like CESM2, but the warming in the Southern Hemisphere mid-latitudes and tropics is much weaker when compared to CESM2 (Figs. S1a and S2a). In particular the atmospheric and surface temperature increase in the tropical eastern Pacific and off the Atacama coast is less pronounced in these two models (Figs. S1a and b and S2a and b) compared to CESM2. Hence, amongst the three available PlioMIP2 models the CESM2 model has the best agreement with proxy data regarding both SST and rainfall in the study area.
We evaluated the rainfall from WRFhist against a WRF simulation that downscales the ERA5 reanalysis for the same domain and spatial resolution (WRFera). There are quantitative differences in rainfall, but the aridity is overall satisfyingly reproduced by the WRF simulation that used data from the historical simulation of CESM2 at the lateral boundaries (WRFhist). Specifically, the spatial patterns and the seasonal cycle of rainfall are qualitatively captured by WRFhist (compare Fig. 3f–j with Fig. 3a–e). Both WRFera and WRFhist show the present-day hyper-aridity in the Atacama Desert, with mean annual rainfall of less than 2 mm yr−1 north of 22∘ S. Rainfall slightly increases towards the south, but a particular strong west-to-east gradient related to the topographic characteristics of the region is visible in the northeastern part of the model domain. The rainfall at the western slopes of the Andes is strongest in summer (DJF, December–January–February), whereas strongest rainfall in the hyper-arid core of the Atacama Desert is simulated for winter (JJA, June–July–August). Annual and seasonal rainfall amounts tend to be regionally overestimated by WRFhist against WRFera, but the hyper-aridity with only a few millimetres of rainfall per year is well simulated (Fig. 3f–j). We therefore conclude that the WRF simulations using CESM2 as boundary conditions are suitable for our research interest.
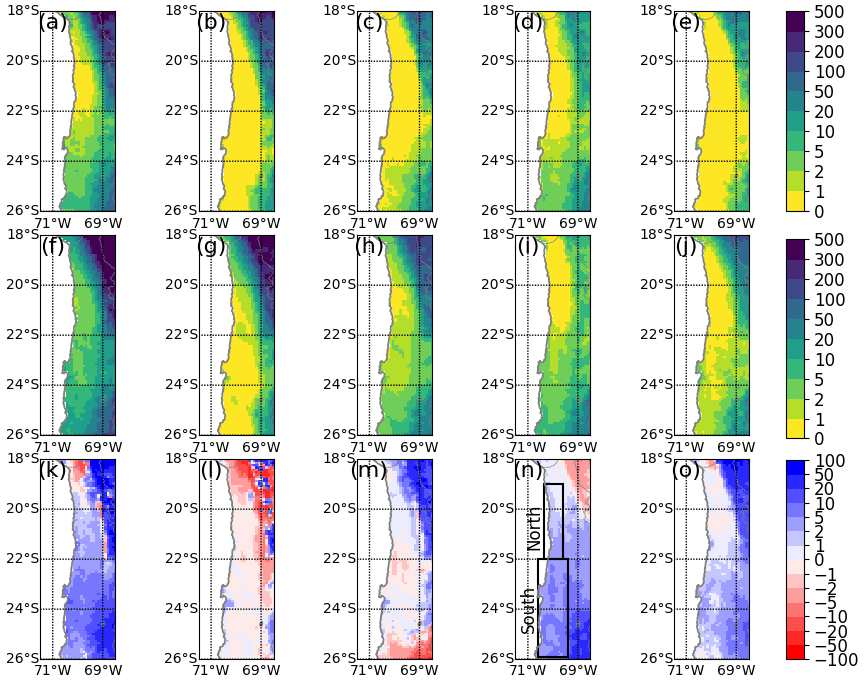
Figure 3Present-day mean annual and seasonal rainfall as simulated by (a–e) WRFera and (f–j) WRFhist and (k–o) mid-Pliocene changes (WRFmP minus WRFhist) in the mean annual and seasonal rainfall. Values for (a, f, k) the whole year, (b, g, l) DJF (December–January–February), (c, h, m) MAM (March–April–May), (d, i, n) JJA (June–July–August) and (f, j, o) SON (September–October–November). All results are shown for the simulations with 10 km resolution, and values are given in millimetres per year and millimetres per season, respectively.
For the mid-Pliocene (WRFmP, Fig. 3k), our simulations yield more humid conditions, with nearly a doubling in the annual rainfall for most parts of the desert south of 20∘ S compared to WRFhist (compare Fig. 3k and f). This mid-Pliocene rainfall increase in the hyper-arid core of the Atacama Desert is mainly due to more winter rainfall (June–August, Fig. 3n). We therefore focus on this season in the remainder of our study and first test the two following hypotheses:
- i.
The intensity of rain days is similar in both periods, but there are more rain days in WRFmP compared to WRFhist.
- ii.
Individual rain days are more intensive in WRFmP than in WRFhist.
The seasonal cycle of rainfall shifts from winter-dominated in the south to summer-dominated in the north of the Atacama Desert (Houston, 2006; Reyers et al., 2021). In order to account for these differences, we split the hyper-arid core into a northern and southern region (see black boxes in Fig. 3n), which has also been done similarly in previous studies (e.g. Böhm et al., 2020). To quantify the cause of the winter rainfall increase (see Fig. 3n), we compute the spatial means of daily rainfall over these two regions. Then we rank the spatially averaged daily rainfall amounts according to their magnitude and display the results in percentile–percentile plots for the mid-Pliocene against the present-day simulation (Fig. 4). For both the northern and the southern boxes, there is no increase in the number of rainfall events in WRFmP when compared to WRFhist, and appreciable rainfall amounts are rare in both simulations. Instead, rain days at the upper end of the distribution are stronger during the mid-Pliocene. For example, for the northern (southern) box daily rainfall is approx. 12 mm (55 mm) per grid point on average for the strongest event in WRFmP but only 5 mm (21 mm) for the strongest event in WRFhist. Hence, our simulations suggest that the more humid conditions during the mid-Pliocene is due to rain days with more intense rainfall events by a factor of about 2, not due to more rain days.

Figure 4Percentile–percentile plots for daily winter rainfall (in mm d−1) in WRFmP (y axis; midPlio) against WRFhist (x axis; HIST) as spatial means over (a) the northern box and (b) the southern box, as marked in Fig. 3n.
3.2 Potential drivers for stronger rainfall events in the mid-Pliocene
We assess physical processes, potentially driving the stronger winter rainfall events in the mid-Pliocene. To that end, we conduct several case studies of days with strong winter rainfall events in the northern and southern Atacama Desert (see black boxes in Fig. 3n). Figure 5 shows the rainfall patterns of exemplary top winter rainfall events as simulated by WRFmP. It turned out that 5 out of the top 10 rain days in the northern box are also among the top days in the southern box. As an example, two of these events are displayed in Fig. 5a and b. The events are associated with elongated bands of strong upper-level IWVF (above 2000 m a.g.l.), which have the typical properties of MCBs, as identified in B2021 for present-day conditions. Further, the MCBs originate in the tropical eastern Pacific region and transport moisture along the coastal offshore region towards the Atacama Desert. Strong rainfall events which are restricted to the northern Atacama Desert are in some cases associated with relatively weaker MCBs but with a similar spatial pattern with a northwestern-to-southeastern moisture flux (Fig. 5c and d). A rather zonally oriented moisture flux is found for one top rainfall events which is restricted to the southern Atacama Desert (Fig. 5e). The majority of the southern events, however, also coincide with strong northwesterly MCBs with an origin in the tropical eastern Pacific, e.g. shown in Fig. 5f. These results indicate that for both the southern and northern Atacama Desert, MCBs and thus the same physical processes are responsible for the wetter conditions in the mid-Pliocene. In contrast, upper-level IWVFs during or prior to the top 10 events in WRFhist are weaker (Fig. 6). Additionally, the IWVF patterns associated with the WRFhist events more often show a rather zonal orientation and thus originate from the subtropical Pacific (Fig. 6b, d, e and f).
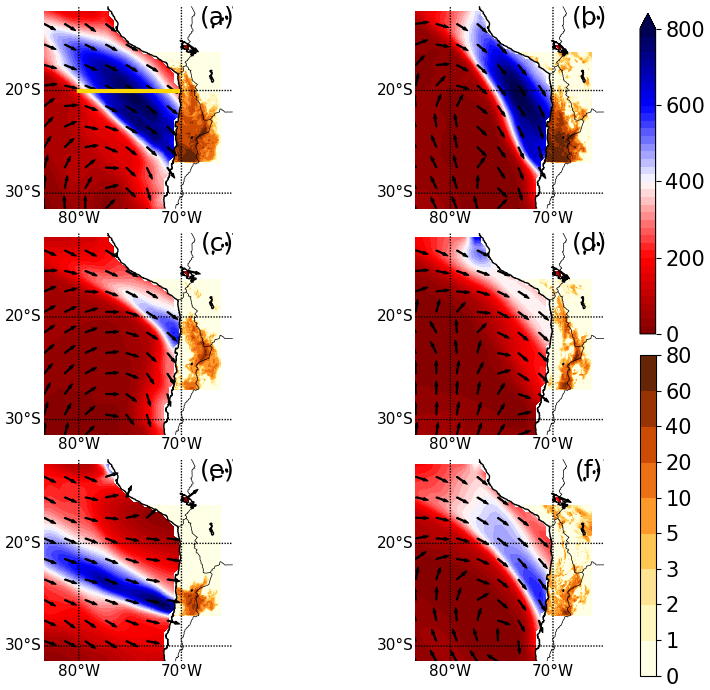
Figure 5Daily rainfall over land (green–blue shading, in mm d−1) during top winter events in WRFmP (obtained for the inner model domain with 10 km resolution) and the maximum upper-level IWVF (above 2000 m a.g.l.) over ocean (arrows and red–blue shading, in ) on the day of or the day prior to the rainfall event (obtained from the outer model domain with 50 km resolution). (a, b) Events which are among the top events of both the northern and southern Atacama Desert. (c, d) Events which are only among the top events of the northern Atacama Desert. (e, f) Events which are only among the top events of the southern Atacama Desert.
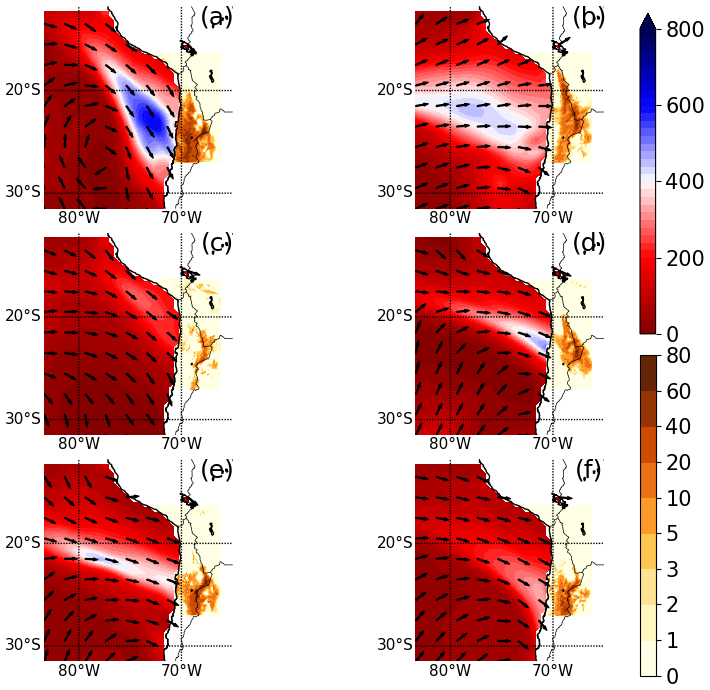
Figure 6As Fig. 5 but for the top winter events in WRFhist.
Interestingly, low-level IWVF (below 2000 m a.g.l.) is negligible during all northern and southern top rainfall events in both WRFmP and WRFhist (Figs. S3 and S4 in the Supplement), consistent with present-day cases (B2021). Upper-level moisture transport via MCBs into the study area is therefore largely decoupled from the maritime boundary layer in both present-day and mid-Pliocene conditions.
The MCBs identified in the case studies for WRFmP often have a northwestern-to-southeastern orientation (Fig. 5a, b, d and f) and are therefore associated with a southward moisture transport from the tropics. Figure 7 shows the probability density function of 12-hourly southward upper-level IWV mass fluxes integrated between 80 and 70∘ W along the 20∘ S transect (see yellow line in Fig. 5a) in WRFmP and WRFhist. The extremely strong southward mass fluxes are more frequent in WRFmP than in WRFhist (inset in Fig. 7). For example, moisture mass fluxes of approx. 400×106 kg s−1 occur more than 15 times in 30 Southern Hemisphere winters of WRFmP but are rare in WRFhist. Additionally, fluxes of more than 600×106 kg s−1 lacking in WRFhist regularly occur in WRFmP. These findings indicate that there are cases in WRFmP when the large moisture reservoir over the tropical eastern Pacific is tapped via MCBs, advecting moist air to the Atacama Desert.
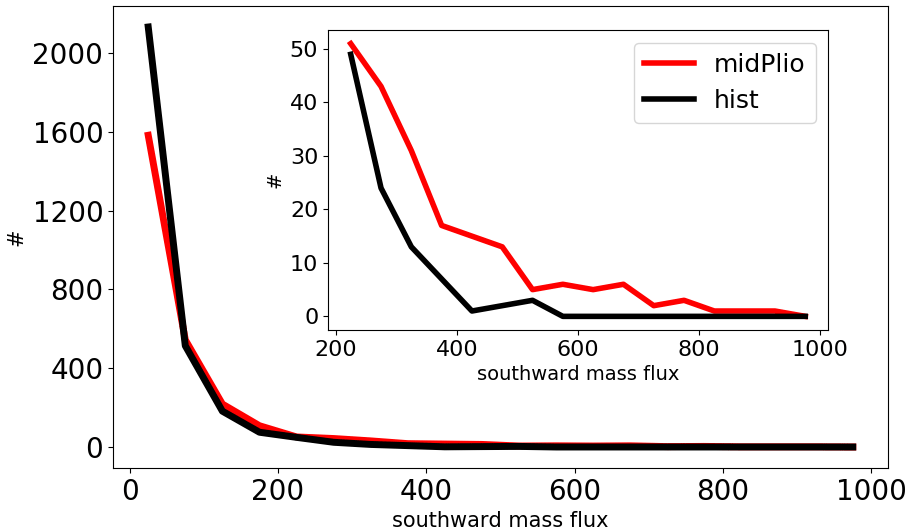
Figure 7Probability density function (y axis, in total number of dates) of 12-hourly southward upper-level (above 2000 m a.g.l.) IWV mass fluxes (x axis, in 106 kg s−1) integrated between 80 and 70∘ W at 20∘ S (see yellow line in Fig. 5a) in WRFmP and WRFhist (outer model domain with 50 km resolution) for Southern Hemisphere winter. The inset zooms into the results above 200×106 kg s−1.
The case studies (Figs. 5 and 6) illustrate the key role of MCBs in increased rainfall in the mid-Pliocene. The question arises as to what extent the characteristics of the MCBs during the mid-Pliocene were systematically different from those under present-day conditions. We perform an objective clustering of upper-level wintertime IWVF (Sect. 2.2) to quantify potential differences. The nine final IWVF clusters for WRFmP are displayed in Fig. 8. The cluster with the highest frequency of occurrence is cluster 8, which represents cases without MCBs and occurs for 79 d per winter on average. Instead, this cluster includes days with easterly IWVF, which in some cases is associated with deep convection over the Altiplano plateau (Reyers et al., 2021). Consequently, a high rainfall amount in the northeastern part of the study area is found for this cluster. Cluster 1, 2, 5, 7 and 9 include more zonally oriented IWVF with landfall in central or southern Chile with origins further towards the south of the Pacific, e.g. when compared to cluster 4. Also cluster 3 is associated with moisture advection from regions south of 20∘ S but includes also some transport from further north with an axis more tilted towards meridional directions compared to cluster 1, 2, 5, 7 and 9. These clusters with dominant moisture advection from regions south of 20∘ S play a minor role in winter rainfall in the Atacama Desert (see red–blue shading in Fig. 8). In contrast, IWVF cluster 4 and 6, which occur approximately every second winter in WRFmP, produce the largest rain amount during winter in the hyper-arid core of the Atacama Desert. These IWVF clusters represent strong MCBs originating in the tropical eastern Pacific region, which make landfall at the coastal region of the Atacama Desert. In WRFhist, the moisture fluxes in the IWVF cluster are generally weaker than in WRFmP (Fig. 9). As for WRFmP, the more zonally oriented IWVF clusters with landfall south of 25∘ S are associated with only a little rainfall (cluster 1, 4, 6, 7, 8 in Fig. 9). The most crucial IWVF clusters for winter rainfall in WRFhist are cluster 9 and in particular cluster 3, which represent northwesterly MCBs. This is in agreement with the findings of B2021, suggesting that the moistest MCBs in the recent climate have their origin in the northwest (see Fig. 7 in B2021). However, compared to the MCBs of WRFmP (Fig. 8), the MCBs in WRFhist (in Fig. 9) have much lower IWVF and can have different transport characteristics, e.g. indicated by wind maxima that are shifted towards the south and east. Take, for instance, the lower IWVF and different wind pattern in cluster 4 (6) for WRFmP in Fig. 8 against cluster 9 (3) for WRFhist in Fig. 9. The strengthening of the northwesterly MCBs in WRFmP might suggest that the wind speeds associated with these MCBs are higher in the mid-Pliocene leading to rainfall on land, but this is not visible in the output. We computed the composite of mean wind speeds for each of the MCB clusters associated with rain in the desert. The resulting composite of wind speeds in the clusters is marked for a typical moisture transport height of 4000 m a.s.l. in Figs. 8 and 9. Interestingly, the mean wind speeds in the two clusters in WRFmP have a similar magnitude like in WRFhist. However, the region with peak winds is shifted to the northwest in WRFmP. We therefore conclude that the MCBs during the mid-Pliocene that lead to rain in the Atacama Desert are not only stronger but also in some cases have origins and characteristics that are different from those that occur under present-day conditions.

Figure 8Final mid-Pliocene wintertime IWVF clusters (yellow–green shading, in ) as obtained by the combined SOM and k-means clustering for WRFmP (outer model domain with 50 km resolution). The numbers in the red boxes are the frequencies of occurrence of the individual cluster (in days per Southern Hemisphere winter). Red–blue shading shows the fraction (in %) of the rainfall associated with the individual clusters to the total winter rainfall (inner model domain with 10 km resolution). The black contours in cluster 4 and 6 show the composite mean wind speeds at 4000 m a.s.l. (15, 17 and 19 m s−1). Note that we show IWVF exceeding 350 in accordance with the definition of MCBs for the mid-Pliocene (see “Data and methods”).
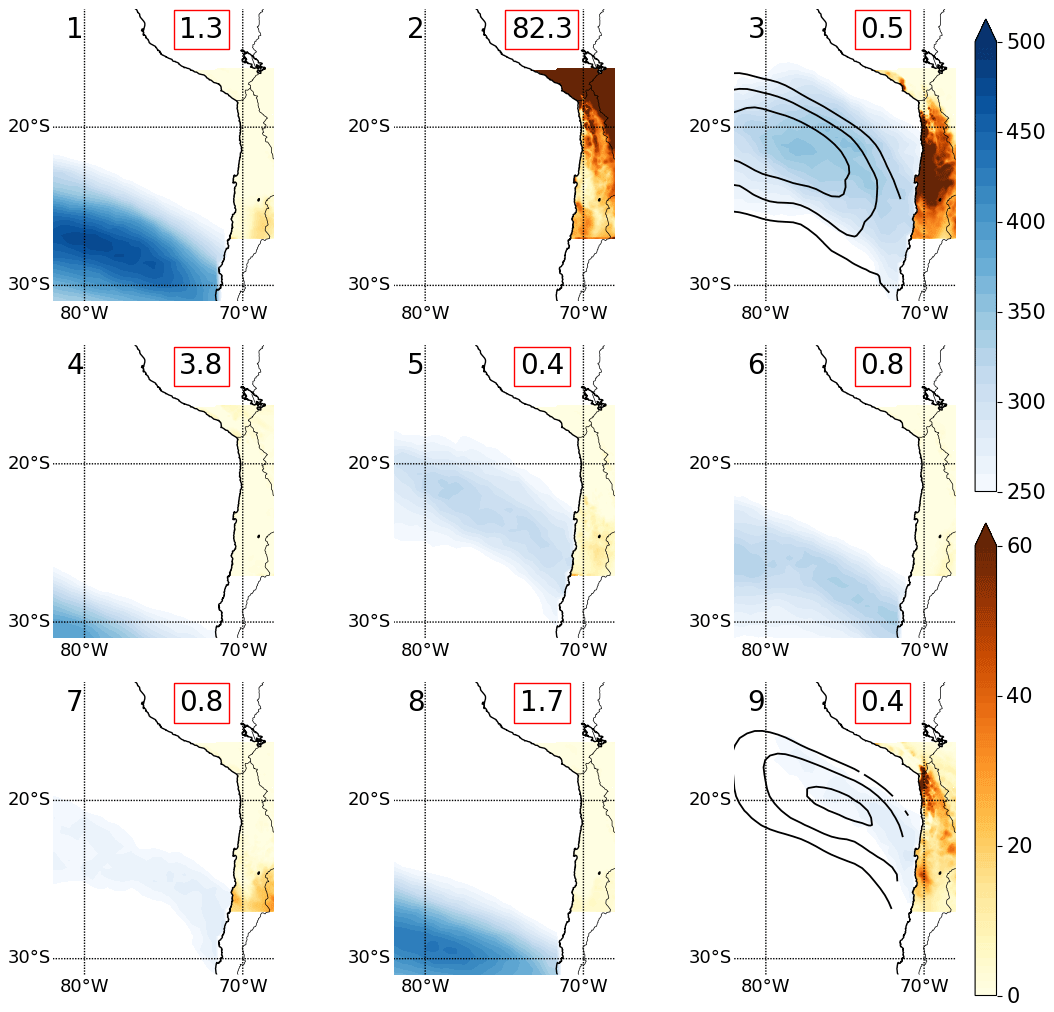
Figure 9As Fig. 8 but for WRFhist. The black contours in cluster 3 and 9 show the composite mean wind speed at 4000 m a.s.l. (15, 17 and 19 m s−1).
Despite their rare occurrence, MCB cluster 4 and 6 of WRFmP (Fig. 8) are associated with a relatively large amount of rainfall. In most parts of the Atacama Desert more than 60 % of the total winter rainfall in WRFmP is associated with only these two MCB clusters, and for some regions north of 22∘ S the fraction is even close to 100 % (Fig. 10a). Further, in the hyper-arid core south of 20∘ S the mid-Pliocene winter rainfall produced by these two clusters is more than 60 % of the total annual rainfall (Fig. 10b), and it even clearly exceeds the total annual rainfall in WRFhist (Fig. 10c). This indicates that MCBs originating in the tropical eastern Pacific are indeed a key driver for the more humid conditions in the Atacama Desert during the mid-Pliocene.
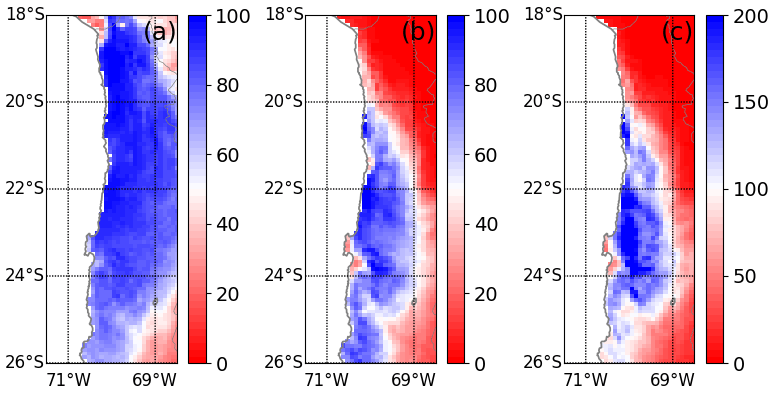
Figure 10Fraction (in %) of the rainfall associated with MCB cluster 4 and 6 of WRFmP to (a) total winter rainfall in WRFmP, (b) total annual rainfall in WRFmP and (c) total annual rainfall in WRFhist (inner model domain with 10 km resolution).
The strength of MCBs is determined by both the winds and the atmospheric moisture content. The former is controlled by pressure gradients. We see that MCBs in the mid-Pliocene appear at the foreside of mid-tropospheric troughs over the subtropical southeastern Pacific. This is also the case for the regional MCBs for present-day conditions (B2021). Interestingly, the frequency of occurrence of troughs in the region is less during the mid-Pliocene compared to present day (Fig. 11a). Thermodynamic and dynamical changes in PlioMIP2 models lead to wetter tropics, particularly in the tropical eastern Pacific (Han et al., 2021). Furthermore, the subtropical anticyclones over the southern Pacific intensified and expanded further to the west in PlioMIP2 (Pontes et al., 2020). The change in the synoptic-scale circulation is a potential reason for the lower frequency of troughs reaching the subtropical Pacific offshore the Atacama Desert (Fig. 11a). Fewer troughs in the warmer past are consistent with findings for future global warming; e.g. Priestley and Catto (2022) found that the Southern Hemisphere extratropical storm track density decreases under future warming based on CMIP6. However, the troughs that occur extraordinarily close to the Equator (at or north of 20∘ S) are stronger in the mid-Pliocene, measured by the mean pressure gradients (Fig. 11b), which implies an intensification and northward shift of the flow at their northern flank. This finding is consistent with wind composites we show for the northwesterly MCB clusters (Figs. 8 and 9).
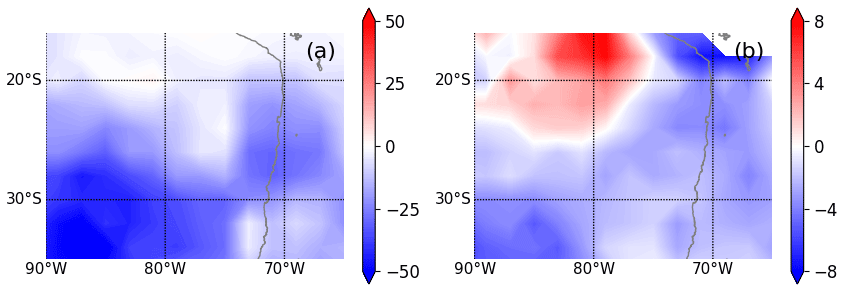
Figure 11CESM2 mid-Pliocene minus CESM2 historical for (a) number of trough points (in number per decade) and (b) mean trough point strength (in gpm).
The atmospheric moisture content is influenced by the SST. In a sensitivity study, Bozkurt et al. (2016) show that a hypothetical reduction in the SST in the tropical eastern Pacific during the March 2015 rainfall event, which occurred during anomalously high SST, significantly decreases the precipitable water along the Peruvian and Chilean coast and the rainfall amount in the Atacama Desert. We therefore assess the role of the SST in the development of MCBs originating over the tropical eastern Pacific. To this end, we computed SST composites for all days within MCB cluster 4 and 6 of WRFmP. For those days, the SST composite is up to 1.2 ∘C warmer than the median of the winter SST for the entire mid-Pliocene period (Fig. 12a). Over the equatorial and tropical eastern Pacific, the SST composite even exceeds the 70th winter SST percentile (Fig. 12b). As shown in Fig. 2b, this corresponds to the region with the strongest SST increase in the mid-Pliocene. Hence, this mid-Pliocene SST increase in combination with the stronger upper-level troughs (Fig. 11b) is a plausible scenario to explain why exceptionally strong MCBs, as identified in cluster 4 and 6 in WRFmP, occur in the mid-Pliocene but are not seen during present-day conditions (WRFhist). Our results support the finding that higher SSTs lead to stronger rainfall in the Atacama Desert, broadly consistent with the March 2015 case studied by Bozkurt et al. (2016).
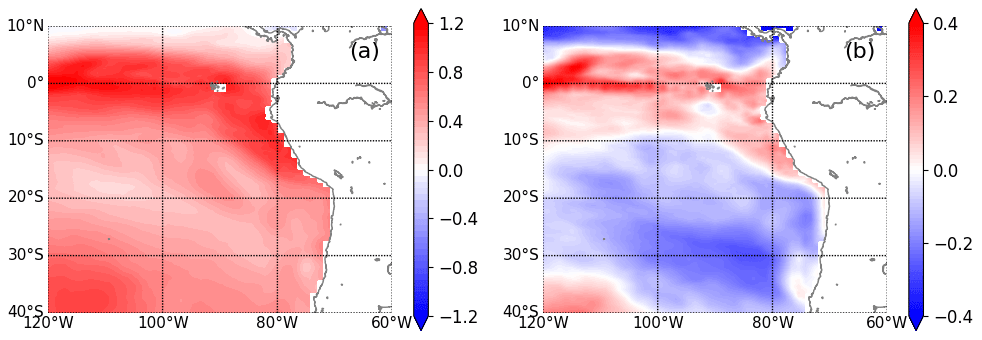
Figure 12SST composite mean over all days with MCB cluster 4 and 6 minus the (a) 50th percentile of winter SST and (b) 70th percentile of winter SST in the mid-Pliocene experiment of CESM2.
These results indicate that stronger troughs and warmer SSTs during the mid-Pliocene favour the formation of strong MCBs. It is not clear, however, how MCBs in the Atacama region develop in detail. For the southwestern United States, Knippertz and Martin (2007) attributed the formation of an MCB to a baroclinic zone and a strong subtropical jet at the foreside of a cutoff, as well as to strong convection in the Intertropical Convergence Zone (ITCZ). Although plausible, this explanation may not necessarily be applicable for MCBs in the southeastern Pacific. For the Atacama Desert under present-day conditions, B2021 traced the air in the strongest MCBs back to the Amazon basin. Their backward trajectories hardly indicate any moisture enrichment when passing the Pacific (see Fig. 4d of B2021), and consequently they conclude that the associated moisture most likely originates from the continental Amazon basin. Interestingly, the isotopic analysis of the collected rainwater in coastal regions from the March 2015 event indicates a tropical Pacific origin for the water (Jordan et al., 2019). While B2021 did not specifically address this particular event, they show tropical and subtropical Pacific origins for cases that are weaker in terms of humidity along the identified trajectories. The uncertainty in identifying the most representative target location and time for the trajectory calculation may cause stronger events to appear weaker.
We analysed global PMIP4–CMIP6 model simulations and performed regional kilometre-scale experiments to assess drivers for the increased rainfall amounts in the Atacama Desert during the warm mid-Pliocene as reported from geological evidence. Our model results suggest that the enhanced rainfall during the mid-Pliocene can be primarily explained by increased winter rainfall. Focussing on this season, we find evidence that the main drivers of the increased rainfall are moisture conveyor belts (MCBs) advecting moisture from the tropical eastern Pacific to the Atacama Desert. This conclusion is based on the following findings:
- i.
More humid conditions in the mid-Pliocene experiment are caused by stronger rainfall events that can be twice as strong compared to the present day. The frequency of occurrence of rainfall events remains nearly unchanged.
- ii.
The top mid-Pliocene rainfall events are often associated with strong elongated upper-level moisture fluxes. These share the typical characteristics of MCBs with an origin in the tropical eastern Pacific advecting moist air to the Atacama Desert.
- iii.
A clustering reveals that MCBs in the mid-Pliocene are stronger and show distinct differences in the exact origin and pathways compared to those for the present day. The two mid-Pliocene clusters for MCBs suggest that the tropical eastern Pacific is the moisture source, in contrast to present-day simulations (historical experiment) for which these northwesterly MCBs are much weaker and their origin is further to the southwest.
- iv.
The rainfall associated with the northwesterly MCBs can be up to 100 % of the regional mid-Pliocene winter rainfall and more than 60 % of the annual rainfall in the mid-Pliocene. Further, these rain amounts exceed the total annual rainfall in the present-day climate in some regions south of 20∘ S.
We find that only the PMIP4–CMIP6 model CESM2 simulates increased rainfall in the Atacama region for the mid-Pliocene experiment, while the other models (IPSL-CM6A-LR, GISS-E2.1-G) simulate decreased rainfall. Simultaneously, CESM2 is the only model that realistically captures the sea-surface warming in the tropical and eastern Pacific. In the other GCMs the temperature increase in the mid-Pliocene is underestimated when compared to proxy data. However, it remains unclear whether the discrepancies in the simulated rainfall change patterns are caused by differences in the sea-surface temperature (SST). There is no clear improvement in tropical rainfall in tandem with reduced biases in SSTs in CMIP models (Fiedler et al., 2020). We cannot rule out that the representation of atmospheric circulation and clouds (Bony et al., 2015) contributes to differences in rainfall changes in the CMIP6 models.
Our regional evaluation is interesting in the context of the relatively high climate sensitivity of CESM2 (Gettelman et al., 2019), which might be seen as an outlier in a larger ensemble of CMIP6 simulations for other time periods (Burls and Sagoo, 2022). It was proposed to use paleosimulations as a test bed for climate model performance to constrain climate sensitivity (Burls and Sagoo, 2022; Zhu et al., 2022). Our results suggest that paleosimulations paired with regional downscaling to the kilometre scale might also be useful for better understanding and predicting regional climate changes with global warming, e.g. for the hydrological cycle that remains an outstanding challenge for global models with parameterized convection. If our mid-Pliocene simulation is a useful out-of-sample test, the fact that CESM2 outperforms other models with lower climate sensitivity for the mid-Pliocene climate in the region of the Atacama Desert would support high climate sensitivity. It would be valuable to have data from more global model simulations for the Pliocene or other warm climates for similar downscaling experiments in future research, especially from CMIP6 models with high climate sensitivity. This endeavour also requires further development of proxy data for paleoclimates, of which there are still a limited number for the Pliocene.
To the best of our knowledge this is the first time that a PMIP4 mid-Pliocene experiment has been downscaled with a regional climate model. We think that the unique datasets give new insights into the processes that are crucial for the mid-Pliocene climate in the Atacama Desert as an analogy for a future warmer world and are valuable for the interpretation of paleoclimate proxies in the region, e.g. for understanding physical processes leading to different MCBs. One interesting aspect for future research could stem from a detailed analysis of processes involved in some of the top mid-Pliocene rainfall events to gain a better understanding of the development of MCBs in the 3 ∘C warmer world of the mid-Pliocene and to put it into the context of the El Niño–Southern Oscillation (ENSO). Solman and Menendez (2001) state that El Niño events result in an equatorward shift of the winter storm track over the subtropical Pacific. Our results suggest that anomalously high SSTs might be beneficial for the formation of MCBs from the tropical Pacific. This implies that a Pliocene mean state more similar to today's El Niño conditions, like that seen in some studies (e.g. Wara et al., 2005), may indeed contribute to wetter conditions in a warmer world via the processes identified in our study. However, the El Niño-like state of the Pliocene is subject to discussion (e.g. Fedorov et al., 2006; Watanabe et al., 2011; Oldeman et al., 2021), and hence the role of ENSO is not yet fully understood. Atmospheric rivers are not unlike MCBs and are more strongly changing in the northern Pacific than in the southern Pacific between the mid-Pliocene and pre-industrial times (Menemenlis et al., 2021), which suggests that a dynamical assessment with high spatial resolutions for the mid-Pliocene would also be interesting in other regions.
Furthermore, our findings have implications for rainfall extremes in a potential future 3 ∘C warmer world, since the mid-Pliocene experiment is regarded as a potential analogue to what might be expected for the future. As such, our work suggests that regional rainfall extremes exceeding historic observations might occur. Such events involve atmospheric dynamics that are similar but not identical to what we know from the recent past.
The code for the regional climate model WRF is available online. The code to compute trough points can be inferred from Knippertz (2004). The code for the machine learning algorithms for SOMs and k-means clustering is based on Python libraries. Further information on codes used in this study is documented on Zenodo (https://doi.org/10.5281/zenodo.7607397; Fiedler and Reyers, 2023).
Rainfall for the Atacama Desert simulated with WRF using ERA-Interim as boundary conditions is freely available in the CRC1211 database (https://doi.org/10.5880/CRC1211DB.20; Reyers, 2019). Primary data for this article are available on Zenodo (https://doi.org/10.5281/zenodo.7607397; Fiedler and Reyers, 2023).
The supplement related to this article is available online at: https://doi.org/10.5194/cp-19-517-2023-supplement.
MR is the main author and led the analysis, conceptualization and writing. SF contributed to the conceptualization and writing, led the revision of the manuscript, and obtained the computing resources from the DKRZ (Deutsches Klimarechenzentrum). PL contributed to the pre-processing of the CESM2 data, WRF simulations and writing. CB contributed to the analysis of the MCBs, conceptualization and writing. VW reviewed and interpreted the literature about mid-Pliocene proxy data and contributed to the writing. YS contributed to the conceptualization and writing. SF and YS acquired funding and managed the project.
The contact author has declared that none of the authors has any competing interests.
Publisher's note: Copernicus Publications remains neutral with regard to jurisdictional claims in published maps and institutional affiliations.
This work used resources of the Deutsches Klimarechenzentrum (DKRZ, Hamburg) granted by its Scientific Steering Committee (WLA; project ID bb1198). We gratefully acknowledge Gary Strand from NCAR for providing CESM2 data as boundary conditions for WRF.
This research has been supported by the Deutsche Forschungsgemeinschaft (grant no. 268236062).
This paper was edited by Claudio Latorre and reviewed by Teresa Jordan and one anonymous referee.
Amidon, W. H., Fisher, G. B., Burbank, D. W., Ciccioli, P. L., Alonso, R. N., Gorin, A. L., Silverhart, P. H., Kylander-Clark, A. R. C., and Christoffersen, M. S.: Mio-Pliocene aridity in the south-central Andes associated with Southern Hemisphere cold periods, P. Natl. Acad. Sci. USA, 114, 6474–6479, https://doi.org/10.1073/pnas.1700327114, 2017.
Amundson, R., Dietrich, W., Bellugi, D., Ewing, S., Nishiizumi, K., Chong, G., Owen, J., Finkel, R., Heimsath, A., Stewart, B., and Caffee, M.: Geomorphologic evidence for the late Pliocene onset of hyperaridity in the Atacama Desert, Geol. Soc. Am. Bull., 124, 1048–1070, https://doi.org/10.1130/B30445.1, 2012.
Bartz, M., Walk, J., Binnie, S. A., Brill, D., Stauch, G., Lehmkuhl, F., Hoffmeister, D., and Brückner, H.: Late Pleistocene alluvial fan evolution along the coastal Atacama Desert (N Chile), Global Planet. Change, 190, 10309, https://doi.org/10.1016/j.gloplacha.2019.103091, 2020.
Bauer, S. E., Tsigaridis, K., Faluvegi, G., Kelley, M., Lo, K. K., Miller, R. L., Nazarenko, L., Schmidt, G. A., and Wu, J.: Historical (1850–2014) aerosol evolution and role on climate forcing using the GISS ModelE2.1 contribution to CMIP6, J. Adv. Model. Earth Sy., 12, e2019MS001978, https://doi.org/10.1029/2019MS001978, 2020.
Böhm, C., Reyers, M., Herbert, S., and Crewell, S.: Water vapor variability in the Atacama Desert during the 20th century, Global Planet. Change, 190, 103192, https://doi.org/10.1016/j.gloplacha.2020.103192, 2020.
Böhm, C., Reyers, M., Knarr, L., and Crewell, S.: The role of moisture conveyor belts for precipitation in the Atacama Desert, Geophys. Res. Lett., 48, e2021GL094372, https://doi.org/10.1029/2021GL094372, 2021.
Bony, S., Stevens, B., Frierson, D. M. W., Jakob, C., Kageyama, M., Pincus, R., Shepherd, T. G., Sherwood, S. C., Siebesma, A. P., Sobel, A. H., Watanabe, M., and Webb, M. J.: Clouds, circulation and climate sensitivity, Nat. Geosci., 8, 261–268, https://doi.org/10.1038/ngeo2398, 2015.
Boucher, O., Denvil, S., Levavasseur, G., Cozic, A., Caubel, A., Foujols, M. A., Meurdesoif, Y., Cadule, P., Devilliers, M., Ghattas, J., Lebas, N., Lurton, T., Mellul, L., Musat, I., Mignot, J., and Cheruy, F.: IPSL IPSL-CM6A-LR model output prepared for CMIP6, CMIP, Version 20180803, Earth System Grid Federation, https://doi.org/10.22033/ESGF/CMIP6.1534, 2018.
Bozkurt, D., Rondanelli, R., Garreaud, R., and Arriagada, A.: Impact of Warmer Eastern Tropical Pacific SST on the March 2015 Atacama Floods, Mon. Weather Rev., 144, 4441–4460, https://doi.org/10.1175/MWR-D-16-0041.1, 2016.
Burls, N. and Sagoo, N.: Increasingly sophisticated climate models need the out-of-sample tests paleoclimates provide, J. Adv. Model. Earth Sy., 14, e2022MS003389, https://doi.org/10.1029/2022MS003389, 2022.
Danabasoglu, G., Lamarque, J. F., Bacmeister, J., Bailey, D. A., DuVivier, A. K., Edwards, J., Emmons, L. K., Fasullo, J., Garcia, R., Gettelman, A., Hannay, C., Holland, M. M., Large, W. G., Lauritzen, P. H., Lawrence, D. M., Lenaerts, J. T. M., Lindsay, K., Lipscomb, W. H., Mills, M. J., Neale, R., Oleson, K. W., Otto-Bliesner, B., Phillips, A. S., Sacks, W., Tilmes, S., van Kampenhout, L., Vertenstein, M., Bertini, A., Dennis, J., Deser, C., Fischer, C., Fox-Kemper, B., Kay, J. E., Kinnison, D., Kushner, P. J., Larson, V. E., Long, M. C., Mickelson, S., Moore, J. K., Nienhouse, E., Polvani, L., Rasch, P. J., and Strand, W. G.: The Community Earth System Model Version 2 (CESM2), J. Adv. Model. Earth Sy., 12, e2019MS001916, https://doi.org/10.1029/2019MS001916, 2020.
Dekens, P. S., Ravelo, A. C., and McCarthy, M. D.: Warm upwelling regions in the Pliocene warm period, Paleoceanography, 22, PA3211, https://doi.org/10.1029/2006PA001394, 2007.
Diederich, J. L., Wennrich, V., Bao, R., Büttner, C., Bolten, A., Brill, D., Campos, E., Fernández-Galego, E., Gödickmeier, P., Ninnemann, L., Reyers, M., Ritter, B., Ritterbach, L., Rolf, C., Scheidt, S., Dunai, T. J., and Melles, M.: A 68 ka precipitation record from the hyperarid core of the Atacama Desert in Northern Chile, Global Planet. Change, 184, 103054, https://doi.org/10.1016/j.gloplacha.2019.103054, 2020.
Dowsett, H., Dolan, A., Rowley, D., Moucha, R., Forte, A. M., Mitrovica, J. X., Pound, M., Salzmann, U., Robinson, M., Chandler, M., Foley, K., and Haywood, A.: The PRISM4 (mid-Piacenzian) paleoenvironmental reconstruction, Clim. Past, 12, 1519–1538, https://doi.org/10.5194/cp-12-1519-2016, 2016.
Dowsett, H. J., Robinson, M. M., Stoll, D. K., Foley, K. M., Johnson, A. L. A., Williams, M., and Riesselman, C. R.: The PRISM (Pliocene palaeoclimate) reconstruction: time for a paradigm shift, Philos. T. Roy. Soc. A, 371, 20120524, https://doi.org/10.1098/rsta.2012.0524, 2013.
Dunai, T. J., López, G. A. G., and Juez-Larré, J.: Oligocene–Miocene age of aridity in the Atacama Desert revealed by exposure dating of erosion-sensitive landforms, Geology, 33, 321–324, https://doi.org/10.1130/G21184.1, 2005.
Evenstar, L., Mather, A., Hartley, A., Stuart, F., Sparks, R., and Cooper, F.: Geomorphology on geologic timescales: Evolution of the late Cenozoic Pacific paleosurface in Northern Chile and Southern Peru, Earth-Sci. Rev., 171, 1–27, https://doi.org/10.1016/j.earscirev.2017.04.004, 2017.
Evenstar, L. A., Hartley, A. J., Archer, S. G., and Neilson, J. E.: Climatic and halokinetic controls on alluvial–lacustrine sedimentation during compressional deformation, Andean forearc, northern Chile, Basin Res., 28, 634–657, https://doi.org/10.1111/bre.12124, 2016.
Fedorov, A. V., Dekens, P. S., McCarthy, M., Ravelo, A. C., deMenocal, P. B., Barreiro, M., Pacanowski, R. C., and Philander, S. G.: The Pliocene paradox (mechanisms for a permanent El Niño), Science, 312, 1485–1489, https://doi.org/10.1126/science.1122666, 2006.
Feng, R., Otto-Bliesner, B. L., Brady, E. C., and Rosenbloom, N.: Increased climate response and Earth system sensitivity from CCSM4 to CESM2 in mid-Pliocene simulations, J. Adv. Model. Earth Sy., 12, e2019MS002033, https://doi.org/10.1029/2019MS002033, 2020.
Fiedler, S. and Reyers, M.: Rainfall data from WRF simulations for the Atacama Desert for present and mid-Pliocene climate (1.0) [Data set], Zenodo [data set], https://doi.org/10.5281/zenodo.7607397, 2023.
Fiedler, S., Crueger, T., D'Agostino, R., Peters, K., Becker, T., Leutwyler, D., Paccini, L., Burdanowitz, J., Buehler, S., Uribe, A., Dauhut, T., Dommenget, D., Fraedrich, K., Jungandreas, L., Maher, N., Naumann, A., Rugenstein, M., Sakradzija, M., Schmidt, H., Sielmann, F., Stephan, C., Timmreck, C., Zhu, X., and Stevens, B.: Simulated tropical precipitation assessed across three major phases of the Coupled Model Intercomparison Project (CMIP), Mon. Weather Rev., 148, 3653–3680, https://doi.org/10.1175/MWR-D-19-0404.1, 2020.
Gaupp, R., Kött, A., and Wörner, G.: Palaeoclimatic implications of Mio–Pliocene sedimentation in the high-altitude intra-arc Lauca Basin of northern Chile, Palaeogeogr. Palaeocl., 151, 79–100, https://doi.org/10.1016/S0031-0182(99)00017-6, 1999.
Gettelman, A., Hannay, C., Bacmeister, J. T., Neale, R. B., Pendergrass, A. G., Danabasoglu, G., Lamarque, J.-F., Fasullo, J. T., Bailey, D. A., Lawrence, D. M., and Mills, M. J.: High climate sensitivity in the Community Earth System Model Version 2 (CESM2), Geophys. Res. Lett., 46, 8329–8337, https://doi.org/10.1029/2019GL083978, 2019.
Han, Z., Zhang, Q., Li, Q., Feng, R., Haywood, A. M., Tindall, J. C., Hunter, S. J., Otto-Bliesner, B. L., Brady, E. C., Rosenbloom, N., Zhang, Z., Li, X., Guo, C., Nisancioglu, K. H., Stepanek, C., Lohmann, G., Sohl, L. E., Chandler, M. A., Tan, N., Ramstein, G., Baatsen, M. L. J., von der Heydt, A. S., Chandan, D., Peltier, W. R., Williams, C. J. R., Lunt, D. J., Cheng, J., Wen, Q., and Burls, N. J.: Evaluating the large-scale hydrological cycle response within the Pliocene Model Intercomparison Project Phase 2 (PlioMIP2) ensemble, Clim. Past, 17, 2537–2558, https://doi.org/10.5194/cp-17-2537-2021, 2021.
Hartigan, J. A. and Wong, M. A.: Algorithm AS 136: A K-Means Clustering Algorithm, J. Roy. Stat. Soc. C-App., 28, 100–108, 1979.
Hartley, A. and Chong, G.: Late Pliocene age for the Atacama Desert: Implications for the desertification of western South America, Geology, 30, 43–46, https://doi.org/10.1130/0091-7613(2002)030<0043:LPAFTA>2.0.CO;2, 2002.
Haywood, A. M. and Valdes, P. J.: Modelling Pliocene warmth: contribution of atmosphere, oceans and cryosphere, Earth Planet. Sc. Lett., 218, 363–377, https://doi.org/10.1016/S0012-821X(03)00685-X, 2014.
Haywood, A. M., Hill, D. J., Dolan, A. M., Otto-Bliesner, B. L., Bragg, F., Chan, W.-L., Chandler, M. A., Contoux, C., Dowsett, H. J., Jost, A., Kamae, Y., Lohmann, G., Lunt, D. J., Abe-Ouchi, A., Pickering, S. J., Ramstein, G., Rosenbloom, N. A., Salzmann, U., Sohl, L., Stepanek, C., Ueda, H., Yan, Q., and Zhang, Z.: Large-scale features of Pliocene climate: results from the Pliocene Model Intercomparison Project, Clim. Past, 9, 191–209, https://doi.org/10.5194/cp-9-191-2013, 2013.
Haywood, A. M., Dowsett, H. J., Dolan, A. M., Rowley, D., Abe-Ouchi, A., Otto-Bliesner, B., Chandler, M. A., Hunter, S. J., Lunt, D. J., Pound, M., and Salzmann, U.: The Pliocene Model Intercomparison Project (PlioMIP) Phase 2: scientific objectives and experimental design, Clim. Past, 12, 663–675, https://doi.org/10.5194/cp-12-663-2016, 2016.
Herrera, C. and Custodio, E.: Origin of waters from small springs located at the northern coast of Chile, in the vicinity of Antofagasta, Andean Geol., 41, 314–341, 2014.
Houston, J.: Variability of Precipitation in the Atacama Desert: Its Causes and Hydrological Impact, Int. J. Climatol., 26, 2181–2198, https://doi.org/10.1002/joc.1359, 2006.
Jordan, T. E., Kirk-Lawlor, N. E., Blanco, N. P., Rech, J. A., and Cosentino, N. J.: Landscape modification in response to repeated onset of hyperarid paleoclimate states since 14 Ma, Atacama Desert, Chile, Geol. Soc. Am. Bull., 126, 1016–1046, https://doi.org/10.1130/b30978.1, 2014.
J ordan, T. E., Herrera, H., Godfrey, L. V., Colucci, S. J., Gamboa, C., Urrutia, J., Gabriel González, L., and Paul, J. F.: Isotopic characteristics and paleoclimate implications of the extreme precipitation event of March 2015 in northern Chile, Andean Geol., 46, 1–31, https://doi.org/10.5027/andgeoV46n1-3087, 2019.
Kageyama, M., Braconnot, P., Harrison, S. P., Haywood, A. M., Jungclaus, J. H., Otto-Bliesner, B. L., Peterschmitt, J.-Y., Abe-Ouchi, A., Albani, S., Bartlein, P. J., Brierley, C., Crucifix, M., Dolan, A., Fernandez-Donado, L., Fischer, H., Hopcroft, P. O., Ivanovic, R. F., Lambert, F., Lunt, D. J., Mahowald, N. M., Peltier, W. R., Phipps, S. J., Roche, D. M., Schmidt, G. A., Tarasov, L., Valdes, P. J., Zhang, Q., and Zhou, T.: The PMIP4 contribution to CMIP6 – Part 1: Overview and over-arching analysis plan, Geosci. Model Dev., 11, 1033–1057, https://doi.org/10.5194/gmd-11-1033-2018, 2018.
Kirk-Lawlor, N. E., Jordan, T. E., Rech, J. A., and Lehmann, S. B.: Late Miocene to Early Pliocene paleohydrology and landscape evolution of Northern Chile, 19∘ to 20∘ S, Palaeogeogr. Palaeocl., 387, 76–90, https://doi.org/10.1016/j.palaeo.2013.07.011, 2013.
Knippertz, P.: A Simple Identification Scheme for Upper-Level Troughs and Its Application to Winter Precipitation Variability in Northwest Africa, J. Climate, 17, 1411–1418, https://doi.org/10.1175/1520-0442(2004)017<1411:ASISFU>2.0.CO;2, 2004.
Knippertz, P. and Martin, J. E.: A Pacific Moisture Conveyor Belt and its Relationship to a Significant Precipitation Event in the Semiarid Southwestern United States, Weather Forecast., 22, 125–144, https://doi.org/10.1175/WAF963.1, 2007.
Kohonen, T.: Self-Organizing Maps, Springer Series in Information Sciences, vol. 30, 3rd edn., Springer-Verlag Berlin Heidelberg, https://doi.org/10.1007/978-3-642-56927-2, 2001.
Ludwig, P., Gómez-Navarro, J. J., Pinto, J. G., Raible, C. C., Wagner, S., and Zorita, E.: Perspectives of regional paleoclimate modeling, Ann. NY Acad. Sci., 1436, 54–69, https://doi.org/10.1111/nyas.13865, 2019.
May, G., Hartley, A. J., Chong, G., Stuart, F., Turner, P., and Kape, S. J.: Eocene to Pleistocene lithostratigraphy, chronostratigraphy and tectono-sedimentary evolution of the Calama Basin, northern Chile, Andean Geol., 32, 33–58, 2010.
McClymont, E. L., Ford, H. L., Ho, S. L., Tindall, J. C., Haywood, A. M., Alonso-Garcia, M., Bailey, I., Berke, M. A., Littler, K., Patterson, M. O., Petrick, B., Peterse, F., Ravelo, A. C., Risebrobakken, B., De Schepper, S., Swann, G. E. A., Thirumalai, K., Tierney, J. E., van der Weijst, C., White, S., Abe-Ouchi, A., Baatsen, M. L. J., Brady, E. C., Chan, W.-L., Chandan, D., Feng, R., Guo, C., von der Heydt, A. S., Hunter, S., Li, X., Lohmann, G., Nisancioglu, K. H., Otto-Bliesner, B. L., Peltier, W. R., Stepanek, C., and Zhang, Z.: Lessons from a high-CO2 world: an ocean view from ∼3 million years ago, Clim. Past, 16, 1599–1615, https://doi.org/10.5194/cp-16-1599-2020, 2020.
Menemenlis, S., Lora, J. M., Lofverstrom, M., and Chandan, D.: Influence of stationary waves on mid-Pliocene atmospheric rivers and hydroclimate, Global Planet. Change, 204, 103557, https://doi.org/10.1016/j.gloplacha.2021.103557, 2021.
Ohba, M., Kadokura, S., and Nohara, D.: Impacts of synoptic circulation patterns on wind power ramp events in East Japan, Renew. Energ., 96, 591–602, https://doi.org/10.1016/j.renene.2016.05.032, 2016.
Oldeman, A. M., Baatsen, M. L. J., von der Heydt, A. S., Dijkstra, H. A., Tindall, J. C., Abe-Ouchi, A., Booth, A. R., Brady, E. C., Chan, W.-L., Chandan, D., Chandler, M. A., Contoux, C., Feng, R., Guo, C., Haywood, A. M., Hunter, S. J., Kamae, Y., Li, Q., Li, X., Lohmann, G., Lunt, D. J., Nisancioglu, K. H., Otto-Bliesner, B. L., Peltier, W. R., Pontes, G. M., Ramstein, G., Sohl, L. E., Stepanek, C., Tan, N., Zhang, Q., Zhang, Z., Wainer, I., and Williams, C. J. R.: Reduced El Niño variability in the mid-Pliocene according to the PlioMIP2 ensemble, Clim. Past, 17, 2427–2450, https://doi.org/10.5194/cp-17-2427-2021, 2021.
Pontes, G. M., Wainer, I., Taschetto, A. S., Sen Gupta, A., Abe-Ouchi, A., Brady, E. C., Chan, W.-L., Chandan, D., Contoux, C., Feng, R., Hunter, S. J., Kame, Y., Lohmann, G., Otto-Bliesner, B. L., Peltier, W. R., Stepanek, C., Tindall, J., Tan, N., Zhang, Q., and Zhang, Z.: Drier tropical and subtropical Southern Hemisphere in the mid-Pliocene Warm Period, Sci. Rep.-UK, 10, 13458, https://doi.org/10.1038/s41598-020-68884-5, 2020.
Priestley, M. D. K. and Catto, J. L.: Future changes in the extratropical storm tracks and cyclone intensity, wind speed, and structure, Weather Clim. Dynam., 3, 337–360, https://doi.org/10.5194/wcd-3-337-2022, 2022.
Reyers, M.: WRF Output daily accumulated total precipitation 10 km resolution Atacama, CRC1211 Database (CRC1211DB) [data set], https://doi.org/10.5880/CRC1211DB.20, 2019.
Reyers, M., Boehm, C., Knarr, L., Shao, J., and Crewell, S.: Synoptic-to-Regional-Scale Analysis of Rainfall in the Atacama Desert (18∘–26∘ S) Using a Long-Term Simulation with WRF, Mon. Weather Rev., 149, 91–112, https://doi.org/10.1175/MWR-D-20-0038.1, 2021.
Ritter, B., Binnie, S. A., Stuart, F. M., Wennrich, V., and Dunai, T. J.: Evidence for multiple Plio-Pleistocene lake episodes in the hyperarid Atacama Desert, Quat. Geochronol., 44, 1–12, https://doi.org/10.1016/j.quageo.2017.11.002, 2018.
Ritter, B., Wennrich, V., Medialdea, A., Brill, D., King, G., Schneiderwind, S., Niemann, K., Fernández-Galego, E., Diederich, J., Rolf, C., Bao, R., Melles, M., and Dunai, T. J.: Climatic fluctuations in the hyperarid core of the Atacama Desert during the past 215 ka, Sci. Rep.-UK, 9, 5270, https://doi.org/10.1038/s41598-019-41743-8, 2019.
Rutz, J. J., Steenburgh, W. J., and Ralph, F. M.: Climatological Characteristics of Atmospheric Rivers and Their Inland Penetration over the Western United States, Mon. Weather Rev., 142, 905–921, https://doi.org/10.1175/MWR-D-13-00168.1, 2014.
Skamarock, W., Klemp, J., Dudhia, J., Gill, D., Barker, D., Wang, W., Huang, X. Y., Duda, M., and Powers, G.: A Description of the Advanced Research WRF Version 3, NCAR Tech. Note NCAR/TN-475+STR, 113 pp., https://doi.org/10.5065/d68s4mvh, 2008.
Solman, S. A. and Menendez, G. C.: ENSO-Related Variability of the Southern Hemisphere Winter Storm Track over the Eastern Pacific–Atlantic Sector, J. Atmos. Sci., 59, 2128–2140, 2001.
Stuut, J. and Lamy, F.: Climate variability at the southern boundaries of the Namib (southwestern Africa) and Atacama (northern Chile) coastal deserts during the last 120 000 yr, Quaternary Res., 62, 301–309, https://doi.org/10.1016/j.yqres.2004.08.001, 2004.
Vásquez, P., Sepúlveda, F. A., Quezada, A., Aguilef, S., Franco, C., and Blanco, N.: Cartas Guanillos del Norte y Salar de Llamara, Regiones de Tarapacá y Antofagasta, Servicio Nacional de Geología y Minería, Carta Geológica de Chile, Serie Geología Básica 195–196, 93 p., 1 mapa escala 1 : 100.000, Santiago, ISSN 0717-7283, 2018.
Vuille, M. and Ammann, C.: Regional snowfall patterns in the high, arid Andes, Climatic Change, 36, 413–423, 1997.
Wara, M. W., Ravelo, A. C., and Delaney, M. L.: Permanent El Niño-like conditions during the Pliocene warm period, Science, 309, 758–761, 2005.
Watanabe, T., Suzuki, A., Minobe, S., Kawashima, T., Kameo, K., Minoshima, K., Aguilar, Y. M., Wani, R., Kawahata, H., Sowa, K., Nagai, T., and Kase, T.: Permanent El Niño during the Pliocene warm period not supported by coral evidence, Nature, 471, 209–211, https://doi.org/10.1038/nature09777, 2011.
Zhu, J., Otto-Bliesner, B. L., Brady, E. C., Gettelman, A., Bacmeister, J. T., Neale, R. B., Poulsen, C. J., Shaw, J. K., McGraw, Z. S., and Kay, J. E.: LGM paleoclimate constraints inform cloud parameterizations and equilibrium climate sensitivity in CESM2, J. Adv. Model. Earth Sy., 14, e2021MS002776, https://doi.org/10.1029/2021MS002776, 2022.