the Creative Commons Attribution 4.0 License.
the Creative Commons Attribution 4.0 License.
 | 02 Feb 2023
Temporal variations of surface mass balance over the last 5000 years around Dome Fuji, Dronning Maud Land, East Antarctica
Kenji Kawamura
Shuji Fujita
Ryo Inoue
Hideaki Motoyama
Kotaro Fukui
Motohiro Hirabayashi
Yu Hoshina
Naoyuki Kurita
Fumio Nakazawa
Hiroshi Ohno
Konosuke Sugiura
Toshitaka Suzuki
Shun Tsutaki
Ayako Abe-Ouchi
Masashi Niwano
Frédéric Parrenin
Fuyuki Saito
Masakazu Yoshimori
We reconstructed surface mass balance (SMB) around Dome Fuji, Antarctica, over the last 5000 years using the data from 15 shallow ice cores and seven snow pits. The depth–age relationships for the ice cores were determined by synchronizing them with a layer-counted ice core from West Antarctica (WAIS Divide ice core) using volcanic signals. The reconstructed SMB records for the last 4000 years show spatial patterns that may be affected by their locations relative to the ice divides around Dome Fuji, proximity to the ocean, and wind direction. The SMB records from the individual ice cores and snow pits were stacked to reconstruct the SMB history in the Dome Fuji area. The stacked record exhibits a long-term decreasing trend at kg m−2 per century over the last 5000 years in the preindustrial period. The decreasing trend may be the result of long-term surface cooling over East Antarctica and the Southern Ocean and sea ice expansion in the water vapor source areas. The multidecadal to centennial variations of the Dome Fuji SMB after detrending the record shows four distinct periods during the last millennium: a mostly negative period before 1300 CE, a slightly positive period from 1300 to 1450 CE, a slightly negative period from 1450 to 1850 CE with a weak maximum around 1600 CE, and a strong increase after 1850 CE. These variations are consistent with those of previously reconstructed SMB records in the East Antarctic plateau. The low accumulation rate periods tend to coincide with the combination of strong volcanic forcings and solar minima for the last 1000 years, but the correspondence is not clear for the older periods, possibly because of the lack of coincidence of volcanic and solar forcings or the deterioration of the SMB record due to a smaller number of stacked cores.
- Article
(8855 KB) - Full-text XML
- BibTeX
- EndNote


The Antarctic Ice Sheet (AIS) is the largest reservoir of fresh water on Earth and has the potential to increase the global sea level by 58 m (Fretwell et al., 2013). The AIS mass balance is determined by the sum of surface mass balance (SMB), basal melting of ice shelves and peripheral ice discharge into the Southern Ocean, and basal melting at bedrock (e.g., Rignot et al., 2019). The SMB is the sum of surface mass gains (mostly snowfall deposition), surface mass loss (sublimation, water run-off and evaporation) and blowing snow redistribution (e.g., Lenaerts and van den Broeke, 2012; Van Wessem et al., 2018; Agosta et al., 2019). Recent satellite remote sensing techniques combined with modeling of regional climate and glacial isostatic adjustment have revealed that the AIS has been losing its mass over the past 2 decades (e.g., The IMBIE team, 2018; IPCC, 2019, 2021). The ice mass loss is enhanced in the Antarctic Peninsula and West Antarctica mainly due to basal melting of ice shelves and the acceleration of glaciers flow (e.g., The IMBIE team, 2018; Rignot et al., 2019; Schröder et al., 2019; Velicogna et al., 2020). On the other hand, it is estimated that some parts of Antarctica have been gaining ice mass, possibly because of the increase in snow accumulation. In particular, the ice mass in Dronning Maud Land (DML) significantly increased over the past decade (e.g., Velicogna et al., 2020). Although in situ observations (e.g., snow stake measurements), remote sensing observation (e.g., Velicogna et al., 2020) and regional climate models (e.g., Mottram et al., 2021) are useful for evaluating the spatiotemporal changes in AIS MB and SMB, they are available only over the last few decades. However, the AIS also changes on much longer timescales than those covered by the direct observations (e.g., Colleoni et al., 2018), and the long-term records of the SMB are needed to better understand the AIS mass changes (Stokes et al., 2022). In this study, we use the term accumulation or accumulation rate to refer to positive SMB because the long-term SMB is generally positive on the interior part of AIS.
Firn and ice cores have provided the AIS SMB histories over the last few centuries to millennia. Thomas et al. (2017) compiled 79 records of Antarctic ice-core-based SMB records over the past 1000 years. The analysis of the total AIS SMB derived from the database suggested that snow accumulation had significantly increased in the 20th century (over the past ∼50 and ∼100 years) (Thomas et al., 2017). A newer SMB reconstruction over the last 200 years by combining the above dataset and reanalysis data suggests accelerating the increase in AIS accumulation rate during the latter half of the 20th century (Medley and Thomas, 2019). In the East Antarctic Plateau (EAP), the ice-core-based SMB reconstructions do not show a uniform trend. At the Kohnen station (EPICA DML), the increasing trend of accumulation rate was reported over the past 200 years (Oerter et al., 2000; Hofstede et al., 2004; Altnau et al., 2015). Along the Japanese–Swedish traverse route between the Wasa and Dome Fuji stations, Fujita et al. (2011) combined shallow cores and ice radar isochrons and found a strong relationship between the SMB and local surface topography and a higher accumulation rate in the latter half of the 20th century than the preindustrial Holocene average by 15 %. A significant increase in accumulation rate in the 20th century was also found from a firn core at the Dome Fuji station (Igarashi et al., 2011). At the Dome C station, stake measurements and firn cores showed that the accumulation rate over the last 200 years increased by ∼30 % with respect to the average over the last 5000 years based on the reconstruction using stable water isotope record as a proxy for SMB (Frezzotti et al., 2005). At Vostok, the accumulation rate after 1950 CE is larger than the average between 1260 and 1600 CE (Osipov et al., 2014). On the other hand, along the Norwegian–USA traverse routes between the coastal DML and the South Pole, Anschütz et al. (2009, 2011) found no consistent trends in SMB since 1963 CE; some sites showed an increase in accumulation rate while others showed a decrease. The same study found decreasing trends in accumulation rate for the sites above 3200 m elevation. The apparently inconsistent trends of the SMB over the EAP may be related to their locations relative to ice ridges and prevailing wind directions (Fujita et al., 2011) or the influences of atmospheric patterns such as the Southern Annular Mode (Medley and Thomas, 2019).
On the multi-centennial timescale, a negative trend in SMB since 1000 CE was found in the SMB composite of four regions with long records: the West Antarctic Ice Sheet (WAIS) and coastal sites in Wilkes Land, the Weddell Sea coast, and Victoria Land (Thomas et al., 2017). However, only four ice core records actually extend to 1000 years (WAIS Divide, Law Dome, Berkner Island and Roosevelt Island cores), and the vast interior of the East Antarctic Ice Sheet (EAIS) is not represented in the 1000-year composite (Thomas et al., 2017). The authors suggested that small changes in the accumulation rate in the EAP, although it is relatively low, could change the sign and significance of the total Antarctic SMB trend because the total area of the EAP accounts for about half of that of the AIS. Thus, reliable long-term SMB records from EAP are particularly valuable.
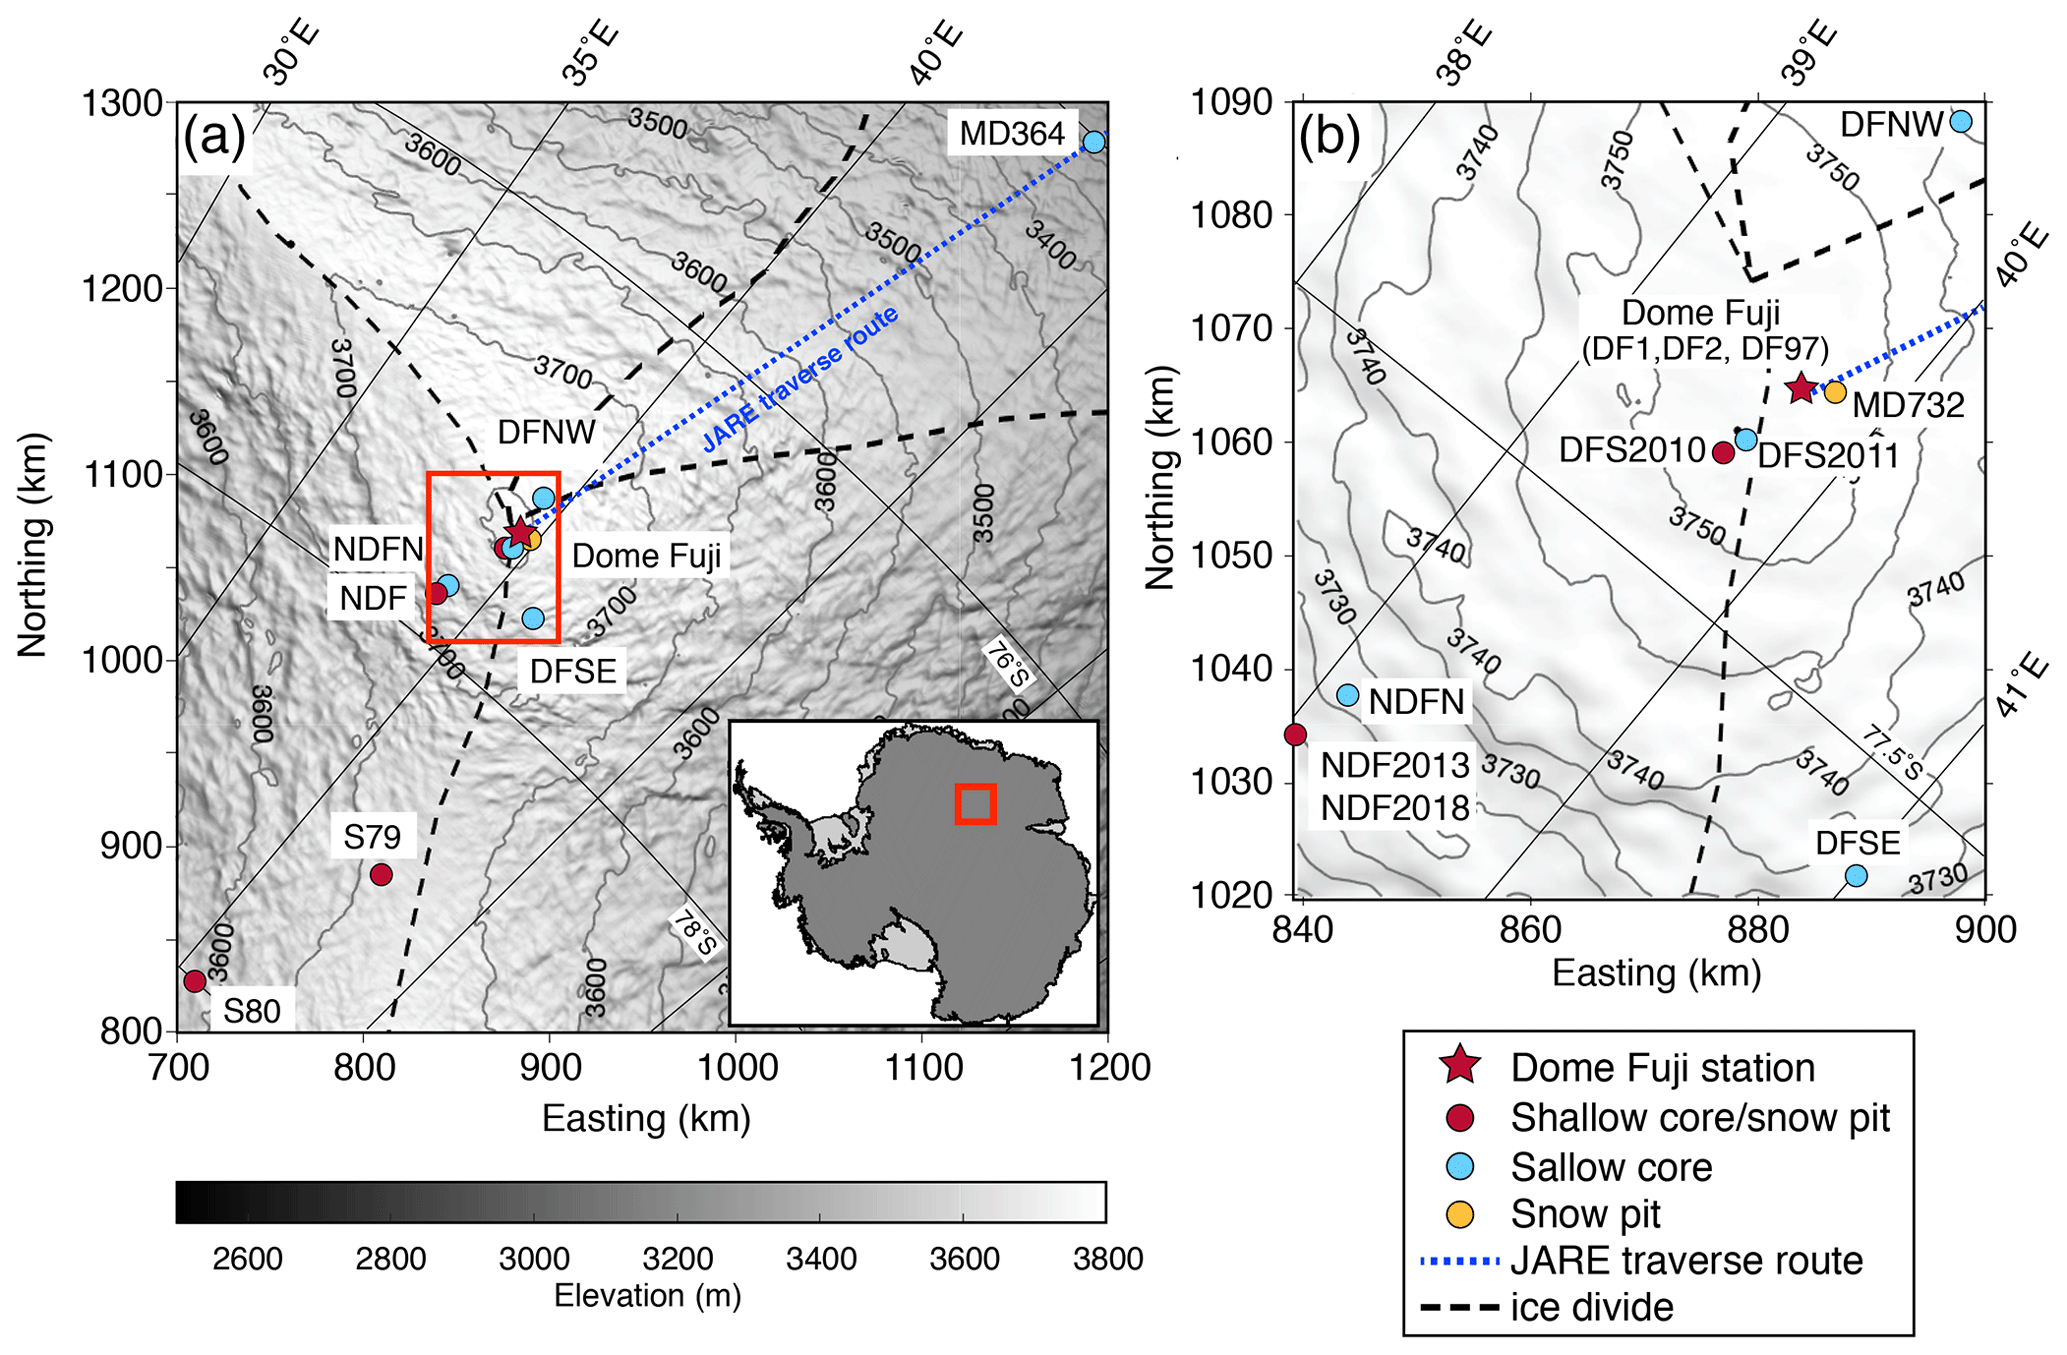
Figure 1Locations of ice cores and snow pits (polar stereographic projection). (a) Overall view and (b) enlarged view. Markers in red are the sites with both an ice core and snow pit, markers in blue are ice core sites, and markers in yellow are snow pit sites. Surface elevation contour intervals are (a) 50 m and (b) 5 m (BedMachine, Morlighem et al., 2020). Figures were drawn using an open-source MATLAB toolbox (Antarctic Mapping Tools, Greene et al., 2017).
There is a primary issue that most of the EAIS is difficult to access in a spatially coherent way. In addition, there are several difficulties in reliable, continuous and long-term SMB reconstructions, particularly from the EAP. (1) The top part (surface to several meters) of shallow cores is extremely fragile, which makes it challenging to precisely measure the density and assign the depths of age markers for the last few hundred years. (2) Snow deposition is not spatially and temporally uniform, and annual layers can be eroded (Kameda et al., 2008); thus, an SMB reconstruction from one core may have large uncertainty. (3) Density profiles in the low-accumulation area are highly variable, especially near the surface (Weinhart et al., 2020), introducing large uncertainty into the estimated masses. (4) Sparseness of volcanic eruption records before 1000 CE and high-resolution ice core datasets, combined with occasional lack of annual layers in the low-accumulation cores, make it difficult to precisely and densely date the ice cores. Thus, the existing SMB reconstructions in EAP over more than several thousand years are based on a proxy method (from stable water isotopes; e.g., Parrenin et al., 2016) or a small number of isochrons from shallow ice radar measurements (e.g., Fujita et al., 2011; Cavitte et al., 2018, 2022).
Table 1Location, elevation, depth and observation date of the shallow cores and snow pits.
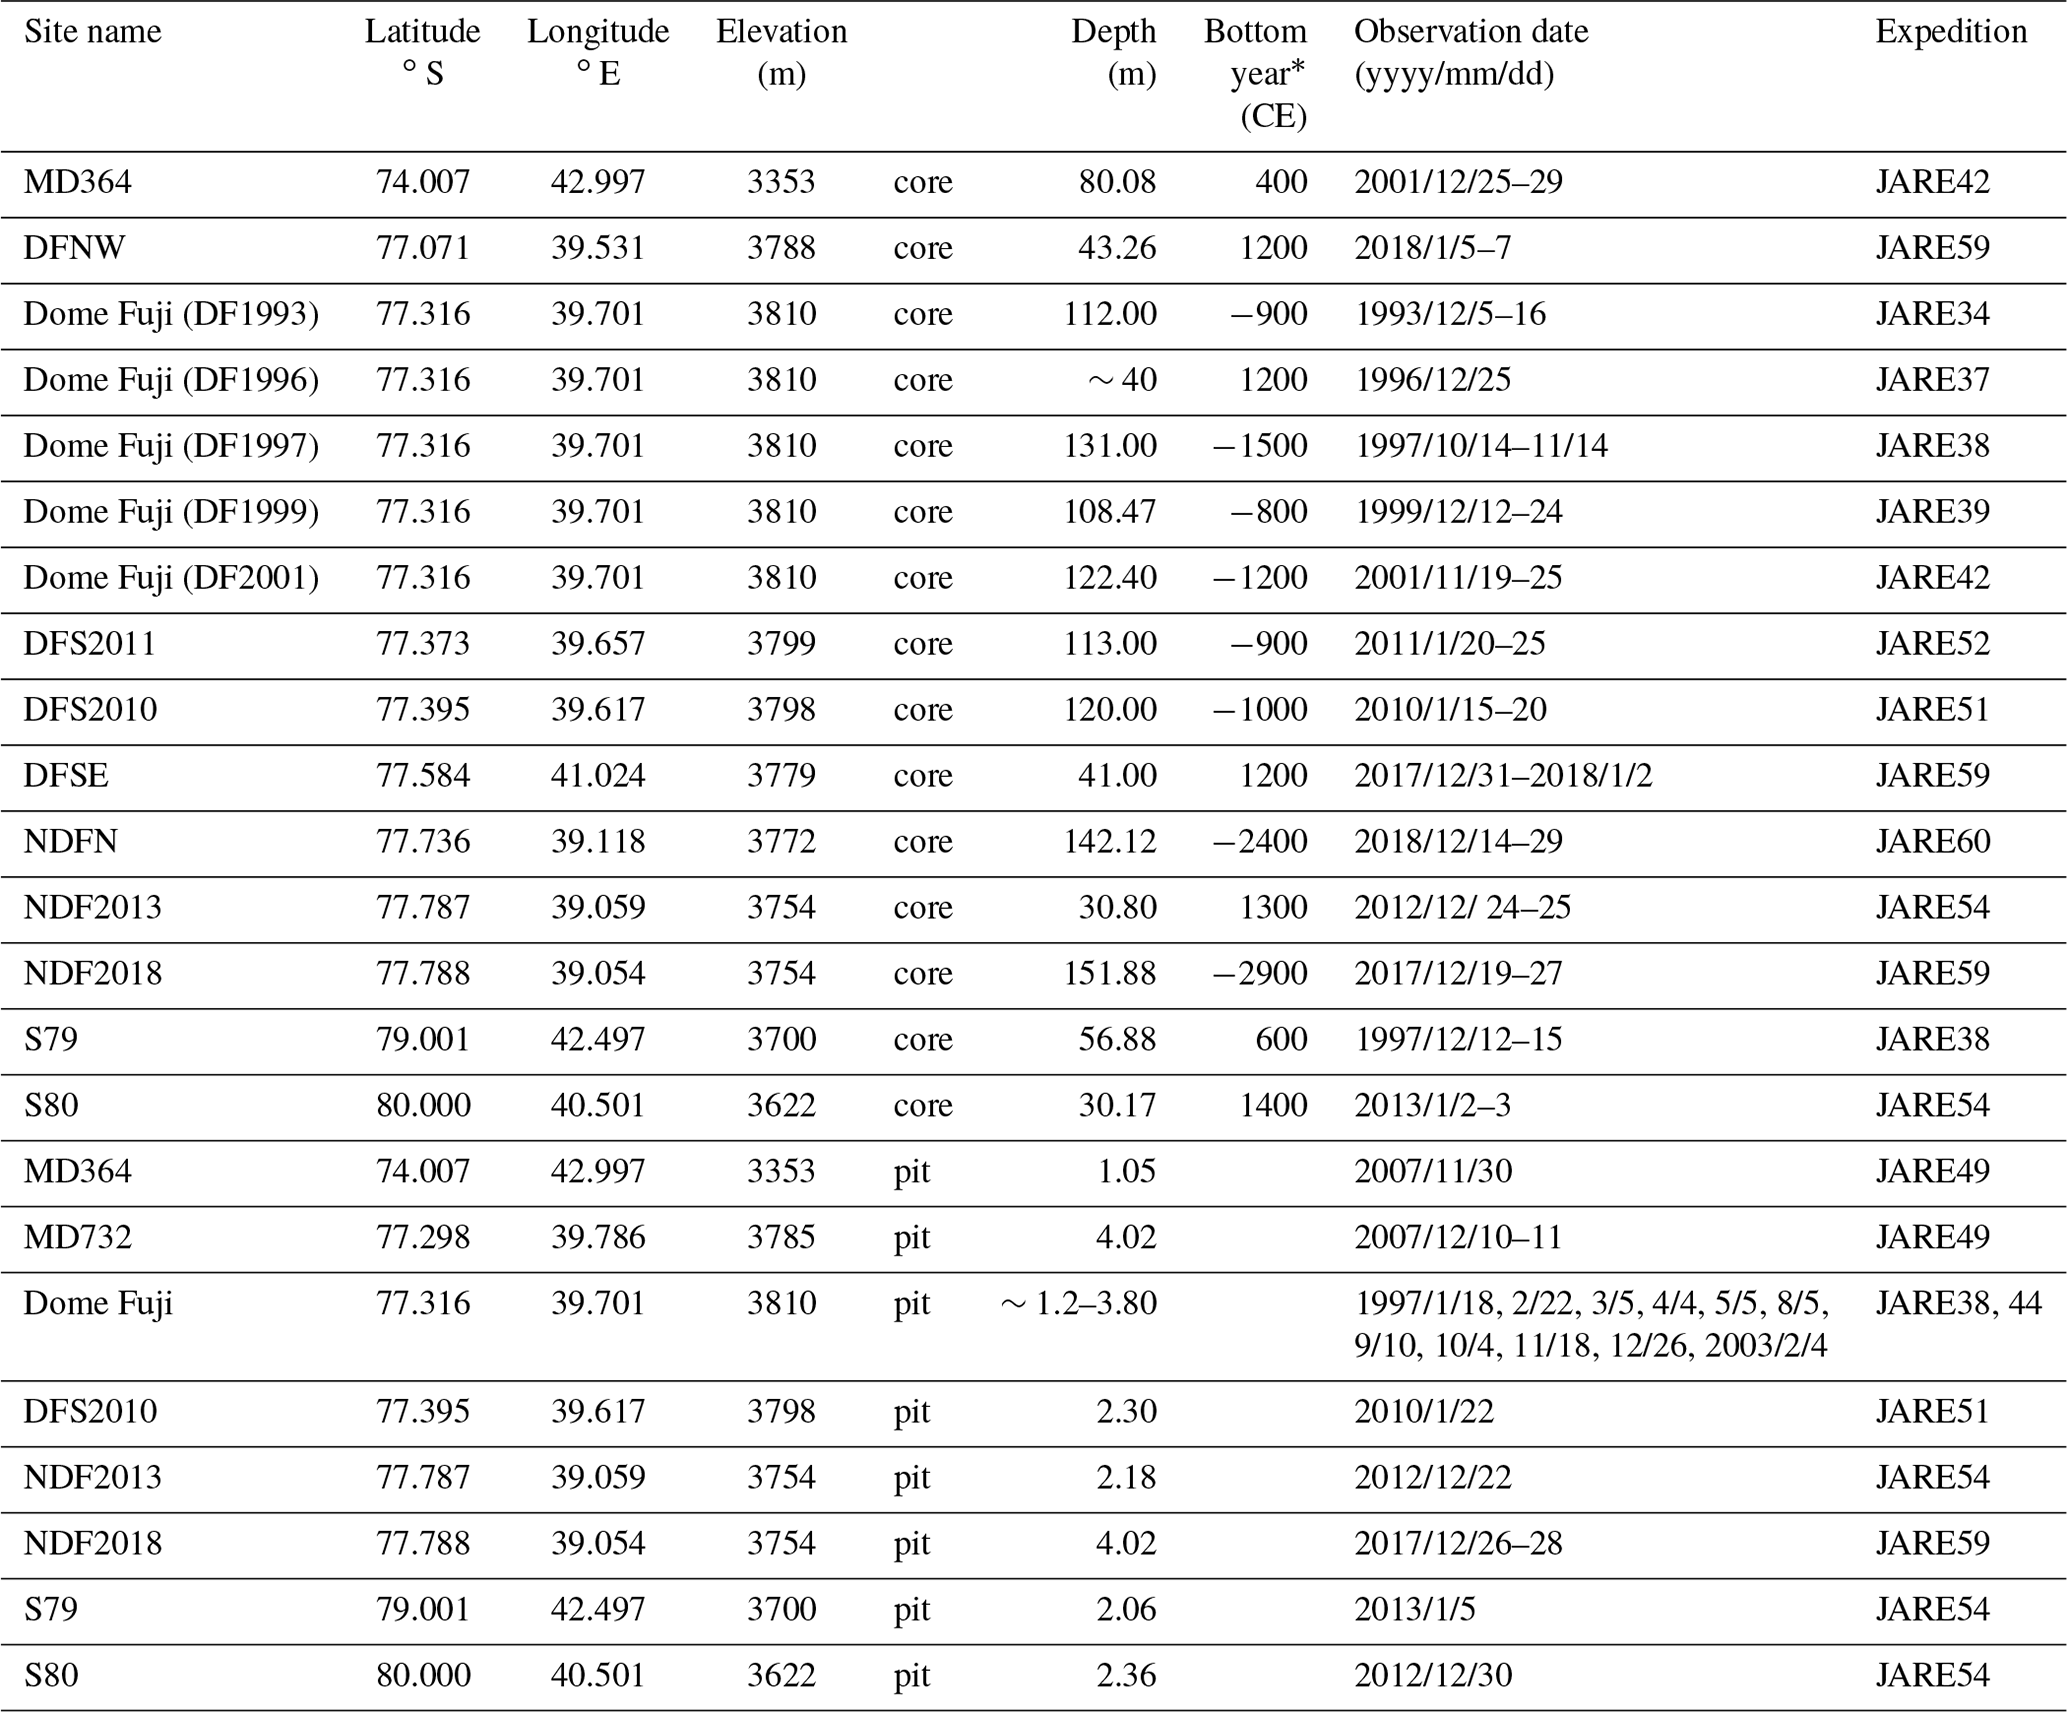
* Rounded to the nearest hundred years.
In this study, we reconstruct the SMB histories around Dome Fuji over the last 5000 years using data from seven snow pits and 15 shallow ice cores retrieved by successive Japanese Antarctic Research Expedition (JARE). We determined the depth–age relationships of the ice cores by synchronizing them with the WAIS Divide ice core, whose chronology is accurately determined by annual layer counting using common volcanic signals (Sigl et al., 2014, 2016). We discuss millennial-scale trends and centennial-scale variabilities of SMB in relation to the climate variabilities during the middle to late Holocene.
2.1 Study area and samples
The study area is inland Dronning Maud Land around the Dome Fuji station (77.316∘ S, 39.701∘ E, 3810 m a.s.l.) with a radius of about 300 km (Fig. 1). Dome Fuji is the second-highest summit of the AIS and is located at the junction of four ice divides (Fig. 1a). Spatial and temporal variability of SMB around the ice divide near Dome Fuji is characterized as follows. The large-scale spatial pattern of the SMB depends on the surface elevation, distance from the moisture source (ocean) along the atmospheric pathway and large-scale surface topography (e.g., positions of ice divides) in combination with a dominant trajectory of air mass with moisture. Around Dome Fuji, SMB is larger on the windward (mostly northeastern) side of ice divides than on the leeward side (Suzuki et al., 2008; Fujita et al., 2011; Tsutaki et al., 2022). In addition, local variations in surface topography, which may be influenced by the bedrock topography and ice flow (Fujita et al., 2011; Tsutaki et al., 2022), also affect the precipitation patterns and snow redistribution and thus the spatial patterns of SMB (Furukawa et al., 1996; Van Liefferinge et al., 2021).
In this study, we use seven snow pit samples and 15 ice cores collected between 1993 and 2019 to reconstruct accumulation rates. The names and locations of each site are shown in Fig. 1 and Table 1. The locations of the sites are mostly distributed within 50 km from Dome Fuji (Fig. 1b), with additional sites further away (200–400 km), both on the windward and leeward sides of the main ice divides with respect to the origin and transport paths of moisture. At the Dome Fuji station, two deep ice cores have also been drilled in the 1990s and 2000s to the depths of 2503 m (340 ka BP) (DF1) and 3035 m (720 ka BP) (DF2), respectively (Watanabe et al., 1997a, b; Dome Fuji Ice Core Project Members, 2017; Motoyama et al., 2021). Two shallow cores (DF1993 and DF2001) are the shallow parts of the DF1 and DF2 deep ice cores. Because the NDF2018 core is the longest and oldest shallow ice core in this study (151 m long, covering ∼4800 years), we use the records of DF1 and DF2 deep cores to cover the same period. Four ice cores (DF1, DF2, NDF2018 and NDFN cores) cover more than 4000 years, three ice cores (DF1997, DFS2010 and DFS2011 cores) cover 1500 years and six ice cores (MD364, NDF2013, S79, S80, DFNW and DFSE cores) cover 800 years or less. The DF1997 core has poor ice core recovery and uncertain depth assignments for 0–20 m; thus, we use the data only below 20 m. The DF1999 core was measured for permittivity (for density estimation) but not for DEP for volcanic matching, and thus it was only used for estimating the average density profile at Dome Fuji.
2.2 Density
We obtained density profiles of shallow cores by combining published density profiles, bulk densities measured at the field, and permittivity measured in a laboratory (Fig. 2, Table 2). We briefly describe each method.
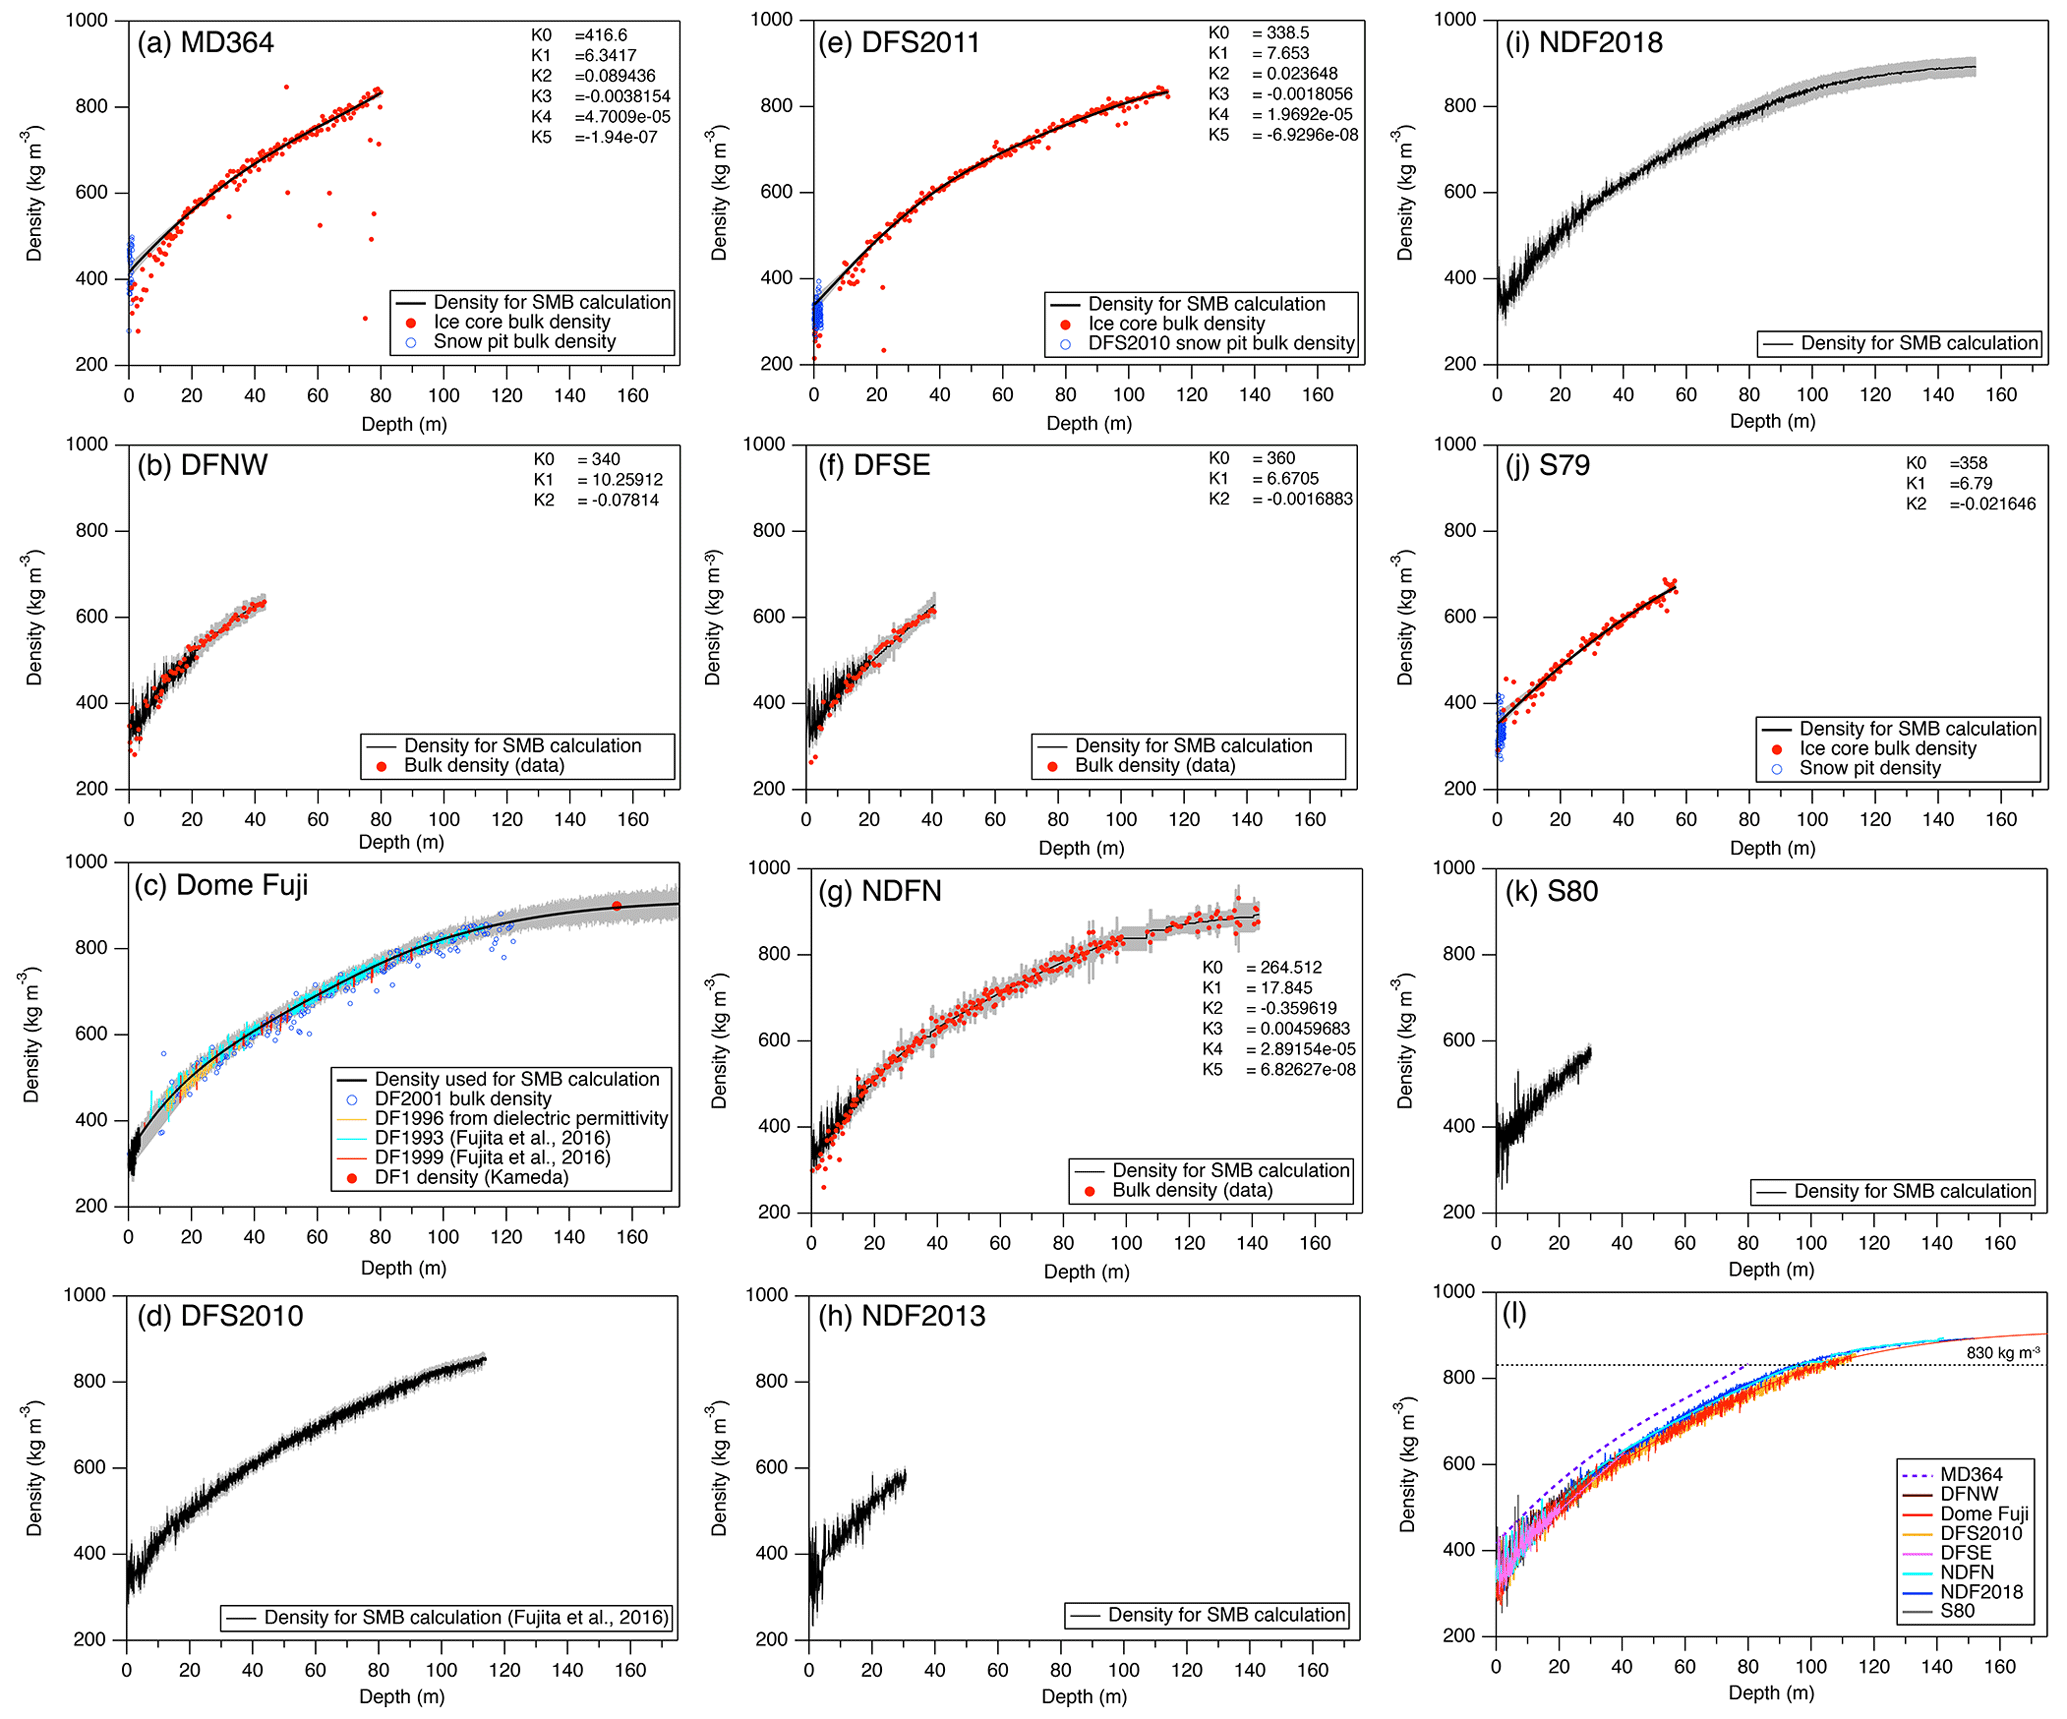
Figure 2Density profiles of the studied sites. The black lines are the data used for the calculation of the accumulation rate, with 1σ uncertainty shown using grey shading. Colored markers indicate bulk density data. K0, K1, K2, K3, K4 and K5 are coefficients for the quadratic or quintic fitting curves. See the main text for coefficients for the fitting curve for the Dome Fuji (Eqs. 4 and 5).
Table 2Surface density from snow pits.
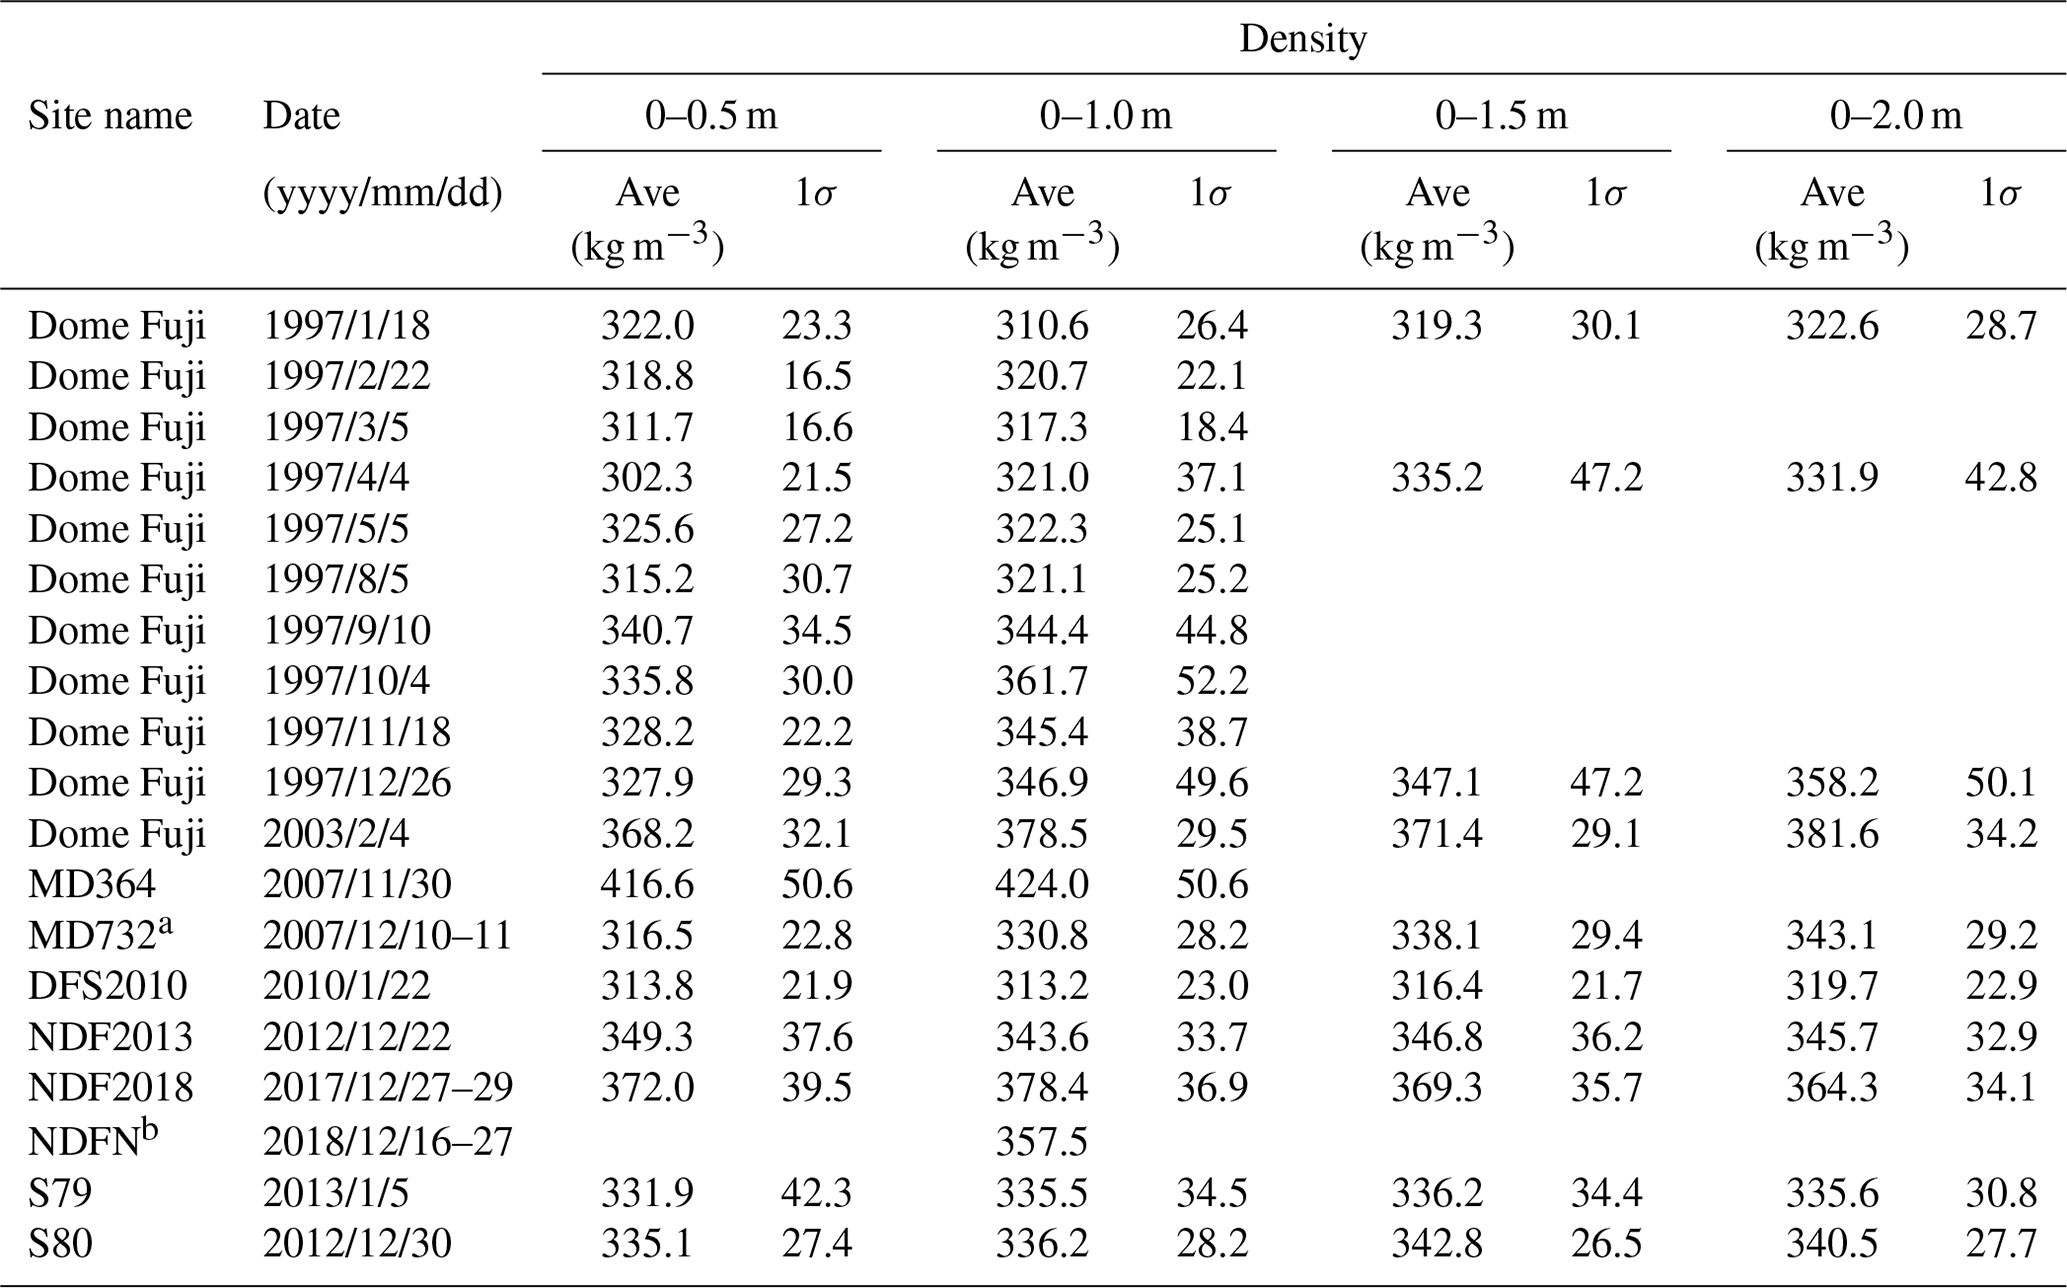
a Hoshina et al. (2014), b Van Liefferinge et al. (2021).
2.2.1 Bulk density measurements
We use the bulk density data for estimating the SMB for the MD364, S79, DFS2011, NDFN, DFSE and DFNW cores. Bulk density of an ice core piece was calculated from its diameter, length and mass measured at the drilling sites, assuming that it has a cylindrical shape. The diameter was measured with a caliper at one to three positions, and the mass was measured with an electronic balance. The density of near-surface snow was obtained by excavating a snow pit and sampling the snow along the pit wall with a stainless-steel snow density sampler, which was measured with an electronic balance. The typical dimensions of the density sampler are 60 mm (W) × 56 mm (D) × 30 mm (H) (∼100 cm3).
To assess the uncertainty of the in situ ice core measurements, the bulk density of the NDFN core was also measured between 21 and 64 m (correspond to ∼500–700 kg m−3) in a cold laboratory at the National Institute of Polar Research (NIPR). The difference between the in situ and laboratory data likely originates in the harsh measurement environment in the field (wind, lack of time, uneven worktable, etc.) and was 6±15 kg m−3 (mean and standard deviation). We assume that the random error of bulk density measured in the field for the other cores is the same as that of the NDFN core (±15 kg m−3). For the Dome Fuji site, the density error can also be evaluated using the two cores (DF1993 and DF2001) separated by only 43 m. We resampled the density data at 0.5 m intervals from 10 to 112 m where both data are available (191 intervals), and evaluated the variability of densities by calculating the pooled standard deviation (Sp) as the square root of the summed squared deviations of the DF1993 and DF2001 density data from the respective means for the 0.5 m intervals, divided by the number of depth intervals:
where ρ is density for the 382 individual data and is the mean of DF1993 and DF2001 for the 191 depth intervals. We found that Sp is 16 kg m−3, which is comparable to the estimated error for the NDFN core.
In addition to the random error, underestimation is common for ice cores from the Antarctic inland for depths shallower than ∼15 m because of the extreme fragility of the cores. For example, the bulk density of the NDF core at ∼4 m is underestimated by ∼20 % with respect to the density measured from snow pit sampling at the same site. The uncertainty of the snow pit density measurements performed with similar devices and procedures has been reported as ±4 % (Conger and McClung, 2009).
2.2.2 Relative permittivity at millimeter wave frequencies
We measured the high-frequency-limit relative permittivity (hereafter relative permittivity, permittivity or ε) of firn cores using open resonators operating under frequencies from ca. 15 to 40 GHz. The relative permittivities were measured at NIPR and converted to firn densities ρ (kg m−3) using empirical relations between ε and ρ (Kovacs et al., 1995; Fujita et al., 2014). The detailed method for the measurement of ε is described elsewhere (Fujita et al., 2009, 2014, 2016; Saruya et al., 2022). Briefly, a core piece is cut into a slab-shaped sample with a typical thickness of 5–80 mm and a width of 45–65 mm. The sample is scanned along the depth axis with an open resonator with a 1σ beam diameter of 15–38 mm. This method allows the detection of tensorial values of ε, from which the vertical (εv) and horizontal (εh) components can be simultaneously derived. The measured εh was converted to ρ using empirical relations under the temperature of the measurements, either or ∘C. The analytical uncertainty of εh is ±0.005 and the overall uncertainty for the density is estimated to be ∼6–14 kg m−3 (Appendix A).
For the measurements under −16 ∘C, we used (Fujita et al., 2014)
This relation was applied for the DF1993, DF1996, DF1999, DFS2010, NDF2013 and S80 cores, which were measured before 2018. Note that we used the published values for the DF1993, DF1999 and DFS2010 cores (Fujita et al., 2016).
For the measurements under −30 ∘C, we used
This relation was applied for the NDF2018, DFNW, DFSE and NDFN cores, which were measured in 2018–2021.
2.2.3 Fitting and interpolation
For S79, MD364 and DFS2011 cores, we fitted a polynomial function to the ice-core data below 15 m with a fixed surface density from the pit data due to the underestimation of bulk density at shallow depths. We employed a second-order polynomial function for the S79 core and a fifth-order polynomial function for the MD364 and DFS2011 cores. The degree of the polynomial functions was chosen to minimize the residual (difference between the data and fitting curve). A second-order polynomial function was sufficient for the relatively short core (S79 core, 56 m), while fifth-order polynomial functions were necessary for the MD364 (80 m) and DFS2011 (113 m) cores. The surface densities (intercept for the fitting curves) for the MD364 and S79 sites were determined by averaging the pit densities over the top 0.5 m at the respective sites. Because there are no pit data for the DFS2011 site, we employ the surface density at DFS2010, which is the nearest observation site to DFS2011 (2.6 km south of DFS2011). The coefficients for the polynomial functions are described in Fig. 2.
For the DFNW, DFSE and NDFN cores, the permittivities were measured over the top 20 m, thus we used them for the top 20 m without smoothing. For the deeper depths, polynomial functions were fitted to the bulk density data over the whole cores and simply used the fitted curve below 20 m. We employ a second-order polynomial function for the DFNW (43 m) and DFSE (41 m) cores and a fifth-order polynomial function for the NDFN core (142 m). The coefficients for the polynomial functions are described in Fig. 2.
For DF1, DF1997 and DF2 cores, which were drilled at the Dome Fuji station, we constructed a common density profile as follows. We note that available density data from the DF cores (DF1993, 1996, 1997, 1999 and 2001) were similar to each other (Fig. 2). Continuous permittivity data were available for the top 3.47 m on the DF1993 core, and thus we converted it to density and used it without smoothing. For the deeper depths, we fitted polynomial functions to discontinuous permittivity-based density from the DF1993 and DF1999 cores (3.5–112 m) and bulk density data from the DF2001 (10.2–122.2 m) and DF1 (155.1, 180.6, 230.1, 276.3, 316.9, 362.8 and 400.7 m, Takao Kameda, personal communication, 2018) cores. The maximum length of the DF cores (175 m) was too long to fit adequately with a single polynomial function; thus, we divided the depth range into two sections. The upper section (0–122 m) and the lower section (74.6–400.7 m) were fitted with respective fifth-order polynomial functions, and the curves were switched at 108.5 m, where they connected smoothly. The resulting functions are
and
where d is depth in meters. The uncertainty of the DF density profile thus constructed was estimated as the standard deviation of the difference between the DF1993 bulk density data and the fitted curves.
For NDF2013 and S80 cores, we combined the pit densities (2.18 and 2.36 m for NDF2013 and S80, respectively) and the densities converted from the permittivity.
Figure 2l compares the density profiles from eight sites (MD364, DFNW, Dome Fuji, DFS2010, DFSE, NDFN, NDF2018 and S80). The density at a given depth at MD364 is higher than those at the other sites, as expected from the markedly higher accumulation rate (Herron and Langway, 1980). The density profiles of the sites near the Dome Fuji station (Dome Fuji, DFS2010, NDFN and NDF2018) are similar to each other, but a closer inspection shows that the densities at NDFN and NDF2018 are consistently higher than those at Dome Fuji and DFS2010 below ∼50 m, and the depths to reach 830 kg m−3, which is considered as a typical close-off density (Cuffey and Paterson, 2010), are shallower at the former sites than those at the latter sites by ∼5 m.
2.3 Ice core and snow sample measurements for dating
Annual layer counting is not possible for our samples because some annual layers can be eroded due to the low accumulation rate (Kameda et al., 2008). Therefore, we used volcanic signals recorded as near-surface conductance of the direct current (ECM) (Hammer, 1980; Wolff, 2000), high-frequency-limit electrical conductivity (DEP) and non-sea-salt sulfate (), or tritium peaks from the past bomb tests to identify the age horizons. We used published data of the ECM of the DF1993 and DF1 cores (Fujita et al., 2015), concentrations of the DF2001 core (Motizuki et al., 2014), concentrations and tritium contents of the MD732 snow pits (Hoshina et al., 2014), respectively. For other ice cores and snow pit samples, we newly generated the data with the following methods.
2.3.1 DEP
Dielectric profiling, DEP, is a method to measure high-frequency (typically 250 kHz or higher frequency) conductivity to quickly locate positions of volcanic events as acidity spikes in ice cores. The method is given in the literature (Moore and Paren, 1987; Wilhelms et al., 1998). At NIPR, DEP measurements were performed for DF2, DF1997, DFS2010, DFS2011, NDF2018, DFNW, DFSE and NDFN cores. The ice cores were measured every 20 mm. The uncertainties for the depth assignment of the DEP measurement is ±0.02 m.
2.3.2 Ion concentrations
Ion concentrations were measured at NIPR for the MD364, DF2001, NDF2013, S79 and S80 cores and snow pit samples from Dome Fuji, DFS2010, NDF2013, NDF2018, S79 and S80. The ice core samples were decontaminated by shaving off their surfaces by ∼10 % by weight with a pre-cleaned ceramic knife on a clean bench, and placed in particle-free plastic bags. The plastic bags were brought to the clean laboratory at room temperature, and the samples were melted in the bags and analyzed with established procedures (e.g., Goto-Azuma et al., 2019) for the concentrations of Cl−, , , F−, , Na+, , K+, Mg2+ and Ca2+ using ion chromatograph (DX-500 or ICS-5000+, Thermo Fisher Scientific). The detection limits for the and Na+ concentrations are 0.1 and 0.2 µg L−1, respectively, which were sufficient for detecting peaks for the dating. The snow samples, originally collected in clean plastic bottles, were melted at room temperature in the clean room and analyzed for ion concentrations.
All the cores and pit samples were continuously measured along the depth at the following resolutions: 5–25 cm for the MD364 core; 2–5 cm (7.70–85.49 m depth) and 20 cm (0–7.70 and 85.49–122.4 m depth) for the DF2001 core; 5–7 cm for the NDF2013 core; 4–6 cm for the S79 core; 5 cm for the S80 core; 4 cm for the Dome Fuji pit; 3 cm for the NDF2018 pit; and 2 cm for the DFS2010, NDF2013, S79, and S80 pits.
We corrected concentration for the sea salt contribution with a common method by assuming that the source of Na+ is only seawater and that sea salt is always accompanied by Na+:
where 0.25 is the ratio of to Na+ in the seawater (Millero et al., 2008). Average concentrations of are 71.8, 105.8, 112.7, 99.6 and 103.4 µg L−1 for the MD364, DF2001, NDF2013, S79 and S80 cores, respectively, and the standard deviations of background concentration is 17.4, 28.9, 27.0, 70.7 and 46.1 µg L−1 for the MD364, DF2001, NDF2013, S79 and S80 cores, respectively. We identified volcanic peaks larger than the average concentration plus 1σ standard deviation of the background concentration. For the snow samples, mean concentrations are 112.2, 108.7, 112.7, 90.7, and 104.0 µg L−1 for the DFS2010, NDF2013, S79 and S80 pits.
2.3.3 Tritium contents
A peak of tritium content in snow pit and firn core samples in Antarctica provides an age marker at 1966 (Jouzel et al., 1979; Kamiyama et al., 1989; Fourré et al., 2006), which is important for samples from low-accumulation areas where annual layer counting is impossible. Tritium contents of the Dome Fuji and NDF2018 snow pit samples were measured at NIPR and Nagoya University, respectively, with the liquid scintillation method (Kamiyama et al., 1989). The snow samples were distilled, mixed with liquid scintillation cocktail and homogenized. The tritium radioactivity was measured with a low background liquid scintillation counter (LSC-LB3, Hitachi at NIPR, or Quantulus 1220, PerkinElmer at Nagoya University). The minimum detection level is around 7 TU, and the relative uncertainty is less than 5 %. Measured values were corrected for radioactive decay and converted into the data as of the time of sampling (February 2003 for Dome Fuji and January 2018 for NDF2018).
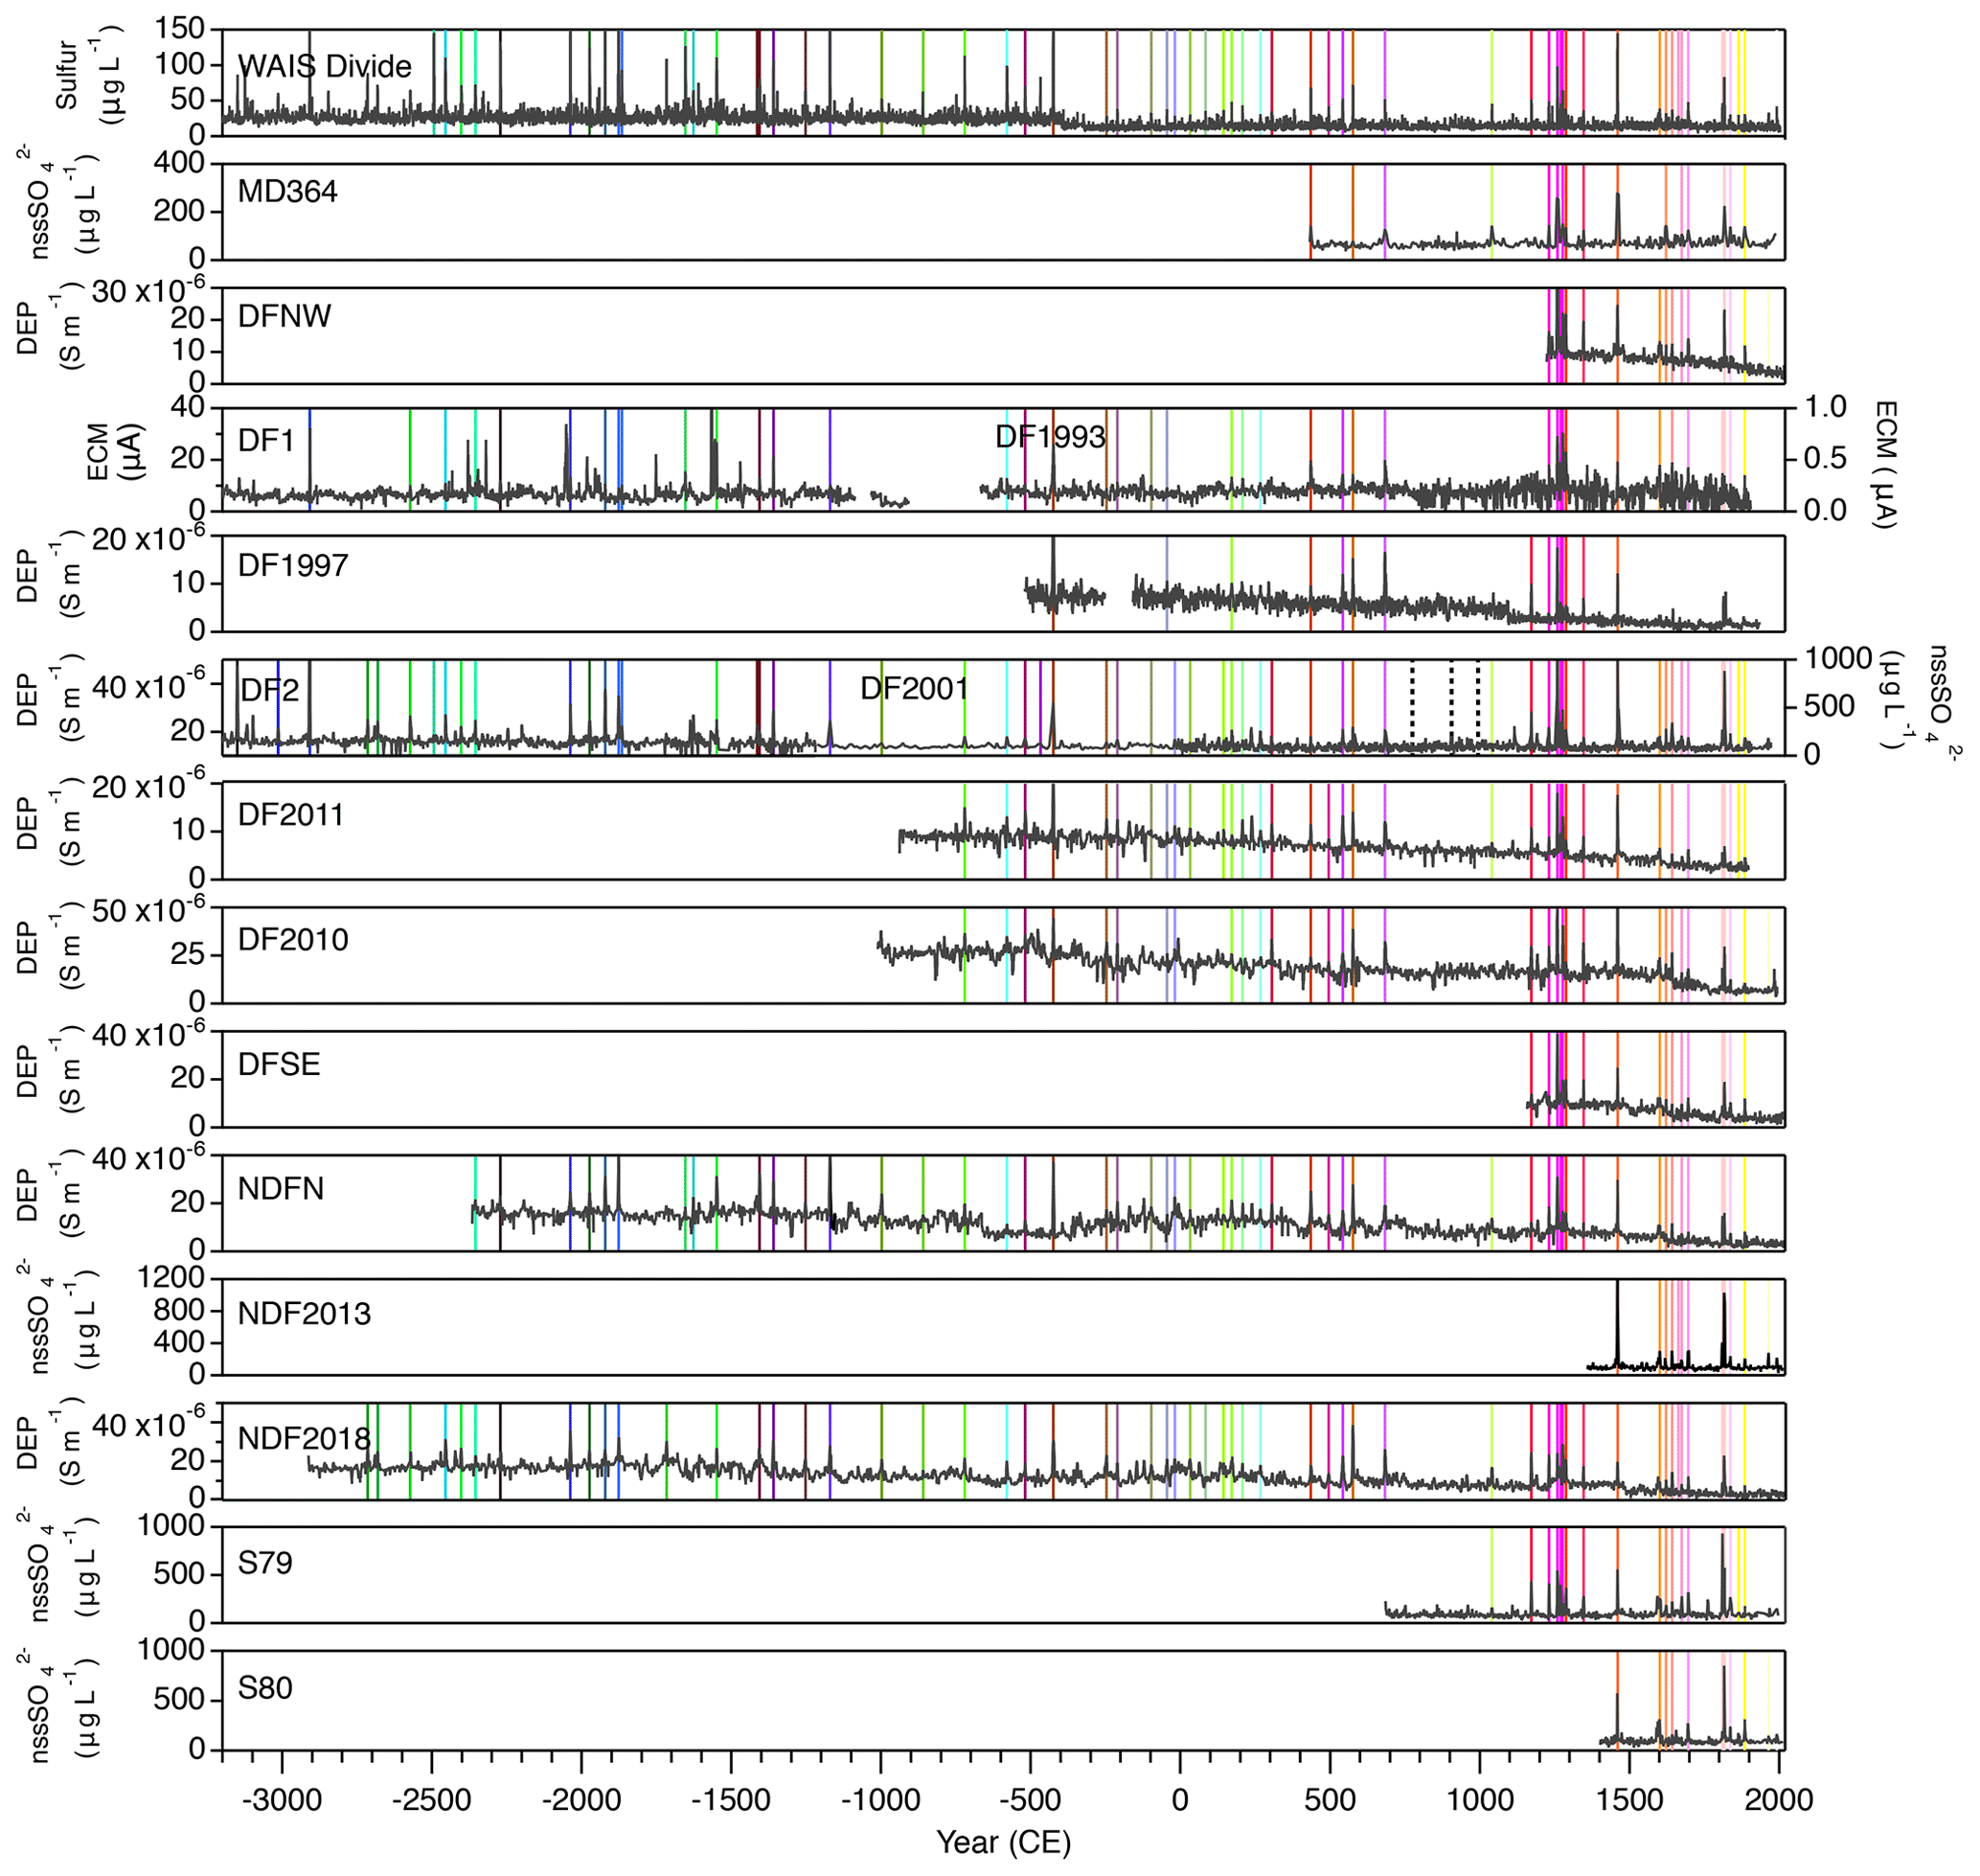
Figure 3DEP, ECM or for our ice cores and sulfur concentration of the WAIS Divide core (Cole-Dai, 2014a, b). Previously published data are for 1900–1 CE for the DF2001 core (right axis) (Motizuki et al., 2014), ECM for 1900 CE–500 BCE for the DF1993 core (left axis), ECM for 900–3200 BCE for the DF1 core (right axis) (Fujita et al., 2015), and DEP for 1200–3200 BCE for the DF2 core (left axis) (Fujita et al., 2015). Other data are previously unpublished (see text). Vertical colored lines indicate volcanic tie points. Three dashed black lines for the DF2001 core indicate additional age tie points from published 10Be–14C matching (Oyabu et al., 2022a). Age scales between the tie points were calculated with cubic spline interpolation. See Fig. B1 for the same data plotted against depth.
2.4 Age determination of layers in the ice cores and snow pits
The depth of a volcanic layer is generally defined at the maximum value of high-resolution data of DEP, ECM or (Hofstede et al., 2004), with depth uncertainty defined by the data resolution. The volcanic signals of low-latitude eruptions are recorded in Antarctic inland snow with a typical lag of 1 to 2 years due to the long-distance transport (Hammer et al., 1980; Cole-Dai and Mosley-Thompson, 1999; Cole-Dai et al., 2000, 2009; Gao et al., 2006). This depositional lag is not constant and may generate additional uncertainty for the dating. To avoid the uncertainty of depositional lag, we take advantage of published sulfur data of the WAIS Divide ice core (WDC) with accurate layer-counting chronology (Sigl et al., 2014, 2016) which we can use to precisely synchronize the volcanic signals in our shallow cores and pit samples. We assumed no depositional lag between WAIS Divide and Dome Fuji. Based on the synchronization of DF1993 and DF1 cores to WDC by Oyabu et al. (2022a), we identified the eruptions in the other shallow cores by inter-comparisons of their volcanic signals. We only employed the peaks found in two or more of our ice cores. In total, we identified 59 volcanic layers for the dating between 1992 CE and 3151 BCE (Figs. 3 and B1). We also confirmed the consistency of our dating with previous studies that used the same volcanic layers (back to 1260 CE for the DF2001 core by Igarashi et al., 2011; back to ∼100 CE, for the DFS2010 core by Motizuki et al., 2014). We found several common peaks in our ice cores that are not recorded in the WDC, which were not used for the dating because their depositional age could not be accurately known. We note that a common 1 cm thick tephra layer was found in the DF2, NDF and NDFN cores at 133.51, 118.66 and 122.18 m, corresponding to 1613±5, 1613±5 and 1611±4 BCE, respectively, according to their chronologies (Sect. 2.5). The tephra layer is not found in WDC, but it is probably the same as those found in the Dome C, Vostok and South Pole data at 132.6, 103.14 and 303.44 m, respectively (Palais et al., 1987; Narcisi et al., 2005), dated around 1550–1650 BCE (on Vostok GT4 and EDC2 chronologies, Narcisi et al., 2005). While the synchronization using tephra layers is generally difficult because of their sparseness and large signals from local eruptions, this tephra layer is easily visible in the field, and the age of the layer determined here (1613 BCE or 3563 yr BP) may be useful as an age constraint for other shallow ice cores from EAP.
The uncertainty in duration between two neighboring volcanic tie points, which is required for the error estimate of SMB, consists of the following components: (1) depth of ECM or DEP measurement (±0.01 m as 1σ for each volcanic layer, corresponding to 0.15–0.35 years), (2) identification of peak positions (±0.01 m as 1σ for each volcanic layer, corresponding to 0.15–0.35 years), and (3) duration between the two horizons originating from the age uncertainty of WD2014 (<0.75 years as 1σ) (Sigl et al., 2016). The overall uncertainties for the shallow cores are smaller than 1 year (1σ).
For the relatively long interval between 700 and 1000 CE without volcanic tie points, we employed three published age tie points for the DF2001 core based on the matching between the ice core 10Be and tree ring 14C (Horiuchi et al., 2008; Miyake et al., 2015, 2019; Oyabu et al., 2022a). The error in the durations between the tie points are also shorter than 1 year (1σ).
For the snow pit data, we used the sulfate peaks for the Pinatubo eruption (deposition in 1992) for all snow pits except for Dome Fuji; sulfate peaks for the Agung eruption (deposition in 1964); and Tritium peaks (deposition in 1966, Jouzel et al., 1979; Fourré et al., 2006) for MD732, Dome Fuji, and NDF2018 snow pits (Fig. 4). We do not use the Pinatubo eruption for the age tie point in the Dome Fuji pit data because there are three possible peaks for the eruption within ∼0.5 m interval (around 1.0 m), making the precise depth–age assignment impossible. Unidentified regional eruptions may have left impurity peaks near the Pinatubo depth, as have been found elsewhere in East Antarctica (Cole-Dai et al., 1997; Plummer et al., 2012; Crockart et al., 2021). The error of the duration between the tie points is estimated to be 0.5 year and that for the peak depth is estimated to be 0.1 m (corresponding to ∼1 year); thus, the overall uncertainty is ∼1.1 year (1σ).
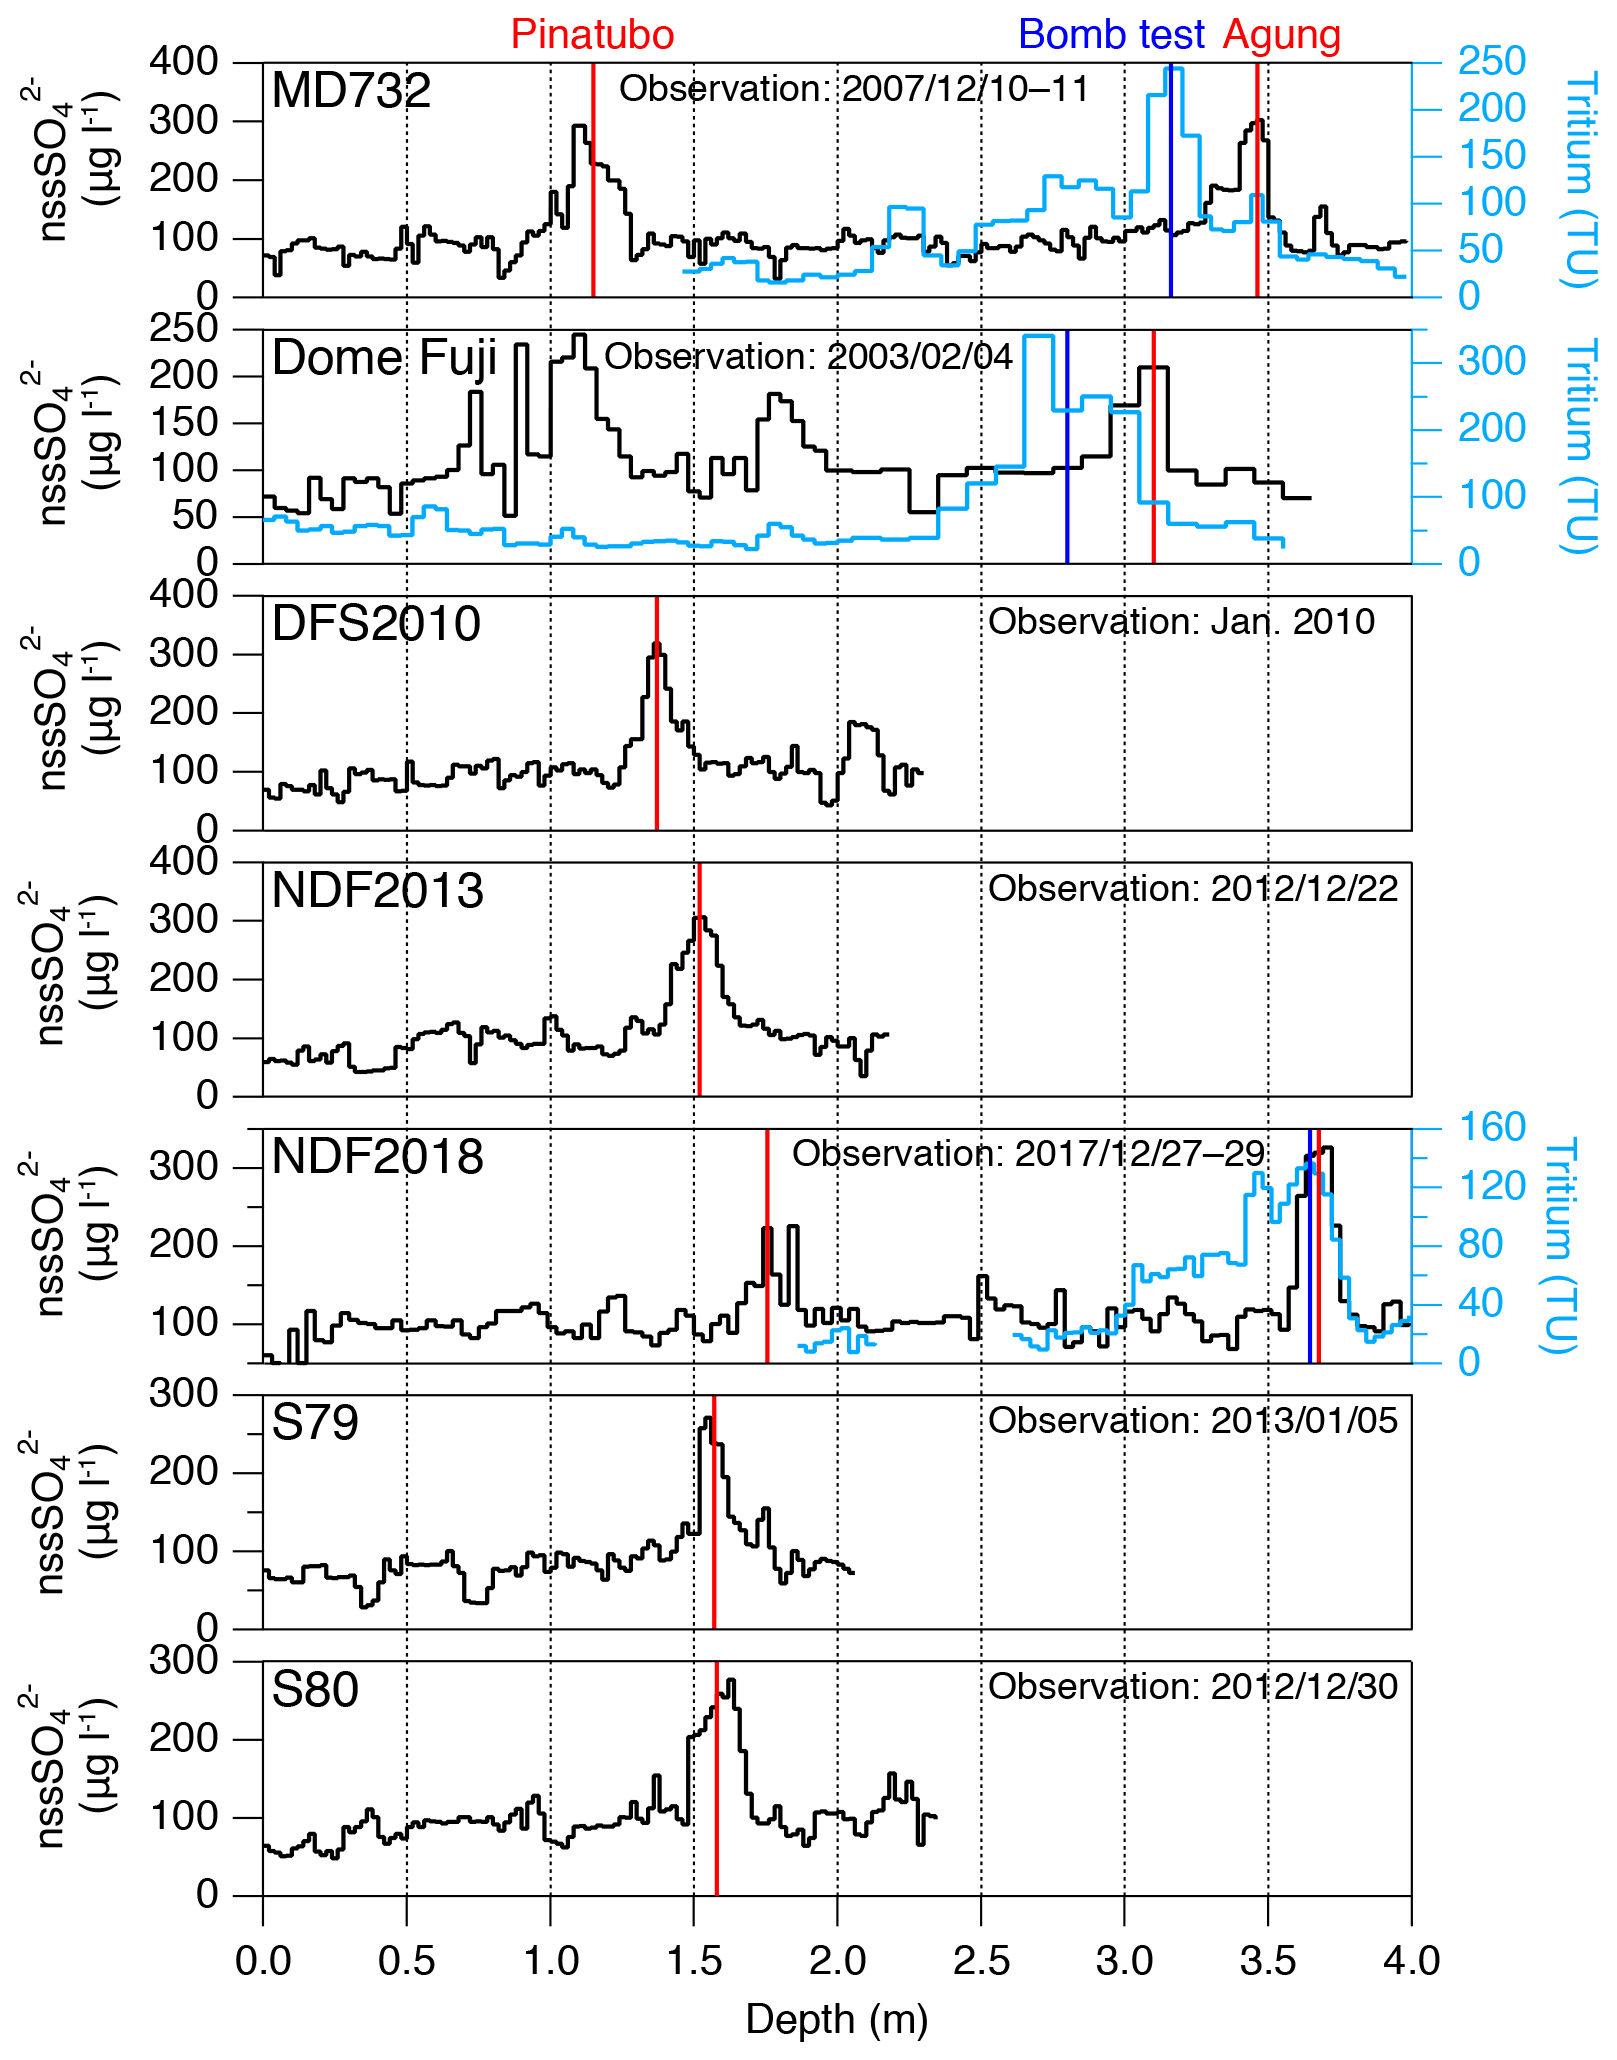
Figure 4The concentration and tritium content for snow pits. The data for MD732 are from Hoshina et al. (2014). Vertical bars represent the depths of volcanic eruptions (red) and the past bomb test (blue) for age controls.
2.5 Calculation of accumulation rate and its uncertainty
Mean accumulation rates between the dated horizons are calculated by dividing the depth difference between the age markers, corrected for firn density and layer thinning (due to ice flow), by the time span. For the thinning function, we used a published model result for the Dome Fuji core (Parrenin et al., 2007) and applied it to other cores using normalized ice-equivalent depth between the surface and bottom of the ice sheet (Fig. 5). We assumed that the uncertainty of the thinning function linearly increases with depth at a rate of 0.01 % m−1 (1σ), giving reasonable uncertainty including the assumption of linear scaling of the Dome Fuji thinning function to other sites (note that the difference between the thinning function between DF and NDF is about 1.5 % at 150 m). The effect of the thinning correction on the resulting accumulation rate is smaller than the overall uncertainty (see below) for the depths shallower than 40 m, roughly corresponding to the last millennium, while it is highly important for the deepest part (4–5 ka BP) of the DF, NDF and NDFN cores (about 3 times the overall uncertainty) to discuss the long-term variations of SMB. The overall uncertainty of SMB for a given core and interval was estimated by using a Monte Carlo approach, in which the density profile, age of horizons and thinning functions were randomly varied 1000 times according to the respective error estimates to calculate the probability distribution of accumulation rate.

Figure 5Thinning function with 1σ uncertainty. The data for Dome Fuji is from Parrenin et al. (2007).
For DF1, DF2, DFS2011, DFS2010, NDFN and NDF2018 cores covering more than 2 kyr, we calculated the average accumulation rates over the periods of 1–1850 CE and 2000 BCE–1850 CE. Because there are no volcanic tie points exactly at 1 CE and 2000 BCE, we interpolated the volcanic depth–age relationships for the DF1, DF2, NDF, NDFN, DFS2010 and DFS2011 cores using a probabilistic dating model Paleochrono (Parrenin et al., 2021) to derive the depths for the exact years in the cores. The model estimates the age scale of a core by optimizing the prior estimates of accumulation rate (A) and thinning (τ) as functions of depth to reproduce the chronological constraints. We used the accumulation rate and thinning function and their uncertainties from the method described above as the prior A and τ. For the age constraints, we used the age differences between volcanic layers (ice age intervals) constructed from volcanic synchronization. The uncertainty of the ice age interval is estimated to be 0.1–1.2 years (1 standard deviation) from the following components: (1) uncertainty in the layer-counted WD2014 age scale (0.1–0.9 years for the intervals, larger for the deeper depth) and (2) depth uncertainty in matching our cores to WDC (<1 year, associated with data resolution).
3.1 SMB histories from individual cores and snow pits
Figure 6 shows the time series of accumulation rates of all 13 ice cores from nine sites. The longest record covers 5152±10 years (2001 CE–3151 BCE, DF2 core). The mean accumulation rate over the last 5 kyr is 26.2±1.0 kg m−2 yr−1 at the Dome Fuji station (mean of DF1 and DF2). A previously published estimate of the accumulation rate at the Dome Fuji station is 25 and 25.5 kg m−2 yr−1 over the period 1260–1993 CE and 1260–2001 CE, based on the DF1993 (shallow part of the DF1 core, Watanabe et al., 1997a) and DF2001 (shallow part of the DF2 core, Igarashi et al., 2011), respectively, with fewer age control points. They agree with our result for the same core and period (24.7±0.1 and 25.5±0.1 kg m−2 yr−1 for DF1993 and DF2001, respectively).
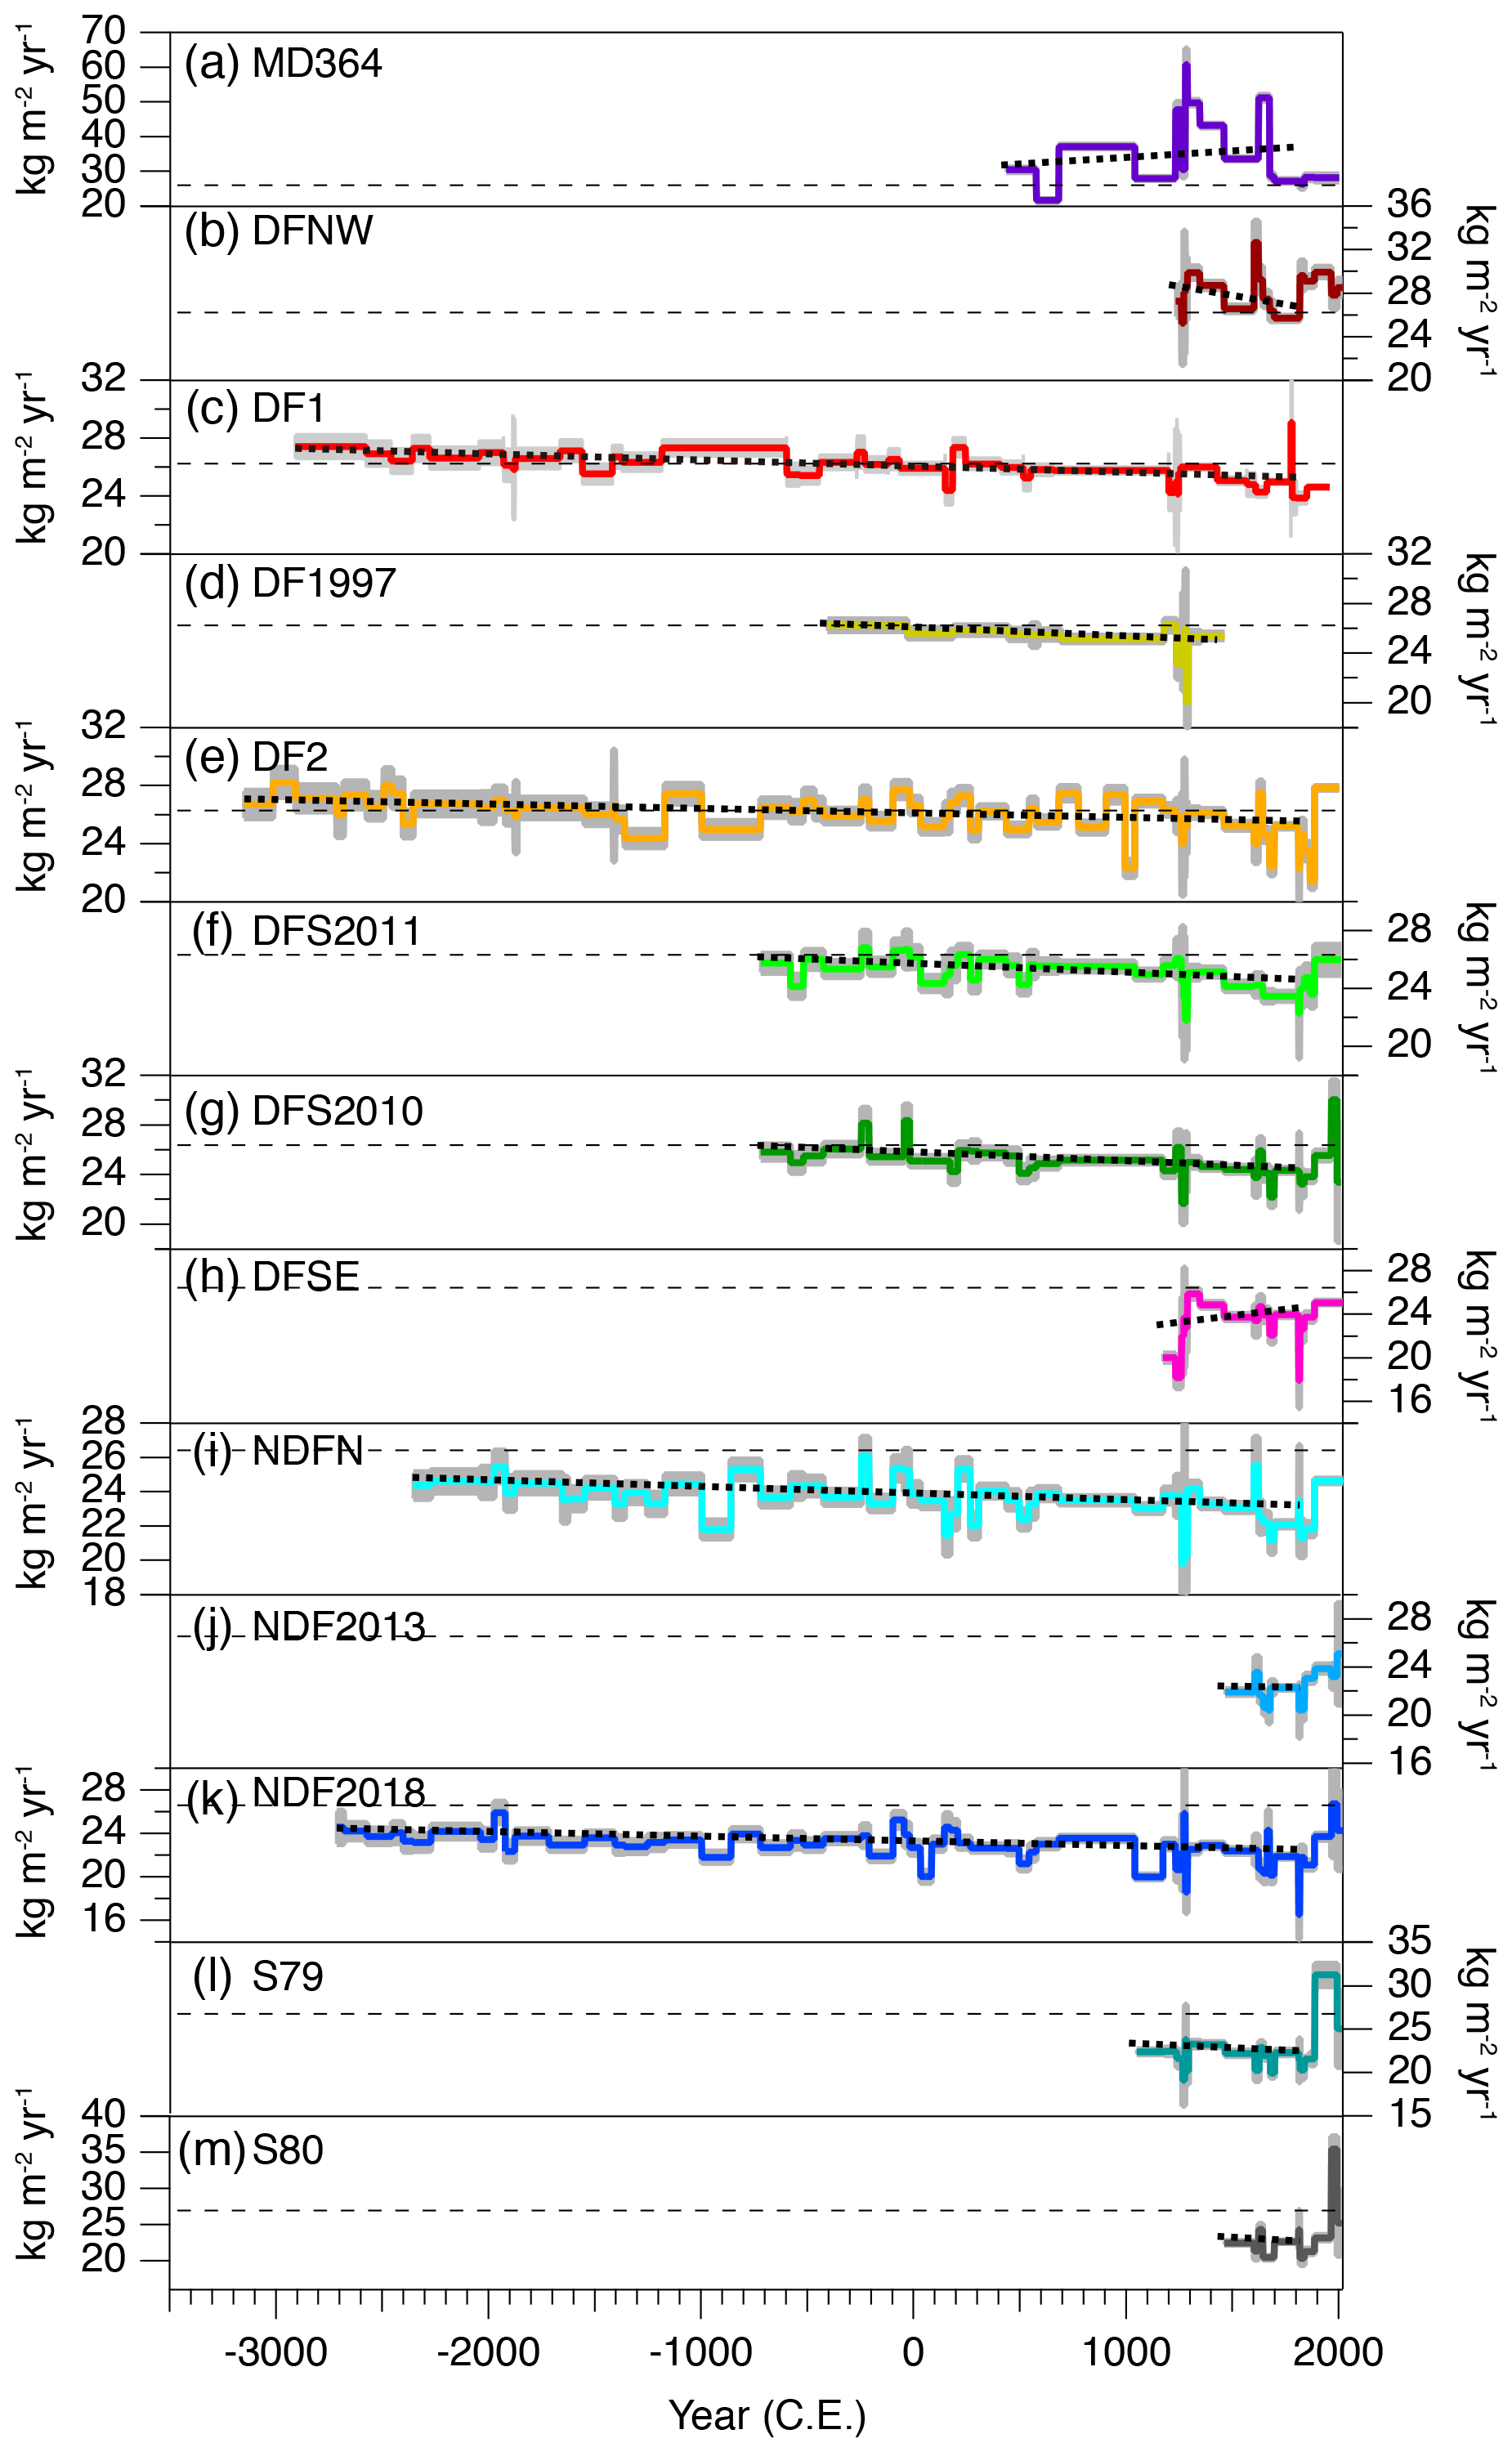
Figure 6Accumulation rates around Dome Fuji and other high-elevation sites in Dronning Maud Land reconstructed from shallow ice cores and snow pits. The horizontal dashed black line in each panel indicates the average value at the Dome Fuji station over the last 5 kyr (26.2 kg m−2 yr−1). Grey shading indicates the estimated uncertainty (2σ). The dotted line indicates a statistically significant long-term trend from the bottom year to 1850 CE (to 1461 CE for the DF1997). Slope values are summarized in Table 3.
For the sites within 100 km of the Dome Fuji station, the accumulation rates generally range from ∼20 to 30 kg m−2 yr−1. We note that the variability (periodicity and amplitude) of each record is determined not only by the natural variability but also by the number of age tie points. For example, the DF2 data show higher centennial-scale variability than the DF1 data because of more tie points. We also note that at around 1000 BCE the DF1 tie points are scarce and the DF1 accumulation rate is larger than the DF2 value on average over ∼600 years. The reason is not clear, but it might suggest possible errors in depth assignments of the ice cores (we note that it is just below the firn–ice transition where the shallow ice core data are connected to the deep ice-core data for the DF cores). The discrepancy for this part does not affect the following discussion and conclusion about the long-term trends and differences between the sites. In general, the accumulation rate is larger to the north and smaller to the south of the Dome Fuji station. The mean accumulation rate and its variability at MD364 (range: ∼20–60 kg m−2 yr−1) are much larger than those in the Dome Fuji area. The site is located at the altitude of ∼3350 m, lower by ∼450 m than at Dome Fuji station, on the north side of the topographic ridge, and thus the mean precipitation is expected to be larger than at Dome Fuji. The larger variability in the depositional environment may be expected from the horizontal ice flow (4.1 m yr−1) over rough bedrock topography, creating temporal variations in local surface topography (e.g., surface slope and convex or concave curvatures) (Fujita et al., 2002; Kahle et al., 2021) or from the variable wind direction for deposition in combination with surface topography (Urbini et al., 2008).
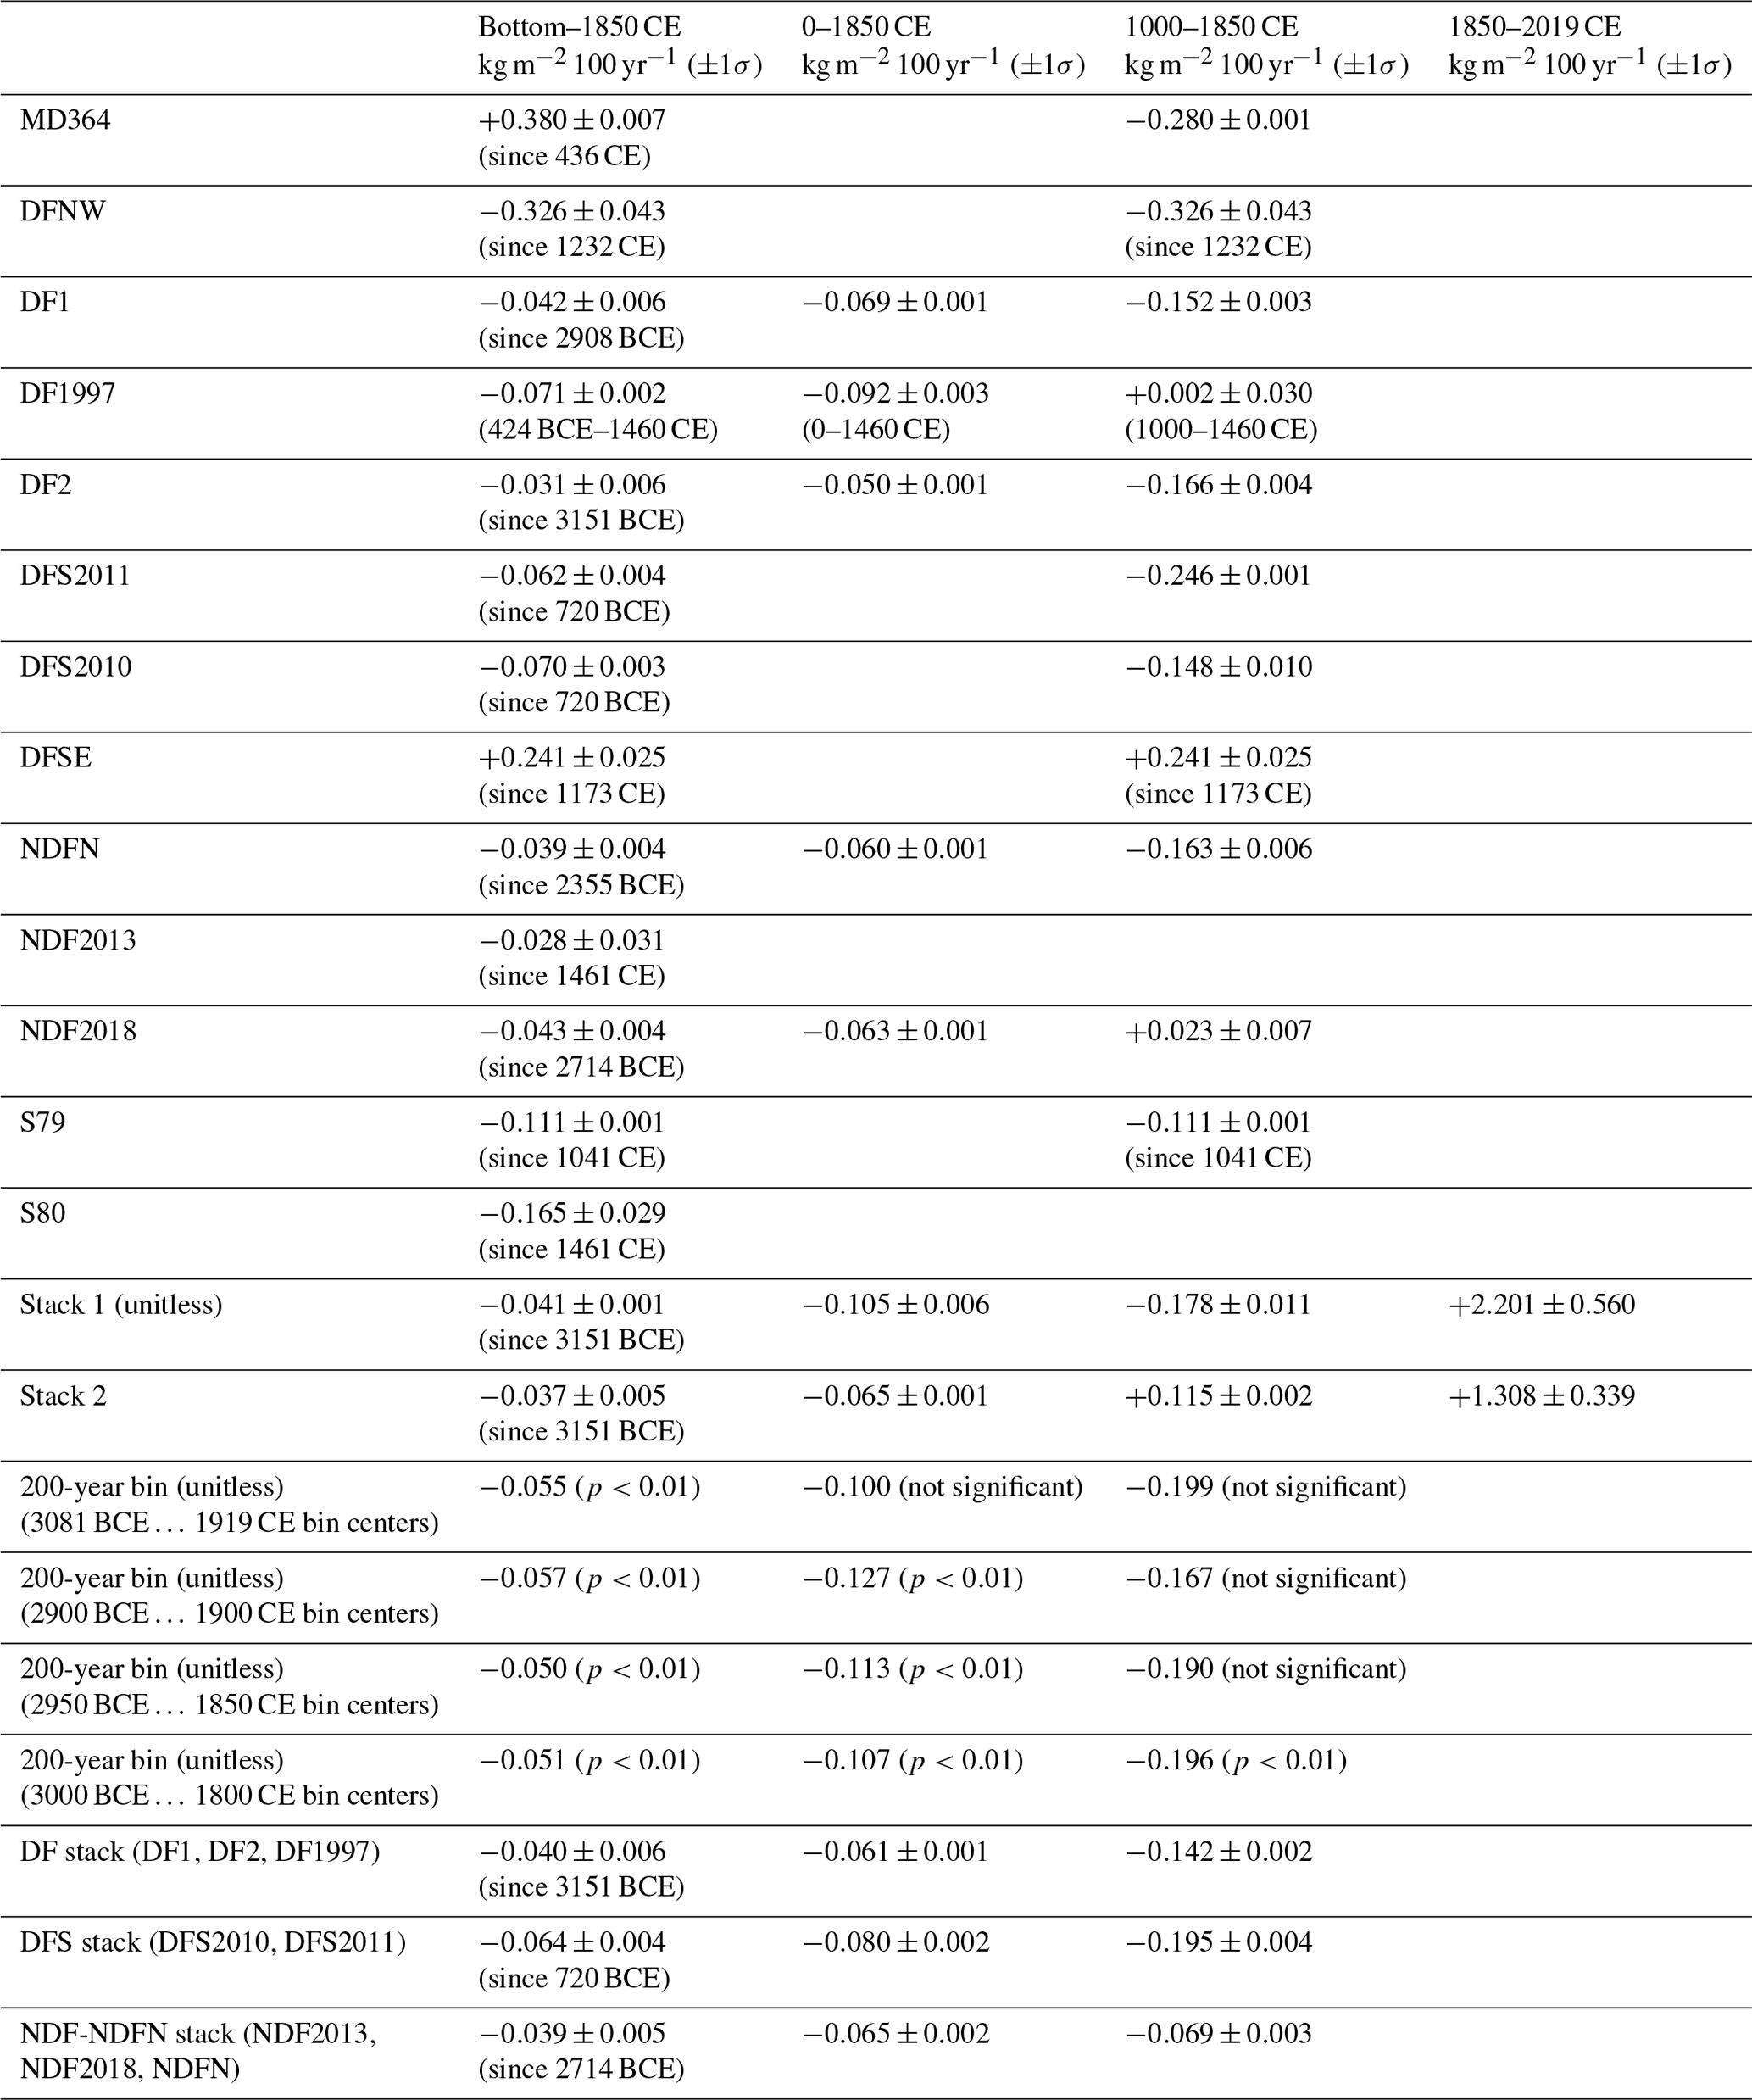
For all the individual SMB time series of six cores (DF1, DF2, DFS2010, DFS2011, NDF2018 and NDFN) covering more than 2000 years, we find clear decreasing trends at the rates from −0.05 to −0.09 kg m−2 per century (Fig. 6, Table 3). In addition, there appears to be a significant increasing trend for the last 200 years for most cores. The increasing trend in the last 200 years is not observed at DF1 (drilled in 1993), possibly due to the lack the record after 1993, when the accumulation rate might have significantly increased, or the depth assignment might be imprecise for the shallowest part of the core. The increasing trend is also not observed for MD364 with large temporal variabilities (see above).
To examine the spatial differences in accumulation rate in the inland plateau region around Dome Fuji, mean accumulation rates over fixed time intervals were calculated for each core. For the averaging periods, we chose (1) 1461–1816 CE (all cores), (2) 1–1850 CE (DF1, DF2, DFS2010, DFS2011, NDFN and NDF2018 cores), and (3) 2000 BCE–1 CE (DF1, DF2, NDFN and NDF2018 cores) (Fig. 7) for the following climatological reasons.
-
We chose 1461–1816 CE because it is the most accurately constrained period by the volcanic years common for all the studied ice cores and also a good representation of the preindustrial late Holocene for averaging SMB without decadal noise.
-
We chose 1–1850 CE because 1 CE is the start year of the “PAGES 2k network” datasets, which is connected to the Paleoclimate Modelling Intercomparison Project (PMIP) for providing the baseline information about natural climate variability (e.g., Martrat et al., 2019), while 1850 CE is chosen for investigating the average preindustrial SMB within the PAGES 2k framework.
-
We chose 2000 BCE–1 CE to compare the averages with those in the recent 2k period for the individual sites and also to examine the consistency of the spatial gradient of SMB over the multi-millennial timescales.
For 1461–1816 CE, the mean accumulation rates south of the Dome Fuji station (NDFN, NDF2013, NDF2018, S79 and S80), i.e., the inland side of the ice divides (Fig. 1), are generally lower than at Dome Fuji (DF1, DF2, DF1997, DFS2011 and DFS2010). On the other hand, the mean accumulation rates north of the Dome Fuji station (MD364 and DFNW) are higher than at Dome Fuji. For example, the accumulation rates at NDFN and NDF are ∼9 % and ∼13 % lower, while that at DFNW is ∼8 % higher than at Dome Fuji. We find small but significant differences between the DF and DFS sites (∼10 km apart) and between the NDFN and NDF sites (∼5 km apart). These spatial differences are qualitatively consistent with previous studies that concluded that the spatial distribution of SMB in the DML region depends on the elevation, latitude and geographical location of the sites relative to the ice divides (Fujita et al., 2011; Van Liefferinge et al., 2021).
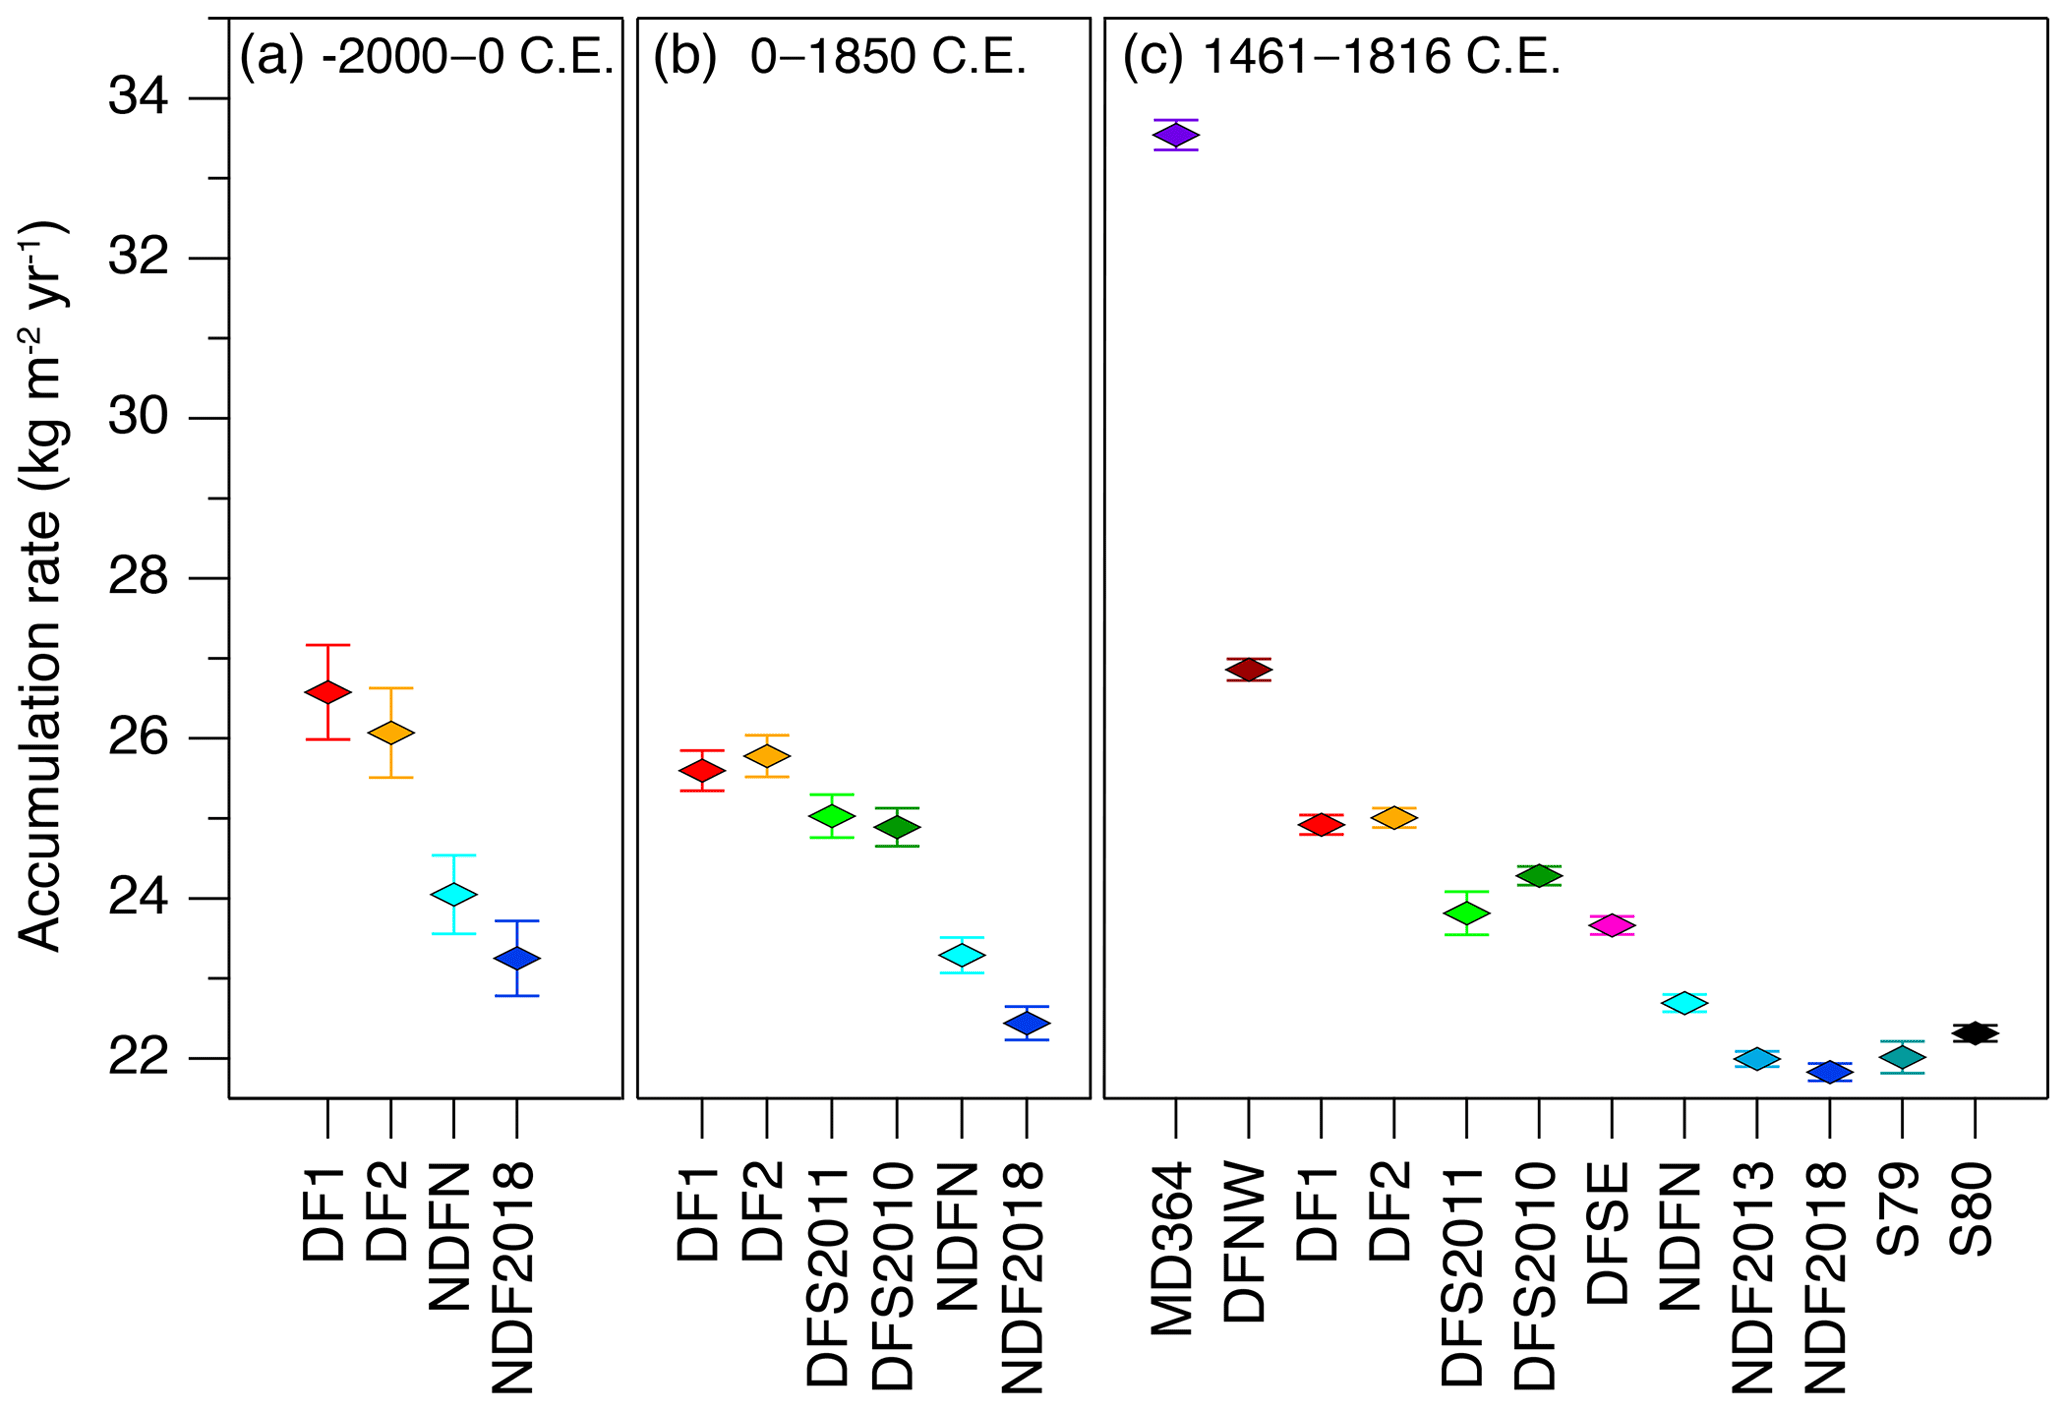
Figure 7Mean accumulation rate over three periods: (a) 2000 BCE–1 CE, (b) 1–1850 CE, and (c) 1461–1816 CE. Error bars represent the 2σ uncertainty of the mean accumulation rate over the respective periods (combined uncertainties in age, density and thinning).
For 1–1850 CE (Fig. 7b), the order of SMB of the DF, DFS, NDFN and NDF sites (from the largest to smallest) is consistent with those for 1461–1816 CE (Fig. 7c). The ratios of SMB at NDFN and NDF sites to that at DF are also similar for all three periods (Fig. 7a–c), suggesting that the relationships of SMB between the sites on multi-centennial or longer timescales have been stable. The mean SMB at the DF, NDFN and NDF sites for the period 2000 BCE–1 CE (Fig. 7a) are slightly larger than those for the period 1–1850 CE and significantly larger than those for the period 1461–1816 CE.

Figure 8Composites of accumulation rates over the last 5000 years after (a) normalizing using both the mean and standard deviation of each core (Stack 1) and (b) normalizing only using the mean of each core near Dome Fuji (Stack 2). (c) The number of records that contribute to the composite. See Sect. 3.2 for details of stacking methods.
Table 4Accumulation rate for the last few decades from snow pit data.
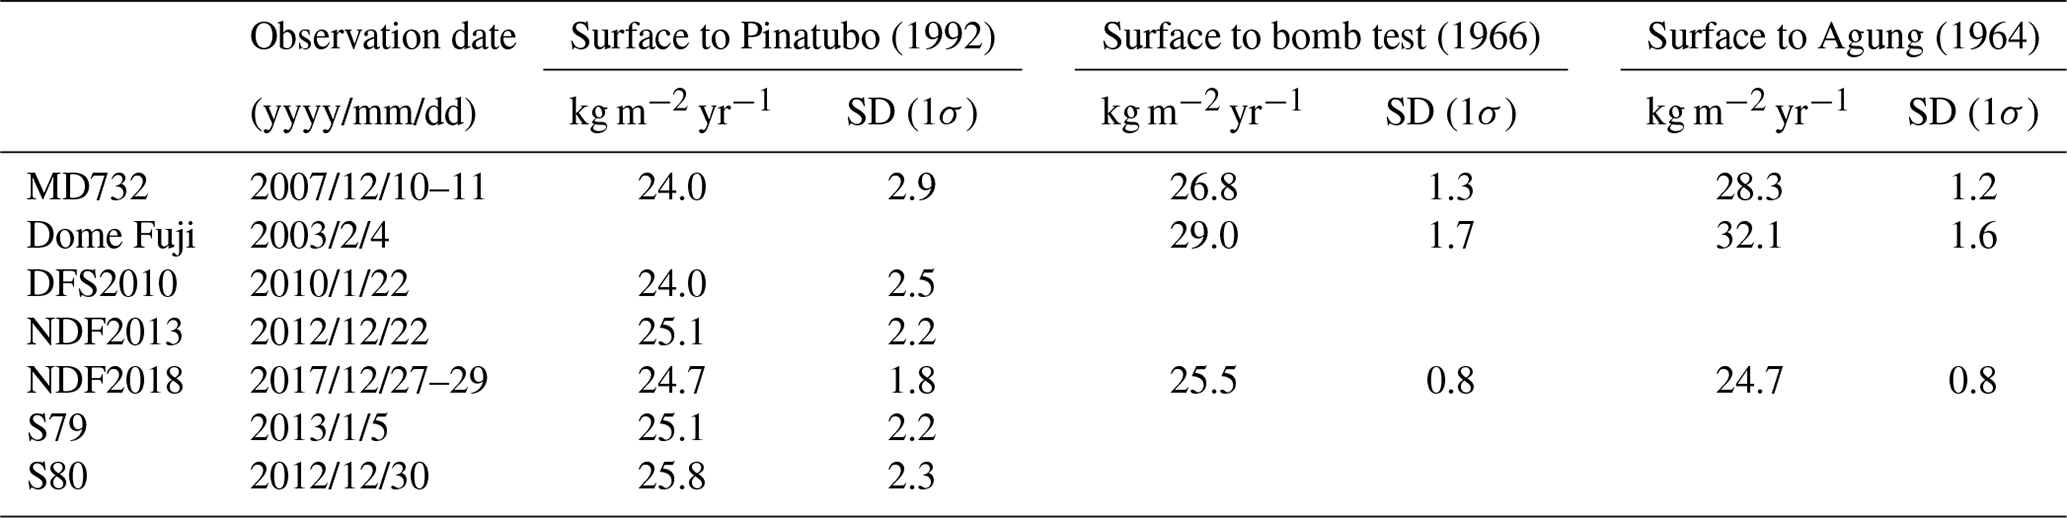
The recent accumulation rates estimated from snow pit observations are shown in Table 4. The average accumulation rate of all pit data since 1992 CE is 24.8±1.0 kg m−2 yr−1, which is in general agreement with previously reported values over similar periods from a pit study (25.6 kg m−2 yr−1 for 1992–2007 CE, Hoshina et al., 2014) and a snow stake study (27.3±1.5 kg m−2 yr−1 for 1995–2006 CE, Kameda et al., 2008). However, there are no consistent spatial gradients relative to the topographic ridge (i.e., less accumulation on the inland side of the ridge) for the average values since 1992 CE as found for the long-term reconstructions from the ice cores. The large variability in density near the surface and redistribution of surface snow (intermittent removal, Kameda et al., 2008) may introduce relatively large uncertainty in the estimates. On the other hand, the mean accumulation rates at MD732 (close to the DF station) since 1966 CE and 1964 CE are significantly larger than those at NDF, which is consistent with the spatial gradient found from the ice cores. The accumulation rates at MD732 and NDF since 1964 CE are significantly larger than the average values over the last 4 kyr and comparable to the largest values about 5 kyr ago. Although precise comparisons may be difficult because of the different averaging periods (pit and ice core records average about ∼50 years and a few centuries, respectively), the accumulation rate around Dome Fuji in the last few decades appears to be high in the long-term perspective.
3.2 Stacked record
To robustly estimate the trends and variability of SMB in the Dome Fuji area, we stack the reconstructed SMB from the individual cores (Fig. 8). We find that the modern SMB values at the study sites are within ±10 % of that at Dome Fuji, and it is not known if the variability of SMB is a function of its mean value. Thus, we stacked the records in two methods, with or without normalizing the variability. We excluded the DF1997 core from the stacking because it lacks reliable SMB reconstruction for the last ∼550 years.
In the first stacking method (Stack 1), each of the 12 SMB time series from nine sites is normalized to its average and 1 standard deviation over the period 1461–1816 CE, and 12 records are simply averaged. The stacked record is smoothed with a 71-year moving average to reduce short-term noise. In the second stacking method (Stack 2), each of the nine SMB time series from within 100 km of the Dome Fuji are normalized to their average between 1461 CE and 1816 CE and smoothed with a 31-year moving average. The smoothed records are averaged, added by the average SMB of the nine sites (23.90 kg m−2 yr−1 for 1461–1816 CE) and smoothed with a 71-year moving average. We exclude S79, S80 and MD364 records, which are located more than 100 km away from the Dome Fuji station. The advantage of this method is to permit a quantitative reconstruction, and it is necessary to exclude MD364 because its average and variability are significantly larger than those near Dome Fuji. The S79 and S80 have similar accumulation rates to Dome Fuji, but their locations are clustered in one direction relative to the dome (Fig. 1). The uncertainties of Stack 1 and Stack 2 were estimated by a Monte Carlo approach, in which the SMB value of each core in each age segment (between the age control points) was randomly varied 1000 times according to the error estimate and stacked. The uncertainties in the long-term trends of Stack 1 and Stack 2 were also estimated as the standard deviation of the slope of regression lines to the same 1000 stacked records by the Monte Carlo method.
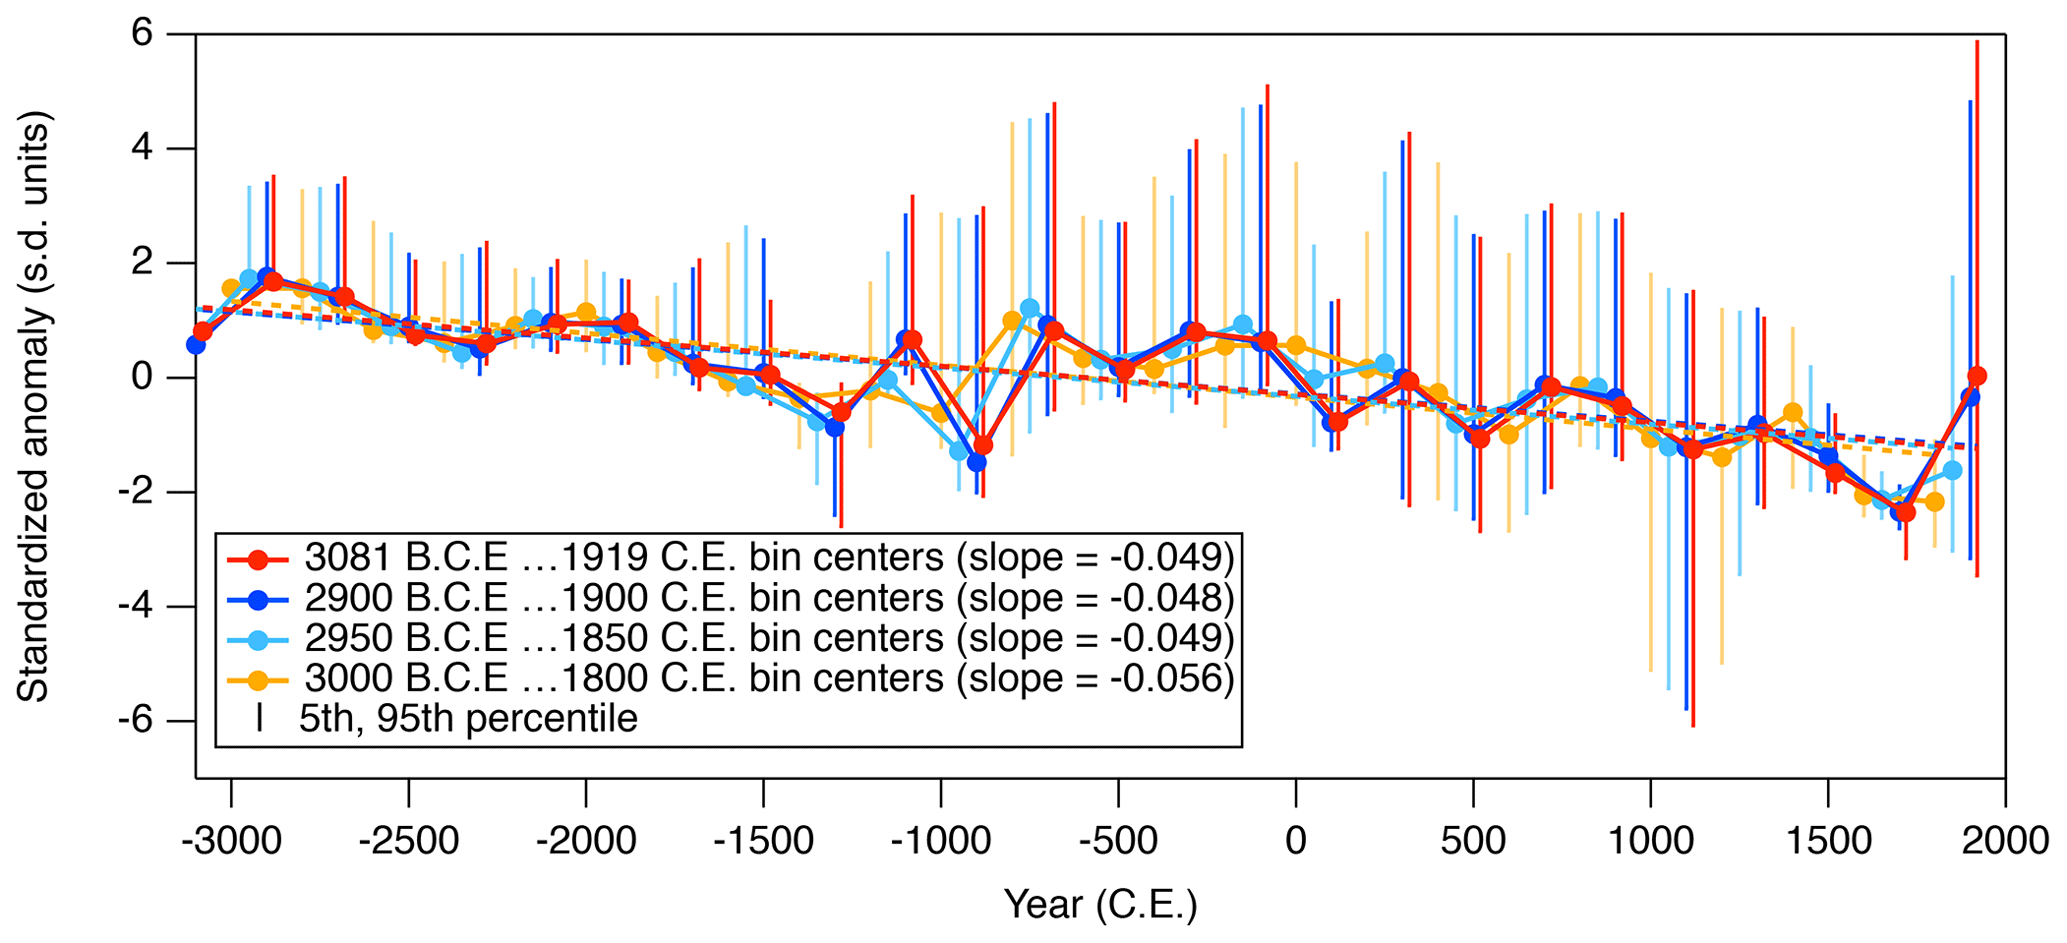
Figure 9SMB composites made by connecting medians in consecutive 200-year bins. Different colors indicate different ranges of bins (offset by ∼50 years). The vertical bar indicates the 5th–95th percentile. The dotted line indicates a statistically significant long-term trend.
The mean SMB of Stack 2 is 25.2±0.8 kg m−2 yr−1 over the entire period. The centennial-scale variabilities in both stacks are very similar to each other (Fig. 8a and b), although the amounts of stacked data are different between the two methods for the last 1500 years. There are general long-term declining trends in both stacked records over the entire period (∼5000 years), with a minimum accumulation rate around 1700–1800 CE and the greatest increase during the last 150 years.
Both stacked records show statistically significant decreasing trends over the most recent ∼5000 years (1850 CE–3151 BCE), with a slope of kg m−2 per century for Stack 2. We analyze the robustness of the long-term trend following the method of McGregor et al. (2015) by calculating the average accumulation rate over 200-year intervals (bins) for each core, taking the median value in each bin, making the composite record by connecting the median values and drawing the regression line (Fig. 9). We also shift the position of the bin in 50-year increments to assess its influence on the regression slope (McGregor et al., 2015). All binned records show similar decreasing trends over the 5000 years, indicating that the decreasing accumulation rate is a robust feature around Dome Fuji. The slopes from the binned reconstructions are smaller than that of Stack 1, probably because the binning method reconstructs a lower accumulation rate from ∼1000 BCE to ∼1000 CE than Stack 1 by taking the median values rather than the average values. The long-term trends for the periods of 1 to 1850 CE (Table 3) for Stack 1 and Stack 2, as well as all the binned records, also show negative trends (Figs. 8 and 9).
We also made three local stacks using the subsets of data from sites close to each other as follows: “DF stack” with DF1, DF2, and DF1997 cores; “DFS stack” with DFS2010 and DFS2011 cores; and “NDF-NDFN stack” with NDFN, NDF2013, and NDF2018 cores (Fig. 10). For the last 2700 years, the local SMB stacks show systematic differences (DF > DFS > NDF-NDFN) with similar centennial-scale variations. We also find significant decreasing trends in all local stacks, with the slope of the DFS stack being slightly steeper than the other two stacks. The difference in the trends might be related to possible long-term migration of the dome summit position in response to glacial–interglacial changes in SMB and grounding line position (Saito, 2002; Parrenin et al., 2016). The dome migration could also possibly be a consequence of spatial and temporal variations in SMB, which may be influenced by meridional midlatitude atmospheric variability and precipitation events (Massom et al., 2004; Scarchilli et al., 2011; Turner et al., 2019), as has been discussed for Dome C and Talos Dome (Urbini et al., 2008).

Figure 10SMB composites for the DF, DFS and NDF regions. The DF stack was calculated as a simple average of the SMB data of the DF1, DF2 and DF1997 cores after smoothing each record with a 31-year moving average (dotted line). The solid line indicates the SMB stack with a 71-year moving average. The DFS and NDF stacks were calculated in the same manner as the DF stack using DFS2010 and DFS2011 for the DFS stack and NDF2013, NDF2018 and NDFN for the NDF stack. The dashed line indicates a statistically significant trend for 1–1850 CE.
4.1 Multi-millennial trend
We first discuss the robustness of the long-term trends. The long-term decreasing trend in the DF area is largely determined by the six ice cores going back by more than 2 kyr (DF1, DF2, DFS2011, DFS2010, NDFN and NDF2018). As the depths of these cores are more than 100 m, the corrections for layer thinning due to ice flow impact the reconstructed SMB records. Because the thinning is weakly constrained for the shallow cores (except for the DF core with good age control from the deeper depths), we investigate the possibility of reversing the sign of trend due to errors in thinning. In particular, we assess whether the negative accumulation rate trend is possibly an artifact of thinning correction (Sect. 2.5) because the correction increases the estimated mass (hence SMB) at deeper depths. Here, we calculate the SMB under the (unrealistic) assumption of no layer thinning for the six cores. As shown in Fig. 11, all cores exhibit a significant negative accumulation rate trend even without the thinning correction. Therefore, we conclude that the multi-millennial decreasing trend in accumulation is a robust feature in the Dome Fuji area.
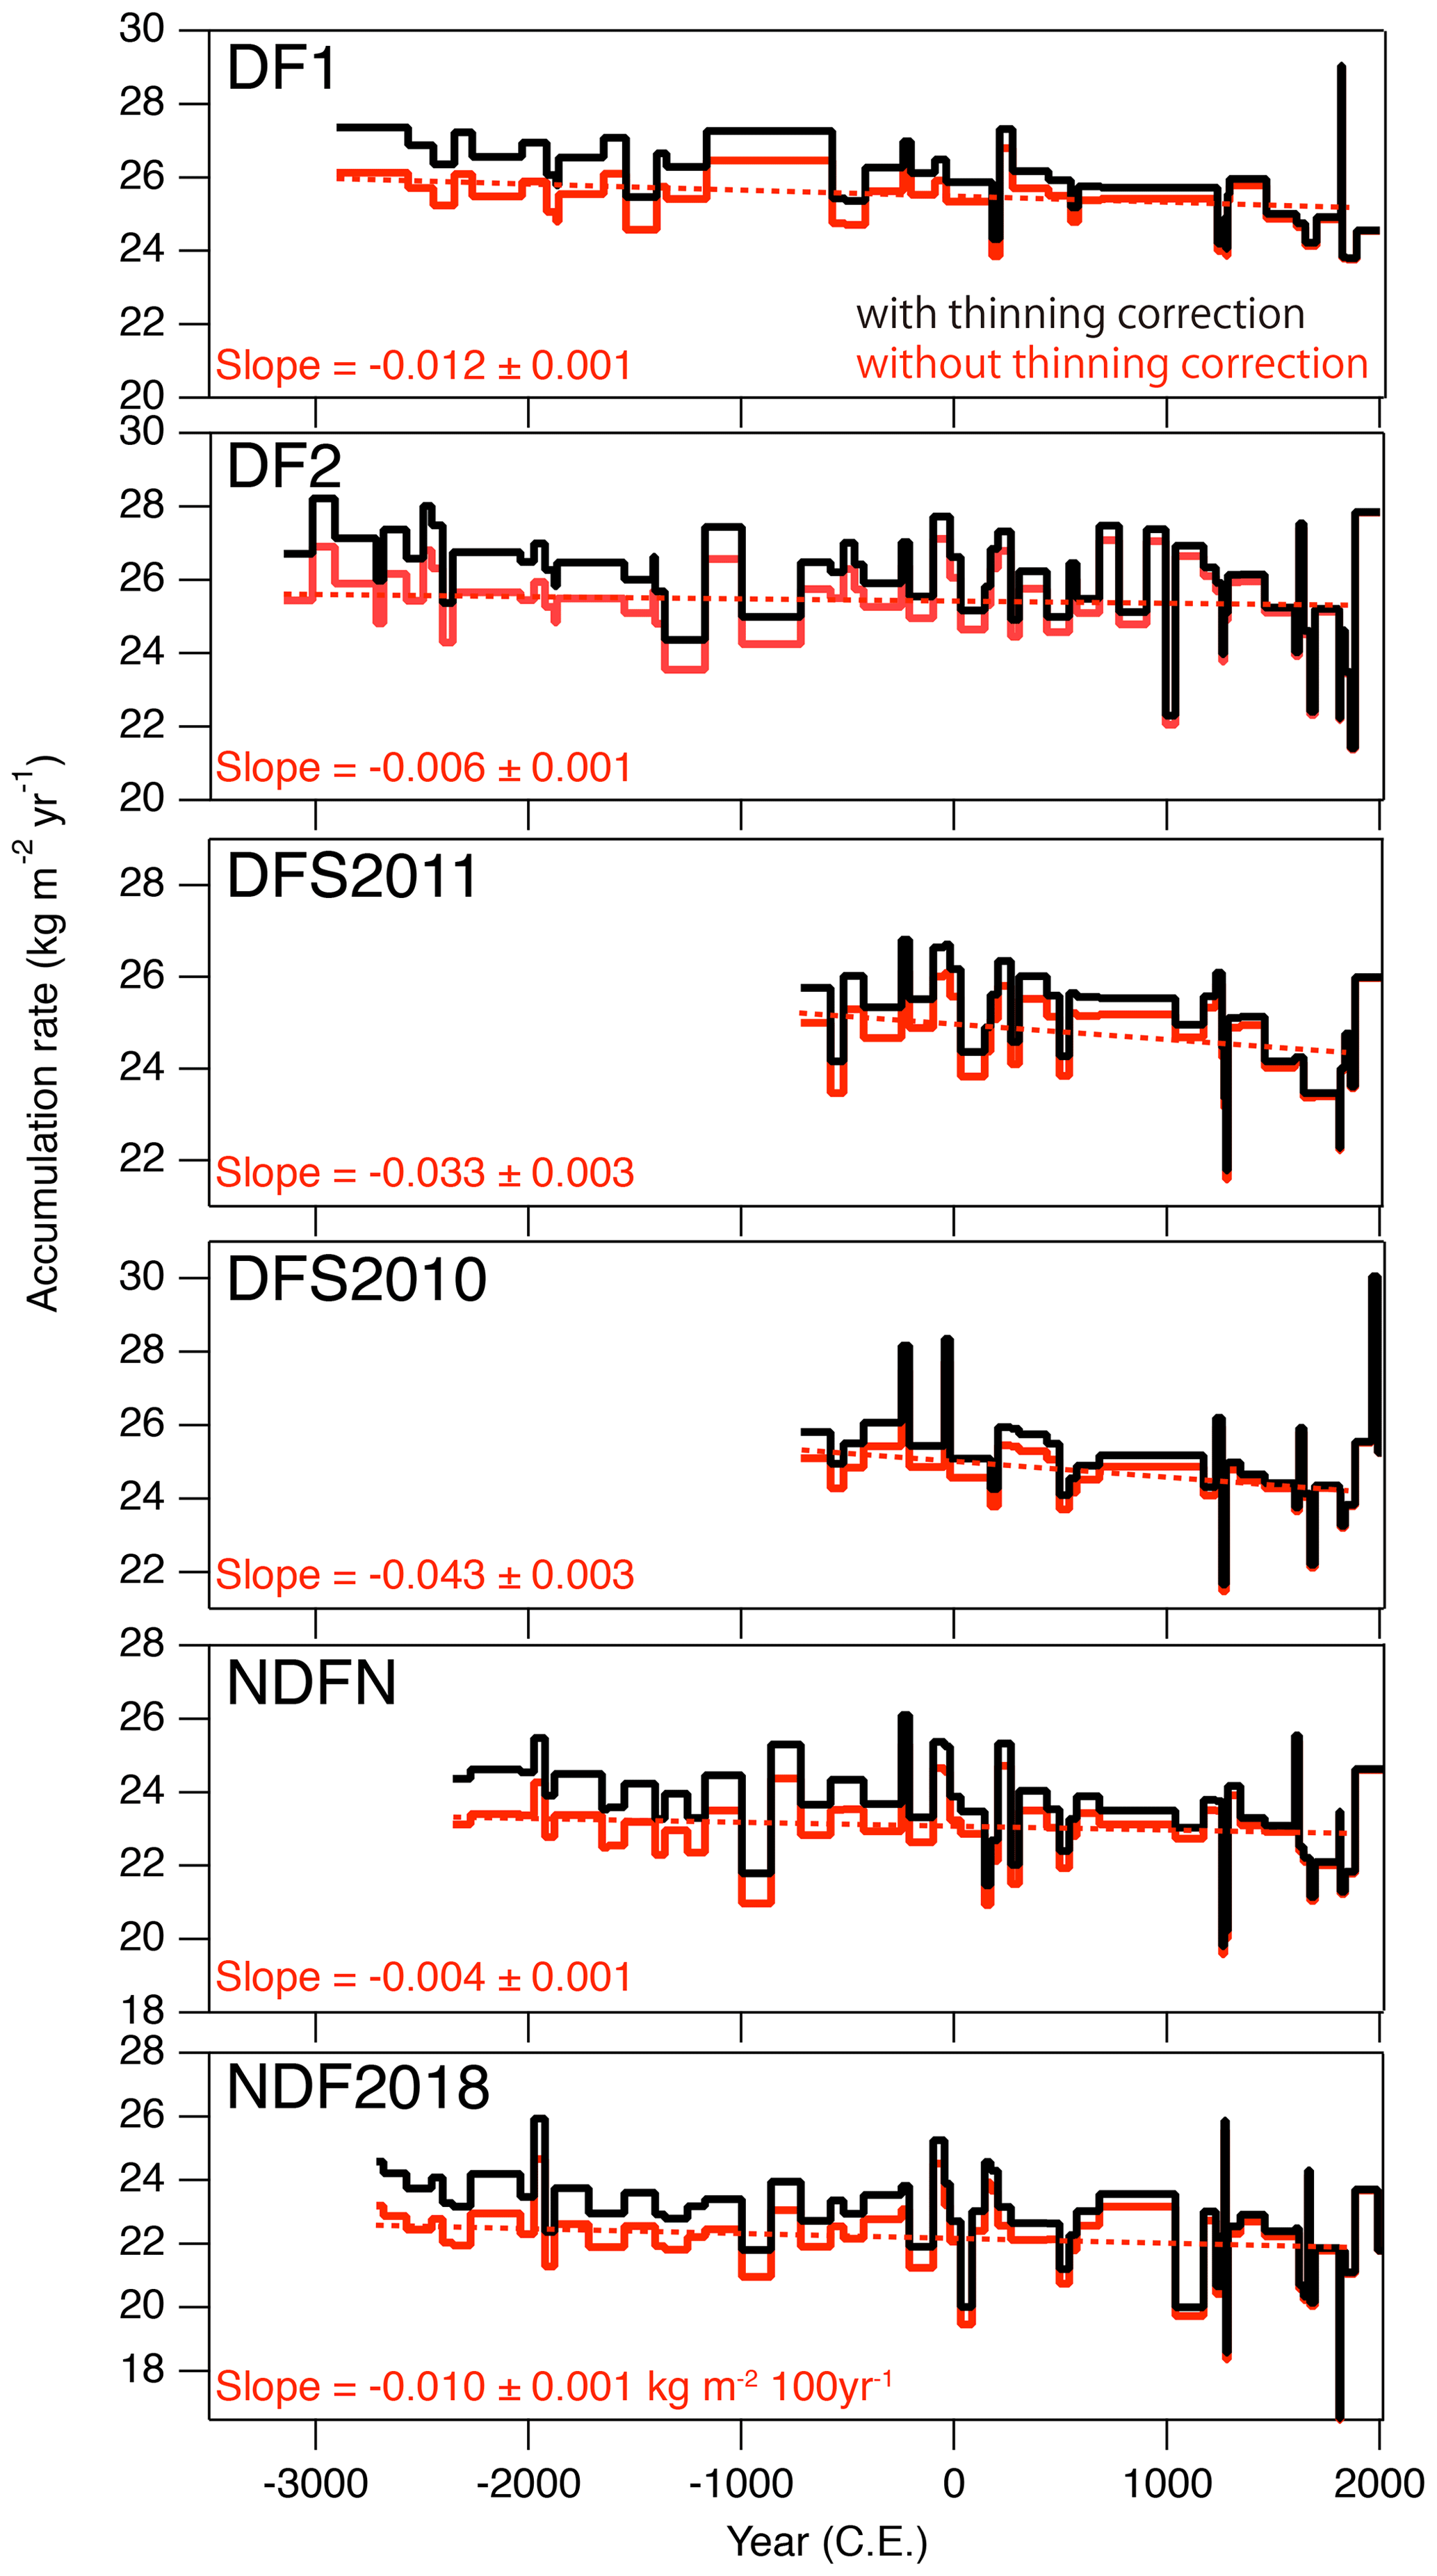
Figure 11Temporal changes in accumulation rate with and without thinning correction. Statistically significant slope values from the results without thinning correction are indicated.
We discuss possible causes for the decreasing trend in accumulation rate around Dome Fuji over the last ∼5000 years in the preindustrial period. Note that the main objective of this study is a reliable reconstruction of SMB over long timescales. The thorough investigation of the mechanisms would require reliable SMB reconstructions in other parts of Antarctica and climate modeling works that are beyond the scope of this study. The first obvious candidate for the long-term change in accumulation rate is the secular changes in orbital forcings. Obliquity (the tilt of Earth's rotation axis) becomes smaller over the last 5000 years (Fig. 12c), which gradually decreases the annual mean insolation at high latitudes. The declining annual mean insolation may cool the ocean surface and atmosphere over the Southern Ocean and Antarctica, leading to reduced evaporation and atmospheric moisture content, and possibly the general decrease in the snow accumulation over the Antarctic inland. On the other hand, the radiative forcing of greenhouse gases (GHGs) increases over the same period (Fig. 12d), which might counteract other forcings for reducing snow accumulation. Other potentially important forcings are the changes in solar irradiance (Fig. 12e) and volcanic forcing (Fig. 12f), although they have significant uncertainties in reconstructions.
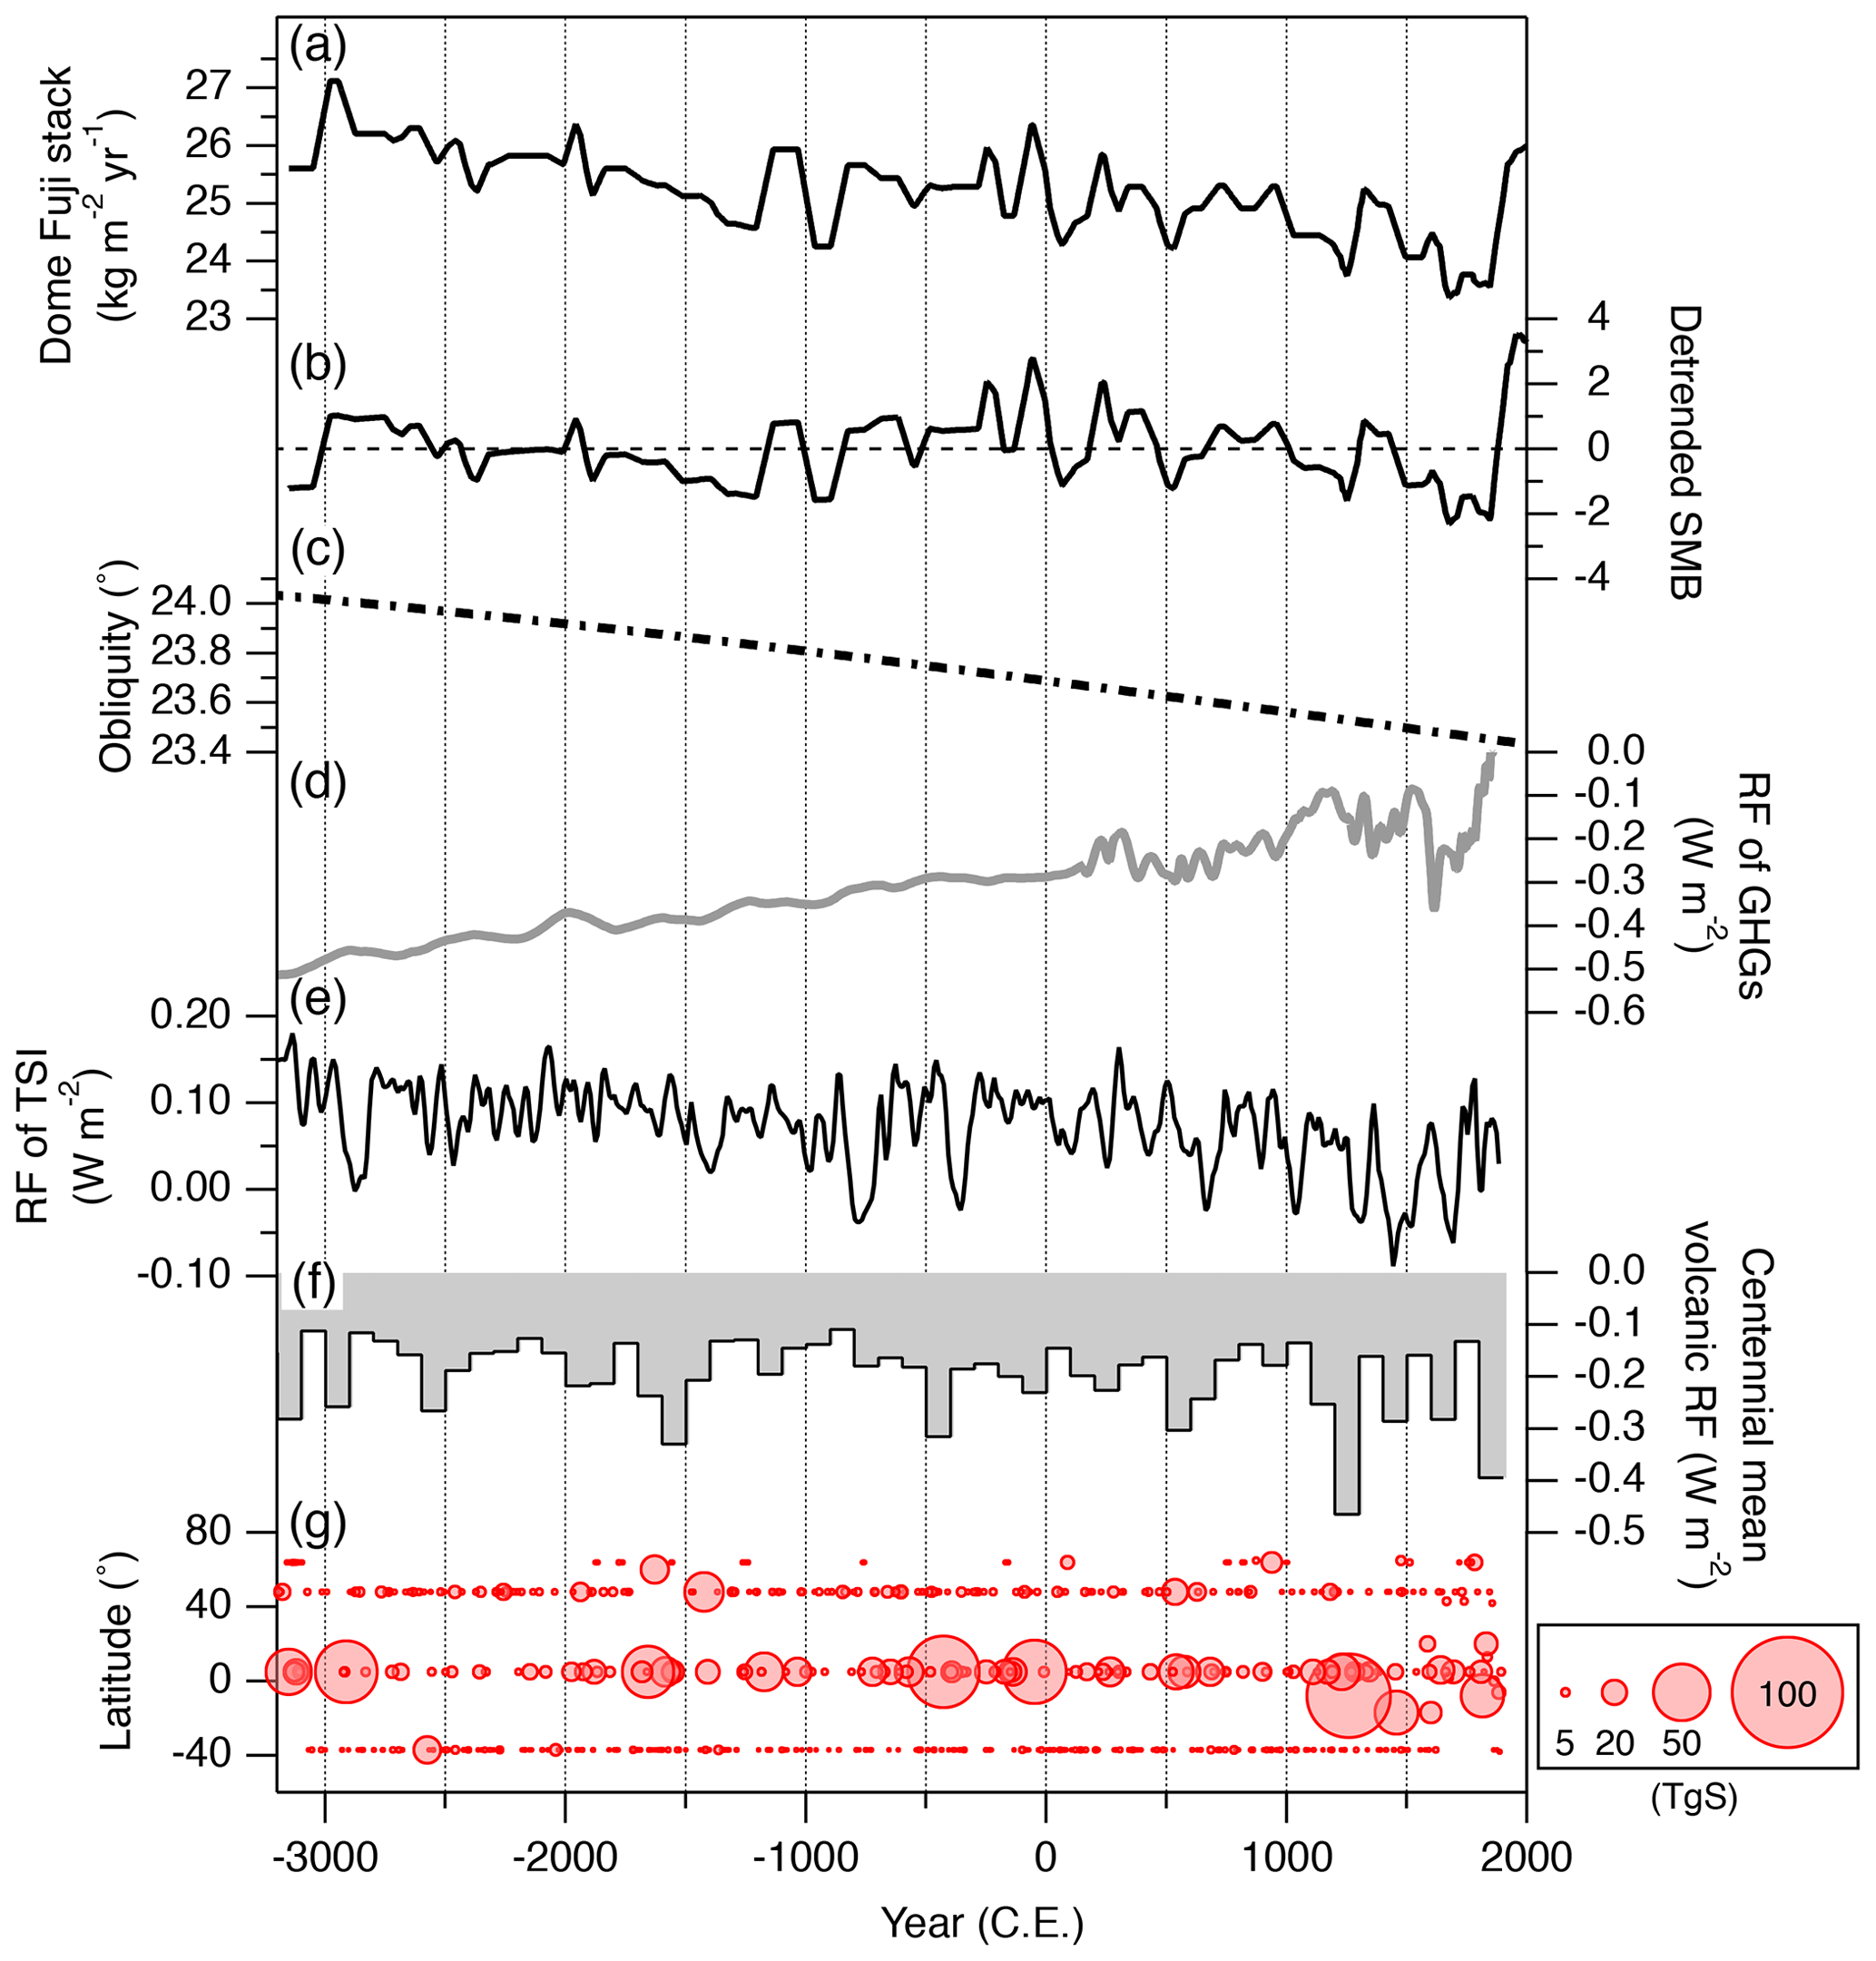
Figure 12Dome Fuji SMB record and climatic forcings over the last 5000 years. (a) Dome Fuji stacked SMB (Stack 2); (b) detrended SMB of Stack 1; (c) obliquity; (d) radiative forcing (RF) of greenhouse gases (CO2, CH4 and N2O) relative to 1750 CE calculated using CO2, CH4, and N2O concentrations from Bereiter et al. (2015), Buizert et al. (2015), and Fischer et al. (2019), respectively, and equations proposed by Etminan et al. (2016); (e) RF of total solar irradiance (Wu et al., 2018) relative to 1750 CE; (f) centennial mean volcanic RF at 40–90∘ S; and (g) stratospheric sulfur injections from volcanic eruptions (TgS stands for teragram of sulfur) (Sigl et al., 2022). Volcanic RF was calculated by stratospheric aerosol optical depth (Sigl et al., 2022) and a conversion factor (Hansen et al., 2005).
For the AIS SMB, sensitivity experiments with a regional climate model have suggested the roles of Southern Ocean sea surface temperature (SST) and sea ice concentration for the SMB (Kittel et al., 2018). Their results showed that increases in sea ice concentration led to a decrease in the SMB over most of the AIS, but lower SST led to contrasting changes in the coastal and inland areas of AIS, i.e., a decrease in coastal areas and an increase in inland areas, because of the relationship between atmospheric vapor content and saturation pressure along the air mass trajectory towards the inland. On the other hand, Vannitsem et al. (2019) analyzed the relationship between reconstructed AIS SMB (Thomas et al., 2017) and the results of global climate models for 850–2005 CE and found that the SMB over the Antarctic Plateau is mostly influenced by the surface air temperature and sea ice concentration and not by large-scale atmospheric modes such as El Niño or the Southern Annular Mode (SAM). Therefore, to provide data-based clues for the long-term relationships between the surface temperature, sea ice and SMB, we compare our SMB trend with the published temperature and sea ice reconstructions over the latter half of the Holocene.
Long-term coolings from the middle to late Holocene at high latitudes in the Southern Hemisphere have been suggested by previous studies, although the relevant climatic forcings and mechanisms (e.g., in terms of orbital configurations and GHGs) are not clear. Recent compilations of surface temperature reconstructions exhibit cooling trends for the middle to high latitudes of the Southern Hemisphere (Marcott et al., 2013; Kaufman et al., 2020a, b), and stable water isotope records on the EAP (EDML, Dome Fuji, Vostok, Dome C, TALDICE) commonly show decreasing trend from the middle to late Holocene (Masson-Delmotte et al., 2011). On the other hand, individual reconstructions of sea surface temperature (SST) show a variety of trends from clear cooling to little trend over the last 5000 years (e.g., Hodell et al., 2001; Nielsen et al., 2004; Anderson et al., 2009; Divine et al., 2010; Lamy et al., 2010; Shevenell et al., 2011; Etourneau et al., 2013; Xiao et al., 2016), which may be partly because local SST may be sensitive to the positions relative to ocean currents. Cooling on land in the latter half of the Holocene is also suggested by the advances of glaciers in the Southern Hemisphere (Solomina et al., 2015).
Reconstructed sea ice extents from multiple proxy records for different parts of the Southern Ocean show general advancements for the last 5000 years. The sea ice advance around 5000 to 4000 years ago was found from TN057-13 in the southeastern Atlantic (Hoddel et al., 2001), from JPC24 in Prydz Bay in the Atlantic Ocean sector (Denis et al., 2010), and from MD03-2601 (Crosta et al., 2008; Denis et al., 2010) and U1357 (Ashley et al., 2021) offshore Adélie Land in the Indian Ocean sector. Denis et al. (2010) suggested that increasing sea ice cover over the late Holocene is a common feature in the coastal Antarctic. From the Antarctic ice cores, secular increases in sodium, which is a proxy for sea ice extent in the Southern Ocean (Wolff et al., 2003), during the Holocene have been widely observed (Winski et al., 2021). From ice cores in the EAP, the increases in sodium fluxes and concentrations since the middle Holocene were observed at EDML (Fischer et al., 2007), Dome Fuji (Iizuka et al., 2008), Dome C (Fischer et al., 2007) and TALDICE (Mezgec et al., 2017). Thus, sea ice extent was probably increased in the areas of the Southern Ocean that supply sodium to the EAP.
From the above evidence, the decreasing trend in the Dome Fuji SMB over the last 5000 years appears to be associated with surface cooling and sea ice expansion in the potential water vapor source areas for the Dome Fuji region, namely the Atlantic Ocean and Indian Ocean sectors of Southern Ocean (Suzuki et al., 2008). The cooling trend is also seen over the EAP, possibly suggesting a general cooling trend of the atmosphere from the vapor source regions to the EAP. Our observation is consistent with the analyses of Vannitsem et al. (2019) that both surface air temperature and sea ice trends could have contributed to the decreasing Dome Fuji SMB. On the contrary, our observation may be inconsistent with the sensitivity study of the regional climate model (Kittel et al., 2018) that shows that the decrease in accumulation rate in the EAP requires an increase in SST. A thorough investigation of the inconsistency is beyond the scope of this study, but it might be related to the differences in the background climate states between the model runs (1979–2015) and the past 5000 years.
4.2 Centennial-scale variability
We compare the centennial-scale variabilities of SMB records at Dome Fuji and other parts of Antarctica for the last 1000 years. For Dome Fuji, the deviation of SMB from the long-term trend was calculated by subtracting a linear function fitted through 1236–1850 CE (the oldest year for the fitting was adopted from the other records with a shorter duration). For the comparison, we use the SMB reconstruction for the Atlantic sector of DML based on the analyses of six firn cores (Hofstede et al., 2004), as well as the composite SMB records for the EAP, all of East Antarctica (EA; including coastal area of DML, Wilkes Land and the East Antarctic Plateau) and parts of West Antarctica (WA; the Antarctic Peninsula is not included) based on the compilations of multiple ice cores (Thomas et al., 2017). The published records by Thomas et al. (2017) were smoothed by a 71-year moving average to match the resolution with that of the Dome Fuji data, and the deviations from their linear trends were calculated in the same manner as the Dome Fuji record. Figure 13 shows the SMB anomaly for Dome Fuji and the Atlantic sector of DML, EAP, EA and AIS. The SMB anomaly around Dome Fuji has four distinct periods: mostly negative before 1300 CE, slightly positive for 1300–1450 CE, slightly negative for 1450–1850 CE, and positive after 1850 CE (Fig. 13a). Before 1460 CE, the Dome Fuji, DML, EAP and EA records commonly exhibit a peak around 1300–1450 CE, suggesting this anomaly is a real climatic signal and extended to much of East Antarctica. For the middle part (1460–1850 CE), the DML, EAP and EA records are also characterized by a broad minimum around 1500 CE and a relatively short maximum around 1600 CE. The Dome Fuji record shows consistently negative values in this period, but it also has a broad minimum around 1500 CE and small maximum around 1600 CE. The WA composite also shows a positive anomaly around 1600 CE. After ∼1650 CE, Dome Fuji, DML, EAP, EA and WA records all show a minimum around 1700 CE, although the durations of the negative anomalies are different. The Dome Fuji and DML records show minima in more recent periods (around 1850 CE in the Dome Fuji record and around 1900 CE in the DML record), which are not seen in the other records. For the most recent part, all records show increases with different durations (over 100–300 years).
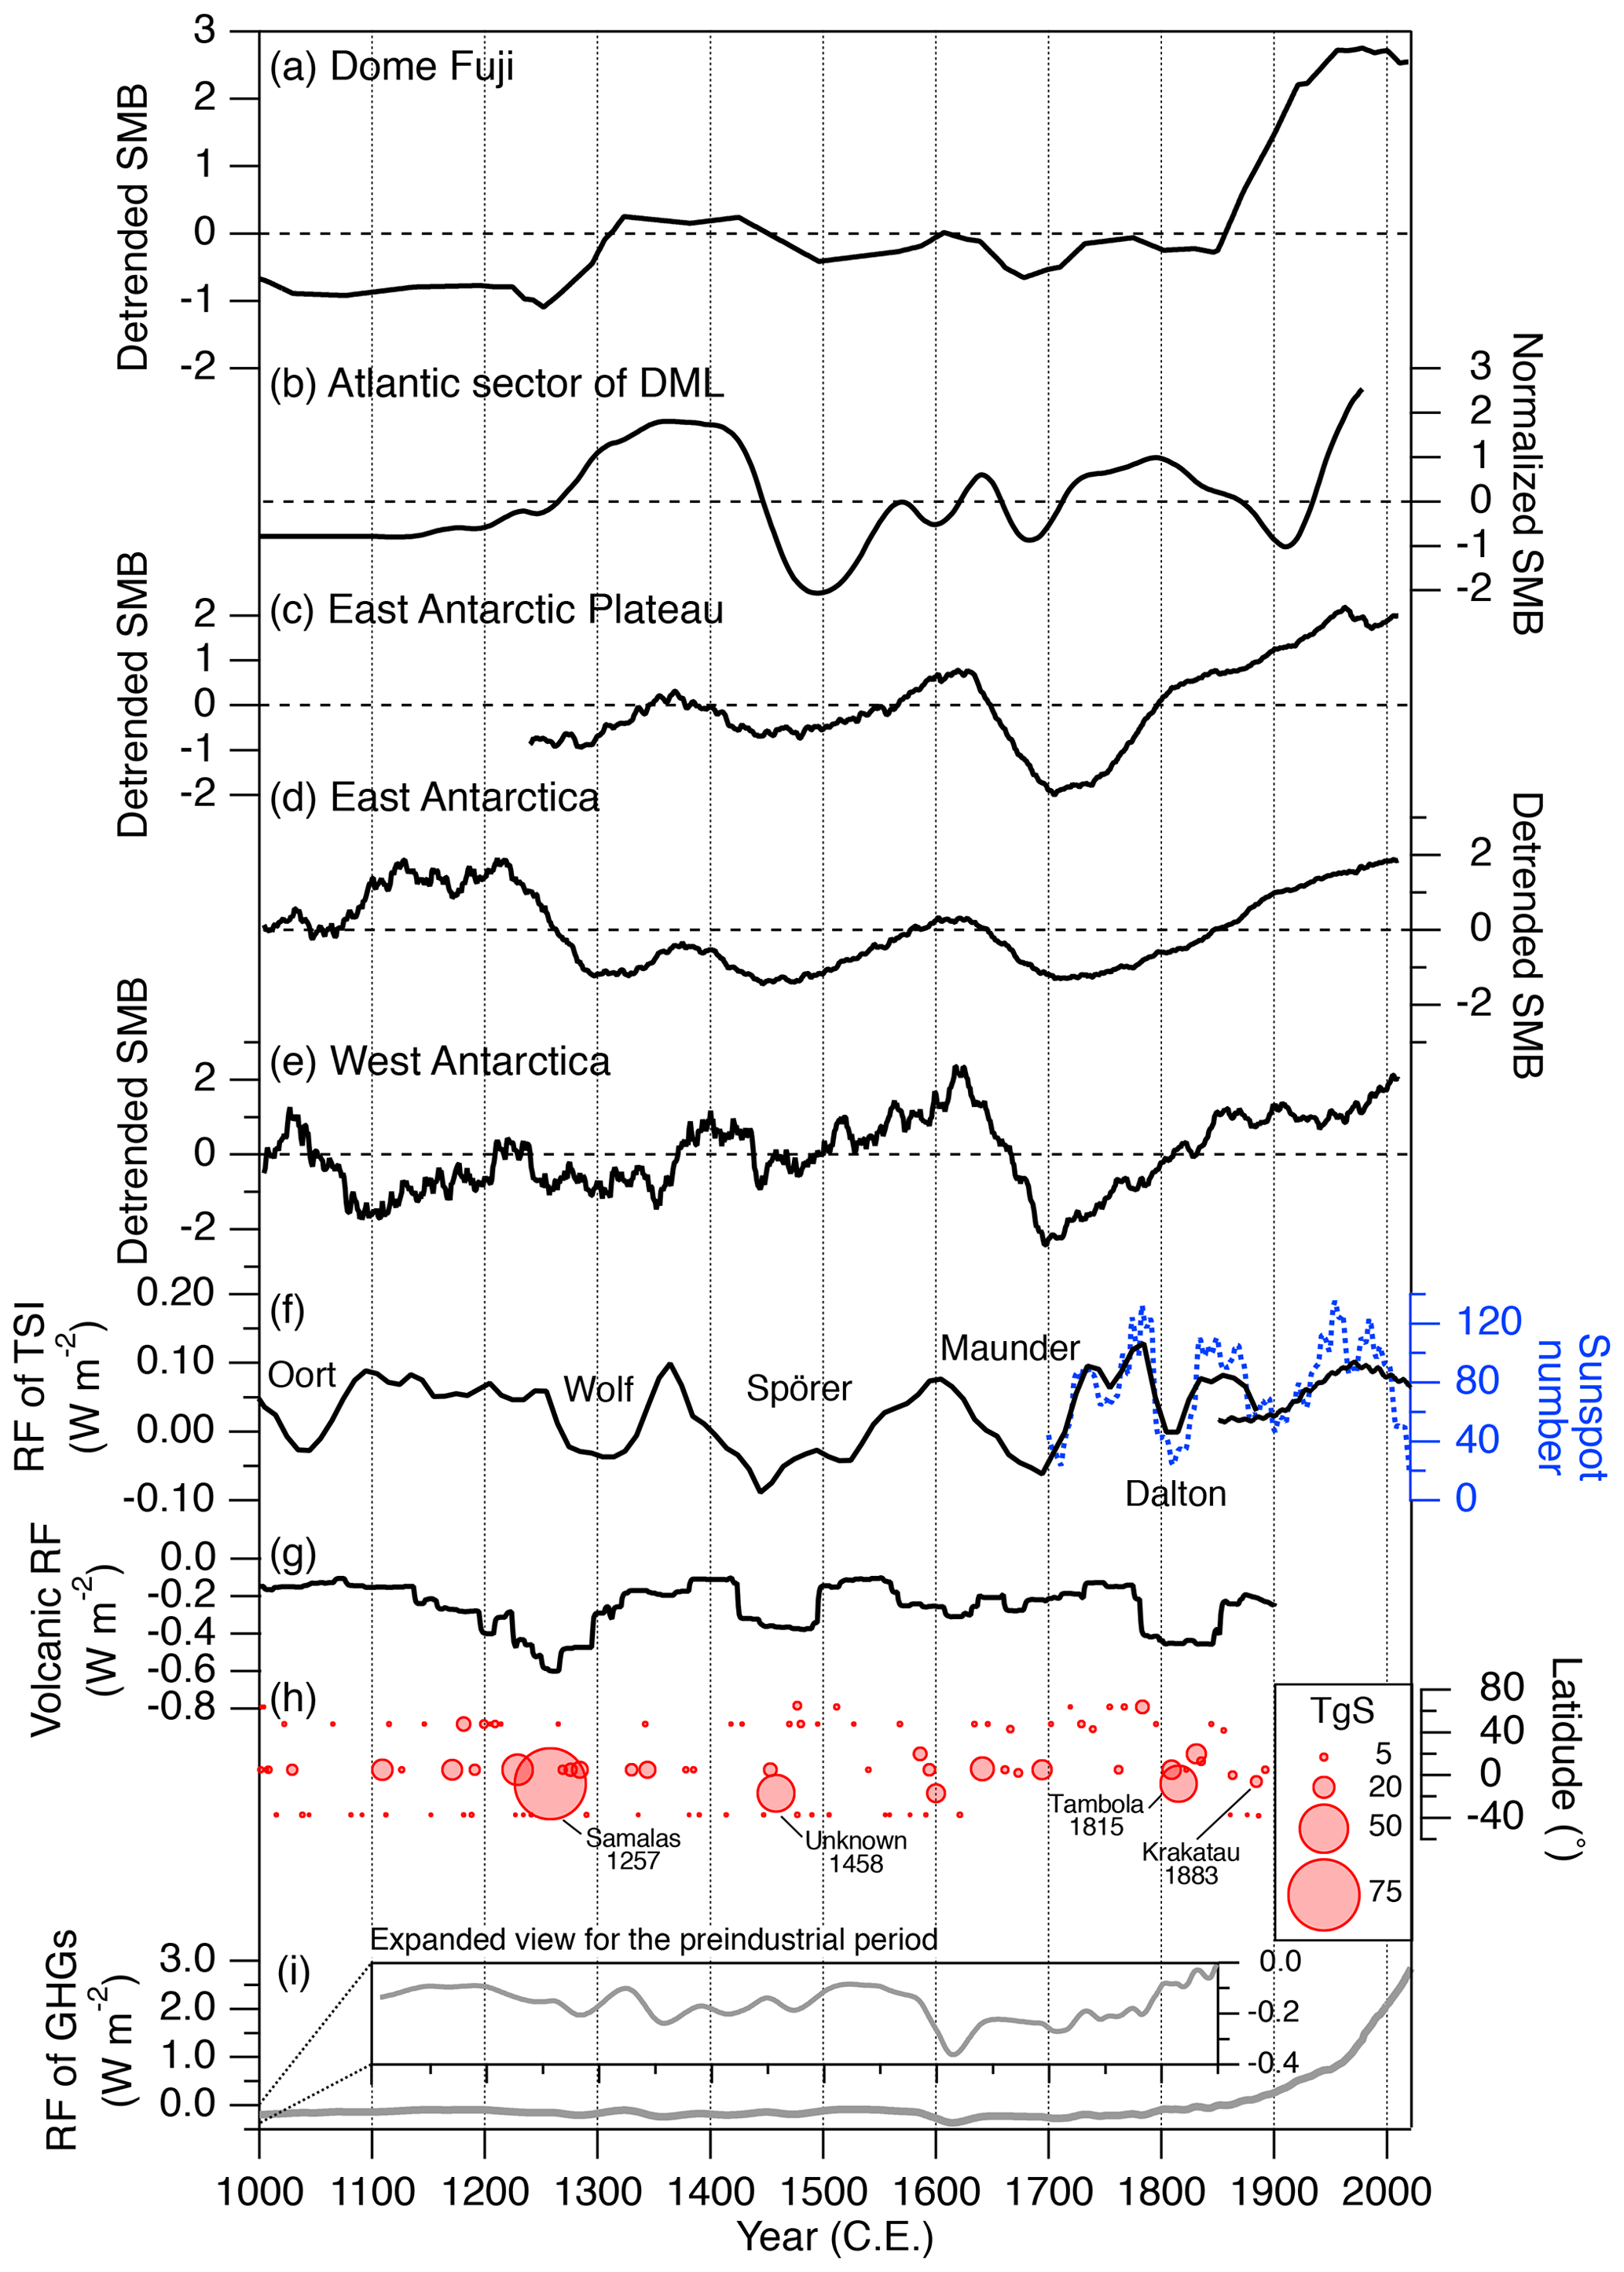
Figure 13Detrended SMB for the last 1000 years for (a) Dome Fuji, (b) the Atlantic sector of DML (Hofstede et al., 2004), (c) the East Antarctic Plateau (detrended EAP SMB of Thomas et al., 2017), (d) East Antarctica (detrended EA SMB of Thomas et al., 2017) and (e) West Antarctica (detrended WA SMB of Thomas et al., 2017). Also shown are (f) radiative forcing (RF) of total solar irradiance relative to 1750 CE (black, Wu et al., 2018) and sunspot number, (g) mean volcanic RF at 40–90∘ S with a 71-year moving average, (h) stratospheric sulfur injections from volcanic eruptions (Sigl et al., 2022), and (i) RF of greenhouse gases (CO2, CH4 and N2O) relative to 1750 CE. Total solar irradiance (TSI, 1000–1885 CE) and sunspot number data (1700–2021 CE) are from the Max Planck Institute for Solar System Research “Solar Variability and Climate” group (https://doi.org/10.17617/1.5U) and the World Data Center SILSO at the Royal Observatory of Belgium in Brussels (https://www.sidc.be/silso/datafiles, last access: 29 January 2023). The TSI of 1850–2020 CE is from Matthes et al. (2017). Volcanic RF was calculated by stratospheric aerosol optical depth (Sigl et al., 2022) and a conversion factor (Hansen et al., 2005). RF of GHGs was calculated using CO2, CH4 and N2O concentrations from Rubino et al. (2019) and equations proposed by Etminan et al. (2016).
We further compare our Dome Fuji record with other published reconstructions. For Princess Elizabeth Land, the SMB anomaly is relatively high for ∼1207–1450 CE, low for ∼1450–1850 CE and significantly increased afterward (until 1996 CE) (Li et al., 2009). In the South Pole record (Ferris et al., 2011), the SMB anomaly is relatively large for ∼1200–1400 CE, reduced during the period of 1500–1900 CE, and then increased afterward. On the continental scale, a stacked SMB record by Frezzotti et al. (2013) for the last 800 years, which includes more data from the Antarctic Plateau than the composite of Thomas et al. (2017), identified three periods of low accumulation rate (1250–1300, 1420–1550 and 1660–1790 CE). In summary, the reconstructions for the EAP commonly show a higher accumulation rate for the periods of ∼1250–1400 and ∼1550–1650 CE and a lower accumulation rate around 1500 and 1700 CE. The increases in the snow accumulation over the 20th century are also observed, although the timing of the onsets is different among the records.
Multidecadal to centennial SMB variabilities may be driven by external forcings such as solar irradiance and volcanic activity, as well as by internal variabilities of the atmosphere–ocean system (Goosse et al., 2012; Frezzotti et al., 2013; PAGES 2k Consortium, 2013, 2019; Medley and Thomas, 2019; Mann et al., 2021). Previous studies have suggested the correspondence between the periods of reduced SMB and strong volcanic forcings or solar minima over the last millennium (Bertler et al., 2011; Frezzotti et al., 2013; Osipov et al., 2014; Thomas et al., 2017), possibly through the reduction of incoming solar radiation and associated changes in the climate system (e.g., surface cooling and circulation change). In the detrended SMB record at Dome Fuji over the last 1000 years, the intervals of small SMB anomalies appear to correspond to those with large volcanic eruptions (e.g., Samalas in 1257 CE, an unknown eruption in 1458 CE, Tambora in 1815 CE and Krakatau in 1883 CE), as well as the Spörer, Maunder and Dalton grand solar minima (Fig. 13). Note that the eruption in 1458 was previously estimated as being from Kuwae, but it is now interpreted as an unknown event (perhaps in the Southern Hemisphere) (Hartman et al., 2019). On the other hand, the Oort and Wolf grand solar minima do not correspond to low SMB anomaly periods at Dome Fuji, but they coincide with the low SMB anomaly periods in the EA composite. Thus, our data are partly consistent with the previous suggestions for the last 1000 years. As discussed above, the Dome Fuji stacked record shows a negative SMB anomaly for the 15th to 19th centuries. During this period, in addition to strong volcanic forcing and weak solar activity, the radiative forcing of GHGs becomes the smallest in the last 2 kyr, which may have contributed to the lower SMB.
For the older period, the detrended SMB for 1500 BCE–1000 CE shows variability similar to the last 1000 years, and it shows reduced variability before 1500 BCE (Fig. 12). In addition, the correspondence between the intervals of low SMB anomalies and strong volcanic or weak solar forcings is not clear in the older period. Before 1000 CE, the average solar activity was larger and the frequency of large volcanic eruptions was lower than during the last 1000 years. It might be possible that the clear relationship between the significant negative SMB anomalies and solar and volcanic forcings is only visible when the two forcing anomalies are strong and coincide, which seems rarer in the older period than in the last 1000 years. However, there is also a possibility that the SMB variability on the multidecadal to centennial scales is not captured well by our stack because of the lower number of ice cores and age constraints. The reconstructions of volcanic and solar forcings might also have larger uncertainties in the older part. In any case, it is desirable to obtain long-term and detailed reconstructions of the AIS SMB at multiple sites to examine their relationships with the climatic forcings.
The Dome Fuji SMB record reveals that the magnitude of the snow accumulation increase during the last 150 years is the greatest in the last 5000 years ( kg m−2 100 yr−1, Table 3). We speculate that the large increase may have been created by the combination of anomalously low accumulation in the 18–19th centuries (23.8±0.4 kg m−2 yr−1 in Stack 2) and a continuous increase in the industrial period. As previous studies have suggested, the significant increase in accumulation rate in the 20th century may be attributed to anthropogenic forcings, such as increased atmospheric GHG concentrations and stratospheric ozone depletion (e.g., Medley and Thomas, 2019). Climate models suggest that enhanced GHG radiative forcing would increase temperature, and thus the moisture content in the atmosphere over the Southern Ocean and Antarctica, leading to the increase in Antarctic precipitation (e.g., Previdi and Polvani, 2016). The ozone depletion is suggested to strengthen the mean zonal wind at middle to high latitudes in the lower troposphere, which is balanced by a stronger mean meridional wind (Chemke et al., 2020). In addition, ozone depletion would enhance barotropic instability, which also increases the poleward eddy moisture fluxes (Chemke et al., 2020). In the preindustrial period, the variation in the combined radiative forcing of solar activity, volcanic forcing and GHGs is smaller than 1 W m−2, while the anthropogenic radiative forcing alone is +2.7 W m−2 in the industrial period (in 2019 relative to 1750) (IPCC, 2021). Although the current accumulation rate is likely lower than the maximum value in the last 5000 years of the preindustrial period, we speculate that it could eventually exceed the natural range in the future as the anthropogenic forcings continue to change the atmosphere–ocean system around Antarctica.
We analyzed a total of 15 ice cores and seven snow pit samples to obtain 13 SMB records around Dome Fuji over the last 5000 years. Four ice cores cover more than 4000 years, three ice cores cover 1500 years, six ice cores cover 800 years or less, and the longest reconstruction covers 5152 years (3151 BCE–2001 CE, DF2 core). Our new SMB reconstructions took advantage of detailed and precise depth–age controls for the ice cores owing to high-resolution volcanic synchronization with the WAIS Divide ice core. We also considered vertical ice thinning for all cores and used high-resolution permittivity data for estimating high-precision density profiles for most of the cores. Because the accumulation rate is low and its variability is relatively large in the high-elevation plateau in East Antarctica (e.g., above 3000 m a.s.l.), we stacked all available SMB records from the individual ice cores and snow pits for a reliable reconstruction of the SMB history in the Dome Fuji area. Our main findings are summarized as follows.
-
The mean accumulation rate over the last 5000 years is 26.2±1.0 kg m−2 yr−1 at Dome Fuji. The mean accumulation rates for the last 4000 years in the preindustrial period are lower (higher) south (north) of the Dome Fuji station. Such a spatial gradient around Dome Fuji is consistent with the modern observations and centennial-scale reconstructions in that it depends on the site location relative to the ice ridges combined with prevailing wind directions and proximity to the ocean.
-
A statistically significant long-term decreasing trend over the last 5000 years in the preindustrial period is found in the stacked SMB record, with a slope of kg m−2 per century. We speculate that the long-term trend is attributable to long-term surface cooling over the Southern Ocean and East Antarctica and sea ice expansion in the moisture source areas.
-
After removing the long-term trend, the stacked SMB shows centennial-scale variations. For 1–1850 CE, the detrended SMB anomaly is mostly negative before 1300 CE, slightly positive for 1300–1450 CE, slightly negative for 1450–1850 CE with a weak maximum around 1600 CE, and positive after 1850 CE with a strong increase. These variations are generally consistent with previous SMB reconstructions in the East Antarctic Plateau, which may be driven by the combination of strong volcanic forcings and solar minima.
-
For the older period, the detrended SMB anomaly for 1500 BCE–1000 CE shows variability similar to the last 1000 years, and it shows reduced variability before 1500 BCE. The correspondence between the SMB anomalies and climatic forcings is not clear as in the last 1000 years, possibly because of generally larger solar forcings, the lack of coincidence of volcanic and solar forcings, or the deterioration of the SMB reconstruction due to the smaller number of ice cores and age constraints.
-
The magnitude of the increase in accumulation rate during the last 150 years ( kg m−2 per century) is the greatest in the last 5000 years, which may have been forced by the combination of the anomalously low accumulation in the 18–19th centuries, anthropogenically forced atmospheric greenhouse gas increases and stratospheric ozone depletion.
We demonstrated the possibility of detailed and precise age control of low-accumulation ice cores thanks to the synchronization to the layer-counted WAIS Divide core, which may be applied to low-accumulation ice cores from other vast high-elevation areas of East Antarctica. To further examine the long-term SMB trend and centennial-scale SMB variations in relation to the climatic forcings, high-resolution and precise SMB reconstructions with a long timescale from multiple sites are desired.
We constructed a conversion equation from the permittivity measured after 2018 to density. The measured bulk densities of the NDF2018, DFNW, DFSE and NDFN cores and the NDF2018 snow pit were used for the conversion. The permittivity data was resampled at 0.5 m intervals to match the resolution of bulk density data of the cores, and a third-order polynomial function was used to represent the permittivity–density relationship:
where ρ is density (kg m−3) and εh is permittivity of the horizontal component (Fig. A1).
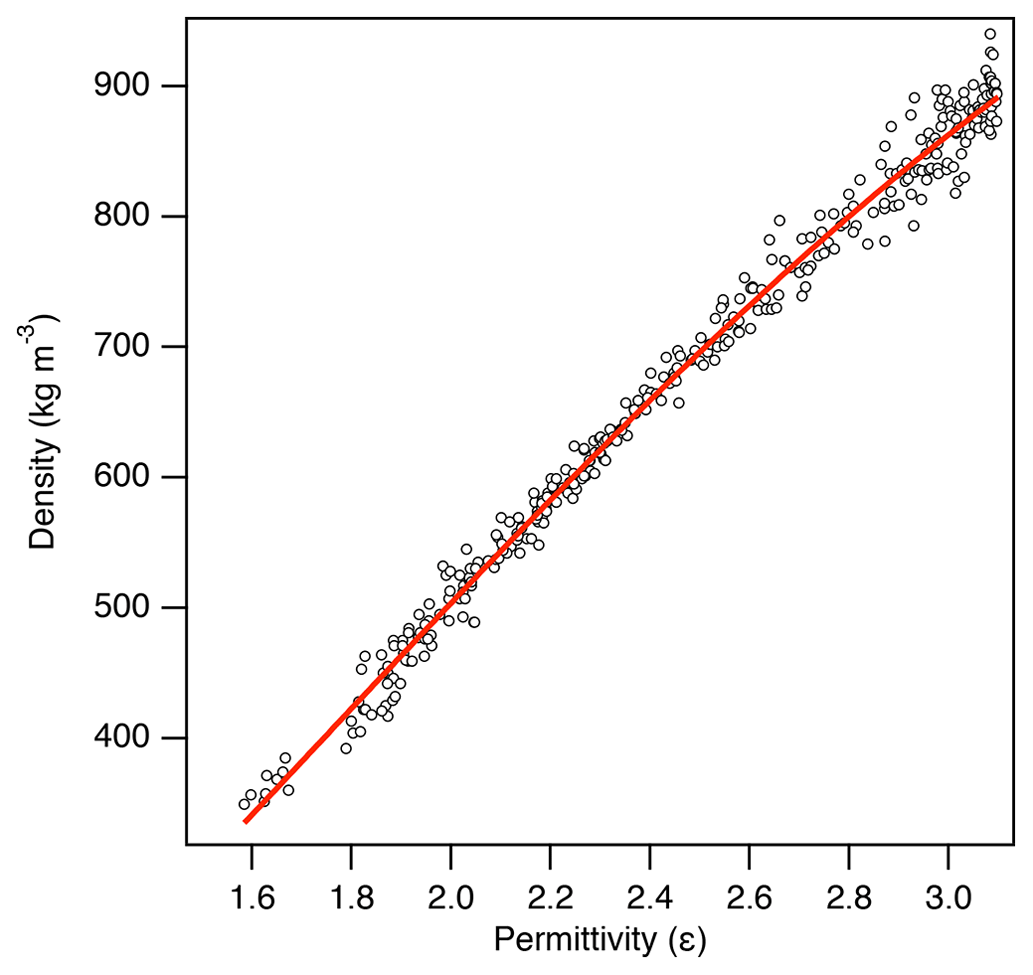
Figure A1Scatter plot of the permittivity and bulk density and its third-order polynomial fitting curve (, where ρ is density and εh is permittivity).
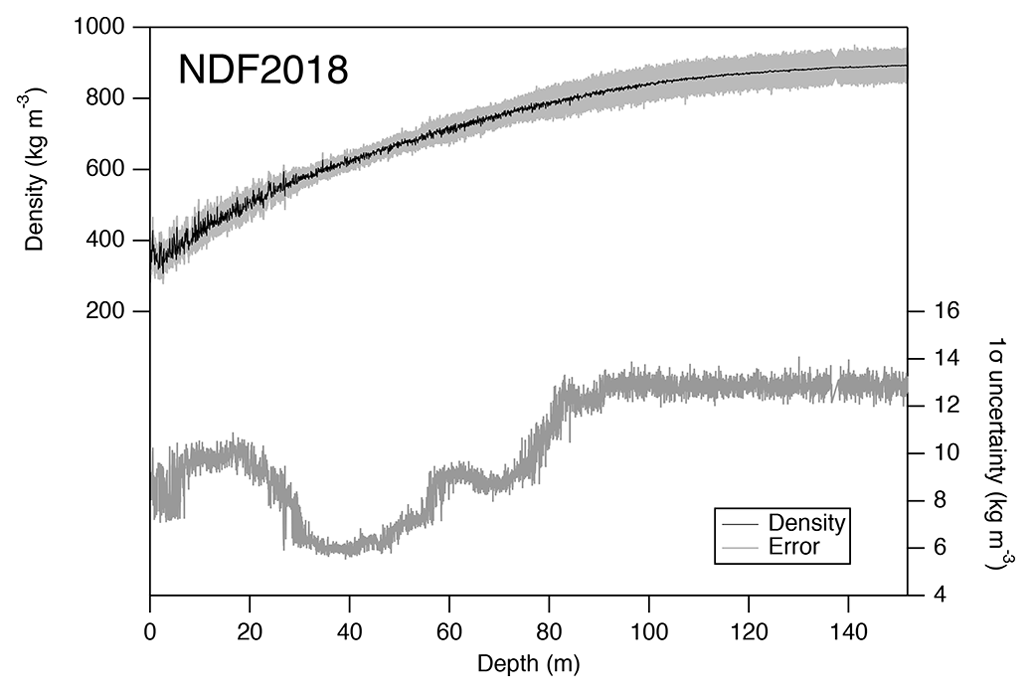
Uncertainty for the permittivity-based density is derived from the uncertainties of (1) bulk density measurement and (2) permittivity for a given density. The first component dominates the uncertainty in the relatively shallow part due to the irregular shapes of the core pieces, and the second component dominates the deep part where the bulk density is rather precise. To estimate the depth-dependent density uncertainty consisting of the two components, we employ a Monte Carlo approach, in which the bulk density and permittivity data were randomly modified 1000 times according to the respective uncertainties and fitted using the polynomial function. The range of density converted from permittivity using the 1000 pseudo datasets gives the uncertainty estimate. An example of the depth profile of density uncertainty is shown in Fig. A2 (NDF2018 core).

All data presented in this study are available at the NIPR ADS data repository (Oyabu et al., 2022b; https://doi.org/10.17592/001.2022081901).
SF, IO and KK conceived the idea of this study. HM, KK, SF, FN, MH, TS, KF, YH, IO, KS, HO, NK and ST conducted the field observations, including ice coring and snow sampling. SF, HM, RI, NK and MH carried out the laboratory measurements of ice cores and snow samples. IO and KK developed the analytical method for the SMB estimation, IO performed the data analyses, and IO, KK, SF, MN, MY, FS and AA interpreted and discussed the data. FP provided the Paleochrono model. IO and KK wrote the manuscript with contributions from all co-authors.
The contact author has declared that none of the authors has any competing interests.
Publisher's note: Copernicus Publications remains neutral with regard to jurisdictional claims in published maps and institutional affiliations.
This article is part of the special issue “Ice core science at the three poles (CP/TC inter-journal SI)”. It is a result of the IPICS 3rd Open Science Conference, Crans-Montana, Switzerland, 2–7 October 2022.
All field activities were conducted as part of the Japanese Antarctic Research Expeditions (JARE), managed by the Ministry of Education, Culture, Sports, Science and Technology (MEXT) and operated by the National Institute of Polar Research (NIPR). We acknowledge all field and laboratory personnel who contributed to obtaining the ice core and snow pit samples, field logistics, processing, and measurements. We appreciate Alexey Ekaykin and the two anonymous referees for their thoughtful and constructive comments.
This study was supported by Japan Society for the Promotion of Science (JSPS) and Ministry of Education, Culture, Sports, Science and Technology-Japan (MEXT) KAKENHI (grant no. 20H04327 to Ikumi Oyabu, grant nos. 17H06320 and 20H00639 to Kenji Kawamura, grant no. 18H05294 to Shuji Fujita, grant nos. 21221002 and 18H04139 to Hideaki Motoyama, grant no. 25871050 to Motohiro Hirabayashi, grant nos. 18K18176 and 20H04978 to Shun Tsutaki, and grant no. 17K05664 to Fuyuki Saito), by a JST FOREST Program grant (JPMJFR216X) to Ikumi Oyabu, and by NIPR Research Projects (Advanced Project and KP305).
This paper was edited by Alexey Ekaykin and reviewed by two anonymous referees.
Agosta, C., Amory, C., Kittel, C., Orsi, A., Favier, V., Gallee, H., Van den Broeke, M. R., Lenaerts, J. T. M., Van Wessem, J., Van De Berg, W. J., and Fettweis, X.: Estimation of the Antarctic surface mass balance using the regional climate model MAR (1979–2015) and identification of dominant processes, The Cryosphere, 13, 281–296, https://doi.org/10.5194/tc-13-281-2019, 2019.
Altnau, S., Schlosser, E., Isaksson, E., and Divine, D.: Climatic signals from 76 shallow firn cores in Dronning Maud Land, East Antarctica, The Cryosphere, 9, 925–944, https://doi.org/10.5194/tc-9-925-2015, 2015.
Anderson, R. F., Ali, S., Bradtmiller, L. I., Nielsen, S. H. H., Fleisher, M. Q., Anderson, B. E., and Burckle, L. H.: Wind-Driven Upwelling in the Southern Ocean and the Deglacial Rise in Atmospheric CO2, Science, 323, 1443–1448, https://doi.org/10.1126/science.1167441, 2009.
Anschütz, H., Müller, K., Isaksson, E., McConnell, J. R., Fischer, H., Miller, H., Albert, M., and Winther, J. G.: Revisiting sites of the South Pole Queen Maud Land Traverses in East Antarctica: Accumulation data from shallow firn cores, J. Geophys. Res.-Atmos., 114, 456–413, https://doi.org/10.1029/2009JD012204, 2009.
Anschütz, H., Sinisalo, A., Isaksson, E., McConnell, J. R., Hamran, S. E., Bisiaux, M. M., Pasteris, D., Neumann, T. A., and Winther, J. G.: Variation of accumulation rates over the last eight centuries on the East Antarctic Plateau derived from volcanic signals in ice cores, J. Geophys. Res., 116, D20103, https://doi.org/10.1029/2011jd015753, 2011.
Ashley, K. E., McKay, R., Etourneau, J., Jimenez-Espejo, F. J., Condron, A., Albot, A., Crosta, X., Riesselman, C., Seki, O., Massé, G., Golledge, N. R., Gasson, E., Lowry, D. P., Barrand, N. E., Johnson, K., Bertler, N., Escutia, C., Dunbar, R., and Bendle, J. A.: Mid-Holocene Antarctic sea-ice increase driven by marine ice sheet retreat, Clim. Past, 17, 1–19, https://doi.org/10.5194/cp-17-1-2021, 2021.
Bereiter, B., Eggleston, S., Schmitt, J., Nehrbass-Ahles, C., Stocker, T. F., Fischer, H., Kipfstuhl, S., and Chappellaz, J.: Revision of the EPICA Dome C CO2 record from 800 to 600 kyr before present, Geophys. Res. Lett., 42, 542–549, https://doi.org/10.1002/2014GL061957, 2015.
Bertler, N. A. N., Mayewski, P. A., and Carter, L.: Cold conditions in Antarctica during the Little Ice Age – Implications for abrupt climate change mechanisms, Earth Planet. Sc. Lett., 308, 41–51, https://doi.org/10.1016/j.epsl.2011.05.021, 2011.
Buizert, C., Cuffey, K. M., Severinghaus, J. P., Baggenstos, D., Fudge, T. J., Steig, E. J., Markle, B. R., Winstrup, M., Rhodes, R. H., Brook, E. J., Sowers, T. A., Clow, G. D., Cheng, H., Edwards, R. L., Sigl, M., McConnell, J. R., and Taylor, K. C.: The WAIS Divide deep ice core WD2014 chronology – Part 1: Methane synchronization (68–31 ka BP) and the gas age–ice age difference, Clim. Past, 11, 153–173, https://doi.org/10.5194/cp-11-153-2015, 2015.
Cavitte, M., Goosse, H., Wauthy, S., Kausch, T., Tison, J. L., Van Liefferinge, B., Pattyn, F., Lenaerts, J. T. M., and Claeys, P.: From ice core to ground-penetrating radar: representativeness of SMB at three ice rises along the Princess Ragnhild Coast, East Antarctica, J. Glaciol., 68, 1221–1233, https://doi.org/10.1017/jog.2022.39, 2022.
Cavitte, M. G. P., Parrenin, F., Ritz, C., Young, A., Van Liefferinge, B., Blankenship, D. D., Frezzotti, M., and Roberts, J. L.: Accumulation patterns around Dome C, East Antarctica, in the last 73 kyr, The Cryosphere, 12, 1401–1414, https://doi.org/10.5194/tc-12-1401-2018, 2018.
Chemke, R., Previdi, M., England, M. R., and Polvani, L. M.: Distinguishing the impacts of ozone and ozone-depleting substances on the recent increase in Antarctic surface mass balance, The Cryosphere, 14, 4135–4144, https://doi.org/10.5194/tc-14-4135-2020, 2020.
Cole-Dai, J.: Major Ion Chemistry Data of WAIS Divide Ice Core Brittle Ice, USAP-DC [data set], https://doi.org/10.7265/N5RF5S0D, 2014a.
Cole-Dai, J.: Major Ion Concentrations in WDC05Q and WDC06A Ice Cores (WAIS Divide), US Antarctic Program (USAP) Data Center [data set], https://doi.org/10.7265/N54M92H3, 2014b.
Cole-Dai, J. and Mosley-Thompson, E.: The Pinatubo eruption in South Pole snow and its potential value to ice-core paleovolcanic records, Ann. Glaciol., 29, 99–105, https://doi.org/10.3189/172756499781821319, 1999.
Cole-Dai, J., Mosley-Thompson, E., and Thompson, L. G.: Quantifying the Pinatubo volcanic signal in south polar snow, Geophys. Res. Lett., 24, 2679–2682, https://doi.org/10.1029/97GL02734, 1997.
Cole-Dai, J., Mosley-Thompson, E., Wight, S. P., and Thompson, L. G.: A 4100-year record of explosive volcanism from an East Antarctica ice core, J. Geophys. Res., 105, 24431–24441, https://doi.org/10.1029/2000JD900254, 2000.
Cole-Dai, J., Ferris, D., Lanciki, A., Savarino, J., Baroni, M., and Thiemens, M. H.: Cold decade (AD 1810–1819) caused by Tambora (1815) and another (1809) stratospheric volcanic eruption, Geophys. Res. Lett., 36, L22703, https://doi.org/10.1029/2009GL040882, 2009.
Colleoni, F., De Santis, L., Siddoway, C. S., Bergamasco, A., Golledge, N. R., Lohmann, G., Passchier, S., and Siegert, M. J.: Spatio-temporal variability of processes across Antarctic ice-bed–ocean interfaces, Nat. Commun., 9, 2289, https://doi.org/10.1038/s41467-018-04583-0, 2018.
Conger, S. M. and McClung, D. M.: Comparison of density cutters for snow profile observations, J. Glaciol., 55, 163–169, https://doi.org/10.3189/002214309788609038, 2009.
Crockart, C. K., Vance, T. R., Fraser, A. D., Abram, N. J., Criscitiello, A. S., Curran, M. A. J., Favier, V., Gallant, A. J. E., Kittel, C., Kjær, H. A., Klekociuk, A. R., Jong, L. M., Moy, A. D., Plummer, C. T., Vallelonga, P. T., Wille, J., and Zhang, L.: El Niño–Southern Oscillation signal in a new East Antarctic ice core, Mount Brown South, Clim. Past, 17, 1795–1818, https://doi.org/10.5194/cp-17-1795-2021, 2021.
Crosta, X., Denis, D., and Ther, O.: Sea ice seasonality during the Holocene, Adélie Land, East Antarctica, Mar. Micropaleontol., 66, 222–232, https://doi.org/10.1016/j.marmicro.2007.10.001, 2008.
Cuffey, K. M. and Paterson, W. S. B.: The physics of glaciers, in: 4th Edn., Academic Press, Amsterdam, 704 pp., ISBN 9780123694614, 2010.
Denis, D., Crosta, X., Barbara, L., Massé, G., Renssen, H., Ther, O., and Giraudeau, J.: Sea ice and wind variability during the Holocene in East Antarctica: insight on middle-high latitude coupling, Quaternary Sci. Rev., 29, 3709–3719, https://doi.org/10.1016/j.quascirev.2010.08.007, 2010.
Divine, D. V., KoC, N., Isaksson, E., Nielsen, S., Crosta, X., and Godtliebsen, F.: Holocene Antarctic climate variability from ice and marine sediment cores: Insights on ocean-atmosphere interaction, Quaternary Sci. Rev., 29, 303–312, https://doi.org/10.1016/j.quascirev.2009.11.012, 2010.
Dome Fuji Ice Core Project Members, Kawamura, K., Abe-Ouchi, A., Motoyama, H., Ageta, Y., Aoki, S., Azuma, N., Fujii, Y., Fujita, K., Fujita, S., Fukui, K., Furukawa, T., Furusaki, A., Goto-Azuma, K., Greve, R., Hirabayashi, M., Hondoh, T., Hori, A., Horikawa, S., Horiuchi, K., Igarashi, M., Iizuka, Y., Kameda, T., Kanda, H., Kohno, M., Kuramoto, T., Matsushi, Y., Miyahara, M., Miyake, T., Miyamoto, A., Nagashima, Y., Nakayama, Y., Nakazawa, T., Nakazawa, F., Nishio, F., Obinata, I., Ohgaito, R., Oka, A., Okuno, J. i., Sakurai, T., Oyabu, I., Parrenin, F., Pattyn, F., Saito, F., Saito, T., Saito, T., Sakurai, T., Sasa, K., Seddik, H., Shibata, Y., Shinbori, K., Suzuki, K., Suzuki, T., Takahashi, A., Takahashi, K., Takahashi, S., Takata, M., Tanaka, Y., Uemura, R., Watanabe, G., Watanabe, O., Yamasaki, T., Yokoyama, K., Yoshimori, M., and Yoshimoto, T.: State dependence of climatic instability over the past 720,000 years from Antarctic ice cores and climate modeling, Sci. Adv., 3, e1600446, https://doi.org/10.1126/sciadv.1600446, 2017.
Etminan, M., Myhre, G., Highwood, E. J., and Shine, K. P.: Radiative forcing of carbon dioxide, methane, and nitrous oxide: A significant revision of the methane radiative forcing, Geophys. Res. Lett., 43, 12614–12623, https://doi.org/10.1002/2016GL071930, 2016.
Etourneau, J., Collins, L. G., Willmott, V., Kim, J. H., Barbara, L., Leventer, A., Schouten, S., Sinninghe Damsté, J. S., Bianchini, A., Klein, V., Crosta, X., and Massé, G.: Holocene climate variations in the western Antarctic Peninsula: evidence for sea ice extent predominantly controlled by changes in insolation and ENSO variability, Clim. Past, 9, 1431–1446, https://doi.org/10.5194/cp-9-1431-2013, 2013.
Ferris, D. G., Cole-Dai, J., Reyes, A. R., and Budner, D. M.: South Pole ice core record of explosive volcanic eruptions in the first and second millennia A.D. and evidence of a large eruption in the tropics around 535 A.D., J. Geophys. Res., 116, D17308, https://doi.org/10.1029/2011JD015916, 2011.
Fischer, H., Fundel, F., Ruth, U., Twarloh, B., Wegner, A., Udisti, R., Becagli, S., Castellano, E., Morganti, A., Severi, M., Wolff, E., Littot, G., Röthlisberger, R., Mulvaney, R., Hutterli, M. A., Kaufmann, P., Federer, U., Lambert, F., Bigler, M., Hansson, M., Jonsell, U., de Angelis, M., Boutron, C., Siggaard-Andersen, M.-L., Steffensen, J. P., Barbante, C., Gaspari, V., Gabrielli, P., and Wagenbach, D.: Reconstruction of millennial changes in dust emission, transport and regional sea ice coverage using the deep EPICA ice cores from the Atlantic and Indian Ocean sector of Antarctica, Earth Planet. Sc. Lett, 260, 340–354, https://doi.org/10.1016/j.epsl.2007.06.014, 2007.
Fischer, H., Schmitt, J., Bock, M., Seth, B., Joos, F., Spahni, R., Lienert, S., Battaglia, G., Stocker, B. D., Schilt, A., and Brook, E. J.: N2O changes from the Last Glacial Maximum to the preindustrial – Part 1: Quantitative reconstruction of terrestrial and marine emissions using N2O stable isotopes in ice cores, Biogeosciences, 16, 3997–4021, https://doi.org/10.5194/bg-16-3997-2019, 2019.
Fourré, E., Jean-Baptiste, P., Dapoigny, A., Baumier, D., Petit, J. R., and Jouzel, J.: Past and recent tritium levels in Arctic and Antarctic polar caps, Earth Planet. Sc. Lett, 245, 56–64, https://doi.org/10.1016/j.epsl.2006.03.003, 2006.
Fretwell, P., Pritchard, H. D., Vaughan, D. G., Bamber, J. L., Barrand, N. E., Bell, R., Bianchi, C., Bingham, R. G., Blankenship, D. D., Casassa, G., Catania, G., Callens, D., Conway, H., Cook, A. J., Corr, H. F. J., Damaske, D., Damm, V., Ferraccioli, F., Forsberg, R., Fujita, S., Gim, Y., Gogineni, P., Griggs, J. A., Hindmarsh, R. C. A., Holmlund, P., Holt, J. W., Jacobel, R. W., Jenkins, A., Jokat, W., Jordan, T., King, E. C., Kohler, J., Krabill, W., Riger-Kusk, M., Langley, K. A., Leitchenkov, G., Leuschen, C., Luyendyk, B. P., Matsuoka, K., Mouginot, J., Nitsche, F. O., Nogi, Y., Nost, O. A., Popov, S. V., Rignot, E., Rippin, D. M., Rivera, A., Roberts, J., Ross, N., Siegert, M. J., Smith, A. M., Steinhage, D., Studinger, M., Sun, B., Tinto, B. K., Welch, B. C., Wilson, D., Young, D. A., Xiangbin, C., and Zirizzotti, A.: Bedmap2: Improved ice bed, surface and thickness datasets for Antarctica, The Cryosphere, 7, 375–393, https://doi.org/10.5194/tc-7-375-2013, 2013.
Frezzotti, M., Pourchet, M., Flora, O., Gandolfi, S., Gay, M., Urbini, S., Vincent, C., Becagli, S., Gragnani, R., Proposito, M., Severi, M., Traversi, R., Udisti, R., and Fily, M.: Spatial and temporal variability of snow accumulation in East Antarctica from traverse data, J. Glaciol., 51, 113–124, https://doi.org/10.3189/172756505781829502, 2005.
Frezzotti, M., Scarchilli, C., Becagli, S., Proposito, M., and Urbini, S.: A synthesis of the Antarctic surface mass balance during the last 800 yr, The Cryosphere, 7, 303–319, https://doi.org/10.5194/tc-7-303-2013, 2013.
Fujita, S., Maeno, H., Furukawa, T., and Matsuoka, K.: Scattering of VHF radio waves from within the top 700 m of the Antarctic ice sheet and its relation to the depositional environment: a case-study along the Syowa–Mizuho–Dome Fuji traverse, Ann. Glaciol., 34, 157–164, https://doi.org/10.3189/172756402781817888, 2002.
Fujita, S., Okuyama, J., Hori, A., and Hondoh, T.: Metamorphism of stratified firn at Dome Fuji, Antarctica: A mechanism for local insolation modulation of gas transport conditions during bubble close off, J. Geophys. Res., 114, F03023, https://doi.org/10.1029/2008JF001143, 2009.
Fujita, S., Holmlund, P., Andersson, I., Brown, I., Enomoto, H., Fujii, Y., Fujita, K., Fukui, K., Furukawa, T., Hansson, M., Hara, K., Hoshina, Y., Igarashi, M., Iizuka, Y., Imura, S., Ingvander, S., Karlin, T., Motoyama, H., Nakazawa, F., Oerter, H., Sjöberg, L. E., Sugiyama, S., Surdyk, S., Ström, J., Uemura, R., and Wilhelms, F.: Spatial and temporal variability of snow accumulation rate on the East Antarctic ice divide between Dome Fuji and EPICA DML, The Cryosphere, 5, 1057–1081, https://doi.org/10.5194/tc-5-1057-2011, 2011.
Fujita, S., Hirabayashi, M., Goto-Azuma, K., Dallmayr, R., Satow, K., Zheng, J., and Dahl-Jensen, D.: Densification of layered firn of the ice sheet at NEEM, Greenland, J. Glaciol., 60, 905–921, https://doi.org/10.3189/2014JoG14J006, 2014.
Fujita, S., Parrenin, F., Severi, M., Motoyama, H., and Wolff, E. W.: Volcanic synchronization of Dome Fuji and Dome C Antarctic deep ice cores over the past 216 kyr, Clim. Past, 11, 1395–1416, https://doi.org/10.5194/cp-11-1395-2015, 2015.
Fujita, S., Goto-Azuma, K., Hirabayashi, M., Hori, A., Iizuka, Y., Motizuki, Y., Motoyama, H., and Takahashi, K.: Densification of layered firn in the ice sheet at Dome Fuji, Antarctica, J. Glaciol., 62, 103–123, https://doi.org/10.1017/jog.2016.16, 2016.
Furukawa, T., Kamiyama, K., and Maeno, H.: Snow surface features along the traverse route from the coast to Dome Fuji station, Queen Maud Land, Antarcticm, Proc. NIPR Symp. Polar Meteorol. Glaciol., 10, 12–24, https://doi.org/10.15094/00003921, 1996.
Gao, C., Robock, A., Self, S., Witter, J. B., Steffenson, J. P., Clausen, H. B., Siggaard-Andersen, M.-L., Johnsen, S., Mayewski, P. A., and Ammann, C.: The 1452 or 1453 A.D. Kuwae eruption signal derived from multiple ice core records: Greatest volcanic sulfate event of the past 700 years, J. Geophys. Res., 111, D12107, https://doi.org/10.1029/2005JD006710, 2006.
Goosse, H., Braida, M., Crosta, X., Mairesse, A., Masson-Delmotte, V., Mathiot, P., Neukom, R., Oerter, H., Philippon, G., Renssen, H., Stenni, B., van Ommen, T., and Verleyen, E.: Antarctic temperature changes during the last millennium: evaluation of simulations and reconstructions, Quaternary Sci. Rev., 55, 75–90, https://doi.org/10.1016/j.quascirev.2012.09.003, 2012.
Goto-Azuma, K., Hirabayashi, M., Motoyama, H., Miyake, T., Kuramoto, T., Uemura, R., Igarashi, M., Iizuka, Y., Sakurai, T., Horikawa, S., Suzuki, K., Suzuki, T., Fujita, K., Kondo, Y., Hattori, S., and Fujii, Y.: Reduced marine phytoplankton sulphur emissions in the Southern Ocean during the past seven glacials, Nat. Commun, 10, 3247, https://doi.org/10.1038/s41467-019-11128-6, 2019.
Greene, C. A., Gwyther, D. E., and Blankenship, D.: Antarctic Mapping Tools for Matlab, Comput. Geosci., 104, 151–157, https://doi.org/10.1016/j.cageo.2016.08.003, 2017.
Hammer, C. U.: Acidity of polar ice cores in relation to absolute dating, past volcanism, and radio echoes, J. Glaciol., 25, 359–372, https://doi.org/10.3189/S0022143000015227, 1980.
Hammer, C. U., Clausen, H. B., and Dansgaard, W.: Greenland ice sheet evidence of post-glacial volcanism and its climatic impact, Nature, 288, 230–235, https://doi.org/10.1038/288230a0, 1980.
Hansen, J., Sato, M., Ruedy, R., Nazarenko, L., Lacis, A., Schmidt, G. A., Russell, G., Aleinov, I., Bauer, M., Bauer, S., Bell, N., Cairns, B., Canuto, V., Chandler, M., Cheng, Y., Del Genio, A., Faluvegi, G., Fleming, E., Friend, A., Hall, T., Jackman, C., Kelley, M., Kiang, N., Koch, D., Lean, J., Lerner, J., Lo, K., Menon, S., Miller, R., Minnis, P., Novakov, T., Oinas, V., Perlwitz, J., Perlwitz, J., Rind, D., Romanou, A., Shindell, D., Stone, P., Sun, S., Tausnev, N., Thresher, D., Wielicki, B., Wong, T., Yao, M., and Zhang, S.: Efficacy of climate forcings, J. Geophys. Res., 110, D18104, https://doi.org/10.1029/2005JD005776, 2005.
Hartman, L. H., Kurbatov, A. V., Winski, D. A., Cruz-Uribe, A. M., Davies, S. D., Dunbar, N. W., Iverson, N. A., Aydin, Fegyveresi, J. M., Ferris, D. G., Fudge, T. J., Osterberg, E. C., Hargreaves G. M., Yates, M. G.: Volcanic glass properties from 1459 C.E. volcanic event in South Pole ice core dismiss Kuwae caldera as a potential source, Sci. Rep., 9, 14437, https://doi.org/10.1038/s41598-019-50939-x, 2019.
Herron, M. M. and Langway, C. C.: Firn Densification: An Empirical Model, J. Glaciol., 25, 373–385, https://doi.org/10.3189/S0022143000015239, 1980.
Hodell, D. A., Kanfoush, S. L., Shemesh, A., Crosta, X., Charles, C. D., and Guilderson, T. P.: Abrupt cooling of Antarctic surface waters and sea ice expansion in the South Atlantic sector of the Southern Ocean at 5000 cal yr B.P., Quatern. Res., 56, 191–198, https://doi.org/10.1006/qres.2001.2252, 2001.
Hofstede, C. M., van de Wal, R. S. W., Kaspers, K. A., van den Broeke, M., Karlöf, L., Winther, J.-G., Isaksson, E., Lappegard, G., Mulvaney, R., Oerter, H., and Wilhelms, F.: Firn accumulation records for the past 1000 years on the basis of dielectric profiling of six cores from Dronning Maud Land, Antarctica, J. Glaciol., 50, 279–289, https://doi.org/10.3189/172756504781830169, 2004.
Horiuchi, K., Uchida, T., Sakamoto, Y., Ohta, A., Matsuzaki, H., Shibata, Y., and Motoyama, H.: Ice core record of 10Be over the past millennium from Dome Fuji, Antarctica: A new proxy record of past solar activity and a powerful tool for stratigraphic dating, Quatern. Geochronol., 3, 253–261, https://doi.org/10.1016/j.quageo.2008.01.003, 2008.
Hoshina, Y., Fujita, K., Nakazawa, F., Iizuka, Y., Miyake, T., Hirabayashi, M., Kuramoto, T., Fujita, S., and Motoyama, H.: Effect of accumulation rate on water stable isotopes of near-surface snow in inland Antarctica, J. Geophys. Res., 119, 274–283, https://doi.org/10.1002/2013JD020771, 2014.
Igarashi, M., Nakai, Y., Motizuki, Y., Takahashi, K., Motoyama, H., and Makishima, K.: Dating of the Dome Fuji shallow ice core based on a record of volcanic eruptions from AD 1260 to AD 2001, Polar Sci., 5, 411–420, https://doi.org/10.1016/j.polar.2011.08.001, 2011.
Iizuka, Y., Hondoh, T., and Fujii, Y.: Antarctic sea ice extent during the Holocene reconstructed from inland ice core evidence, J. Geophys. Res., 113, D15114, https://doi.org/10.1029/2007JD009326, 2008.
Jouzel, J., Merlivat, L., Pourchet, M., and Lorius, C.: A continuous record of artificial tritium fallout at the South Pole (1954–1978), Earth Planet. Sc. Lett., 45, 188–200, https://doi.org/10.1016/0012-821X(79)90120-1, 1979.
IPCC: Special Report on the Ocean and Cryosphere in a Changing Climate, edited by: Portner, H.-O., Roberts, D. C., Masson-Delmotte, V., Zhai, P., Tignor, M., Poloczanska, E., Mintenbeck, K., Alegria, A., Nicolai, M., Okem, A., Petzold, J., Rama, B., and Weyer, N. M., Cambridge University Press, Cambridge, UK and New York, NY, USA, 755 pp., https://doi.org/10.1017/9781009157964, 2019.
IPCC: Climate Change 2021: The Physical Science Basis, in: Contribution of Working Group I to the Sixth Assessment Report of the Intergovernmental Panel on Climate Change, edited by: Masson-Delmotte, V., Zhai, P., Pirani, A., Connors, S. L., Péan, C., Berger, S., Caud, N., Chen, Y., Goldfarb, L., Gomis, M. I., Huang, M., Leitzell, K., Lonnoy, E., Matthews, J. B. R., Maycock, T. K., Waterfield, T., Yelekçi, O., Yu, R., and Zhou, B., Cambridge, UK and New York, NY, USA, https://www.ipcc.ch/report/ar6/wg1/about/how-to-cite-this-report/ (last access: 29 January 2023), 2021.
Kahle, E. C., Steig, E. J., Jones, T. R., Fudge, T. J., Koutnik, M. R., Morris, V. A., Vaughn, B. H., Schauer, A. J., Stevens, C. M., Conway, H., Waddington, E. D., Buizert, C., Epifanio, J., and White, J. W. C.: Reconstruction of Temperature, Accumulation Rate, and Layer Thinning From an Ice Core at South Pole, Using a Statistical Inverse Method, J. Geophys. Res., 126, e2020JD033300, https://doi.org/10.1029/2020JD033300, 2021.
Kameda, T., Motoyama, H., Fujita, S., and Takahashi, S.: Temporal and spatial variability of surface mass balance at Dome Fuji, East Antarctica, by the stake method from 1995 to 2006, J. Glaciol., 54, 107–116, https://doi.org/10.3189/002214308784409062, 2008.
Kamiyama, K., Ageta, Y., and Fujii, Y.: Atmospheric and depositional environments traced from unique chemical compositions of the snow over an inland high plateau, Antarctica, J. Geophys. Res., 94, 18515–18519, https://doi.org/10.1029/jd094id15p18515, 1989.
Kaufman, D., McKay, N., Routson, C., Erb, M., Davis, B., Heiri, O., Jaccard, S., Tierney, J., Dätwyler, C., Axford, Y., Brussel, T., Cartapanis, O., Chase, B., Dawson, A., Vernal, A., Engels, S., Jonkers, L., Marsicek, J., Moffa-Sánchez, P., Morrill, C., Orsi, A., Rehfeld, K., Saunders, K., Sommer, P. S., Thomas, E., Tonello, M., Tóth, M., Vachula, R., Andreev, A., Bertrand, S., Biskaborn, B., Bringué, M., Brooks, S., Caniupán, M., Chevalier, M., Cwynar, L., Emile-Geay, J., Fegyveresi, J., Feurdean, A., Finsinger, W., Fortin, M.-C., Foster, L., Fox, M., Gajewski, K., Grosjean, M., Hausmann, S., Heinrichs, M., Holmes, N., Ilyashuk, B., Ilyashuk, E., Juggins, S., Khider, D., Koinig, K., Langdon, P., Larocque-Tobler, I., Li, J., Lotter, A.,, Luoto, T., Mackay, A., Magyari, E., Malevich, S., Mark, B., Massaferro, J., Montade, V., Nazarova, L., Novenko, E., Pařil, P., Pearson, E., Peros, M., Pienitz, R., Płóciennik, M., Porinchu, D., Potito, A., Rees, A., Reinemann, S., Roberts, S., Rolland, N., Salonen, S., Self, A., Seppä, H., Shala, S., St-Jacques, J.-M., Stenni, B., Syrykh, L., Tarrats, P., Taylor, K., Bos, V., Velle, G., Wahl, E., Walker, I., Wilmshurst, J., Zhang, E., and Zhilich, S.: A global database of Holocene paleotemperature records, Scient. Data, 7, 115, https://doi.org/10.1038/s41597-020-0445-3, 2020a.
Kaufman, D., McKay, N., Routson, C., Erb, M., twyler, C. D. x. E., Sommer, P. S., Heiri, O., and Davis, B.: Holocene global mean surface temperature, a multi-method reconstruction approach, Scient. Data, 7, 201, https://doi.org/10.1038/s41597-020-0530-7, 2020b.
Kittel, C., Amory, C., Agosta, C., Delhasse, A., Doutreloup, S., Huot, P.-V., Wyard, C., Fichefet, T., and Fettweis, X.: Sensitivity of the current Antarctic surface mass balance to sea surface conditions using MAR, The Cryosphere, 12, 3827–3839, https://doi.org/10.5194/tc-12-3827-2018, 2018.
Kovacs, A., Gow, A., J, and Morey, R. M.: The in-situ dielectric constant of polar firn revisited, Cold Reg. Sci. Technol., 23, 245–256, https://doi.org/10.1016/0165-232X(94)00016-Q, 1995.
Lamy, F., Kilian, R., Arz, H. W., Francois, J.-P., Kaiser, J., Prange, M., and Steinke, T.: Holocene changes in the position and intensity of the southern westerly wind belt, Nat. Geosci., 3, 695–699, https://doi.org/10.1038/ngeo959, 2010.
Lenaerts, J. T. M. and van den Broeke, M. R.: Modeling drifting snow in Antarctica with a regional climate model: 2. Results, J. Geophys. Res.-Atmos., 117, D05109, https://doi.org/10.1029/2010JD015419, 2012.
Li, Y., Cole-Dai, J., and Zhou, L.: Glaciochemical evidence in an East Antarctica ice core of a recent (AD 1450–1850) neoglacial episode, J. Geophys. Res., 114, D08117, https://doi.org/10.1029/2008JD011091, 2009.
Mann, M. E., Steinman, B. A., Brouillette, D. J., and Miller, S. K.: Multidecadal climate oscillations during the past millennium driven by volcanic forcing, Science, 371, 1014–1019, https://doi.org/10.1126/science.abc5810, 2021.
Marcott, S. A., Shakun, J. D., Clark, P. U., and Mix, A. C.: A reconstruction of regional and global temperature for the past 11,300 years, Science, 339, 1198–1201, https://doi.org/10.1126/science.1228026, 2013.
Martrat, B., Eggleston, S., Abram, N., Bothe, O., Linderholm, H., McGregor, H., Neukom, R., Phipps, S., and St George, S.: The PAGES 2k Network: Understanding the climate of the Common Era (past 2000 years), in: EGU General Assembly 2019, Geophysical Research Abstracts, Vol. 21, EGU2019-16976, 2019.
Massom, R. A., Pook, M. J., Comiso, J. C., Adams, N., Turner, J., Lachlan-Cope, T., and Gibson, T. T.: Precipitation over the Interior East Antarctic Ice Sheet Related to Midlatitude Blocking-High Activity, J. Climate, 17, 1914–1928, https://doi.org/10.1175/1520-0442(2004)017<1914:POTIEA>2.0.CO;2, 2004.
Masson-Delmotte, V., Buiron, D., Ekaykin, A., Frezzotti, M., Gallée, H., Jouzel, J., Krinner, G., Landais, A., Motoyama, H., Oerter, H., Pol, K., Pollard, D., Ritz, C., Schlosser, E., Sime, L. C., Sodemann, H., Stenni, B., Uemura, R., and Vimeux, F.: A comparison of the present and last interglacial periods in six Antarctic ice cores, Clim. Past, 7, 397–423, https://doi.org/10.5194/cp-7-397-2011, 2011.
Matthes, K., Funke, B., Andersson, M. E., Barnard, L., Beer, J., Charbonneau, P., Clilverd, M. A., Dudok de Wit, T., Haberreiter, M., Hendry, A., Jackman, C. H., Kretzschmar, M., Kruschke, T., Kunze, M., Langematz, U., Marsh, D. R., Maycock, A. C., Misios, S., Rodger, C. J., Scaife, A. A., Seppälä, A., Shangguan, M., Sinnhuber, M., Tourpali, K., Usoskin, I., van de Kamp, M., Verronen, P. T., and Versick, S.: Solar forcing for CMIP6 (v3.2), Geosci. Model Dev., 10, 2247–2302, https://doi.org/10.5194/gmd-10-2247-2017, 2017.
McGregor, H. V., Evans, M. N., Goosse, H., Leduc, G., Martrat, B., Addison, J. A., Mortyn, P. G., Oppo, D. W., Seidenkrantz, M.-S., Sicre, M.-A., Phipps, S. J., Selvaraj, K., Thirumalai, K., Filipsson, H. L., and Ersek, V.: Robust global ocean cooling trend for the pre-industrial Common Era, Nat. Geosci., 8, 671–677, https://doi.org/10.1038/ngeo2510, 2015.
Medley, B. and Thomas, E. R.: Increased snowfall over the Antarctic Ice Sheet mitigated twentieth-century sea-level rise, Nat. Clim. Change, 9, 34–39, https://doi.org/10.1038/s41558-018-0356-x, 2019.
Mezgec, K., Stenni, B., Crosta, X., Masson-Delmotte, V., Baroni, C., Braida, M., Ciardini, V., Colizza, E., Melis, R., Salvatore, M. C., Severi, M., Scarchilli, C., Traversi, R., Udisti, R., and Frezzotti, M.: Holocene sea ice variability driven by wind and polynya efficiency in the Ross Sea, Nat. Commun., 8, 1334–1312, https://doi.org/10.1038/s41467-017-01455-x, 2017.
Millero, F. J., Feistel, R., Wright, D. G., and McDougall, T. J.: The composition of Standard Seawater and the definition of the Reference-Composition Salinity Scale, Deep-Sea Res. Pt. I, 55, 50–72, https://doi.org/10.1016/j.dsr.2007.10.001, 2008.
Miyake, F., Suzuki, A., Masuda, K., Horiuchi, K., Motoyama, H., Matsuzaki, H., Motizuki, Y., Takahashi, K., and Nakai, Y.: Cosmic ray event of A.D. 774–775 shown in quasi-annual 10Be data from the Antarctic Dome Fuji ice core, Geophys. Res. Lett., 42, 84–89, https://doi.org/10.1002/2014GL062218, 2015.
Miyake, F., Horiuchi, K., Motizuki, Y., Nakai, Y., Takahashi, K., Masuda, K., Motoyama, H., and Matsuzaki, H.: 10Be Signature of the Cosmic Ray Event in the 10th Century CE in Both Hemispheres, as Confirmed by Quasi-Annual 10Be Data From the Antarctic Dome Fuji Ice Core, Geophys. Res. Lett., 46, 11–18, https://doi.org/10.1029/2018GL080475, 2019.
Moore, J. C. and Paren, J. G.: A new technique for dielectric logging of Antarctic ice cores, J. Phys. Colloq., 48, C1-155–C151-160, https://doi.org/10.1051/jphyscol:1987123, 1987.
Morlighem, M., Rignot, E., Binder, T., Blankenship, D., Drews, R., Eagles, G., Eisen, O., Ferraccioli, F., Forsberg, R., Fretwell, P., Goel, V., Greenbaum, J. S., Gudmundsson, H., Guo, J., Helm, V., Hofstede, C., Howat, I., Humbert, A., Jokat, W., Karlsson, N. B., Lee, W. S., Matsuoka, K., Millan, R., Mouginot, J., Paden, J., Pattyn, F., Roberts, J., Rosier, S., Ruppel, A., Seroussi, H., Smith, E. C., Steinhage, D., Sun, B., Broeke, M. R. v. d., Ommen, T. D. v., Wessem, M. v., and Young, D. A.: Deep glacial troughs and stabilizing ridges unveiled beneath the margins of the Antarctic ice sheet, Nat. Geosci., 13, 132–137, https://doi.org/10.1038/s41561-019-0510-8, 2020.
Motizuki, Y., Nakai, Y., Takahashi, K., Igarashi, M., Motoyama, H., and Suzuki, K.: Dating of a Dome Fuji (Antarctica) shallow ice core by volcanic signal synchronization with B32 and EDML1 chronologies, The Cryosphere Discuss., 8, 769–804, https://doi.org/10.5194/tcd-8-769-2014, 2014.
Motoyama, H., Takahashi, A., Tanaka, Y., Shinbori, K., Miyahara, M., Yoshimoto, T., Fujii, Y., Furusaki, A., Azuma, N., Ozawa, Y., Kobayashi, A., and Yoshise, Y.: Deep ice core drilling to a depth of 3035.22 m at Dome Fuji, Antarctica in 2001–07, Ann. Glaciol., 62, 212–222, https://doi.org/10.1017/aog.2020.84, 2021.
Mottram, R., Hansen, N., Kittel, C., Van Wessem, M., Agosta, C., Amory, C., Boberg, F., Van De Berg, W. J., Fettweis, X., Gossart, A., van Lipzig, N. P. M., van Meijgaard, E., Orr, A., Phillips, T., Webster, S., Simonsen, S. B., and Souverijns, N.: What is the Surface Mass Balance of Antarctica? An Intercomparison of Regional Climate Model Estimates, The Cryosphere, 15, 3751–3784, https://doi.org/10.5194/tc-15-3751-2021, 2021.
Narcisi, B., Petit, J. R., Delmonte, B., Basile-Doelsch, I., and Maggi, V.: Characteristics and sources of tephra layers in the EPICA-Dome C ice record (East Antarctica): Implications for past atmospheric circulation and ice core stratigraphic correlations, Earth Planet. Sc. Lett, 239, 253–265, https://doi.org/10.1016/j.epsl.2005.09.005, 2005.
Nielsen, S. H. H., Koç, N., and Crosta, X.: Holocene climate in the Atlantic sector of the Southern Ocean: Controlled by insolation or oceanic circulation?, Geology, 32, 317–320, https://doi.org/10.1130/G20334.1, 2004.
Oerter, H., Wilhelms, F., Jung-Rothenhausler, F., Goktas, F., Miller, H., Graf, W., and Sommer, S.: Accumulation rates in Dronning Maud Land, Antarctica, as revealed by dielectric-profiling measurements of shallow firn cores, Ann. Glaciol., 30, 27–34, https://doi.org/10.3189/172756400781820705, 2000.
Osipov, E. Y., Khodzher, T. V., Golobokova, L. P., Onischuk, N. A., Lipenkov, V. Y., Ekaykin, A. A., Shibaev, Y. A., and Osipova, O. P.: High-resolution 900 year volcanic and climatic record from the Vostok area, East Antarctica, The Cryosphere, 8, 843–851, https://doi.org/10.5194/tc-8-843-2014, 2014.
Oyabu, I., Kawamura, K., Buizert, C., Parrenin, F., Orsi, A., Kitamura, K., Aoki, S., and Nakazawa, T.: The Dome Fuji ice core DF2021 chronology (0–207 kyr BP), Quaternary Sci. Rev., 294, 107754, https://doi.org/10.1016/j.quascirev.2022.107754, 2022a.
Oyabu, I., Kawamura, K., Fujita, S., Inoue, R., Motoyama, H., Fukui, K., Hirabayashi, M., Hoshina, Y., Kurita, N., Nakazawa, F., Ohno, H., Sugiura, K., Suzuki, T., Tsutaki, S., Abe-Ouchi, A., Niwano, M., Parrenin, F., Saito, F., and Yoshimori, M.: Accumulation rate, volcanic tie points, ECM, DEP, nssSO4, density and chronology from shallow ice cores around Dome Fuji, East Antarctica 1.00, Arctic Data archive System (ADS) [data set], https://doi.org/10.17592/001.2022081901, 2022b.
PAGES 2k Consortium: Continental-scale temperature variability during the past two millennia, Nat. Geosci., 6, 339–346, https://doi.org/10.1038/ngeo1797, 2013.
PAGES 2k Consortium: Consistent multidecadal variability in global temperature reconstructions and simulations over the Common Era, Nat. Geosci., 12, 643–649, https://doi.org/10.1038/s41561-019-0400-0, 2019.
Palais, J. M., Kyle, P. R., Mosley-Thompson, E., and Thomas, E.: Correlation of a 3,200 year old tephra in ice cores from Vostok and South Pole Stations, Antarctica, Geophys. Res. Lett., 14, 804–807, https://doi.org/10.1029/GL014i008p00804, 1987.
Parrenin, F., Dreyfus, G., Durand, G., Fujita, S., Gagliardini, O., Gillet, F., Jouzel, J., Kawamura, K., Lhomme, N., Masson-Delmotte, V., Ritz, C., Schwander, J., Shoji, H., Uemura, R., Watanabe, O., and Yoshida, N.: 1-D-ice flow modelling at EPICA Dome C and Dome Fuji, East Antarctica, Clim. Past, 3, 243–259, https://doi.org/10.5194/cp-3-243-2007, 2007.
Parrenin, F., Fujita, S., Abe-Ouchi, A., Kawamura, K., Masson-Delmotte, V., Motoyama, H., Saito, F., Severi, M., Stenni, B., Uemura, R., and Wolff, E. W.: Climate dependent contrast in surface mass balance in East Antarctica over the past 216 ka, J. Glaciol., 62, 1037–1048, https://doi.org/10.1017/jog.2016.85, 2016.
Parrenin, F., Bazin, L., Buizert, C., Capron, E., Beeman, J. C., Corrick, E. C., Drysdale, R. N., Kawamura, K., Landais, A., Mulvaney, R., Oyabu, I., and Rasmussen, S. O.: The Paleochrono probabilistic model to derive a consistent chronology for several paleoclimatic sites, in: EGU General Assembly 2021, online, 19–30, https://doi.org/10.5194/egusphere-egu21-822, 2021.
Plummer, C. T., Curran, M. A. J., van Ommen, T. D., Rasmussen, S. O., Moy, A. D., Vance, T. R., Clausen, H. B., Vinther, B. M., and Mayewski, P. A.: An independently dated 2000-yr volcanic record from Law Dome, East Antarctica, including a new perspective on the dating of the 1450s CE eruption of Kuwae, Vanuatu, Clim. Past, 8, 1929–1940, https://doi.org/10.5194/cp-8-1929-2012, 2012.
Previdi, M. and Polvani, L. M.: Anthropogenic impact on Antarctic surface mass balance, currently masked by natural variability, to emerge by mid-century, Environ. Res. Lett., 11, 094001, https://doi.org/10.1088/1748-9326/11/9/094001, 2016.
Rignot, E., Mouginot, J., Scheuchl, B., van den Broeke, M. R., Van Wessem, M., and Morlighem, M.: Four decades of Antarctic Ice Sheet mass balance from 1979–2017, P. Natl. Acad. Sci. USA, 116, 1095–1103, https://doi.org/10.1073/pnas.1812883116, 2019.
Rubino, M., Etheridge, D. M., Thornton, D. P., Howden, R., Allison, C. E., Francey, R. J., Langenfelds, R. L., Steele, L. P., Trudinger, C. M., Spencer, D. A., Curran, M. A. J., van Ommen, T. D., and Smith, A. M.: Revised records of atmospheric trace gases CO2, CH4, N2O, and δ13C-CO2 over the last 2000 years from Law Dome, Antarctica, Earth Syst. Sci. Data, 11, 473–492, https://doi.org/10.5194/essd-11-473-2019, 2019.
Saito, F.: Development of a three dimensional ice sheetmodel for numerical studies of Antarctic and Greenland ice sheet, PhD thesis, University of Tokyo, Department of Earth and Planetary Science, Tokyo, Japan, http://gakui.dl.itc.u-tokyo.ac.jp/cgi-bin/gazo.cgi?no=116763 (last access: 29 January 2023), 2002.
Saruya, T., Fujita, S., and Inoue, R.: Dielectric anisotropy as indicator of crystal orientation fabric in Dome Fuji ice core: Method and initial results, J. Glaciol., 68, 65–76, https://doi.org/10.1017/jog.2021.73, 2022.
Scarchilli, C., Frezzotti, M., and Ruti, P. M.: Snow precipitation at four ice core sites in East Antarctica: Provenance, seasonality and blocking factors, Clim. Dynam., 37, 2107–2125, https://doi.org/10.1007/s00382-010-0946-4, 2011.
Schröder, L., Horwath, M., Dietrich, R., Helm, V., van den Broeke, M. R., and Ligtenberg, S. R. M.: Four decades of Antarctic surface elevation changes from multi-mission satellite altimetry, The Cryosphere, 13, 427–449, https://doi.org/10.5194/tc-13-427-2019, 2019.
Shevenell, A. E., Ingalls, A. E., Domack, E. W., and Kelly, C.: Holocene Southern Ocean surface temperature variability west of the Antarctic Peninsula, Nature, 470, 250–254, https://doi.org/10.1038/nature09751, 2011.
Sigl, M., McConnell, J. R., Toohey, M., Curran, M., Das, S. B., Edwards, R., Isaksson, E., Kawamura, K., Kipfstuhl, S., Kruger, K., Layman, L., Maselli, O. J., Motizuki, Y., Motoyama, H., Pasteris, D. R., and Severi, M.: Insights from Antarctica on volcanic forcing during the Common Era, Nat. Clim. Change, 4, 693–697, https://doi.org/10.1038/nclimate2293, 2014.
Sigl, M., Fudge, T. J., Winstrup, M., Cole-Dai, J., Ferris, D., McConnell, J. R., Taylor, K. C., Welten, K. C., Woodruff, T. E., Adolphi, F., Bisiaux, M., Brook, E. J., Buizert, C., Caffee, M. W., Dunbar, N. W., Edwards, R., Geng, L., Iverson, N., Koffman, B., Layman, L., Maselli, O. J., McGwire, K., Muscheler, R., Nishiizumi, K., Pasteris, D. R., Rhodes, R. H., and Sowers, T. A.: The WAIS Divide deep ice core WD2014 chronology – Part 2: Annual-layer counting (0–31 ka BP), Clim. Past, 12, 769–786, https://doi.org/10.5194/cp-12-769-2016, 2016.
Sigl, M., Toohey, M., McConnell, J. R., Cole-Dai, J., and Severi, M.: Volcanic stratospheric sulfur injections and aerosol optical depth during the Holocene (past 11 500 years) from a bipolar ice-core array, Earth Syst. Sci. Data, 14, 3167–3196, https://doi.org/10.5194/essd-14-3167-2022, 2022.
Solomina, O. N., Bradley, R. S., Hodgson, D. A., Ivy-Ochs, S., Jomelli, V., Mackintosh, A. N., Nesje, A., Owen, L. A., Wanner, H., Wiles, G. C., and Young, N. E.: Holocene glacier fluctuations, Quaternary Sci. Rev., 111, 9–34, https://doi.org/10.1016/j.quascirev.2014.11.018, 2015.
Stokes, C. R., Abram, N. J., Bentley, M. J., Edwards, T. L., England, M. H., Foppert, A., Jamieson, S. S. R., Jones, R. S., King, M. A., Lenaerts, J. T. M., Medley, B., Miles, B. W. J., Paxman, G. J. G., Ritz, C., van de Flierdt, T., and Whitehouse, P. L.: Response of the East Antarctic Ice Sheet to past and future climate change, Nature, 608, 275–286, https://doi.org/10.1038/s41586-022-04946-0, 2022.
Suzuki, K., Yamanouchi, T., and Motoyama, H.: Moisture transport to Syowa and Dome Fuji stations in Antarctica, J. Geophys. Res., 113, 149–111, https://doi.org/10.1029/2008JD009794, 2008.
The IMBIE team: Mass balance of the Antarctic Ice Sheet from 1992 to 2017, Nature, 558, 219–222, https://doi.org/10.1038/s41586-018-0179-y, 2018.
Thomas, E. R., Melchior Van Wessem, J., Roberts, J., Isaksson, E., Schlosser, E., Fudge, T. J., Vallelonga, P., Medley, B., Lenaerts, J., Bertler, N., van den Broeke, M. R., Dixon, D. A., Frezzotti, M., Stenni, B., Curran, M., and Ekaykin, A. A.: Regional Antarctic snow accumulation over the past 1000 years, Clim. Past, 13, 1491–1513, https://doi.org/10.5194/cp-13-1491-2017, 2017.
Tsutaki, S., Fujita, S., Kawamura, K., Abe-Ouchi, A., Fukui, K., Motoyama, H., Hoshina, Y., Nakazawa, F., Obase, T., Ohno, H., Oyabu, I., Saito, F., Sugiura, K., and Suzuki, T.: High-resolution subglacial topography around Dome Fuji, Antarctica, based on ground-based radar surveys over 30 years, The Cryosphere, 16, 2967–2983, https://doi.org/10.5194/tc-16-2967-2022, 2022.
Turner, J., Phillips, T., Thamban, M., Rahaman, W., Marshall, G. J., Wille, J. D., Favier, V., Winton, V. H. L., Thomas, E., Wang, Z., van den Broeke, M., Hosking, J. S., and Lachlan-Cope, T.: The dominant role of extreme precipitation events in Antarctic snowfall variability, Geophys. Res. Lett., 46, 3502–3511, https://doi.org/10.1029/2018GL081517, 2019.
Urbini, S., Frezzotti, M., Gandolfi, S., Vincent, C., Scarchilli, C., Vittuari, L., and Fily, M.: Historical behaviour of Dome C and Talos Dome (East Antarctica) as investigated by snow accumulation and ice velocity measurements, Global Planet. Change, 60, 576–588, https://doi.org/10.1016/j.gloplacha.2007.08.002, 2008.
Van Liefferinge, B., Taylor, D., Tsutaki, S., Fujita, S., Gogineni, P., Kawamura, K., Matsuoka, K., Moholdt, G., Oyabu, I., Abe-Ouchi, A., Awasthi, A., Buizert, C., Gallet, J.-C., Isaksson, E., Motoyama, H., Nakazawa, F., Ohno, H., O'Neill, C., Pattyn, F., and Sugiura, K.: Surface Mass Balance Controlled by Local Surface Slope in Inland Antarctica: Implications for Ice-Sheet Mass Balance and Oldest Ice Delineation in Dome Fuji, Geophys. Res. Lett., 48, e2021GL094966, https://doi.org/10.1029/2021GL094966, 2021.
Vannitsem, S., Dalaiden, Q., and Goosse, H.: Testing for Dynamical Dependence: Application to the Surface Mass Balance Over Antarctica, Geophys. Res. Lett., 46, 12125–12135, https://doi.org/10.1029/2019GL084329, 2019.
Van Wessem, J., Jan Van De Berg, W., Noël, B. P. Y., van Meijgaard, E., Amory, C., Birnbaum, G., Jakobs, C. L., Krüger, K., Lenaerts, J. T. M., Lhermitte, S., Ligtenberg, S. R. M., Medley, B., Reijmer, C. H., Van Tricht, K., Trusel, L. D., Van Ulft, L. H., Wouters, B., Wuite, J., and van den Broeke, M. R.: Modelling the climate and surface mass balance of polar ice sheets using RACMO2 – Part 2: Antarctica (1979–2016), The Cryosphere, 12, 1479–1498, https://doi.org/10.5194/tc-12-1479-2018, 2018.
Velicogna, I., Mohajerani, Y., Geruo, A., Landerer, F., Mouginot, J., Noel, B., Rignot, E., Sutterley, T., van den Broeke, M., Van Wessem, M., and Wiese, D.: Continuity of Ice Sheet Mass Loss in Greenland and Antarctica From the GRACE and GRACE Follow-On Missions, Geophys. Res. Lett., 47, e87291, https://doi.org/10.1029/2020GL087291, 2020.
Watanabe, O., Fujii, Y., Motoyama, H., Furukawa, T., Shoji, H., Enomoto, H., Kameda, T., Narita, H., Naruse, R., Hondoh, T., Fujita, S., Mae, S., Azuma, N., Kobayashi, S., Nakawo, M., and Ageta, Y.: A Preliminary study of ice core chronology at Dome Fuji station, Antarctica, Proceedings of the NIPR Symposium on Polar Meteorology and Glaciology, 11, 9–13, https://doi.org/10.15094/00003965, 1997a.
Watanabe, O., Shimada, W., Narita, H., Miyamoto, A., Tayuki, K., Hondoh, T., Kawamura, T., Fujita, S., Shoji, H., Enomoto, H., Kameda, T., Kawada, K., and Yokoyama, K.: Preliminary discussion of physical properties of the Dome Fuji shallow ice core in 1993, Antarctica, Proc. NIPR Symp. Polar Meteorol. Glaciol., 11, 1–8, https://doi.org/10.15094/00003964, 1997b.
Weinhart, A. H., Freitag, J., Hörhold, M., Kipfstuhl, S., and Eisen, O.: Representative surface snow density on the East Antarctic Plateau, The Cryosphere, 14, 3663–3685, https://doi.org/10.5194/tc-14-3663-2020, 2020.
Wilhelms, F., Kipfstuhl, J., Miller, H., Heinloth, K., and Firestone, J.: Precise dielectric profiling of ice cores: a new device with improved guarding and its theory, J. Glaciol., 44, 171–174, https://doi.org/10.3189/S002214300000246X, 1998.
Winski, D. A., Osterberg, E. C., Kreutz, K. J., Ferris, D. G., Cole-Dai, J., Thundercloud, Z., Huang, J., Alexander, B., Jaeglé, L., Kennedy, J. A., Larrick, C., Kahle, E. C., Steig, E. J., and Jones, T. R.: Seasonally Resolved Holocene Sea Ice Variability Inferred From South Pole Ice Core Chemistry, Geophys. Res. Lett., 48, e2020GL091602, https://doi.org/10.1029/2020GL091602, 2021.
Wolff, E., Rankin, A. M., and Röthlisberger, R.: An ice core indicator of Antarctic sea ice production?, Geophys. Res. Lett., 30, 2158, https://doi.org/10.1029/2003GL018454, 2003.
Wolff, E. W.: Electrical stratigraphy of polar ice cores: Principles, methods, and findings, edited by: Hondoh, T., Hokkaido University Press, Sapporo, 155–171, http://hdl.handle.net/2115/32467 (last access: 29 January 2023), 2000.
Wu, C. J., Krivova, N. A., Solanki, S. K., and Usoskin, I. G.: Solar total and spectral irradiance reconstruction over the last 9000 years, Astron. Astrophys., 620, A120, https://doi.org/10.1051/0004-6361/201832956, 2018.
Xiao, W., Esper, O., and Gersonde, R.: Last Glacial – Holocene climate variability in the Atlantic sector of the Southern Ocean, Quaternary Sci. Rev., 135, 115–137, https://doi.org/10.1016/j.quascirev.2016.01.023, 2016.
- Abstract
- Introduction
- Materials and methods
- Results
- Discussion
- Conclusion
- Appendix A: Conversion of relative permittivity to density for NDF2018, DFNW, DFSE and NDFN cores
- Appendix B: Age tie points
- Data availability
- Author contributions
- Competing interests
- Disclaimer
- Special issue statement
- Acknowledgements
- Financial support
- Review statement
- References