the Creative Commons Attribution 4.0 License.
the Creative Commons Attribution 4.0 License.
 | 17 Nov 2023
Model and proxy evidence for coordinated changes in the hydroclimate of distant regions over the Last Millennium
Jesús Fidel González-Rouco
Jason E. Smerdon
Félix García-Pereira
The Medieval Climate Anomaly (MCA; ca. 950–1250 CE) and the Little Ice Age (LIA; ca. 1450–1850 CE) were periods generally characterized by respectively higher and lower temperatures in many regions. However, they have also been associated with drier and wetter conditions in areas around the Intertropical Convergence Zone (ITCZ) and the Asian Monsoon region and in areas impacted by large-scale climatic modes like the Northern Annular Mode and Southern Annular Mode (NAM and SAM respectively). To analyze coordinated changes in large-scale hydroclimate patterns and whether similar changes also extend to other periods of the Last Millennium (LM) outside the MCA and the LIA, reconstruction-based products have been analyzed. This includes the collection of tree-ring-based drought atlases (DAs), the Paleo Hydrodynamics Data Assimilation product (PHYDA) and the Last Millennium Reanalysis (LMR). These analyses have shown coherent changes in the hydroclimate of tropical and extratropical regions, such as northern and central South America, East Africa, western North America, western Europe, the Middle East, Southeast Asia, and the Indo-Pacific, during the MCA, the LIA and other periods of the LM. Comparisons with model simulations from the Community Earth System Model – Last Millennium Ensemble (CESM-LME) and phases 5 and 6 of the Coupled Model Intercomparison Project (CMIP5 and CMIP6) show that both external forcing and internal variability contributed to these changes, with the contribution of internal variability being particularly important in the Indo-Pacific basin and that of external forcing in the Atlantic basin. These results may help to identify not only those areas showing coordinated changes, but also those regions more impacted by the internal variability, where forced model simulations would not be expected to successfully reproduce the evolution of past actual hydroclimate changes.
- Article
(22202 KB) - Full-text XML
- BibTeX
- EndNote


The climate of the Last Millennium (LM) was characterized in many regions by periods of warmer and cooler conditions with respect to the pre-industrial mean climate (Diaz et al., 2011; Graham et al., 2010), two well-known examples being the Medieval Climate Anomaly (MCA; ca. 950–1250 CE) and the Little Ice Age (LIA; ca. 1450–1850 CE; Graham et al., 2007; Laird et al., 2012; Ledru et al., 2013). Such temperature changes are often associated with changes in external forcing factors like solar variability and volcanic activity (Mann et al., 2009; Schurer et al., 2013; Fernández-Donado et al., 2013). The impact of these changes on hydroclimate is not straightforward, but reconstructions show that episodes of severe drought also took place during the LM in many regions (Cook et al., 2022). Periods of wetter and drier conditions existed in large areas of North America (Cook et al., 2010b), Europe (Luterbacher et al., 2012), South America (Vuille et al., 2012) and Monsoon Asia (Hu et al., 2008), with occurrences that coincide with the MCA and the LIA.
These similarities in the evolution of the hydroclimate of distant regions suggest coordinated changes at a global scale (Graham et al., 2010; Atwood et al., 2021). For example, reconstructions from southwestern North America (Graham et al., 2007; Meko et al., 2001; Cook et al., 2004, 2010b; Hughes and Funkhouser, 1998; Anderson, 2011) and the Mediterranean basin (Luterbacher et al., 2012; Martín-Puertas et al., 2010; Morellón et al., 2009) show drier conditions during the MCA and wetter conditions during the LIA. In contrast, reconstructions from northwestern North America (Steinman et al., 2013; Stevens and Dean, 2008), central Europe (Büntgen et al., 2010, 2011) and the British Isles (Wilson et al., 2012; Proctor et al., 2000) tend to show wetter conditions during the MCA and drier conditions during the LIA.
An antiphased relationship between the MCA and LIA is also observed in tropical areas of South America. Wetter conditions are found during the MCA in areas of northern South America, like the Cariaco Basin in Venezuela (Haug et al., 2001), and drier conditions in areas of central South America, like Peru (Bird et al., 2011; Reuter et al., 2009; Vuille et al., 2012; Thompson et al., 1986; Apaéstegui et al., 2014) and eastern Brazil (Vuille et al., 2012; Taylor, 2010; Novello et al., 2012). In East Africa, Anchukaitis and Tierney (2013) showed coordinated changes for Lake Challa (Verschuren et al., 2009; Wolff et al., 2011), Naivasha (Verschuren et al., 2000; Verschuren, 2001), Tanganyika (Tierney et al., 2010a), Masoko (Gilbert et al., 2002; Garcin et al., 2006, 2007) and Malawi (Johnson et al., 2001; Brown and Johnson, 2005; Johnson and McCave, 2008), with an opposite behavior between the lakes in the south and the north of the Intertropical Convergence Zone (ITCZ). Changes in the ITCZ have also been associated with coordinated changes in the hydroclimate of the Indian Monsoon region. Wetter conditions during the MCA and drier conditions during the LIA are found for wide areas of Pakistan (von Rad et al., 1999; Treydte et al., 2006), India (Sinha et al., 2007; Berkelhammer et al., 2010; Bryson and Swain, 1981; Phadtare and Pant, 2006) and the Arabian Sea (Burns et al., 2002; Fleitmann et al., 2003; Anderson et al., 2002; Gupta et al., 2003). Alterations of the ITCZ have also been associated with changes in the hydroclimate of the Indo-Pacific basin (Atwood et al., 2021). A marked transition between the MCA and LIA is found in areas of China (Wang et al., 2005; Zhang et al., 2008; Hu et al., 2008), Southeast Asia (Buckley et al., 2010, 2007), Indonesia (Griffiths et al., 2016; Newton et al., 2006; Tierney et al., 2010b), northern Australia (Denniston et al., 2016) and the eastern Pacific islands (Sachs et al., 2009; Higley et al., 2018).
Most of the impacted regions are located in the extratropics, in the boundary between low and high pressures within the regions of the Northern Annular Mode and Southern Annular Mode (NAM and SAM; Thompson and Wallace, 2001; Jones et al., 2009; Fogt et al., 2009), or in tropical areas around the ITCZ. Analyses based on simulated data (Roldán-Gómez et al., 2020) link transitions from the MCA to LIA in extratropical areas with alterations in the variability in modes like the NAM and SAM (Ortega et al., 2015; Jones et al., 2009; Fogt et al., 2009), mainly driven by changes in external forcing factors (Roldán-Gómez et al., 2020). In tropical areas, the transitions from the MCA to LIA can be linked to alterations of the ITCZ (Atwood et al., 2021), like a contraction over the western Pacific (Denniston et al., 2016; Yan et al., 2015) and shifts over East Africa (Anchukaitis and Tierney, 2013), the Indian Monsoon region (Fleitmann et al., 2003) and the eastern Pacific (Higley et al., 2018). The analysis of the simulated hydroclimate from the Community Earth System Model – Last Millennium Ensemble (CESM-LME; Otto-Bliesner et al., 2015) performed by Roldán-Gómez et al. (2022) shows that these alterations of the ITCZ may be impacted by both external forcing factors and internal variability.
Even if individual reconstructions from different regions suggest coordinated changes in the hydroclimate during the MCA and LIA, global analyses based on proxy data are scarce and limited to certain reconstructions and products. The analysis of simulated data provides an insight into the mechanisms explaining coordinated changes in the hydroclimate of the LM, but analyses of LM simulations must account for both forced and internal variability (Roldán-Gómez et al., 2022). This work addresses these challenges by performing a comparative assessment of the LM hydroclimate at global and large continental scales from different sources, including reconstructions, model simulations, and hybrid products based on data assimilation and reanalysis. The use of several reconstruction-based products allows the identification with a robustness assessment of those regions more impacted by hydroclimatic changes during the MCA and LIA and more generally during the LM. The comparison between reconstruction-based products and model simulations from different ensembles allows an assessment of the contributions of external forcing and internal variability to the hydroclimate of each region, showing those regions where model simulations can provide representative information about changes in the hydroclimate.
To survey the available evidence, we assessed 96 reconstructions reporting changes from wetter to drier or from drier to wetter conditions during the transition from the MCA to LIA (Fig. 1, with detailed references in Table 2). The reconstructions used in this compilation include proxy data from tree rings, marine and lake sediments, speleothems, ice cores, and documentary information. These sources provide information about precipitation, moisture, level of lakes and river flows, which can be linked to drier and wetter conditions. Some reconstructions represent the annual hydroclimate, while some others are sensitive to a particular season, as described in Table 2.
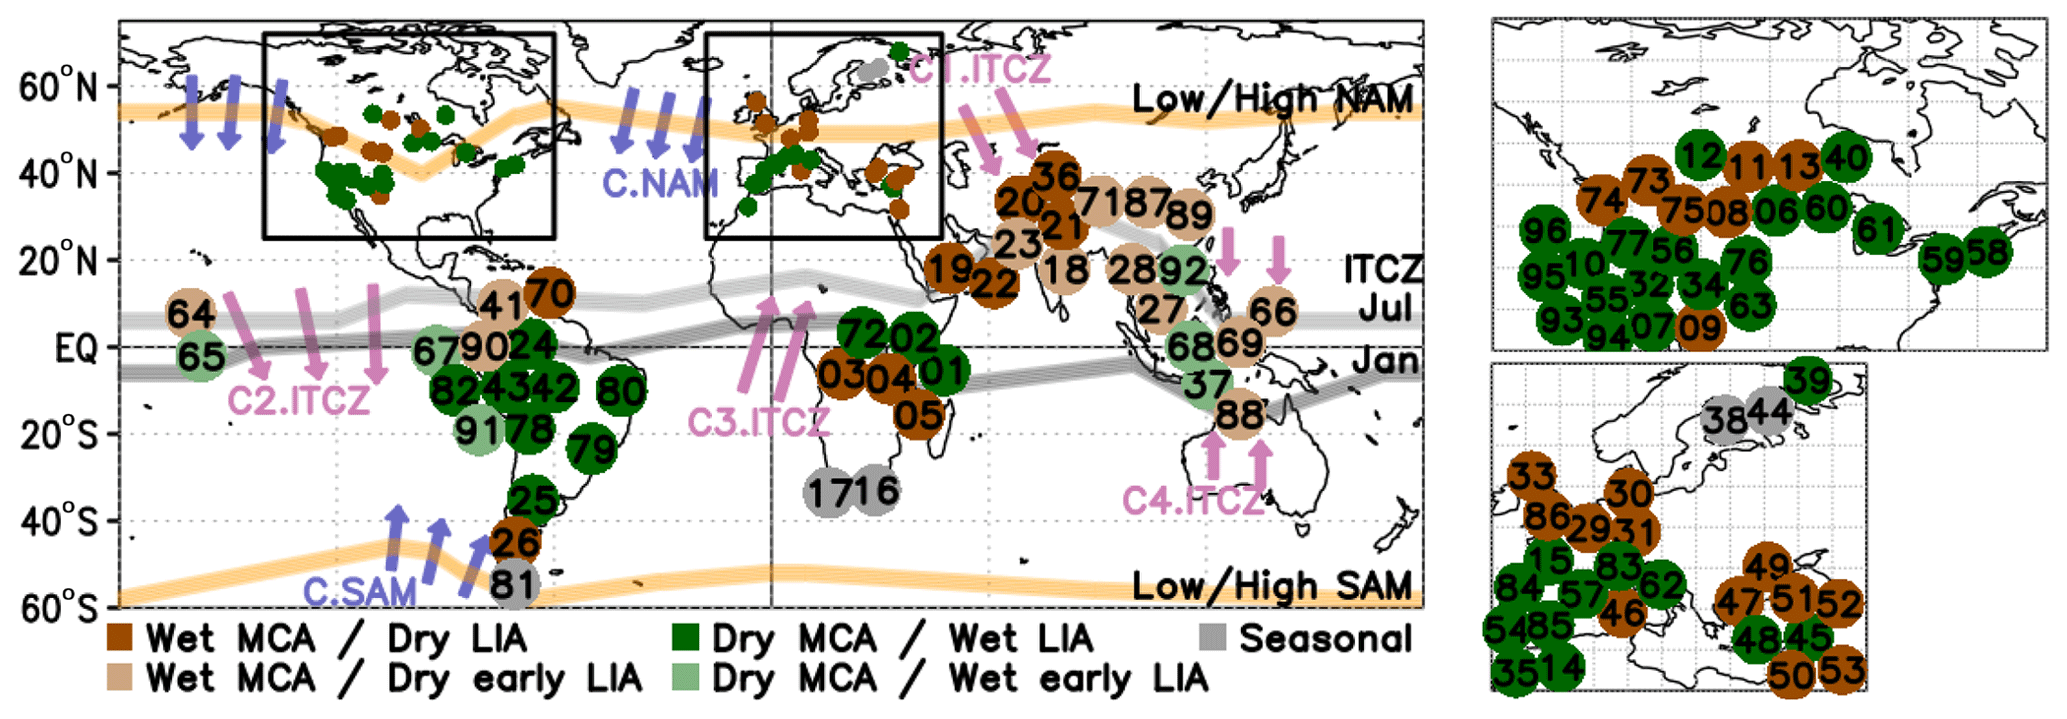
Figure 1Hydroclimate reconstructions showing (dark brown) drier conditions during MCA and wetter conditions during LIA, (light brown) drier conditions during MCA and wetter conditions during early LIA (until the late 1500s CE), (dark green) wetter conditions during MCA and drier conditions during LIA, (light green) wetter conditions during MCA and drier conditions during early LIA (until the late 1500s CE), and (gray) drier or wetter conditions in MCA and LIA depending on the season. Shown within the map, according to the references included in Table 1, are the current position of the ITCZ in July and January; the ITCZ changes in the transition from MCA to LIA in the Indian Monsoon region (C1.ITCZ), eastern Pacific (C2.ITCZ), East Africa (C3.ITCZ) and western Pacific (C4.ITCZ); the boundary between low and high pressures in the pattern of NAM and SAM; and the changes in this boundary in the transition from MCA to LIA (C.NAM and C.SAM). Arrows only indicate the direction of the changes and not their magnitude. Regional maps over North America and Europe are shown on the right side of the panel. Detailed references are included in Table 2.
Table 1References for the position of ITCZ, the boundary between low and high pressures in the pattern of NAM and SAM, and the changes in these two elements during MCA and LIA according to the codes included in Fig. 1.
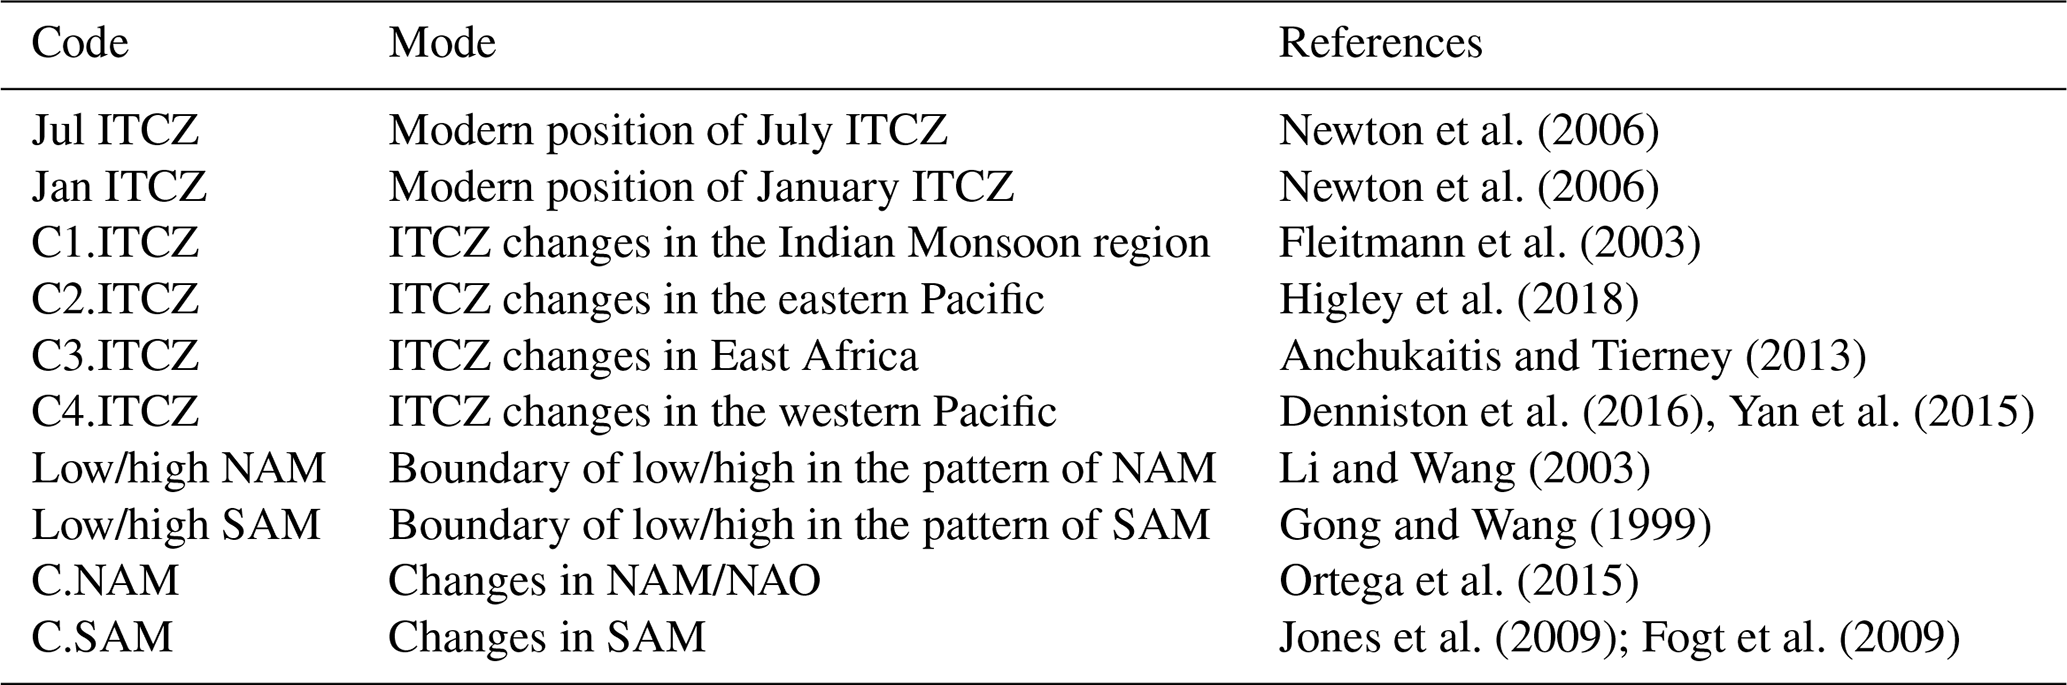
Table 2Location, references, season and type of reconstruction (sediments, tree rings, speleothems, documentary, ice cores or multi-proxy) for the reconstructions represented in Fig. 1. The first column indicates the code used in Fig. 1 for each reconstruction.
All the reconstructions included in the compilation cover the MCA and LIA. Some of them show consistent drier or wetter conditions during the whole LIA (dark green and dark brown), while some others show drier or wetter conditions until the late 1500s CE, during the early LIA (light green and light brown), as reported for areas of Pakistan, western India and southern China by Graham et al. (2010).
The reconstructions from Fig. 1 are used as reference for the analysis of reconstruction-based and model-based products included in the following sections.
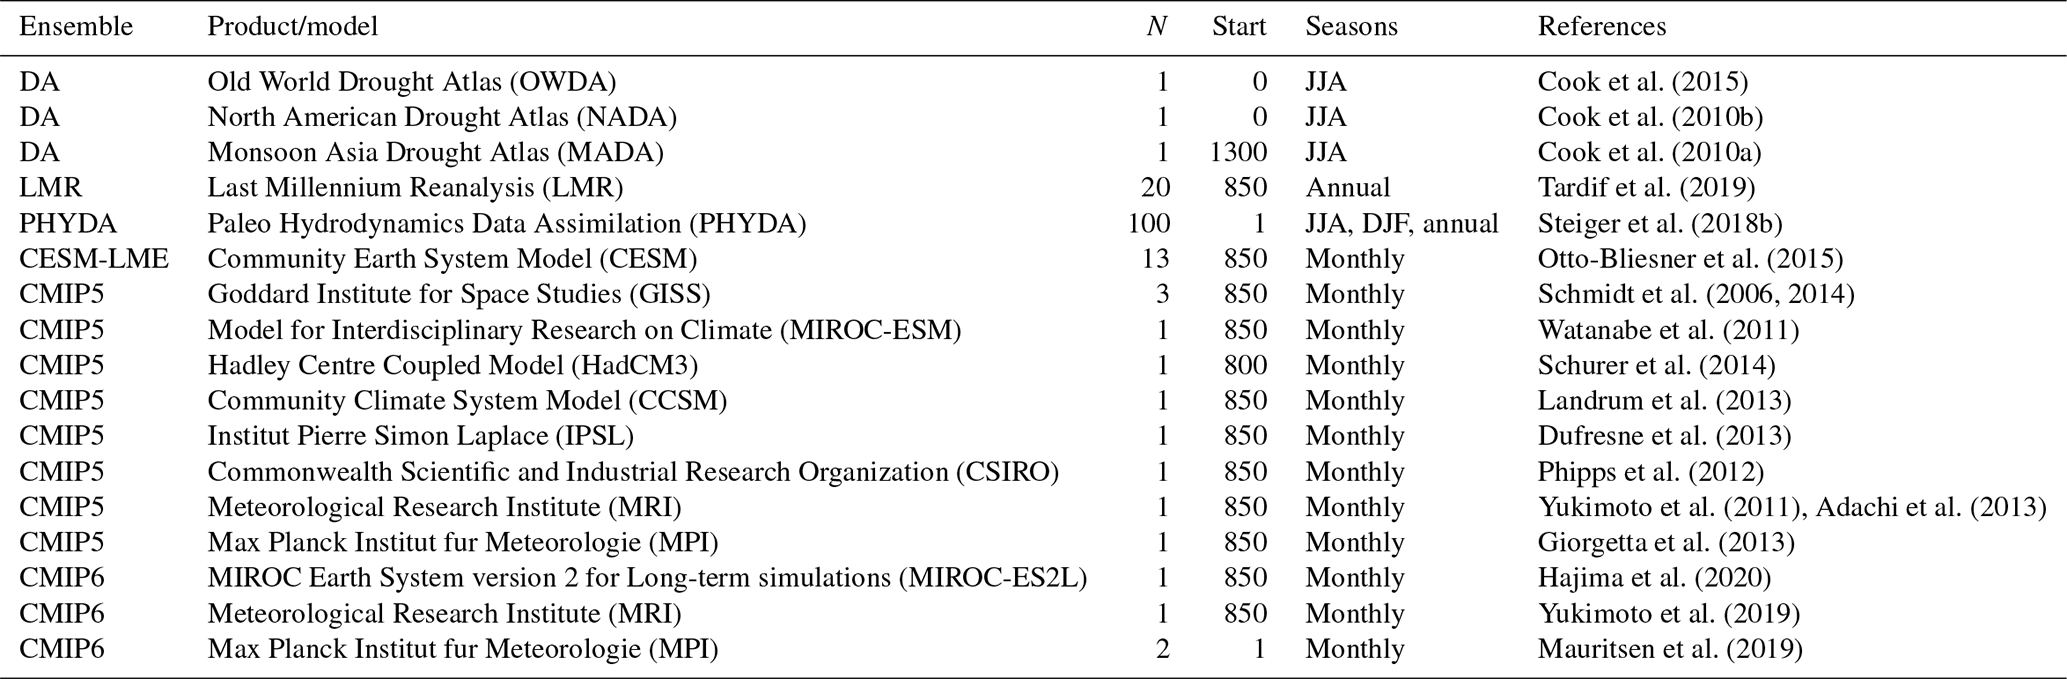
The following reconstruction-based products are employed: the 100-member ensemble of the Paleo Hydrodynamics Data Assimilation product (PHYDA; Steiger et al., 2018b); the 20-member ensemble of the Last Millennium Reanalysis (LMR; Tardif et al., 2019); and the tree-ring-based drought atlases (DAs), including the Old World Drought Atlas (OWDA; Cook et al., 2015), the North American Drought Atlas (NADA; Cook et al., 2010b) and the Monsoon Asia Drought Atlas (MADA; Cook et al., 2010a). Due to the fact that they do not extend back into the MCA and LIA, other DAs have not been included in our analyses, and since the MADA does not extend back into the MCA, it has only been considered for the analysis of time series of Sect. 3.3. Even if the PHYDA and LMR provide data for the whole millennium, some of the proxies used for the assimilation do not extend so far in the past. Figure 2 shows the distribution of proxies from Steiger et al. (2018a), including those that cover the MCA and LIA. There is a large number of proxies covering these periods in regions like North America and Europe, so for these regions the products would be expected to follow the behavior of the proxies. However, for other regions like central Africa and eastern South America, the lack of proxies could increase the contribution of the model used for the assimilation and thus the uncertainty in the products.
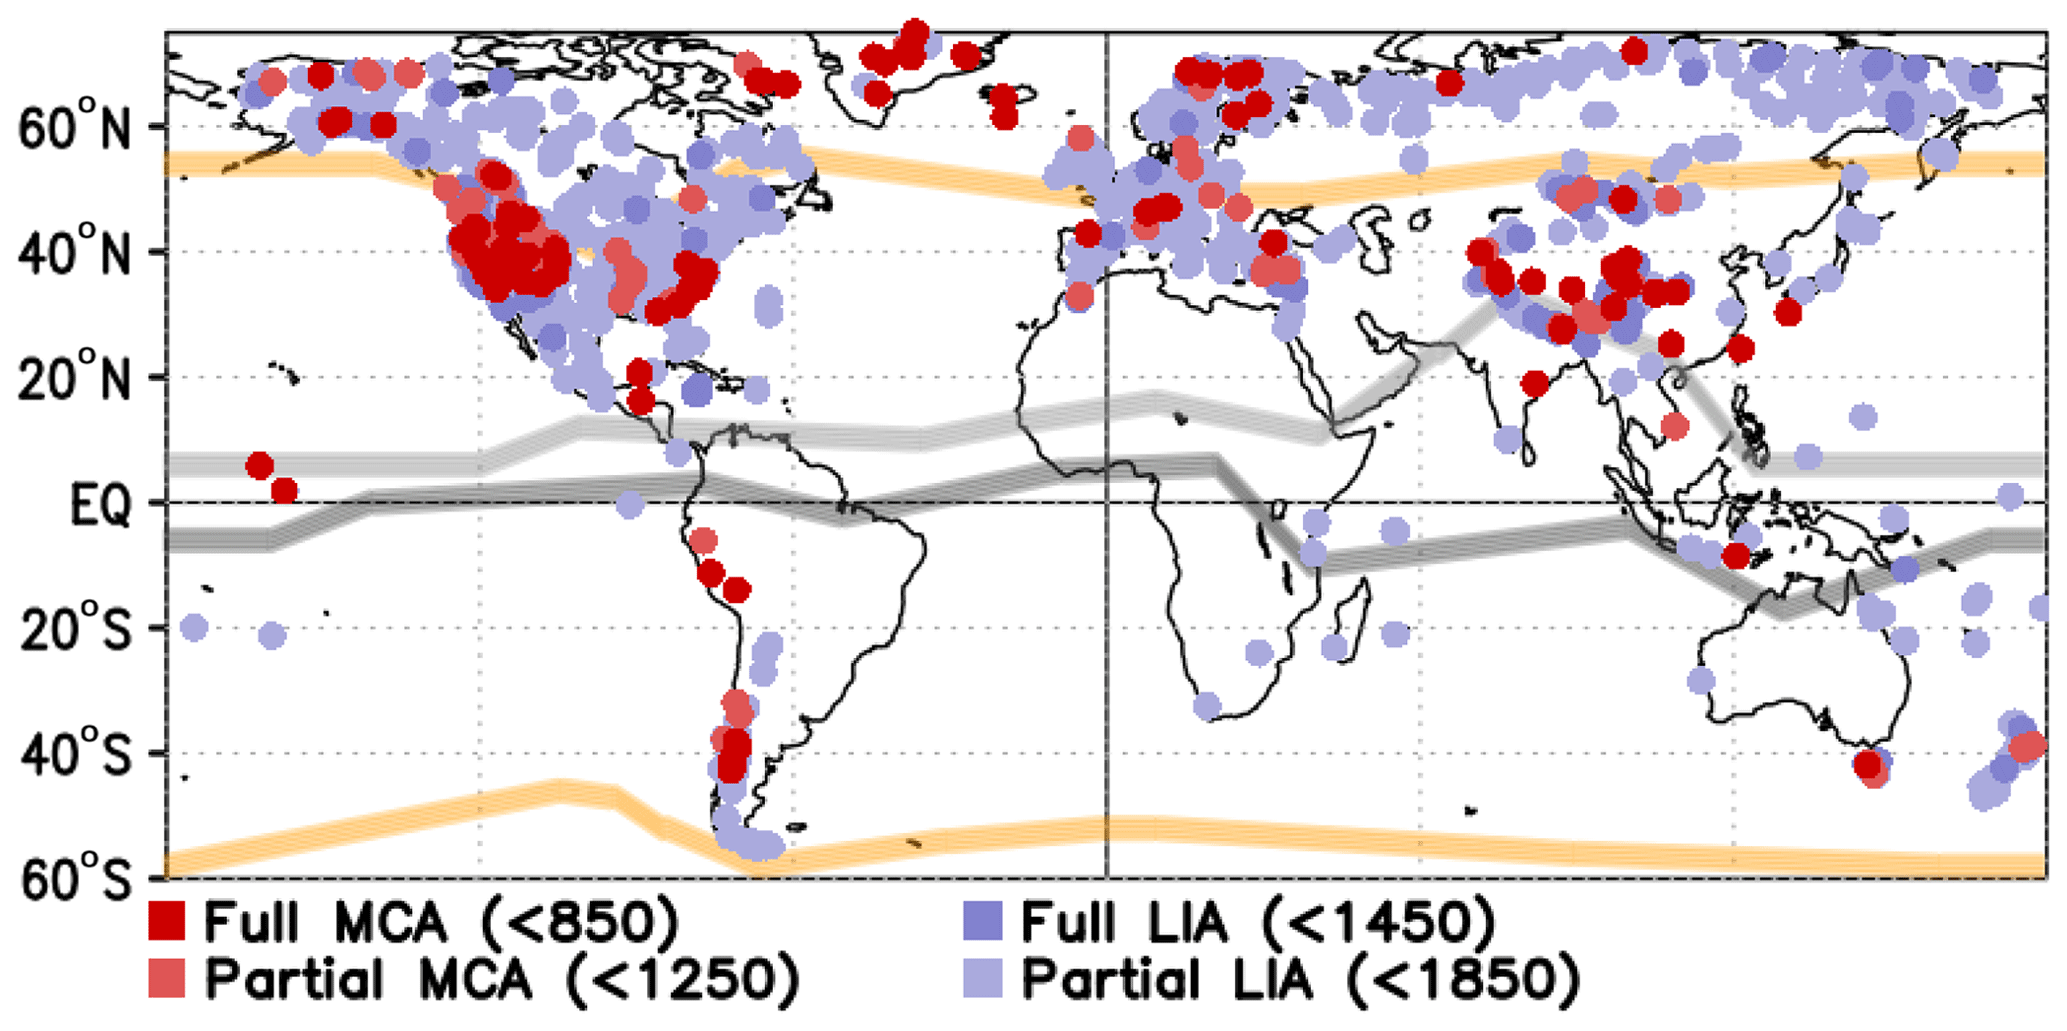
Figure 2Coverage of the MCA and LIA by the proxies from Steiger et al. (2018a), considered for the generation of PHYDA and LMR. Positions of the modern ITCZ, NAM and SAM boundaries are also shown, as described in Fig. 1.
Regarding the model-based products, we use the 13 all-forcing simulations of the CESM-LME, together with 10 LM simulations from the Coupled Model Intercomparison Project Phase 5–Paleoclimate Modelling Intercomparison Project Phase 3 (CMIP5–PMIP3; Taylor et al., 2007; Schmidt et al., 2011, 2012; Stocker et al., 2013) and 4 LM simulations from the Coupled Model Intercomparison Project Phase 6–Paleoclimate Modelling Intercomparison Project Phase 4 (CMIP6–PMIP4; Eyring et al., 2016; Jungclaus et al., 2017), all of which are described in Table 3. All these simulations have been interpolated to a common grid resolution of , the coarsest among the analyzed simulations, to allow for the calculation of ensemble averages across the CESM-LME, CMIP5 and CMIP6 products. The CESM-LME and CMIP5 simulations are forced according to the CMIP5–PMIP3 protocol (Schmidt et al., 2011, 2012), while the CMIP6 simulations consider the CMIP6–PMIP4 protocol (Jungclaus et al., 2017). Agreement between reconstruction-based and model-based products would only be expected for those areas dominated by the external forcing, as may be the case for extratropical areas like North America and Europe (Roldán-Gómez et al., 2020) and tropical areas in the Atlantic basin like South America and Central Africa (Roldán-Gómez et al., 2022), but not in those areas dominated by the internal variability, like the tropical Indo-Pacific (Roldán-Gómez et al., 2022).
Cook et al. (2015)Cook et al. (2010b)Cook et al. (2010a)Tardif et al. (2019)Steiger et al. (2018b)Otto-Bliesner et al. (2015)Schmidt et al. (2006, 2014)Watanabe et al. (2011)Schurer et al. (2014)Landrum et al. (2013)Dufresne et al. (2013)Phipps et al. (2012)Yukimoto et al. (2011)Adachi et al. (2013)Giorgetta et al. (2013)Hajima et al. (2020)Yukimoto et al. (2019)Mauritsen et al. (2019)Table 3Reconstruction-based and model products considered in this work. When referring to an ensemble of experiments, the abbreviation used for the ensemble and the number of members (N) are provided. The starting year, the available seasons and references describing each product are provided in the last columns.
Considering the wide bibliography of single-point reconstructions showing wetter or drier conditions during MCA and LIA (Fig. 1), most analyses have been based on these two periods. Following the approach of Masson-Delmotte et al. (2013), the MCA has been considered from 950 to 1250 CE and the LIA from 1450 to 1850 CE, even if these temporal intervals might not be suitable for all the regions and for all products (Neukom et al., 2014, 2019). To assess the robustness of our results to the specifics of this definition, we have performed additional analyses based on the trend during the whole period from 950 to 1750 CE and report our findings in Appendix A.
Our analyses focus on reconstructions of the Palmer drought severity index (PDSI; Palmer, 1965). Even if other variables like the soil moisture, the precipitation, or the difference between precipitation and evaporation may also provide information about the hydroclimate conditions, the use of a standardized index like the PDSI is generally preferred when combining different products (Cook et al., 2014). The PDSI takes into account the soil moisture conditions from the previous months, estimated based on temperature and precipitation and considering the water storage capacity of the soil. The cumulative behavior of the PDSI makes its variations smoother than those of atmospheric variables, making it a suitable variable for analyses on decennial to centennial scales, while the direct impact of temperature on the PDSI makes it more sensitive to changes in external forcing than variables exclusively based on precipitation (Roldán-Gómez et al., 2020).
The PDSI is directly provided by the DAs, the PHYDA and the LMR. For the CMIP5, CMIP6 and CESM-LME simulations, PDSI has been computed based on atmospheric variables and soil parameters, following the approach of a self-calibrating PDSI (scPDSI; Wells et al., 2004). The potential evapotranspiration is calculated using the Thornthwaite method (Thornthwaite, 1948). While the Thorntwaite formulation has been shown to have limitations for projections of 21st-century soil moisture conditions because of its strong dependence on temperature, assessments of the Thornthwaite formulation in model simulations of the LM have shown that such limitations are not a concern for the LM period (Smerdon et al., 2015). For the 20th century, the PDSI from the different sources have been compared to the instrumental observation-based PDSI from the Climatic Research Unit (CRU; Barichivich et al., 2021).
The analysis of hydroclimate based on proxy data is sensitive to the seasonality of the proxies. As shown in Table 2, most proxies provide annual values, but certain proxies for the Northern Hemisphere are linked to the hydroclimate of the boreal summer (June, July and August, JJA), while certain proxies in the Southern Hemisphere are associated with the boreal winter (December, January, and February, DJF). The selection of the season considered in the different products is then a critical point for the analyses. As shown in Table 3, the PHYDA provides water-year annual averages and seasonal averages for JJA and DJF. The LMR only provides annual averages, while the Northern Hemisphere DAs exclusively target the JJA period. For all the analyses, JJA values are considered for all the products except for the LMR, for which the annual values are used. To confirm that the annual results from the LMR can be meaningfully compared to the seasonal results from the other products, the annual PDSI from the PHYDA and the ensembles of CMIP5, CMIP6 and CESM-LME are analyzed in Appendix B.
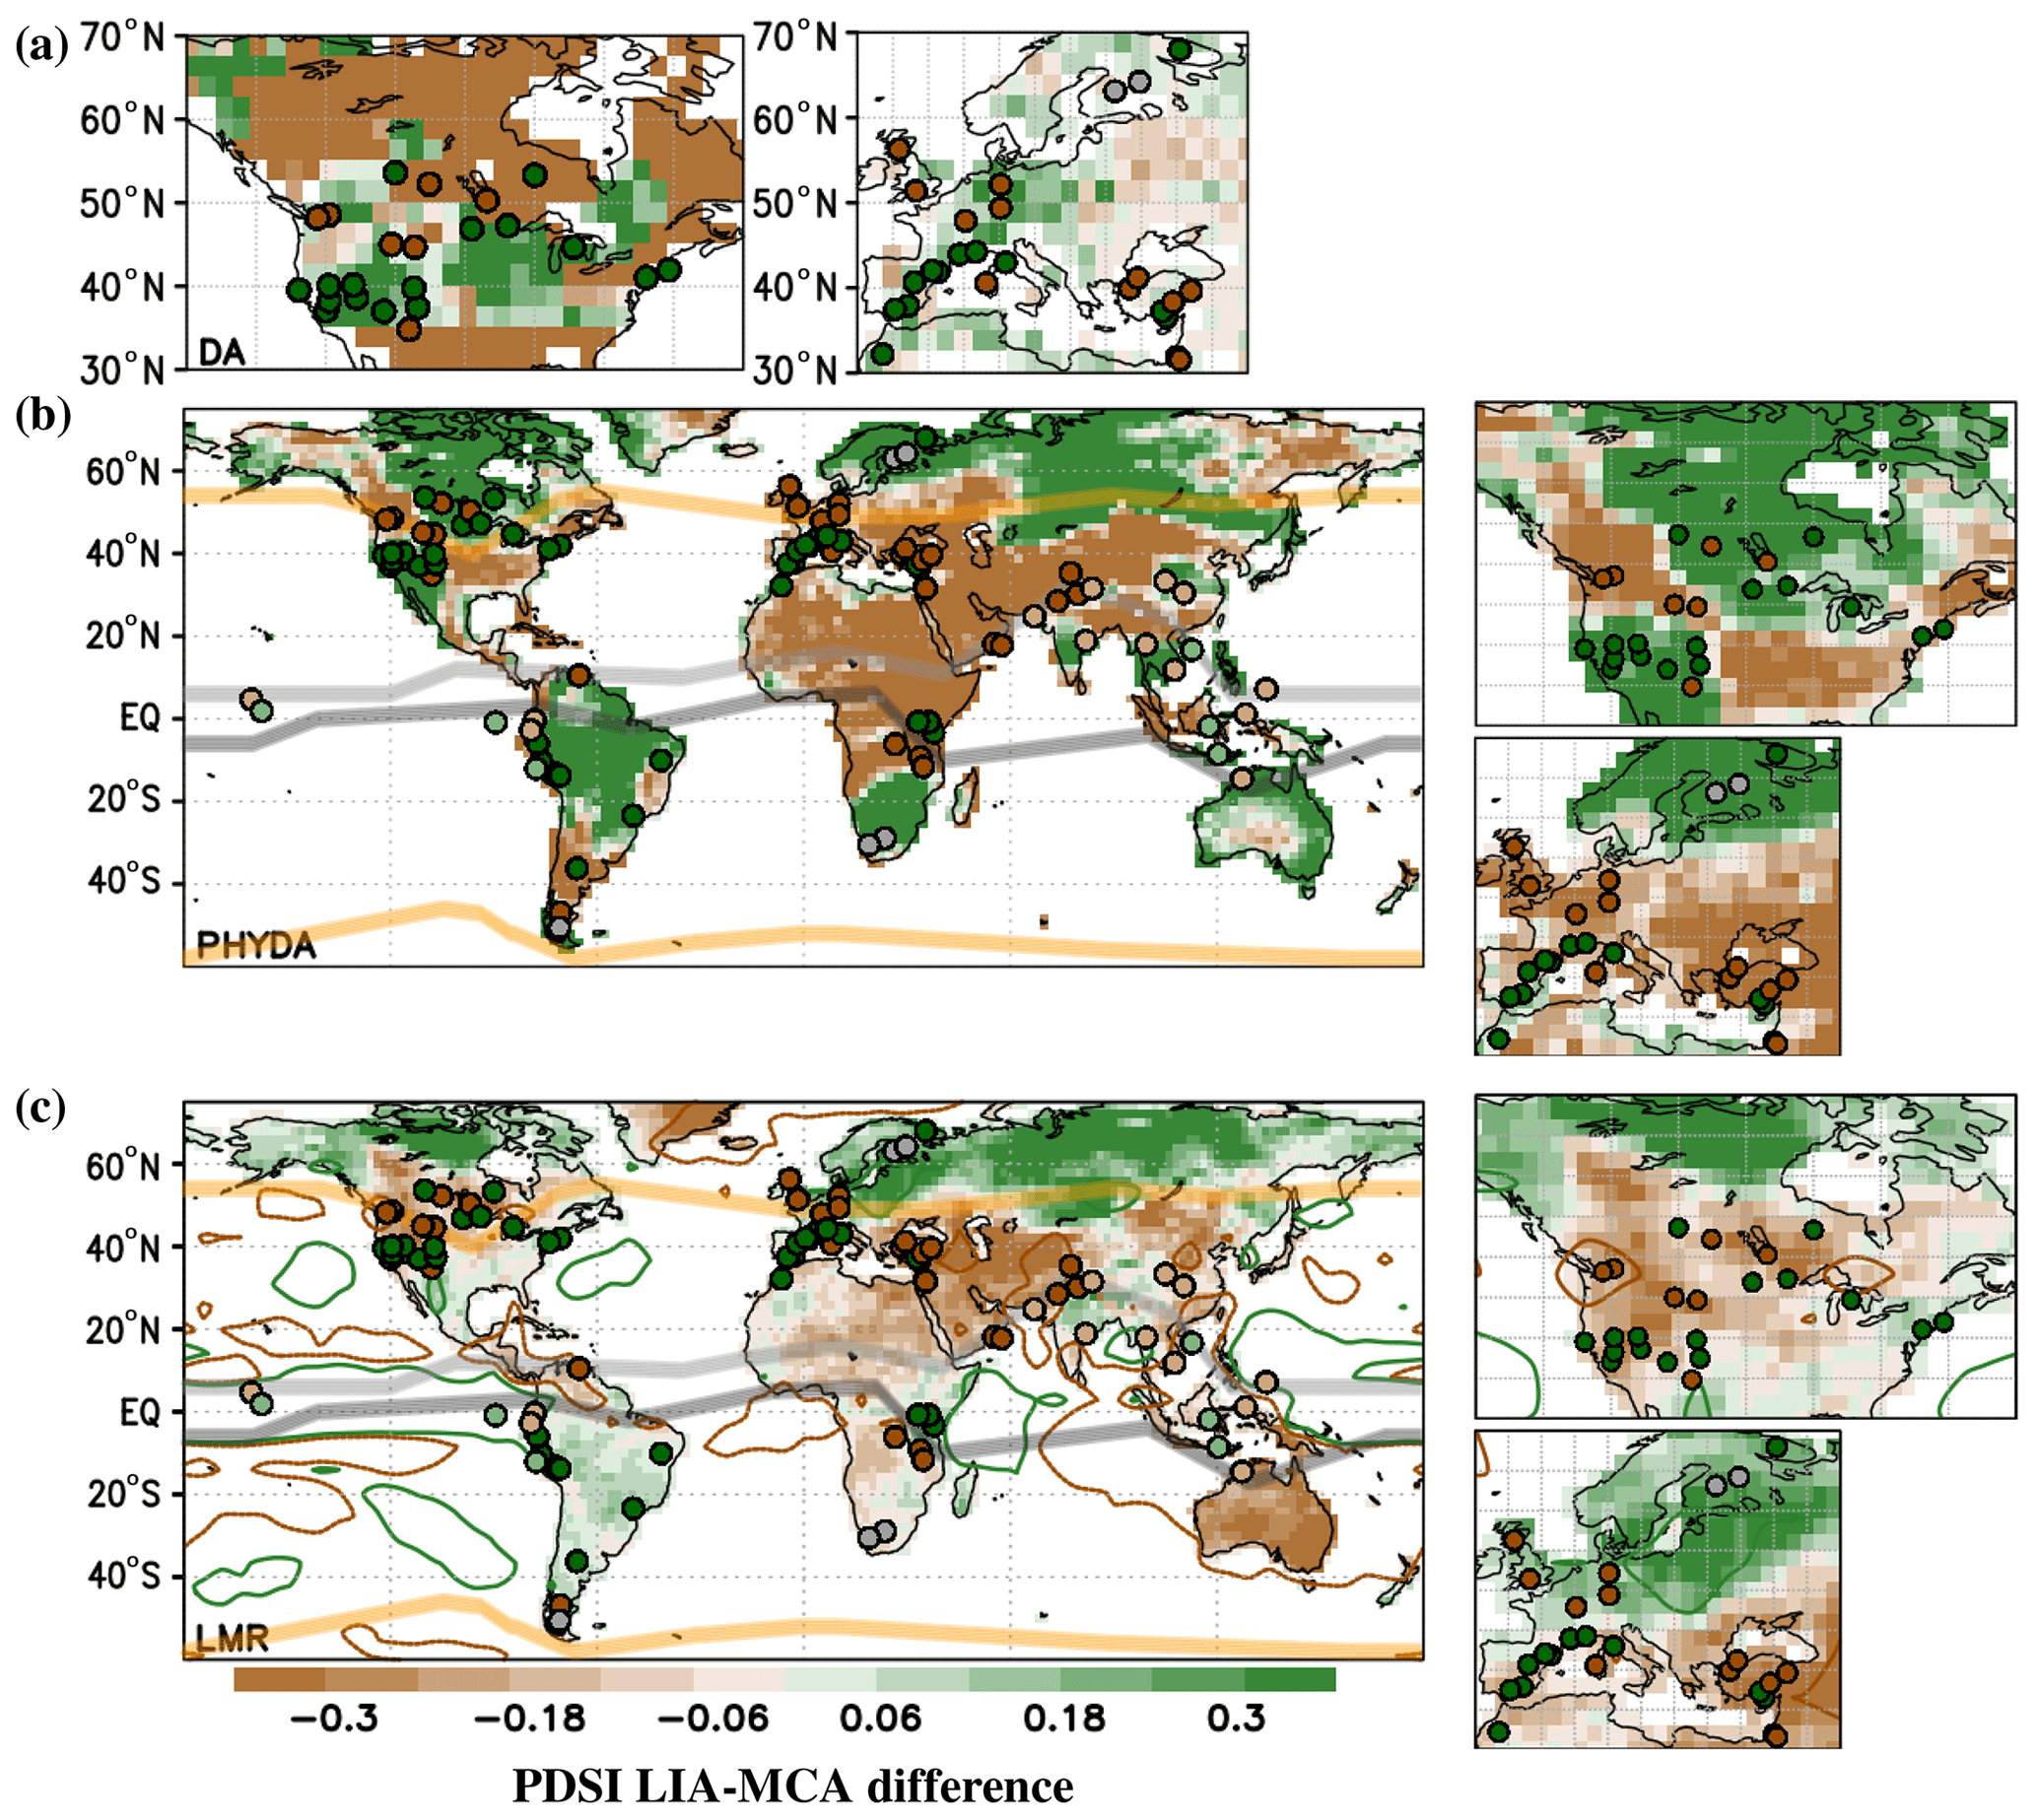
Figure 3LIA–MCA differences in PDSI (shading) or precipitation (contours) from (a) DAs, (b) PHYDA and (c) LMR. Dots represent the locations of Fig. 1, with the same color code considered in that figure; positions of the modern ITCZ, NAM and SAM boundaries are also shown, as described in Fig. 1. For the precipitation, contours of −1 mm per month (brown) and 1 mm per month (green) are shown. The average of JJA is considered for the PHYDA and the DAs, while the annual average is considered for the LMR. For the PHYDA and the LMR, regional maps over North America and Europe are shown on the right side of each corresponding panel.
Coordinated changes during the MCA and the LIA are characterized by computing the difference between each variable and product during the LIA and MCA periods. The agreement between products is also assessed by computing the global spatial correlation between PDSI LIA–MCA maps from each product (Coats et al., 2013a) and by counting the number of products showing positive or negative PDSI differences for each location. Finally, time series of PDSI for the whole millennium are extracted from different locations and different products to analyze the correlations between them beyond the periods of the MCA and LIA.
4.1 Reconstructions of hydroclimate during the MCA and LIA
PDSI differences between the LIA and MCA are shown for the DAs, the PHYDA and the LMR (Fig. 3). Some wetting and drying patterns are consistent across the DAs (Fig. 3a), the PHYDA (Fig. 3b) and the LMR (Fig. 3c). For example, all products estimate drier conditions during the LIA and wetter conditions during the MCA over the Middle East. There is also good agreement across the PHYDA and LMR in South America, with drier conditions in the north and wetter conditions in the central continent during the LIA, as well as in northern Canada, Scandinavia and northern Eurasia, with wetter conditions during the LIA. The PHYDA and the LMR agree well with the reconstructions of Fig. 1, which also show drier conditions during the LIA in southeastern Europe and Anatolia (Göktürk, 2011; Jones et al., 2006; Woodbridge and Roberts, 2011; Kuzucuoglu et al., 2011), the Indian Monsoon region (Burns et al., 2002; Bryson and Swain, 1981; Phadtare and Pant, 2006; Anderson et al., 2002; Gupta et al., 2003), and South America north of the ITCZ (Haug et al., 2001). The LMR also agrees with the reconstructions of Fig. 1 in regions of East Africa (Anchukaitis and Tierney, 2013).
In western North America there is good agreement between the DA and PHYDA and between these two products and the reconstructions of Fig. 1, most of them showing wetter conditions in the southwest and drier conditions in the northwest during the LIA (Steinman et al., 2013; Cook et al., 2004, 2010b). Each of these products is nevertheless in contrast to the LMR, which shows drier conditions during the LIA for most of the American west, in sharp contrast with a broad range of literature on megadroughts during the MCA period (Cook et al., 2010b; Coats et al., 2013b). For the case of central and western Europe, the PHYDA estimates drier conditions during the LIA, in agreement with the reconstructions of Fig. 1, while the DA and LMR estimate wetter conditions. The same happens for areas of central and eastern North America, especially for those areas with a small number of proxies covering the MCA (Fig. 2). Differences between products are particularly relevant in the Indo-Pacific basin, where the PHYDA and LMR show opposite behavior in Australia, Southeast Asia and Patagonia, and at high latitudes, with opposite behavior in areas of Alaska and northeast Asia.
4.2 Simulated hydroclimate during the MCA and LIA
The analysis of the model ensembles allows an estimate of those areas that are potentially more impacted by external forcing as estimated by the models because individual simulations include different realizations of internal variability but share the external forcing changes imposed as boundary conditions (Fernández-Donado et al., 2013; Jungclaus et al., 2017).
Figure 4 shows the mean PDSI differences between the LIA and MCA for the CESM-LME, CMIP5 and CMIP6 LM ensembles. For the areas of the Middle East and southern Asia the agreement between the DAs, the PHYDA, the LMR and the reconstructions of Fig. 1 also extends to the simulations from CESM-LME (Fig. 4a), CMIP5 (Fig. 4b) and CMIP6 (Fig. 4c). There is also good agreement in central South America, where the CESM-LME (Fig. 4a), CMIP5 (Fig. 4b) and CMIP6 (Fig. 4c) simulations all show a wet LIA for the areas south of the ITCZ. For northern South America, the dry LIA observed in reconstructions (Fig. 3b and c) is also found, with a limited extension, in CMIP5 (Fig. 4b) and CMIP6 (Fig. 4c) simulations. The agreement found for these areas is consistent with an impact of external forcing on the position of the Atlantic ITCZ (Roldán-Gómez et al., 2022) and the intensity of the monsoon system (Roldán-Gómez et al., 2020).
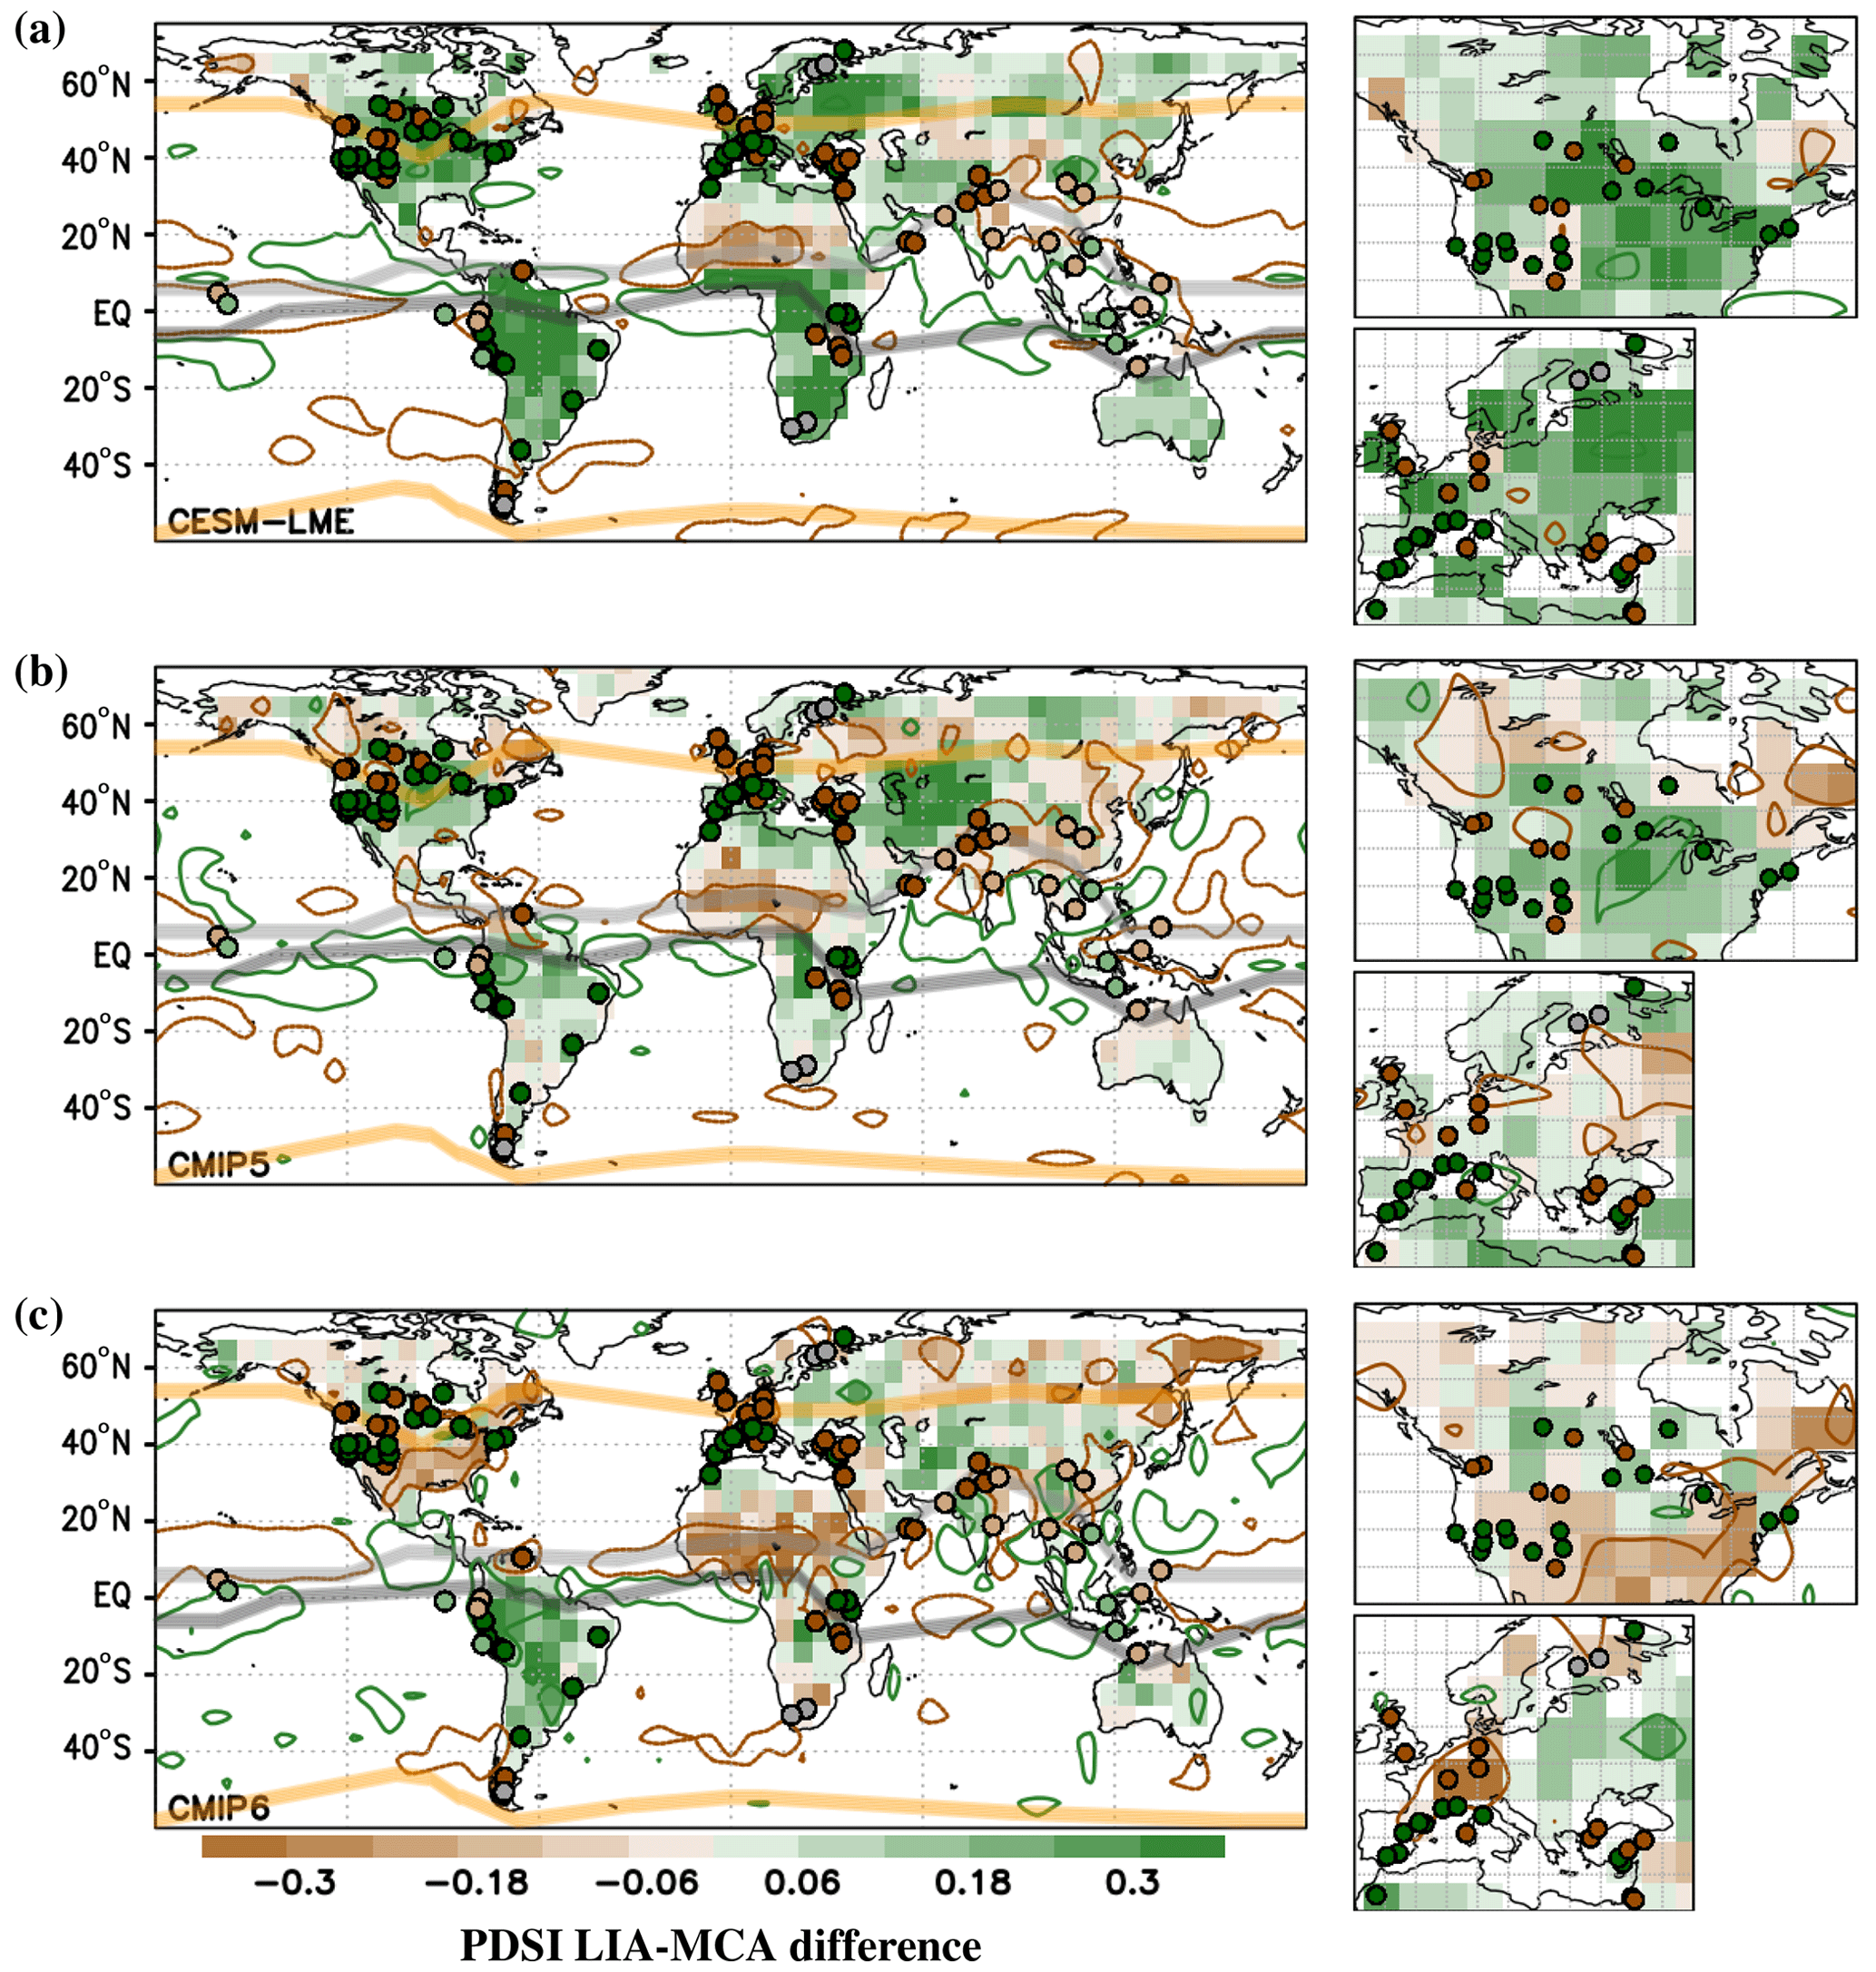
Figure 4LIA–MCA differences in PDSI (shading) or precipitation (contours) from the ensemble average of (a) CESM-LME, (b) CMIP5 and (c) CMIP6 LM simulations. Dots represent the locations of Fig. 1, with the same color code considered in that figure; positions of the modern ITCZ, NAM and SAM boundaries are also shown, as described in Fig. 1. For the precipitation, contours of −1 mm per month (brown) and 1 mm per month (green) are shown. In all the cases, the average of JJA is considered. For each product, regional maps over North America and Europe are shown on the right side of each corresponding panel.
The CMIP5 simulations (Fig. 4b) show a wetter LIA in most areas of western North America and western Europe, which is also found with a more limited extension in the reconstructions of Fig. 1 and the PHYDA (Fig. 3b). However, this consistency is not so clear in the simulations from CMIP6 (Fig. 4c), for which a dry LIA is found in most regions of North America. Disagreement also exists in the CESM-LME (Fig. 4a), which simulates a dry LIA in some areas of southwestern North America and a wet LIA in western and northern Europe. As shown in Appendix C, this disagreement can be explained by a different behavior in terms of temperatures and atmospheric dynamics.
In the Indo-Pacific basin, the ensemble average of CESM-LME (Fig. 4a), CMIP5 (Fig. 4b) and CMIP6 (Fig. 4c) LM simulations shows small PDSI differences between the MCA and LIA, with no clear agreement with the PHYDA (Fig. 3b) and the LMR (Fig. 3c). This behavior is consistent with a larger impact of internal variability in these areas (Roldán-Gómez et al., 2022), with simulation-dependent changes that are filtered out when working with ensemble averages.
4.3 Agreement between products
To assess the agreement between different pairs of products, spatial pattern correlations for the global maps of Figs. 3 and 4 have been included in Table 4. Despite the regional differences found in areas of North America and the Indo-Pacific basin, the ensembles of CESM-LME, CMIP5 and CMIP6 show global spatial correlations between 0.29 and 0.39. The global correlation of reconstruction-based products is strongly impacted by low correlations in some areas of the Southern Hemisphere and at high latitudes, with a lower density of proxy data. If these regions are excluded (Table 5), correlations larger than 0.29 are also found between DAs and PHYDA and between PHYDA and LMR. The disagreement between LMR and the other reconstruction-based products in areas of western Europe and western North America explains the small global correlation between the DAs and LMR. It is important to note that the spatial correlation between reconstruction-based and model-based products is impacted by internal variability. The use of ensemble averages removes the contribution of internal variability as it was manifest in the climate trajectory from the simulated data. For the reconstruction-based products the contribution of internal variability is not removed, even if the multi-century averages for the LIA and MCA periods emphasize the contribution of the external forcing.
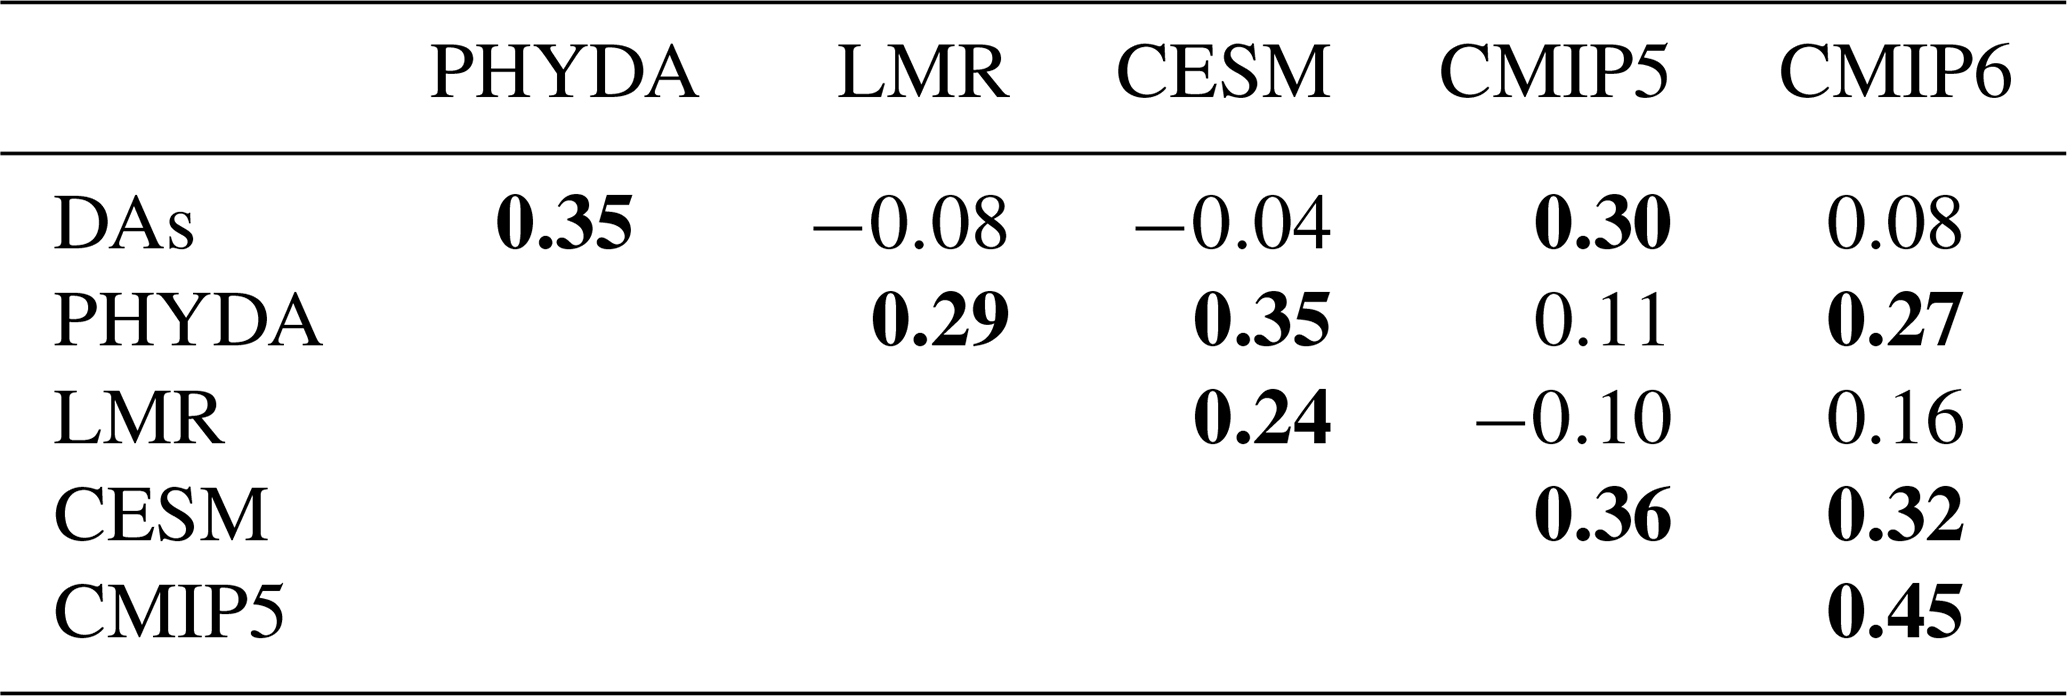
Table 4Correlation between the maps of LIA–MCA in PDSI from DAs (Fig. 3a), PHYDA (Fig. 3b), LMR (Fig. 3c), CESM-LME (Fig. 4a), CMIP5 (Fig. 4b) and CMIP6 (Fig. 4c). Significant correlations (p<0.05) accounting for autocorrelation are shown in bold.
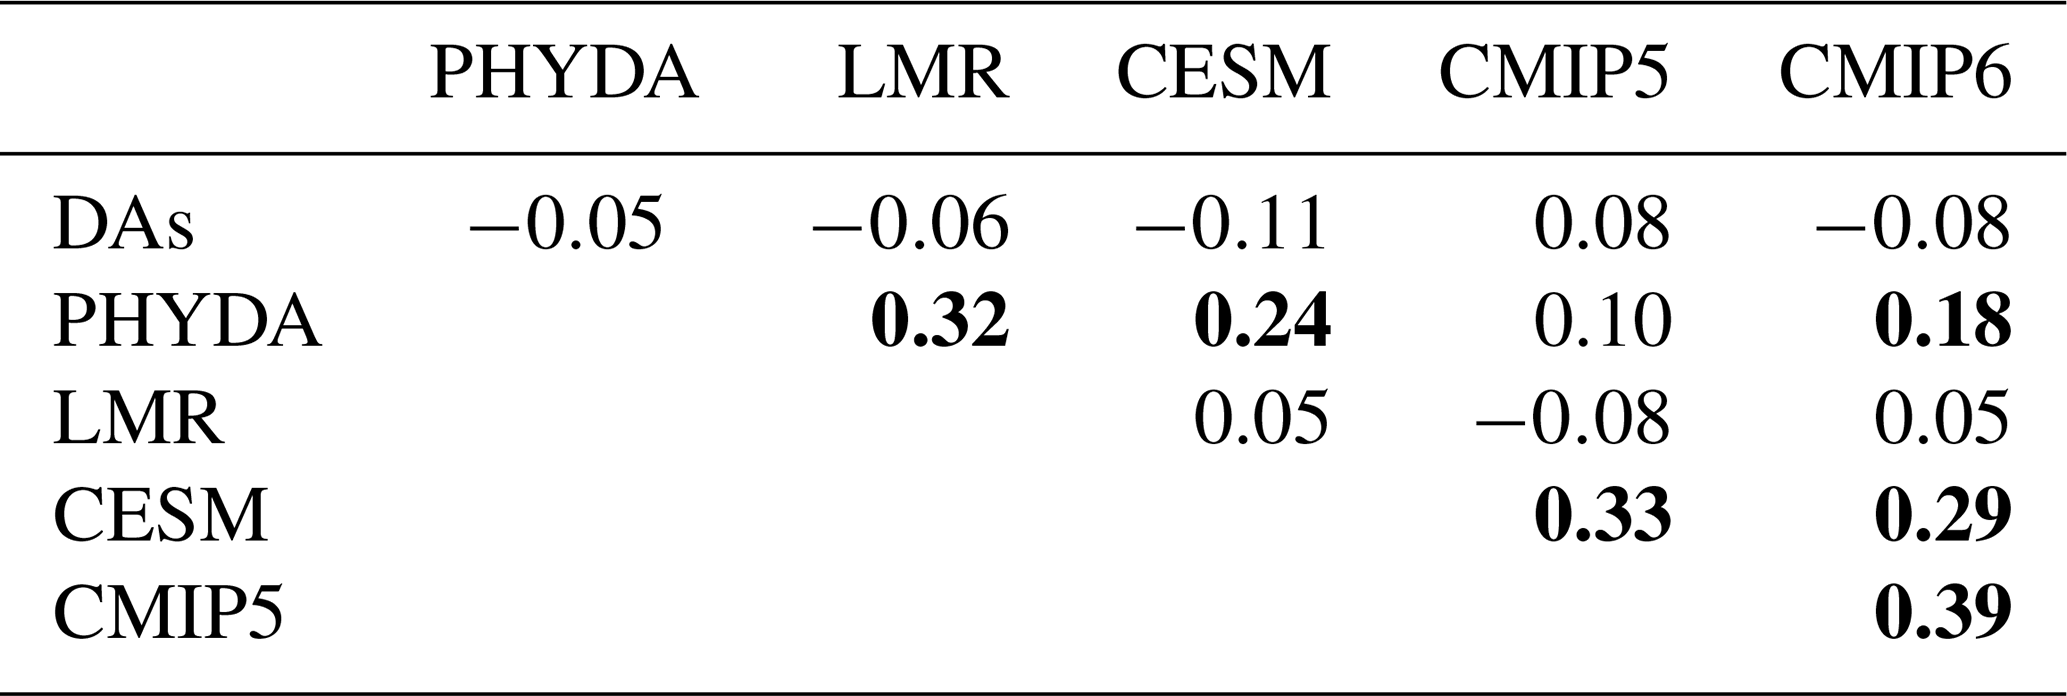
Table 5Same as Table 4 but considering only the data between 20∘ S and 50∘ N. Significant correlations (p<0.05) accounting for autocorrelation are shown in bold.
The agreement between sources is particularly poor in areas of the Indo-Pacific basin. As shown in Fig. 5a, there is no clear agreement regarding the sign of the PDSI LIA–MCA differences for areas of Southeast Asia and Australia. There is also no clear agreement for these areas among the individual simulations comprising the CMIP5 and CMIP6 ensembles (Fig. 5b), suggesting that the hydroclimate of these areas is strongly impacted by simulation-dependent processes, likely those associated with internal variability. The link to the internal variability is clear when analyzing the simulations of the CESM-LME (Fig. 5c), which share the same forcing conditions and differ only in the internal variability. These results are in line with the results obtained with the CESM-LME by Roldán-Gómez et al. (2022), showing a relevant impact of internal variability on the position and extension of the Indian and western Pacific ITCZ.
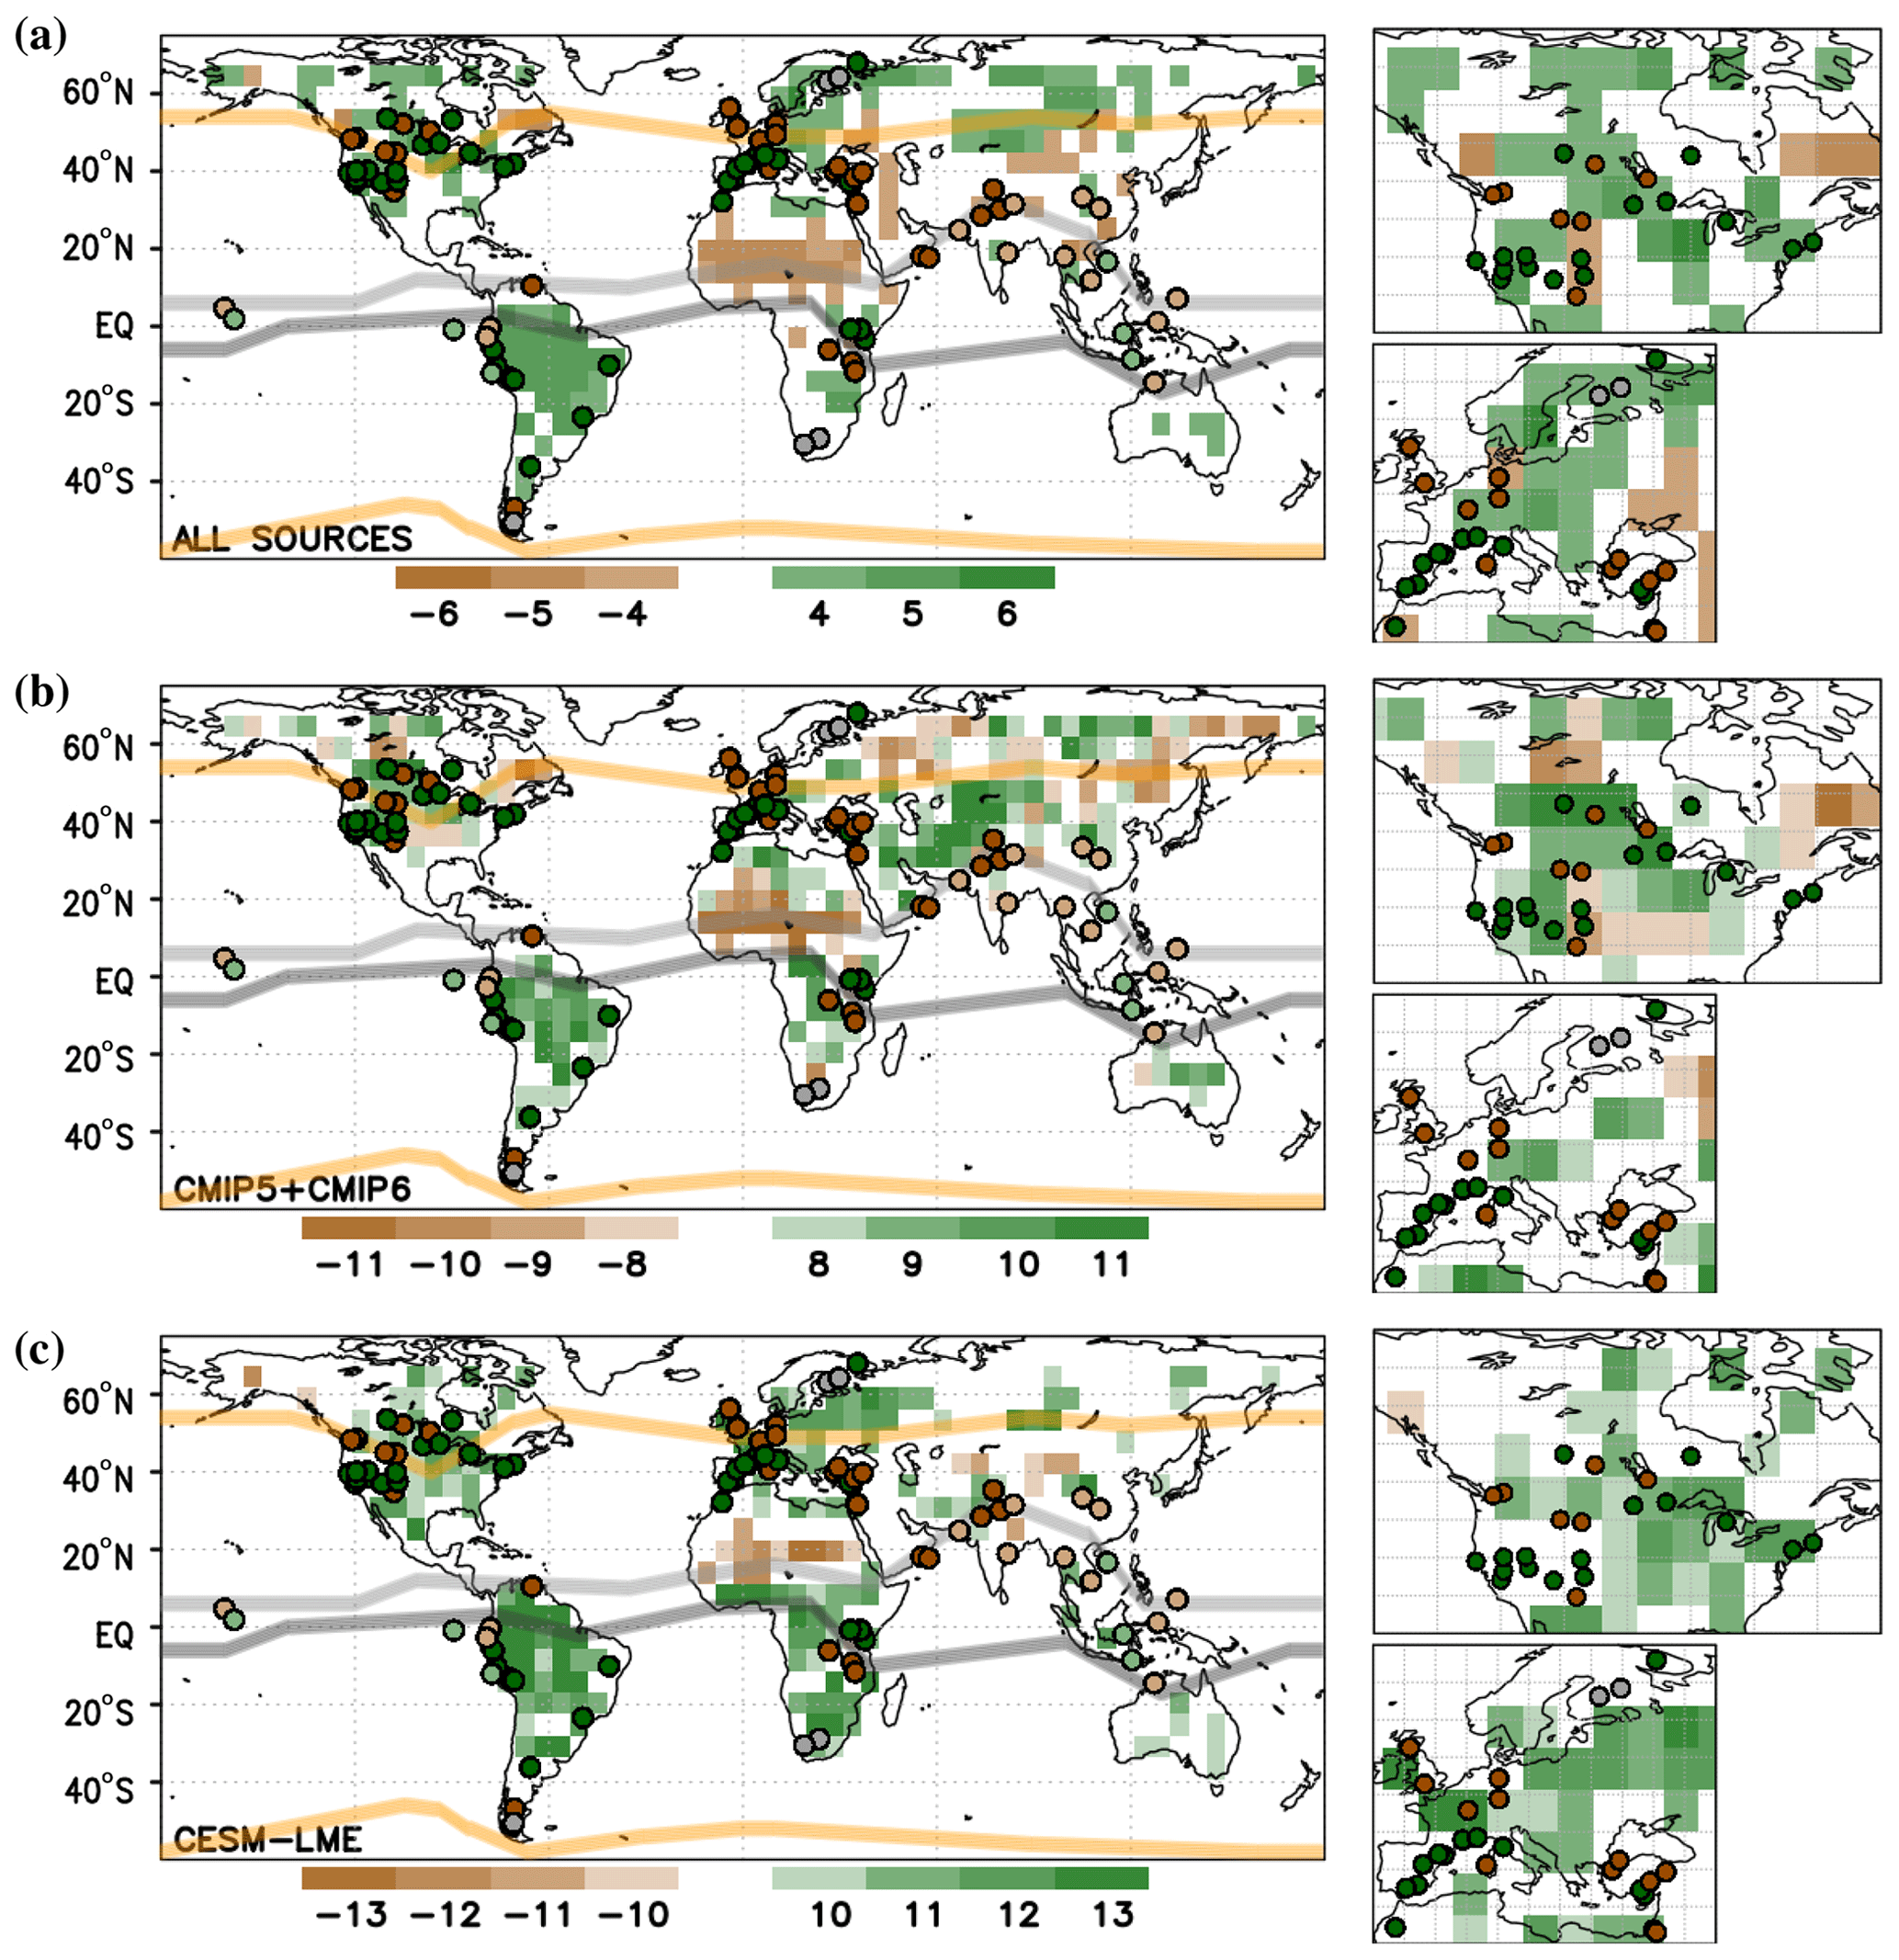
Figure 5(a) Number of products, from the six analyzed products (DAs, PHYDA and LMR as well as the ensemble averages of CESM-LME, CMIP5 and CMIP6), showing positive (green) or negative (brown) LIA–MCA differences in PDSI. (b) Number of simulations, from the 14 simulations in the ensembles of CMIP5 and CMIP6, showing positive (green) or negative (brown) LIA–MCA differences in PDSI. (c) Number of simulations, from the 13 simulations of the CESM-LME, showing positive (green) or negative (brown) LIA–MCA differences in PDSI. Dots represent the locations of Fig. 1, with the same color code considered in that figure; positions of the modern ITCZ, NAM and SAM boundaries are also shown, as described in Fig. 1. Regional maps over North America and Europe are shown on the right side of each corresponding panel.
In other areas, most products (Fig. 5a) and most individual simulations (Fig. 5b and c) show the same sign of PDSI differences such as in central South America, with a drier MCA and a wetter LIA, or the Sahel, extending from western Africa to the Arabian Peninsula, for which most products and simulations show a wetter MCA and a drier LIA. Consistency also extends to areas of western North America, with at least four products showing wetter conditions in the south and drier conditions in the north during the LIA, or to northern India, where most products show a wetter MCA and a drier LIA. The agreement for these areas suggests a contribution of external forcing that is more important than that of internal variability.
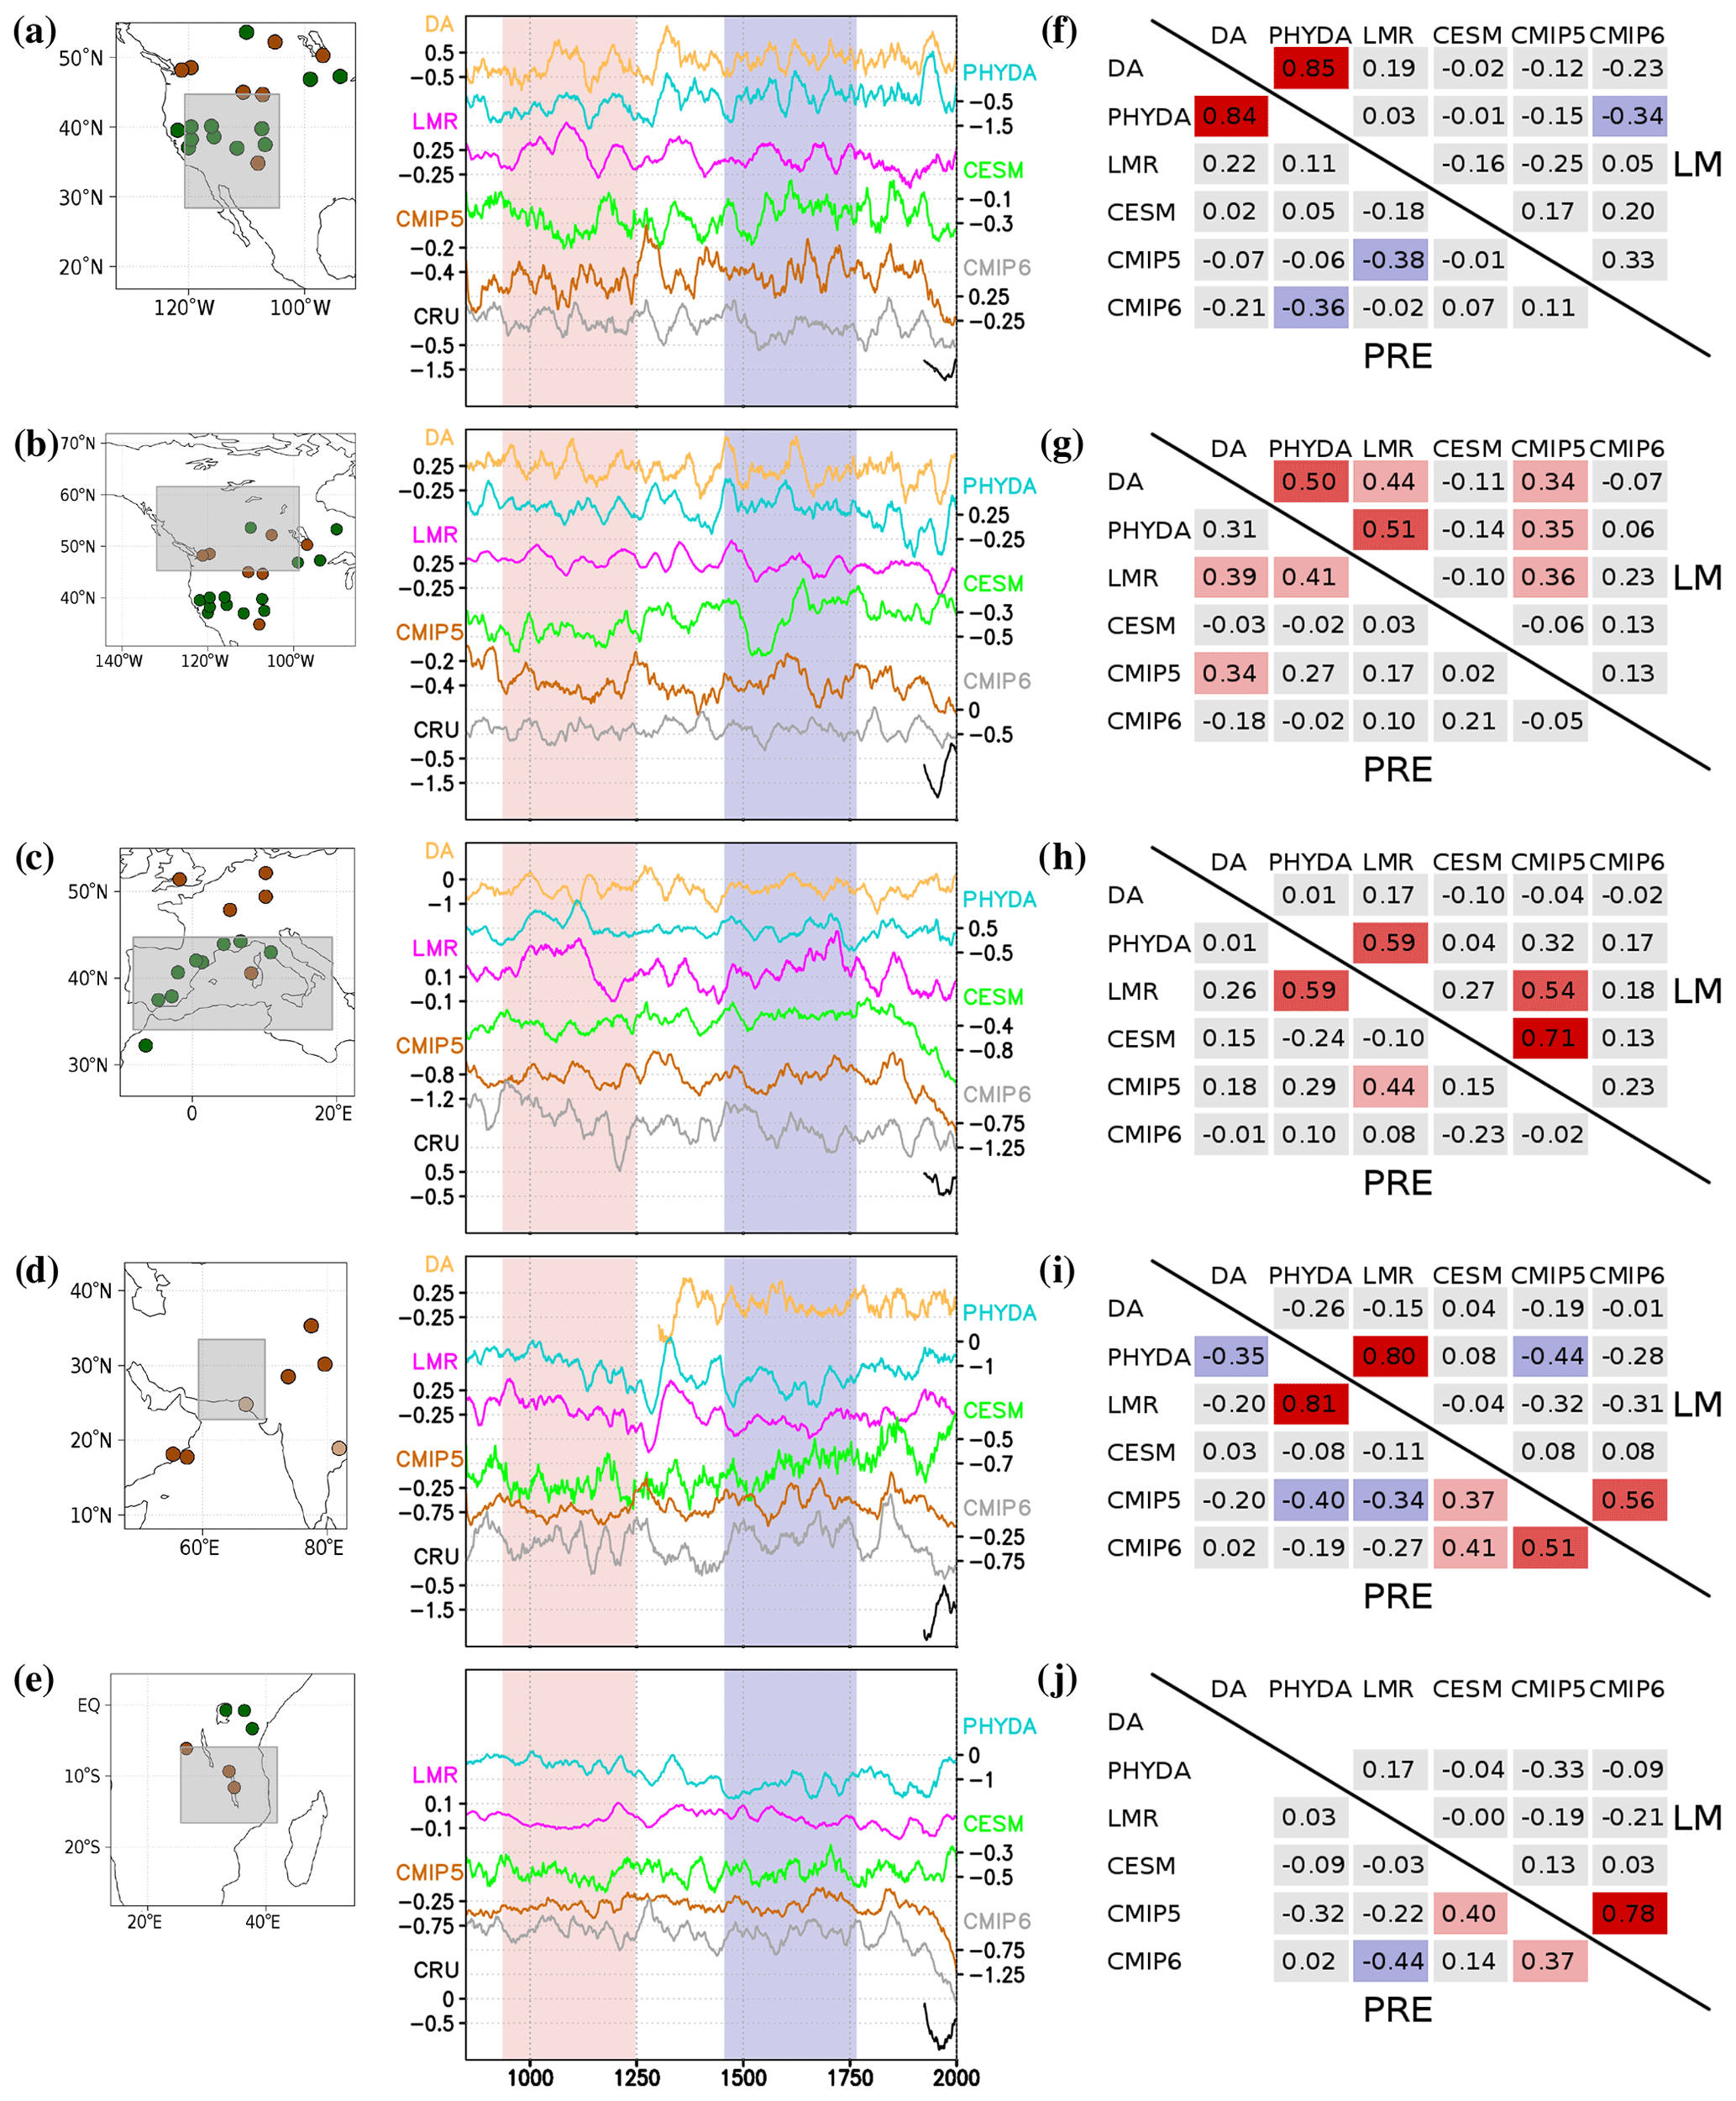
Figure 6(a–e) Time series of PDSI for (a) southwestern North America, (b) northwestern North America, (c) southwestern Europe, (d) Pakistan and (e) East Africa, obtained from DAs, PHYDA and LMR as well as the ensemble average of CESM-LME, CMIP5 and CMIP6 LM simulations. Time series from the CRU PDSI data set for the 20th Century have also been included for comparison. Time series of DAs are not available for those regions not considered in OWDA, NADA and MADA. Periods of MCA and LIA are highlighted in red and blue in the middle panels. Dots in the map of the left side represent the locations of Fig. 1, with the same color code considered in that figure. (f–j) Correlations between time series of PDSI for each region obtained from DAs, PHYDA and LMR as well as the ensemble average of CESM-LME, CMIP5 and CMIP6 LM simulations for both the full millennium (LM) and the pre-industrial period (PRE). Color code for the correlations is the same as included in Fig. 8.
The MCA and the LIA are periods extensively addressed in the literature, but they are not the only periods showing relevant droughts (Cook et al., 2022). The analyses have then been extended to other periods by extracting time series of PDSI for the whole millennium from the same regions that show coordinated changes during the MCA and LIA (Figs. 6a–e and 7a–e), including western North America, southwestern Europe, northern and central South America, East Africa, Pakistan, India, Southeast Asia, and Indonesia. For each region, the correlations between the DAs, the PHYDA and the LMR as well as the ensemble average of CESM-LME, CMIP5 and CMIP6 LM simulations have been computed (Figs. 6f–j and 7f–j).
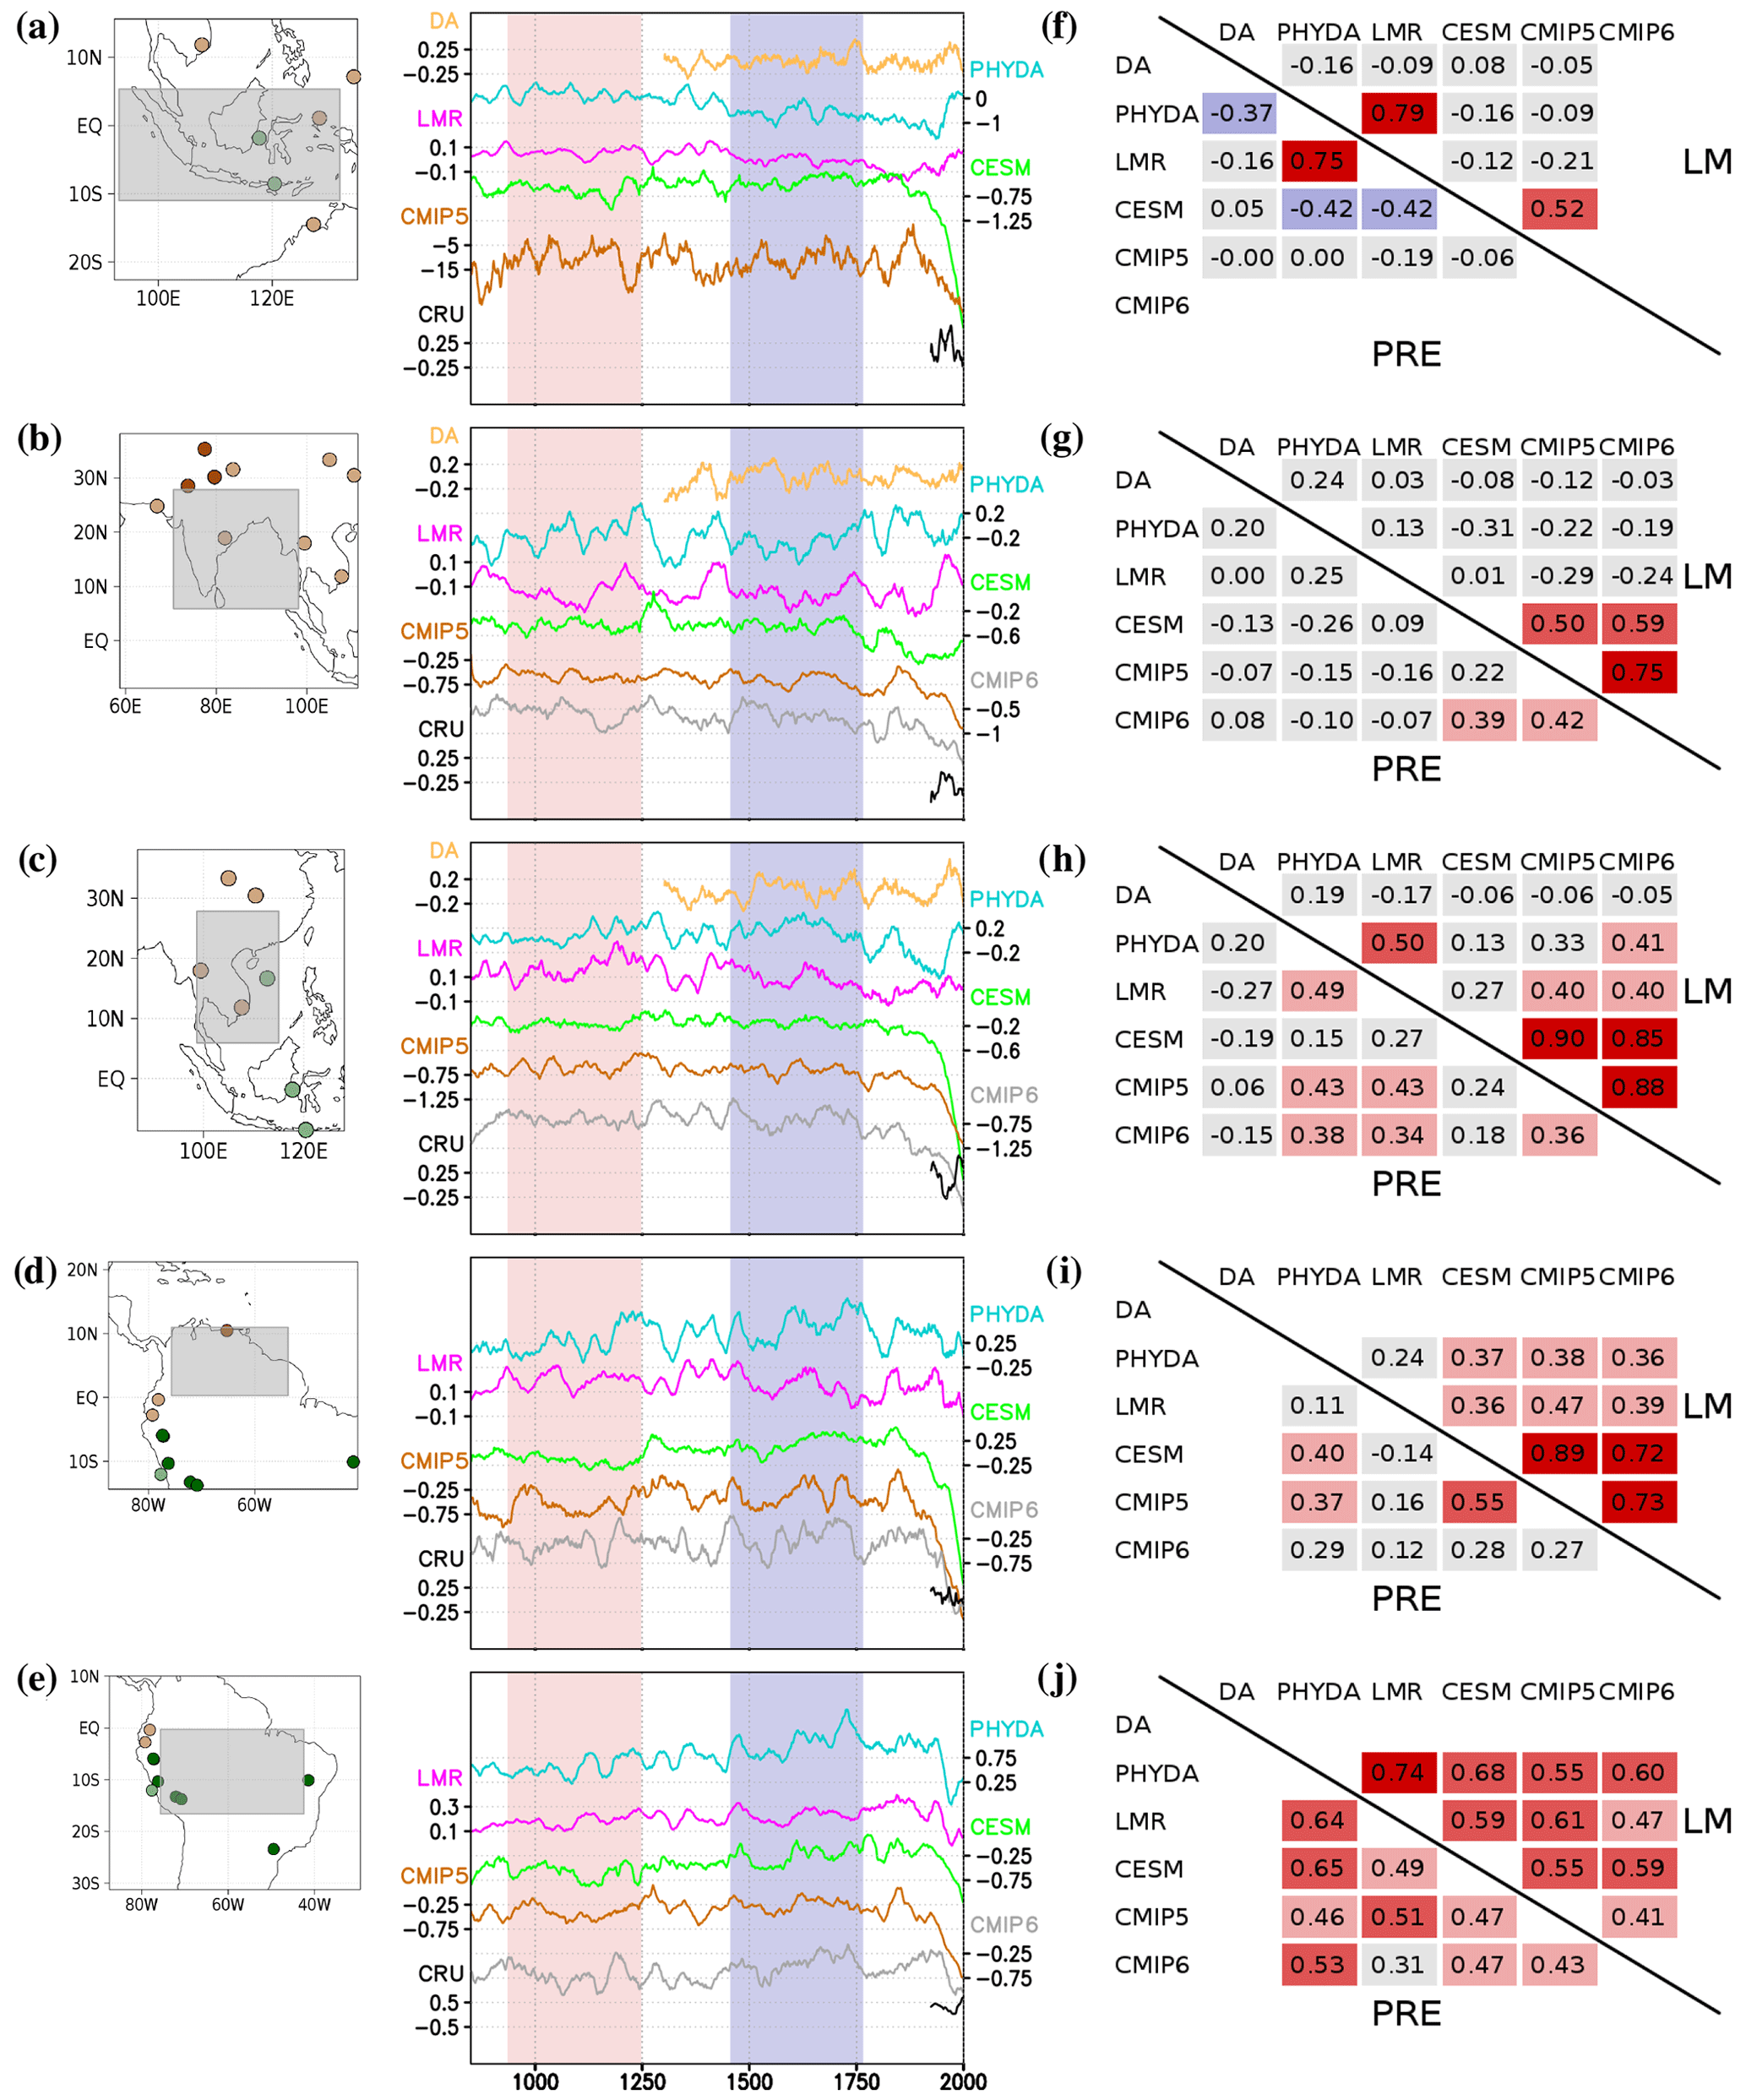
Figure 7Same as Fig. 6 for (a, f) Indonesia, (b, g) India, (c, h) Southeast Asia, (d, i) northern South America and (e, j) central South America. Time series of DAs are not available for those regions not considered in OWDA, NADA, MADA and MXDA. Time series of CMIP6 are not available for Indonesia, since most CMIP6 simulations do not provide the necessary variables to compute the PDSI for this region.
The correlation between the DAs and PHYDA is significant for western North America, while the correlation between the PHYDA and LMR is significant for central South America, northwestern North America, southwestern Europe, Pakistan, Southeast Asia and Indonesia. Some of these correlations exceed 0.7 and are clearly visible in the time series of PDSI from these regions. This is the case for the correlation between the DA and the PHYDA in southwestern North America (Fig. 6a and f) and the correlation between PHYDA and LMR in Pakistan (Fig. 6d and i), Indonesia (Fig. 7a and f) and central South America (Fig. 7e and j). Regions showing high correlations between reconstruction-based products are in general those regions showing the largest hydroclimate changes during the LM, like those around the ITCZ (Yan et al., 2015; Anchukaitis and Tierney, 2013), those in the Monsoon region (Fleitmann et al., 2003) and those in the area of influence of the NAM (Ortega et al., 2015).
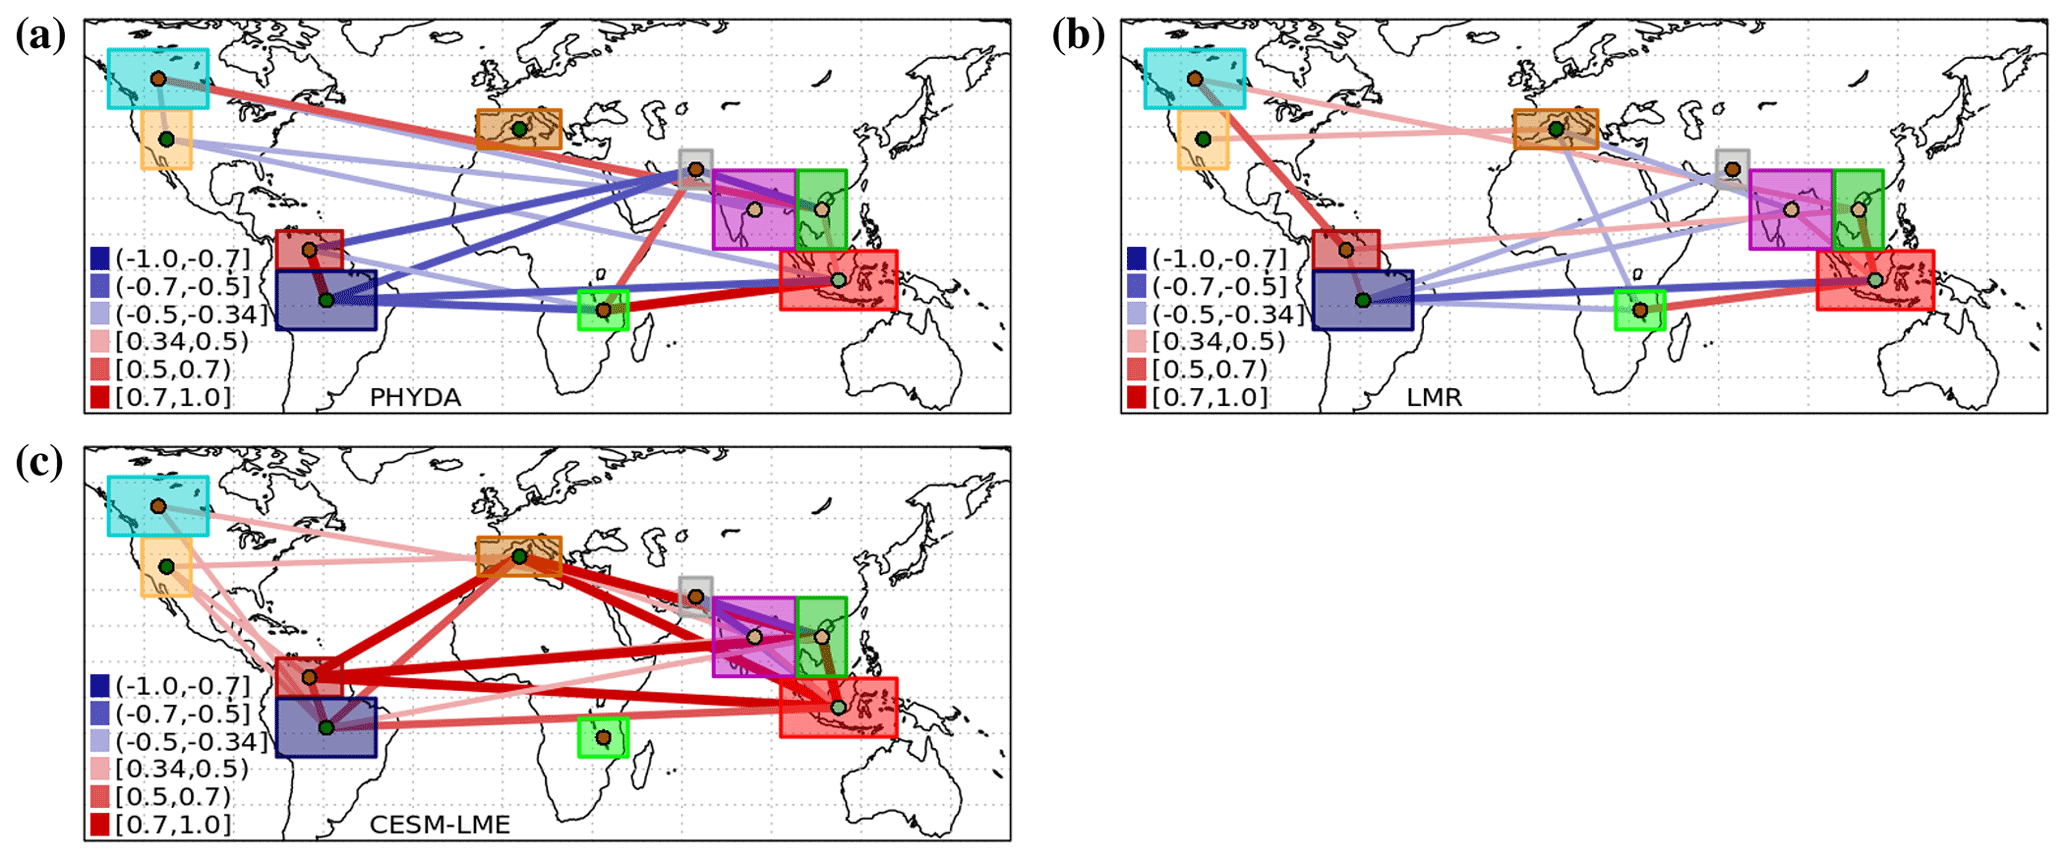
Figure 8Correlations between time series of PDSI for different regions (solid lines), obtained from (a) PHYDA, (b) LMR and (c) CESM-LME. Only significant correlations (p<0.05, ) accounting for autocorrelation are shown, following the color code on the bottom left side of the panels. The color of the points for each region indicate whether the LIA was wetter (green) or drier (brown) than the MCA in the reconstructions of Fig. 1.
Significant correlations are also found between the ensemble averages of CESM-LME, CMIP5 and CMIP6 for regions of South America, India and Southeast Asia; between CMIP5 and CMIP6 ensembles for areas of southeastern Europe, East Africa and Pakistan; and between CESM-LME and CMIP5 ensembles in areas of southwestern Europe and Indonesia. As for the case of reconstruction-based products, some of these correlations exceed 0.7 and are visible in the time series of PDSI, like those of northern South America (Fig. 7d and i) and Southeast Asia (Fig. 7c and h) for CESM-LME, CMIP5 and CMIP6 and those of East Africa (Fig. 6e and j) and India (Fig. 7b and g) for CMIP5 and CMIP6. In these cases, similarities are found during the whole millennium, including a trend in the 20th century not found in the reconstructions (Ljungqvist et al., 2016). If only the pre-industrial period is considered, the correlations are smaller but still significant for most of these areas. The correlation between simulated products is particularly high for those areas with a larger impact of external forcing, like the Atlantic ITCZ (Roldán-Gómez et al., 2020), consistent with the fact that the use of the ensemble average emphasizes the forcing signal (Fernández-Donado et al., 2013; Roldán-Gómez et al., 2020).
Considering this, the comparison between time series from reconstruction-based products and from model simulations would only be relevant for those areas where the contribution of the forcing dominates. Significant correlations are found between the ensemble average of CESM-LME, CMIP5 and CMIP6 LM simulations and the PHYDA and LMR in northern and central South America and, to a lesser extent, in regions of southwestern Europe, northern North America and Southeast Asia, suggesting a relevant contribution of the forcing to the hydroclimate of these areas. Some of these correlations between reconstruction-based products and model simulations exceed 0.5 and are visible in the time series of PDSI, like those in central South America (Fig. 7e and j) and those between the LMR and the ensemble average of CMIP5 in southwestern Europe (Fig. 6c and h). These results can then be linked to a particularly important contribution of the forcing in these regions, present in both proxy data and model simulations.
4.4 Correlation between distant regions
As described in the previous sections, distant regions showed similar hydroclimate behaviors during the MCA and LIA. These similarities suggest the presence of coordinated changes between distant regions that go beyond these two periods. To analyze these changes, correlations between the time series of different regions from Figs. 6 and 7 have been computed for the PHYDA (Fig. 8a) and the LMR (Fig. 8b). Both reconstruction-based products show significant positive and negative correlations between distant regions, some of them in agreement with the behavior of reconstructions during the MCA and LIA (Fig. 1).
In particular, both the PHYDA and the LMR show significant negative correlations between central South America and the regions of East Africa and Pakistan. These correlations can be linked to coordinated changes in the Atlantic ITCZ and the monsoon system, in line with those observed in model simulations and associated with shifts in the Atlantic ITCZ in response to changes in the external forcing (Roldán-Gómez et al., 2020, 2022). Both reconstruction-based products also show significant positive correlations across the Indian and Pacific basins, such as those between Indonesia and East Africa and between Southeast Asia and northwestern North America, consistent with the changes in the Pacific Walker circulation found in simulations (Yan et al., 2015).
The correlations across the Pacific basin are emphasized in the PHYDA, which also shows significant negative correlations between southwestern North America and the regions in India and Indonesia. In contrast, the LMR tends to emphasize the variability in the Atlantic basin, with positive correlations between southwestern North America and southwestern Europe following the pattern of the North Atlantic Oscillation (NAO).
The correlations for the PHYDA and LMR shown in Fig. 8a and b are impacted by the climatological covariance of the model used for the data assimilation. However, if the correlations are computed for the CESM-LME (Fig. 8c) without any data assimilation, only positive correlations associated with the impact of temperature in the PDSI are obtained, showing that a certain impact of the proxies may also be present in the results for the PHYDA and LMR. The fact that the PHYDA and LMR respectively emphasize the variability in the Pacific and Atlantic basins also shows that the regional variability given by the proxies is consistent with the spatial patterns from the models. This increases the confidence on the ability of the models to reproduce the behavior of the hydroclimate at a global scale, in particular for those areas and those mechanisms more impacted by the external forcing.
The analysis of different reconstruction-based and model-based products shows consistent coordinated changes during the LM in the hydroclimate of distant regions. The areas more impacted by these changes are those around the ITCZ, like northern and central South America, East Africa and the Indo-Pacific; those in the area of influence of the NAM/NAO, like western North America and western Europe; and those of the Indian Monsoon region, extending from the Middle East to Southeast Asia. Even if these changes are particularly important during the MCA and the LIA, for which a high number of reconstructions show drier or wetter conditions, significant correlations between distant regions are also found when considering the whole millennium.
The agreement between reconstruction-based and model-based products for areas of South America and East Africa is indicative of a relevant contribution of the forcing in these regions, consistent with the shifts in the Atlantic ITCZ obtained in simulations in response to the forcing (Roldán-Gómez et al., 2022). Agreement is also high in the Indian Monsoon region, consistent with an alteration of the monsoon system as a consequence of changes in the forcing (Roldán-Gómez et al., 2020). Certain agreement is also found for areas of western North America and western Europe, consistent with an alteration of the NAM/NAO in response to changes in the forcing (Roldán-Gómez et al., 2020), even if the different products show discrepancies at regional scales. These discrepancies may be linked to the contribution of internal variability in these areas, but also to uncertainties in the reconstructed data, limitations in the physics of the models and inaccuracies in the assessment of external forcing considered for the simulations. The largest discrepancies between reconstructed and simulated products are found in the Indo-Pacific basin, suggesting that this area is more impacted by internal variability processes than by changes in the forcing.
The combination of reconstructions, model simulations and hybrid products is a powerful technique to overcome the limitations of each individual source. On one hand, the sparse hydroclimate records available from proxy data can be completed with gridded information of atmospheric dynamics and hydroclimate variables provided by model simulations and hybrid products to extend the analysis to areas not fully covered by the proxies. On the other hand, the representativity of the mechanisms found in simulations, often involving temperatures, atmospheric dynamics and hydroclimate, like the shifts in the ITCZ, the alteration of variability modes like the NAM/NAO, and the changes in the Walker circulation during the MCA and LIA, could be confirmed with the hydroclimate information obtained from proxy data and hybrid products.
In this work, we considered an exhaustive and up-to-date compilation of all the available reconstruction-based and model-based sources to analyze the hydroclimate of the LM at a global scale, with a particular focus on the MCA and LIA as periods with particular forcing conditions. This exercise, perhaps more typical in the analysis of temperatures but systematically applied for the first time to the global hydroclimate, provided a novel assessment of global hydroclimate changes. The focus on the MCA and LIA periods and the comparison with model simulations allowed the isolation of those mechanisms potentially impacted by the forcing, while the novel approach based on combining reconstruction-based and model-based sources showed a coherence in the large-scale changes in the hydroclimate of the LM.
For the analyses described in the previous sections, the periods of the MCA and LIA have been respectively defined from 950 to 1250 CE and from 1450 to 1850 CE. This definition may depend on the product and is not applicable at a global scale (Neukom et al., 2014, 2019). For example, reconstructions of the Indo-Pacific basin (Fig. 1, light brown and light green) tend to show stable conditions only during the early LIA until the late 1500s CE rather than during the whole LIA as found in regions of Europe and North America (Fig. 1, dark brown and dark green). To make the analyses independent from the particular selection of periods for the MCA and LIA, the LIA–MCA differences of Figs. 3 and 4 have been replaced in Figs. A1 and A2 by the slope of PDSI computed over the whole period from 950 to 1750 CE. The results obtained with this method show no major differences with respect to those shown in Figs. 3 and 4, confirming that the conclusions obtained in the paper are independent from the particular definition of the MCA and LIA.
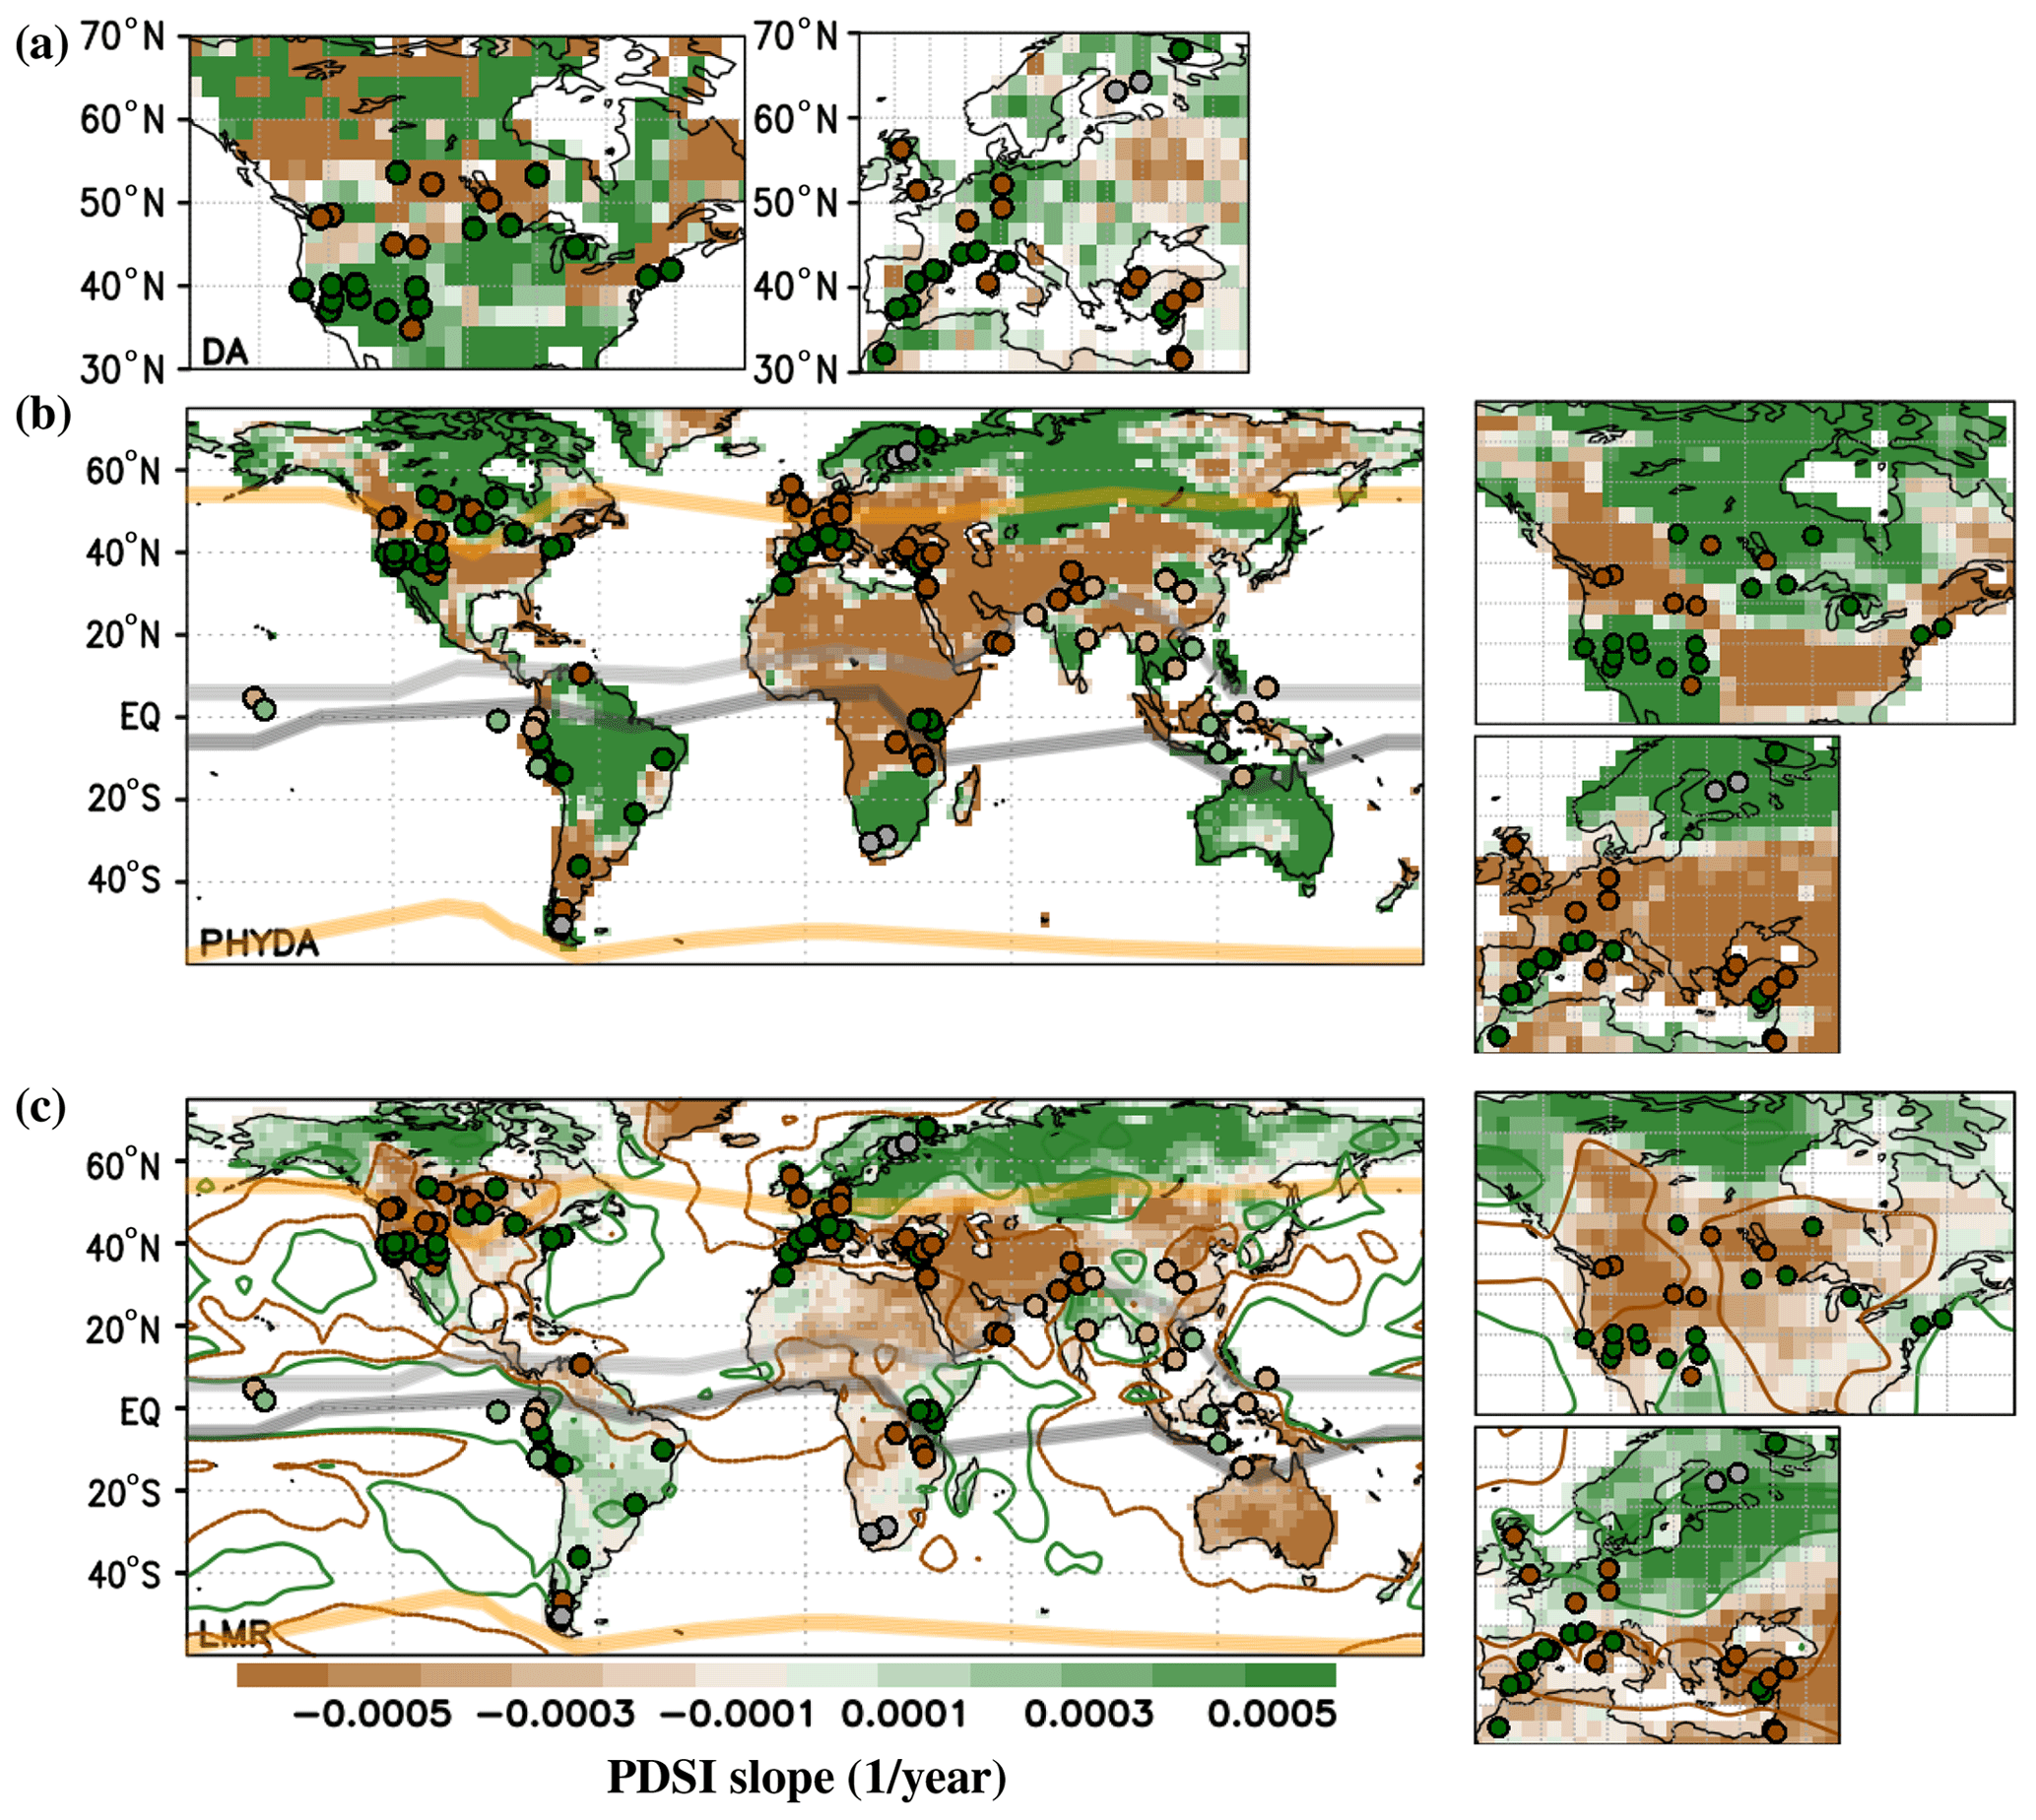
Figure A1Slope of PDSI (shading) or precipitation (contours) from (a) DAs, (b) PHYDA and (c) LMR, obtained with a linear regression for the period 950–1750 CE. Dots represent the locations of Fig. 1, with the same color code considered in that figure; positions of the modern ITCZ, NAM and SAM boundaries are also shown, as described in Fig. 1. For the slope of precipitation, contours of −0.001 mm per month per year (brown) and 0.001 mm per month per year (green) are shown. The average of JJA is considered for the PHYDA and the DAs, while the annual average is considered for the LMR. For the PHYDA and the LMR, regional maps over North America and Europe are shown on the right side of each corresponding panel.
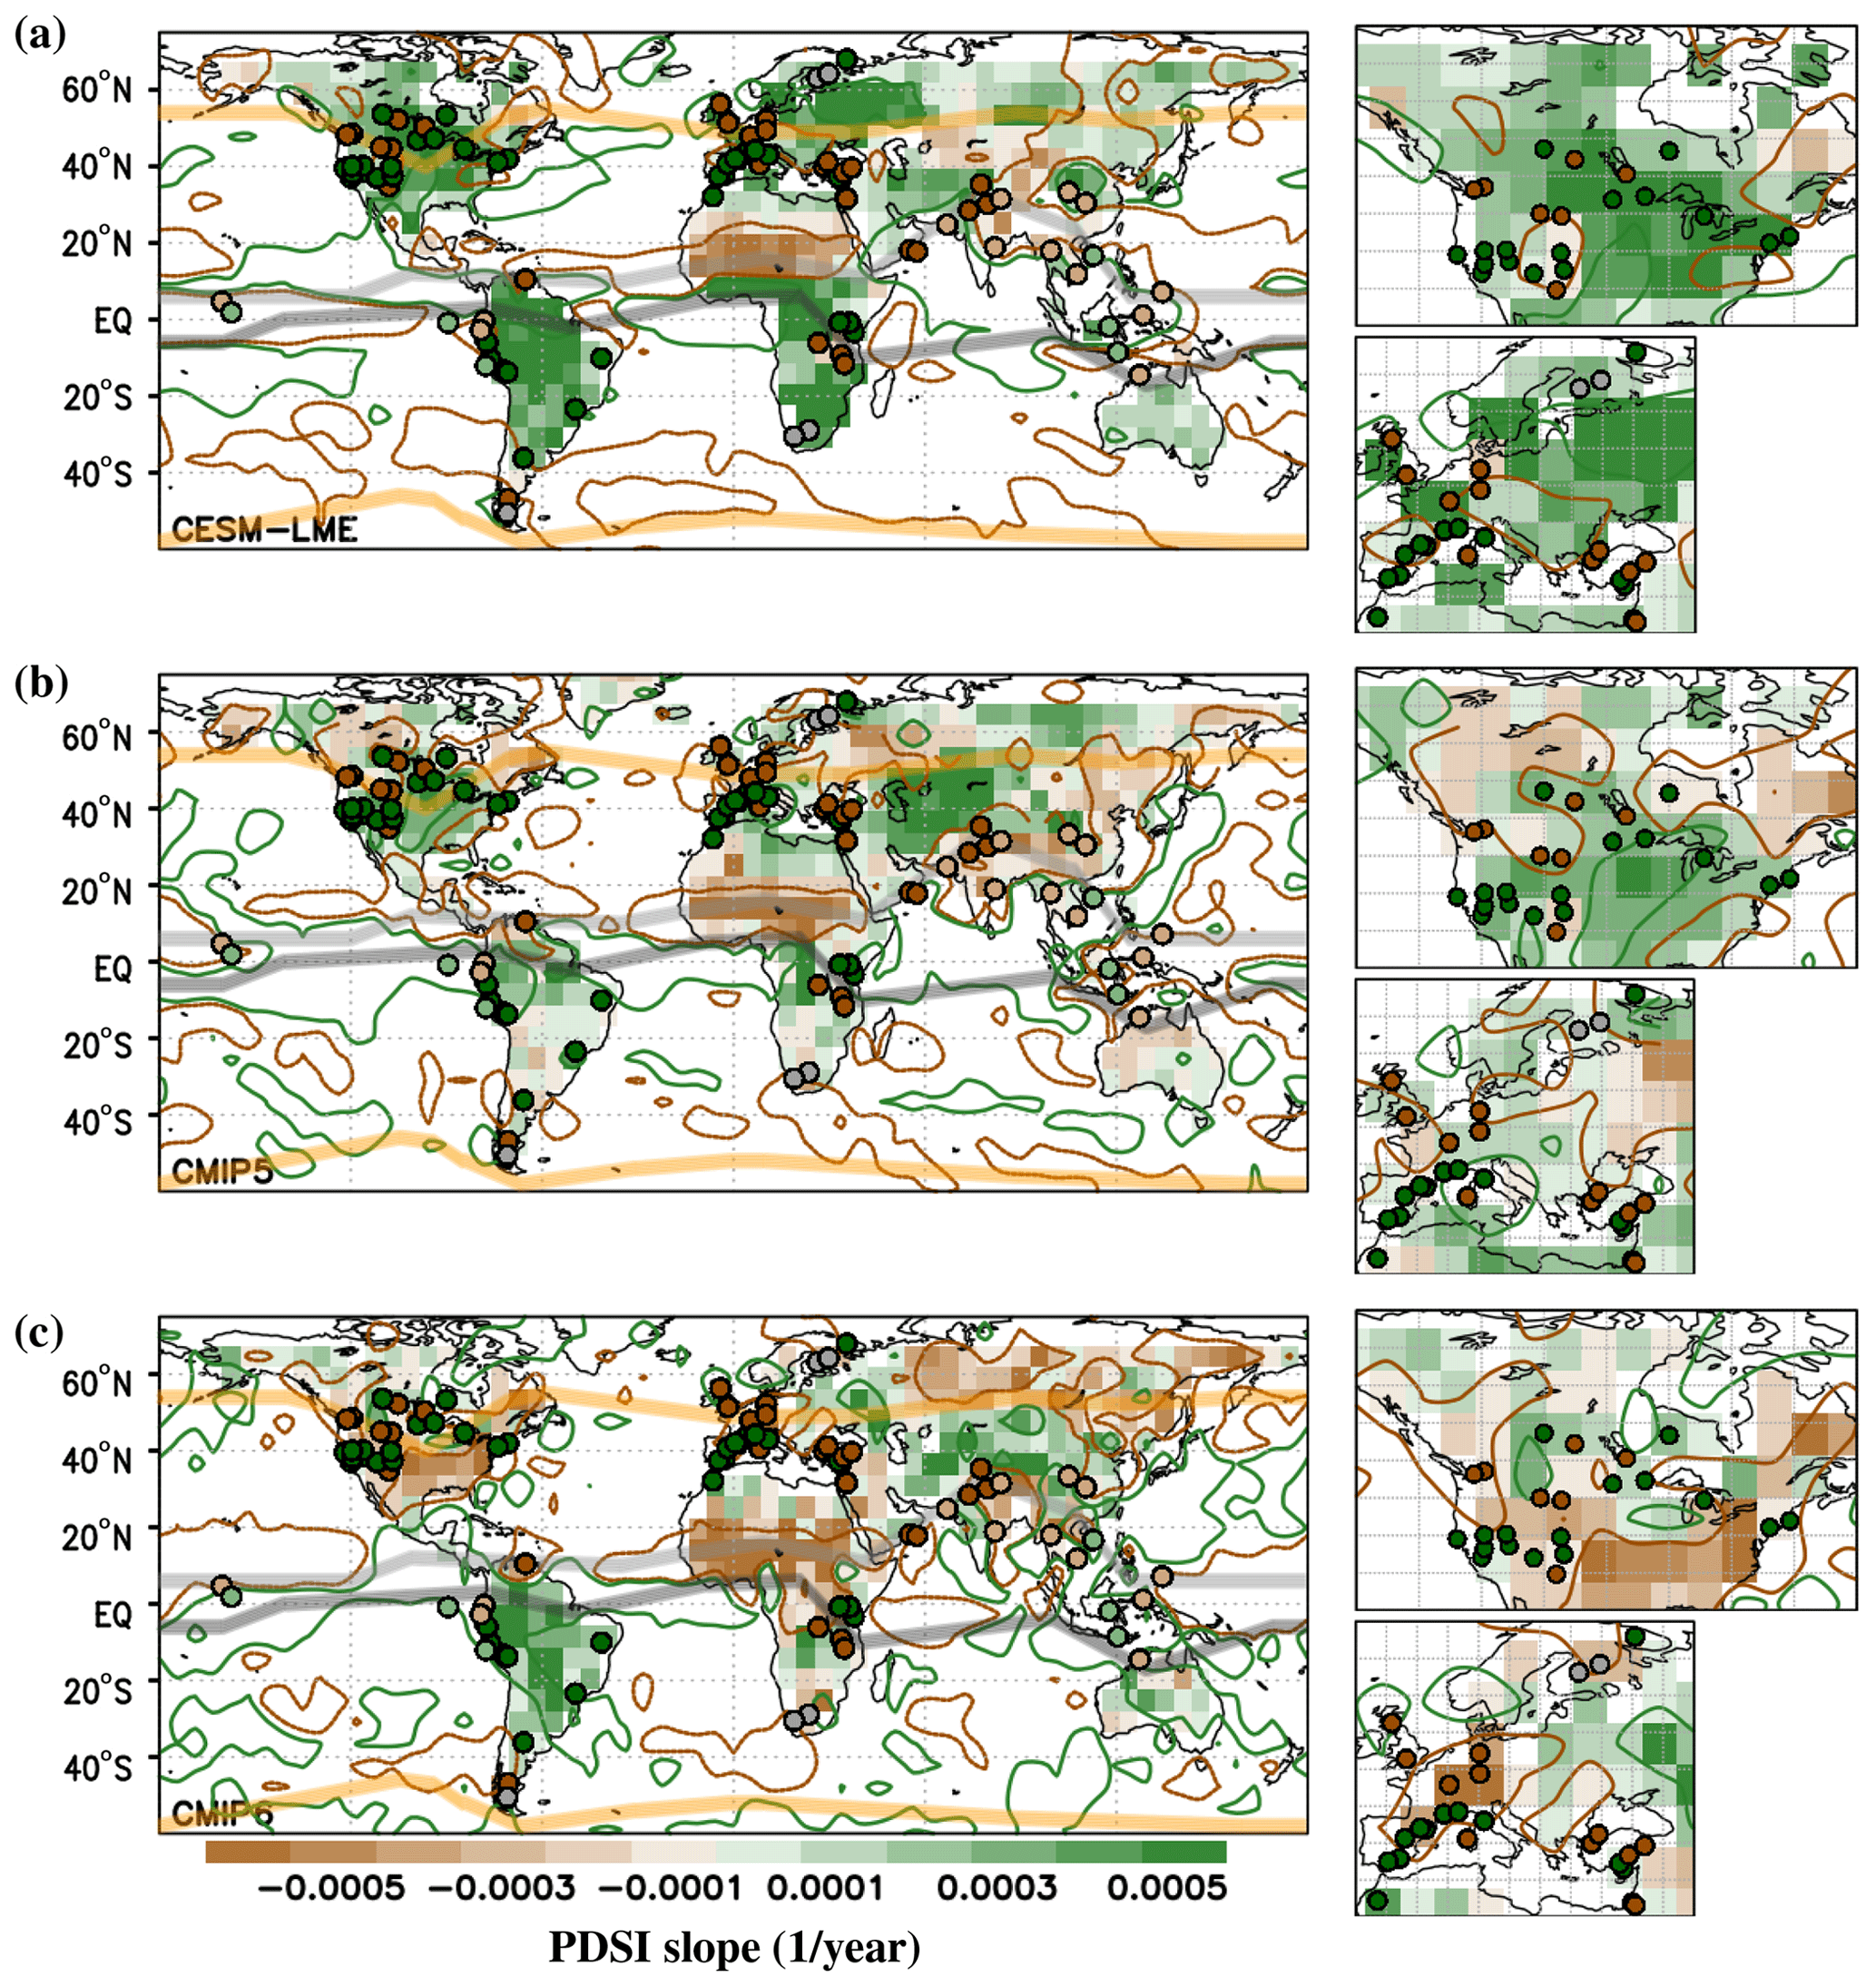
Figure A2Slope of PDSI (shading) or precipitation (contours) from the ensemble average of (a) CESM-LME, (b) CMIP5 and (c) CMIP6 LM simulations, obtained with a linear regression for the period 950–1750 CE. Dots represent the locations of Fig. 1, with the same color code considered in that figure; positions of the modern ITCZ, NAM and SAM boundaries are also shown, as described in Fig. 1. For the slope of precipitation, contours of −0.001 mm per month per year (brown) and 0.001 mm per month per year (green) are shown. In all the cases, the average of JJA is considered. For each product, regional maps over North America and Europe are shown on the right side of each corresponding panel.
In the results presented in the previous sections, the JJA PDSI values from the DAs and the PHYDA as well as the simulations from CESM-LME, CMIP5 and CMIP6 are compared with the annual PDSI provided by the LMR. To confirm that the use of different averaging periods does not have a significant impact on the results, the annual PDSI from the PHYDA and the different ensembles of simulations have been also analyzed. The difference between the LIA and MCA for the annual PDSI of the PHYDA and the ensembles of CESM-LME, CMIP5 and CMIP6 is respectively shown in Figs. B1a, b and B2a, b. When comparing these results with those obtained with the average of JJA (Figs. 3b and 4) only minor differences are observed, mostly limited to regional scales. This shows that despite the relevant seasonal changes found in the atmospheric variables, the cumulative behavior of the PDSI makes it less sensitive to the season.
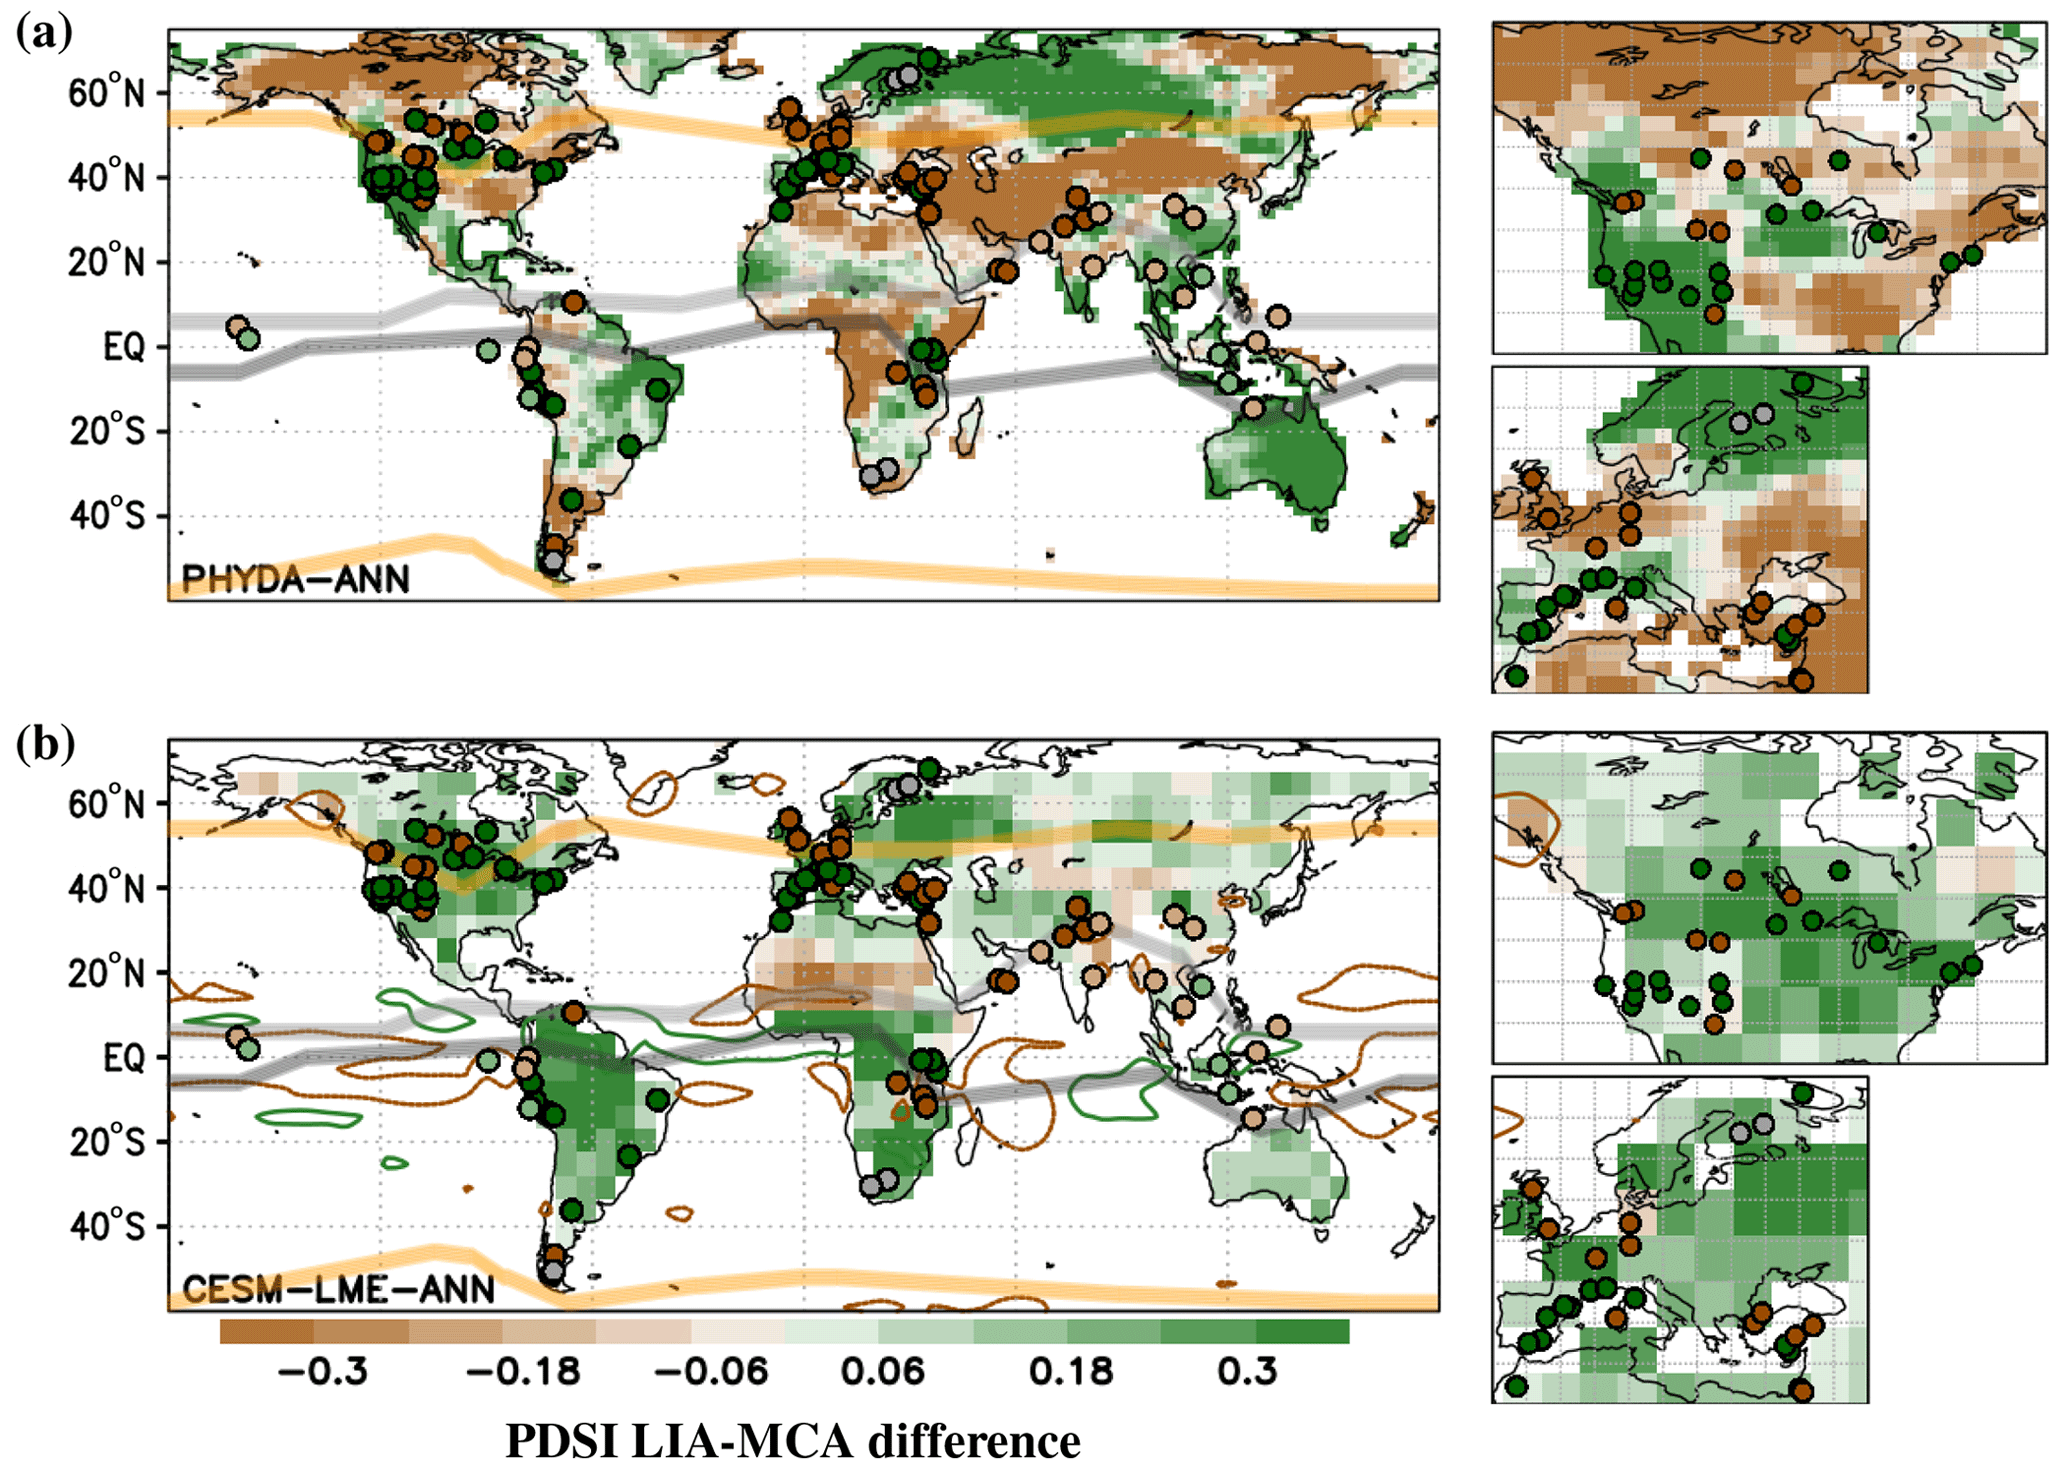
Figure B1LIA–MCA differences in PDSI (shading) or precipitation (contours) from (a) PHYDA and (b) the ensemble average of CESM-LME, considering annual averages. Dots represent the locations of Fig. 1, with the same color code considered in that figure; positions of the modern ITCZ, NAM and SAM boundaries are also shown, as described in Fig. 1. For the precipitation, contours of −1 mm per month (brown) and 1 mm per month (green) are shown. For each case, regional maps over North America and Europe are shown on the right side of each corresponding panel.
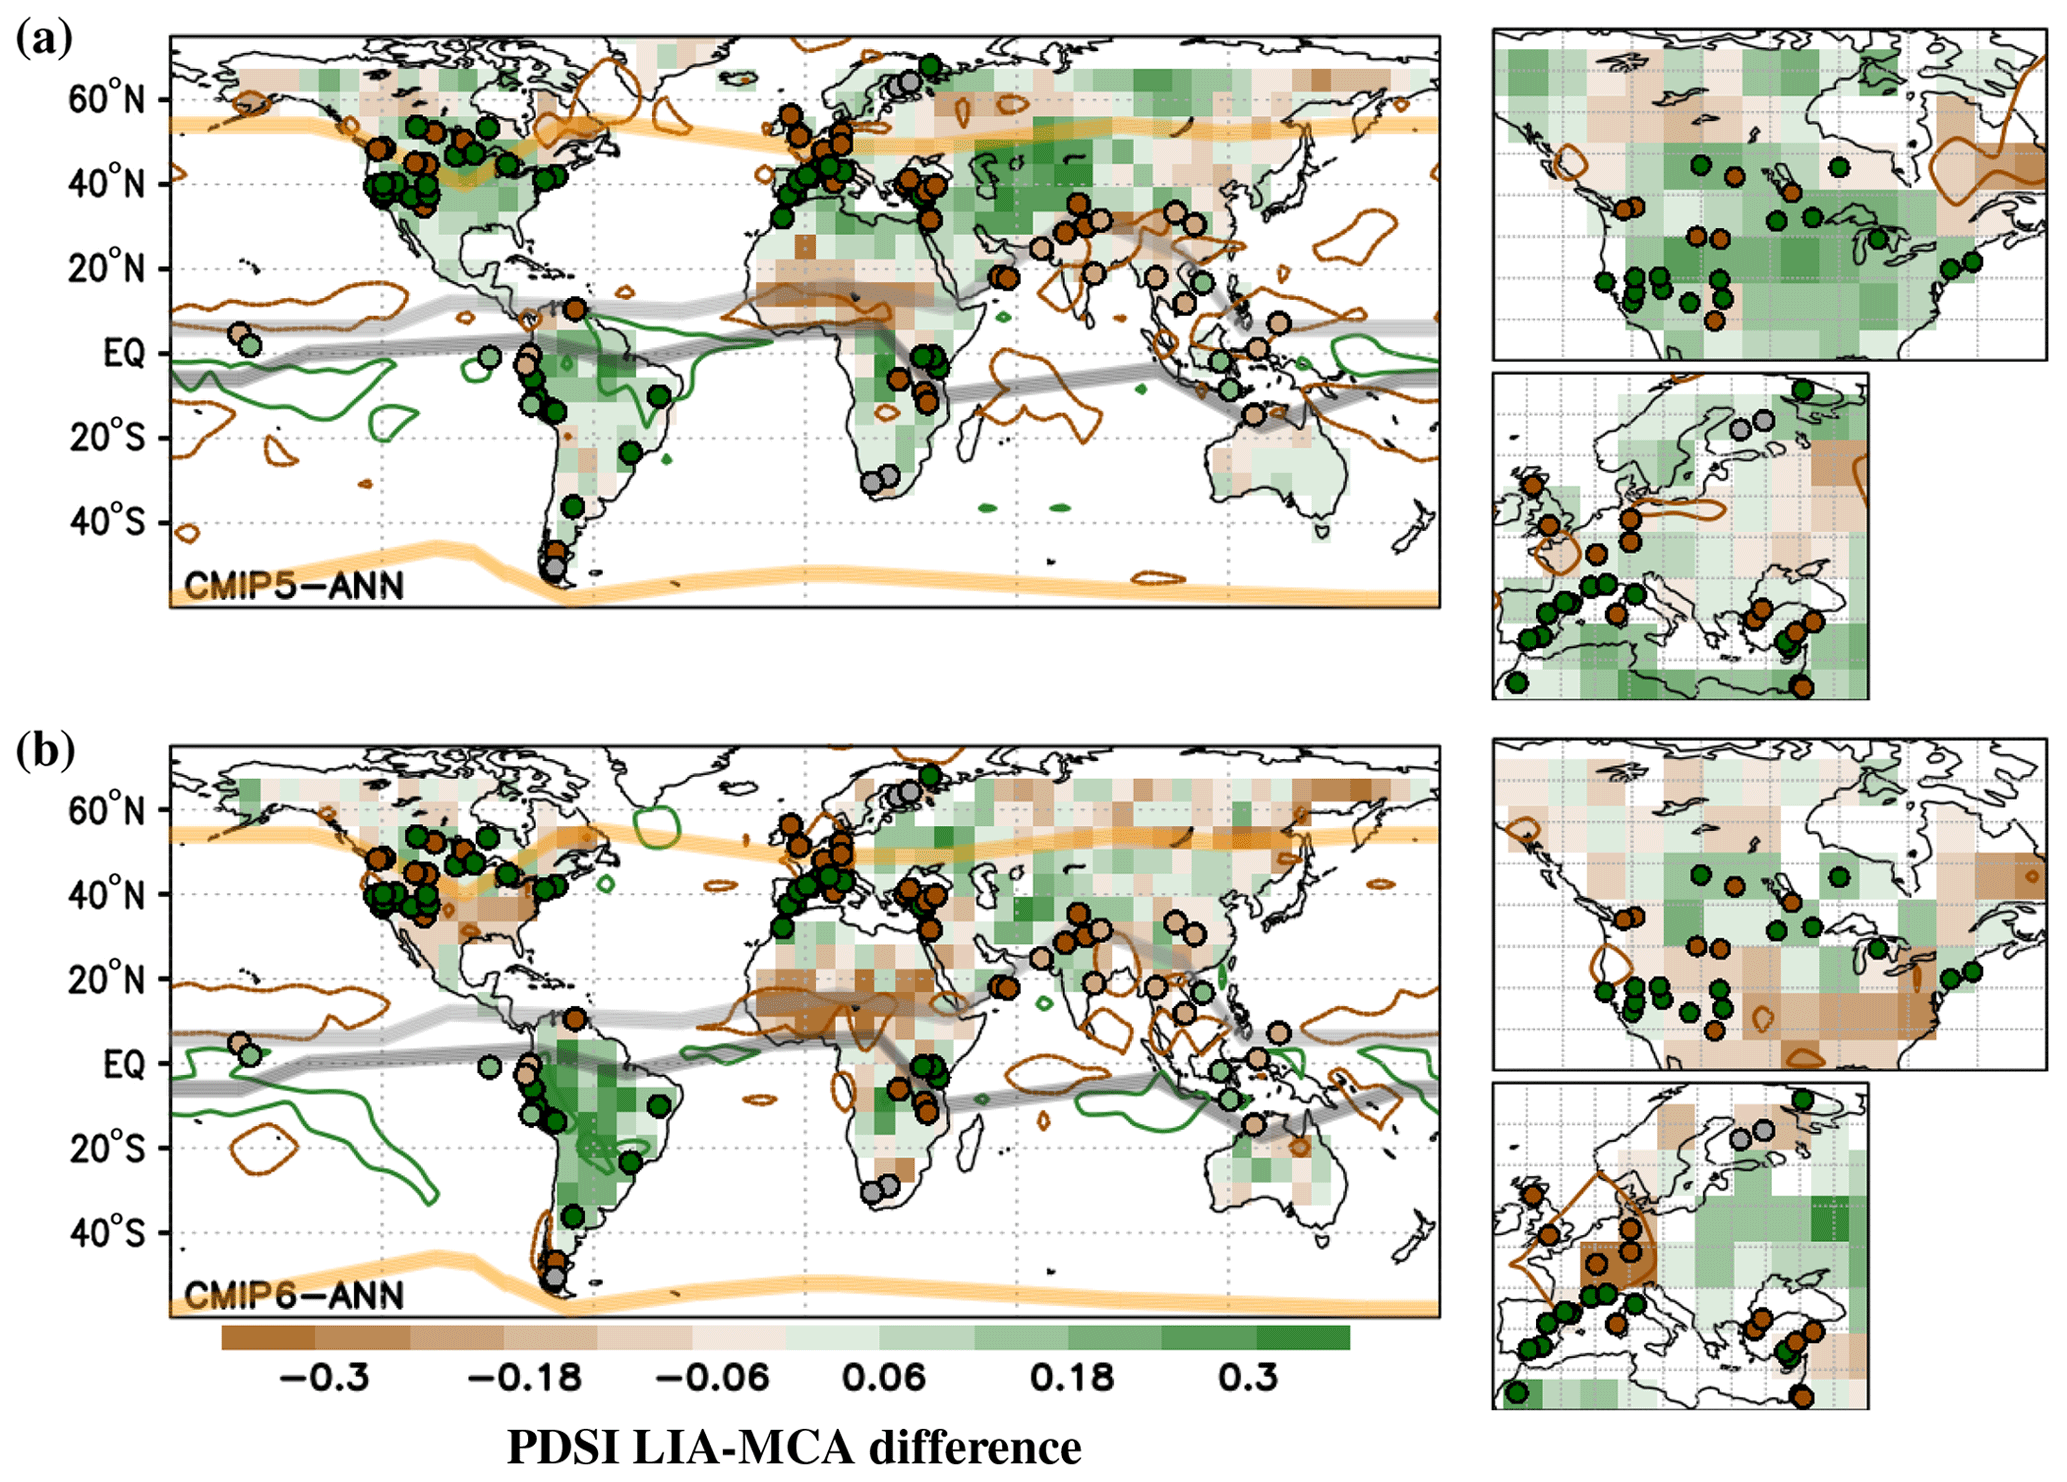
Figure B2LIA–MCA differences in PDSI (shading) or precipitation (contours) from the ensemble average of (a) CMIP5 and (b) CMIP6 LM simulations, considering annual averages. Dots represent the locations of Fig. 1, with the same color code considered in that figure; positions of the modern ITCZ, NAM and SAM boundaries are also shown, as described in Fig. 1. For the precipitation, contours of −1 mm per month (brown) and 1 mm per month (green) are shown. For each case, regional maps over North America and Europe are shown on the right side of each corresponding panel.
For many regions, the agreement in the PDSI differences between the MCA and LIA from different products could be linked to agreement in temperatures. This is the case for central South America, where all the products show a wet LIA (Figs. 3 and 4), linked to cooler temperatures during this period (Figs. C1 and C2), or the Middle East, where the PHYDA and LMR show a drier LIA and a wetter MCA (Fig. 3), consistent with a cooler MCA and a warmer LIA shown by these products (Fig. C1).
The analysis of temperatures can also explain some of the discrepancies found in the analysis of PDSI. For example, the different behavior obtained from PHYDA and LMR for areas of Australia and Patagonia (Fig. 3) can be explained by an opposite behavior in terms of temperature, with the PHYDA (Fig. C1a) and LMR (Fig. C1b) respectively showing warmer or cooler conditions in Patagonia and cooler or warmer conditions in Australia during the LIA. The drier LIA shown by CMIP6 simulations for regions of North America (Fig. 4c) could also be associated with a limited cooling during that period in the CMIP6 ensemble (Fig. C2c) compared to that shown in CMIP5 (Fig. C2b) and CESM-LME (Fig. C2a), while the wetter LIA shown by CESM-LME simulations in western and northern Europe (Fig. 4a) could be associated with the fact that CESM-LME shows cooler conditions during the LIA for these regions (Fig. C2a) compared to those simulated in CMIP5 (Fig. C2b) and CMIP6 (Fig. C2c) ensembles.
These differences can be linked to differences in atmospheric dynamics, with the CMIP5 ensemble showing important differences in sea level pressure (SLP) between the MCA and the LIA in most regions of North America and Europe (Fig. C2b), while the CMIP6 ensemble (Fig. C2c) and the CESM-LME (Fig. C2a) limit these changes to some areas of southern and eastern Europe and northern North America. Despite these differences, all the models show relevant changes in these regions during the MCA and LIA, in line with the changes in the NAO shown in Roldán-Gómez et al. (2020).
For the Indo-Pacific basin, the CESM-LME (Fig. C2a) tends to show cooler conditions during the LIA for most regions, but the temperature difference is small compared to that of North America and Europe. For the case of CMIP5 (Fig. C2b) and CMIP6 (Fig. C2c), warmer conditions are found during the LIA for some areas of India and northern Australia. Regarding the atmospheric dynamics, only the LMR shows relevant changes in SLP for the Indo-Pacific, with positive anomalies in the Indian and western Pacific basin and negative anomalies in the eastern Pacific basin during the LIA. These relatively small changes found in temperature and SLP could explain the limited impact observed in the analysis of PDSI for this area.
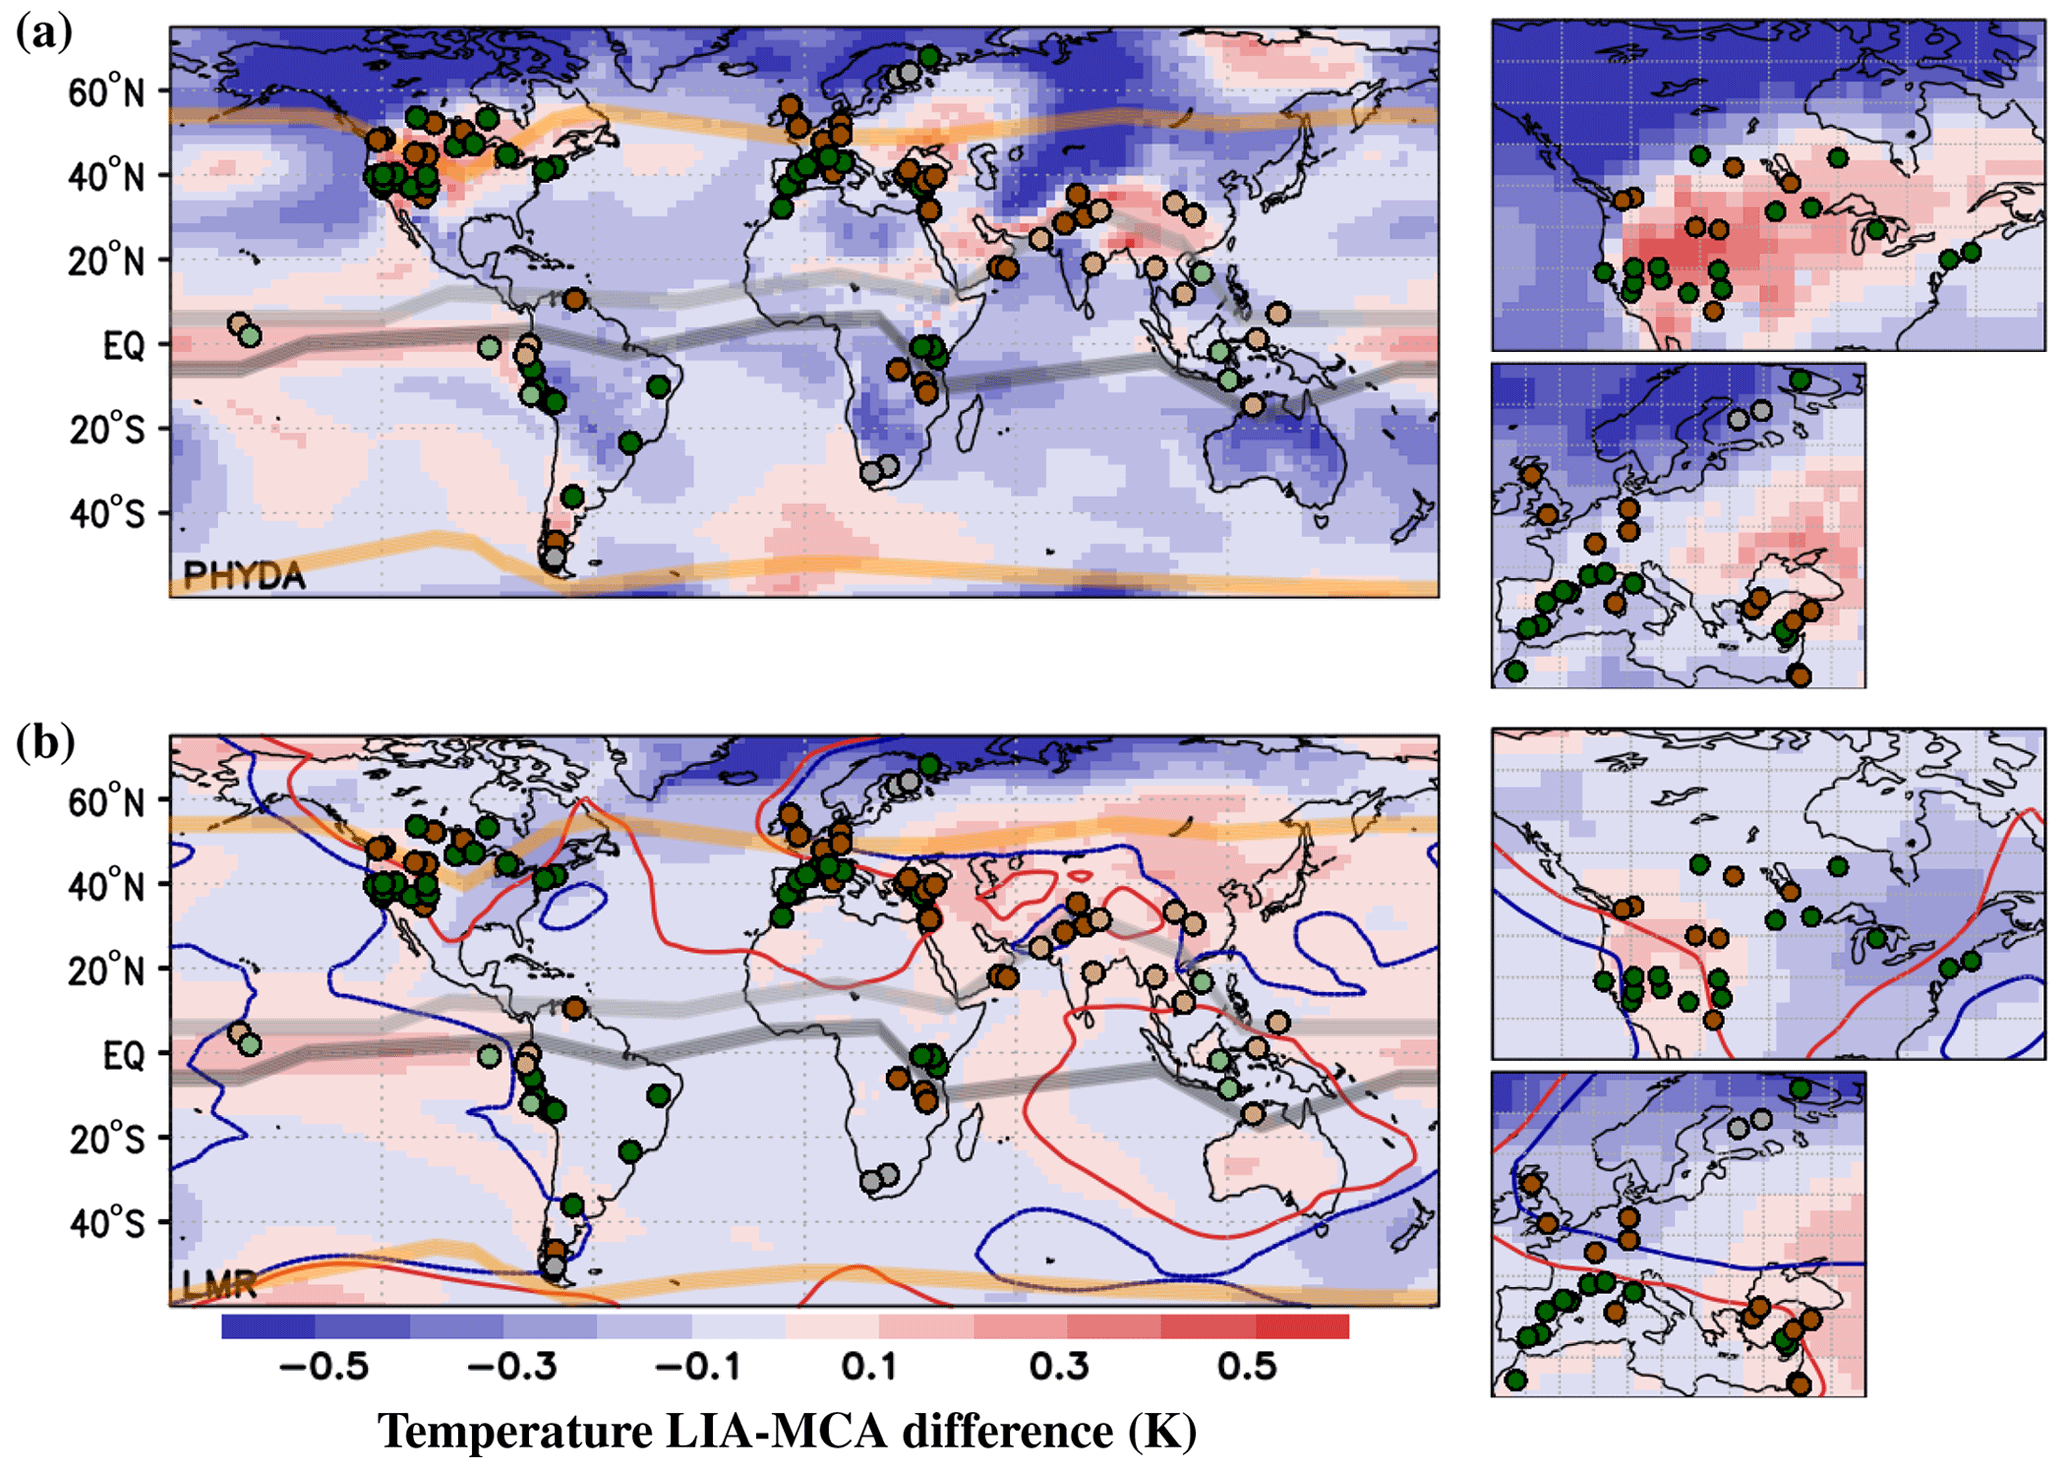
Figure C1LIA–MCA differences in temperature from (a) PHYDA and (b) LMR. Dots represent the locations of Fig. 1, with the same color code considered in that figure; positions of the modern ITCZ, NAM and SAM boundaries are also shown, as described in Fig. 1. For the LMR, differences in SLP are also shown with contours of −5 Pa (blue) and 5 Pa (red). The average of JJA is considered for the PHYDA, while the annual average is considered for the LMR. For each product, regional maps over North America and Europe are shown on the right side of each corresponding panel.
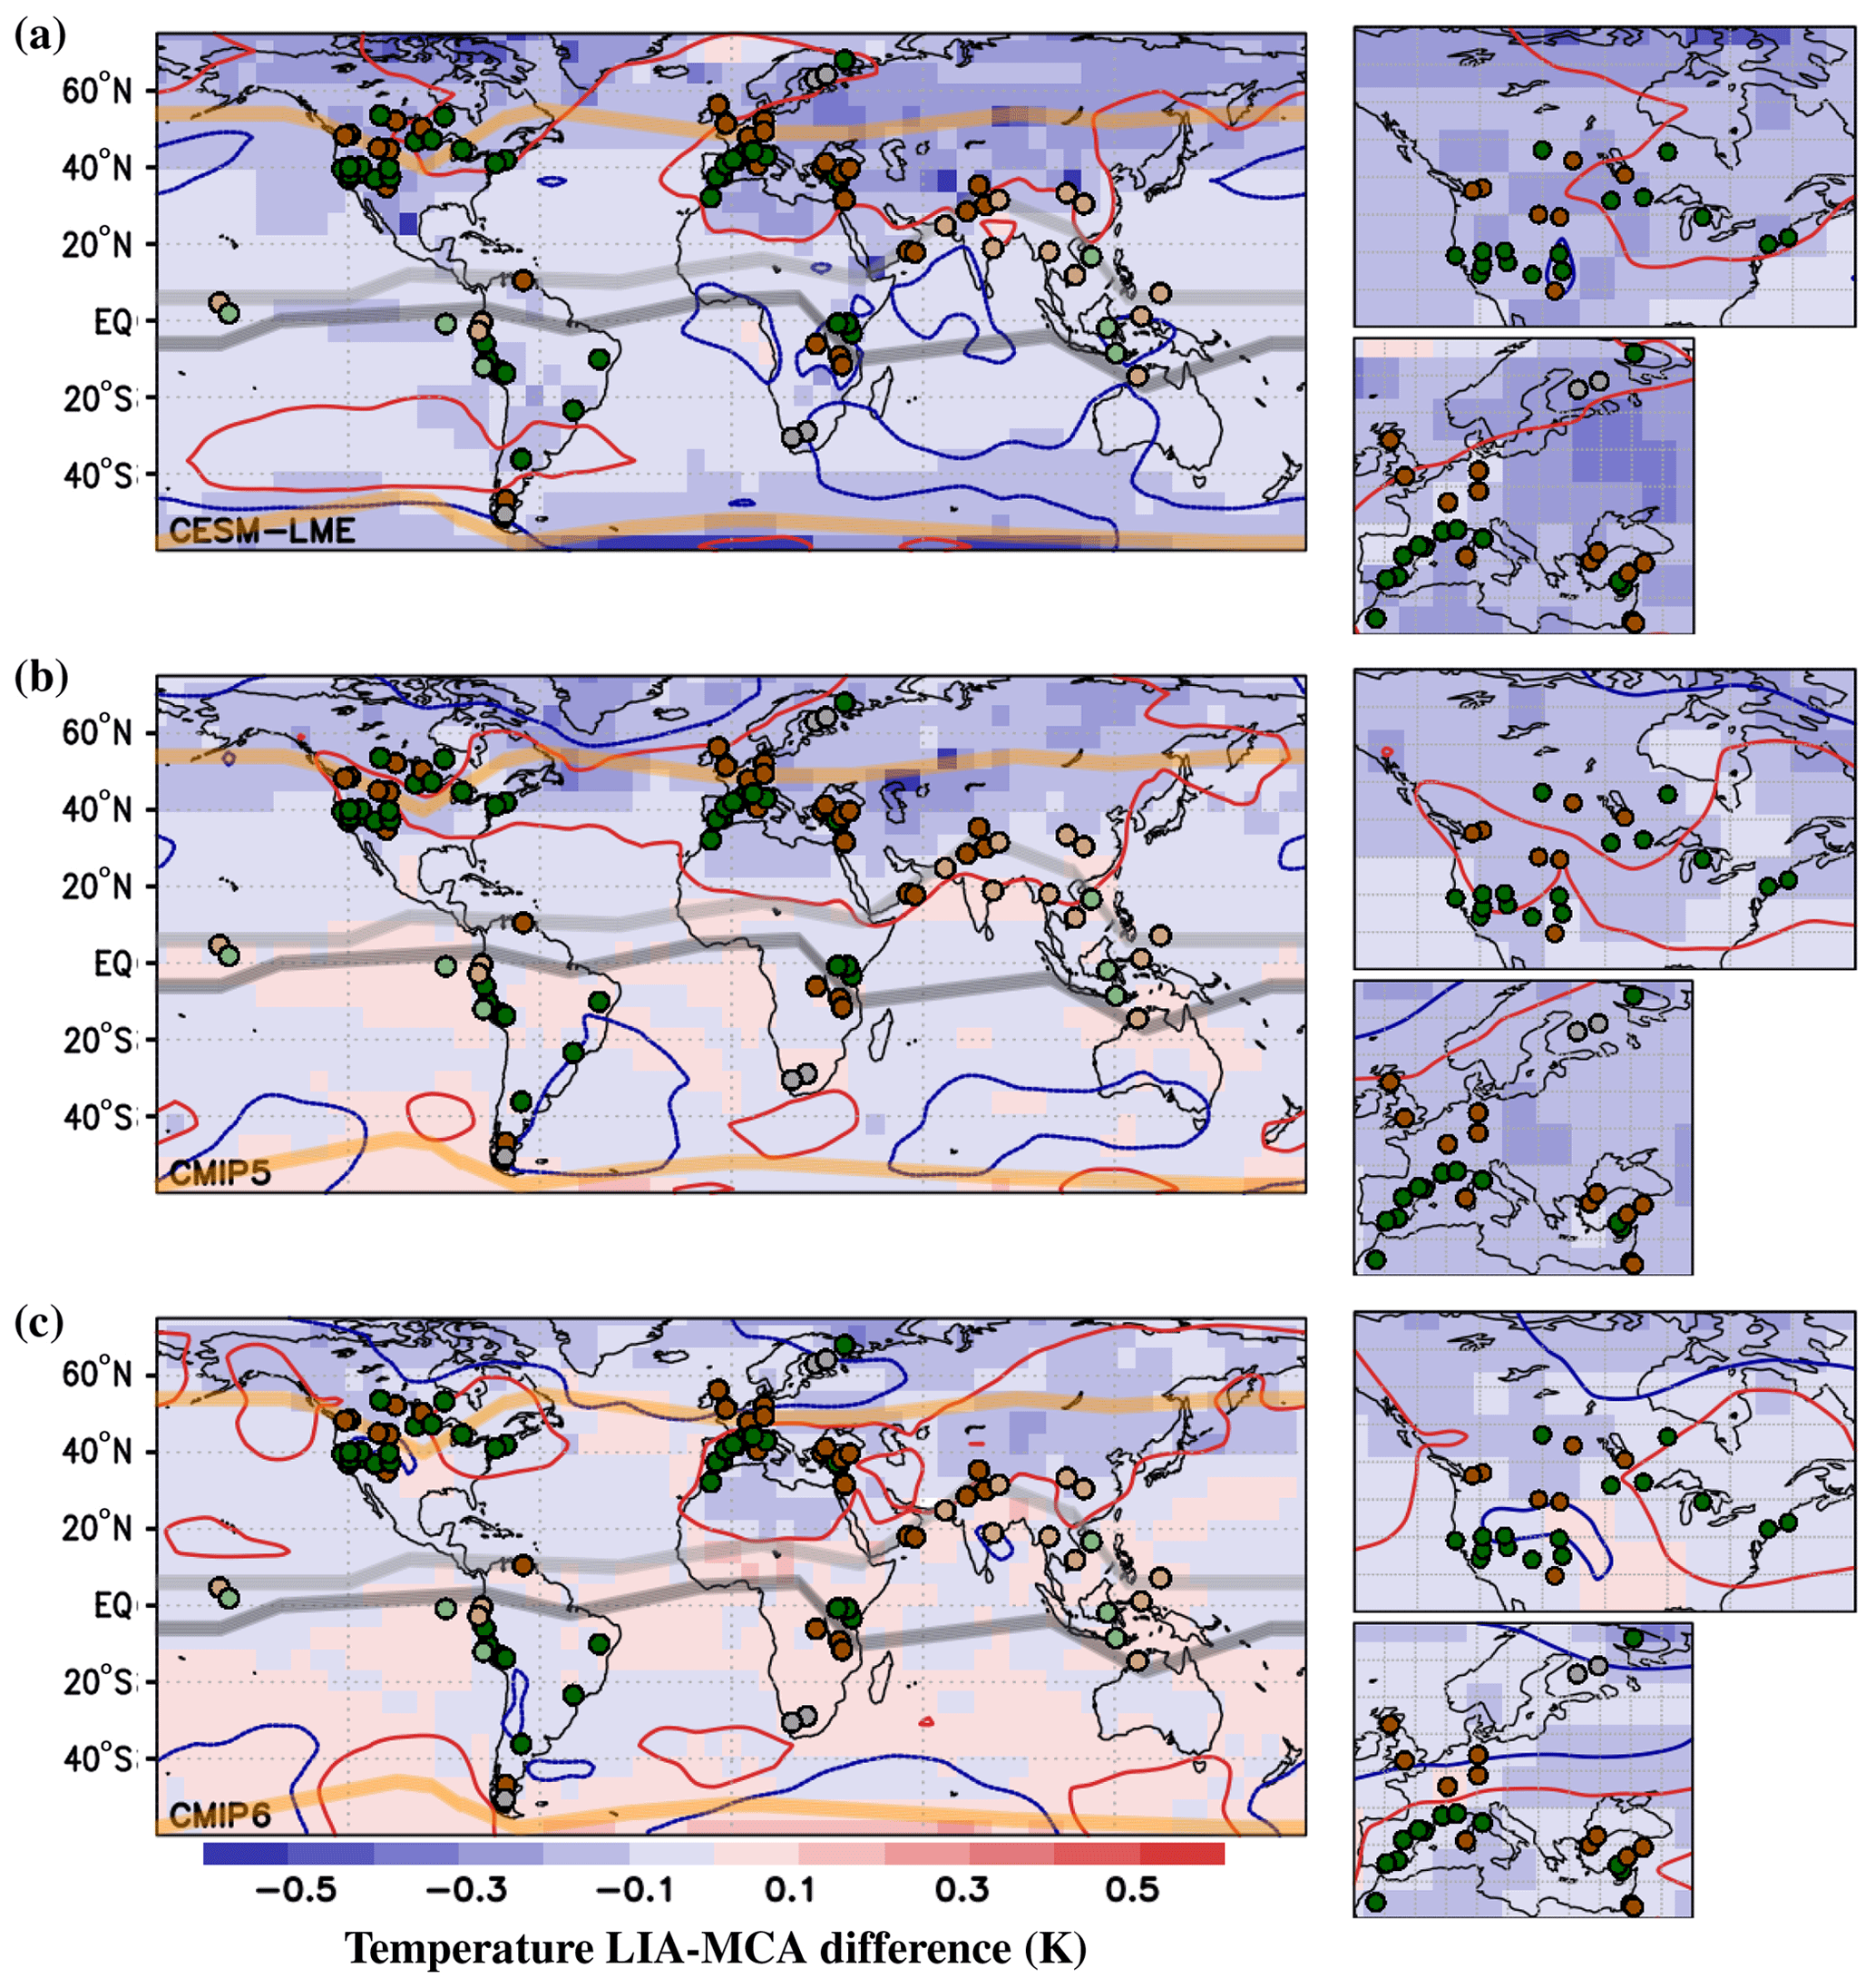
Figure C2LIA–MCA differences in temperature (shading) or SLP (contours) from the ensemble average of (a) CESM-LME, (b) CMIP5 and (c) CMIP6 LM simulations. Dots represent the locations of Fig. 1, with the same color code considered in that figure; positions of the modern ITCZ, NAM and SAM boundaries are also shown, as described in Fig. 1. For the SLP, contours of −5 Pa (blue) and 5 Pa (red) are shown. In all the cases, the average of JJA is considered. For each product, regional maps over North America and Europe are shown on the right side of each corresponding panel.
The analyses included in this work have been based on the data from CMIP5-PMIP3, CMIP6-PMIP4, CESM-LME, LMR, PHYDA, DAs and CRU, all of them publicly available. More details about the outcomes of these analyses can be requested from the authors.
This study is part of PJRG's PhD. PJRG contributed with data processing, analysis of results and writing of the paper. JFGR, JES and FGP contributed to the analysis and discussion of results and to writing the paper.
The contact author has declared that none of the authors has any competing interests.
Publisher's note: Copernicus Publications remains neutral with regard to jurisdictional claims made in the text, published maps, institutional affiliations, or any other geographical representation in this paper. While Copernicus Publications makes every effort to include appropriate place names, the final responsibility lies with the authors.
This publication is part of the SMILEME project (PID2021-126696OB-C21), funded by MCIN/AEI/10.13039/501100011033. Jason E. Smerdon was supported in part by the US National Science Foundation grants OISE-1743738 and AGS-2101214. Félix García-Pereira was funded by a FPI contract (PRE2019-090694) of the Spanish Ministry of Science and Innovation.
This paper was edited by Hugues Goosse and reviewed by two anonymous referees.
Adachi, Y., Yukimoto, S., Deushi, M., Obata, A., Nakano, H., Tanaka, T. Y., Hosaka, M., Sakami, T., Yoshimura, H., Hirabara, M., Shindo, E., Tsujino, H., Mizuta, R., Yabu, S., Koshiro, T., Ose, T., and Kitoh, A.: Basic performance of a new earth system model of the Meteorological Research Institute (MRI-ESM1), Pap. Meteorol. Geophys., 64, 1–19, 2013. a
Anchukaitis, K. J. and Tierney, J. E.: Identifying coherent spatiotemporal modes in time-uncertain proxy paleoclimate records, Clim. Dynam., 41, 1291–1306, 2013. a, b, c, d, e
Anderson, D. M., Overpeck, J. T., and Gupta, A. K.: Increase in the Asian southwest monsoon during the past four centuries, Science, 297, 596–599, 2002. a, b, c
Anderson, L.: Holocene record of precipitation seasonality from lake calcite δ18O in the central Rocky Mountains, United States, Geology, 39, 211–214, 2011. a, b
Antonioli, F., Silenzi, S., Gabellini, M., and Mucedda, M.: High resolution climate trend over the last 1000 years from a stalagmite in Sardinia (Italy), Quat. Nova, 7, 1–5, 2003. a
Apaéstegui, J., Cruz, F. W., Sifeddine, A., Vuille, M., Espinoza, J. C., Guyot, J. L., Khodri, M., Strikis, N., Santos, R. V., Cheng, H., Edwards, L., Carvalho, E., and Santini, W.: Hydroclimate variability of the northwestern Amazon Basin near the Andean foothills of Peru related to the South American Monsoon System during the last 1600 years, Clim. Past, 10, 1967–1981, https://doi.org/10.5194/cp-10-1967-2014, 2014. a, b
Atwood, A. R., Battisti, D. S., Wu, E., Frierson, D. M. W., and Sachs, J. P.: Data-Model Comparisons of Tropical Hydroclimate Changes Over the Common Era, Paleoceanogr. Paleoclimatol., 36, e2020PA003934, https://doi.org/10.1029/2020PA003934, 2021. a, b, c
Barichivich, J., Osborn, T. J., Harris, I., van der Schrier, G., and Jones, P. D.: Monitoring global drought using the self-calibrating Palmer Dr ought Severity Index. In: State of the Climate in 2021, B. Am. Meteorol. Soc., 103, S31–S33, 2021. a
Benito, G., Rico, M., Sánchez-Moya, Y., Sopeña, A., Thorndycraft, V. R., and Barriendos, M.: The impact of late Holocene climatic variability and land use change on the flood hydrology of the Guadalentín River, southeast Spain, Global Planet. Change, 70, 53–63, 2010. a
Benito, G., Thorndycraft, V. R., Rico, M., Sánchez-Moya, Y., Sopena, A., Botero, B. A., Machado, M. J., and Pérez-González, A.: Hydrological response of a dryland ephemeral river to southern African climatic variability during the last millennium, Quatern. Res., 75, 471–482, 2011. a
Benson, L., Kashgarian, M., Rye, R., Lund, S., Paillet, F., Smoot, J., Kester, C., Mensing, S., Meko, D., and Lindstrom, S.: Holocene multidecadal and multicentennial droughts affecting northern California and Nevada, Quaternary Sci. Rev., 21, 659–682, 2002. a
Berkelhammer, M., Sinha, A., Mudelsee, M., Cheng, H., Edwards, R. L., and Cannariato, K.: Persistent multidecadal power of the Indian Summer Monsoon, Earth Planet. Sc. Lett., 290, 166–172, 2010. a, b
Bird, B. W., Abbott, M. B., Rodbell, D. T., and Vuille, M.: Holocene tropical South American hydroclimate revealed from a decadally resolved lake sediment d18O record, Earth Planet. Sc. Lett., 310, 192–202, 2011. a, b
Bookman, R., Enzel, Y., Agnon, A., and Stein, M.: Late Holocene lake-levels of the Dead Sea, Bull. Geol. Soc. Am., 116, 555–571, 2004. a
Booth, R. K., Notaro, M., Jackson, S. T., and Kutzbach, J. E.: Widespread drought episodes in the western Great Lakes region during the past 2000 years: geographic extent and potential mechanisms, Earth Planet. Sc. Lett., 242, 415–427, 2006. a, b
Boucher, É., Guiot, J., and Chapron, E.: A millennial multi-proxy reconstruction of summer PDSI for Southern South America, Clim. Past, 7, 957–974, https://doi.org/10.5194/cp-7-957-2011, 2011. a, b
Brown, E. T. and Johnson, T. C.: Coherence between tropical East African and South American records of the Little Ice Age, Geochem. Geophy. Geosys., 6, Q12005, https://doi.org/10.1029/2005GC000959, 2005. a, b
Bryson, R. and Swain, A.: Holocene variations of monsoon rainfall in Rajasthan, Quatern. Res., 16, 135–145, 1981. a, b, c
Buckley, B. M., Palakit, K., Duangsathaporn, K., Sanguantham, P., and Prasomsin, P.: Decadal scale droughts over northwestern Thailand over the past 448 years: Links to the tropical Pacific and Indian Ocean sectors, Clim. Dynam., 29, 63–71, 2007. a, b
Buckley, B. M., Anchukaitis, K., Penny, D., Fletcher, R., Cook, E. R., Sano, M., Nam, L. C., Wichienkeeo, A., Minh, T. T., and Hong, T. M.: Climate as a contributing factor in the demise of Angkor, Cambodia, P. Natl. Acad. Sci. USA, 107, 6748–6752, 2010. a, b
Büntgen, U., Trouet, V., Frank, D., Leuschner, H. H., Friedrichs, D., Luterbacher, J., and Esper, J.: Tree-ring indicators of German summer drought over the last millennium, Quaternary Sci. Rev, 29, 1005–1016, 2010. a, b, c
Büntgen, U., Tegel, W., Nicolussi, K., McCormick, M., Frank, D., Trouet, V., Kaplan, J. O., Herzig, F., Heussner, K., Wanner, H., Luterbacher, J., and Esper, J.: 2500 years of european climate variability and human susceptibility, Science, 331, 578–582, 2011. a, b, c, d
Burns, S. J., Fleitmann, D., Mudelsee, M., Neff, U., Matter, A., and Mangini, A.: A 780-year annually resolved record of Indian Ocean monsoon precipitation from a speleothem from south Oman, J. Geophys. Res.-Atmos., 107, 4434, https://doi.org/10.1029/2001JD001281, 2002. a, b, c
Case, R. A. and MacDonald, G. M.: Tree ring reconstructions of streamflow for three Canadian prairie rivers, J. Am. Water Resour. Assoc., 39, 703–716, 2003. a
Chepstow-Lusty, A. J., Frogley, M. R., Bauer, B. S., Leng, M. J., Boessenkool, K. P., Carcaillet, C., Ali, A. A., and Gioda, A.: Putting the rise of the Inca Empire within a climatic and land management context, Clim. Past, 5, 375–388, https://doi.org/10.5194/cp-5-375-2009, 2009. a
Coats, S., Smerdon, J. E., Cook, B. I., and Seager, R.: Stationarity of the tropical pacific teleconnection to North America in CMIP5/PMIP3 model simulations, Geophys. Res. Lett, 40, 1–6, 2013a. a
Coats, S., Smerdon, J. E., Seager, R., Cook, B. I., and González-Rouco, J. F.: Megadroughts in Southwestern North America in ECHO-G millenial simulations and their comparison to proxy drougth reconstructions, Am. Meteorol. Soc., 26, 7635–7649, 2013b. a
Cook, B. I., Smerdon, J. E., Seager, R., and Coats, S.: Global warming and 21st century drying, Clim. Dynam., 43, 2607–2627, 2014. a
Cook, B. I., Smerdon, J. E., Cook, E. R., Williams, A. P., Anchukaitis, K. J., Mankin, J. S., Allen, K., Andreu-Hayles, L., Ault, T. R., Belmecheri, S., Coats, S., Coulthard, B., Fosu, B., Grierson, P., Griffin, D., Herrera, D. A., Ionita, M., Lehner, F., Leland, C., Marvel, K., Morales, M. S., Mishra, V., Ngoma, J., Nguyen, H. T. T., O'Donnell, A., Palmer, J., Rao, M. P., Rodriguez-Caton, M., Seager, R., Stahle, D. W., Stevenson, S., Thapa, U. K., Varuolo-Clarke, A. M., and Wise, E. K.: Megadroughts in the Common Era and the Anthropocene, Nat. Rev. Earth And Environ., 3, 741–757, 2022. a, b
Cook, E. R., Woodhouse, C. A., Eaking, C. M., Meko, D. M., and Stahle, D. W.: Long-term aridity changes in the western United States, Science, 306, 1015–1018, 2004. a, b, c
Cook, E. R., Anchukaitis, K. J., Buckley, B. M., D'Arrigo, R. D., Jacoby, G. C., and Wright, W. E.: Asian Monsoon Failure and Megadrought During the Last Millennium, Science, 328, 486–489, 2010a. a, b
Cook, E. R., Seager, R., Heim, R. R., Vose, R. S., Herweijer, C., and Woodhouse, C.: Megadroughts in North America: placing IPCC projections of hydroclimatic change in a long-term palaeoclimate context, J. Quaternary Sci., 25, 48–61, 2010b. a, b, c, d, e, f, g
Cook, E. R., Seager, R., Kushnir, Y., Briffa, K., Buntgen, U., Frank, D., Krusic, P., Tegel, W., van der Schrier, G., Andreu-Hayles, L., Baillie, M., Baittinger, C., Bleicher, N., Bonde, N., Brown, D., Carrer, M., Cooper, R., Cufar, K., Dittmar, C., Esper, J., Griggs, C., Gunnarson, B., Gunther, B., Gutierrez, E., Haneca, K., Helama, S., Herzig, F., Heussner, K.-U., Hofmann, J., Janda, P., Kontic, R., Kose, N., Kyncl, T., Levanic, T., Linderholm, H., Manning, S., Melvin, T. M., Miles, D., Neuwirth, B., Nicolussi, K., Nola, P., Panayotov, M., Popa, I., Rothe, A., Seftigen, K., Seim, A., Svarva, H., Svoboda, M., Thun, T., Timonen, M., Touchan, R., Trotsiuk, V., Trouet, V., Walder, F., Wazny, T., Wilson, R., and Zang, C.: Old World megadroughts and pluvials during the Common Era, Sci. Adv., 1, 1500561, https://doi.org/10.1126/sciadv.1500561, 2015. a, b
Denniston, R. F., Ummenhofer, C. C., Jr., A. D. W., Lachniet, M. S., Villarini, G., Asmerom, Y., Polyak, V. J., Passaro, K. J., Cugley, J., Woods, D., and Humphreys, W. F.: Expansion and Contraction of the Indo-Pacific Tropical Rain Belt over the Last Three Millennia, Sci. Rep., 6, 34485, https://doi.org/0.1038/srep34485, 2016. a, b, c, d
Diaz, H. F., Trigo, R., Hughes, M. K., Mann, M. E., Xoplaki, E., and Barriopedro, D.: Spatial and temporal characteristics of climate in Medieval Times revisited, B. Am. Meteorol. Soc., 92, 1487–1500, 2011. a
Dufresne, J., Foujols, M., Denvil, S., Caubel, A., Marti, O., Aumont, O., Balkanski, Y., Bekki, S., Bellenger, H., Benshila, R., Bony, S., Bopp, L., Braconnot, P., Brockmann, P., Cadule, P., Cheruy, F., Codron, F., Cozic, A., Cugnet, D., de Noblet, N., Duvel, J., Ethe, C., Fairhead, L., Fichefet, T., Flavoni, S., Friedlingstein, P., Grandpeix, J., Guez, L., Guilyardi, E., Hauglustaine, D., Hourdin, F., Idelkadi, A., Ghattas, J., Joussaume, S., Kageyama, M., Krinner, G., Labetoulle, S., Lahellec, A., Lefebvre, M., Lefevre, F., Levy, C., Li, Z. X., Lloyd, J., Lott, F., Madec, G., Mancip, M., Marchand, M., Masson, S., Meurdesoif, Y., Mignot, J., Musat, I., Parouty, S., Polcher, J., Rio, C., Schulz, M., Swingedouw, D., Szopa, S., Talandier, C., Terray, P., Viovy, N., and Vuichard, N.: Climate change projections using the IPSL-CM5 Earth System Model: From CMIP3 to CMIP5, Clim. Dynam., 40, 2123–2165, 2013. a
Ely, L. L., Enzel, Y., Baker, V. R., and Cayan, D. R.: A 5000-year record of extreme floods and climate change in the southwestern United States, Science, 262, 410–412, 1993. a
Esper, J., Frank, D., Büntgen, U., Verstege, A., Luterbacher, J., and Xoplaki, E.: Long-term drought severity variations in Morocco, Geophys. Res. Lett, 34, L17702, https://doi.org/10.1029/2007GL030844, 2007. a
Eyring, V., Bony, S., Meehl, G. A., Senior, C. A., Stevens, B., Stouffer, R. J., and Taylor, K. E.: Overview of the Coupled Model Intercomparison Project Phase 6 (CMIP6) experimental design and organization, Geosci. Model Dev., 9, 1937–1958, https://doi.org/10.5194/gmd-9-1937-2016, 2016. a
Fernández-Donado, L., González-Rouco, J. F., Raible, C. C., Ammann, C. M., Barriopedro, D., García-Bustamante, E., Jungclaus, J. H., Lorenz, S. J., Luterbacher, J., Phipps, S. J., Servonnat, J., Swingedouw, D., Tett, S. F. B., Wagner, S., Yiou, P., and Zorita, E.: Large-scale temperature response to external forcing in simulations and reconstructions of the last millennium, Clim. Past, 9, 393–421, https://doi.org/10.5194/cp-9-393-2013, 2013. a, b, c
Fleitmann, D., Burns, S. J., Mudelsee, M., Neff, U., Kramers, J., Mangini, A., and Matter, A.: Holocene forcing of the Indian monsoon recorded in a stalagmite from Southern Oman, Science, 300, 1737–1739, 2003. a, b, c, d
Fogt, R. L., Perlwitz, J., Monaghan, A. J., Bromwich, D. H., Jones, J. M., and Marshall, G. J.: Historical SAM variability. Part II: Twentieth-Century variability and trends from reconstructions, observations, and the IPCC AR4 models, Am. Meteorol. Soc., https://doi.org/10.1175/2009JCLI2786.1, 2009. a, b, c
Garcin, Y., Williamson, D., Taieb, M., Vincens, A., Mathe, P. E., and Majule, A.: Centennial to millennial changes in maar-lake deposition during the last 45,000 years in tropical Southern Africa (Lake Masoko, Tanzania), Palaeogeogr. Palaeoclimatol. Palaeoecol., 239, 334–354, 2006. a, b
Garcin, Y., Williamson, D., Bergonzini, L., Radakovitch, O., Vincens, A., Buchet, G., Guiot, J., Brewer, S., Mathé, P., and Majule, A.: Solar and anthropogenic imprints on Lake Masoko (southern Tanzania) during the last 500 years, J. Paleolimnol., 37, 475–490, 2007. a, b
Gilbert, E., Bergonzini, L., Massault, M., and Williamson, D.: AMS-C14 chronology of 40.0 cal ka BP continuous deposits from a crater lake (Lake Masoko, Tanzania) – modern water balance and environmental implications, Palaeogeogr. Palaeoclimatol. Palaeoecol., 187, 307–322, 2002. a, b
Giorgetta, M. A., Jungclaus, J., Reick, C. H., Legutke, S., Bader, J., Böttinger, M., Brovkin, V., Crueger, T., Esch, M., Fieg, K., Glushak, K., Gayler, V., Haak, H., Hollweg, H., Ilyina, T., Kinne, S., Kornblueh, L., Matei, D., Mauritsen, T., Mikolajewicz, U., Mueller, W., Notz, D., Pithan, F., Raddatz, T., Rast, S., Redler, R., Roeckner, E., Schmidt, H., Schnur, R., Segschneider, J., Six, K. D., Stockhause, M., Timmreck, C., Wegner, J., Widmann, H., Wieners, K., Claussen, M., Marotzke, J., and Stevens, B.: Climate and carbon cycle changes from 1850 to 2100 in MPI ESM simulations for the Coupled Model Intercomparison Project phase 5, J. Adv. Model. Earth Syst., 5, 572–597, 2013. a
Göktürk, O. M.: Climate in the Eastern Mediterranean through the Holocene inferred from Turkish stalagmites, PhD thesis, University of Bern, Bern, 113 pp., https://occrdata.unibe.ch/students/theses/phd/68.pdf (last access: 16 November 2023), 2011. a, b, c
Göktürk, O. M., Fleitmann, D., Badertscher, S., Cheng, H., Edwards, R. L., and Tüysüz, O.: Climate on the Southern Black Sea coast during the Holocene: implications from the Sofular Cave record, Quaternary Sci. Rev., 30, 2433–2445, 2011. a
Gong, D. Y. and Wang, S. W.: Definition of Antarctic Oscillation Index, Geophys. Res. Lett., 26, 459–462, 1999. a
Graham, N. E., Hughes, M. K., Ammann, C. M., Cobb, K. M., Hoerling, M. P., Kennett, D. J., Kennett, J. P., Rein, B., Stott, L., Wigand, P. E., and Xu, T.: Tropical Pacific - mid-latitude teleconnections in medieval times, Climatic Change, 83, 241–285, 2007. a, b, c
Graham, N. E., Ammann, C. M., Fleitmann, D., Cobb, K. M., and Luterbacher, J.: Support for global climate reorganization during the “Medieval Climate Anomaly”, Clim. Dynam., 37, 1217–1245, https://doi.org/10.1007/s00382-010-0914-z, 2010. a, b, c
Gray, S. T., Fastie, C. L., Jackson, S. T., and Betancourt, J. L.: Tree-ring based reconstruction of precipitation in the Bighorn Basin, Wyoming, sice 1260 AD, J. Climate, 17, 3855–3865, 2004. a
Greenbaum, N., Schick, A. P., and Baker, V. R.: The palaeoflood record of a hyperarid catchment, Nahal Zin, Negev Desert, Israel, Earth Surf. Proc. Land., 25, 951–971, 2000. a
Griffiths, M. L., Kimbrough, A. K., Gagan, M. K., Drysdale, R. N., Cole, J. E., Johnson, K. R., Zhao, J. X., Cook, B. I., Hellstrom, J. C., and Hantoro, W. S.: Western Pacific hydroclimate linked to global climate variability over the past two millennia, Nat. Commun., 7, 11719, https://doi.org/10.1038/ncomms11719, 2016. a, b
Grissino-Mayer, H. D.: Tree-ring reconstructions of climate and fire history at El Malpais National Monument, New Mexico, PhD dissertation, The University of Arizona, 407 pp., https://ltrr.arizona.edu/content/tree-ring-reconstructions-climate-and-fire-history-el-malpais (last access: 16 November 2023), 1995. a
Gupta, A., Anderson, D., and Overpeck, J.: Abrupt changes in the Asian southwest monsoon during the Holocene and their links to the North Atlantic Ocean, Nature, 421, 354–357, 2003. a, b, c
Hajima, T., Watanabe, M., Yamamoto, A., Tatebe, H., Noguchi, M. A., Abe, M., Ohgaito, R., Ito, A., Yamazaki, D., Okajima, H., Ito, A., Takata, K., Ogochi, K., Watanabe, S., and Kawamiya, M.: Development of the MIROC-ES2L Earth system model and the evaluation of biogeochemical processes and feedbacks, Geosci. Model Dev., 13, 2197–2244, https://doi.org/10.5194/gmd-13-2197-2020, 2020. a
Haug, G. H., Hughen, K. A., Sigman, D. M., Peterson, L. C., and Röhl, U.: Southward migration of the intertropical convergence zone through the Holocene, Science, 293, 1304–1308, 2001. a, b, c
Helama, S., Meriläinen, J., and Tuomenvirta, H.: Multicentennial megadrought in northern Europe coincided with a global El Nino–Southern Oscillation drought pattern during the Medieval Climate Anomaly, Geology, 37, 175–178, 2009. a
Higley, M. C., Conroy, J. L., and Schmitt, S.: Last millennium meridional shifts in hydroclimate in the central tropical Pacific, Paleoceanogr. Paleoclimatol., 33, 354–366, 2018. a, b, c, d
Hiner, C. A., Kirby, M. E., Bonuso, N., Patterson, W. P., Palermo, J., and Silveira, E.: Late Holocene hydroclimatic variability linked to Pacific fo rcing: evidence from Abbott Lake, coastal central California, J. Paleolimnol., 56, 299–313, 2016. a
Hu, C., Henderson, G. M., Huang, J., Xie, S., Sun, Y., and Johnson, K. R.: Quantification of Holocene Asian monsoon rainfall from spatially separated cave records, Earth Planet. Sc. Lett., 266, 221–232, 2008. a, b, c
Hughes, M. K. and Funkhouser, G.: Extremes of moisture availability reconstructed from tree rings for recent millennia in the Great Basin of western North America, in: The Impacts of Climate Variability on Forests, Springer, New York, 99–107, https://doi.org/10.1007/BFb0009768, 1998. a, b
Johnson, T. and McCave, I.: Transport mechanism and paleoclimatic significance of terrigenous silt deposited in varved sediments of an African rift lake, Limnol. Oceanogr., 53, 1622–1632, 2008. a, b
Johnson, T. C., Barry, S. L., Chan, Y., and Wilkinson, P.: Decadal record of climate variability spanning the past 700 yr in the Southern Tropics of East Africa, Geology, 29, 83–86, 2001. a, b
Jones, J. M., Fogt, R. L., Widmann, M., Marshall, G. J., Jones, P. D., and Visbeck, M.: Historical SAM variability. Part I: Century-Length seasonal reconstructions, Am. Meteorol. Soc., https://doi.org/10.1175/2009JCLI2785.1, 2009. a, b, c
Jones, M. D., Roberts, N., Leng, M. J., and Türke, M.: A high-resolution late Holocene lake isotope record from Turkey and links to North Atlantic and monsoon climate, Geology, 34, 361–364, 2006. a, b
Jungclaus, J. H., Bard, E., Baroni, M., Braconnot, P., Cao, J., Chini, L. P., Egorova, T., Evans, M., González-Rouco, J. F., Goosse, H., Hurtt, G. C., Joos, F., Kaplan, J. O., Khodri, M., Klein Goldewijk, K., Krivova, N., LeGrande, A. N., Lorenz, S. J., Luterbacher, J., Man, W., Maycock, A. C., Meinshausen, M., Moberg, A., Muscheler, R., Nehrbass-Ahles, C., Otto-Bliesner, B. I., Phipps, S. J., Pongratz, J., Rozanov, E., Schmidt, G. A., Schmidt, H., Schmutz, W., Schurer, A., Shapiro, A. I., Sigl, M., Smerdon, J. E., Solanki, S. K., Timmreck, C., Toohey, M., Usoskin, I. G., Wagner, S., Wu, C.-J., Yeo, K. L., Zanchettin, D., Zhang, Q., and Zorita, E.: The PMIP4 contribution to CMIP6 – Part 3: The last millennium, scientific objective, and experimental design for the PMIP4 past1000 simulations, Geosci. Model Dev., 10, 4005–4033, https://doi.org/10.5194/gmd-10-4005-2017, 2017. a, b, c
Kirby, M. E., Feakins, S. J., Hiner, C. A., Fantozzi, J., Zimmerman, S. R. H., Dingemans, T., and Mensing, S. A.: Tropical Pacific forcing of Late-Holocene hydrologic variability in the coastal southwest United States, Quaternary Sci. Rev., 102, 27–38, 2014. a
Kirby, M. E., Patterson, W. P., Lachniet, M., Noblet, J. A., Anderson, M. A., Nichols, K., and Avila, J.: Pacific Southwest United States Holocene Droughts and Pluvials Inferred From Sediment d18O(calcite) and Grain Size Data (Lake Elsinore, California), Front. Earth Sci., 7, https://doi.org/10.3389/feart.2019.00074, 2019. a
Kirby, M. E., Barbosa, J., Carlin, J., MacDonald, G., Leidelmeijer, J., Bonuso, N., Han, J., Nauman, B., Avila, J., and Woodward, A.: Holocene hydroclimatic variability recorded in sediments from Maddox Lake (northern California Coast Range), Quatern. Res., 115, 90–108, https://doi.org/10.1017/qua.2023.18, 2023. a
Kremenetski, K. V., Boettger, T., andT. Vaschalova, G. M. M., Sulerzhitsky, L., and Hiller, A.: Medieval climate warming and aridity as indicated by multiproxy evidence from the Kola Peninsula, Russia, Palaeogeogr. Palaeoclimatol. Palaeoecol., 209, 113–125, 2004. a
Kuzucuoglu, C., Dörfler, W., Kunesch, S., and Goupille, F.: Mid- to late-Holocene climate change in central Turkey: the Tecer Lake record, Holocene, 21, 173–188, 2011. a, b
Laird, K. R., Fritz, S. C., Grimm, E. C., and Mueller, P. G.: Century-scale paleoclimatic reconstruction from Moon Lake, a closed-basin lake in the northern Great Plains, Limnol. Oceanogr., 41, 890–902, 1996. a
Laird, K. R., Haig, H. A., Ma, S., Kingsbury, M. V., Brown, T. A., Lewis, C. F. M., Oglesby, R. J., and Cumming, B. F.: Expanded spatial extent of the Medieval Climate Anomaly revealed in lake-sediment records across the boreal region in northwest Ontario, Global Change Biol., 18, 2869–2881, 2012. a, b
Landrum, L., Otto-Bliesner, B., Wahl, E., Conley, A., Lawrence, P., Rosenbloom, N., and Teng, H.: Last Millennium Climate and its Variability in CCSM4, J. Climate, 1, 1085–1111, 2013. a
Langton, S. J., Linsley, B. K., Robinson, R. S., Rosenthal, Y., Oppo, D. W., Eglinton, T. I., Howe, S. S., Djajadihardja, Y. S., and Syamsudin, F.: 3,500 yr record of centennial-scale climate variability from the Western Pacific Warm Pool, Geology, 36, 795–798, 2008. a
Ledru, M.-P., Jomelli, V., Samaniego, P., Vuille, M., Hidalgo, S., Herrera, M., and Ceron, C.: The Medieval Climate Anomaly and the Little Ice Age in the eastern Ecuadorian Andes, Clim. Past, 9, 307–321, https://doi.org/10.5194/cp-9-307-2013, 2013. a, b
Li, J. and Wang, J.: A modified zonal index and its physical sense, Geophys. Res. Lett., 30, 1632, https://doi.org/10.1029/2003GL017441, 2003. a
Ljungqvist, F. C., Krusic, P. J., Sundqvist, H. S., Zorita, E., Brattström, G., and Frank, D.: Northern Hemisphere hydroclimate variability over the past twelve centuries, Nature, 532, 94–98, 2016. a
Llasat, D. C. M., Rigo, T., and Barriendos, M.: The 'Montserrat-2000' flash-flood event: A comparison with the floods that have occurred in the northeastern Iberian Peninsula since the 14th century, Int. J. Climatol., 23, 453–469, 2003. a
Luoto, T. P., Helama, S., and Nevalainen, L.: Stream flow intensity of the Saavanjoki River, eastern Finland, during the past 1500 years reflected by mayfly and caddisfly mandibles in adjacent lake sediments, J. Hydrol., 476, 147–153, 2013. a
Luterbacher, J., García-Herrera, R., Akcer-On, S., Allan, R., Alvarez-Castro, M. C., Benito, G., Booth, J., Büntgen, U., Cagatay, N., Colombaroli, D., Davis, B., Esper, J., Felis, T., Fleitmann, D., Frank, D., Gallego, D., Garcia-Bustamante, E., Glaser, R., Gonzalez-Rouco, F., Goosse, H., Kiefer, T., Macklin, M. G., Manning, S. W., Montagna, P., Newman, L., Power, M. J., Rath, V., Ribera, P., Riemann, D., Roberts, N., Sicre, M. A., Silenzi, S., Tinner, W., Tzedakis, P. C., Valero-Garcés, B., Schrier, G., Vannière, B., Vogt, S., Wanner, H., Werner, J. P., Willett, G., Williams, M. H., Xoplaki, E., Zerefos, C. S., and Zorita, E.: A review of 2000 years of paleoclimatic evidence in the Mediterranean, in: The Climate of the Mediterranean Region: From the Past to the Future, Elsevier, 87–185, https://doi.org/10.1016/B978-0-12-416042-2.00002-1, 2012. a, b
Magny, M., de Beaulieu, J. L., Drescher-Schneider, R., Vanniere, B., Walter-Simonnet, A. V., Miras, Y., Millet, L., Bossuet, G., Peyron, O., Brugiapaglia, E., and Leroux, A.: Holocene climate changes in the central Mediterranean as recorded by lake-level fluctuations at Lake Accesa (Tuscany, Italy), Quaternary Sci. Rev., 26, 1736–1758, 2007. a
Mann, M. E., Zhang, Z., Rutherford, S., Bradley, R. S., Hughes, M. K., Shindell, D., Ammann, C., Faluvegi, G., and Ni, F.: Global signatures and dynamical origins of the Little Ice Age and Medieval Climate Anomaly, Science, 326, 1256–1260, 2009. a
Martín-Puertas, C., Valero-Garcés, B. L., Mata, P., González-Sampériz, P., Bao, R., and Moreno, A.: Arid and humid phases in Southern Spain during the last 4000 years: the Zoñar Lake record, Córdoba, Holocene, 18, 907–921, 2008. a
Martín-Puertas, C., Jiménez-Espejo, F., Martínez-Ruiz, F., Nieto-Moreno, V., Rodrigo, M., Mata, M. P., and Valero-Garcés, B. L.: Late Holocene climate variability in the southwestern Mediterranean region: an integrated marine and terrestrial geochemical approach, Clim. Past, 6, 807–816, https://doi.org/10.5194/cp-6-807-2010, 2010. a, b
Masson-Delmotte, V., Schulz, M., Abe-Ouchi, A., Beer, J., Ganopolski, A., Rouco, J. F. G., Jansen, E., Lambeck, K., Luterbacher, J., Naish, T., Osborn, T., Otto-Bliesner, B., Quinn, T., Ramesh, R., Rojas, M., Shao, X., and Timmermann, A.: Information from Paleoclimate Archives, in: Climate Change 2013: The Physical Science Basis, Contribution of Working Group I to the Fifth Assessment Report of the Intergovernmental Panel on Climate Change, Cambridge University Press, https://doi.org/10.1017/CBO9781107415324, 2013. a
Mauritsen, T., Bader, J., Becker, T., Behrens, J., Bittner, M., Brokopf, R., Brovkin, V., Claussen, M., Crueger, T., Esch, M., Fast, I., Fiedler, S., Fläschner, D., Gayler, V., Giorgetta, M., Goll, D. S., Haak, H., Hagemann, S., Hedemann, C., Hohenegger, C., Ilyina, T., Jahns, T., de-la Cuesta, D. J., Jungclaus, J., Kleinen, T., Kloster, S., Kracher, D., Kinne, S., Kleberg, D., Lasslop, G., Kornblueh, L., Marotzke, J., Matei, D., Meraner, K., Mikolajewicz, U., Modali, K., Möbis, B., Müller, W. A., Nabel, J. E. M. S., Nam, C. C. W., Notz, D., Nyawira, S. S., Paulsen, H., Peters, K., Pincus, R., Pohlmann, H., Pongratz, J., Popp, M., Raddatz, T. J., Rast, S., Redler, R., Reick, C. H., Rohrschneider, T., Schemann, V., Schmidt, H., Schnur, R., Schulzweida, U., Six, K. D., Stein, L., Stemmler, I., Stevens, B., von Storch, J. S., Tian, F., Voigt, A., Vrese, P., Wieners, K. H., Wilkenskjeld, S., Winkler, A., and Roeckner, E.: Developments in the MPI-M Earth System Model version 1.2 (MPI-ESM1.2) and its response to increasing CO2, J. Adv. Model. Earth Syst., 11, 998–1038, 2019. a
Meko, D. M., Therrell, M. D., Baisan, C. H., and Hughes, M. K.: Sacramento River flow reconstructed to AD 869 from tree rings, J. Am. Water Resour. Assoc., 37, 1029–1039, 2001. a, b
Michels, A., Laird, K. R., Wilson, S. E., Thomson, D., Leavitt, P. R., Oglesby, R. J., and Cumming, B. F.: Multidecadal to millennial-scale shifts in drought conditions on the Canadian Prairies over the past six millennia: Implications for future drought assessment, Global Change Biol., 13, 1295–1307, 2007. a
Morellón, M., Valero-Garcés, B., Vegas-Vilarrúbia, T., González-Sampériz, P., Romero, O., Delgado-Huertas, A., Moreno, P. M. A., Rico, M., and Corella, J. P.: Late glacial and Holocene palaeohydrology in the western Mediterranean region: the Lake Estanya record (NE Spain), Quaternary Sci. Rev., 28, 2582–2599, 2009. a, b
Morellón, M., Valero-Garcés, B. L., González-Sampériz, P., Vegas-Vilarrúbia, T., Rubio, E., Rieradevall, M., Delgado-Huertas, A., Mata, P., Romero, O., Engstrom, D. R., López-Vicente, E., Navas, A., and Soto, J.: Climate changes and human activities recorded in the sediments of Lake Estanya (NE Spain) during the Medieval Warm Period and Little Ice Age, J. Paleolimnol., 46, 423–452, 2011. a
Moreno, A., Valero-Garcés, B., Gonzales-Sampériz, P., and Rico, M.: Flood response to rainfall variability during the last 2000 years inferred from the Taravilla Lake record (Central Iberian Range, Spain), J. Paleolimnol., 40, 943–961, 2008. a
Moy, C. M., Seltzer, G. O., Rodbell, D. T., and Anderson, D. M.: Variability of El Niño/Southern Oscillation activity at millennial timescales during the Holocene epoch, Nature, 420, 162–165, 2002. a
Neukom, R., Luterbacher, J., Villalba, R., Kuettel, M., Frank, D., Jones, P. D., Grosjean, M., Esper, J., Lopez, L., and Wanner, H.: Multi-centennial summer and winter precipitation variability in southern South America, Geophys. Res. Lett., 37, L14708, https://doi.org/10.1029/2010GL043680, 2010. a
Neukom, R., Gergis, J., Karoly, D. J., Wanner, H., Curran, M., Elbert, J., González-Rouco, F., Linsley, B. K., Moy, A. D., Mundo, I., Raible, C. C., Steig, E. J., van Ommen, T., Vance, T., Villalba, R., Zinke, J., and Frank, D.: Inter-hemispheric temperature variability over the past millennium, Nat. Clim. Change, 4, 362–367, 2014. a, b
Neukom, R., Steiger, N., Gómez-Navarro, J. J., Wang, J., and Werner, J. P.: No evidence for globally coherent warm and cold periods over the preindustrial Common Era, Nature, 571, 550–554, 2019. a, b
Neumann, F. H., Kagan, E. J., Schwab, M. J., and Stein, M.: Palynology, sedimentology and palaeoecology of the late Holocene Dead Sea, Quaternary Sci. Rev., 26, 1476–1498, 2007. a
Newton, A., Thunell, R., and Stott, L.: Climate and hydrographic variability in the Indo-Pacific Warm Pool during the last millennium, Geophys. Res. Lett., 33, L19710, https://doi.org/10.1029/2006GL027234, 2006. a, b, c, d
Novello, V. F., Cruz, F. W., Karmann, I., Burns, S. J., Strikis, N. M., Vuille, M., Cheng, H., Edwards, R. L., Barreto, E. A. S., and Frigo, E.: Multidecadal climate variability in Brazil's Nordeste during the last 3000 years based on speleothem isotope records, Geophys. Res. Lett., 39, L23706, https://doi.org/10.1029/2012GL053936, 2012. a, b
Ortega, P., Lehner, F., Swingedouw, D., Masson-Delmotte, V., Raible, C. C., Casado, M., and Yiou, P.: A model-tested North Atlantic Oscillation reconstruction for the past millennium, Nature, 523, 71–74, 2015. a, b, c
Oswald, W. W. and Foster, D. R.: A record of late-Holocene environmental change from southern New England, USA, Quatern. Res., 76, 314–318, 2011. a
Otto-Bliesner, B. L., Brady, E. C., Fasullo, J., Jahn, A., Landrum, L., Stevenson, S., Rosenbloom, N., Mai, A., and Strand, G.: Climate variability and change since 850 C.E.: An ensemble approach with the Community Earth System Model (CESM), B. Am. Meteorol. Soc., 97, 735–754, https://doi.org/10.1175/BAMS-D-14-00233.1, 2015. a, b
Palmer, W.: Meteorologic drought, US Weather Bureau, Res. Pap. No. 45, 58 pp. https://www.droughtmanagement.info/literature/USWB_Meteorological_Drought_1965.pdf (last access: 16 November 2023), 1965. a
Pederson, D. C., Peteet, D. M., Kurdyla, D., and Guilderson, T.: Medieval Warming, Little Ice Age, and European impact on the environment during the last millennium in the lower Hudson Valley, New York, USA, Quatern. Res., 63, 238–249, 2005. a
Phadtare, N. and Pant, R.: A century-scale pollen record of vegetation and climate history during the past 3500 years in the Pinder Valley, Kumaon Higher Himalaya, J. Geol. Soc. India, 68, 495–506, 2006. a, b, c
Phipps, S. J., Rotstayn, L. D., Gordon, H. B., Roberts, J. L., Hirst, A. C., and Budd, W. F.: The CSIRO Mk3L climate system model version 1.0 – Part 2: Response to external forcings, Geosci. Model Dev., 5, 649–682, https://doi.org/10.5194/gmd-5-649-2012, 2012. a
Proctor, C. J., Baker, A., Barnes, W. L., and Gilmour, M.: A thousand year speleotherm proxy record of North Atlantic climate from Scotland, Clim. Dynam., 16, 815–820, 2000. a, b
Rein, B., Lückge, A., and Sirocko, F.: A major Holocene ENSO anomaly during the Medieval period, Geophys. Res. Lett., 31, L17211, https://doi.org/10.1029/2004GL020161, 2004. a
Reuter, J., Stott, L., Khider, D., Sinha, A., Cheng, H., and Edwards, R. L.: A new perspective on the hydroclimate variability in northern South America during the Little Ice Age, Geophys. Res. Lett., 36, L21706, https://doi.org/10.1029/2009GL041051, 2009. a, b
Roldán-Gómez, P. J., González-Rouco, J. F., Melo-Aguilar, C., and Smerdon, J. E.: Dynamical and hydrological changes in climate simulations of the last millennium, Clim. Past, 16, 1285–1307, https://doi.org/10.5194/cp-16-1285-2020, 2020. a, b, c, d, e, f, g, h, i, j, k
Roldán-Gómez, P. J., González-Rouco, J. F., Melo-Aguilar, C., and Smerdon, J. E.: The Role of Internal Variability in ITCZ Changes Over the Last Millennium, Geophys. Res. Lett., 49, e2021GL096487, https://doi.org/10.1029/2021GL096487, 2022. a, b, c, d, e, f, g, h, i
Routson, C. C., Woodhouse, C. A., and Overpeck, J. T.: Second century megadrought in the Rio Grande headwaters, Colorado: How unusual was medieval drought?, Geophys. Res. Lett., 38, L22703, https://doi.org/10.1029/2011GL050015, 2011. a
Sachs, J. P., Sachse, D., Smittenberg, R. H., Zhang, Z. H., Battisti, D. S., and Golubic, S.: Southward movement of the Pacific intertropical convergence zone AD 1400–1850, Nat. Geosci., 2, 519–525, 2009. a, b, c, d, e
Schmidt, G., Ruedy, R., Hansen, J., Aleinov, I., Bell, N., Bauer, M., Bauer, S., Cairns, B., Canuto, V., Cheng, Y., Genio, A. D., Faluvegi, G., Friend, A., Hall, T., Hu, Y., Kelley, M., Kiang, N., Koch, D., Lacis, A., Lerner, J., Lo, K., Miller, R., Nazarenko, L., Oinas, V., Perlwitz, J., Perlwitz, J., Rind, D., Romanou, A., Russell, G., Sato, M., Shindell, D., Stone, P., Sun, S., Tausnev, N., Thresher, D., and Yao, M.: Present day atmospheric simulations using GISS ModelE: Comparison to in-situ, satellite and reanalysis data, J. Climate, 19, 153–192, 2006. a
Schmidt, G., Kelley, M., Nazarenko, L., Ruedy, R., Russell, G., Aleinov, I., Bauer, M., Bauer, S., Bhat, M., Bleck, R., Canuto, V., Chen, Y., Cheng, Y., Clune, T., Genio, A. D., de Fainchtein, R., Faluvegi, G., Hansen, J., Healy, R., Kiang, N., Koch, D., Lacis, A., LeGrande, A., Lerner, J., Lo, K., Matthews, E., Menon, S., Miller, R., Oinas, V., Oloso, A., Perlwitz, J., Puma, M., Putman, W., Rind, D., Romanou, A., Sato, M., Shindell, D., Sun, S., Syed, R., Tausnev, N., Tsigaridis, K., Unger, N., Voulgarakis, A., Yao, M., and Zhang, J.: Configuration and assessment of the GISS ModelE2 contributions to the CMIP5 archive, J. Adv. Model. Earth Syst., 6, 141–184, 2014. a
Schmidt, G. A., Jungclaus, J. H., Ammann, C. M., Bard, E., Braconnot, P., Crowley, T. J., Delaygue, G., Joos, F., Krivova, N. A., Muscheler, R., Otto-Bliesner, B. L., Pongratz, J., Shindell, D. T., Solanki, S. K., Steinhilber, F., and Vieira, L. E. A.: Climate forcing reconstructions for use in PMIP simulations of the last millennium (v1.0), Geosci. Model Dev., 4, 33–45, https://doi.org/10.5194/gmd-4-33-2011, 2011. a, b
Schmidt, G. A., Jungclaus, J. H., Ammann, C. M., Bard, E., Braconnot, P., Crowley, T. J., Delaygue, G., Joos, F., Krivova, N. A., Muscheler, R., Otto-Bliesner, B. L., Pongratz, J., Shindell, D. T., Solanki, S. K., Steinhilber, F., and Vieira, L. E. A.: Climate forcing reconstructions for use in PMIP simulations of the Last Millennium (v1.1), Geosci. Model Dev., 5, 185–191, https://doi.org/10.5194/gmd-5-185-2012, 2012. a, b
Schurer, A. P., Hegerl, G. C., Mann, M. E., Tett, S. F. B., and Phipps, S. J.: Separating forced from chaotic climate variability over the past millennium, J. Climate, 26, 6954–6973, 2013. a
Schurer, A. P., Tett, S. F. B., and Hegerl, G. C.: Small influence of solar variability on climate over the past millennium, Nat. Geosci., 7, 104–108, 2014. a
Sheffer, N. A., Rico, M., Enzel, Y., Benito, G., and Grodek, T.: The palaeoflood record of the Gardon river, France: A comparison with the extreme 2002 flood event, Geomorphology, 98, 71–83, https://doi.org/10.1016/j.geomorph.2007.02.034, 2007. a
Sinha, A., Cannariato, K. G., Stott, L. D., Cheng, H., Edwards, R. L., Yadava, M. G., Ramesh, R., and Singh, L. B.: A 900-year (600 to 1500 A.D.) record of the Indian summer monsoon precipitation from the core monsoon zone of India, Geophys. Res. Lett., 34, L16707, https://doi.org/10.1029/2007GL030431, 2007. a, b
Smerdon, J. E., Cook, B. I., Cook, E. R., and Seager, R.: Bridging Past and Future Climate across Paleoclimatic Reconstructions, Observations, and Models: A Hydroclimate Case Study, J. Climate, 28, 3212–3231, 2015. a
Stager, J. C., Ryves, D., Cumming, B. F., Meeker, L. D., and Beer, J.: Solar variability and the levels of Lake Victoria, East Africa, during the last millenium, J. Paleolimnol., 33, 243–251, 2005. a
Steiger, N. J., Horlick, K., Tardif, R., Erb, M., Emile-Geay, J., Steig, E., and Hakim, G.: A global collection of paleoclimate proxy time series over the Common Era, Zenodo [data set], https://doi.org/10.5281/zenodo.1189006, 2018a. a, b
Steiger, N. J., Smerdon, J. E., Cook, E. R., and Cook, B. I.: A reconstruction of global hydroclimate and dynamical variables over the Common Era, Sci. Data, 5, 180086, https://doi.org/10.1038/sdata.2018.86, 2018b. a, b
Steinman, B. A., Abbott, M. B., Mann, M. E., Stansell, N. D., and Finney, B. P.: 1,500 year quantitative reconstruction of winter precipitation in the Pacific Northwest, P. Natl. Acad. Sci. USA, 109, 11619–11623, 2013. a, b, c, d
Stevens, L. R. and Dean, W. E.: Geochemical evidence for hydroclimatic variability over the last 2,460 years from Crevice Lake in Yellowstone National Park, USA, Quatern. Int., 188, 139–148, 2008. a, b
St.George, S. and Nielsen, E.: Hydroclimatic change in southern Manitoba since A.D. 1409 inferred from tree rings, Quatern. Res., 58, 103–111, 2002. a
Stine, S.: Extreme and persistent drought in California and Patagonia during mediaeval time, Nature, 369, 546–549, 1994. a
Stocker, T. F., Qin, D., Plattner, G. K., Alexander, L. V., Allen, S. K., Bindoff, N. L., Bréon, F. M., Church, J. A., Cubasch, U., Emori, S., Forster, P., Friedlingstein, P., Gillett, N., Gregory, J. M., Hartmann, D. L., Jansen, E., Kirtman, B., Knutti, R., Kumar, K. K., Lemke, P., Marotzke, J., Masson-Delmotte, V., Meehl, G. A., Mokhov, I. I., Piao, S., Ramaswamy, V., Randall, D., Rhein, M., Rojas, M., Sabine, C., Shindell, D., Talley, L. D., Vaughan, D. G., and Xie, S. P.: Technical Summary, in: Climate Change 2013: The Physical Science Basis, Contribution of Working Group I to the Fifth Assessment Report of the Intergovernmental Panel on Climate Change, Cambridge University Press, https://doi.org/10.1017/CBO9781107415324, 2013. a
Tardif, R., Hakim, G. J., Perkins, W. A., Horlick, K. A., Erb, M. P., Emile-Geay, J., Anderson, D. M., Steig, E. J., and Noone, D.: Last Millennium Reanalysis with an expanded proxy database and seasonal proxy modeling, Clim. Past, 15, 1251–1273, https://doi.org/10.5194/cp-15-1251-2019, 2019. a, b
Taylor, B. L.: A speleothems-based high resolution reconstruction of climate in southeastern Brazil over the past 4,100 years, MS thesis, University of Massachusetts, https://scholarworks.umass.edu/theses/390/ (last access: 16 November 2023), 2010. a, b
Taylor, C. M., Parker, D. J., and Harris, P. P.: An observational case study of mesoscale atmospheric circulations induced by soil moisture, Geophys. Res. Lett., 34, L15801, https://doi.org/10.1029/2007GL030572, 2007. a
Thompson, D. W. J. and Wallace, J. M.: Regional Climate Impacts of the Northern Hemisphere Annular Mode, Science, 293, 85–89, 2001. a
Thompson, L. G., Mosley-Thompson, E., Dansgaard, W., and Grootes, P. M.: The Little Ice Age as recorded in the stratigraphy of the tropical Quelccaya Ice Cap, Science, 234, 361–364, 1986. a, b
Thornthwaite, C. W.: An approach toward a rational classification of climate, Geogr. Rev., 38, 55–94, 1948. a
Tierney, J., Mayes, M., Meyer, N., Johnson, C., Swarzenski, P., Cohen, A., and Russell, J.: Late-twentieth-century warming in Lake Tanganyika unprecedented since AD 500, Nat. Geosci., 3, 422–425, 2010a. a, b
Tierney, J. E., Oppo, D. W., Rosenthal, Y., Russell, J. M., and Linsley, B. K.: Coordinated hydrological regimes in the Indo-Pacific region during the past two millennia, Paleoceanography, 25, PA1102, https://doi.org/10.1029/2009PA001871, 2010b. a, b
Touchan, R., Akkemik, U., Hughes, M. K., and Erkan, N.: May–June precipitation reconstruction of southwestern Anatolia, Turkey during the last 900 years from tree rings, Quatern. Res., 68, 196–202, 2007. a
Treydte, K., Schleser, G. H., Helle, G., Frank, D. C., Winiger, M., Haug, G. H., and Esper, J.: The twentieth century was the wettest period in northern Pakistan over the past millennium, Nature, 440, 1179–1182, 2006. a, b
Tyson, P. D. and Lindesay, J. A.: The climate of the last 2000 years in southern Africa, Holocene, 2, 271–278, 1992. a
Verschuren, D.: Reconstructing fluctuations of a shallow East African lake during the past 1800 yrs from sediment stratigraphy in a submerged crater basin, J. Paleolimnol., 25, 297–311, 2001. a, b
Verschuren, D., Laird, K., and Cumming, B.: Rainfall and drought in equatorial East Africa during the past 1000 years, Nature, 403, 410–414, 2000. a, b
Verschuren, D., Damste, J. S. S., Moernaut, J., Kristen, I., Blaauw, M., Fagot, M., and Haug, G. H.: Half-precessional dynamics of monsoon rainfall near the East African Equator, Nature, 462, 637–641, 2009. a, b
von Rad, U., Schaaf, M., Michels, K. H., Schulz, H., Berger, W. H., and Sirocko, F.: A 5000-yr record of climate change in varved sediments from the oxygen minimum zone of Pakistan, northeastern Arabian Sea, Quatern. Res., 51, 39–53, 1999. a, b
Vuille, M., Burns, S. J., Taylor, B. L., Cruz, F. W., Bird, B. W., Abbott, M. B., Kanner, L. C., Cheng, H., and Novello, V. F.: A review of the South American monsoon history as recorded in stable isotopic proxies over the past two millennia, Clim. Past, 8, 1309–1321, https://doi.org/10.5194/cp-8-1309-2012, 2012. a, b, c, d, e, f
Wang, Y., Cheng, H., Edwards, R. L., He, Y., Kong, X., An, Z., Wu, J., Kelly, M. J., Dykoski, C. A., and Li, X.: The Holocene Asian monsoon: links to solar changes and North Atlantic climate, Science, 308, 854, 2005. a, b
Watanabe, S., Hajima, T., Sudo, K., Nagashima, T., Takemura, T., Okajima, H., Nozawa, T., Kawase, H., Abe, M., Yokohata, T., Ise, T., Sato, H., Kato, E., Takata, K., Emori, S., and Kawamiya, M.: MIROC-ESM 2010: model description and basic results of CMIP5-20c3m experiments, Geosci. Model Dev., 4, 845–872, https://doi.org/10.5194/gmd-4-845-2011, 2011. a
Wells, N., Goddard, S., and Hayes, M. J.: A self-calibrating Palmer Drought Severity Index, J. Climate, 17, 2335–2351, 2004. a
Wilhelm, B., Arnaud, F., Sabatier, P., Crouzet, C., Brisset, E., Chaumillon, E., Disnar, J., Guiter, F., Malet, E., Reyss, J., Tachikawa, K., Bard, E., and Delannoy, J.: 1400 years of extreme precipitation patterns over the Mediterranean French Alps and possible forcing mechanisms, Quatern. Res., 78, 1–12, 2012. a
Wilson, R. J. S., Miles, D., Loader, N., Melvin, T. M., Cunningham, L., Cooper, R. J., and Briffa, K. R.: A millennial long March-July precipitation reconstruction for southern-central England, Clim. Dynam., 40, 997–1017, 2012. a, b
Wolff, C., Haug, G. H., Timmermann, A., Damste, J. S. S., Brauer, A., Sigman, D. M., Cane, M. A., and Verschuren, D.: Reduced interannual rainfall variability in east Africa during the Last Ice Age, Science, 333, 743–747, 2011. a, b
Woodbridge, J. and Roberts, N.: Late Holocene climate of the Eastern Mediterranean inferred from diatom analysis of annually-laminated lake sediments, Quaternary Sci. Rev., 30, 3381–3392, 2011. a, b
Yan, H., Sun, L., Oppo, D. W., Wang, Y., Liu, Z., Xie, Z., Liu, X., and Cheng, W.: South China Sea hydrological changes and Pacific Walker Circulation variations over the last millennium, Nat. Commun., 2, 293, https://doi.org/10.1038/ncomms1297, 2011. a
Yan, H., Wei, W., Soon, W., An, Z., Zhou, W., Liu, Z., Wang, Y., and Carter, R. M.: Dynamics of the intertropical convergence zone over the western Pacific during the Little Ice Age, Nat. Geosci., 8, 315–320, https://doi.org/10.1038/NGEO2375, 2015. a, b, c, d
Yukimoto, S., Yoshimura, H., Hosaka, M., Sakami, T., Tsujino, H., Hirabara, M., Tanaka, T. Y., Deushi, M., Obata, A., Nakano, H., Adachi, Y., Shindo, E., Yabu, S., Ose, T., and Kitoh, A.: Meteorological Research Institute – Earth System Model Version 1 (MRI-ESM1) – Model Description, Tech. Rep. of the Met. Res. Inst., 64 pp., https://www.mri-jma.go.jp/Publish/Technical/DATA/VOL_64/tec_rep_mri_64.pdf (last access: 16 November 2023), 2011. a
Yukimoto, S., Kawai, H., Koshiro, T., Oshima, N., Yoshida, K., Urakawa, S., Tsujino, H., Deushi, M., Tanaka, T., Hosaka, M., Yabu, S., Yoshimura, H., Shindo, E., Mizuta, R., Obata, A., Adachi, Y., and Ishii, M.: The Meteorological Research Institute Earth System Model Version 2.0, MRI-ESM2.0: Description and Basic Evaluation of the Physical Component, J. Meteorol. Soc. Jpn. Ser. II, 97, 931–965, 2019. a
Zhang, P. Z., Cheng, H., Edwards, R. L., Chen, F., Wang, Y., Yang, X., Liu, J., Tan, M., Wang, X., Liu, J., An, C., Dai, Z., Zhou, J., Zhang, D., Jia, J., Jin, L., and Johnson, K. R.: A test of climate, sun, and culture relationships from an 1810-year Chinese cave record, Science, 322, 940–942, 2008. a, b
- Abstract
- Introduction
- Evidence from the literature
- Data and methods
- Results
- Conclusions
- Appendix A: Impact of the definition of the MCA and LIA
- Appendix B: Seasonal changes in the PDSI
- Appendix C: Link to temperature and atmospheric dynamics
- Data availability
- Author contributions
- Competing interests
- Disclaimer
- Financial support
- Review statement
- References