the Creative Commons Attribution 4.0 License.
the Creative Commons Attribution 4.0 License.
 | 30 Oct 2023
Drought reconstruction since 1796 CE based on tree-ring widths in the upper Heilongjiang (Amur) River basin in Northeast Asia and its linkage to Pacific Ocean climate variability
Yang Xu
Heli Zhang
Shijie Wang
Mao Hu
Martín Hadad
Fidel Roig
The economic and environmental impacts of persistent droughts in East Asia are of growing concern, and therefore it is important to study the cyclicity and causes of these regional droughts. The self-calibrating Palmer drought severity index (scPDSI) has been extensively employed to describe the severity of regional drought, and several scPDSI reconstructions based on tree rings have been produced. We compiled a tree-ring chronology for Hailar pine (Pinus sylvestris var. mongolica) from two sites in the Hailar region in the upper Heilongjiang (Amur) River basin. Analysis of the climate response revealed that scPDSI was the primary factor limiting tree ring growth from May to July. The mean May to July scPDSI in the Hailar region since 1796 was reconstructed from the tree-ring width chronology. The results of spatial correlation analysis revealed that the reconstructed scPDSI in this region responded significantly to climate change. Analysis of the synoptic climatology indicated that the drought in the upper Heilongjiang (Amur) River basin is closely related to El Niño–Southern Oscillation (ENSO) and the Silk Road teleconnection. The results of atmospheric water cycle analysis show that water vapor transport processes are the dominant factor in the development of drought in this region.
- Article
(9347 KB) - Full-text XML
-
Supplement
(332 KB) - BibTeX
- EndNote


Drought – accompanied by persistent high temperatures and below-average precipitation over intervals of months to years – is of growing concern. The frequency and duration of drought, a a natural disaster, have increased as global warming has intensified. The impact of drought on human well-being and economic productivity is also increasing, given that drought severely threatens food and water security (Lesk et al., 2016; Trenberth et al., 2014; Wang et al., 2016; Chen et al., 2022). Due to regional water shortages, droughts frequently wreak havoc on agriculture and the quality of life in northeast Asia. Hence, understanding the variability of drought in this region and its causal mechanisms is essential for both drought prediction and the formulation of disaster response strategies (Li et al., 2019; Yuan and Wood, 2013).
However, only short-duration instrumental records of drought variability are available for northeast Asia, most of them from the 1950s onwards. However, this deficiency can be addressed via proxy paleoclimate records, such as tree-ring widths (Fritts, 1991). With their high annual precision and extensive coverage, tree rings have been used as a reliable proxy for reconstructing historical climatic and hydrological changes (Cook et al., 2016; Chen et al., 2021; Pearson et al., 2020). Hailar is located in the upper Heilongjiang (Amur) River basin, at the woodland–steppe interface of Northeast Asia, part of the eastern edge of the Hulunbuir grasslands, a region highly susceptible to climatic and environmental changes and that has experienced drought over the past few decades (Zhang et al., 1997; Wang et al., 2010; Bao et al., 2015; Chen et al., 2012). Drought reconstructions based on tree-ring widths can potentially make a valuable contribution to regional planning and ecological conservation in this region. Over the past two decades, several studies based on tree-ring widths have been conducted in Northeast Asia (Cook et al., 2010; Bao et al., 2015; Chen et al., 2012, 2022; Liu et al., 2016; Zhao et al., 2023). However, there is a need to focus research efforts on the agro-pastoral zone located in the western region of Northeast Asia. This area is characterized by a delicate ecological balance and high climate susceptibility, making it imperative to enhance our comprehension of drought patterns and underlying mechanisms.
Severe drought events are a serious problem in northern China. This has especially been the case since the late 1970s, when the weakening of the East Asian Summer Monsoon (EASM) contributed to the “southern flooding and northern drought” climatic pattern, with frequent intense drought events in the north (Wang, 2002; Yu et al., 2004; Ding et al., 2009). Regarding the climatic mechanisms responsible for the northeast Asia drought, it has been suggested that variations in the Pacific Decadal Oscillation (PDO) and in Arctic Ocean sea-ice cover have contributed to an interdecadal decrease in precipitation in Northeast Asia, leading to drought (Han et al., 2015). It has also been suggested that the global distributions of sea surface temperature and El Niño–Southern Oscillation (ENSO) events are closely linked to summer precipitation in Northeast Asia, thus explaining the summer drought mechanism in Northeast Asia from an interannual perspective (Han et al., 2017). Winter NAO has also been shown to impact the interannual variability of summer drought events in northeast Asia (Fu and Zeng, 2005). Anticyclonic circulation anomalies can often trigger extreme and prolonged drought events. Such anomalies always occur as a major product of specific remote teleconnection patterns called stationary wave patterns (Schubert et al., 2014). Several steady wave models have been shown to generate extreme drought events, with the 2014 summer drought in northern China attributed to the European Union pattern. It has also been confirmed that the Silk Road, Pacific-Japanese, and European Union models caused the July–August 2014 drought in north and northeastern China (Wang and He, 2015; Wang et al., 2017; Xu et al., 2017). While many of the above studies describe water vapor flux anomalies during periods of extreme drought, our understanding of the role of water vapor derived from local evaporation and advective transport is limited. Quantifying the contribution of advected water vapor transport and precipitation circulation processes to precipitation is essential for understanding the water vapor cycle and anticipating the intensity of severe drought episodes (Findell and Eltahir, 2003; Guan et al., 2022).
The objectives of the present study are: (1) to reconstruct the self-calibrating Palmer drought severity index (scPDSI) of the Hailar region and to analyze changes in the temporal variations of regional drought; (2) to determine the atmospheric circulation mechanisms generating extreme drought events; and (3) to analyze the contribution of advective water vapor transport and local evaporation to precipitation during droughts and to determine their leading causes.
2.1 Study area
The tree-ring sampling sites Neul Gacha (NEGC) (119∘36′ E, 47∘58′ N, 600–700 m a.s.l.) and Mingertu (MGET) (119∘24′ E, 47∘59′ N, 1100–1200 m a.s.l.) are located in the upper Heilongjiang (Amur) River basin (Fig. 1). This region lies within the arid and semiarid region of Northeast China (NEC), on the eastern edge of the Hulunbuir steppe and close to the western slopes of the Greater Khingan Range. This region has a continental and monsoonal climate (Bao et al., 2012). Due to the incursion of high-latitude cold and dry air masses in winter and of warm and moist air masses from low-latitude areas in summer, the climate tends to alternate between cold and dry in winter and warm and humid in summer. The average annual temperature is around −0.9 ∘C and the average yearly precipitation is ∼382.8 mm (Fig. 2a). December–January is the coldest period, with sparse rainfall, while June–August is the hottest period when precipitation is abundant (Fig. 2b). Thus, the climate is generally cold and dry. The grassland in this region is undergoing severe desertification and degradation in response to global and regional climate change (Zhang et al., 2011).
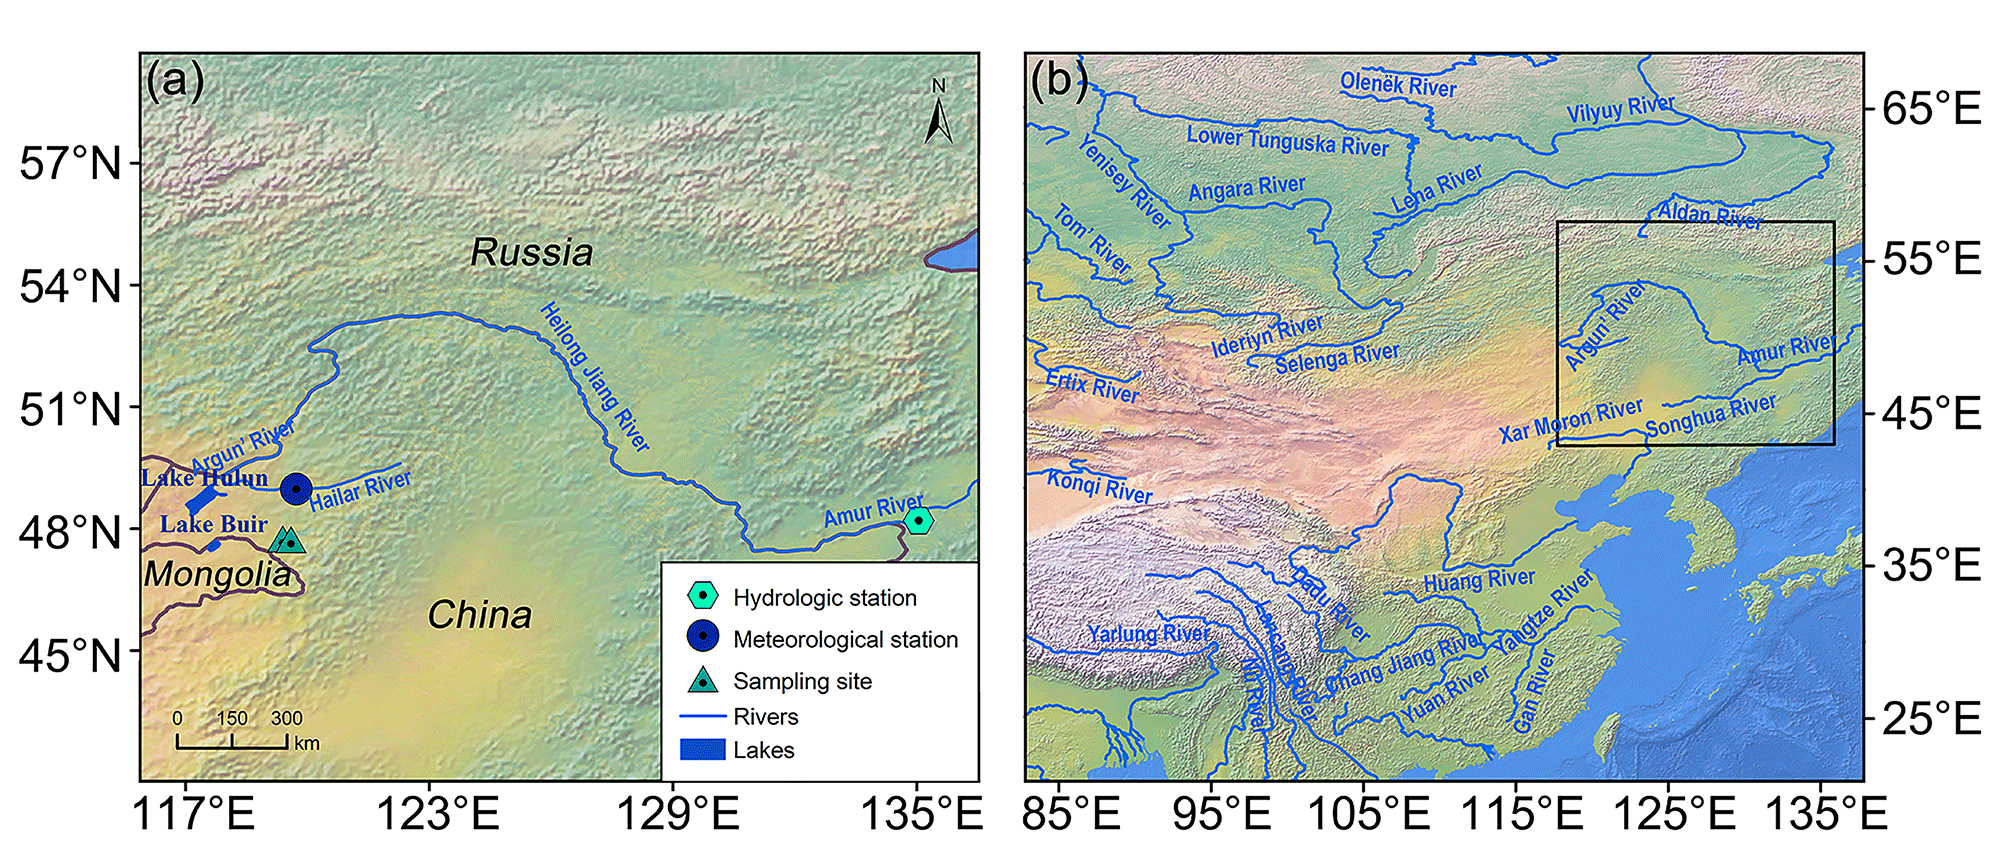
Figure 1(a) Locations of the tree-ring sampling sites and the meteorological and hydrological stations in the upper Amur (Heilongjiang) River basin. (b) Location of the study area in Asia. (This figure was generated using ArcGIS 10.2. The raster data for the production of the map was taken from https://www.naturalearthdata.com/ (last access: 18 February 2023).)
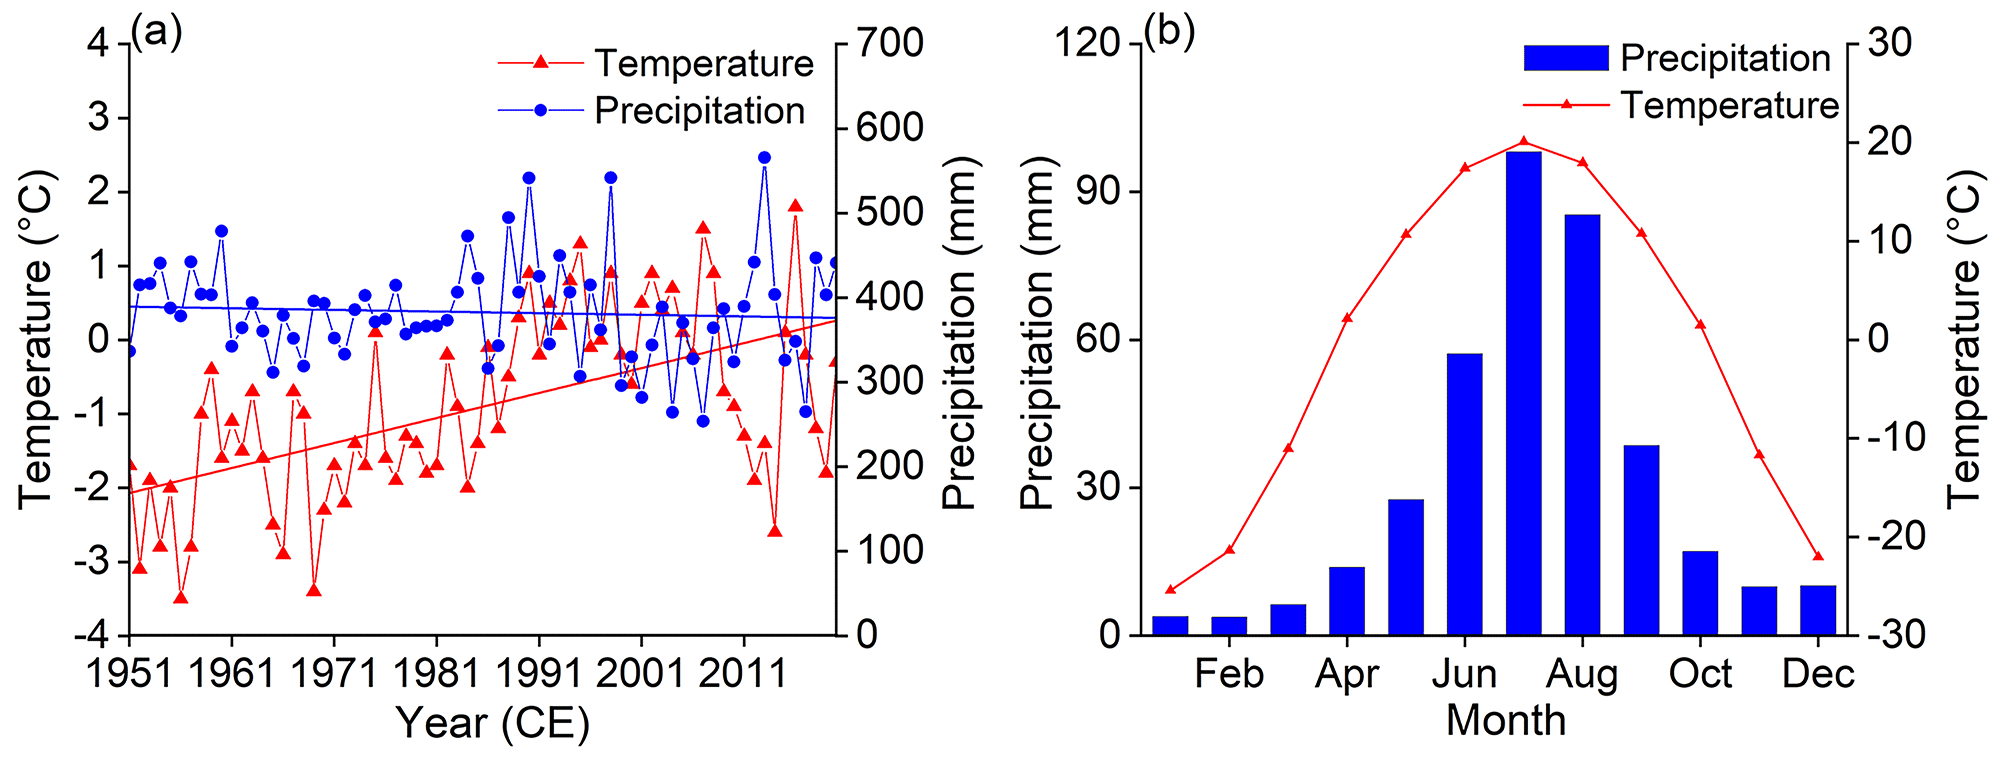
Figure 2(a) Annual precipitation and temperature trends for the upper Amur (Heilongjiang) River basin from 1951 to 2020. (b) Monthly total precipitation and mean temperature for the upper Amur (Heilongjiang) River basin.
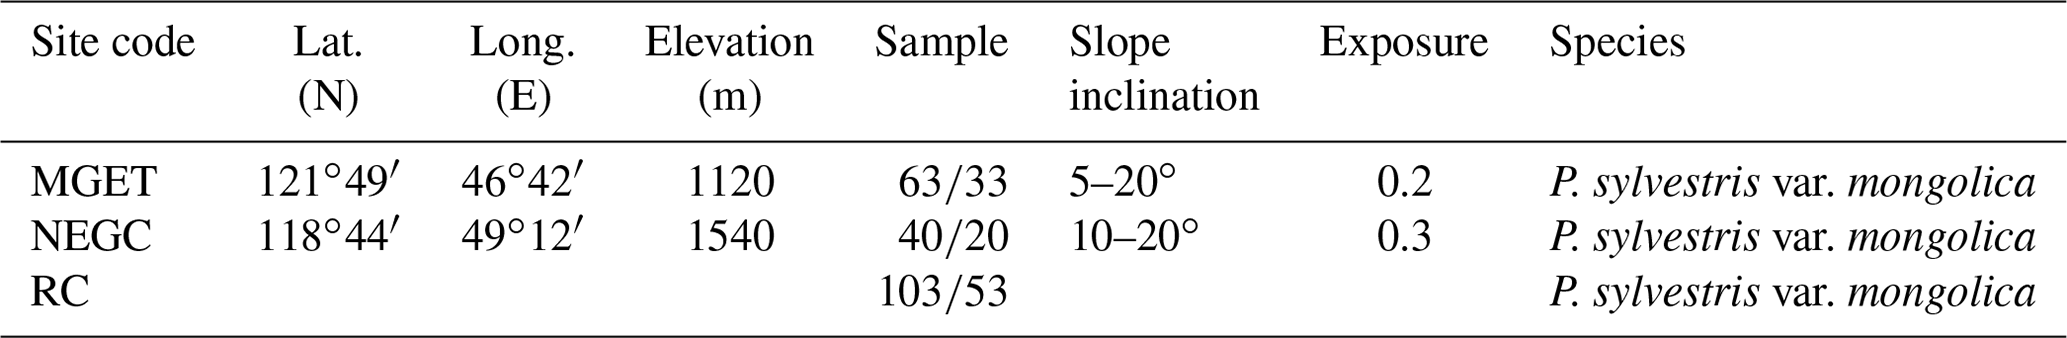
Table 1Information about the tree-ring sampling sites in the upper Amur (Heilongjiang) River basin.
2.2 Tree-ring data
The dominant tree species in the Hailar region is Hailar pine (Pinus sylvestris var. mongolica), which was sampled for tree-ring analysis. Both sites were located at the upper tree line, on steep slopes with thin soils. Information about the sampling sites is given in Table 1. Samples were taken from breast height using a 10 mm diameter incremental borer. Forty cores were collected from 20 trees at sampling site NEGC, and 63 cores were collected from 33 trees at sampling site MGET. In the laboratory, the core samples were dried, mounted, and successively sanded with 320 and 600 grit sandpaper until the tree-ring widths were visible and were then imaged using a high-precision scanner. Tree-ring width data were measured using CooRecorder 9.4 software, and the data quality was checked by cross-matching using the quality control program COFFCHA (Holmes, 1983). The ARSTAN procedure was then used to remove non-climatic influences on the tree-ring width data, due to age and growth, using exponential detrending. This procedure resulted in a standardized chronology of tree-ring widths (STD), a chronology of differences (RES) and an autoregressive chronology (ARS). The individual detrended chronologies from the two sites were combined to produce a new regional chronology (RC) using a robust averaging method (Cook, 1985). The STD chronology was selected to retain high- and low-frequency variations based on the consideration of subsequent analyses. The data series were truncated according to thresholds of at least expressed population signal (EPS) > 0.85 and 6 (three trees) for the expressed population signal and sample size, respectively, resulting in a reliable reconstruction for the period of 1796–2020.
2.3 Climate data and statistical methods
Monthly instrumental climate data from Hailar Meteorological Station (49∘15′ E, 119∘42′ N, 650 m a.s.l.), affiliated to the National Meteorological Administration of China, including monthly mean temperature and monthly total precipitation data, were obtained for the period of 1951–2020. Monthly mean runoff data from Khabarovsks Hydrological Station on the lower Heilongjiang River were used to analyze the response of the reconstructed scPDSI to runoff variations. The locations of the meteorological and hydrological stations are shown in Fig. 2a. scPDSI gridded climate data of CRU TS 4.06 from the Climate Research Unit (CRU) of the University of East Anglia were also used in this study (Harris et al., 2014a). SPSS 22.0 was used to assess the correlation coefficient of the climate signals contained in the three chronologies for the individual months from July of the previous year to September of the current year. Based on the results of this correlation coefficient analysis, several seasonal climate combinations from July of the last year to September of the current year were filtered, and the seasonal climate combinations with the highest correlation were selected for climate reconstruction, using one-dimensional linear regression. A split calibration-verification test was used to test the reliability of the reconstructed models, dividing the period of 1951–2020 into independent calibration and validation periods. The main parameters assessed were the correlation coefficient (R), explained variance (R2), efficiency coefficient (CE), error reduction value (RE), sign test (ST1) and first-order difference sign test (ST2) (Fritts et al., 1990). In this study, after 15-year low-pass filtering, intervals of more than 10 years below/above the mean of the reconstructed series were defined as dry/wet periods, and the years below or above 1.5 times the standard deviation of the series mean were defined as extreme dry/wet years. The quasi-periodic characteristics of the reconstructed scPDSI were analyzed using multitaper spectral analysis (MTM) (Mann and Lees, 1996). Spatial correlation maps were generated between the reconstructed scPDSI series and the grid data, including precipitation and scPDSI data from CRU TS 4.06 and runoff grid point data from global runoff (G-RUN) (Harris et al., 2014a; Ghiggi et al., 2021a).
2.4 Land–atmosphere water balance
The Brubaker binary model has been used to quantify the contribution of external water vapor transport and local evaporative water vapor to precipitation, based on the atmospheric water vapor balance (Brubaker et al., 1993). The water vapor equation for the vertical integration per unit area can be expressed as follows (Brubaker et al., 1993; Guo et al., 2018):
where Q is the vertically integrated water vapor concentration; Fu and Fv are the vertically integrated latitudinal and meridional water vapor fluxes, respectively; and E and P are the vertically integrated land evaporation and rainfall, respectively.
Compared to the magnitude of the water vapor flux, the vertically integrated water vapor content varies very little over time and is insignificant on longer timescales (Burde and Zangvil, 2001). Thus, the left side of Eq. (1) is 0. In addition, the water vapor balance equation for the external water vapor transport term is as follows (Guo et al., 2018; Zhao and Zhou, 2021; Li et al., 2020):
where and represent the vertically integrated latitudinal and longitudinal water vapor transport from external inputs, respectively. Assume that P, E and Pa are constant within the study area during the interval of concern (Burde and Zangvil, 2001). Assume that externally imported water vapor and locally evaporated water vapor are well mixed over the study area, and that the proportions of evaporated and advected water vapor contribute equally to the development of precipitation and moisture fluxes. Using the above assumptions and the Gaussian scattering assumptions, Eqs. (1) and (2) can be applied to a region of area A (in m) as follows:
Here, and represent the total water vapor irradiation dispersion in the targeted region and the irradiation dispersion of externally transported water vapor, respectively; Fout and Fout−a represent the total water vapor leaving the calculated area and the part of the external input water vapor flowing away from the calculated area again, respectively; and Fin represents the total water vapor transported to the targeted area from outside. This enables an estimate to be made of the contribution of external moisture transport and local land surface evaporation to precipitation as follows (Guo et al., 2018; Li et al., 2020):
where r and ρ are the contributions to precipitation from external water vapor transport and local land surface evaporation, respectively, and ρ is the precipitation recirculation rate.
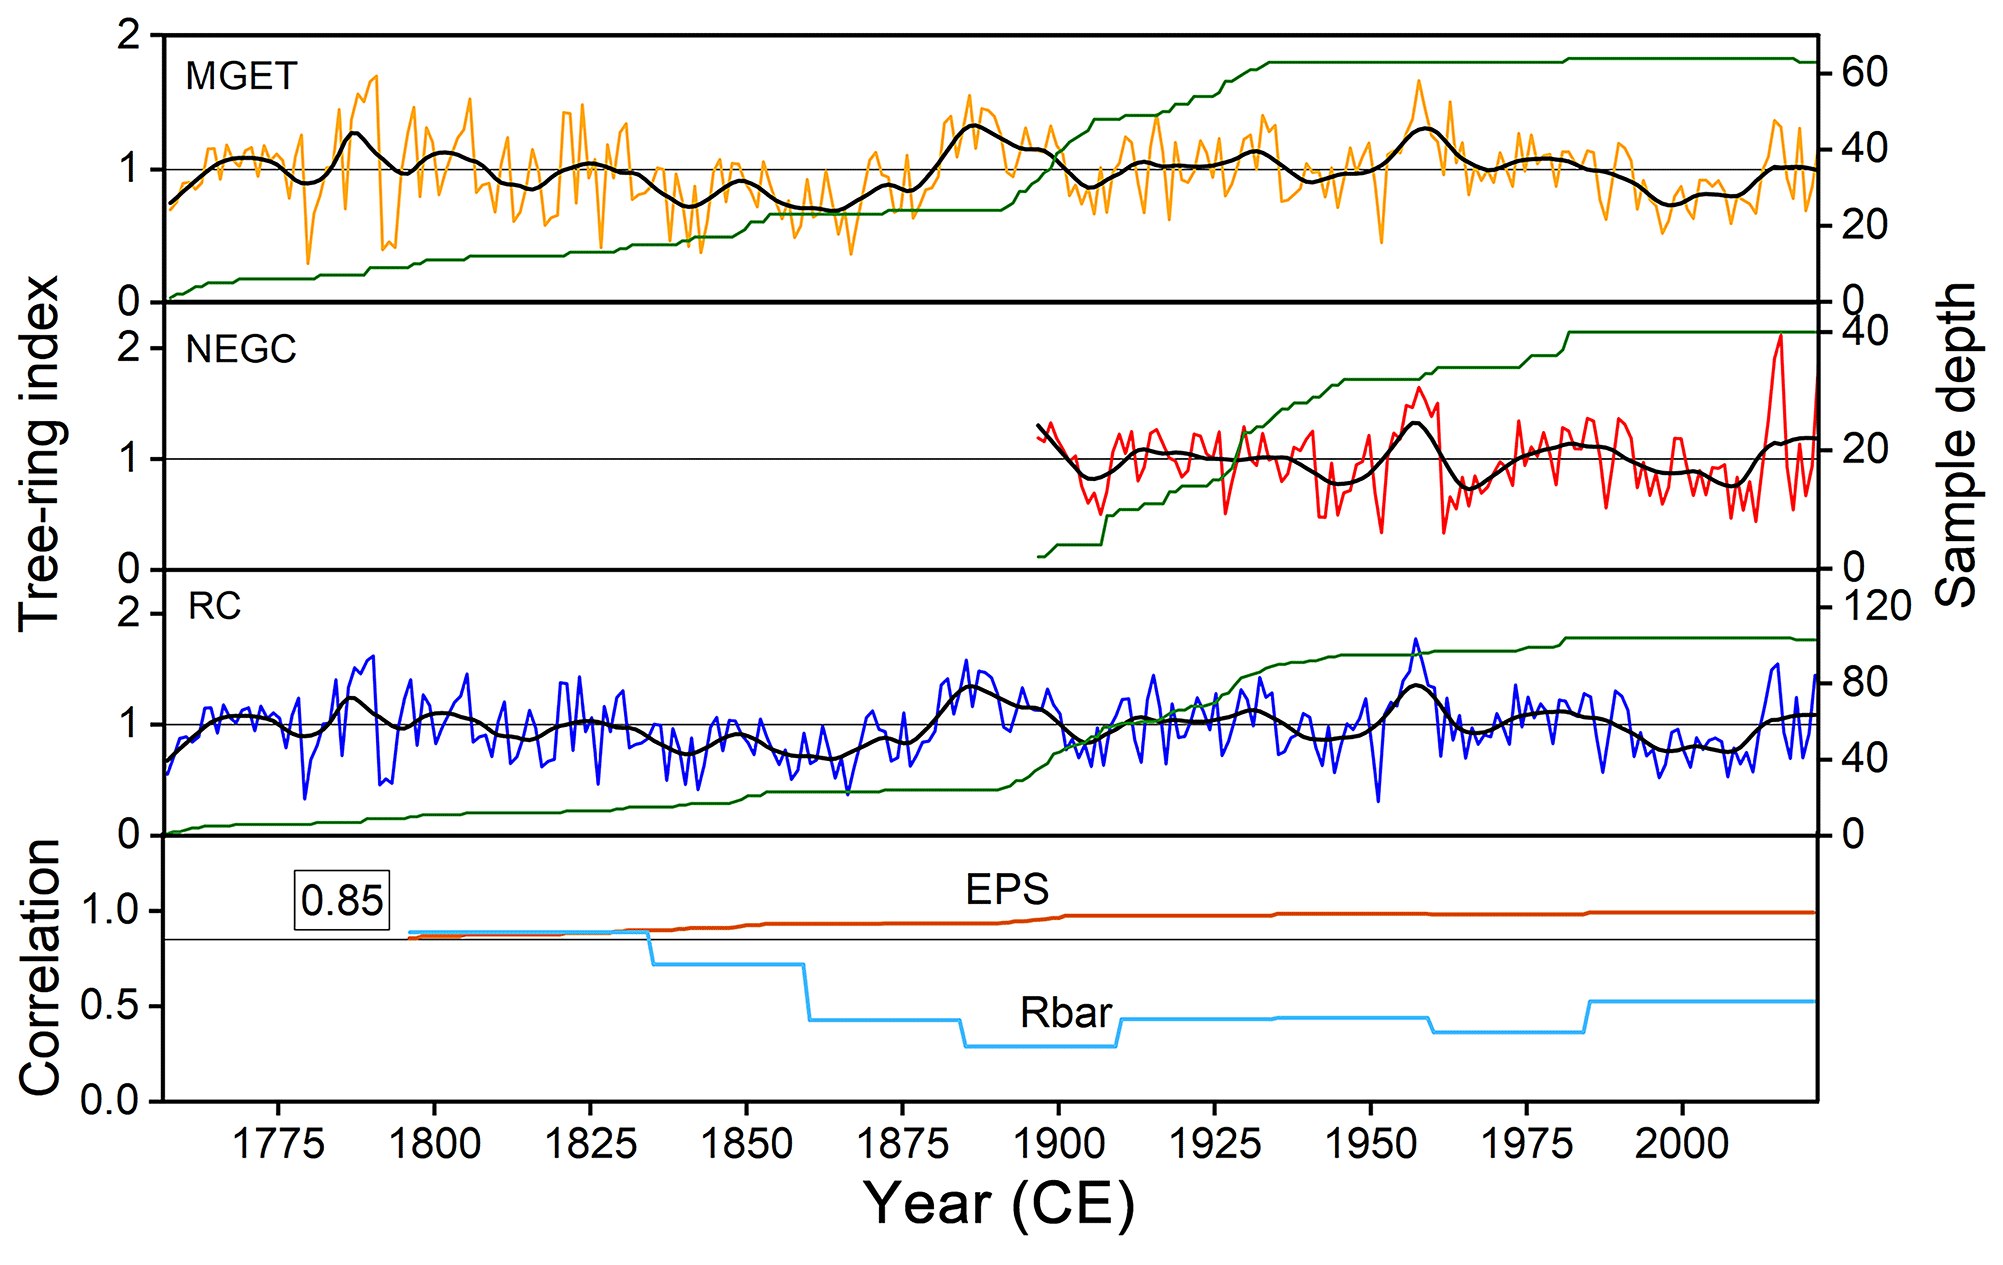
Figure 3Chronologies of the two tree-ring records (MGET and NEGC) and the RC from the upper Amur (Heilongjiang) River basin. The thick black curve illustrates the 15-year low-pass-filtered curve of the tree-ring width index. The inter-series correlation (Rbar) and the EPS are shown in the lowermost panel.
The Brubaker binary model water vapor transport process is based mainly on advection terms, which can be applied to calculate the precipitation recirculation rates in the study area. Give that the calculation of these precipitation recirculation rates depends on the size of the selected area, the study area was enlarged (42.5–52.5∘ N, 115–125∘ E) for the purpose of calculation.
3.1 scPDSI reconstruction
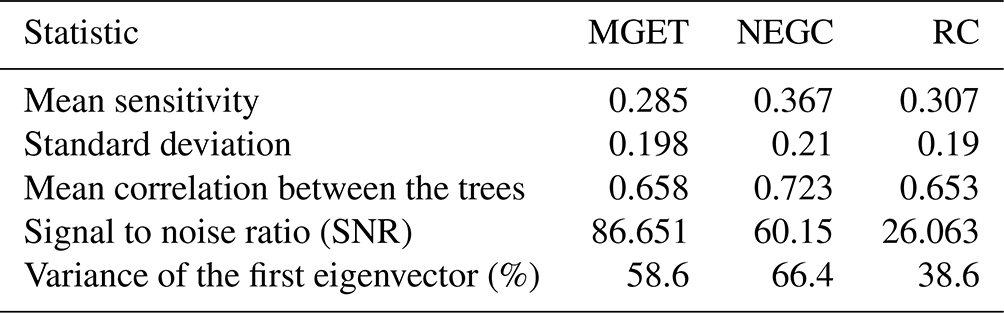
All the tree ring chronologies show a high mean sensitivity and standard deviation (typical of trees growing in arid and semiarid regions) due to the location of the Hailar region. The high inter-series correlation coefficient suggests that our tree-ring width chronology reliably captures several standard climate signals. The EPS of the RC chronology passed the test for signal strength (EPS > 0.85) after 1796 (Table 2 and Fig. 3). The tree-ring width series has a significant negative correlation with temperature, a significant positive correlation with precipitation and a significant positive correlation with scPDSI according to the climate response results (p<0.05) (Fig. 4a and b). Screening for seasonal combinations of temperature, precipitation and scPDSI revealed the strongest correlation coefficient between the RC tree ring width chronology and the mean scPDSI from May to July (r=0.645, p<0.01). Accordingly, we reconstructed the May to July scPDSI for the Hailar region since 1796 CE using the following equation (Fig. 4d):
(n=70, r=0.645, R2=41.6 %, %, F=48.385, p<0.01), where Y is the mean reconstructed scPDSI for May to July and X is the tree ring width index from the composite chronology.
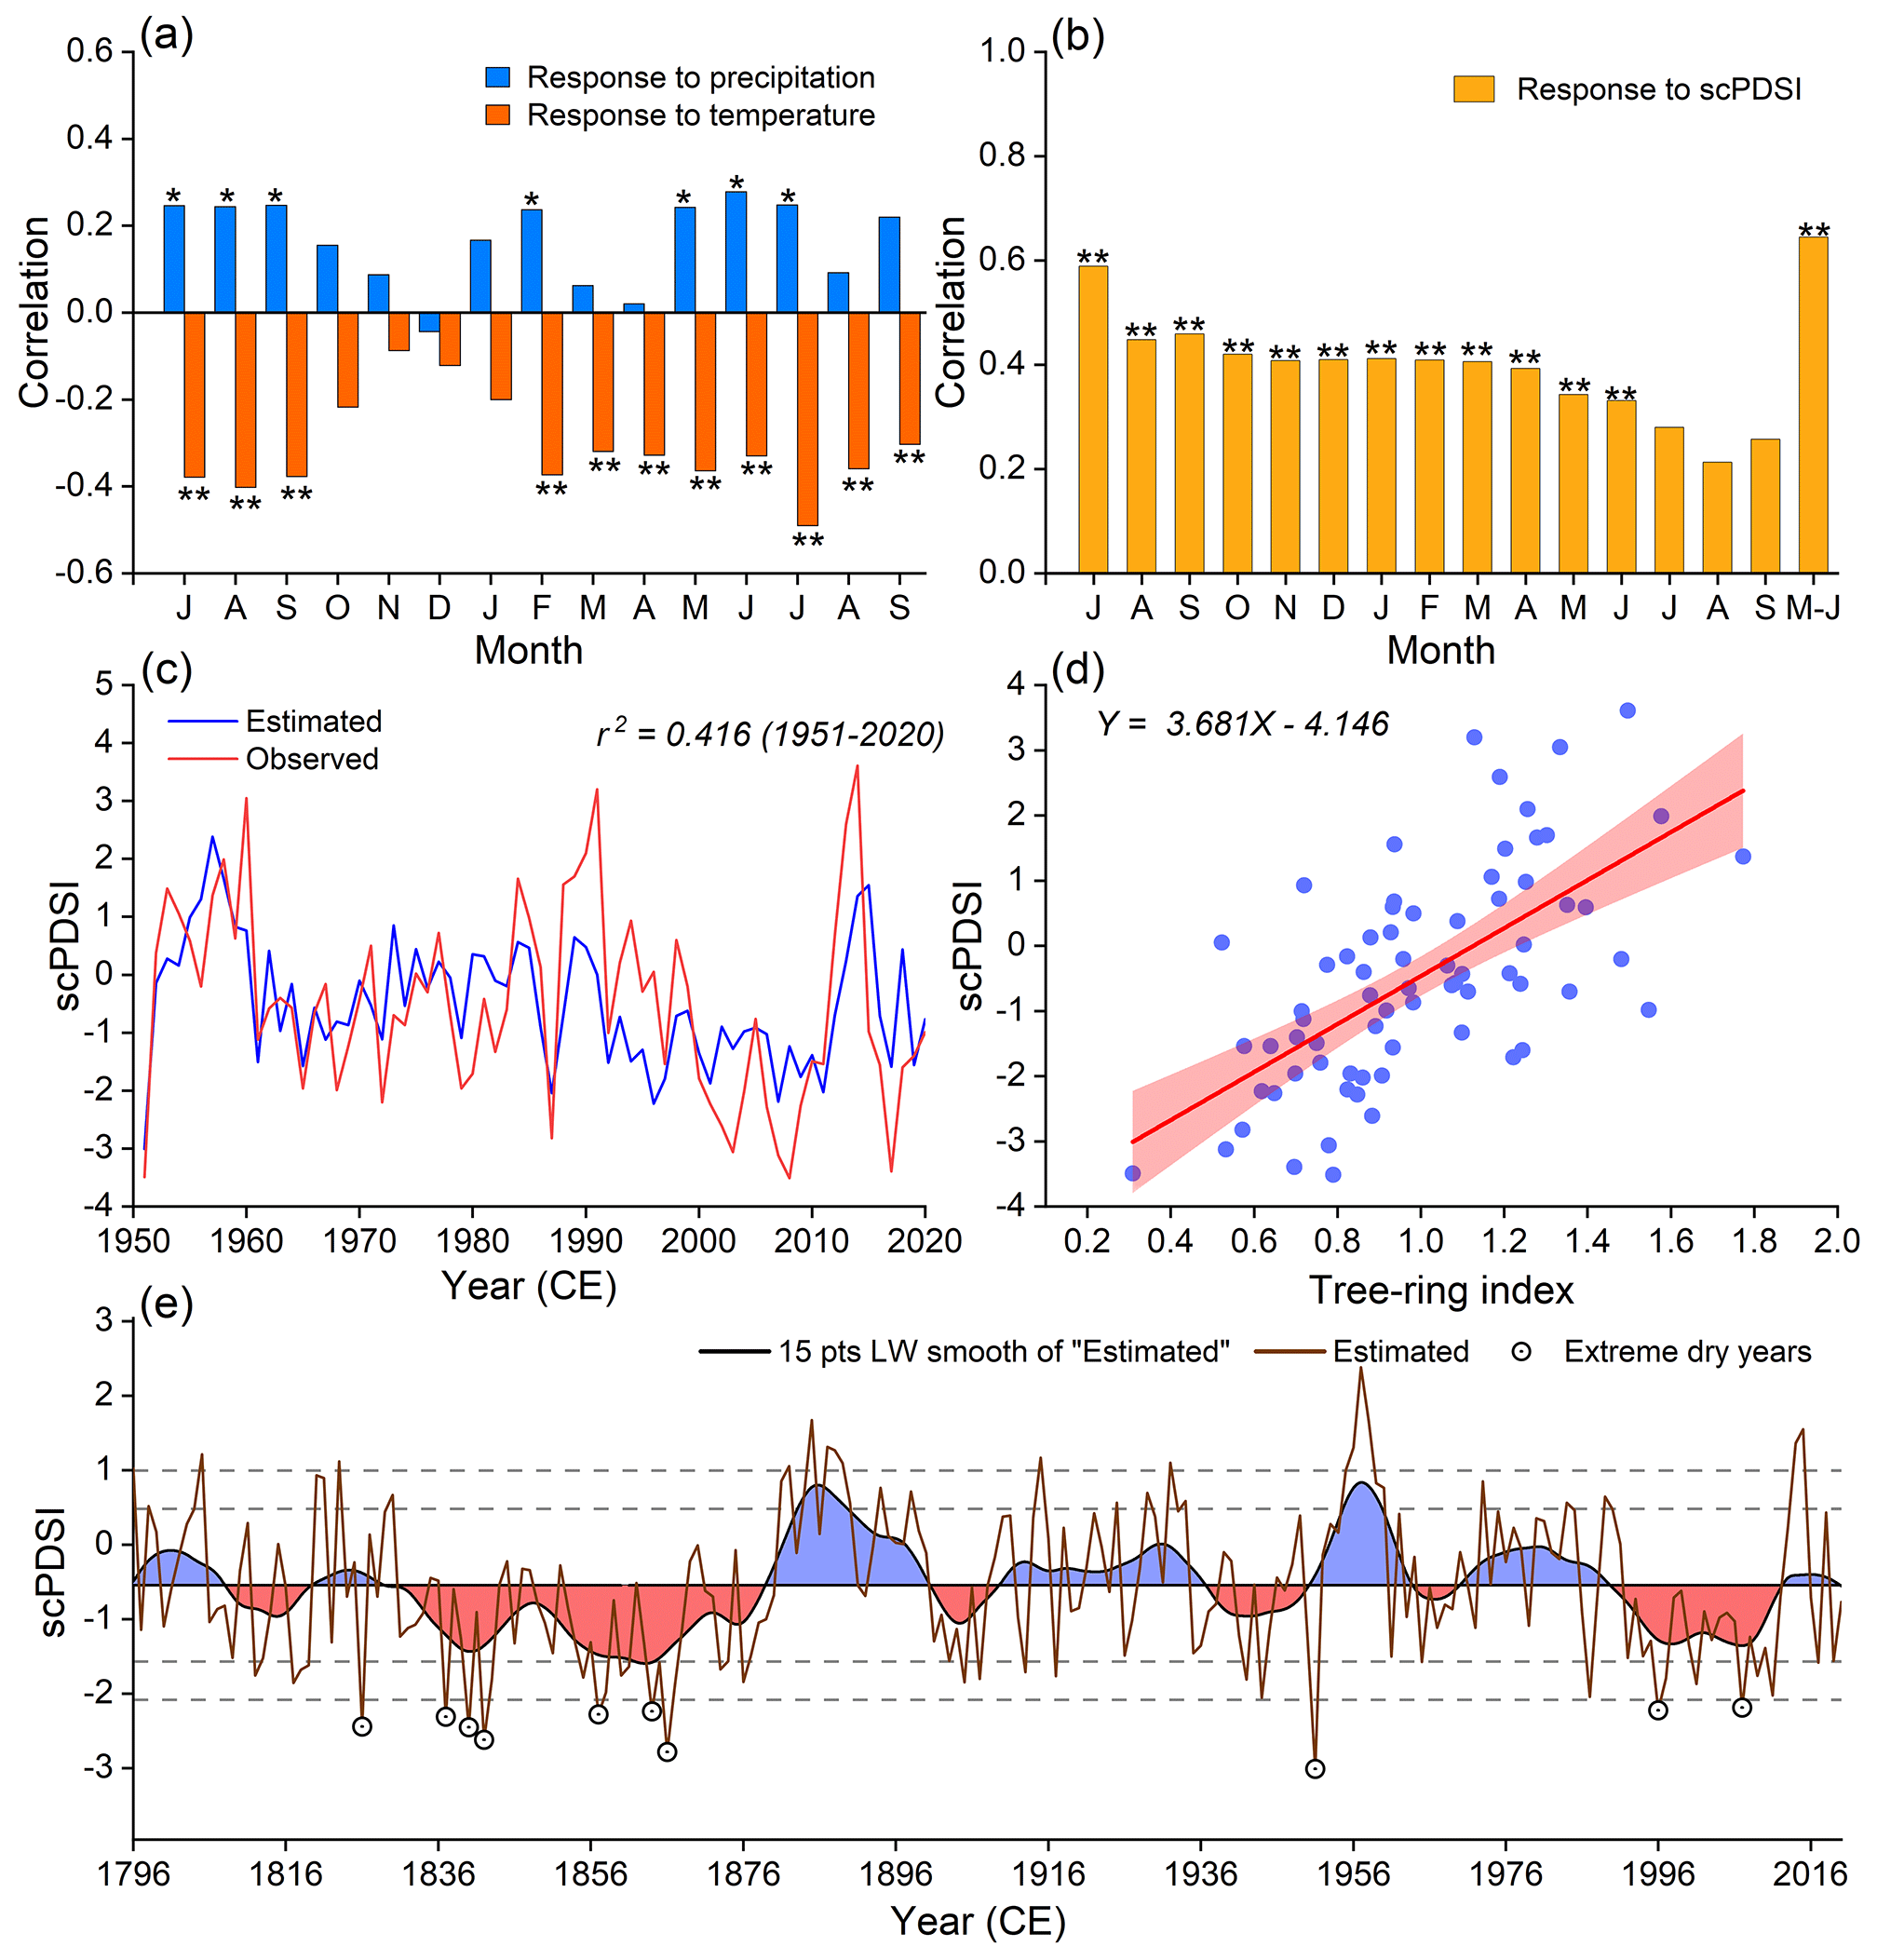
Figure 4(a) Correlation coefficients between the tree-ring chronologies and monthly total precipitation and mean temperature. (b) Correlation coefficients between the RC tree-ring chronologies and monthly mean scPDSI of the CRU. Correlations are calculated from the previous June to the current September over the time period of 1951–2020 (* represents the 95 % significance level and represents the 99 % significance level). (c) Comparison between the instrumental and reconstructed mean May–July scPDSI for the Hailar region during 1951–2020. (d) One-dimensional linear regression fits for the May to July scPDSI for 1796–2020. (e) Reconstructed mean May–July scPDSI and its 15-year low-pass-filtered version since 1796 CE. The horizontal central line represents the average reconstructed scPDSI. The horizontal dotted lines represent ±1 and ±1.5 SD on a mean value basis.
Table 2Statistical properties of the tree-ring width chronologies from the upper Amur (Heilongjiang) River basin.
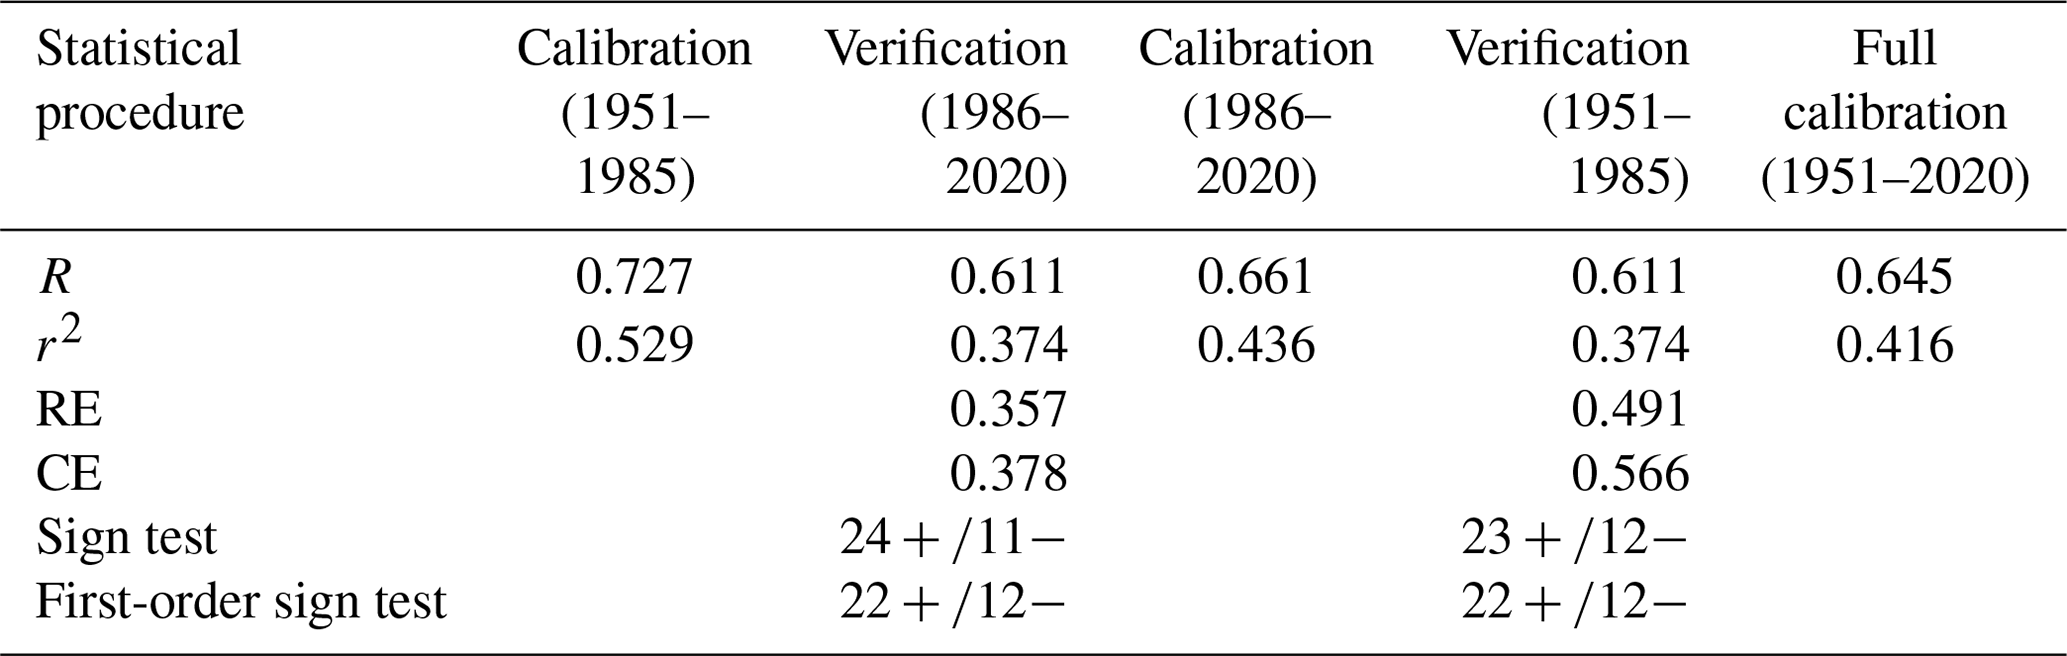
In Eq. (7), the correlation between the mean May–July scPDSI and the tree-ring width index over the period of 1951–2020 is 0.645, with the tree-ring width index explaining 41.6 % (40.7 % after adjustment for the degrees of freedom) of the mean scPDSI variance (F=48.385 and p<0.01). Except for several anomalously high values, the reconstructed mean scPDSI values agree well with the instrumental data (Fig. 4c). The first-order differencing correlation coefficient is 0.571. The split calibration-verification test results show that the reconstruction model has good reliability and stability, with values of RE and CE > 0.20. The sign and first-order difference sign tests are significant at the 0.05 level (Table 3). These results suggest that our scPDSI reconstruction has reliably recorded climate signals.
Table 3Results of verification and calibration tests for the scPDSI reconstruction.
3.2 Characteristics of the scPDSI reconstruction
Our scPDSI reconstructions reveal oscillations between drier and wetter conditions in the Hailar region during 1796–2020 CE (Fig. 4e). Dry/wet periods after 15-year low-pass filtering were continuously below/above the long-term mean for more than 10 years. Four dry periods (1809–1819, 1829–1878, 1937–1950, 1990–2012) and five wet periods (1796–1808, 1879–1900, 1910–1936, 1951–1963, 1970–1989) are evident in the record. A data value < 1.5 times the standard deviation of the long-term mean is defined as an extreme drought year, and such years occurred in 1779, 1826, 1837, 1840, 1842, 1857, 1864, 1866, 1951, 1996 and 2007. The curves also show an increase following lower values in the 1870s and a clear decreasing trend in the last 10 years, which is consistent with the instrumental observations (Fig. 4e). The results of the MTM analysis revealed periodicities of 2–8.1 years (Fig. 5). The results of spatial correlation analysis revealed a strong positive correlation between the reconstructed scPDSI series on the scale of the upper basin of the Heilongjiang (Amur) River and the gridded scPDSI, total rainfall, and runoff from May to July (Fig. 6a and b). After obtaining the mean series of the gridded data, good correlation coefficients were obtained between the reconstructed scPDSI and the regional mean of the gridded data: r=0.57 (p<0.01) and r=0.35 (p<0.01) with CRU scPDSI and CRU precipitation, respectively (Fig. 6a–c). The correlation coefficients between the reconstructed scPDSI and the G-RUN runoff and the runoff from the Khabarovsks Hydrological Station runoff were r=0.34 (p<0.01) and r=0.36 (p<0.01), respectively (Fig. 6d). These results indicate that our scPDSI reconstructions reliably reflect the regional drought characteristics and changes in runoff in the upper Heilongjiang (Amur) River basin.
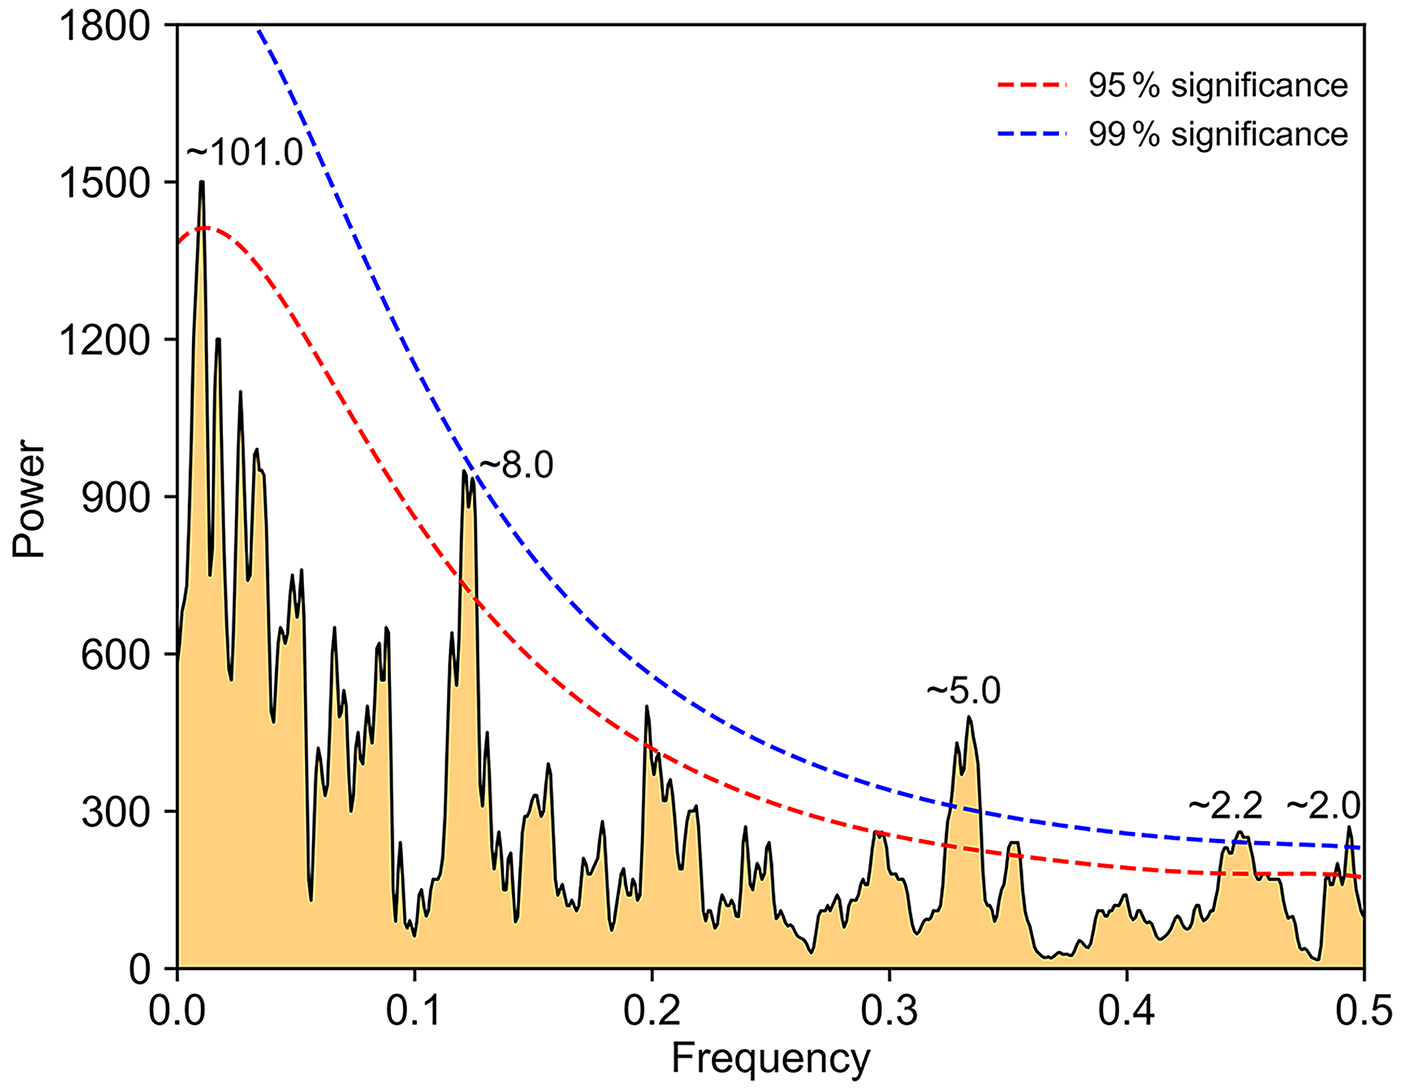
Figure 5MTM spectral density of the drought reconstruction. The dashed curves represent the 95 % (red) and 99 % (blue) significance levels.
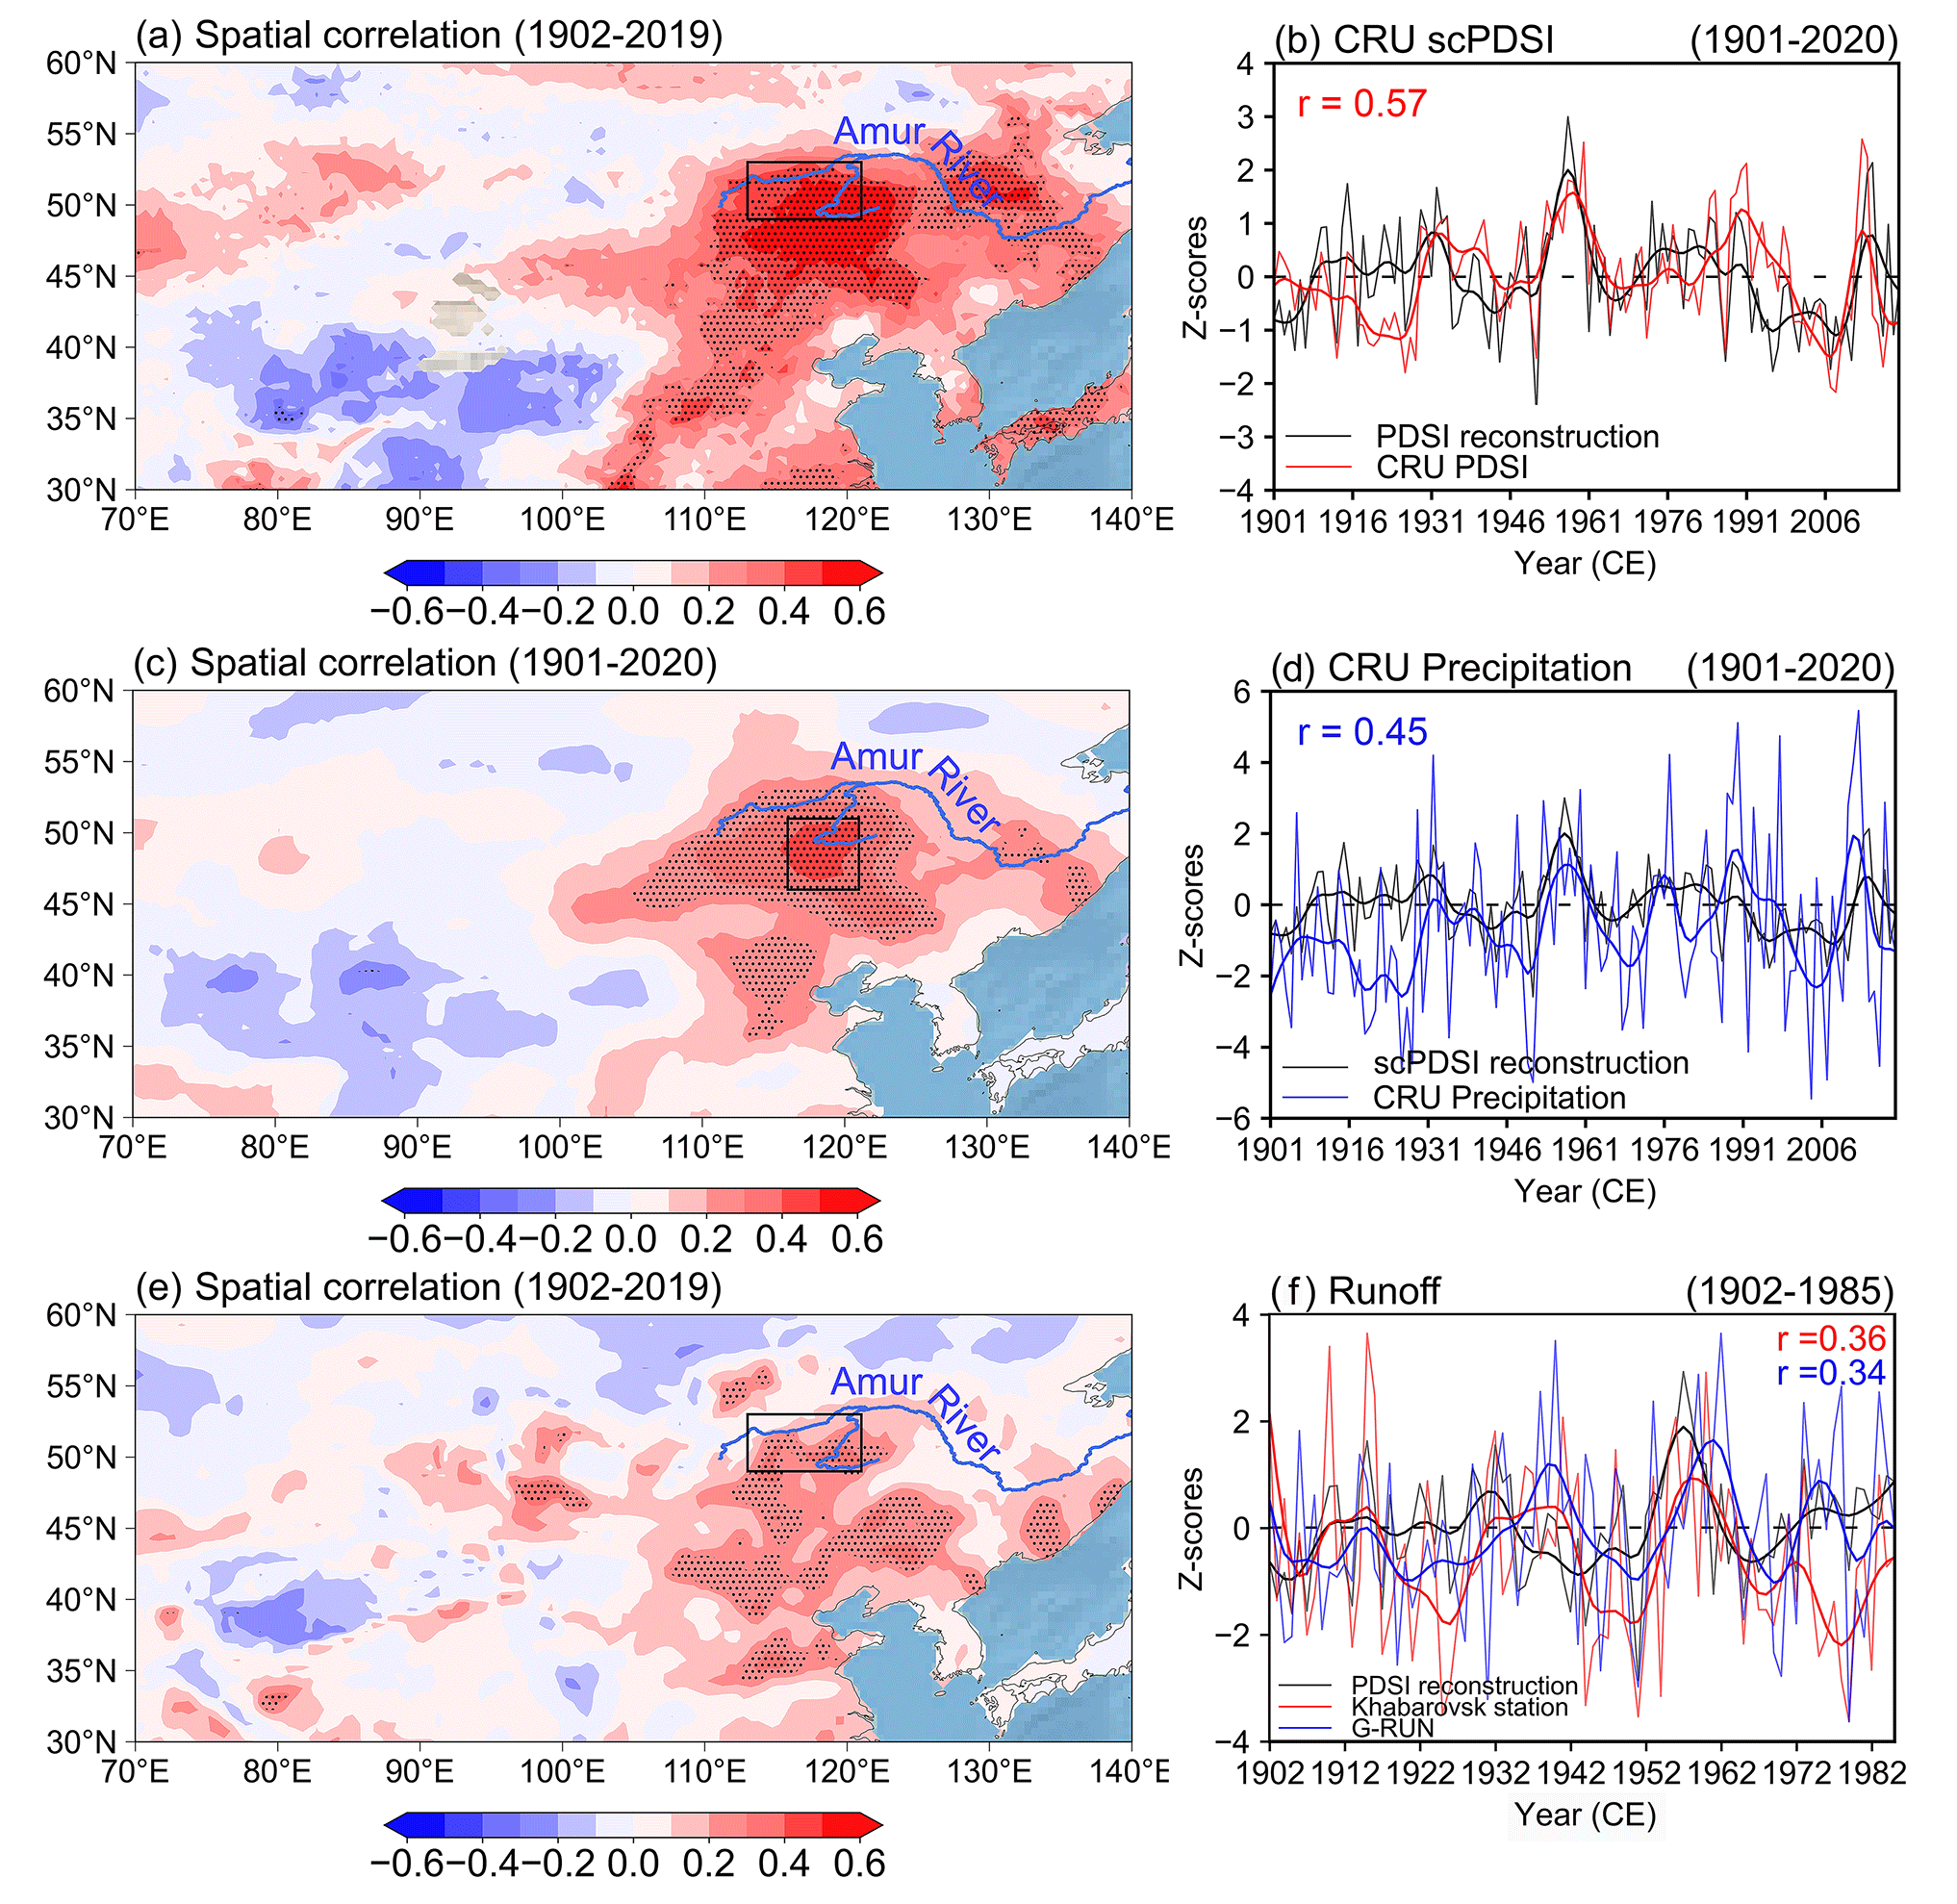
Figure 6Spatial correlation maps of the reconstructed scPDSI with the CRU gridded mean May–July scPDSI (a) and the CRU gridded total May–July precipitation (c) since 1901 CE. The graphs on the right show comparisons of the reconstructed scPDSI with the regional mean scPDSI (b) and precipitation (d) curves from the CRU, with dark curves representing 10 years of low-pass filtering. (e) Reconstructed scPDSI with G-RUN gridded May–July mean runoff spatial correlation map for the period of 1902–2019. (f) Comparison of the reconstructed scPDSI, hydrological station runoff data and the G-RUN regional mean runoff data for the period of 1902–1985. In (a), (c) and (e), the rectangle indicates the location of the range of the grid, shaded areas represent the 99 % significance level and dark curves represent 10-year low-pass-filtered curves.
4.1 Climate–tree-ring growth relationships and temporal variations in regional drought
The positive correlation between tree-ring width and rainfall and the negative correlation with temperature indicate that the increase in the circumference of P. sylvestris var. mongolica in the Hailar area is described by a humidity-sensitive growth model. Temperature is much a greater stressor for tree growth in arid and semi-arid regions than precipitation (Bao et al., 2015; Fang et al., 2010; Sun et al., 2012). The higher correlation coefficients between temperature and the tree-ring indices in our dataset indicate that the radial expansion of P. sylvestris var. mongolica in the Hailar region is mainly influenced by soil moisture conditions modulated by temperature variations (Fig. 4a). Compared with precipitation alone, scPDSI better reflects changes in soil moisture caused by precipitation and temperature stress on the radial growth of trees. The scPDSI during the growing season from May to July also shows the highest correlation with scPDSI (r=0.645, p<0.01) (Fig. 4c). The radial growth of P. sylvestris var. mongolica is mainly determined by the control of soil moisture by precipitation (Song et al., 2015). However, in semiarid areas, the increasing temperature during the growing season accelerates the evaporation of soil moisture and enhances plant transpiration, and thus the soil moisture supply is insufficient for tree growth (Shang et al., 2012). In contrast, temperatures above a certain threshold during the growth season can adversely affect tree growth because the decrease in the net photosynthetic rate and excessive temperatures will lead to more severe drought stress (D'Arrigo et al., 2004).
The reconstructed scPDSI reveals 10 extreme drought years during 1796–2000, seven of which can be identified in historical documents (Zhang, 2004; Liu and Wen, 2008) (Table 4). The historical literature includes detailed descriptions of drought events; for example, 1951 was a drought year throughout Inner Mongolia – one of a series of relatively severe droughts – when the lack of rainfall in summer and autumn was more severe than in spring. Numerous seedlings of crop plants in Hulunbuir were killed by the drought, and the grain yield of the entire region was significantly reduced (Liu and Wen, 2008). In 1996, a severe drought affected the north-central part of Inner Mongolia in early summer (Liu and Wen, 2008). Our reconstruction captures several extreme drought events in the past decade. The intense heat in Northeast China (NEC) during July–August 2016 resulted in severe crop yield reductions and economic losses amounting to USD 15.61 billion (Li et al., 2018). In 2017, the NEC region encountered an exceptionally severe spring and summer drought event (Zeng et al., 2019). This event had a significant impact on the cultivated area in eastern Inner Mongolia. Notably, the crop failure extent and ensuing economic losses ranked as the second highest since 2012. The drought affected an area of 74.3×10⁴ km2 across the region, with the western Hulunbuir area experiencing primarily moderately intense drought (Zhang et al., 2017).
Table 4Comparisons between the reconstructed scPDSI and documented climatic events.
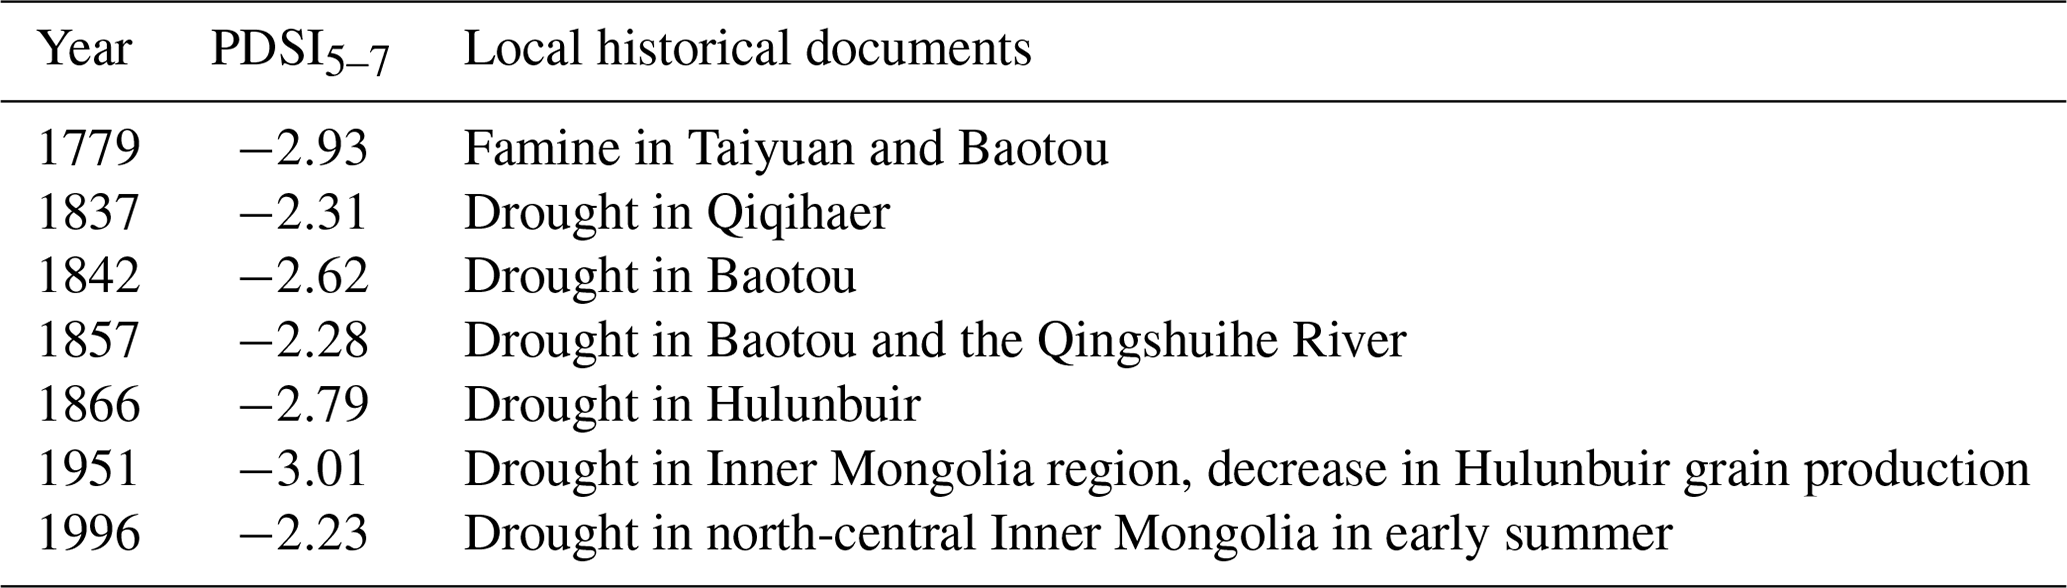
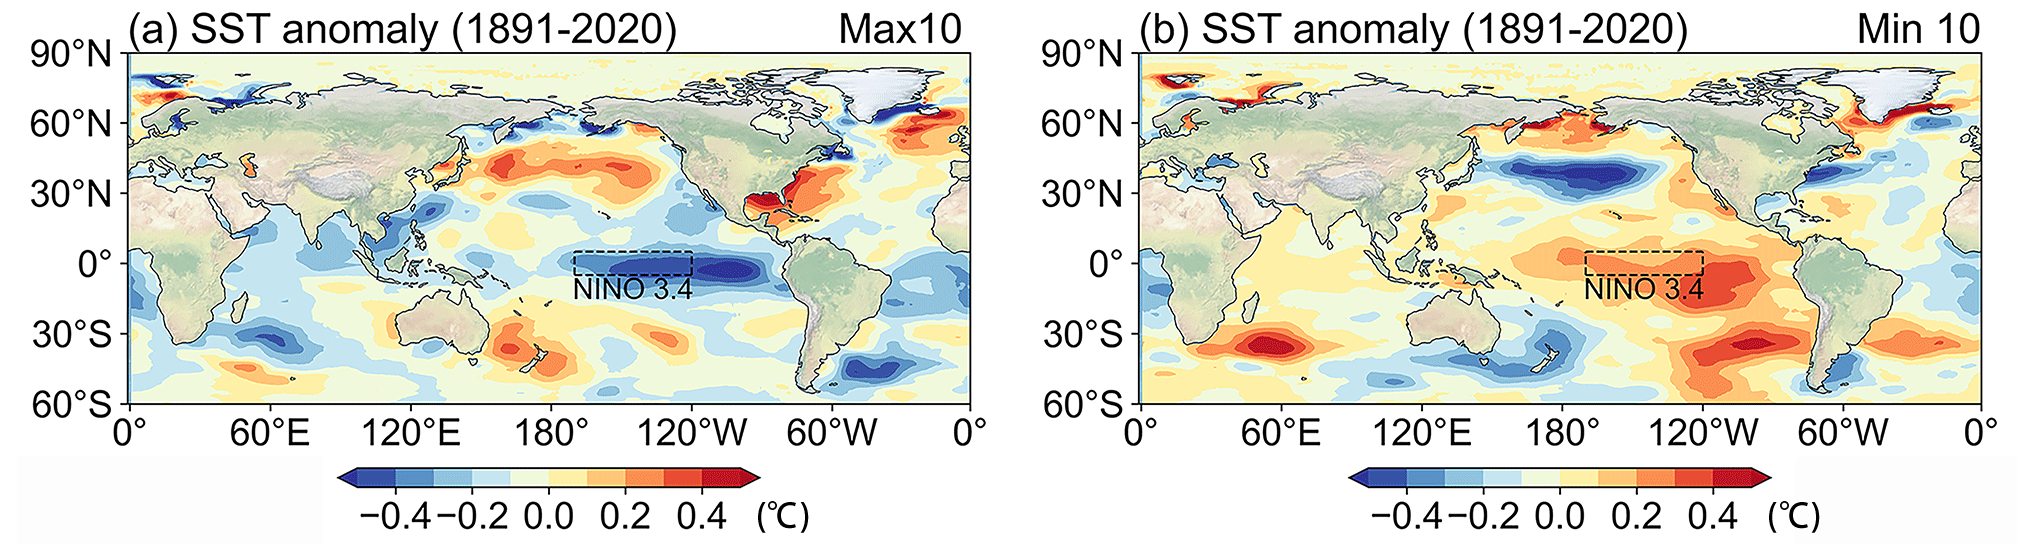
Figure 7Composite maps of SST anomalies (∘C) for the 10 wettest years (a) and 10 driest years (b) from the previous December to the current January during 1891–2020. SST data from JRA COBE-SST dataset (Ishii et al., 2005a).
4.2 Synoptic meteorological analysis of severe drought
To explore the climatic drivers of the extreme drought events, we screened the wettest and driest decades from 1891 to 2020. Sea surface temperature (SST) changes in the previous winter are critical for precipitation in East Asia in the following year (Juneng and Tangang, 2005), and thus we selected the winter SST from December of the previous year to January of the current year to analyze the respective decadal SST anomalies. The results indicate that during wet years, SST has the negative ENSO phase pattern, while in dry years, it has the positive ENSO phase pattern (Fig. 7a and b). The reconstructed scPDSI also has the same 2–5 year cycle as ENSO (Fig. 5), suggesting that ENSO may have contributed to drought in the upper Heilongjiang (Amur) River basin. The wettest decade and the driest decade from 1950 to 2020 were also selected for climatological analysis, which revealed the following relationships. During the wet years, the SST in the preceding winter had the negative ENSO phase pattern, the SST in the eastern equatorial Pacific decreased, and the western Pacific warm pool and the Walker circulation intensified. At the same time, the western Pacific subtropical high pressure weakened and shifted northward, the Mongolian high pressure weakened significantly (Fig. 8a), the anomalous cyclone in the wet years corresponded to a cold anomaly (Fig. 8c), and the major rainfall band in May–July (MJJ) shifted northward. This scenario caused an anomalous increase in precipitation in the upper Heilongjiang (Amur) River basin during the selected wet years. In dry years, the SST in the preceding winter had a positive ENSO phase pattern, the SST difference between the western and eastern equatorial Pacific decreased, the latitudinal Walker circulation weakened, and the western Pacific subtropical high pressure strengthened and shifted southward compared to normal. These events result in weak East Asian summer winds and a significantly more intense Mongolian high (Fig. 8b). The anomalous cyclone in dry years corresponds to a warm anomaly (Fig. 8d), and the anticyclone corresponds to a warm anomaly (Fig. 8d), which is controlled by an eccentric northerly component that favors cold air transport from high latitudes to the northeast during dry years. This results in anomalous descending motion and a southward shift of the main rain and wind belts, leading to drought (Fig. 8f).
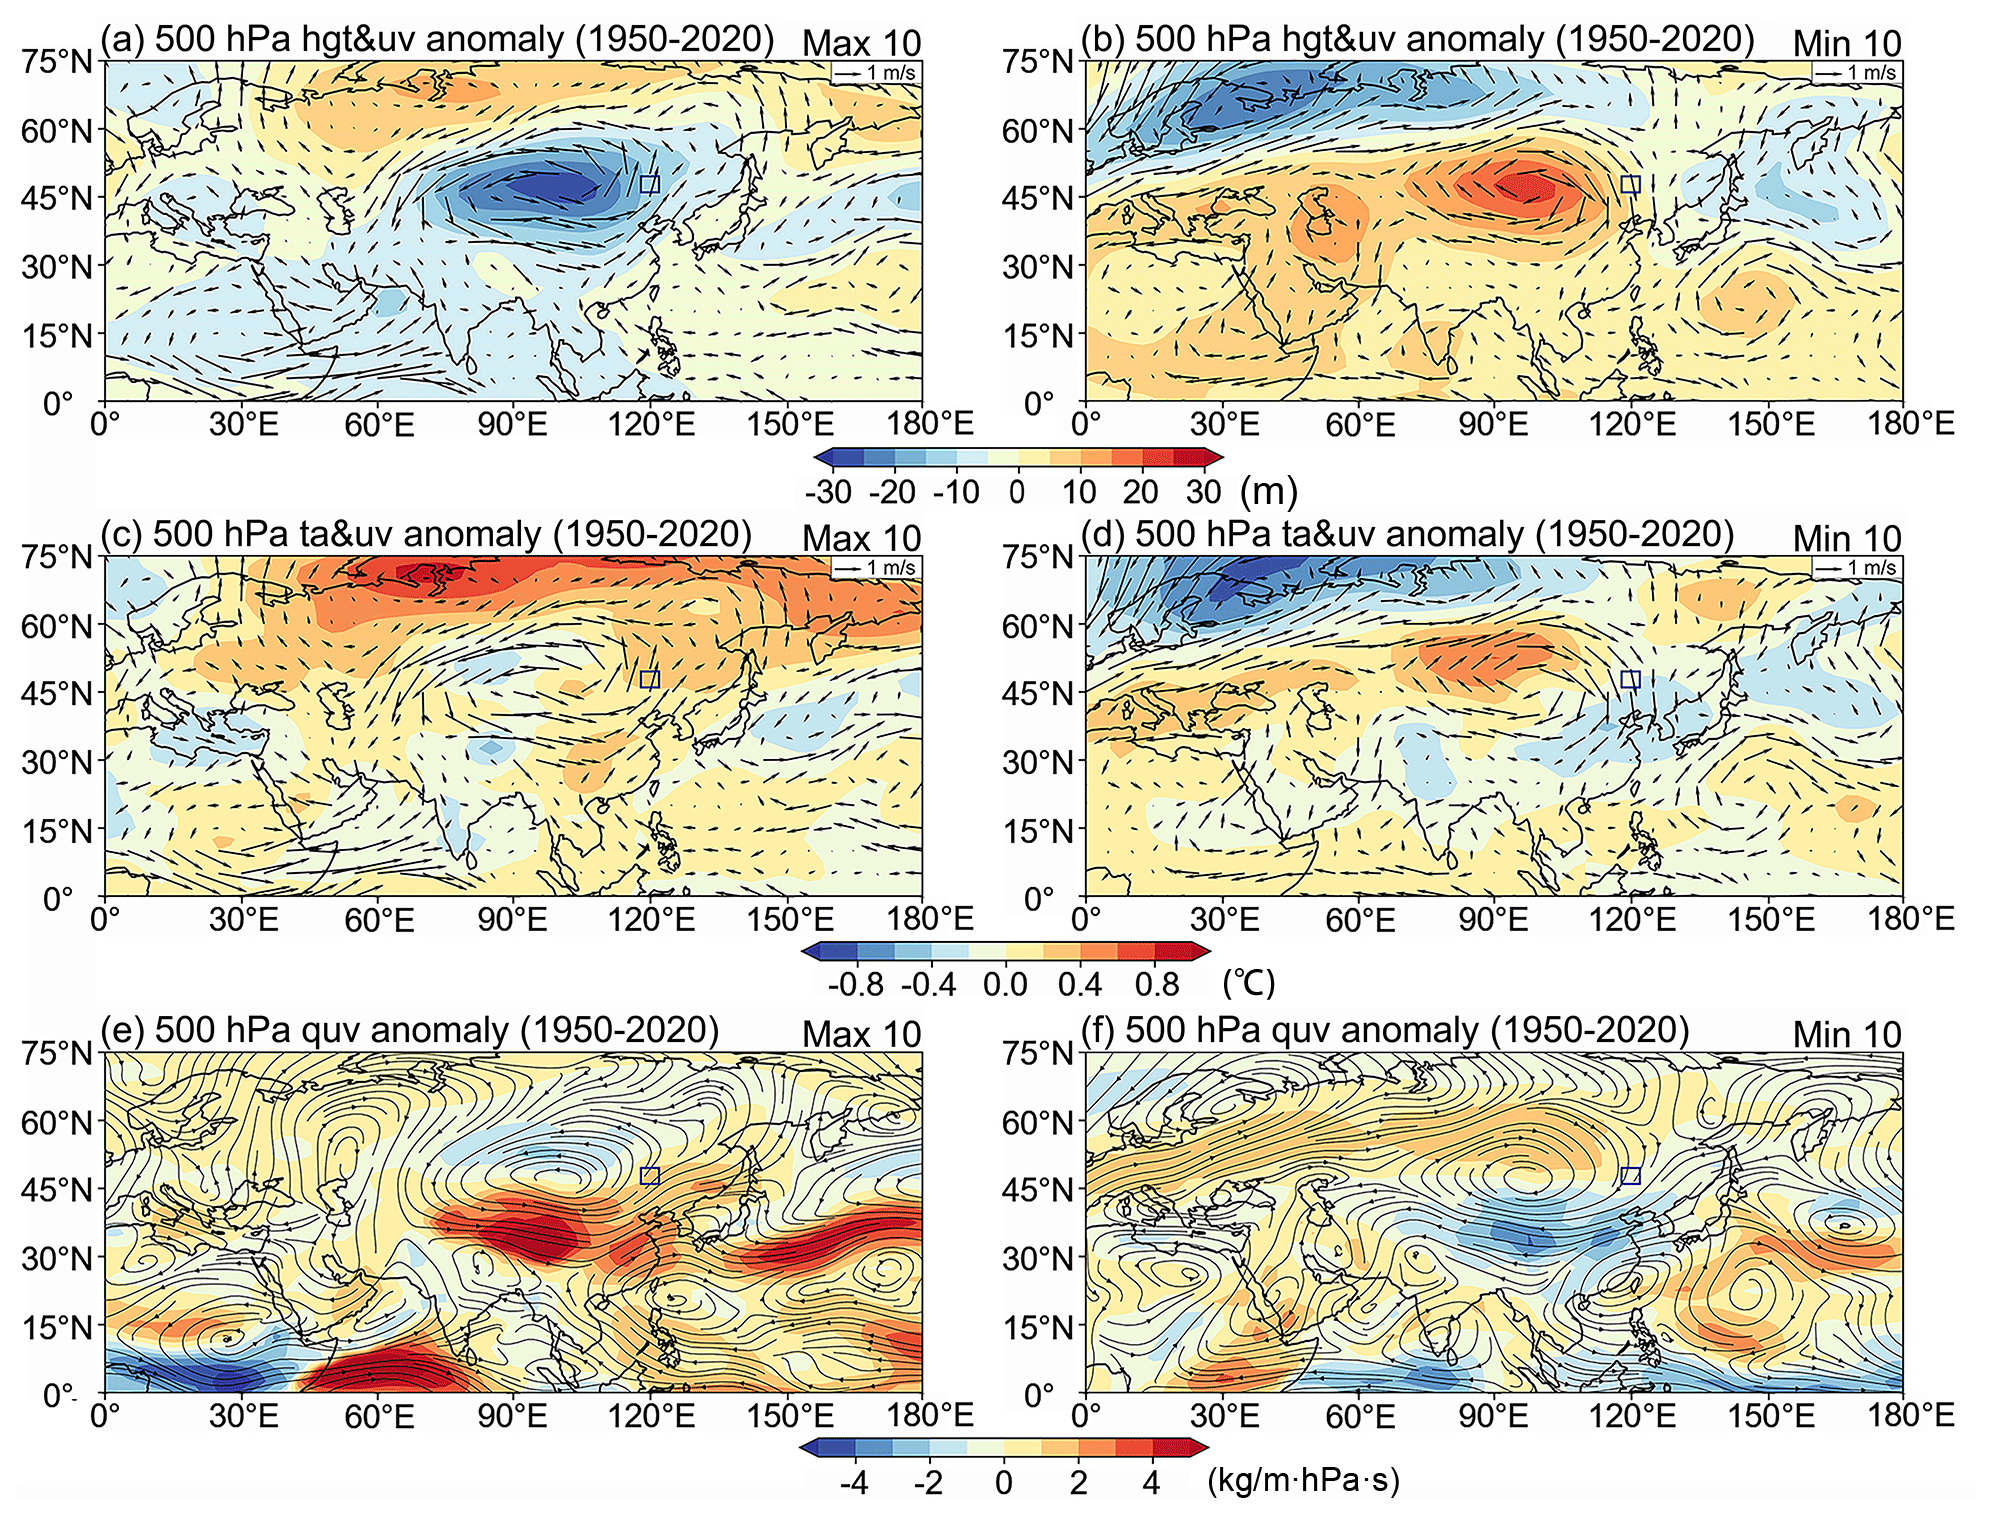
Figure 8Spatial patterns of geopotential height and 500 hPa vector wind anomalies (a, b), 500 hPa air temperature and 500 hPa vector wind anomalies (c, d), and 500 hPa water vapor transport anomalies (e, f) in the wettest decade and the driest decade during 1950–2020 in NCEP-NCAR Reanalysis 1. The rectangle indicates the location of the study area.
Several additional studies have found that Nino3 SST has a significant negative correlation with precipitation in North China (Wang, 2002; Yu et al., 2004), and the negative correlation between rainfall and ENSO in northern China is associated with anomalous cyclones over East Asia (Wu et al., 2003). These findings exhibit congruence with the outcomes derived from our analytical examinations. In summary, the large-scale ocean–atmosphere–land circulation system is a critical driver of drought development in the upper Heilongjiang (Amur) River basin.
4.3 Atmospheric water cycle during drought years
Based on National Centers for Environmental Prediction-National Center for Atmospheric Research (NCEP–NCAR) reanalysis 1 data (Kalnay et al., 1996a), we quantified the meteorological conditions and atmospheric hydrological cycle anomalies in the Hailar region during May–July of the driest decade during 1950–2020, based on the reconstructed scPDSI. The total climatic precipitation for May–July during 1950–2020 was 27.0×10⁶ kg s−1, while the total precipitation for May–July in a drought year was 23.0×10⁶ kg s−1, a decrease of 14.8 %. The external advective input (Fin) under climatic conditions was 230.9×10⁶ kg s−1, compared to 211.4×10⁶ kg s−1 during the dry year, with an 8.4 % reduction in external advective input during the drought. Evaporation (E) was 30.7×10⁶ kg s−1 under these climatic conditions and 29.5×10⁶ kg s−1 during dry years, with a 3.9 % reduction in evaporation during the drought. Precipitation formed by external advective input (Pa) under these climatic conditions was 25.3×10⁶ kg s−1, contributing 93.8 % of the precipitation, and precipitation formed by evaporation (Pe) was 1.7×10⁶ kg s−1, with a precipitation recirculation rate of 6.2 %. Precipitation formed by external advection input (Pa) during the dry year was 21.4×10⁶ kg s−1, contributing 93.5 % of the precipitation, and precipitation formed by evaporation (Pe) was 1.5×10⁶ kg s−1, with a precipitation recirculation rate of 6.5 % (Fig. 9b). During the dry year, total precipitation decreased by 14.8 % compared to the climatic mean, and the external advective input of water vapor decreased significantly (8.4 %), resulting in a 15.4 % decrease in precipitation formed from the external advective input of water vapor, with little change in evaporation and precipitation formed by evaporation. These results suggest that the drought in the upper Heilongjiang (Amur) Basin is mainly caused by a reduction in the external advective water vapor input rather than by anomalies in the precipitation cycle. Synthetic anomalies in the whole-layer water vapor fluxes and precipitation rates also indicate a decrease in advective water vapor transport and precipitation during the drought (Fig. 9a). These results indicate that variations in the process of moisture transport play a pivotal role in the formation of drought in the upper Heilongjiang (Amur) River basin.
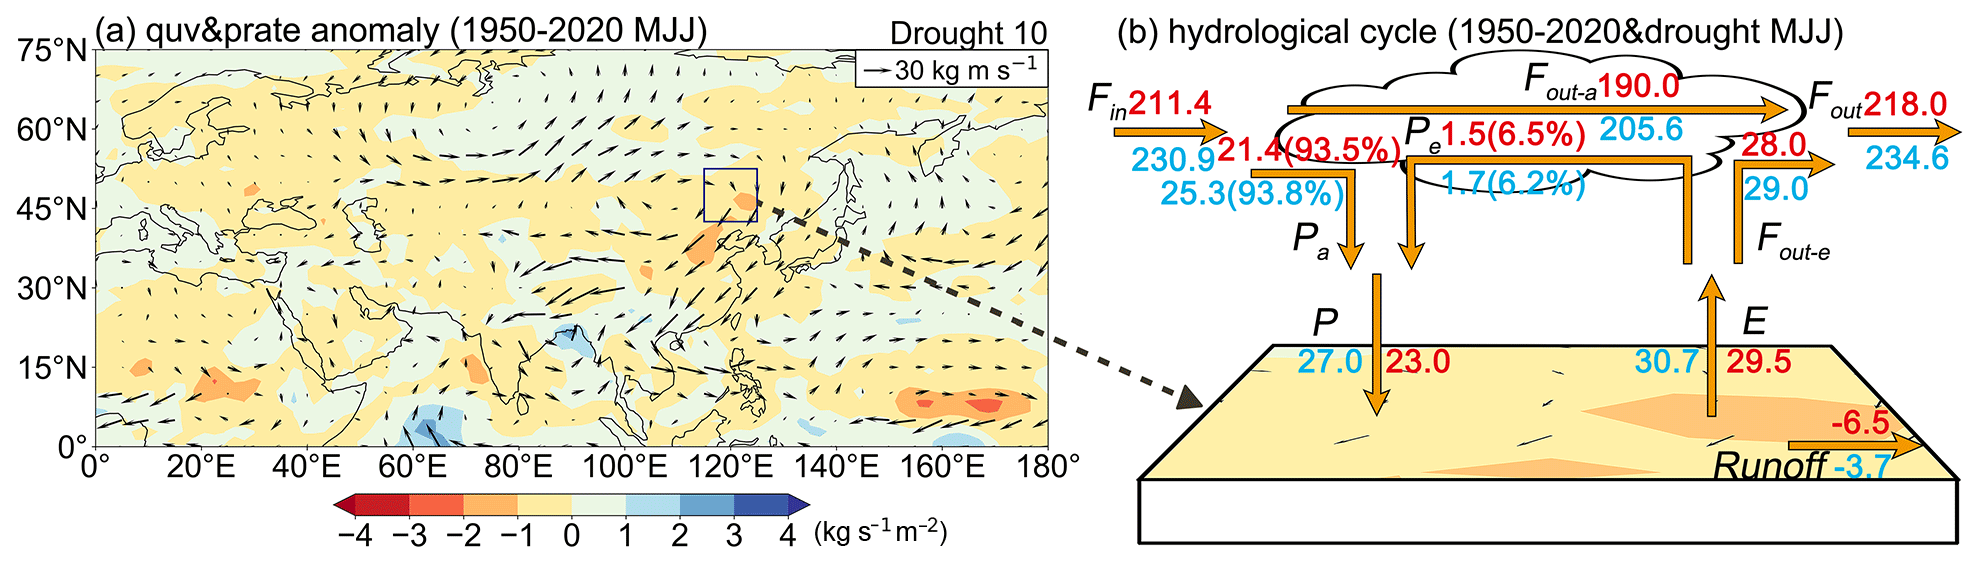
Figure 9(a) Anomaly composites of the mean precipitation rate (kg s m−2) and the whole-layer moisture flux (kg m s−1) for May–July of the driest decade in the study area (115–125∘ E, 42.5–52.5∘ N) relative to that of May–July for the period of 1950–2020 (arrows represent the whole-layer moisture flux; filled colors represent the precipitation rate). (b) Schematic diagram of the land–atmosphere water balance in the study area during the climatic period (1950–2020) and dry years. The variables in this plot (i.e., Fin, Fout−a, Fout−e, Fout, Pa, Pe, P, E) are explained in Sect. 2.4. The blue labels (in kg s−1) indicate climatic averages, while the red labels indicate averages during drought.
We built a composite tree-ring chronology for two sampling sites in the Hailar region. Based on this chronology, we reconstructed the monthly mean scPDSI for May–July in the upper Heilongjiang (Amur) Basin since 1796. The reconstructed sequence comprises more than 220 years of wet and dry variations in the upper Heilongjiang (Amur) River basin, which has experienced four consecutive dry periods and five consecutive wet periods since 1796 CE, with a significant 2–8-year cyclicity. The drought reconstruction accurately captured the recent trends in dry/wet variability and reflects drought variability across a large area.
Our synoptic climatological analysis of extreme drought years suggests that the dry/wet variability in the upper Heilongjiang (Amur) River basin is related to several large-scale climate stresses and atmospheric circulation patterns (the ENSO and Silk Road models) and that one of the critical drivers of drought development in the upper Heilongjiang (Amur) River basin is the large-scale ocean–atmosphere–land circulation system. Our atmospheric water circulation analysis suggests that the cause of drought is primarily a reduction in advective water vapor transport, rather than precipitation circulation processes, which further implies that atmospheric circulation systems control wet/dry variability in the upper Heilongjiang (Amur) River basin.
Our drought reconstruction has several shortcomings since it is based on only two sample sites, spans a relatively short interval (230 years) and represents only a very small region. Therefore, it is essential to systematically compile additional tree-ring-based climate records from this region to provide drought reconstructions on a large spatial scale, which may help characterize the spatio-temporal variability and impact mechanisms of drought within NEC.
The scPDSI reconstruction for the upper Heilongjiang (Amur) River basin is available in the Supplement. CRU precipitation and scPDSI datasets is available at https://crudata.uea.ac.uk/cru/data/hrg/ (Harris et al., 2014b). G-RUN dataset is available at https://doi.org/10.6084/m9.figshare.1279-4075 (Ghiggi et al., 2021b). NCEP–NCAR reanalysis 1 dataset is available at https://psl.noaa.gov/data/gridded/data.ncep.reanalysis.html (Kalnay et al., 1996b). JRA COBE-SST dataset is available at https://psl.noaa.gov/data/gridded/data.cobe.html (Ishii et al., 2005b).
The supplement related to this article is available online at: https://doi.org/10.5194/cp-19-2079-2023-supplement.
FC conceived the study, YX conducted the analyses and wrote the manuscript, and other authors were involved in the sample collection. All the authors interpreted and discussed the results.
The contact author has declared that none of the authors has any competing interests.
Publisher's note: Copernicus Publications remains neutral with regard to jurisdictional claims made in the text, published maps, institutional affiliations, or any other geographical representation in this paper. While Copernicus Publications makes every effort to include appropriate place names, the final responsibility lies with the authors.
This research was supported by the National Natural Science Foundation of China (32061123008).
This research has been supported by the National Natural Science Foundation of China International Cooperation Project “Synergistic Responses of Tree-Ring Records in Northern China and the Patagonian Desert Ecosystem in Argentina to ENSO” (No. 32061123008).
This paper was edited by Z. S. Zhang and reviewed by Qiang Li and one anonymous referee.
Bao, G., Liu, Y., and Linderholm, H. W.: April–September mean maximum temperature inferred from Hailar pine (Pinus sylvestris var. mongolica) tree rings in the Hulunbuir region, Inner Mongolia, back to 1868 AD, Palaeogeogr. Palaeocl. Palaeoecol., 313, 162–172, https://doi.org/10.1016/j.palaeo.2011.10.017, 2012.
Bao, G., Liu, Y., Liu, N., and Linderholm, H. W.: Drought variability in eastern Mongolian Plateau and its linkages to the large-scale climate forcing, Clim. Dynam., 44, 717–733, https://doi.org/10.1007/s00382-014-2273-7, 2015.
Brubaker, K. L., Entekhabi, D., and Eagleson, P. S.: Estimation Of Continental Precipitation Recycling, J. Climate, 6, 1077–1089, https://doi.org/10.1175/1520-0442(1993)006<1077:Eocpr>2.0.Co;2, 1993.
Burde, G. I. and Zangvil, A.: The estimation of regional precipitation recycling. Part I: Review of recycling models, J. Climate, 14, 2497–2508, https://doi.org/10.1175/1520-0442(2001)014<2497:Teorpr>2.0.Co;2, 2001.
Chen, F., Opala-Owczarek, M., Khan, A., Zhang, H. L., Owczarek, P., Chen, Y. P., Ahmed, M., and Chen, F.: Late twentieth century rapid increase in high Asian seasonal snow and glacier-derived streamflow tracked by tree rings of the upper Indus River basin, Environ. Res. Lett., 16, 094055, https://doi.org/10.1088/1748-9326/ac1b5c, 2021.
Chen, F., Martin, H., Zhao, X., Roig, F., Zhang, H. L., Wang, S. J., Yue, W. P., and Chen, Y. P.: Abnormally low precipitation-induced ecological imbalance contributed to the fall of the Ming Dynasty: new evidence from tree rings, Climatic Change, 173, 13, https://doi.org/10.1007/s10584-022-03406-y, 2022.
Chen, Z. J., Zhang, X. L., Cui, M. X., He, X. Y., Ding, W. H., and Peng, J. J.: Tree-ring based precipitation reconstruction for the forest-steppe ecotone in northern Inner Mongolia, China and its linkages to the Pacific Ocean variability, Global Planet. Change, 86–87, 45–56, https://doi.org/10.1016/j.gloplacha.2012.01.009, 2012.
Cook, B. I., Anchukaitis, K. J., Touchan, R., Meko, D. M., and Cook, E. R.: Spatiotemporal drought variability in the Mediterranean over the last 900 years, J. Geophys. Res.-Atmos., 121, 2060–2074, https://doi.org/10.1002/2015jd023929, 2016.
Cook, E. R.: A time series analysis approach to tree ring standardization, University of Arizona, Tucson, https://www.proquest.com/openview/fb46d6e00bbe31c1fae1cb03a8383dea/1, (last access: 25 October 2023), 1985.
Fritts, H. C., Guiot, J., Gordon, G. A., and Schweingruber, F.: Methods of Dendrochronology: Applications in the Environmental Sciences, edited by: Cook, E. R. and Kairiukstis, L. A., Springer Netherlands, Dordrecht, 163–217, https://doi.org/10.1007/978-94-015-7879-0_4, 1990.
Cook, E. R., Anchukaitis, K. J., Buckley, B. M., D'Arrigo, R. D., Jacoby, G. C., and Wright, W. E.: Asian Monsoon Failure and Megadrought During the Last Millennium, Science, 328, 486–489, https://doi.org/10.1126/science.1185188, 2010.
D'Arrigo, R. D., Kaufmann, R. K., Davi, N., Jacoby, G. C., Laskowski, C., Myneni, R. B., and Cherubini, P.: Thresholds for warming-induced growth decline at elevational tree line in the Yukon Territory, Canada, Global Biogeochem. Cy., 18, GB3021, https://doi.org/10.1029/2004gb002249, 2004.
Ding, Y. H., Sun, Y., Wang, Z. Y., Zhu, Y. X., and Song, Y. F.: Inter-decadal variation of the summer precipitation in China and its association with decreasing Asian summer monsoon Part II: Possible causes, Int. J. Climatol., 29, 1926–1944, https://doi.org/10.1002/joc.1759, 2009.
Fang, K. Y., Gou, X. H., Chen, F. H., D'Arrigo, R., and Li, J. B.: Tree-ring based drought reconstruction for the Guiqing Mountain (China): linkages to the Indian and Pacific Oceans, Int. J. Climatol., 30, 1137–1145, https://doi.org/10.1002/joc.1974, 2010.
Findell, K. L. and Eltahir, E. A. B.: Atmospheric controls on soil moisture-boundary layer interactions. Part I: Framework development, J. Hydrometeorol., 4, 552–569, https://doi.org/10.1175/1525-7541(2003)004<0552:Acosml>2.0.Co;2, 2003.
Fritts, H. C.: Reconstructing large-scale climatic patterns from tree-ring data: t diagnostic analysis, University of Arizona Press, https://www.osti.gov/biblio/5321264 (last access: 25 October 2023), 1991.
Fu, C. B. and Zeng, Z. M.: Correlations between North Atlantic Oscillation Index in winter and eastern China Flood/Drought Index in summer in the last 530 years, Chinese Sci. Bull., 50, 2505–2516, https://doi.org/10.1360/04wd0284, 2005.
Ghiggi, G., Humphrey, V., Seneviratne, S. I., and Gudmundsson, L.: G-RUN ENSEMBLE: A Multi-Forcing Observation-Based Global Runoff Reanalysis, Water Resour. Res., 57, e2020WR028787, https://doi.org/10.1029/2020WR028787, 2021a.
Ghiggi, G., Humphrey, V., Seneviratne, S. I., and Gudmundsson, L.: G-RUN ENSEMBLE: A Multi-Forcing Observation Based Global Runoff Reanalysis, figshare [data set], https://doi.org/10.6084/m9.figshare.1279-4075, 2021b.
Guan, Y. S., Gu, X. H., Slater, L. J., Li, L. F., Kong, D. D., Liu, J. Y., Zhang, X., and Yan, X. S.: Tracing anomalies in moisture recycling and transport to two record-breaking droughts over the Mid-to-Lower Reaches of the Yangtze River, J. Hydrol., 609, 127787, https://doi.org/10.1016/j.jhydrol.2022.127787, 2022.
Guo, L., Klingaman, N. P., Demory, M. E., Vidale, P. L., Turner, A. G., and Stephan, C. C.: The contributions of local and remote atmospheric moisture fluxes to East Asian precipitation and its variability, Clim. Dynam., 51, 4139–4156, https://doi.org/10.1007/s00382-017-4064-4, 2018.
Han, T. T., Chen, H. P., and Wang, H. J.: Recent changes in summer precipitation in Northeast China and the background circulation, Int. J. Climatol., 35, 4210–4219, https://doi.org/10.1002/joc.4280, 2015.
Han, T. T., Wang, H. J., and Sun, J. Q.: Strengthened Relationship between Eastern ENSO and Summer Precipitation over Northeastern China, J. Climate, 30, 4497–4512, https://doi.org/10.1175/jcli-d-16-0551.1, 2017.
Harris, I., Jones, P. D., Osborn, T. J., and Lister, D. H.: Updated high-resolution grids of monthly climatic observations – the CRU TS3.10 Dataset, Int. J. Climatol., 34, 623–642, https://doi.org/10.1002/joc.3711, 2014a.
Harris, I., Jones, P. D., Osborn, T. J., and Lister, D. H.: Updated high-resolution grids of monthly climatic observations the CRU TS 3.10, CRU TS, https://crudata.uea.ac.uk/cru/data/hrg/ (last access: 21 February 2023), 2014b.
Holmes, R. L.: Computer-assisted quality control in tree-ring dating and measurement, Tree-Ring Bull., 43, 69–78, 1983.
Ishii, M., Shouji, A., Sugimoto, S., and Matsumoto, T.: Objective analyses of sea-surface temperature and marine meteorological variables for the 20th century using ICOADS and the Kobe collection, Int. J. Climatol., 25, 865–879, 2005a.
Ishii, M., Shouji, A., Sugimoto, S., and Matsumoto, T.: Objective analyses of sea-surface temperature and marine meteorological variables for the 20th century using ICOADS and the Kobe collection, NOAA [data set], https://psl.noaa.gov/data/gridded/data.cobe.html(last access: 21 February 2023), 2005b.
Juneng, L. and Tangang, F. T.: Evolution of ENSO-related rainfall anomalies in Southeast Asia region and its relationship with atmosphere-ocean variations in Indo-Pacific sector, Clim. Dynam., 25, 337–350, https://doi.org/10.1007/s00382-005-0031-6, 2005.
Kalnay, E., Kanamitsu, M., Kistler, R., Collins, W., Deaven, D., Gandin, L., Iredell, M., Saha, S., White, G., Woollen, J., Zhu, Y., Chelliah, M., Ebisuzaki, W., Higgins, W., Janowiak, J., Mo, K. C., Ropelewski, C., Wang, J., Leetmaa, A., Reynolds, R., Jenne, R., and Joseph, D.: The NCEP/NCAR 40-year reanalysis project, B. Am. Meteorol. Soc., 77, 437–471, https://doi.org/10.1175/1520-0477(1996)077<0437:Tnyrp>2.0.Co;2, 1996a.
Kalnay, E., Kanamitsu, M., Kistler, R., Collins, W., Deaven, D., Gandin, L., Iredell, M., Saha, S., White, G., Woollen, J., Zhu, Y., Chelliah, M., Ebisuzaki, W., Higgins, W., Janowiak, J., Mo, K. C., Ropelewski, C., Wang, J., Leetmaa, A., Reynolds, R., Jenne, R., and Joseph, D.: The NCEP/NCAR 40-year reanalysis project, NOAA [data set], https://psl.noaa.gov/data/gridded/data.ncep.reanalysis.html (last access: 21 February 2023), 1996b.
Lesk, C., Rowhani, P., and Ramankutty, N.: Influence of extreme weather disasters on global crop production, Nature, 529, 84–87, https://doi.org/10.1038/nature16467, 2016.
Li, H., Chen, H., Wang, H., Sun, J., and Ma, J.: Can Barents Sea ice decline in spring enhance summer hot drought events over northeastern China?, J. Climate, 31, 4705–4725, 2018.
Li, Y., Zhang, L., and Wang, B.: Contributions of Local and Remote Water Vapor Transport to Precipitation Variations over Songhua River Basin, Chinese J. Atmos. Sci., 44, 611–624, 2020.
Li, Y. H., Yuan, X., Zhang, H. S., Wang, R. Y., Wang, C. H., Meng, X. H., Zhang, Z. Q., Wang, S. S., Yang, Y., Han, B., Zhang, K., Wang, X. P., Zhao, H., Zhou, G. S., Zhang, Q., He, Q., Guo, N., Hou, W., Zhang, C. J., Xiao, G. J., Sun, X. Y., Yue, P., Sha, S., Wang, H. L., Zhang, T. J., Wang, J. S., and Yao, Y. B.: Mechanisms and Early Warning of Drought Disasters: Experimental Drought Meteorology Research over China, B. Am. Meteorol. Soc., 100, 673–687, https://doi.org/10.1175/bams-d-17-0029.1, 2019.
Liu, G. and Wen, K.: Chinese Meteorological Disasters Ceremony (Inner Mongolia Volume), Meteorology, Beijing, China, 288–308, 2008.
Liu, N., Liu, Y., Bao, G., Bao, M., Wang, Y. C., Zhang, L. Z., Ge, Y. X., Bao, W., and Tian, H.: Drought reconstruction in eastern Hulun Buir steppe, China and its linkages to the sea surface temperatures in the Pacific Ocean, J. Asian Earth Sci., 115, 298–307, https://doi.org/10.1016/j.jseaes.2015.10.009, 2016.
Mann, M. E. and Lees, J. M.: Robust estimation of background noise and signal detection in climatic time series, Climatic Change, 33, 409–445, 1996.
Pearson, C., Salzer, M., Wacker, L., Brewer, P., Sookdeo, A., and Kuniholm, P.: Securing timelines in the ancient Mediterranean using multiproxy annual tree-ring data (vol 117, pg 8410, 2020), P. Natl. Acad. Sci. USA, 117, 8410–8415, https://doi.org/10.1073/pnas.2013168117, 2020.
Schubert, S. D., Wang, H. L., Koster, R. D., Suarez, M. J., and Groisman, P. Y.: Northern Eurasian Heat Waves and Droughts, J. Climate, 27, 3169–3207, https://doi.org/10.1175/jcli-d-13-00360.1, 2014.
Shang, J., Shi, Z., Gao, J., Xu, L., Lu, S., Feng, C., and Wang, L.: Response of tree-ring width of Pinus sylvestris var.mongolica to climate change in Hulunbuir sand land,China, Acta Ecolog. Sin., 32, 1077–1084, 2012.
Song, L., Liu, B., Zhang, H., and Liu, Y.: Response of Pinus sylvestris var. mongolica Tree-ring Width to Climate Change in Hulunbuir Sandy Land, China, J. N.-E. Forest. Univers., 43, 17–22, 2015.
Sun, J. Y., Liu, Y., Sun, B., and Wang, R. Y.: Tree-ring based PDSI reconstruction since 1853 AD in the source of the Fenhe river basin, Shanxi province, China, Sci. China-Earth Sci., 55, 1847–1854, https://doi.org/10.1007/s11430-012-4369-4, 2012.
Trenberth, K. E., Dai, A. G., van der Schrier, G., Jones, P. D., Barichivich, J., Briffa, K. R., and Sheffield, J.: Global warming and changes in drought, Nat. Clim. Change, 4, 17–22, https://doi.org/10.1038/nclimate2067, 2014.
Wang, H. J.: The instability of the East Asian summer monsoon – ENSO relations, Adv. Atmos. Sci., 19, 1–11, 2002.
Wang, H. J. and He, S. P.: The North China/Northeastern Asia Severe Summer Drought in 2014, J. Climate, 28, 6667–6681, https://doi.org/10.1175/jcli-d-15-0202.1, 2015.
Wang, L. Y., Yuan, X., Xie, Z. H., Wu, P. L., and Li, Y. H.: Increasing flash droughts over China during the recent global warming hiatus, Sci. Rep., 6, 30571, https://doi.org/10.1038/srep30571, 2016.
Wang, S. S., Yuan, X., and Li, Y. H.: Does a Strong El Nino Imply a Higher Predictability of Extreme Drought?, Sci. Rep., 7, 40741, https://doi.org/10.1038/srep40741, 2017.
Wang, X., Zhang, C., Hasi, E., and Dong, Z.: Has the Three Norths Forest Shelterbelt Program solved the desertification and dust storm problems in arid and semiarid China?, J. Arid Environ., 74, 13–22, 2010.
Wu, R. G., Hu, Z. Z., and Kirtman, B. P.: Evolution of ENSO-related rainfall anomalies in East Asia, J. Climate, 16, 3742–3758, https://doi.org/10.1175/1520-0442(2003)016<3742:Eoerai>2.0.Co;2, 2003.
Xu, Z. Q., Fan, K., and Wang, H. J.: Role of sea surface temperature anomalies in the tropical Indo-Pacific region in the northeast Asia severe drought in summer 2014: month-to-month perspective, Clim. Dynam., 49, 1631–1650, https://doi.org/10.1007/s00382-016-3406-y, 2017.
Yu, R. C., Wang, B., and Zhou, T. J.: Tropospheric cooling and summer monsoon weakening trend over East Asia, Geophys. Res. Lett., 31, L22212, https://doi.org/10.1029/2004gl021270, 2004.
Yuan, X. and Wood, E. F.: Multimodel seasonal forecasting of global drought onset, Geophys. Res. Lett., 40, 4900–4905, https://doi.org/10.1002/grl.50949, 2013.
Zeng, D. W., Yuan, X., and Roundy, J. K.: Effect of Teleconnected Land-Atmosphere Coupling on Northeast China Persistent Drought in Spring–Summer of 2017, J. Climate, 32, 7403–7420, https://doi.org/10.1175/jcli-d-19-0175.1, 2019.
Zhang, D. E.: A compendium of Chinese meteorological records of the last 3000 years, Jiangsu Education House, Nanjing, ISBN 9787806434680, 2004.
Zhang, G. L., Xu, X. L., Zhou, C. P., Zhang, H. B., and Ouyang, H.: Responses of grassland vegetation to climatic variations on different temporal scales in Hulun Buir Grassland in the past 30 years, J. Geogr. Sci., 21, 634–650, https://doi.org/10.1007/s11442-011-0869-y, 2011.
Zhang, L., Fang, X., Ren, G., and Suo, X.: Environmental changes in the North China farming-grazing transitional zone, Earth Sci. Front., 4, 127–134, 1997.
Zhang, Y., Zhang, L., Wang, S., and Feng, J.: Drought events and their influence in summer of 2017 in China, J. Arid Meteorol., 35, 899–905, 2017.
Zhao, X. E., Fang, K. Y., Chen, F., Martín, H., and Roig, F. A.: Reconstructed Jing River streamflow from western China: A 399-year perspective for hydrological changes in the Loess Plateau, J. Hydrol., 621, 129573, https://doi.org/10.1016/j.jhydrol.2023.129573, 2023.
Zhao, Y. and Zhou, T. J.: Interannual Variability of Precipitation Recycle Ratio Over the Tibetan Plateau, J. Geophys. Res.-Atmos., 126, e2020JD033733, https://doi.org/10.1029/2020jd033733, 2021.