the Creative Commons Attribution 4.0 License.
the Creative Commons Attribution 4.0 License.
 | 17 Oct 2023
Spatiotemporal Intertropical Convergence Zone dynamics during the last 3 millennia in northeastern Brazil and related impacts in modern human history
Giselle Utida
Francisco W. Cruz
Mathias Vuille
Angela Ampuero
Valdir F. Novello
Jelena Maksic
Gilvan Sampaio
Hai Cheng
Haiwei Zhang
Fabio Ramos Dias de Andrade
R. Lawrence Edwards
Changes in tropical precipitation over the past millennia have usually been associated with latitudinal displacements of the Intertropical Convergence Zone (ITCZ). Recent studies provide new evidence that contraction and expansion of the tropical rain belt may also have contributed to ITCZ variability on centennial timescales. Over tropical South America few records point to a similar interpretation, which prevents a clear diagnosis of ITCZ changes in the region. In order to improve our understanding of equatorial rain belt variability, our study presents a reconstruction of precipitation for the last 3200 years from the northeastern Brazil (NEB) region, an area solely influenced by ITCZ precipitation. We analyze oxygen isotopes in speleothems that serve as a faithful proxy for the past location of the southern margin of the ITCZ. Our results, in comparison with other ITCZ proxies, indicate that the range of seasonal migration, contraction, and expansion of the ITCZ was not symmetrical around the Equator on secular and multidecadal timescales. A new NEB ITCZ pattern emerges based on the comparison between two distinct proxies that characterize the ITCZ behavior during the last 2500 years, with an ITCZ zonal pattern between NEB and the eastern Amazon. In NEB, the period related to the Medieval Climate Anomaly (MCA – 950 to 1250 CE) was characterized by an abrupt transition from wet to dry conditions. These drier conditions persisted until the onset of the period corresponding to the Little Ice Age (LIA) in 1560 CE, representing the longest dry period over the last 3200 years in NEB. The ITCZ was apparently forced by teleconnections between Atlantic and Pacific that controlled the position, intensity, and extent of the Walker cell over South America, changing the zonal ITCZ characteristics, while sea surface temperature changes in both the Pacific and Atlantic stretched or weakened the ITCZ-related rainfall meridionally over NEB. Wetter conditions started around 1500 CE in NEB. During the last 500 years, our speleothems document the occurrence of some of the strongest drought events over the last centuries, which drastically affected population and environment of NEB during the Portuguese colonial period. The historical droughts were able to affect the karst system and led to significant impacts over the entire NEB region.
- Article
(5267 KB) - Full-text XML
-
Supplement
(1751 KB) - BibTeX
- EndNote


Northeastern Brazil (NEB) is one of the areas in South America (SA) most vulnerable to the impacts of climate change. The semi-arid conditions in NEB are strongly affected by precipitation variability, and since the 18th century the region has experienced more frequent drought events (Marengo and Bernasconi, 2015; Lima and Magalhães, 2018). Today the frequent droughts put ∼57 million people, ∼27 % of the Brazilian population, at risk of experiencing water scarcity (Marengo and Bernasconi, 2015; Lima and Magalhães, 2018). Aside from native people, the region has been occupied since the Portuguese colonization in the 16th century, and the ensuing intense agricultural activity has been responsible for a large-scale degradation of the Caatinga biome, the typical vegetation of NEB's semi-arid areas. This land mismanagement and the increasing frequency of regional droughts has put some of these areas at great risk of desertification (Marengo and Bernasconi, 2015; Sampaio et al., 2020). Advancing our knowledge about NEB's climate and recurrence of extreme events in a long-term context is therefore of great importance to better anticipate the impacts of these intense and abrupt drought events.
The Intertropical Convergence Zone (ITCZ) is one of the key elements responsible for precipitation over NEB, which also indirectly affects the South American Summer Monsoon (SASM). When the ITCZ is in its southernmost position during austral autumn, northern areas of NEB experience increased precipitation (Schneider et al., 2014), while the precipitation in the southern areas of NEB occurs mainly during austral summer in response to climatic conditions in the tropical South Atlantic (Vera et al., 2006; Vuille et al., 2012). Although these systems are independent and arise in different seasons, the position of the ITCZ affects SASM intensity and its development through moisture influx to the continent (Vuille et al., 2012; Schneider et al., 2014).
On orbital to centennial timescales, weakened precipitation in NEB has been associated with enhanced subsidence over NEB during intense SASM periods (Cruz et al., 2009; Orrison et al., 2022), giving rise to a zonal dipole between the western Amazon and NEB (Cruz et al., 2009; Novello et al., 2018). This mode also operates today on interannual and seasonal timescales (Lenters and Cook, 1997; Sulca et al., 2016).
More recent studies suggested that these variations on millennial and centennial timescales in NEB may also have been caused by contraction or expansion of the tropical rain belt affecting the precipitation over South America (Utida et al., 2019; Chiessi et al., 2021). These ITCZ dynamics would be forced by changes in tropical Atlantic and Pacific sea surface temperature (SST) and related atmospheric circulation changes (e.g., Lechleitner et al., 2017; Utida et al., 2019; Chiessi et al., 2021; Steinman et al., 2022). These results suggest complex ITCZ dynamics operating over NEB; a region where the lack of studies complicates the paleoclimate interpretations for the last millennia.
In comparison with the ITCZ, the SASM has received more attention from recent studies, mainly due to its larger area of influence in SA, extending from the tropical Andes to the Amazon and southeastern SA (e.g., Apaéstegui et al., 2018; Azevedo et al., 2019; Della Libera et al., 2022). Rainfall variability over southern northeastern Brazil (S-NEB) is also determined by the dynamics of the South Atlantic Convergence Zone (SACZ), a component of the SASM (Novello et al., 2018; Zilli et al., 2019; Wong et al., 2021). The spatiotemporal precipitation variability over tropical SA during the Common Era (CE) was evaluated based on a network of high-resolution proxy records (Novello et al., 2018; Campos et al., 2019; Orrison et al., 2022). These studies point to an association between SASM variability and the latitudinal displacement of the ITCZ and SACZ, although changes in the latitude of the ITCZ during the last millennia are not well established.
Previous studies based on oxygen and hydrogen isotopes from paleorecords obtained in NEB have served as useful proxies for ITCZ precipitation in the region (Cruz et al., 2009; Novello et al., 2012; Utida et al., 2019), while carbon isotopes have been used to interpret soil erosion and production and vegetation cover in different biomes of Brazil (Utida et al., 2020; Azevedo et al., 2021; Novello et al., 2021).
For the past 4200 years, NEB has experienced semi-arid conditions (Cruz et al., 2009; Utida et al., 2020) that were imprinted on the oxygen isotope signals recorded in stalagmites. These drier conditions in NEB could have resulted in a seasonal bias toward the δ18O rainfall of recharge periods or an evaporative fractionation of stored karst water (Baker et al., 2019). In addition, isotopic fractionation processes associated with different karst architectures can affect the stalagmite δ18O signals (Treble et al., 2022). Unfortunately, cave monitoring in northern NEB is not available due to the scarcity of modern dripping water, probably as a result of increasing droughts in the region in the last decades (Marengo and Bernasconi, 2015). Because of this, the interpretation of oxygen isotopes in the region has been challenging.
Although the hydrological processes occurring in the epikarst may affect the fractionation of oxygen isotope values in the dripping water and thus control δ18O recorded in stalagmites on a global scale, previous studies mentioned above suggest a strong relationship with rainfall amount based on model results and comparison with other regional and global records.
Building on these recent advances, we present an ITCZ precipitation reconstruction based on stalagmite records from the state of Rio Grande do Norte (RN), located at the modern southernmost limit of the ITCZ in eastern SA (Fig. 1). By using oxygen isotopes obtained from these stalagmites, we reconstruct precipitation based on field correlations between precipitation amount and oxygen isotopic composition of modern rainfall and by using carbon isotopes to reconstruct vegetation and soil cover over the last 3200 years over NEB. These data are essential to fill the gap of high-resolution records in NEB and to improve the interpretation of ITCZ dynamics over SA and how they are related to SASM variability during the CE.
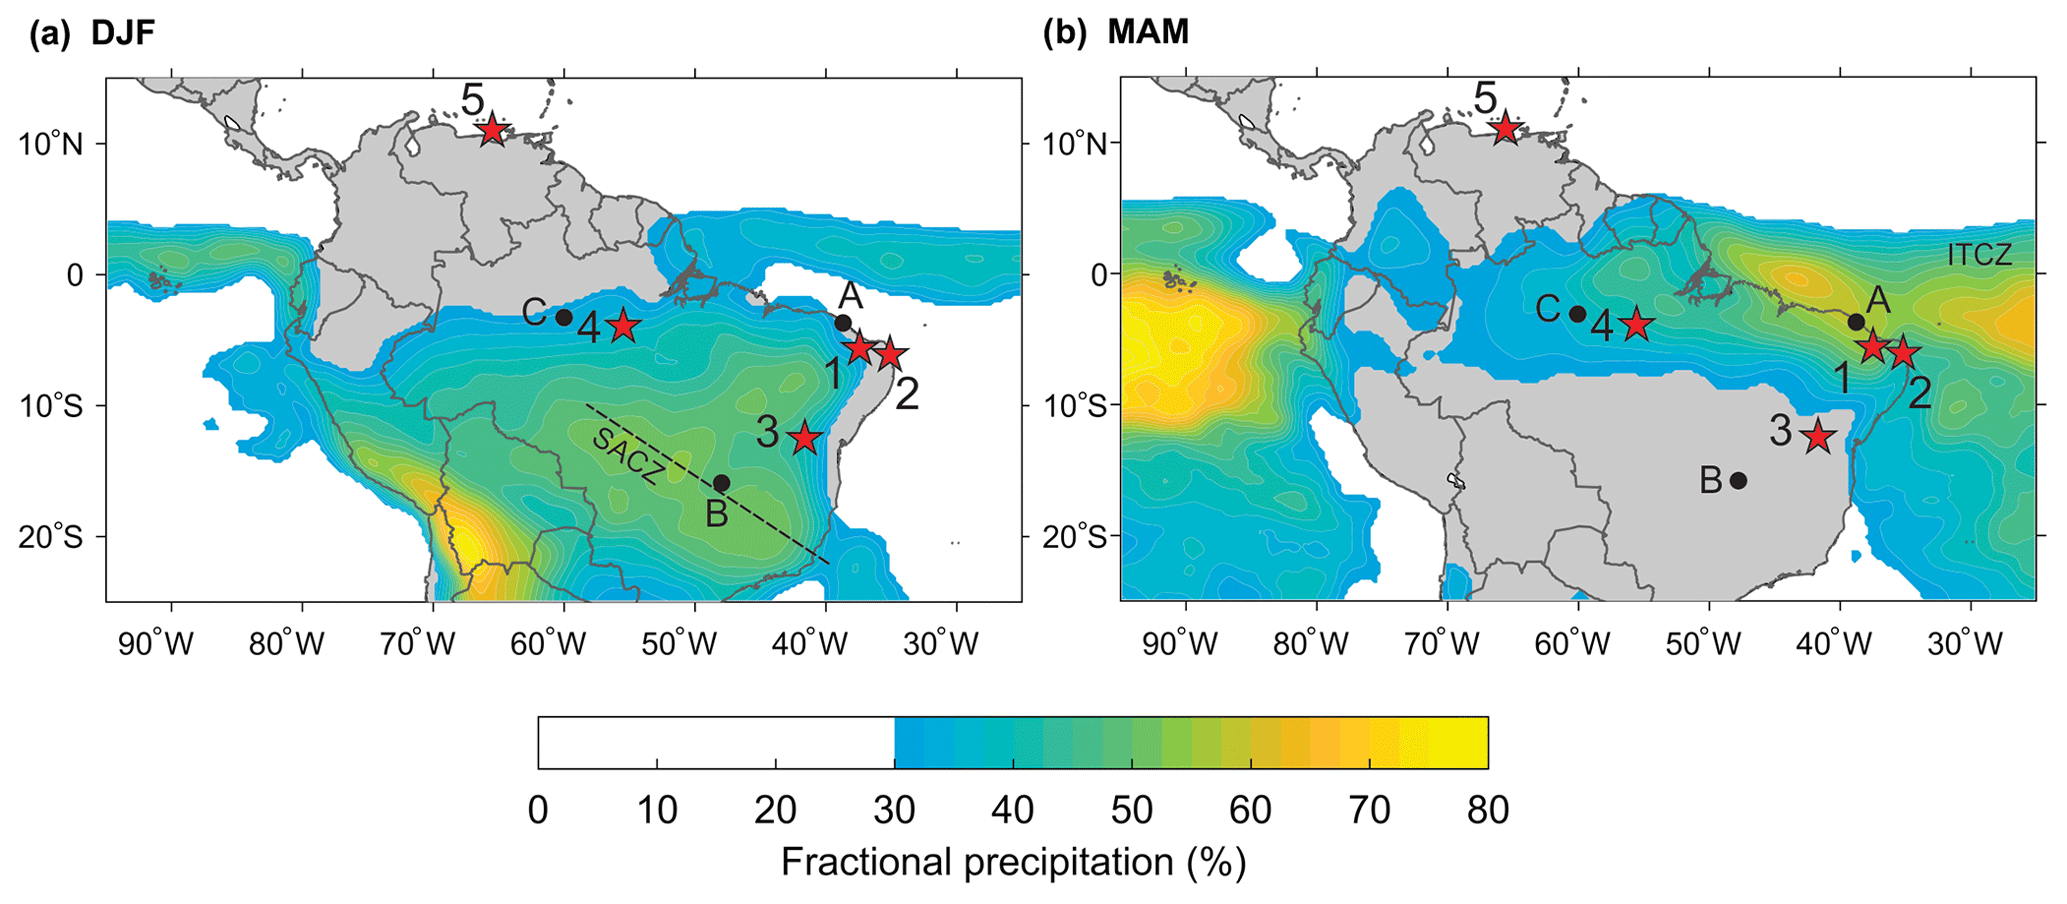
Figure 1Location and precipitation climatology of study sites during the austral summer (DJF – December to February) and autumn (MAM – March to May). Color shading indicates percentage of the annual precipitation total that is received during either DJF or MAM and highlights the extent of (a) SASM over the continent and (b) the ITCZ over the ocean. Precipitation data from the Global Precipitation Measurement (GPM) mission, with averages calculated over the period 2001–2020. (1) Trapiá and Furna Nova Cave at Pedra das Abelhas Station (this study), (2) Boqueirão Lake (Utida et al., 2019), (3) Diva de Maura Cave (Novello et al., 2012), (4) Paraíso Cave (Wang et al., 2017), and (5) Cariaco Basin (Haug et al., 2001). GNIP stations are (A) Fortaleza, (B) Brasília, and (C) Manaus.
2.1 Study area
We study stalagmites from two caves located in the Rio Grande do Norte state in northern NEB (Fig. 1), Trapiá and Furna Nova Cave. The caves were developed in the Cretaceous carbonate rocks of the Jandaíra Formation, Potiguar Basin, close to the Apodi River valley in a region of exposed karst pavements (Pessoa-Neto, 2003; Melo et al., 2016; Silva et al., 2017). We collected speleothems in Trapiá and Furna Nova caves. Trapiá Cave (5∘33′45.43′′ S, 37∘37′15.92′′ W) is a 2330 m long cave with 29 m of bedrock above the cave cavity. This cave is located 90 km from the Atlantic coast and ∼50 m above sea level, with temperature and relative humidity of 28.5 ∘C and 100 %, respectively, in the chamber. Furna Nova Cave (5∘2′3.22′′ S, 37∘34′16′′ W) is located 60 km north of Trapiá Cave, 45 km from the Atlantic coast and ∼95 m above sea level. The cave is 239.3 m long, with 29.8 m of bedrock above the cave cavity. Its temperature and relative humidity in the speleothem chamber are 25 ∘C and 95.0 %, respectively.
The annual mean temperature in the region is around 28 ∘C for the period from 1961 to 1990 (INMET – Instituto Nacional de Meteorologia, 2021), and the average precipitation is approximately 730 mm yr−1, concentrated in the period between March and May, during the southernmost position of the ITCZ (Agência Nacional de Águas – ANA – National Agency of Waters, 2013; Ziese et al., 2018). Caatinga dry forest is the typical vegetation of the region. It is adapted to short rainy seasons of 3 to 4 months in length and tolerates large interannual variations in precipitation. It is characterized by sparse dry forest, dominated by arboreal deciduous shrubland (Erasmi et al., 2009).
2.2 Climatology
The drylands of NEB extend from 2.5 to 16.1∘ S and from 34.8 to 46∘ W, with an area of about 1 542 000 km2, representing 18.26 % of the Brazilian territory (Marengo and Bernasconi, 2015). Although the whole area is classified as semi-arid and has faced intense droughts, especially influenced by El Niño, there are significant differences in climatic systems between the northern and southern sectors of NEB. Furthermore, the NEB eastern coastal sector is characterized by a different rainfall seasonality, receiving more rainfall across the year, as the climate in this region is modulated by the sea breeze circulation and easterly wave disturbances during June and July (Gomes et al., 2015; Marengo and Bernasconi, 2015; Utida et al., 2019). Northern NEB (N-NEB), where the studied caves are located, receives most of its precipitation from March to May, when the seasonal migration of the ITCZ reaches its southernmost position around 2∘ N (Schneider et al., 2014; Utida et al., 2020), and ITCZ-related precipitation extends across the Equator southward to NEB (Fig. 1). In southern-NEB (S-NEB), the precipitation occurs mainly during summer from December to February influenced by the margins of the SACZ (Fig. 1a).
The rainfall patterns over the study area were evaluated by analyzing monthly rainfall data from the Pedra das Abelhas National Agency of Water (ANA) Station – RN, located ∼1 km from the Trapiá Cave (Fig. 1), using data from 1911 to 2015 (n=103). In order to exclude possible extreme events with a known forcing, we excluded the 39 El Niño–Southern Oscillation (ENSO) years that most drastically changed the precipitation amount in NEB, following the methodology of Araújo et al. (2013).
In order to identify spatial patterns of rainfall associated with the oxygen isotope signal in northeast and central Brazil, we produced maps showing the Pearson's correlation scores between GPCC gridded precipitation anomalies (Schneider et al., 2011), based on the period 1961–1990 for December to February (DJF) and March to May (MAM) (Ziese et al., 2018), and δ18O values for IAEA-GNIP stations (International Atomic Energy Agency – Global Network of Isotopes in Precipitation, IAEA-WMO, 2021) for northern NEB (Pedra das Abelhas ANA and Fortaleza GNIP Station), southern NEB (Andaraí ANA and Brasília GNIP stations), and the Eastern Amazon (Belterra ANA and Manaus GNIP stations). The IAEA stations were chosen based on their closest proximity to sites discussed in the study: (1) Trapiá Cave and Furna Nova Cave (this study), (2) Boqueirão Lake (Utida et al., 2019), (3) Diva de Maura Cave (Novello et al., 2012), and (4) Paraíso Cave (Wang et al., 2017). Sites 1 and 2 are located in N-NEB, 3 is located in S-NEB, and 4 is located in the eastern Amazon. Four stalagmites were collected in N-NEB caves; two at Trapiá Cave, TRA5 and TRA7 that are 178 and 270 mm long, respectively (Fig. S1); and two at Furna Nova, FN1 and FN2, with a length of 202 and 95 mm, respectively (Fig. S2). The stalagmite FN1 was previously studied by Cruz et al. (2009) for chronology and oxygen isotopes. Utida et al. (2020) also studied TRA7 for chronology and carbon isotopes.
Chronological studies on speleothems were based on U–Th geochronology performed at the Laboratories of the Department of Earth and Environmental Sciences, College of Science and Engineering, University of Minnesota (USA), and at the Isotope Laboratory of the Institute of Global Environmental Change, Xi'an Jiaotong University (China), according to Cheng et al. (2013). Subsamples of ∼100 mg were obtained in clear layers, close to the growth axis trying to keep a maximum thickness of 1.5 mm, 10 mm wide, and no more than 3 mm depth. The powder samples were dissolved in 14 N HNO3 and spiked with a mixed solution of known 233U (0.78646±0.0002 pmol g−1) and 229Th (0.21686±0.0001 pmol g−1) concentration. Th and U were co-precipitated with FeCl and separated with ion exchange Spectra/Gel IE 1 × 8 resin column with 6 N HCl and super clear water, respectively. Th and U were counted using inductively coupled plasma mass spectrometry (MC-ICP-MS Thermo-Finnigan NEPTUNE PLUS), and the results were calculated in a standard spreadsheet based on Edwards et al. (1987) and Richards and Dorale (2003) using the isotopic ratios measured, machine parameters, and correction factors to eliminate effects of contamination by detrital Th to finally obtain the age of each sample. The decay constants used are λ238 (Jaffey et al., 1971), λ234 , and (Cheng et al., 2013). Corrected 230Th ages assume the initial 230Th 232Th atomic ratio of . Those are the values for a material at secular equilibrium, with the bulk Earth 232Th 238U value being 3.8 (McDonough and Sun, 1995). The ages are reported in BP (Before Present, defined as the year 1950 CE) and also converted to Common Era (CE), and age uncertainties are 2σ. We analyzed a large number of U Th ages to improve the age model and reduce the errors associated with detrital Th and recrystallization.
Age models of speleothem TRA5 and FN2 were based on 12 and 10 U Th dates, respectively (Tables S1 and S2). The FN1 chronology is based on 10 previously published U Th results obtained by Cruz et al. (2009) plus 8 additional new dates obtained for this study (Table S1). Speleothem TRA7 has 27 U Th ages that were presented in Utida et al. (2020). The individual age models for all speleothems were constructed by the software COPRA (Breitenbach et al., 2012) through a set of 2000 Monte Carlo simulations, where a random age within the ±1σ age interval was chosen each time.
For oxygen and carbon isotope analysis of the speleothems, around 200 µg of powder was drilled for each sample, consecutively at intervals of 0.1 mm (TRA5), 0.3 mm (TRA7), and 0.15 mm (FN2), with a Micromill micro-sampling device. These samples were prepared using an online automated carbonate preparation system and analyzed by a GasBench interfaced to a Thermo Finnigan Delta V Advantage at the Laboratory of Stable Isotopes (LES) at the Geoscience Institute of the University of São Paulo. Isotopes are reported in delta notation (δ18O and δ13C) relative to the Vienna Pee Dee Belemnite (VPDB) standard, with uncertainties in the reproducibility of standard materials <0.1 ‰. The isotopic profiles of TRA5, TRA7, FN1, and FN2 stalagmites consist of 443, 885, 1215, and 651 isotope samples, respectively. These datasets provide an average resolution of ∼1 year per sample for TRA5 and ∼4 years for the other speleothem records. TRA7 δ13C results were presented by Utida et al. (2020) and FN1 δ18O results by Cruz et al. (2009) using the same methods. Cruz et al. (2009) do not provide FN1 δ13C results, which were not included in this study.
Different textural characteristics of speleothem TRA5 and FN2 were identified in intervals which were analyzed for mineralogical composition based on approximately 20 mg samples with X-ray powder diffraction in a Bruker D8 diffractometer (Cu Ka, 40 kV, 40 mA, step 0.02∘, 153 s per step, scanning from 3 to 105∘ 2θ) at the NAP Geoanalítica Laboratory of the University of São Paulo. Qualitative and quantitative mineralogical analyses were performed with Match! and FullProf software using the Crystallographic Open Database (Grazulis et al., 2009). Crystallographic data for the mineral phases were taken from Pokroy et al. (1989) for aragonite and from Paquette and Reeder (1990) for calcite. Mineralogical results of TRA7 and FN1 were obtained by Utida et al. (2020) using the same method. All results are presented in weight proportion (wt %). The δ18O results of speleothems were calibrated according to the percentage of calcite identified for the interval applying the aragonite–calcite fractionation offset of 0.85 ‰ ± 0.29 ‰ (Zhang et al., 2014). The δ13C results were not corrected because the original aragonite–secondary calcite fractionation factor is negligible (∼ 0.1 ‰–0.2 ‰) (Zhang et al., 2014). Even considering the original aragonite–original calcite mean fractionation factor of 1.1 ‰ (Zhang et al., 2015), the range of δ13C RN stalagmites is very large (>8 ‰), and the correction would not affect the main interpretation.
The intra-site correlation model (iscam) was used to construct a composite record (Fohlmeister, 2012). It combined the climate records to obtain a unique age model and oxygen isotopic record, corrected only for mineralogical composition of speleothems from the state of Rio Grande do Norte, which here is referred to as the RN Composite. The age–depth modeling software was adjusted to calculate 1000 Monte Carlo simulations on absolute age determinations to find the best correlation between oxygen isotope records from Trapiá and Furna Nova speleothems, reproducing adjacent archives. The results estimate the error in the age–depth model by indicating the 68 %, 95 %, and 99 % confidence intervals obtained from evaluation of a set of 2000 first-order autoregressive processes (AR1) for each record (Table S3). This method allows for significantly reducing the age uncertainty within the overlapping periods and it can be tested if the signal of interest is indeed similar in all the records (Fohlmeister, 2012). The age data were assumed to have a Gaussian distribution and were calculated pointwise. The composite result was detrended and normalized according to the iscam method. The performance of the iscam results is affected by low quality of chronological control, low resolution, and hiatuses. Therefore, the following intervals were removed from the stalagmite records before constructing the RN Composite: FN1 0–12 mm and 187–202 mm, FN2 0–6 mm, TRA5 0–37 mm, and TRA7 222–227 mm. In addition, the FN1 record was divided into two portions: FN1a 12.14–136.99 mm and FN1b 140.15–186.87 mm that are separated by a hiatus. The chronological age–depth relationship in the overlapping parts of the individual stalagmites was modified and improved according to the iscam results of the composite record. The composite calculation rearranges the proxies in order to obtain the optimal calculated age and then calculates the average of the proxy data after normalizing the records. The RN record only contains overlapping segments between two stalagmites per period. Hence, the RN composite proxy error can be quantified as the difference between the δ18O of the stalagmites combined for any given point in time (Fig. S6).
4.1 Modern climatology and δ18O rainfall distribution
The data from Pedra das Abelhas Station reveal that in the majority of years (normal years – interquartile range) the rainy season persists from February to April, with precipitation varying from 100 to 180 mm per month, and minor contributions occurring in January and May (50–70 mm per month) (Fig. 2). During the drier years (lower quartile), February has a reduced precipitation amount, similar to the amount in January during normal years, as described above. The maximum precipitation of 90 mm per month occurs between March and April. For wetter years (upper quartile), the rainy season starts in January with more than 100 mm per month and lasts until May with almost 150 mm per month, reaching values higher than 250 mm around March. These data show that wetter years are characterized by increased precipitation amounts and a longer rainy season starting in January and ending in May, while the precipitation deficit during drought years is a result of decreased precipitation amount and a shorter rainy season, with a peak in precipitation between March and April. The anomalous length of the rainy season during dry and wet years is attributed to variations in the meridional SST gradient in the tropical Atlantic that results in a shift in the ITCZ to the north or south of its climatological position (e.g., Andreoli et al., 2011; Marengo and Bernasconi, 2015; Alvalá et al., 2019).
In S-NEB, the precipitation occurs mainly during summer, from December to February (Figs. 1a and 3b). This regional seasonality difference with N-NEB is evident in the spatial correlation map between GPCC precipitation anomalies and δ18O anomalies obtained from IAEA-GNIP for Fortaleza and Brasília stations (Fig. 3). The reddish areas on the map indicate significant negative correlations during the austral summer (DJF) and autumn (MAM) between the local precipitation δ18O signals and the regional precipitation amount. Overall, the spatial correlations indicate that in both areas the amount effect is the dominant effect on the isotopic composition of rainfall (Dansgaard, 1964). However, the isotopic signal varies seasonally and as a function of the two different circulation systems. The negative spatial correlation observed over N-NEB (Fig. 3a) suggests precipitation is dominated by ITCZ dynamics, similar to the conditions over Fortaleza, while the negative spatial correlation over S-NEB (Fig. 3b) is a result of the rainfall influenced by the SASM (Fig. 1) (Vera et al., 2006), such as in Brasília City in central Brazil. Therefore, precipitation and the associated isotopic signal are the result of ITCZ dynamics in N-NEB, while they are influenced by the SASM in the S-NEB. Accordingly, their rainfall seasonality is also different (Fig. 3), with a NDJFM peak in the south (Brasília, Fig. 3b) and a MAM rainfall peak in the north (Fortaleza, Fig. 3a).
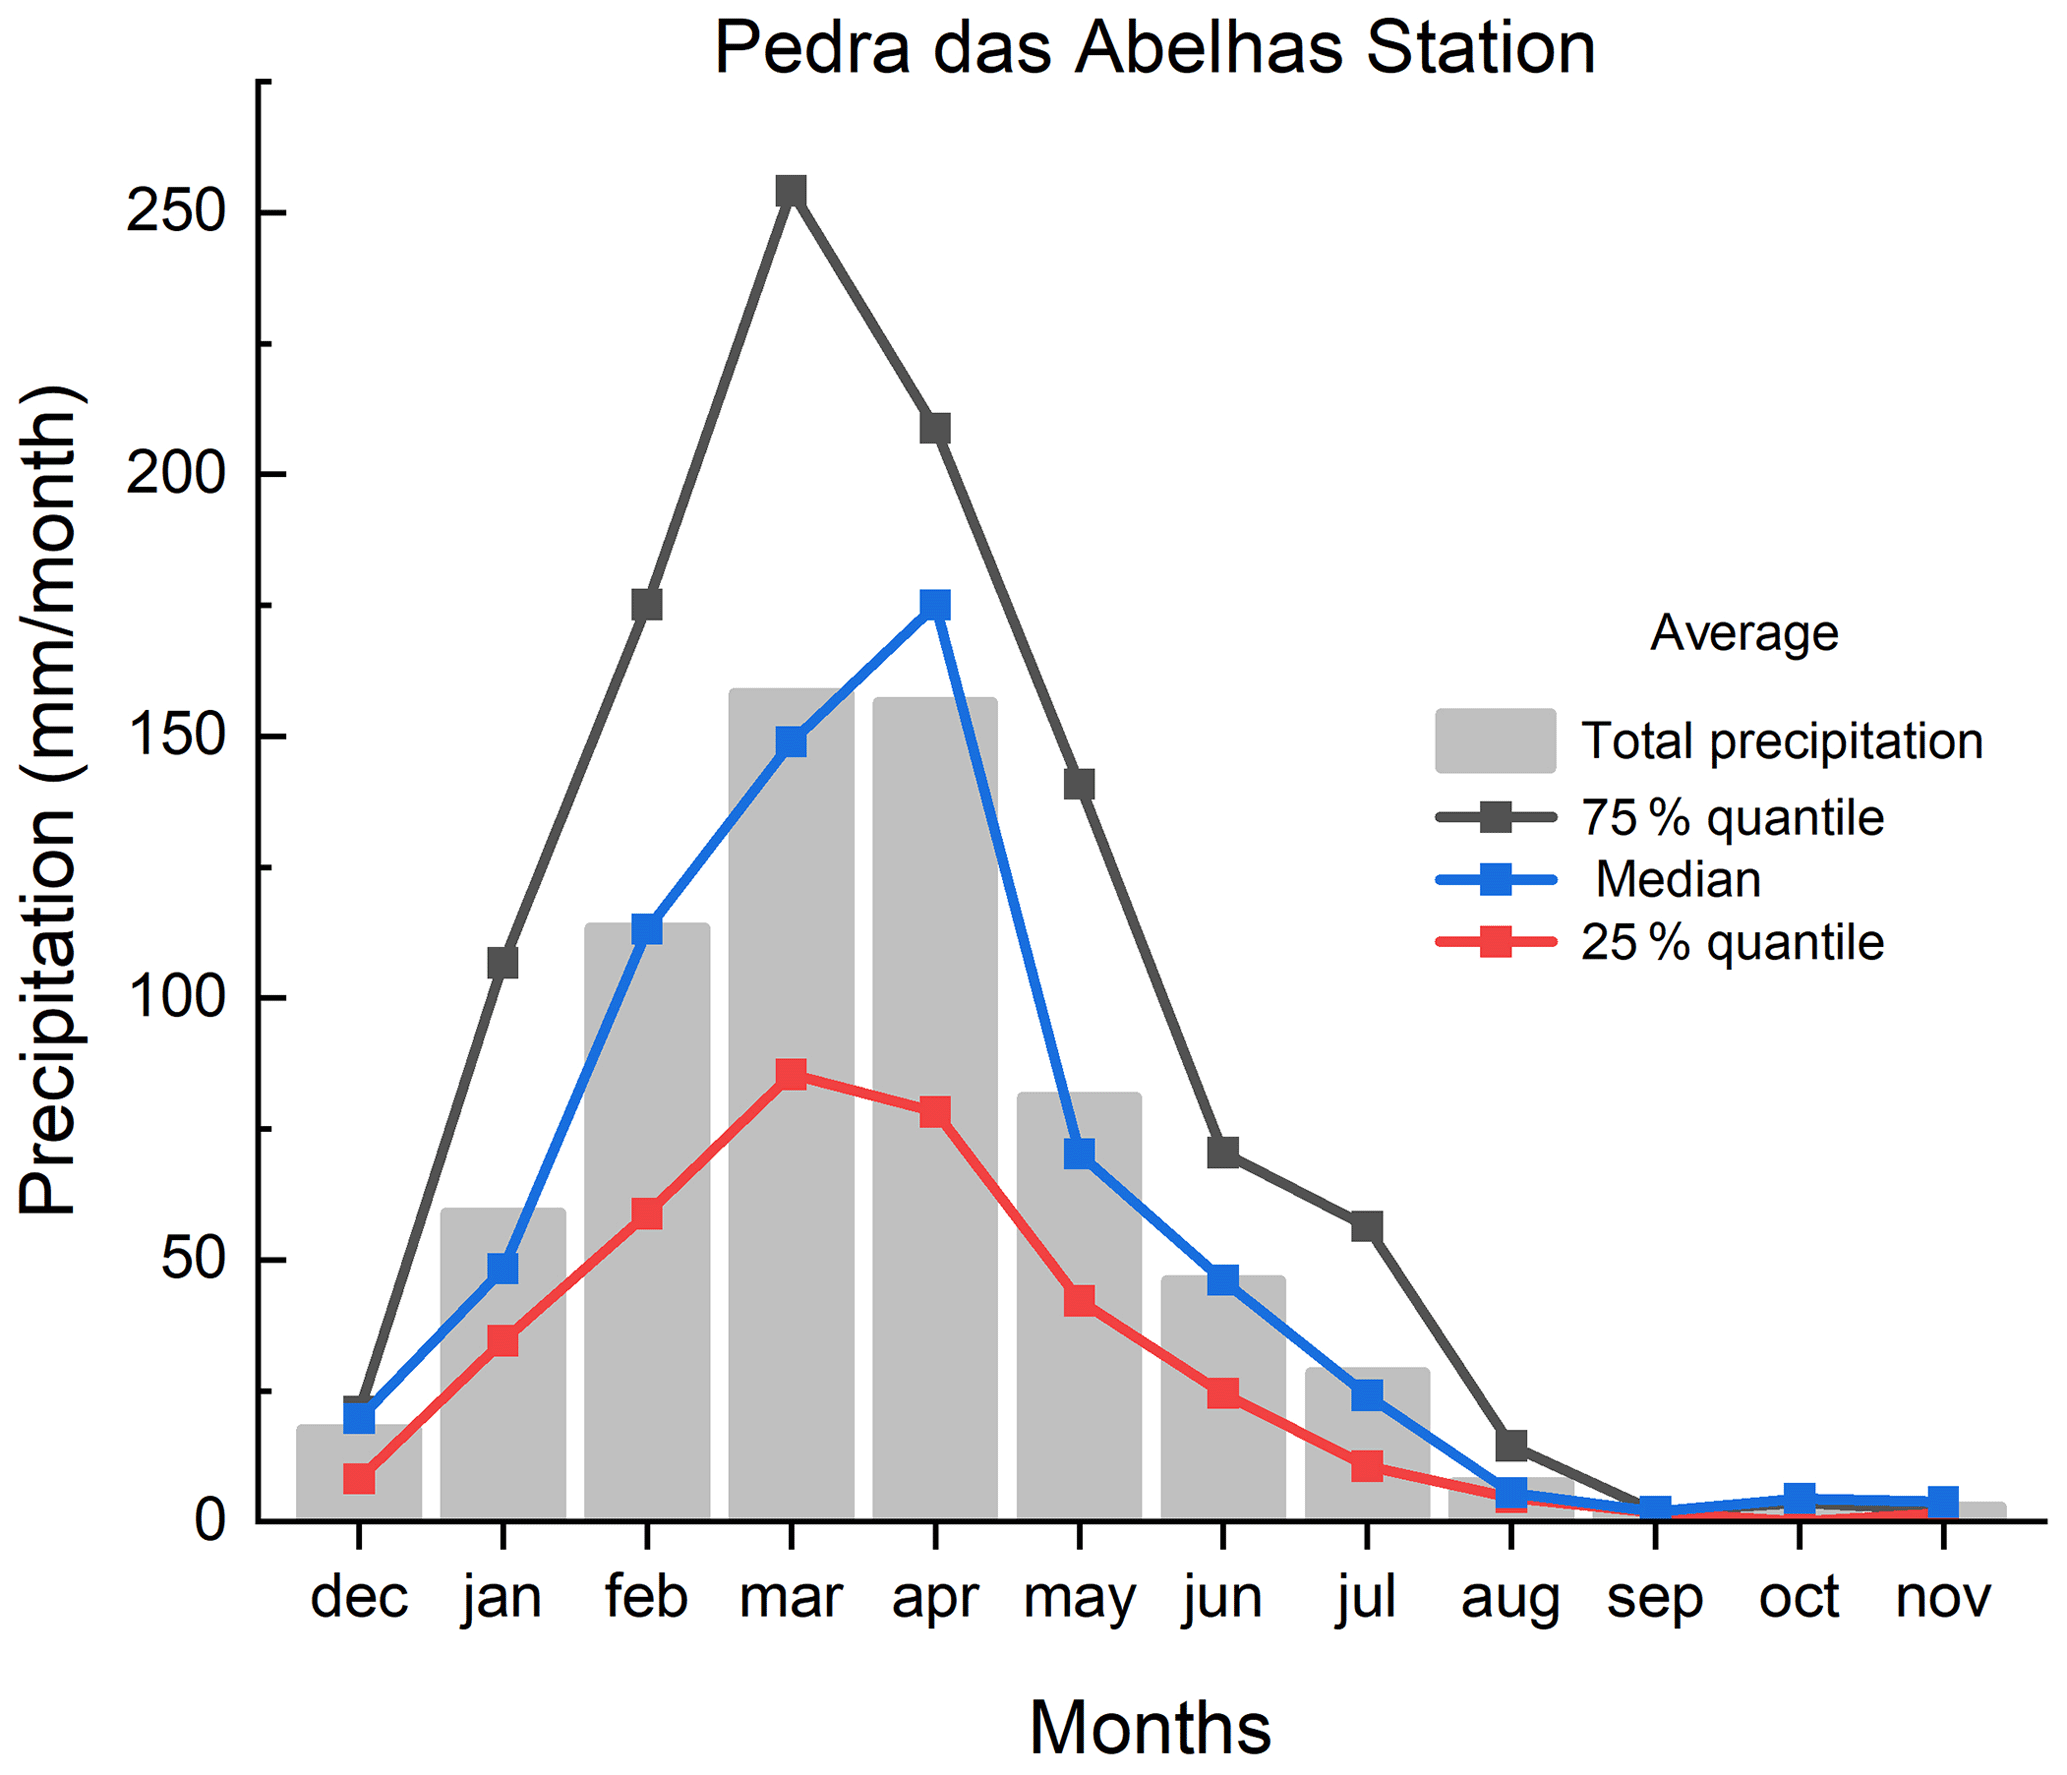
Figure 2Pedra das Abelhas ANA Station precipitation analyzed from 1911 to 2015 (n=103), excluding the strongest ENSO years (39 years), according to Araújo et al. (2013).
Another important region in SA affected by the ITCZ behavior is the eastern Amazon, west of the NEB (Figs. 1 and 3c). This region is characterized by increased precipitation during DJF and MAM and a peak in rainfall and δ18O minimum in MAM (Fig. 3c) as a result of precipitation received from the ITCZ in both summer and autumn. It can be depicted by the negative correlation between δ18O at the Manaus GNIP station and rainfall over the upstream equatorial region under direct ITCZ influence. In addition, there is only a minor influence through water recycling over the Amazon basin, due to its proximity to the coast (Wang et al., 2017).
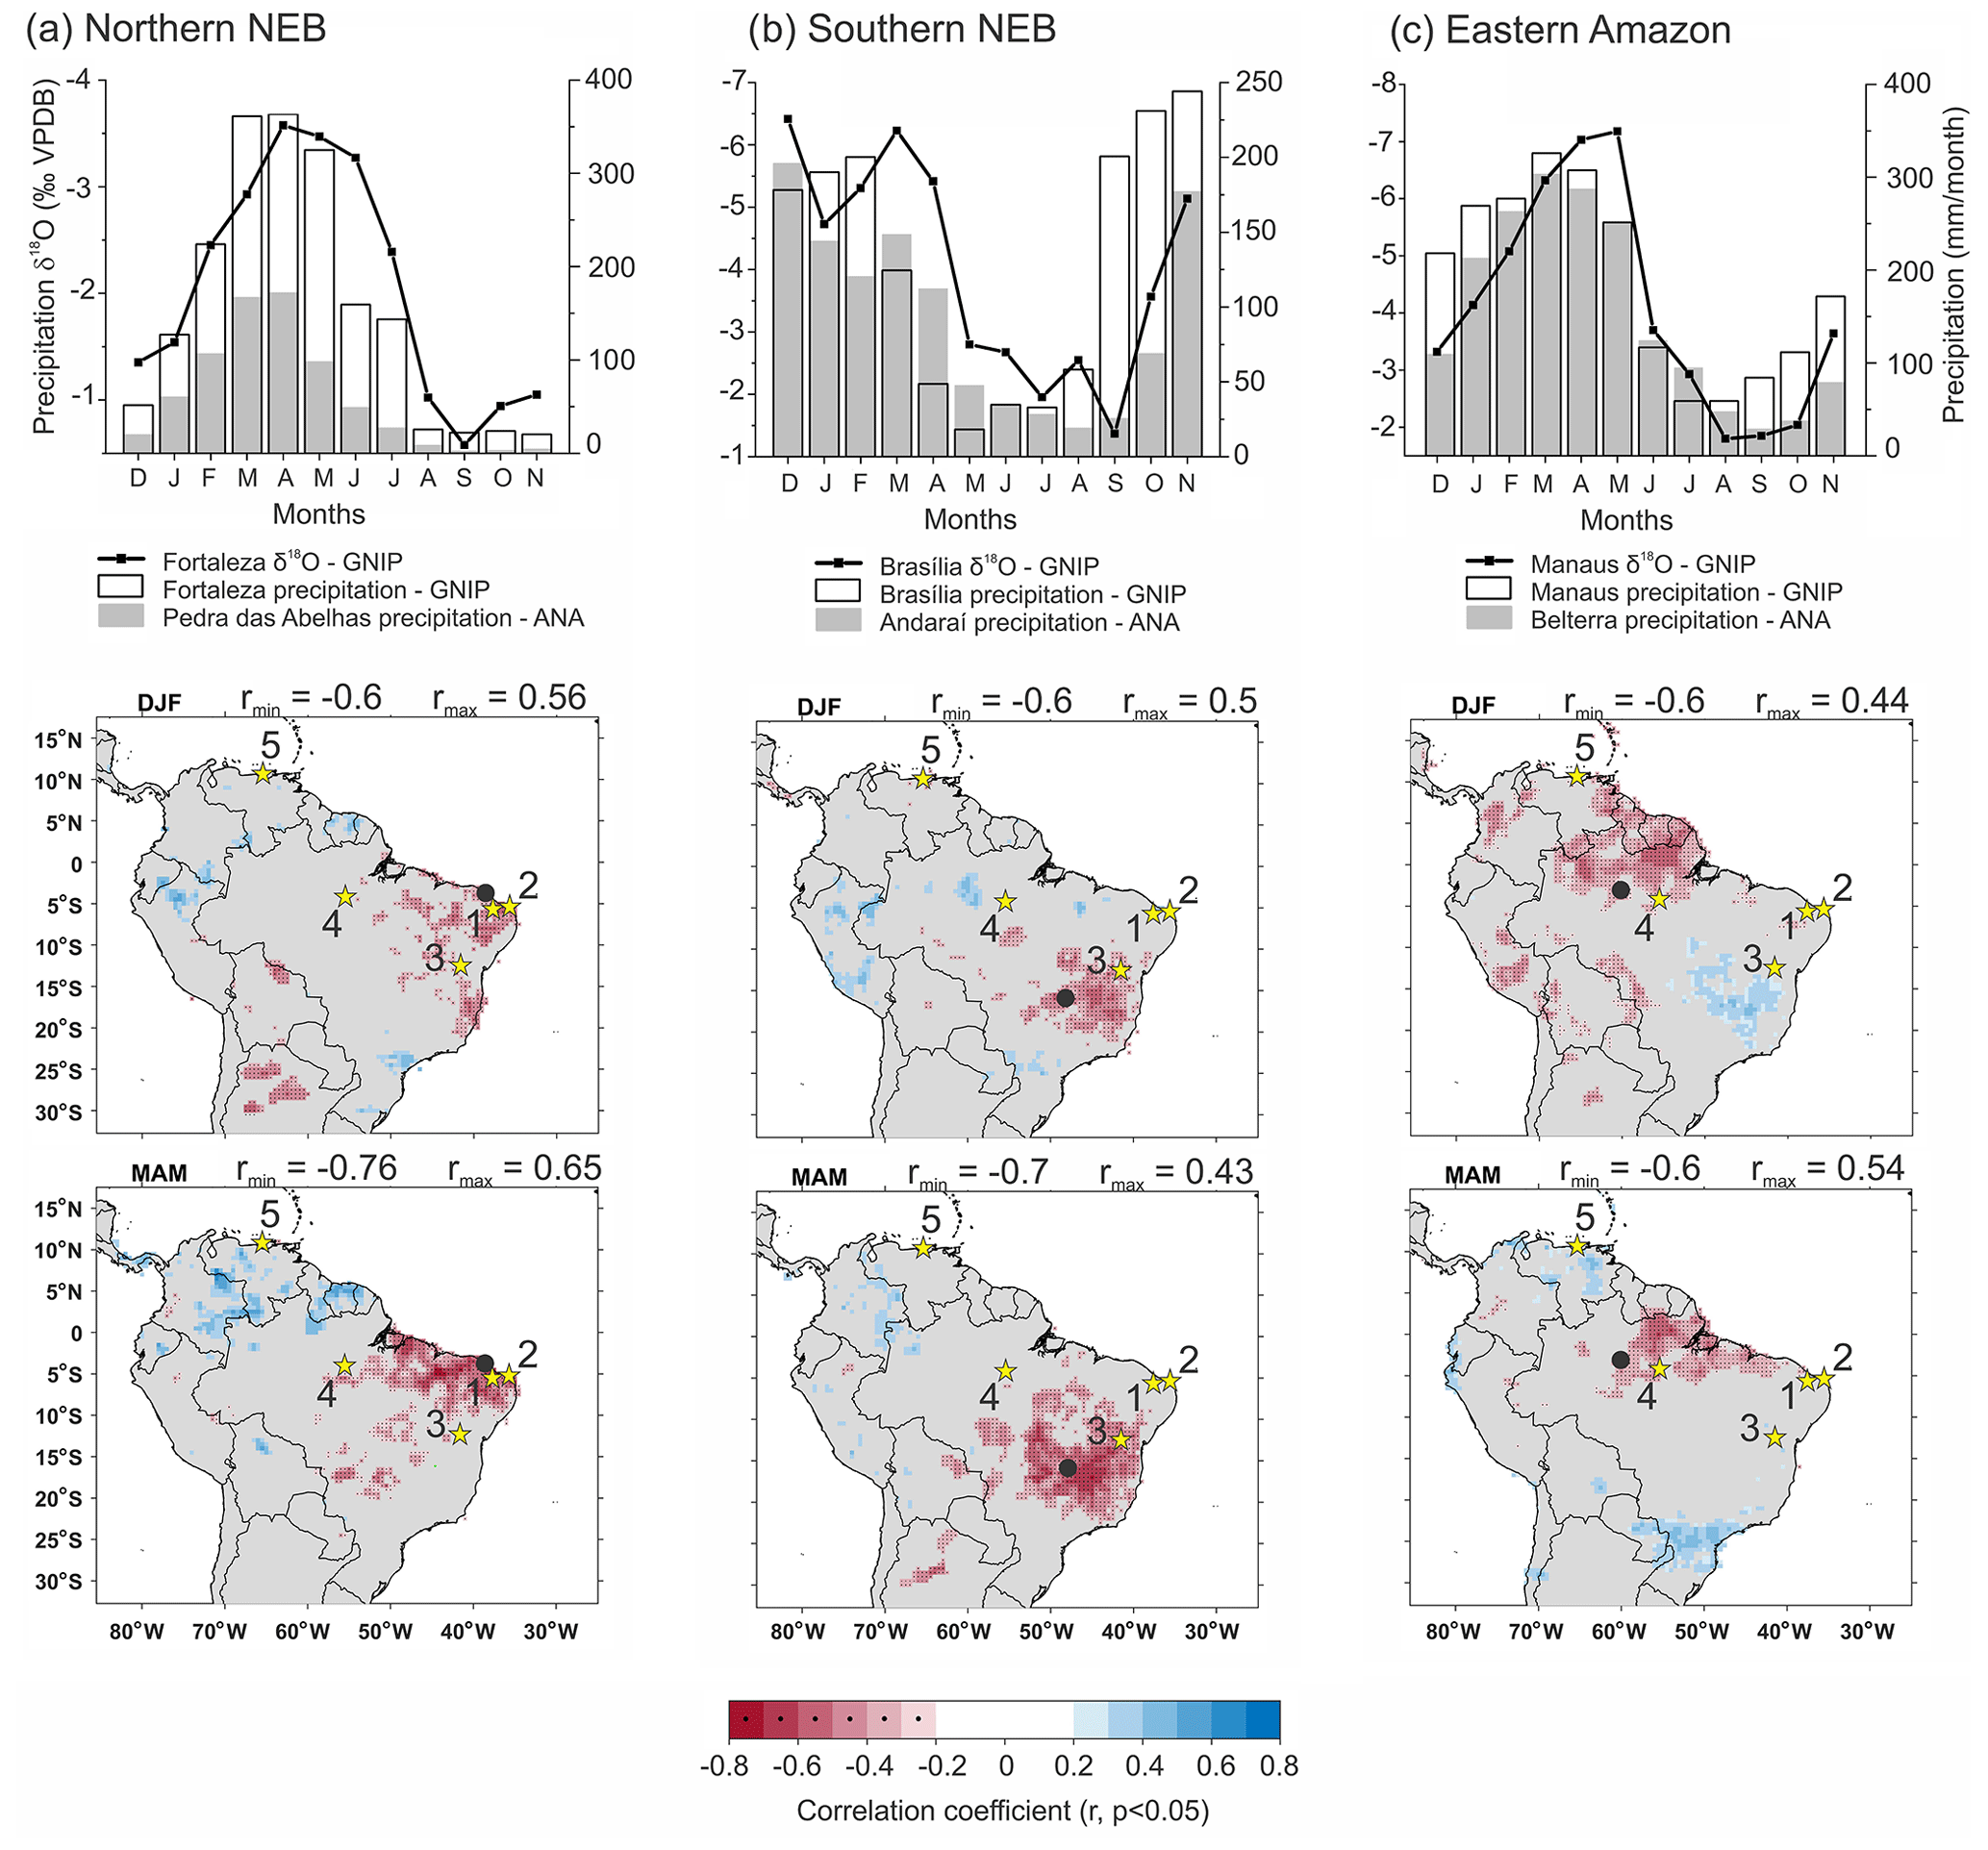
Figure 3Monthly mean observed precipitation amount collected at ANA and GNIP, δ18O values for GNIP stations (IAEA-WMO, 2021) (black dots), and correlation maps between gridded precipitation and δ18O anomalies from the same stations (black dots) for (a) northern NEB at Fortaleza and Pedra das Abelhas stations (star 1); (b) southern NEB at Brasília and Andaraí stations (star 3); and (c) eastern Amazon at Manaus and Belterra stations (star 4). The maps show the spatial correlation between δ18O anomalies at GNIP stations and GPCC gridded precipitation anomalies based on the period 1961–1990 for December to February (DJF) and March to May (MAM) for Fortaleza, Brasília, and Manaus stations (Ziese et al., 2018). The δ18O values (left y axis) and precipitation (right y axis) for each station were obtained from GNIP IAEA/WMO database. Stars indicate the site locations: (1) Trapiá Cave, Furna Nova Cave, and Pedra das Abelhas ANA Station (reference period 1910–2019); (2) Boqueirão Lake (Utida et al., 2019); (3) Diva de Maura Cave (Novello et al., 2012) and Andaraí ANA Station (reference period 1960–1986); (4) Paraíso Cave (Wang et al., 2017) and Belterra ANA Station (reference period 1975–2007); and (5) Cariaco Basin (Haug et al., 2001).
4.2 Chronology and mineralogy
The RN record covers the last 5000 years, four stalagmites cover the last 3250 years, and two of these stalagmites partially cover the time period between 3000 and 1260 Before Common Era (BCE), with the exception of one hiatus at 2100–1720 BCE (Fig. 4, Tables S1 and S2).
Stalagmite TRA7 from Trapiá Cave was deposited from 3000 to 2180 BCE (Fig. S3) with a low deposition rate (DR) of approximately 0.05 mm yr−1. After a hiatus of 1880 years, it resumed deposition from 300 BCE until 1940 CE with a DR of 0.18 mm yr−1. The TRA5 stalagmite deposition occurred continuously from 1490 to 1906 CE (Fig. S3) with a DR of 0.33 mm yr−1.
Stalagmite FN1 from Furna Nova was deposited over the last 3600 years, with a hiatus from 125 to 345 BCE and another one of approximately 100 years between 1525 and 1662 CE (Fig. S3), with an average DR of 0.09 mm yr−1. The ages from the FN1 stalagmite are all in chronological order and contain low errors and were therefore all kept in the age model. The FN2 stalagmite deposited continuously from 1226 BCE to 7 CE, except for a hiatus between 189 and 45 BCE (Fig. S3) with a DR of 0.20 mm yr−1.
The mineralogy of the stalagmites from Trapiá Cave is formed by layers of crystals with mosaic and columnar fabrics, composed exclusively of calcite, except for the base portion of TRA7 from 173 to 270 mm (3000 BCE to 130 CE), which is described as an interbedded needle-like crystals texture, composed of 87.1 % to 99 % of aragonite (Fig. S1, Table S4). The same needle-like morphology is present in most of the Furna Nova Cave stalagmites, composed of aragonite with a weight proportion greater than 85 % in FN1, extending from 0 to 83 mm (160 to 1340 CE) and from 128 to 183 mm (1730 BCE to 80 CE). In the FN2 sample this weight proportion is greater than 93.4 % (1265 BCE to 35 CE). The only interval composed of 100 % calcite is from 95 to 125 mm in FN1 (Fig. S2, Table S4). These speleothem samples show no sign of dissolution or recrystallization.
4.3 Stalagmite δ18O and δ13C
The oxygen isotope ratios of the RN record vary from −4.5 ‰ to 0.6 ‰, with δ18O mean values for each speleothem of −2.8 ‰ for TRA7, −3.5 ‰ for TRA5, −2.4 ‰ for FN1, and −1.5 ‰ for FN2. Similarities among the stalagmites are evident, especially around 1500 CE when δ18O values abruptly decrease in TRA7 and TRA5, while in FN2 this period features a hiatus (Fig. S4).
The δ18O correction due to mineralogy for the stalagmites from Furna Nova Cave resulted in changes of less than 0.1 ‰ of their mean values. The mean correction for TRA7 equals an enrichment of 0.5 ‰ during the period spanning 130 BCE to 1940 CE. Values from TRA5 were corrected along the entire sample by adding 0.85 ‰, as it is composed of 100 % calcite. Therefore, the mean values increased from −3.5 ‰ to −2.7 ‰ (Fig. S4).
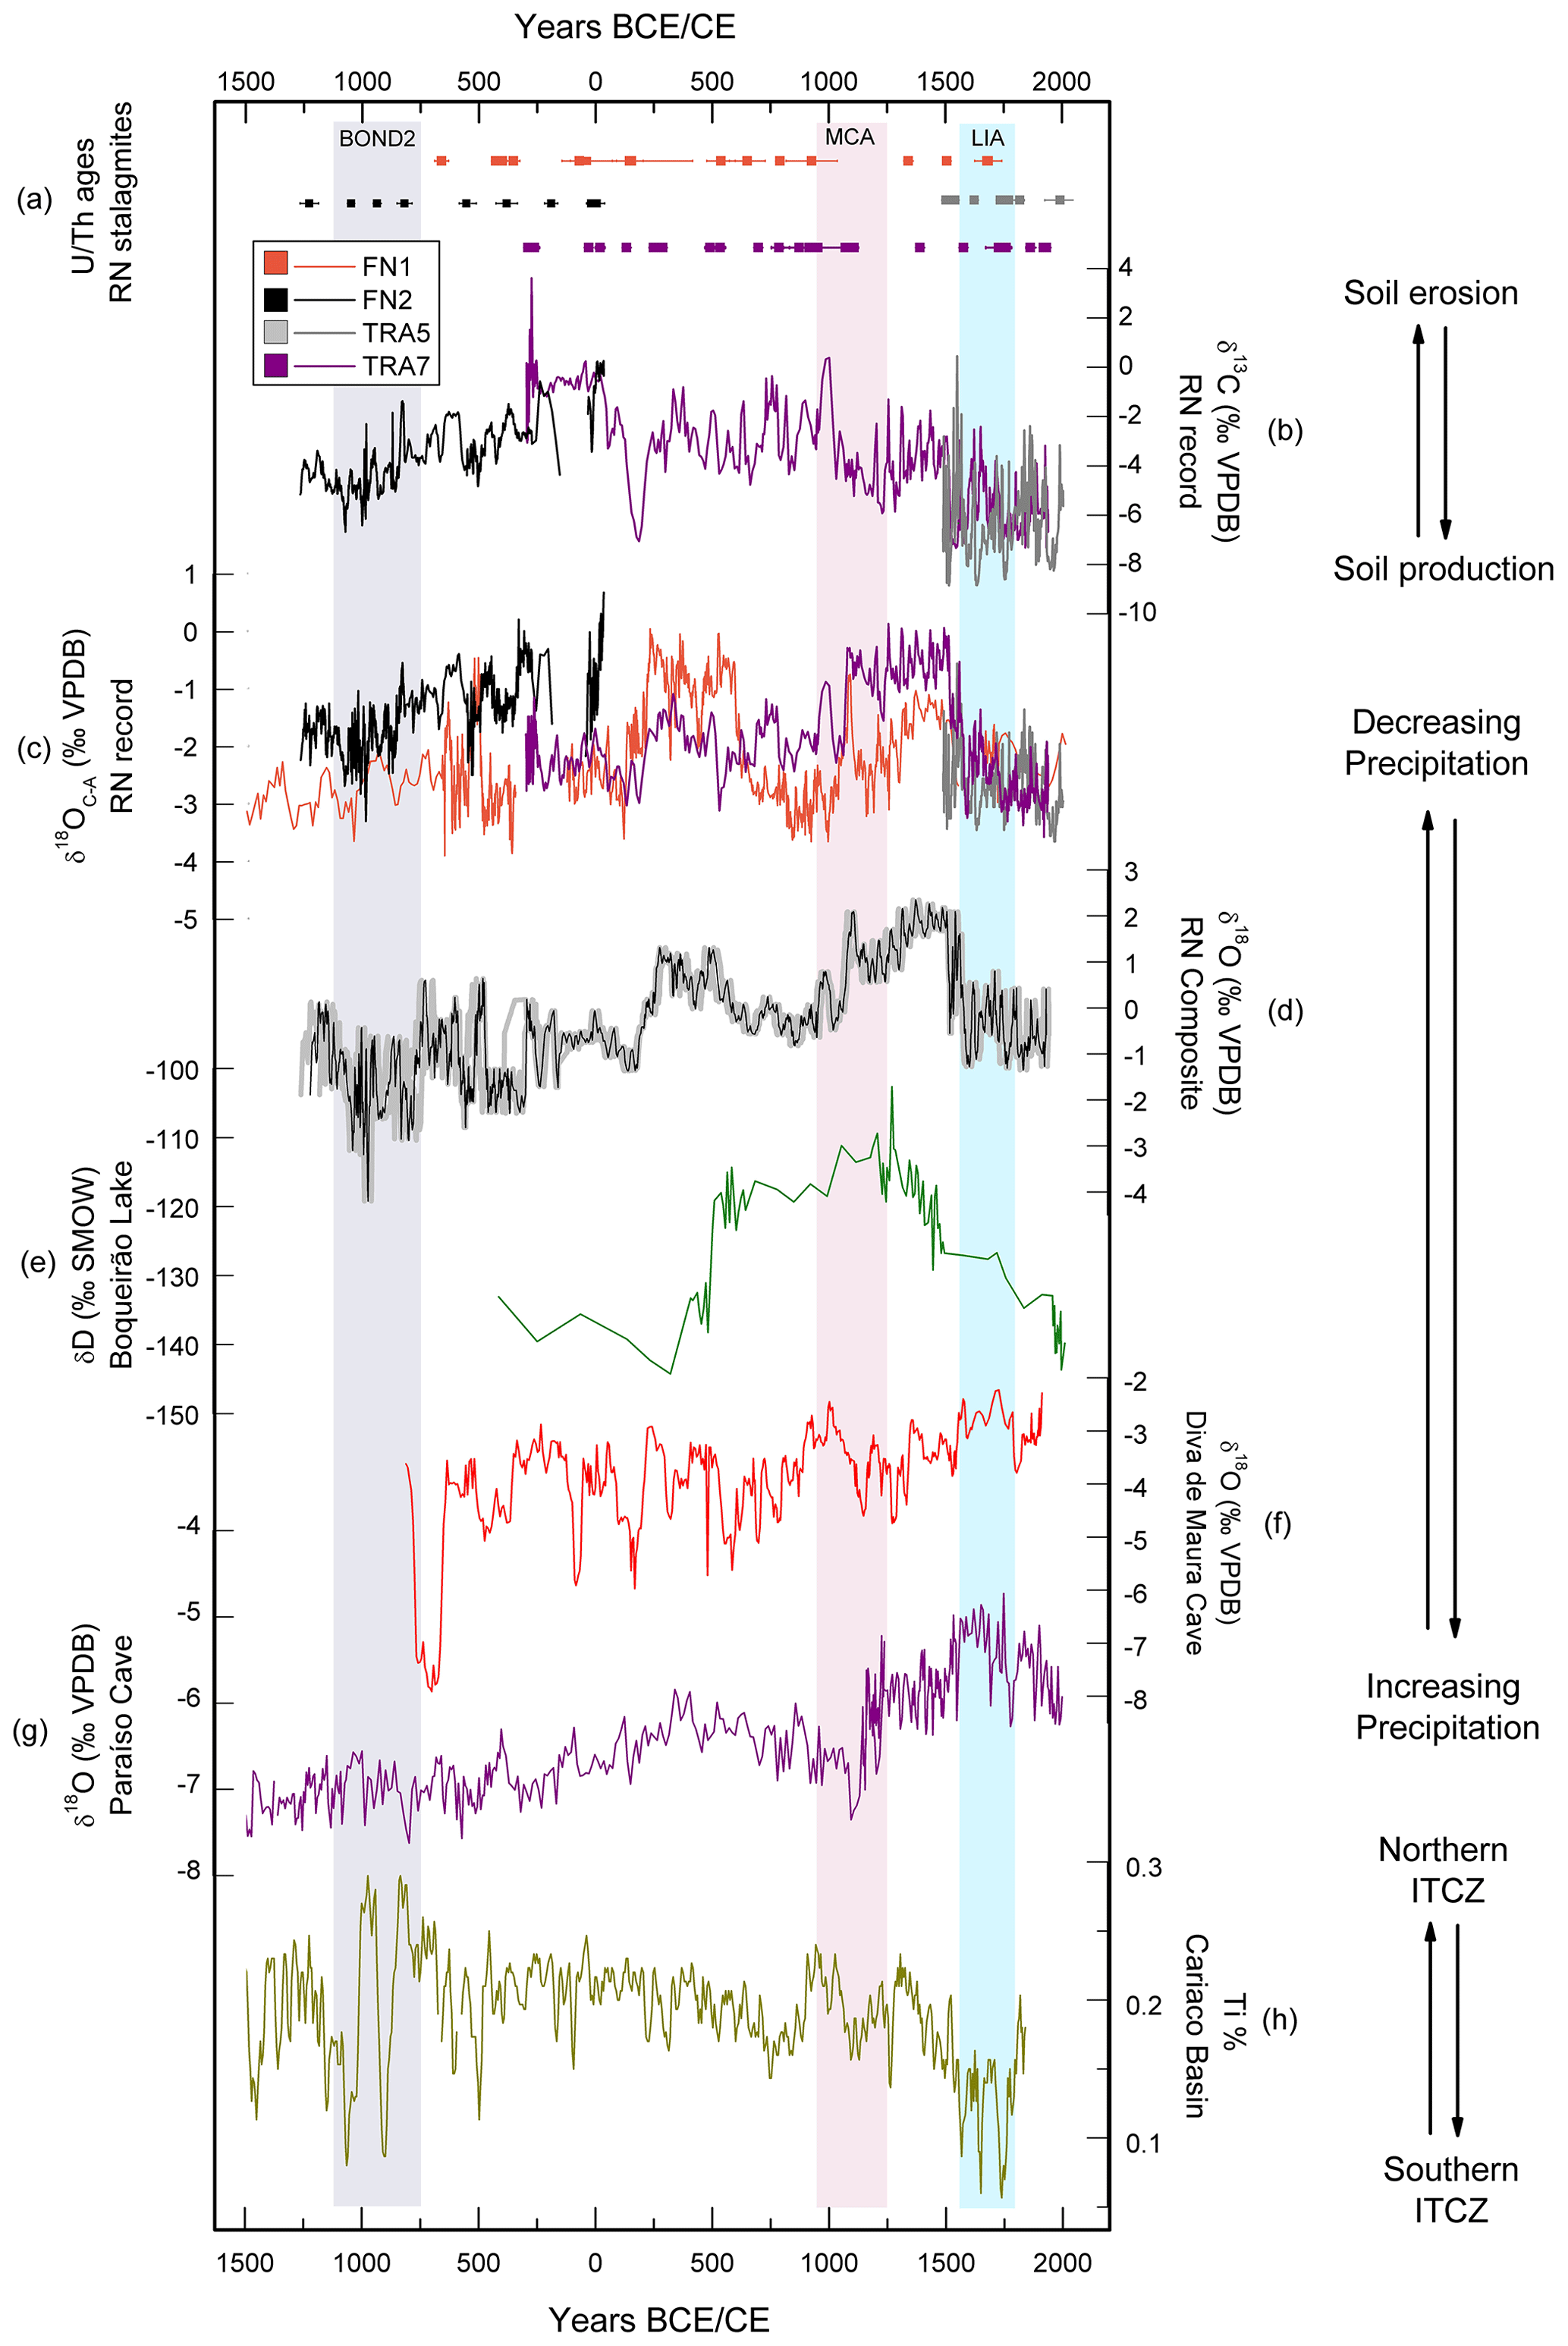
Figure 4Rio Grande do Norte stalagmite isotope records and comparisons with other records from South America. (a) U Th ages from each stalagmite studied. (b) Raw data of δ13C. (c) Oxygen isotope results corrected for calcite–aragonite fractionation (δ18OC-A), according to weight proportion of mineralogical results. (d) δ18O RN Composite constructed using stalagmite records from NEB (black line). Gray-shaded area denotes the 99 % confidence interval of the age model, blue-shaded area refers to LIA (Little Ice Age), pink-shaded area refers to MCA (Medieval Climate Anomaly), light-gray-shaded area refers to Bond 2 event. (e) Boqueirão Lake δD record (Utida et al., 2019). (f) DV2 speleothem oxygen isotope record from Diva de Maura cave, southern NEB (Novello et al., 2012). (g) PAR01 and PAR03 δ18O records from Paraíso Cave, eastern Amazon (Wang et al., 2017). (h) Ti record of Cariaco Basin (Haug et al., 2001).
Four main phases describe the δ13C dataset (Fig. 4b). The oldest phase from 3000 to 2160 BCE is characterized by δ13C values close to zero. After a hiatus (2170–1270 BCE) there is a short interval of stability with δ13C values around −4 ‰ that lasts from 1270 to 840 BCE and is followed by a δ13C enrichment that reaches a value of zero at 30 CE. Between 30 and 1500 CE there is a trend toward more negative δ13C values, varying from 0 ‰ to −8.8 ‰. This interval is marked by a valley at 190 CE with δ13C values of −7.2 ‰ and a peak at 1000 CE with δ13C values of 0.22 ‰. The youngest period, from 1500 to 1930 CE, is more stable than the previous one, with δ13C values averaging around −6.4 ‰.
4.4 Composite
Combining the δ18O results from the four RN stalagmites allows for establishing a continuous record covering the last ∼3200 years, the RN Composite (Fig. 4d). The correlation coefficient (r) between each measured δ18O stalagmite time series is >0.59, significant at the 95 % level (Fig. S5). The composite provides an average temporal resolution of ∼2 years. The entire stable isotope time series is composed of 2495 δ18O measurements, corrected according to mineralogical composition.
5.1 U Th chronology and RN Composite
The high values of 232Th and low 230Th 232Th ratio suggest incorporation of detrital Th transported by the seepage solution to the speleothems, which leads to a higher uncertainty in the age values. Recrystallization of aragonite into calcite might also reduce the U content and give older ages for carbonates (Lachniet et al., 2012). We assume that these are the main reasons for age inversions along speleothems from northeastern Brazil.
Because FN1 is mostly composed of aragonite and presents low U concentration in some samples of the first 127 cm and high 232Th amounts, we considered the association of low 230Th 232Th and low U content the most important factor affecting the age errors and inversions in the FN1 stalagmite. In contrast, the FN2 stalagmite has a more precise chronology due to the predominant aragonite composition, with high 238U content and a higher 230Th 232Th ratio than FN1. Although the TRA5 stalagmite is entirely composed of calcite, the 238U content is relatively high compared to other stalagmites, which improves the confidence in its age results. The high 232Th contamination of TRA5 samples is the main factor attributed to cause age inversions and increased errors. According to age results produced by Utida et al. (2020), most of the TRA7 ages are in chronological order, the inversions seem to not have a direct relationship with 238U amount, and the high 232Th content is similar to other ages from TRA7. Most of the TRA7 stalagmite used in our composite is composed of calcite and might not affect the main trends of δ18O.
The age uncertainties caused by high 232Th concentration and calcite recrystallization in stalagmites might affect the age model. However, the strong coherence between the δ18O curves from different stalagmites argues in favor of the good quality of our chronology. This is evident when FN2, which is composed 100 % of aragonite, is compared with other samples. There is a different amplitude range in its δ18O values, but when the curve is superposed on other δ18O records the variability is similar. This amplitude range is corrected when the δ18O results are submitted to the iscam composite construction, since it normalizes the results (Fig. S6).
Although the δ18O results present a different range of values between FN2 and FN1, the mineralogical correction did not significantly change the main curves (Fig. S4). TRA7 and FN1 underwent substantial changes due to mineralogical corrections between 80 to 1500 CE (Table S4). However, the δ18O trends were not modified. The mineralogical correction for the last 500 years adjusts the δ18O values over the same range for TRA5, TRA7, and FN1 (Fig. S4). Some of this δ18O variability might also be attributed to karst fractionation effects. However, no cave monitoring in northern NEB is available that could quantify the extent of these processes.
These differences in mineralogical corrections and possible δ18O fractionations did not alter the general shape of the RN Composite. Before merging the results, iscam normalizes the δ18O and different range values are adjusted to the same scale, resulting in significant reduction in the difference between stalagmite records (Fig. S6). The largest error occurs between 250 and 580 CE, when the maximum and minimum values of FN1 and TRA7 are 2.4 ‰ and −1.50 ‰ after normalization, respectively (Fig. S6). This is a period when FN1 registers high δ18O values; an anomaly that is not evident in TRA7. The period extending from 500 to 570 CE is characterized by an anti-phased signal between FN1 and TRA7, and hence the RN Composite shows a smoothed signal during this time.
5.2 Paleoclimate interpretation
The variability in the global δ18O values for speleothems originating from the same cave is ∼0.37 ‰, which can be attributed to karst fractionation effects and not directly to hydroclimate, host rock geology, cave depth, or cave microclimate instability (Treble et al., 2022). Some intervals in coeval RN stalagmites from the same cave are above this limit; however, we demonstrated based on the composite treatment associated with mineralogical corrections that the δ18O variability from the RN record is similar for stalagmites from the same cave and between the two studied caves throughout the period analyzed, further reinforcing the notion applied by previous studies that these records can be interpreted in a paleoclimatic context (Cruz et al., 2009; Utida et al., 2020). In addition, we consider the RN composite as representative of a precipitation δ18O signal since the differences between stalagmite records are significantly reduced after age rearrangements and isotope normalization.
The δ18O RN Composite allowed us to reconstruct precipitation changes influenced by the ITCZ position in N-NEB and its convective intensity. This interpretation is based on the spatial correlation between δ18O at GNIP stations and GPCC precipitation (Fig. 3). The highest precipitation amounts occur between March and May, and they coincide with more depleted δ18O precipitation signals, consistent with the amount effect (Dansgaard, 1964). Hence, the most negative δ18O values in RN stalagmites reflect an increased rainfall amount, as a consequence of an ITCZ position close to N-NEB (Cruz et al., 2009; Utida et al., 2019).
A generally drier climate prevailed in NEB after the 4.2 ka BP event in the mid-Holocene (Cruz et al., 2009). This led to the development of the Caatinga, a sparse vegetation cover which has persisted in NEB to the present (De Oliveira et al., 1999; Utida et al., 2020; Chiessi et al., 2021). These drier conditions favored soil erosion during rainfall events and reduced soil thickness (Utida et al., 2020). When erosion events remove most of the soil cover, there is an increase in the carbon contribution from local bedrock (mean δ13C of 0.5 ‰), which leads to higher δ13C values in the NEB stalagmites from RN. On the other hand, more negative δ13C values in stalagmites are associated with increased soil coverage and soil production (Utida et al., 2020). NEB soils have a δ13C average around −25 ‰, which suggests a dominant influence from C3 plants with δ13C values ranging between −32 ‰ and −20 ‰ (Pessenda et al., 2010). Therefore, the δ13C stalagmite results are interpreted as changes in soil production or erosion and the density of vegetation coverage (e.g., Utida et al., 2020; Azevedo et al., 2021; Novello et al., 2021).
The oldest period covered by the RN Composite, from 1200 to 500 BCE, is characterized by successive dry and wet multidecadal periods, with increased precipitation in N-NEB from 1060 to 750 BCE and from 460 to 290 BCE, as suggested by the negative departures seen in the δ18O values. During this last period, there is also a tendency from lower to higher δ13C values, suggesting progressive surface soil erosion related to rainfall variability (Fig. 4), as interpreted by Utida et al. (2020). This period ends up in a stable interval, lasting from 300 BCE to 0 CE, with little fluctuation in δ18O values and δ13C values close to the bedrock signature at about −1 ‰ to +1 ‰, indicating a lack of soil above the cave. After an abrupt reduction in both isotopes around 200 CE, there was a brief time of increased precipitation and vegetation development. Between 200 and 1500 CE, decreased δ13C values, reaching approximately −2 ‰, suggest a vegetation development above the cave. However, δ18O values indicate significant variability, with two main periods of dry conditions, from 270 to 530 CE and 1060 to 1500 CE. From 1500 CE to the present, more negative values of δ18O represent wetter climatic conditions. The more negative δ13C during this period can be related to denser vegetation that favored both soil production and stability above the cave. Due to the high range of δ13C results (more than 11 ‰), we assume that the prior calcite precipitation effect is negligible in our results. In addition, a more positive δ13C signal occurs around 280 BCE when the climate conditions were not the driest in the last 5000 years, thus probably representing a local environmental change.
During the last 2500 years, the RN Composite shows similar characteristics to the lower-resolution δD lipids record (n-C28 alkanoic acid from leaf waxes) obtained in Boqueirão Lake sediments (N-NEB) (Figs. 1 and 4). Both records show a more stable climatic signal between 400 BCE and 350 CE. From 500 to 1500 CE, enriched δD lipids obtained in Boqueirão Lake were interpreted as the beginning of a long dry phase (Utida et al., 2019), although the beginning of the dry period is slightly delayed when compared with the RN speleothem isotope record. This inconsistency might be related to different chronological controls between lake and stalagmite records and possibly also to the location of Boqueirão Lake, which is affected by the ITCZ and winter breezes as it is in the eastern coastal sector of NEB (Zular et al., 2018; Utida et al., 2019).
It is important to note that the RN record exhibits a climatic signal that is distinctly different from the from DV2 speleothem record from Diva de Maura Cave in S-NEB (Novello et al., 2012). Although both regions are affected by the same mesoscale atmospheric circulation, the RN site receives its precipitation directly from the ITCZ. At the S-NEB site, on the other hand, the primary source of precipitation is associated with the monsoon, as it is located too far inland to be affected directly by the ITCZ, as demonstrated by the correlations maps (Fig. 3). The general trend toward more positive values, as a result from insolation forcing, occurs from 150 to 1500 CE in the RN Composite but from 600 to 1900 CE in the DV2 sample (Cruz et al., 2009; Novello et al., 2012). This trend is a result of the persistent dry conditions in the entire NEB region that suggest an ITCZ contraction in an orbital timescale, resulting in drier conditions over NEB during periods of maximum austral summer insolation (Cruz et al., 2009; Chiessi et al., 2021; Campos et al., 2022). However, the DV2 record does not document the same multidecadal- and centennial-scale climate variability as recorded in the RN speleothem record, nor the less dry interval from 600 to 1060 CE seen in the RN Composite (Fig. 4). As demonstrated by the spatial correlation maps between δ18O values and regional precipitation (Fig. 3), the S-NEB and N-NEB regions are influenced by distinct rainfall regimes whose peaks of precipitation arise during the summer monsoon season and the autumn ITCZ, respectively. Our data provide evidence for a spatial and temporal distinction of NEB climate patterns for the past that can be interpreted as differences in seasonality during the last millennia. Furthermore, contemporaneous dry or wet events in both N-NEB and S-NEB suggest the occurrence of larger regional climate changes with higher environmental impacts.
When comparing N-NEB and eastern Amazon conditions, it is evident that the RN Composite shares some similarities with the Paraíso stalagmite record (Wang et al., 2017) due to the contribution of ITCZ precipitation in both places. But there are also important differences (Fig. 4). The RN Composite shows lower δ18O values between 500 and 1000 CE, compared to the earlier period, while Paraíso shows gradually decreasing values around the same period, suggesting a slight increase in precipitation in both areas. From 1160 to 1500 CE, abrupt increases in δ18O values are seen in both records, which indicate abrupt and prolonged drought conditions due to a northward ITCZ migration. However, around 1100 CE, centered in the MCA, and the period from 1500 to 1750 CE, Paraíso is anti-phased with the RN Composite and in phase with the Cariaco Basin (Haug et al., 2001), which is inconsistent with the notion of an ITCZ-induced regional precipitation change. Instead, a zonally oriented precipitation change within the ITCZ domain over Brazil is required to explain the anti-phased behavior between precipitation in N-NEB and the eastern Amazon and similarities between Cariaco and the eastern Amazon.
We investigate the potential relationship between δ18O values in our RN speleothems and an ITCZ displacement toward the warmer hemisphere to explain paleoclimate variability observed in N-NEB. In order to test this hypothesis, the RN Composite was compared with a reconstruction of Atlantic multidecadal variability (AMV) (Lapointe et al., 2020) (Fig. 5). Some studies suggest that the warm phase of the AMV (when the North Atlantic presents warm SST) forces the mean ITCZ to shift to the north of its climatological position, thereby causing a reduction in NEB rainfall (Knight et al., 2006; Levine et al., 2018), while a recent study suggests that the warm phase of the AMV would cause a weakening of the ITCZ from February to July (Maksic et al., 2022). The driest periods from 750 to 500 BCE, 200 to 580 CE, and 1100 to 1500 CE occurred during long, relatively warm AMV anomalies centered at the North Hemisphere. The warm average temperature of 22.19 ∘C for the period would force a northward ITCZ displacement or an ITCZ weakening, and in both cases the result is low precipitation over NEB. The lowest AMV temperature (cold phase) around 1500 CE might be related to the abrupt dry conditions seen in the RN Composite and suggests an increased equatorial Atlantic SST, and consequently increased precipitation over N-NEB (Fig. 5). Opposite conditions between the RN Composite and the AMV can be observed during the Current Warm Period, which requires further investigation. The relationship between North Atlantic temperature and ITCZ location can also explain the Bond 2 event recorded in the RN Composite. It is marked by increased precipitation around 1000 BCE, when the ITCZ was displaced toward the south. This southerly ITCZ displacement might be attributed to persistently lower temperatures in the North Atlantic (Bond et al., 2001; Broccoli et al., 2006) caused by the slowdown of the Atlantic Meridional Overturning Circulation (Jackson et al., 2015).
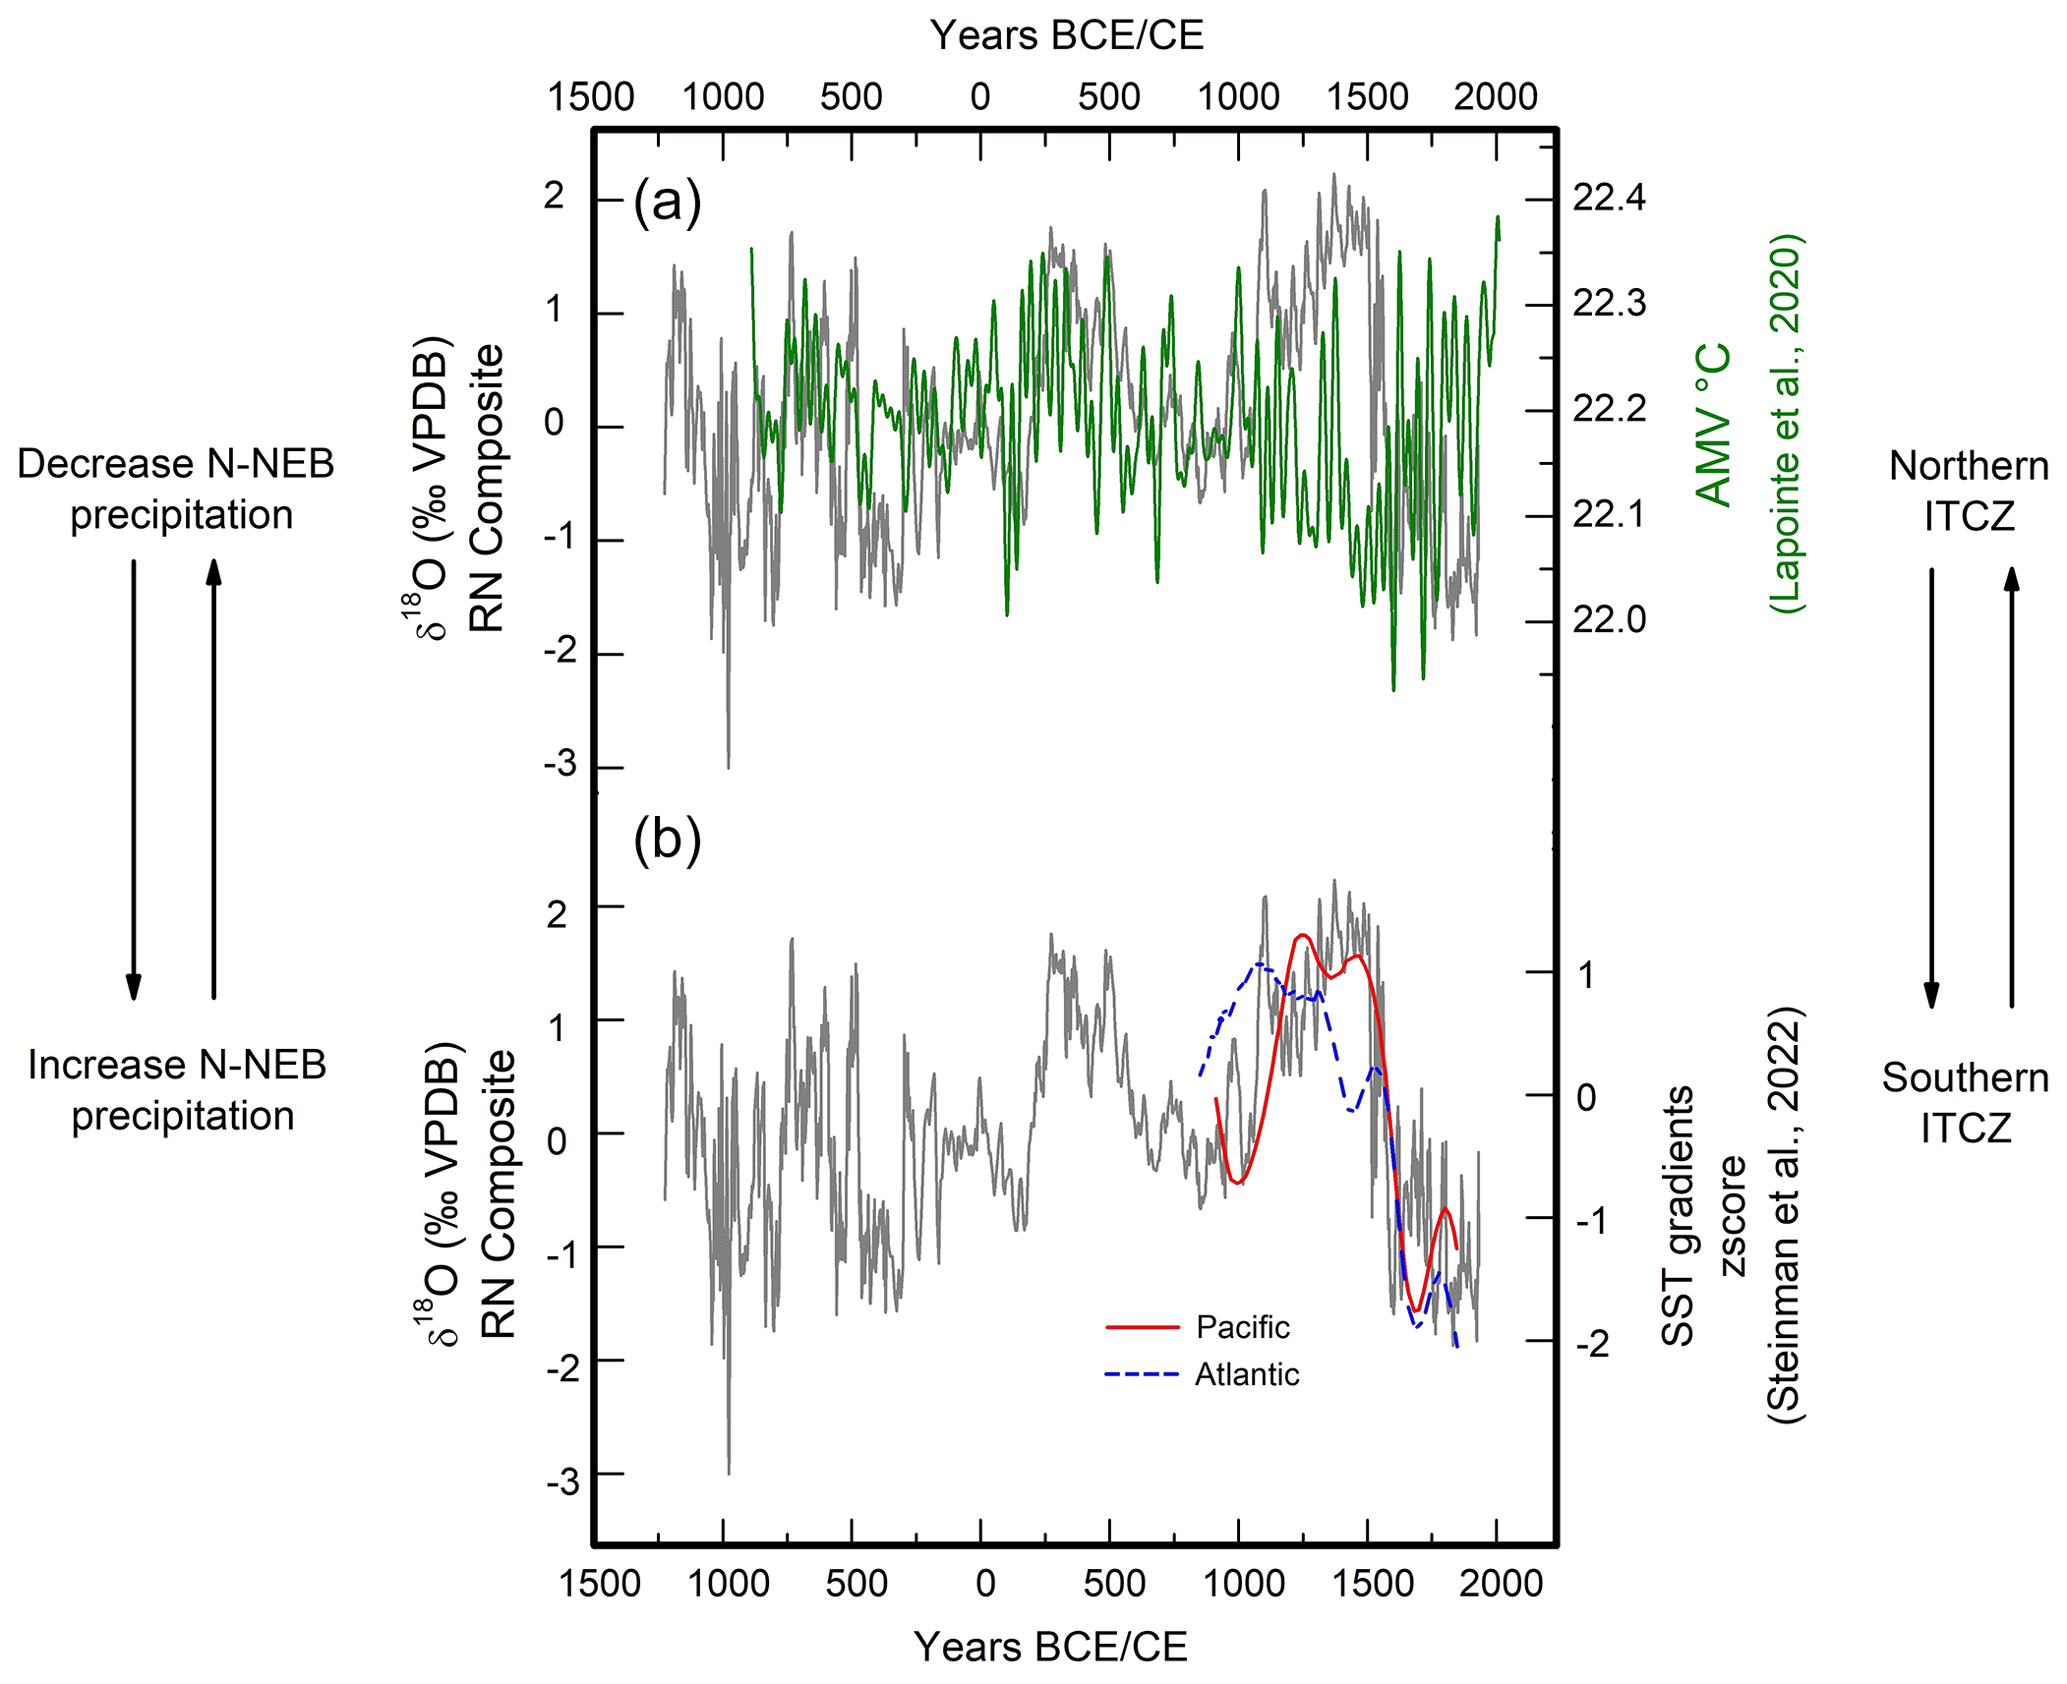
Figure 5The δ18O RN Composite compared with (a) Atlantic multidecadal variability (Lapointe et al., 2020) and (b) Pacific and Atlantic sea surface temperature gradients calculated (z score) according to Steinman et al. (2022). Atlantic data use a 2 σ range of 1000 realizations of the Atlantic meridional SST gradient (north–south). Pacific data use a median of 1000 realizations of the Pacific zonal SST gradient (west–east).
Steinmann et al. (2022) suggested a southward displacement of the ITCZ during the Common Era toward the Southern Hemisphere in response to changes in the Pacific and Atlantic meridional SST gradients. Indeed, our RN Composite is dynamically consistent with these SST gradient changes and in agreement with the hypothesis of a north–south oscillation of the latitudinal ITCZ position in the tropical Atlantic during the last millennia, modulating precipitation over N-NEB. When the tropical South Atlantic and tropical eastern Pacific are anomalously warm with negative z score (cold with positive z score) (Fig. 5) the ITCZ is displaced to the south (north), resulting in increased (decreased) precipitation over NEB. The abrupt changes in N-NEB precipitation around 1100 and 1500 CE occur approximately synchronous with the SST gradient changes, confirming how sensitive the RN speleothems are to changes in the ITCZ latitudinal position (Fig. 5). The same is observed during the period equivalent to the LIA, between 1560 and 1800 CE, considering N-NEB, S-NEB, and eastern Amazon records, when both the Pacific and South Atlantic became warmer (Fig. 5). According to Steinmann et al. (2022), during the LIA period warm SST in the eastern tropical Pacific and in the tropical South Atlantic would promote a southward displacement of the ITCZ. This is supported by other records from the western Amazon and the tropical Andes that document an intensified SASM during the LIA, fueled by the southern location of the ITCZ (e.g., Vuille et al., 2012; Apaéstegui et al., 2018), which is also very well recorded in other archives around the tropics (Leichleitner et al., 2017; Campos et al., 2019; Orrison et al., 2022; Steinmann et al., 2022).
According to Kayano et al. (2020, 2022), during the last century, dry conditions over N-NEB and the eastern Amazon are present when AMV and Pacific decadal variability (PDV) are both in their warm phases or when the AMV is in a cold phase and the PDV in its warm phase. On the other hand, when AMV and PDV are both in their cold phase, precipitation over the Amazon is anti-phased with NEB, resulting in decreased precipitation over the Amazon and increased precipitation over NEB. This zonally aligned precipitation signal over eastern tropical South America is the result of joint perturbations of both the regional Walker and Hadley cells produced by teleconnection between the two ocean basins (He et al., 2021). This joint interaction between the two basins can help explain the results seen during the cold AMV phase between 1500 and 1750 CE (Fig. 5), when precipitation over N-NEB increased but the eastern Amazon saw a decrease in precipitation (Fig. 4).
5.3 TRA5 δ18O stalagmite and extreme drought events
The last 500 years were the wettest of the last 2 millennia, and the onset of this period was forced by Atlantic and Pacific SST according to our results (Figs. 4 and 5). Superimposed on these long-term negative δ18O anomalies, distinct peaks are recorded in the TRA5 δ18O record from 1500 to 1850 CE (Fig. 6). These drought events are visible in this record thanks to its higher deposition rate (faster growth) and thus higher temporal resolution of the δ18O record when compared to other stalagmites used in our study. No preferred periodicity of these events is apparent in our record, preventing comparison with ENSO events, for example. There are no precipitation reconstructions or observations from this region between 1500 and 1850 CE aside from historical drought records.
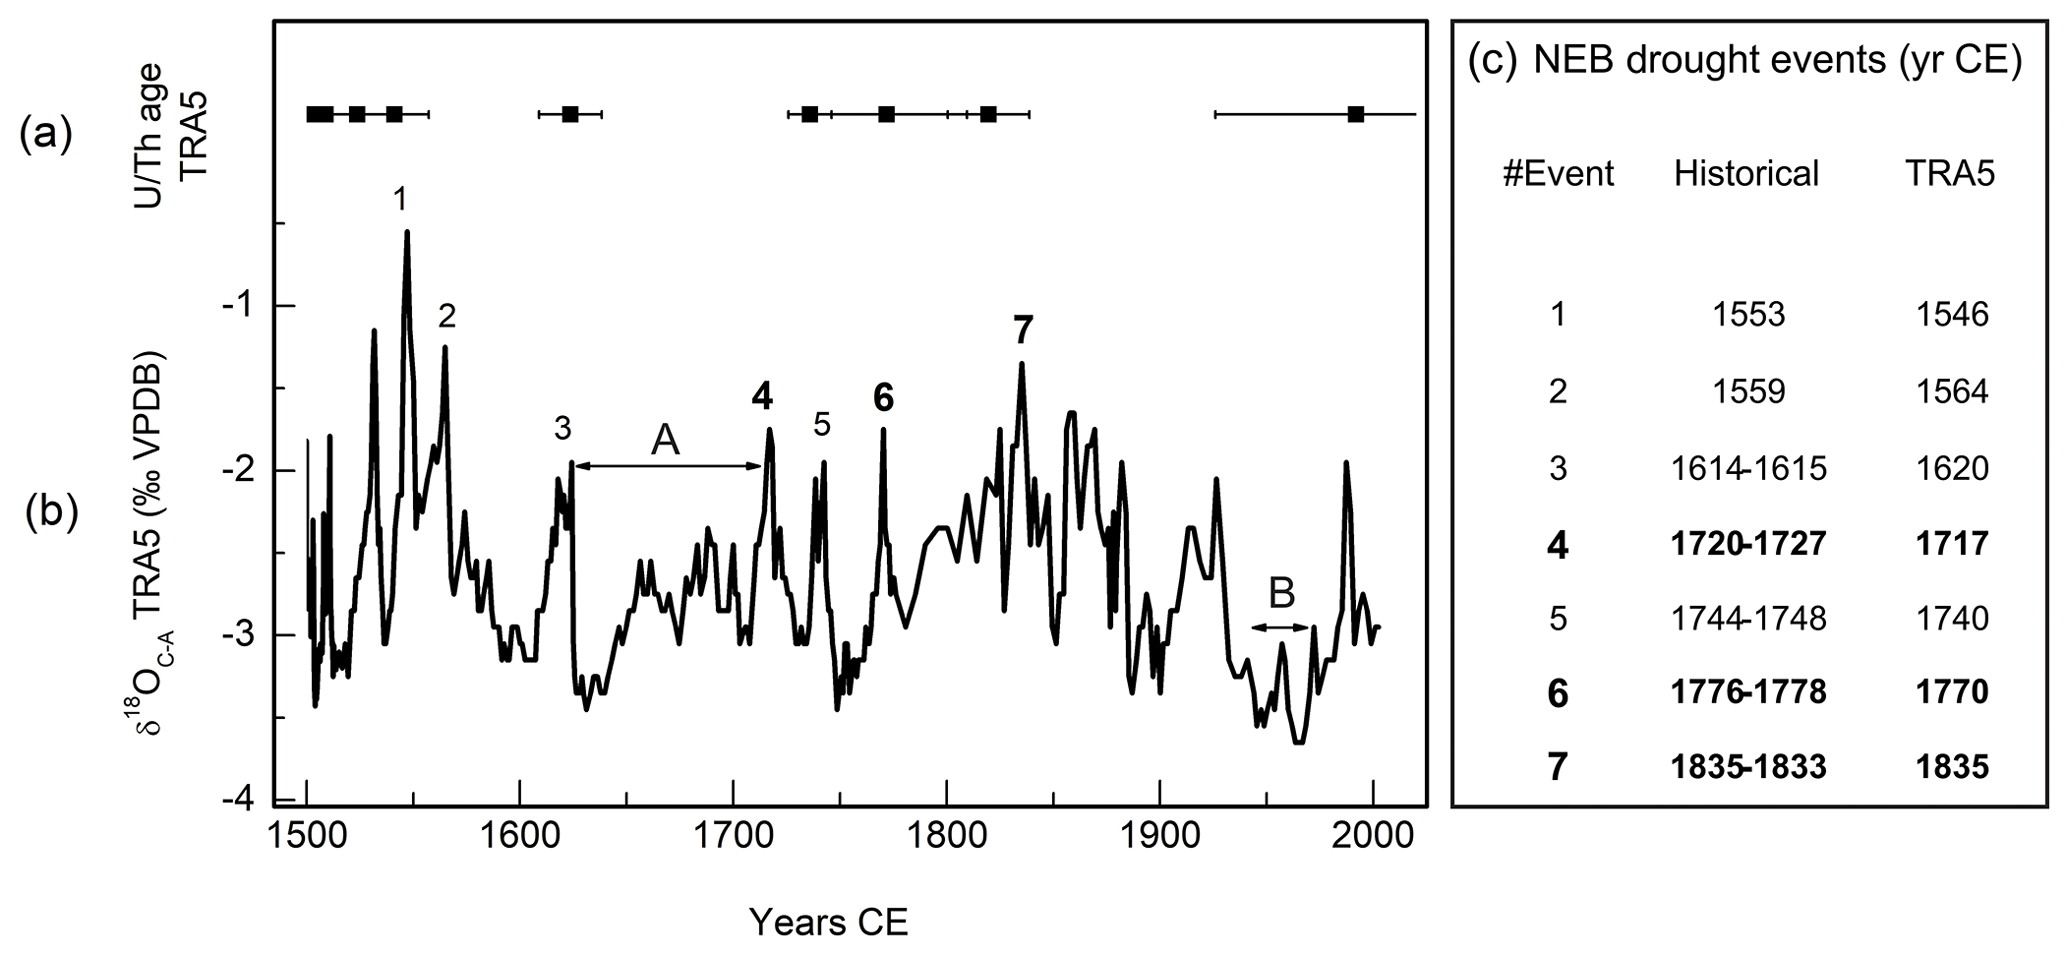
Figure 6TRA5 record and equivalent historical record. (a) U Th age is represented by black dots, and horizontal lines indicate age uncertainty. (b) δ18OC-A record, where numbers represent the peak of a drought event. Bold numbers represent the most severe drought events. (A) Few drought events are seen in the interval from the 1620s to 1970s CE period and (B) the 1940s to 1970s CE period. (c) Occurrence of historical drought years compiled from Lima and Magalhães (2018).
Although the age model errors in TRA5 are larger and could limit our ability to attribute δ18O peaks to specific single-year events, it still allows for a comparison between these abrupt events with historical records to demonstrate the long-term context of abrupt drought events in modern human history. We thus consider our speleothem-based record a first attempt to reconstruct precipitation in northeastern Brazil that would allow for a comparison with historical droughts. If our speleothem records regional hydroclimate, it should retain a signal of the most intense droughts over NEB that are known to have struck the region based on the available historical literature of Brazil.
The highest peaks correspond to extreme drought events, such as the ones centered around 1546 and 1564 CE (points 1 and 2 of Fig. 6). They can be associated with observed historical droughts that took place in 1553 and 1559 CE. These were the first two events recorded in Brazil by the Portuguese Jesuits that led to a reported reduction in river flow in the tributaries of the main rivers of NEB (Serafim Leite, 1938; Hue et al., 2006; Lima and Magalhães, 2018).
Another relevant drought according to TRA5 is centered around 1620 CE (point 3 of Fig. 6). This drought is recorded in historical documents and lasted from 1614 to 1615 CE, although it did not have the same socioeconomic impact as the two prior droughts (Lima and Magalhães, 2018). In fact, between the 16th and 17th century there are few historical drought records (period A in Fig. 6). One hypothesis to explain this hiatus is the low population density of the NEB territory, resulting in poor historical documentation of such events. However, according to the TRA5 record, between event 2 ∼1564 CE and event 4 ∼1717 CE (Fig. 6), the only drought peak occurs in 1620 CE, confirming an almost 150-year-long period of relative climate stability with prevailing wet conditions in NEB. These favorable conditions certainly helped with the initial population establishment at the beginning of 16th century and led to the peak era of sugar cane production in NEB around 1650 CE along coastal areas (Taylor, 1970).
During the 18th century NEB experienced a significant increase in rural population, characterized by the establishment of large cattle farms (Fausto, 2006). In this period, three droughts are documented in the TRA5 record (Fig. 6). The δ18O excursion around 1717 CE (point 4 in Fig. 6) can be associated with the drought that lasted from 1720 to 1727 CE; the first big drought in NEB, which according to historical documents caused the mortality of wildlife and cattle and affected the agricultural productivity. Entire Indigenous tribes died of starvation as a consequence of this drought and a concurrent smallpox (variola) epidemic, which also killed other ethnic groups, especially the native population and black people enslaved during that period (Alves, 2003).
The following event around 1740 CE (point 5 in Fig. 6) was also recorded in historical documents but did not seem to be associated with major impacts. However, all of these droughts were probably responsible for a drop in sugar cane exports to Europe during the first half of the 18th century (Galloway, 1975).
Another drought occurred from 1776 to 1778 CE and is imprinted in our record around 1770 CE (point 6 in Fig. 6). This event was again accompanied by a variola outbreak probably spread by a lowering in the sanitary conditions and increased population agglomeration. The association between this disease and droughts might explain the economic and health crisis, since people started to migrate to the cities looking for treatment and food, leading the Brazilian Governor to transfer infected people to isolated lands, resulting in thousands of deaths (Rosado, 1981). Finally, the most recent peak in our data displays an event around 1835 CE (point 7 of Fig. 6), associated with a drought that lasted from 1833 to 1835 CE, reaching the northernmost areas of NEB, and leading to the largest human migration to other Brazilian regions (Lima and Magalhães, 2018). The droughts centered around 1770 and 1835 CE had a huge impact on society according the historical records (Lima and Magalhães, 2018).
Although the precision of the TRA5 speleothem chronology is reduced during the last ∼150 years, we observe that the wet period from the 1940s to the 1970s (line B in Fig. 6) is coincident with the mid-20th-century break in global warming that has been discussed as being forced by aerosol emissions (e.g., Booth et al., 2012; Undorf et al., 2018). Our data suggest an increased precipitation in this period that is supported by a trend in decreasing values of δ18O in corals from the northeastern coast of N-NEB, equally interpreted as an ITCZ southward displacement caused by a decreasing SST gradient between the North and South Atlantic (Pereira et al., 2022).
Our TRA5 stalagmite documents some of the most important droughts that occurred in NEB between the 16th and the 18th centuries, demonstrating the potential of stalagmite studies in monitoring abrupt and extreme climate events through time. However, the speleothems do not record all documented historical dry events, as some droughts may not have affected the Trapiá Cave region or were not strong or long enough to affect the isotopic signal of the groundwater storage in the epikarst. Furthermore, the period between 1620 and 1717 CE is devoid of any abrupt drought events in the TRA5 stalagmite, which is again consistent with the historical records. It is also important to mention that Lima and Magalhães (2018) report all drought events in NEB and do not indicate their location. We suggest that progressive changes in the mean ITCZ position along the last 500 years might be responsible for historical droughts that affected the seasonality of N-NEB and caused abrupt and strong drought events. Additional drought-sensitive high-resolution records will be required to improve our understanding of these historical droughts events in NEB.
We present the first high-resolution record for the ITCZ in N-NEB that covers the last 3200 years and also records the major historical droughts that took place in NEB during the last 500 years. Based on stalagmite oxygen isotopes, we describe the regions' paleoclimate variability for the last 2500 years and its connections to remote forcing mechanisms such as the AMV and changes in Pacific and Atlantic SST gradients.
The N-NEB record presents a trend toward drier conditions from 1000 BCE to 1500 CE as is also being observed in the Diva de Maura Cave in S-NEB, interpreted as an ITCZ contraction and SASM weakening on an orbital timescale, respectively. Although the two records are influenced by distinctly different climate systems with different precipitation seasonality, ITCZ and SASM dynamics are known to be closely linked (Vuille et al., 2012).
During the last millennia, ITCZ dynamics in the tropical Atlantic–South America sector cannot be explained solely by north–south ITCZ migrations or one single forcing mechanism. We propose a zonally non-uniform behavior of the ITCZ during the event centered around 1100 CE and the drought events between 1500 and 1750 CE, when the RN record is anti-phased with the Paraíso Cave record from the eastern Amazon. This zonal behavior would be forced by the interactions between AMV and PDV modes that changed the regional Walker cell position and ITCZ intensity and extent, thus affecting precipitation variability between the eastern Amazon and N-NEB.
The historical droughts discussed are the longest drought events in northeastern Brazil that occurred within the zone of influence of the ITCZ and are thus probably the most likely to be recorded by stalagmites according to our interpretation. The northern and southern NEB are influenced by different climatic systems, the ITCZ and SASM, respectively, and this can explain, in part, the differences between historical and stalagmite records of Rio Grande do Norte. These historical droughts recorded in the RN stalagmite suggest that much of the socioeconomic development of the NEB, which occurred after 1500 CE, benefitted from conditions that were unusually humid in a long-term context. During the last 500 years the technological development, infrastructure, civilization, and population growth relied on more abundant resources. On the other hand, our data also show how short, abrupt drought events significantly affected human population and other life forms, especially when associated with anthropogenic changes in the environment. These droughts induced an environment favorable for spreading of disease, starvation, lack of water, environmental degradation, and crowding of people seeking help, among other problems. These events demonstrate the social and environmental impacts associated with extreme events in this vulnerable environment, and our speleothem work documents the enormous potential of these archives to reconstruct the drought history in this region.
The dataset generated as part of this study will be available in the PANGAEA website.
The supplement related to this article is available online at: https://doi.org/10.5194/cp-19-1975-2023-supplement.
GU and FWC designed the experiment, performed isotopic analysis, and prepared the manuscript with help from the coauthors. FWC directed the project and revised all versions of manuscript. MV helped with the interpretation and revision of the manuscript. AA contributed with statistical analysis and interpretation. VFN contributed with the paleoclimate interpretations and revision of the manuscript. GS and JM helped with interpretation and revision of the manuscript. FRDdA provided and interpreted the mineralogical analysis. HZ helped with U Th analysis and revision of the manuscript. HC and RLE coordinated the laboratory procedures for U Th analysis.
The contact author has declared that none of the authors has any competing interests.
Publisher's note: Copernicus Publications remains neutral with regard to jurisdictional claims made in the text, published maps, institutional affiliations, or any other geographical representation in this paper. While Copernicus Publications makes every effort to include appropriate place names, the final responsibility lies with the authors.
We thank Alyne Barros M. Lopes, Osmar Antunes, and Christian Millo (LES-IGc-USP, Brazil) for their support during the analyses. We thank Marcela Eduarda Della Libera de Godoy, Júlio Cauhy Rodrigues, Eline Alves de Souza Barreto, Vitor Azevedo and Wenjing Du for their support in U Th analysis. We are grateful to Cristiano Chiessi for comments on the draft and Leda Zogbi and Diego de Medeiros Bento for the Trapiá Cave and Furna Nova maps. We thank Jocy Brandão Cruz, Diego de Medeiros Bento, José Iatagan Mendes de Freitas, Darcy José dos Santos, Uilson Paulo Campos (CECAV/RN), Antônio Idaelson do Nascimento, and Geilson Góes Fernandes for all their support during the field trip and information and data about the caves. This work was supported by the São Paulo Research Foundation (FAPESP), Brazil, through PIRE NSF-FAPESP (grant nos. 2017/50085-3 and 2022/08359-7 to Francisco William Cruz), as well as the fellowships to Giselle Utida (grant nos. 2020/02737-4, 2021/12860-0, and 2022/14915-0), Jelena Maksic (grant no. 2018/23522-6), and Angela Ampuero (grant no. 2020/09258-4). The United States NSF support through grant nos. AGS-1303828 and OISE-1743738 to Mathias Vuille and grant no. 1103403 to R. Lawrence Edwards and Hai Cheng is acknowledged. The NSFC, China, support through grant no. NSFC 41888101 to Hai Cheng and grant no. NSFC 42261144753 to Haiwei Zhang is acknowledged. The Deutsche Forschungsgemeinschaft (DFG) is acknowledged for supporting Valdir F. Novello. Giselle Utida is grateful to CAPES for the postdoc fellowships through the Programa de Pós-Graduação em Geoquímica e Geotectônica at Universidade de São Paulo, Brazil.
This research has been supported by the Fundação de Amparo à Pesquisa do Estado de São Paulo (grant nos. 2017/50085-3, 2020/02737-4, 2018/23522-6, 2020/09258-4, and 2022/08359-7).
This paper was edited by Dominik Fleitmann and reviewed by two anonymous referees.
Alvalá, R. C. S., Cunha, A. P. M. A., Briton, S. S. B., Seluchi, M. E., Marengo, J. A., Moraes, O. L. L., and Carvalho, M. A.: Drought monitoring in the Brazilian Semiarid region, An. Acad. Bras. Ciênc., 91, e20170209, https://doi.org/10.1590/0001-3765201720170209, 2019.
Alves, J.: História das secas (séculos XVII a XIX), Edição fac-símile, Fundação Waldemar Alcântara, Fortaleza, https://www.fwa.org.br/livros/historia-das-secas.pdf (last access: 7 October 2023), 2003.
ANA – Agência Nacional de Águas: Sistema Nacional de Informações sobre Recursos Hídricos, http://www.snirh.gov.br/hidroweb/apresentacao (last access: 1 February 2022), 2013.
Andreoli, R. F. S., de Souza, R. A. F., Kayano, M. T., and Candido, L. A.: Seasonal anomalous rainfall in the central and eastern Amazon and associated anomalous oceanic and atmospheric patterns, Int. J. Climatol., 32, 1193–1205, https://doi.org/10.1002/joc.2345, 2011.
Apaéstegui, J., Cruz, F. W., Vuille, M., Fohlmeister, J., Espinoza, J. C., Sifeddine, A., Strikis, N., Guyot, J. L., Ventura, R., Cheng, H., and Edwards, R. E.: Precipitation changes over the eastern Bolivian Andes inferred from speleothem (δ18O) records for the last 1400 years, Earth Planet. Sci. Lett., 494, 124–134, https://doi.org/10.1016/j.epsl.2018.04.048, 2018.
Araújo, R. G., Andreoli, R. V., Candido, L. A., Kayano, M. T., and de Souza, R. A. F.: Influence of El Niño-Southern Oscillation and Equatorial Atlantic on rainfall over northern and northeastern regions of South America, Acta Amaz., 43, 469–480, https://doi.org/10.1590/S0044-59672013000400009, 2013.
Azevedo, V., Stríkis, N. M., Santos, R. V., Souza, J. G., Ampuero, A., Cruz, F. W., Oliveira, P., Iriarte, J., Stumpf, C. F., Vuille, M., Mendes, V. R., Cheng, H., and Edwards, R. L.: Medieval Climate Variability in the eastern Amazon-Cerrado regions and its archeological implications, Sci. Rep., 9, 20306, https://doi.org/10.1038/s41598-019-56852-7, 2019.
Azevedo, V., Strikis, N. M., Novello, V. F., Roland, C. L., Cruz, F. W., Santos, R. V., Vuille, M., Utida, G., de Andrade, F. D., Cheng, H., and Edwards, R. L.: Paleovegetation seesaw in Brazil since the Late Pleistocene: A multiproxy study of two biomes, Earth Planet. Sci. Lett., 563, 116880, https://doi.org/10.1016/j.epsl.2021.116880, 2021.
Baker, A., Hartmann, A., Duan, W., Hankin, S., Comas-Bru, L., Cuthbert, M. O., Treble, P. C., Banner, J., Genty, D., Baldini, L. M., Bartolomé, M., Moreno, A., Pérez-Mejías, C., and Werner, M.: Global analysis reveals climatic controls on the oxygen isotope composition of cave drip water, Nat. Commun., 10, 2984. https://doi.org/10.1038/s41467-019-11027-w, 2019.
Bond, G., Kromer, B., Beer, Muscheler, R., Evans, M. N., Showers, W., Hoffmann, S., Lotti-Bond, R., Hajdas, I., and Bonani, G.: Persistent Solar Influence on North Atlantic Climate During the Holocene, Science, 294, 2130–2136, https://doi.org/10.1126/science.1065680, 2001.
Booths, B. B. B., Dunstone, N. J., Halloran, P. R., Andrews, T., and Bellouin, N.: Aerosols implicated as a prime driver of twentieth-century North Atlantic climate variability, Nature, 484, 228–232, https://doi.org/10.1038/nature10946, 2012.
Breitenbach, S. F. M., Rehfeld, K., Goswami, B., Baldini, J. U. L., Ridley, H. E., Kennett, D. J., Prufer, K. M., Aquino, V. V., Asmerom, Y., Polyak, V. J., Cheng, H., Kurths, J., and Marwan, N.: COnstructing Proxy Records from Age models (COPRA), Clim. Past, 8, 1765–1779, https://doi.org/10.5194/cp-8-1765-2012, 2012.
Broccoli, A. J., Dahl, K. A., and Stouffer, R. J.: Response of the ITCZ to Northern Hemisphere cooling, Geophys. Res. Lett., 33, L01702, https://doi.org/10.1029/2005GL024546, 2006.
Campos, J. L. P. S., Cruz, F. W., Ambrizzi, T., Deininger, M., Vuille, M., Novello, V. F., and Strikis, N. M.: Coherent South American Monsoon Variability During the Last Millennium Revealed Through High-Resolution Proxy Records, Geophys. Res. Lett., 46, 8261–8270, https://doi.org/10.1029/2019GL082513, 2019.
Campos, M. C., Chiessi, C. M., Novello, V. F., Crivellari, S., Campos, J. L. P. S., Albuquerque, A. L. S., Venancio, I. M., Santos, T. P., Melo, D. B., Cruz, F. W., Sawakuchi, A. O., and Mendes, V. R.: South American precipitation dipole forced by interhemispheric temperature gradient, Sci. Rep., 12, 10527, https://doi.org/10.1038/s41598-022-14495-1, 2022.
Cheng, H., Edwards, R. L., Shen, C.-C., Polyak, V. J., Asmerom, Y., Woodhead, J., Hellstrome, J., Wang, Y., Kong, X., Spötlg, C., Wang, X., and Alexander Jr., E. C.: Improvements in 230Th dating, 230Th and 234U half-life values and U-Th isotopic measurements by multi-collector inductively coupled plasma mass spectrometry, Earth Planet. Sci. Lett., 371–372, 82–91, https://doi.org/10.1016/j.epsl.2013.04.006, 2013.
Chiessi, C. M., Mulitza, S., Taniguchi, N. K., Prange, M., Campos, M. C., Häggi, C., Schefuß, E., Pinho., T. M. L., Frederichs, T., Portilh-Ramos, R. C., Souza, S. H. M., Crivellari, S., and Cruz, F. W.: Mid- to late-Holocene contraction of the Intertropical Convergence Zone over northeastern South America, Paleocean. Paleoclim., 36, e2020PA003936, https://doi.org/10.1029/2020PA003936, 2021.
Cruz, F. W., Vuille, M., Burns, S. J., Wang, X., Cheng, H., Werner, M., Edwards, R. L., Karman, I., Auler, A. S., and Nguyen, H.: Orbitally driven east-west antiphasing of South American precipitation, Nat. Geosci., 2, 210–214, https://doi.org/10.1038/ngeo444, 2009.
Dansgaard, W.: Stable isotopes in precipitation, Tellus, 4, 436–468, https://doi.org/10.1111/j.2153-3490.1964.tb00181.x, 1964.
De Oliveira, P. E., Barreto, A. M. F., and Suguio, K.: Late Pleistocene-Holocene climatic and vegetational history of the Brazilian Caatinga: the fossil dunes of the middle São Francisco River, Palaeogeogr. Palaeoclimatol. Palaeoecol., 152, 319–337, https://doi.org/10.1016/S0031-0182(99)00061-9, 1999.
Della Libera, M. E., Novello, V. F., Cruz, F. W., Orrison, R., Vuille, M., Maezumi, S. Y., de Souza, J., Cauhy, J., Campos, J. L. P. S., Ampuero, A., Utida, G., Stríkis, N. M., Stumpf, C. F., Azevedo, V., Zhang, H., Edwards, R. L., and Cheng, H.: Paleoclimatic and paleoenvironmental changes in Amazonian lowlands over the last three millennia, Quaternary Sci. Rev., 279, 107383, https://doi.org/10.1016/j.quascirev.2022.107383, 2022.
Edwards, R. L., Cheng, H., and Wasserburg, J.: 238U-234U-230Th-232Th systematics and the precise measurement of time over the past 500,000 years, Earth Planet. Sci. Lett, 81, 175–192, https://doi.org/10.1016/0012-821X(87)90154-3, 1987.
Erasmi, S., Maurer, F., Petta, R. A., Gerold, G., and Barbosa, M. P.: Interannual variability of the Normalized Difference Vegetation Index over Northeast Brazil and its relation to rainfall and El Niño Southern Oscillation, Geo-Öko, 30, 185–206, 2009.
Fausto, B.: História do Brasil, Editora Universidade de São Paulo, São Paulo, 12th edn., 660 pp., ISBN 85-314-0240-9, 2006.
Fohlmeister, J.: A statistical approach to construct composite climate records of dated archives, Quat. Geochronol., 14, 48–56, https://doi.org/10.1016/j.quageo.2012.06.007, 2012.
Galloway, J. H.: Northeast Brazil 1700–50: The agricultural crisis re-examined, J. Hist. Geogr., 1, 21–38, https://doi.org/10.1016/0305-7488(75)90073-0, 1975.
Gomes, H. B., Ambrizzi, T., Herdies, D. L., Hodges, K., and da Silva, B. F. P.: Easterly Wave Disturbances over Northeast Brazil: An Observational Analysis, Adv. Meteorol., 2015, 176238, https://doi.org/10.1155/2015/176238, 2015.
Grazulis, S., Chateigner, D., Downs, R. T., Yokochi, A. F. T., Quirós, M., Lutterotti, L., Manakova, E., Butkus, J., Moeck., P., and Le Bail, A.: Crystallography Open Database – an open-access collection of crystal structures, J. Appl. Crystallogr., 42, 726–729, https://doi.org/10.1107/S0021889809016690, 2009.
Haug, G., Hughen, K. A., Sigman, D. M., Peterson, L. C., and Röhl, U.: Southward migration of the Intertropical Convergence Zone through the Holocene, Science, 293, 1304–1308, https://doi.org/10.1126/science.1059725, 2001.
He, Z., Dai, A., and Vuille, M.: The Joint Impacts of Atlantic and Pacific Multidecadal Variability on South American Precipitation and Temperature, J. Climate, 34, 7959–7981, https://doi.org/10.1175/JCLI-D-21-0081.1, 2021.
Hue, S. M.: Primeiras Cartas do Brasil 1551–1555: Introdução e notas, Jorge Zahar Editor, Rio de Janeiro, 147 pp., ISBN 8571109079, 2006.
IAEA/GNIP: Global Network of Isotopes in Precipitation, The GNIP Database, https://nucleus.iaea.org/wiser (last access: 20 August 2021), 2021.
INMET – Instituto Nacional de Meteorologia: Banco de Dados Meteorológicos para Ensino e Pesquisa, http://www.inmet.gov.br/ (last access 5 November 2021), 2021.
Jackson, L. C., Kahana, R., Graham, T., Ringer, M. A., Woollings, T., Mecking, J. V., and Wood, R. A.: Global and European climate impacts of a slowdown of the AMOC in a high resolution GCM, Clim. Dynam, 45, 3299–3316, https://doi.org/10.1007/s00382-015-2540-2, 2015.
Jaffey, A. H., Flynn, K. F., Glendenin, L. E., Bentley, W. C., and Essling, A. M., Precision measurement of half-lives and specific activities of 235U and 238U, Phys. Rev. C, 4, 1889–1906, https://doi.org/10.1103/PhysRevC.4.1889, 1971.
Kayano, M. T., Andreoli, R. V., and de Souza, R. A.: Pacific and Atlantic multidecadal variability relations to the El Niño events and their effects on the South American rainfall, Int. J. Clim., 40, 2183–2200, https://doi.org/10.1002/joc.6326, 2020.
Kayano, M. T., Cerón, W. L., Andreoli, R. V., Souza, R. A. F., Avila-Diaz, A., Zuluaga, C. F., and Carvalho, L. M. V.: Does the El Niño-Southern Oscillation Affect the Combined Impact of the Atlantic Multidecadal Oscillation and Pacific Decadal Oscillation on the Precipitation and Surface Air Temperature Variability over South America?, Atmosphere, 13, 231, https://doi.org/10.3390/atmos13020231, 2022.
Knight, J. R., Folland, C. K., and Scaife, A. A.: Climate impacts of the Atlantic Multidecadal Oscillation, Geophys. Res. Let., 33, L17706, https://doi.org/10.1029/2006GL026242, 2006.
Lachniet, M. S., Bernal, J. P., Asmerom, Y., and Polyak, V.: Uranium loss and aragonite–calcite age discordance in a calcitized aragonite stalagmite, Quat. Geochron., 14, 26–37, https://doi.org/10.1016/j.quageo.2012.08.003, 2012.
Lapointe, F., Bradley, R. S., Francus, P., Balascio, N. L., Abbott, M. B., Stoner, J. S., St-Onge, G., De Coninck, A., and Labarre, T.: Annually resolved Atlantic Sea surface temperature variability over the past 2,900 y, PNAS, 117, 27171–27178, https://doi.org/10.1073/pnas.2014166117, 2020.
Lechleitner, F. A., Breitenbach, S. F. M., Rehfeld, K., Ridley, H. E., Asmerom, Y., Prufer, K. M., Marwan, N., Goswami, B., Kennett, D. J., Aquino, V. V., Polyak, V., Haug, G. H., Eglinton, T. I., and Baldini, J. U. L.: Tropical rainfall over the last two millennia: Evidence for a low-latitude hydrologic seesaw, Sci. Rep., 7, 45809, https://doi.org/10.1038/srep45809, 2017.
Lenters, J. D. and Cook, K. H.: On the origin of the Bolivian High and related circulation features of the South American climate, J. Atmos. Sci., 54, 656–677, https://doi.org/10.1175/1520-0469(1997)054<0656:OTOOTB>2.0.CO;2, 1997.
Levine, A. F. Z., Frierson, D. M. W., and McPhaden, M. J.: AMO Forcing of Multidecadal Pacific ITCZ Variability, J. Climate, 31, 5749–5764, https://doi.org/10.1175/JCLI-D-17-0810.1, 2018.
Lima, J. R. and Magalhães, A. R.: Secas no Nordeste: registros históricos das catástrofes econômicas e humanas do século 16 ao século 21, Parcer. Estratég., 23, 191–212, 2018.
Maksic J., Shimizu, M. H., Kayano, M. T., Chiessi, C. M., Prange, M., and Sampaio, G.: Influence of the Atlantic Multidecadal Oscillation on South American Atmosphere Dynamics and Precipitation, Atmosphere, 13, 1778, https://doi.org/10.3390/atmos13111778, 2022.
Marengo, J. A. and Bernasconi, M.: Regional differences in aridity/drought conditions over Northeast Brazil: present state and future projections, Clim. Chang., 129, 103–115, https://doi.org/10.1007/s10584-014-1310-1, 2015.
McDonough, W. F. and Sun, S.-s.: The composition of the Earth, Chem. Geol., 120, 223–253, https://doi.org/10.1016/0009-2541(94)00140-4, 1995.
Melo, A. C. C., Castro, D. L., Bezerra, F. H. R., and Bertotti, G.: Rift fault geometry and evolution in the Cretaceous Potiguar Basin (NE Brazil) based on fault growth models, J. South Am. Earth Sci., 71, 96–107, https://doi.org/10.1016/j.jsames.2016.07.006, 2016.
Novello, V. F., Cruz, F. W., Karmann, I., Burns, S. J., Stríkis, N. M., Vuille, M., Cheng, H., Edwards, R. L., Santos, R. V., Frigo, E., and Barreto, E. A. S.: Multidecadal climate variability in Brazil's Nordeste during the last 3000 years based on speleothem isotope records, Geophys. Res. Lett., 39, L23706, https://doi.org/10.1029/2012GL053936, 2012.
Novello, V. F., Cruz, F. W., Moquet, J. S., Vuille, M., de Paula, M. S., Nunes, D., Edwards, R. L., Cheng, H., Karmann, I., Utida, U., Stríkis, N. M., and Campos, J. L. P. S.: Two Millennia of South Atlantic Convergence Zone Variability Reconstructed from Isotopic Proxies, Geophys. Res. Lett., 45, 1–7, https://doi.org/10.1029/2017GL076838, 2018.
Novello, V. F., Cruz, F. W., Vuille, M., Campos, J. L. P. S., Stríkis, N. M., Apaéstegui, J., Moquet, J. S., Azevedo, V., Ampuero, A., Utida, G., Wang, X., Paula-Santos, G. M., Jaqueto, P., Pessenda, L. C. R., Breecker, D. O., and Karmann, I.: Investigating δ13C values in stalagmites from tropical South America for the last two millennia, Quaternary Sci. Rev., 255, 106822, https://doi.org/10.1016/j.quascirev.2021.106822, 2021.
Orrison, R., Vuille, M., Smerdon, J. E., Apaéstegui, J., Azevedo, V., Campos, J. L. P. S., Cruz, F. W., Della Libera, M. E., and Stríkis, N. M.: South American Summer Monsoon variability over the last millennium in paleoclimate records and isotope-enabled climate models, Clim. Past, 18, 2045–2062, https://doi.org/10.5194/cp-18-2045-2022, 2022.
Paquette, J. and Reeder, R. J.: Single-crystal X-ray structure refinements of two biogenetic magnesian calcite crystals, Am. Mineral., 75, 1151–1158, 1990.
Pereira, N. S., Clarke, L. J., Chiessi, C. M., Kilbourne, K. H., Crivellari, S., Cruz, F. W., Campos, J. L. P. S., Yu, T.-L., Shen, C.-C., Kikuchi, R. K. P., Pinheiro, B. R., Longo, G. O., Sial, A. N., and Felis, T.: Mid to late 20th century freshening of the western tropical South Atlantic triggered by southward migration of the Intertropical Convergence Zone, Palaeogeogr. Palaeoclimatol. Palaeoecol., 597, 111013, https://doi.org/10.1016/j.palaeo.2022.111013, 2022.
Pessenda, L. C. R., Gouveia, S. E. M., Ribeiro, A. S., De Oliveira, P. E., and Aravena, R.: Late Pleistocene and Holocene vegetation changes in northeastern Brazil determined from carbon isotopes and charcoal records in soils, Palaeogeogr. Palaeoclimatol. Palaeoecol., 297, 597–608, https://doi.org/10.1016/j.palaeo.2010.09.008, 2010.
Pessoa-Neto, O. C.: Estratigrafia de sequências da plataforma mista neogênica na Bacia Potiguar, margem equatorial brasileira, Revista Bras. Geociênc., 33, 263–278, 2003.
Pokroy, B., Fieramosca, J. S., Von Dreele, R. B., Fitch, A. N., Caspi, E. N., and Zolotoyabko, E.: Atomic structure of biogenic aragonite, Chem. Mater., 19, 3244–3251, https://doi.org/10.1021/cm070187u, 1989.
Richards, D. and Dorale, J.: Uranium-series chronology and environmental applications of speleothems, Rev. Mineral., 52, 407–460, https://doi.org/10.2113/0520407, 2003.
Rosado, J. V.-U. (org): Memorial da Seca, Brasília, Coleção Mossoroense, no. 163, Centro Gráfico do Senado Federal/ESAM, https://colecaomossoroense.org.br/site/acervo-oswaldo-lamartine/ (last access: 25 August 2022), 1981.
Sampaio, P. R. F., Saraiva Jr., J. C., Portela, J. C., and da Silva, J. F.: Agricultural areas to desertification in RN and mitigating measures: the case of settlements Milagres and Terra da Esperança, HOLOS, 36, e5902, https://doi.org/10.15628/holos.2020.5902, 2020.
Schneider, T., Bischoff, T., and Haug, G. H.: Migrations and dynamics of the intertropical convergence zone, Nature, 513, 45–53, https://doi.org/10.1038/nature13636, 2014.
Schneider, U., Becker, A., Finger, P., Meyer-Christoffer, A., Rudolf, B., and Ziese, M.: GPCC Full Data Reanalysis Version 6.0 at 1.0°: Monthly Land-Surface Precipitation from Rain-Gauges built on GTS-based and Historic Data, Deutscher Wetterdienst [data set], https://doi.org/10.5676/DWD_GPCC/FD_M_V7_100, 2011.
Serafim Leite, S. J.: História da Companhia de Jesus no Brasil, Tomo II (Século XVI – A Obra), Civilização Brasileira, Rio de Janeiro, 658 pp., https://archive.org/details/leite-serafim-1938-historia-da-companhia-de-jesus-no-brasil-tomo-2/page/n5/mode/2up (last access: 7 October 2023), 1938.
Silva, O. L., Bezerra, F. H. R., Maia, R. P., and Cazarin, C. L.: Karst landforms revealed at various scales using LiDAR and UAV in semi-arid Brazil: Consideration on karstification processes and methodological constraints, Geomorphol., 295, 611–630, https://doi.org/10.1016/j.geomorph.2017.07.025, 2017.
Steinman, B. A., Stansell, N. D., Mann, M. E., Cooke, C. A., Abbott, M. B., Vuille, M., Bird, B. W., Lachniet, M. S., and Fernandez, A.: Interhemispheric antiphasing of neotropical precipitation during the past millennium, PNAS, 119, e2120015119, https://doi.org/10.1073/pnas.2120015119, 2022.
Sulca, J., Vuille, M., Silva, Y., and Takahashi, K.: Teleconnections between the Peruvian Central Andes and Northeast Brazil during Extreme Rainfall Events in Austral Summer, J. Hydrometeorol., 17, 499–515, https://doi.org/10.1175/JHM-D-15-0034.1, 2016.
Taylor, K. S.: The Economics of Sugar and Slavery in Northeastern Brazil, Agric. Hist., 44, 267–280, 1970.
Treble, P. C., Baker, A., Abram, N. J., Hellstrom, J. C., Crawford, J., Gagan, M. K., Borsato, A., Griffiths, A. D., Bajo, P., Markowska, M., Priestley, S. C., Hankin, S., and Paterson, D.: Ubiquitous karst hydrological control on speleothem oxygen isotope variability in a global study, Commun. Earth Environ., 3, 29, https://doi.org/10.1038/s43247-022-00347-3, 2022.
Undorf, S., Bollasina, M. A., and Hegerl, G. C.: Impacts of the 1900–74 Increase in Anthropogenic Aerosol Emissions from North America and Europe on Eurasian Summer Climate, J. Climate, 31, 8381–8399, https://doi.org/10.1175/JCLI-D-17-0850.1, 2018.
Utida, G., Cruz, F. W., Etourneau, J., Bouloubassi, I., Schefuß, E., Vuille, M., Novello, V., Prado, L. F., Sifeddine, A., Klein, V., Zular, A., Viana, J. C. C., and Turcq, B.: Tropical South Atlantic influence on Northeastern Brazil precipitation and ITCZ displacement during the past 2300 years, Sci. Rep., 9, 1698, https://doi.org/10.1038/s41598-018-38003-6, 2019.
Utida, G., Cruz, F. W., Santos., R. V., Sawakuchi, A. O., Wang, H., Pessenda, L. C. R., Novello, V. F., Vuille, M., Strauss, A. M., Borella, A. C., Stríkis, N. M., Guedes, C. C. F., De Andrade, F. D., Zhang., H., Cheng, H., and Edwards, R. L.: Climate changes in Northeastern Brazil from deglacial to Meghalayan periods and related environmental impacts, Quaternary Sci. Rev., 250, 106655, https://doi.org/10.1016/j.quascirev.2020.106655, 2020.
Vera, C., Higgins, W., Amador, J., Ambrizzi, T., Garreaud, R., Gochis, D., Gutzler, D., Lettenmaier, D., Marengo, J., Mechoso, C. R., Nogues-Paegle, J., Silva Dias, P. L., and Zhang, C.: Toward a Unified View of the American Monsoon Systems, J. Climate, 19, 4977–5000, https://doi.org/10.1175/JCLI3896.1, 2006.
Vuille, M., Burns, S. J., Taylor, B. L., Cruz, F. W., Bird, B. W., Abbott, M. B., Kanner, L. C., Cheng, H., and Novello, V. F.: A review of the South American monsoon history as recorded in stable isotopic proxies over the past two millennia, Clim. Past, 8, 1309–1321, https://doi.org/10.5194/cp-8-1309-2012, 2012.
Wang, X., Edwards, R. L., Auler, A. S., Cheng, H., Kong, X., Wnag, Y., Cruz, F. W., Dorale, J. A., and Chiang, H.-W.: Hydroclimate changes across the Amazon lowlands over the past 45,000 years, Nature, 541, 204–207, https://doi.org/10.1038/nature20787, 2017.
Wong, M. L., Wang, X., Latrubesse, E. M., He, S., and Bayer, M.: Variations in the South Atlantic Convergence Zone over the mid-to-late Holocene inferred from speleothem δ18O in central Brazil, Quaternary Sci. Rev., 270, 107178, https://doi.org/10.1016/j.quascirev.2021.107178, 2021.
Zhang, H., Cai, Y., Tan, L., Qin, S., and An, Z.: Stable isotope composition alteration produced by the aragonite-to-calcite transformation in speleothems and implications for paleoclimate reconstructions, Sediment. Geol., 309, 1–14, https://doi.org/10.1016/j.sedgeo.2014.05.007, 2014.
Zhang, H., Cai, Y., Tan, L., Cheng, H., Qin, S., An, Z., Edwards, R. L., and Ma, L.: Large variations of δ13C values in stalagmites from southeastern China during historical times: implications for anthropogenic deforestation, Boreas, 44, 511–525, https://doi.org/10.1111/bor.12112, 2015.
Ziese, M., Rauthe-Schöch, A., Becker, A., Finger, P., Meyer-Christoffer, A., and Schneider, U.: GPCC Full Data Daily Version 2018 at 1.0°: Daily Land-Surface Precipitation from Rain-Gauges built on GTS-based and Historic Data, Deutscher Wetterdienst [data set], https://doi.org/10.5676/DWD_GPCC/FD_D_V2018_100, 2018.
Zilli, M. T., Carvalho, L. M. V., and Lintnerm, B. R.: The poleward shift of South Atlantic Convergence Zone in recent decades, Clim. Dynam., 52, 2545–2563, https://doi.org/10.1007/s00382-018-4277-1, 2019.
Zular, A., Utida, G., Cruz, F. W., Sawakuchi, A. O., Wang, H., Bícego, M. Giannini, P. C. F., Rodrigues, S. I., Garcia, G. P. B., Vuille, M., Sifeddine, A., Zocatelli, R., Turcq, B., and Mendes, V. R.: The effects of mid-Holocene fluvio-eolian interplay and coastal dynamics on the formation of dune-dammed lakes in NE Brazil, Quaternary Sci. Rev., 196, 137–153, https://doi.org/10.1016/j.quascirev.2018.07.022, 2018.