the Creative Commons Attribution 4.0 License.
the Creative Commons Attribution 4.0 License.
 | 25 Sep 2023
Multi-proxy speleothem-based reconstruction of mid-MIS 3 climate in South Africa
Anna Nele Meckler
Stein-Erik Lauritzen
Torill Brekken
Helen Aase Rokkan
Alvaro Fernandez
Yves Krüger
Jane Adigun
Stéphane Affolter
Markus Leuenberger
The southern coast of South Africa displays a highly dynamical climate as it is at the convergence of the Atlantic and Indian oceans, and it is located near the subtropical/temperate zone boundary with seasonal influence of easterlies and westerlies. The region hosts some key archeological sites with records of significant cognitive, technological and social developments. Reconstructions of the state and variability of past climate and environmental conditions around sites of archeological significance can provide crucial context for understanding the evolution of early humans. Here we present a short but high-resolution record of hydroclimate and temperature in South Africa. Our reconstructions are based on trace elements, calcite and fluid inclusion stable isotopes, as well as fluid inclusion microthermometry, from a speleothem collected in Bloukrantz cave, in the De Hoop Nature Reserve in the southern Cape region of South Africa.
Our record covers the time period from 48.3 to 45.2 ka during marine isotope stage 3. Both δ18Oc and δ13Cc show strong variability and covary with . This correlation suggests that the control on these proxies originates from internal cave processes such as prior carbonate precipitation, which we infer to be related to precipitation amount. The hydroclimate indicators furthermore suggest a shift towards overall drier conditions after 46 ka, coincident with cooling in Antarctica and drier conditions in the eastern part of South Africa corresponding to the summer rainfall zone (SRZ).
Fluid inclusion-based temperature reconstructions show good agreement between the oxygen isotope and microthermometry methods, and results from the latter display little variation throughout the record, with reconstructed temperatures close to the present-day cave temperature of 17.5 ∘C. Overall, the BL3 speleothem record thus suggests relatively stable temperature from 48.3 to 45.2 ka, whereas precipitation was variable with marked drier episodes on sub-millennial timescales.
- Article
(3586 KB) - Full-text XML
-
Supplement
(8681 KB) - BibTeX
- EndNote


The southern region of South Africa (SA) is a key region for the study of human evolution. Episodes of significant cultural changes, seemingly not related to subsistence requirements, have been identified during the Middle Stone Age (MSA), with artifacts such as engraved ochre, an ochre processing kit, engraved ostrich eggshells, bifacial points and perforated marine shell beads, which are considered archeological markers for “symbolically mediated behavior” (e.g., Henshilwood et al., 2011, 2014; Marean et al., 2007; Wurz, 2002). The environmental conditions at the time have been suggested to drive changes either by offering refuge (suitable habitat), allowing for experimentation, or conversely by forcing innovative mechanisms of adaptation (d'Errico, 2003; Wadley, 2021). However, although the number of paleoenvironmental reconstructions in South Africa's southern Cape coastal region during the MSA is increasing (e.g., Bar-Matthews et al., 2010; Braun et al., 2019b, 2020; Chase, 2010; Chase et al., 2021; Strobel et al., 2022), information on past climate in this region still remains sparse. In this study, we apply a suite of traditional and novel approaches to reconstruct the climate in South Africa from a speleothem from Bloukrantz cave that grew during a short interval during marine isotope stage (MIS) 3. Our goal is to cross-validate the various proxies and reconstruct the state and variability of hydroclimate and temperature.
Today, South Africa's climate is marked by different seasonal and spatial rainfall patterns (Fig. 1). During austral winter, the southern westerlies wind belt is displaced northward, bringing precipitation to the southwestern tip of South Africa (winter rainfall zone, WRZ). During austral summer, the westerlies are displaced southwards, allowing easterlies to bring rain to the eastern part of South Africa (summer rainfall zone, SRZ). Bloukrantz Cave and several key archeological sites are located in the junction of these two rain zones, known as the year-round rainfall zone (YRZ), with winter rain accounting for 30 %–60 % of the annual precipitation and no marked seasonality (Carr et al., 2006; Chase and Meadows, 2007; Roffe et al., 2019). Identifying the drivers of climate change in the YRZ is not straightforward as the YRZ is a transition zone between WRZ and SRZ and thus influenced by a variety of mechanisms: Indian Ocean sea surface temperature (SST) and convective and tropical weather systems in the east (Engelbrecht et al., 2015) and the westerlies belt position and intensity, along with the associated frontal systems, in the west (Chase, 2010; Chase and Meadows, 2007).
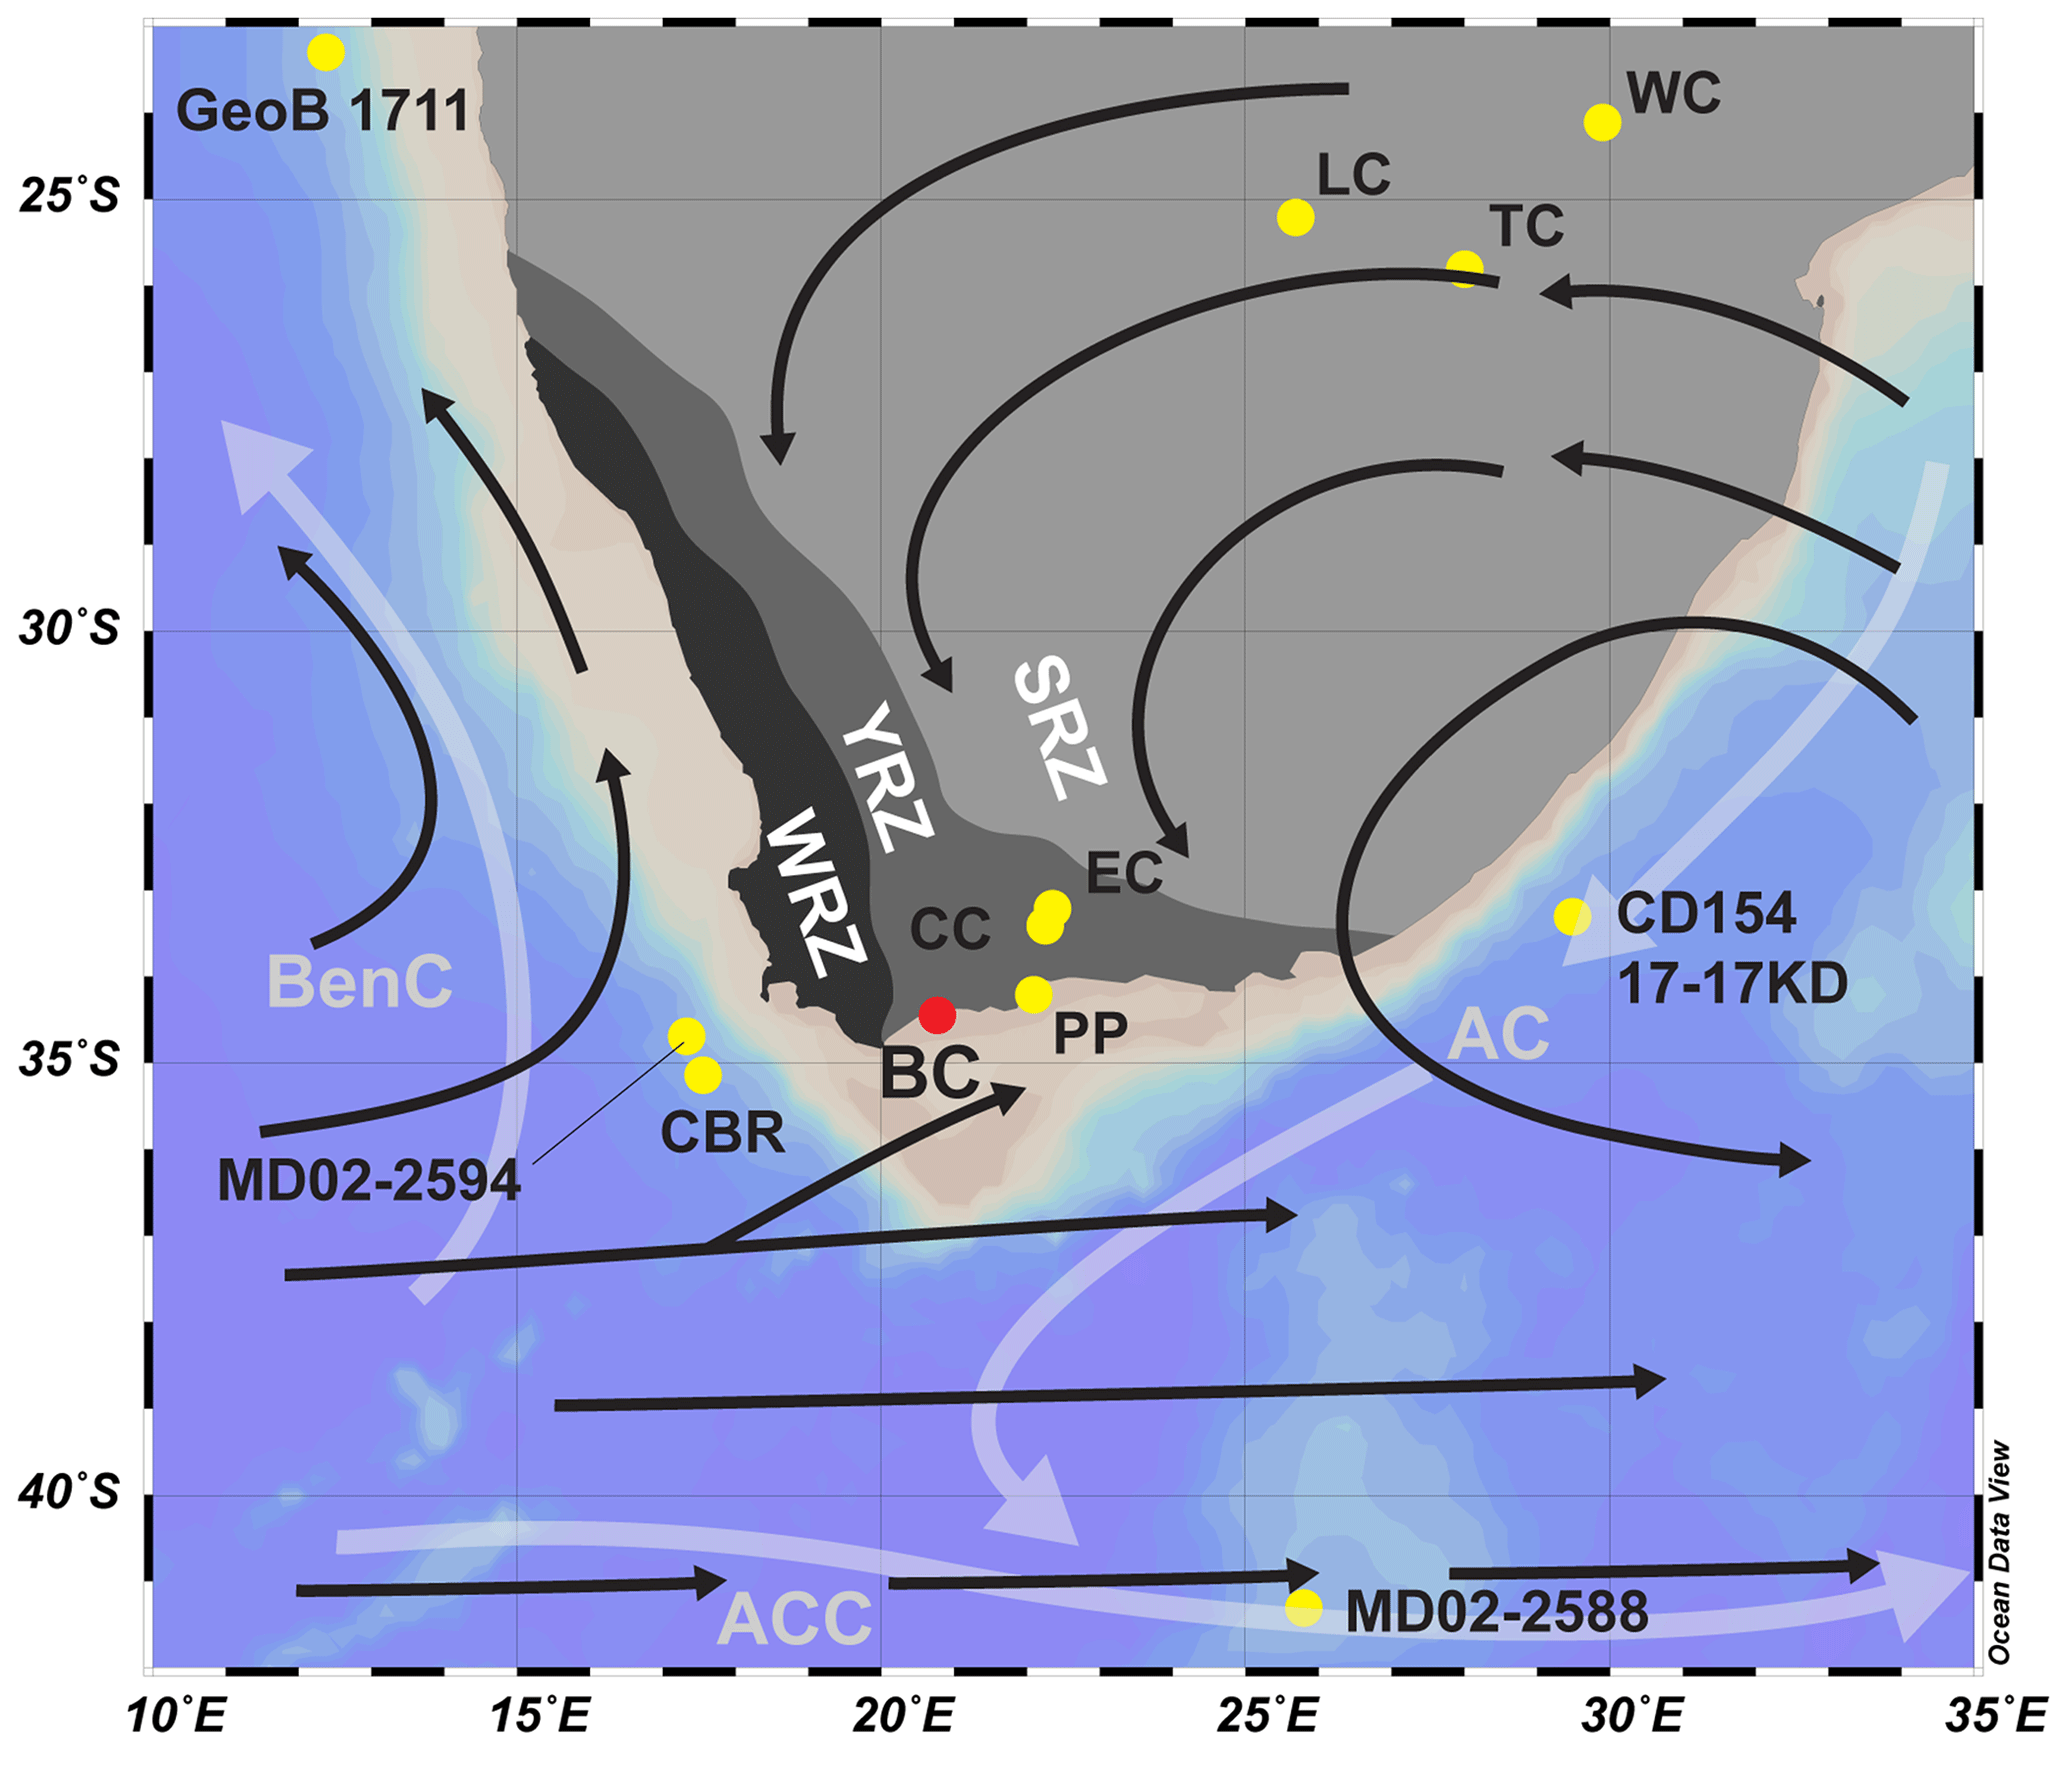
Figure 1Map of southern Africa showing the study site (red circle) with the main rainfall zones (gray shading) and other sites from the literature (yellow circles). Major atmospheric circulation is indicated by thin black arrows and major oceanic currents are indicated by thick white arrows. BC – Bloukrantz cave, WC – Wolkberg cave (Holzkämper et al., 2009), LC – Lobatse cave (Holmgren et al., 1995), TC – Tswaing crater (Partridge et al., 1997), EC – Efflux cave (Braun et al., 2020), CC – Cango cave (Talma and Vogel, 1992; Chase et al., 2021) and PP – Pinnacle Point (Bar-Matthews et al. 2010). Marine cores: MD02-2588 and CD154 17-17K (Simon et al., 2013), GeoB 1711 (Kirst et al., 1999), MD02-2594 (Dyez et al., 2014) and CBR (Peeters et al., 2004). WRZ – winter rainfall zone (dark gray), YRZ – year-round rainfall zone (gray), SRZ – summer rainfall zone (light gray), AC – Agulhas Current, BenC – Benguela Current and ACC – Antarctic Circumpolar Current. This map was created using Ocean Data View (Schlitzer, 2002).
MIS 3, the period between ∼ 60 and 29 ka during the last glacial period, is characterized by a global mean sea level lower than today (Siddall et al., 2008) and globally colder temperature (Van Meerbeeck et al., 2009). Northern Hemisphere ice core proxies reveal substantial millennial-scale variability such as Dansgaard–Oeschger and Heinrich events (Andersen et al., 2004) and associated temperature changes (Huber et al., 2006; Kindler et al., 2014). In the Southern Hemisphere, Antarctic ice core records display similar variability, though of a lesser amplitude (Siddall et al., 2008). The Antarctic ice core record is mimicked by SST reconstructions from sediment cores surrounding the southern tip of the African continent, both in the Indian (e.g., Simon et al., 2013) and the Atlantic sector (e.g., Dyez et al., 2014; Peeters et al., 2004). Mean annual precipitation reconstructions in the SRZ of southern Africa closely follow solar radiation intensity (daily January insolation at 30∘ S) with reduced amplitude variation during MIS 3 compared to MIS 4 and 5 (Partridge et al., 1997). This is illustrated in a speleothem sample from Wolkberg cave, where a drying trend was recorded from ∼ 51 to 46 ka and linked to decreasing solar radiation (Holzkämper et al., 2009). In the YRZ, fynbos pollen numbers indicate a drying period from 60 to 40 ka followed by wetter conditions from 40 to 30 ka (Quick et al., 2016). In the speleothem record, this is illustrated by a marked decrease in the overall number of speleothem samples recovered at ∼ 60 ka, followed by a slight increase from 45 to 30 ka (Braun et al., 2019a). In the Little Karoo region, a composite record (Chase et al., 2021; Talma and Vogel, 1992) shows evidence of a shift from low- to high-latitude forcing dominance at the onset of MIS 4 (∼ 70 ka). In the composite record (Chase et al., 2021), changes in δ13C have been interpreted to reflect changes in rain dominance, with increased summer rain dominance from 59 to 54 ka, from 49 to 47 ka and from 41 to 36 ka. A speleothem from the same region, covering the 88–18 ka time interval, displays trends similar to terrestrial runoff from the Namibian west coast, suggesting a general dominant contribution of winter rains (Braun et al., 2020). Finally, aridity reconstructions indicate variable aridity conditions in the WRZ through MIS 3, although with overall drier conditions compared to MIS 4 (Stuut et al., 2002).
Speleothems are cave deposits (most often Ca carbonates), which can be accurately dated by the U–Th method. They are most commonly used to reconstruct changes in precipitation on the basis of variations in the oxygen isotopic composition (δ18O) of the calcite matrix (Lachniet, 2009). The carbon isotopic composition (δ13C) of speleothem calcite is more complex to interpret, as it can reflect changes in vegetation (C3 vs. C4 plants) and respiration processes above the cave and/or internal cave processes leading to C isotope fractionation (Fohlmeister et al., 2020). The latter are commonly also reflected in variations in ratios of trace elements to Ca, such as or (Stoll et al., 2012). Here we combine both δ18O and δ13C from the calcite (later noted with subscript c), and ratios to infer past changes in precipitation.
Recently, quantitative proxies for cave temperature have been developed (Affek et al., 2008; Blyth and Schouten, 2013; Kluge et al., 2008; Krüger et al., 2011; Vonhof et al., 2006). Cave temperature generally reflects the mean annual air temperature outside of the cave (Poulson and White, 1969), making cave deposits ideal candidates for land temperature reconstructions. The first quantitative temperature reconstruction method that has been proposed is the water–carbonate paleothermometer based on oxygen isotopes. The theoretical background of this approach dates back to the 1950s (Epstein et al., 1951, 1953; Mccrea, 1950; Urey, 1947). In speleothems, however, the application of this thermometer has initially been limited by the lack of knowledge of the water isotopic composition. This information can now be gained from fluid inclusion water isotope (FIWI) measurements (e.g., Affolter et al., 2014; Fernandez et al., 2023; Matthews et al., 2021; Vonhof et al., 2006; Warken et al., 2022; Wassenburg et al., 2021; Wortham et al., 2022), which reveal the isotopic composition of former drip water preserved in microscopic inclusions in the speleothem calcite. Here we combine temperature estimates based on the difference in oxygen isotopic composition of fluid inclusions and calcite with another, independent temperature proxy, namely fluid inclusion microthermometry. The microthermometry approach uses liquid–vapor homogenization temperatures to determine the density of the enclosed drip water (Krüger et al., 2011; Løland et al., 2022). The suite of methods applied here allows us to derive multi-proxy records of both hydroclimate and temperature.
2.1 Site description and setting
Bloukrantz cave (34∘27.557′ S, 20∘46.697′ E, 10–25 m a.s.l.) is located along the coast of South Africa in the De Hoop Nature Reserve in the southern Cape region (Noah, 2011). The cave is a composite marine abrasion cave formed in quartzite, where the entrance is almost completely closed by travertine derived from overlying aeolian calcarenite dunes. The narrow entrance leads to a first chamber followed by a steep slope down to the main room (Fig. S1 in the Supplement). The interior of the cave is largely filled with columnar stalagmites that have grown since the entrance wall closed the cave. The speleothem used in this study (BL3) was collected in a smaller chamber adjacent to the main room (Adigun, 2016). The cave floor mainly consists of sand mixed with bat guano. An Onset HOBO U23-001 ProV2 temperature logger was placed in the cave in February 2018 and data were collected in January 2019 and March 2020. In 2018, dripping was not active, and the logged relative humidity (RH) was ∼ 90 %. During the two subsequent visits, in January 2019 and March 2020, dripping in the cave was active and the logged RH was ∼ 100 % (Fig. S2). Temperature in the cave was fairly stable between February 2018 and March 2020 and varied from 16.4 to 18.8 ∘C with a mean annual temperature of 17.5 ± 0.5 ∘C ±1 SD. Slightly further inland, at the Potberg station (34∘22.623′ S, 20∘02.044′ E, 176 m a.s.l.), the mean annual temperature was 16 ± 5 ∘C for the same period with annual precipitation of 220–380 mm. At Klipdrift sea cave (34∘27.096′ S, 20∘43.458′ E), a few kilometers west along the coast, a mean annual temperature of 17.6 ± 0.3 ∘C ±1 SD was recorded. The similar temperatures recorded at the two sites allow us to exclude potential warming from guano degradation at Bloukrantz cave as the Klipdrift sea cave does not shelter a bat colony. Bloukrantz cave is ideally positioned in the YRZ to provide local paleoclimate reconstructions in relation with key archeological sites such as Blombos cave and Klipdrift shelter.
2.2 Sample description
Sample BL3 (Figs. 2, S3) is 425 mm long and 105 mm wide at its widest (close to mid-height). The stalagmite displays two distinct growth episodes with a clear hiatus at 198 mm from the top (Fig. S3). The pre-hiatus part consists of white milky calcite with microcrystalline fabric according to the classification scheme of Frisia (2015), and it displays multiple changes in the direction of the stalagmite growth axis, most likely linked to lateral shifts of the dripping site. After the hiatus, stalagmite BL3 features a 100 mm long straight section of translucent calcite with brittle columnar fabric (Frisia, 2015) that also covers the flanks of the lower part (Fig. S4). The top 95 mm consist again of microcrystalline, milky calcite and shows clear layering.
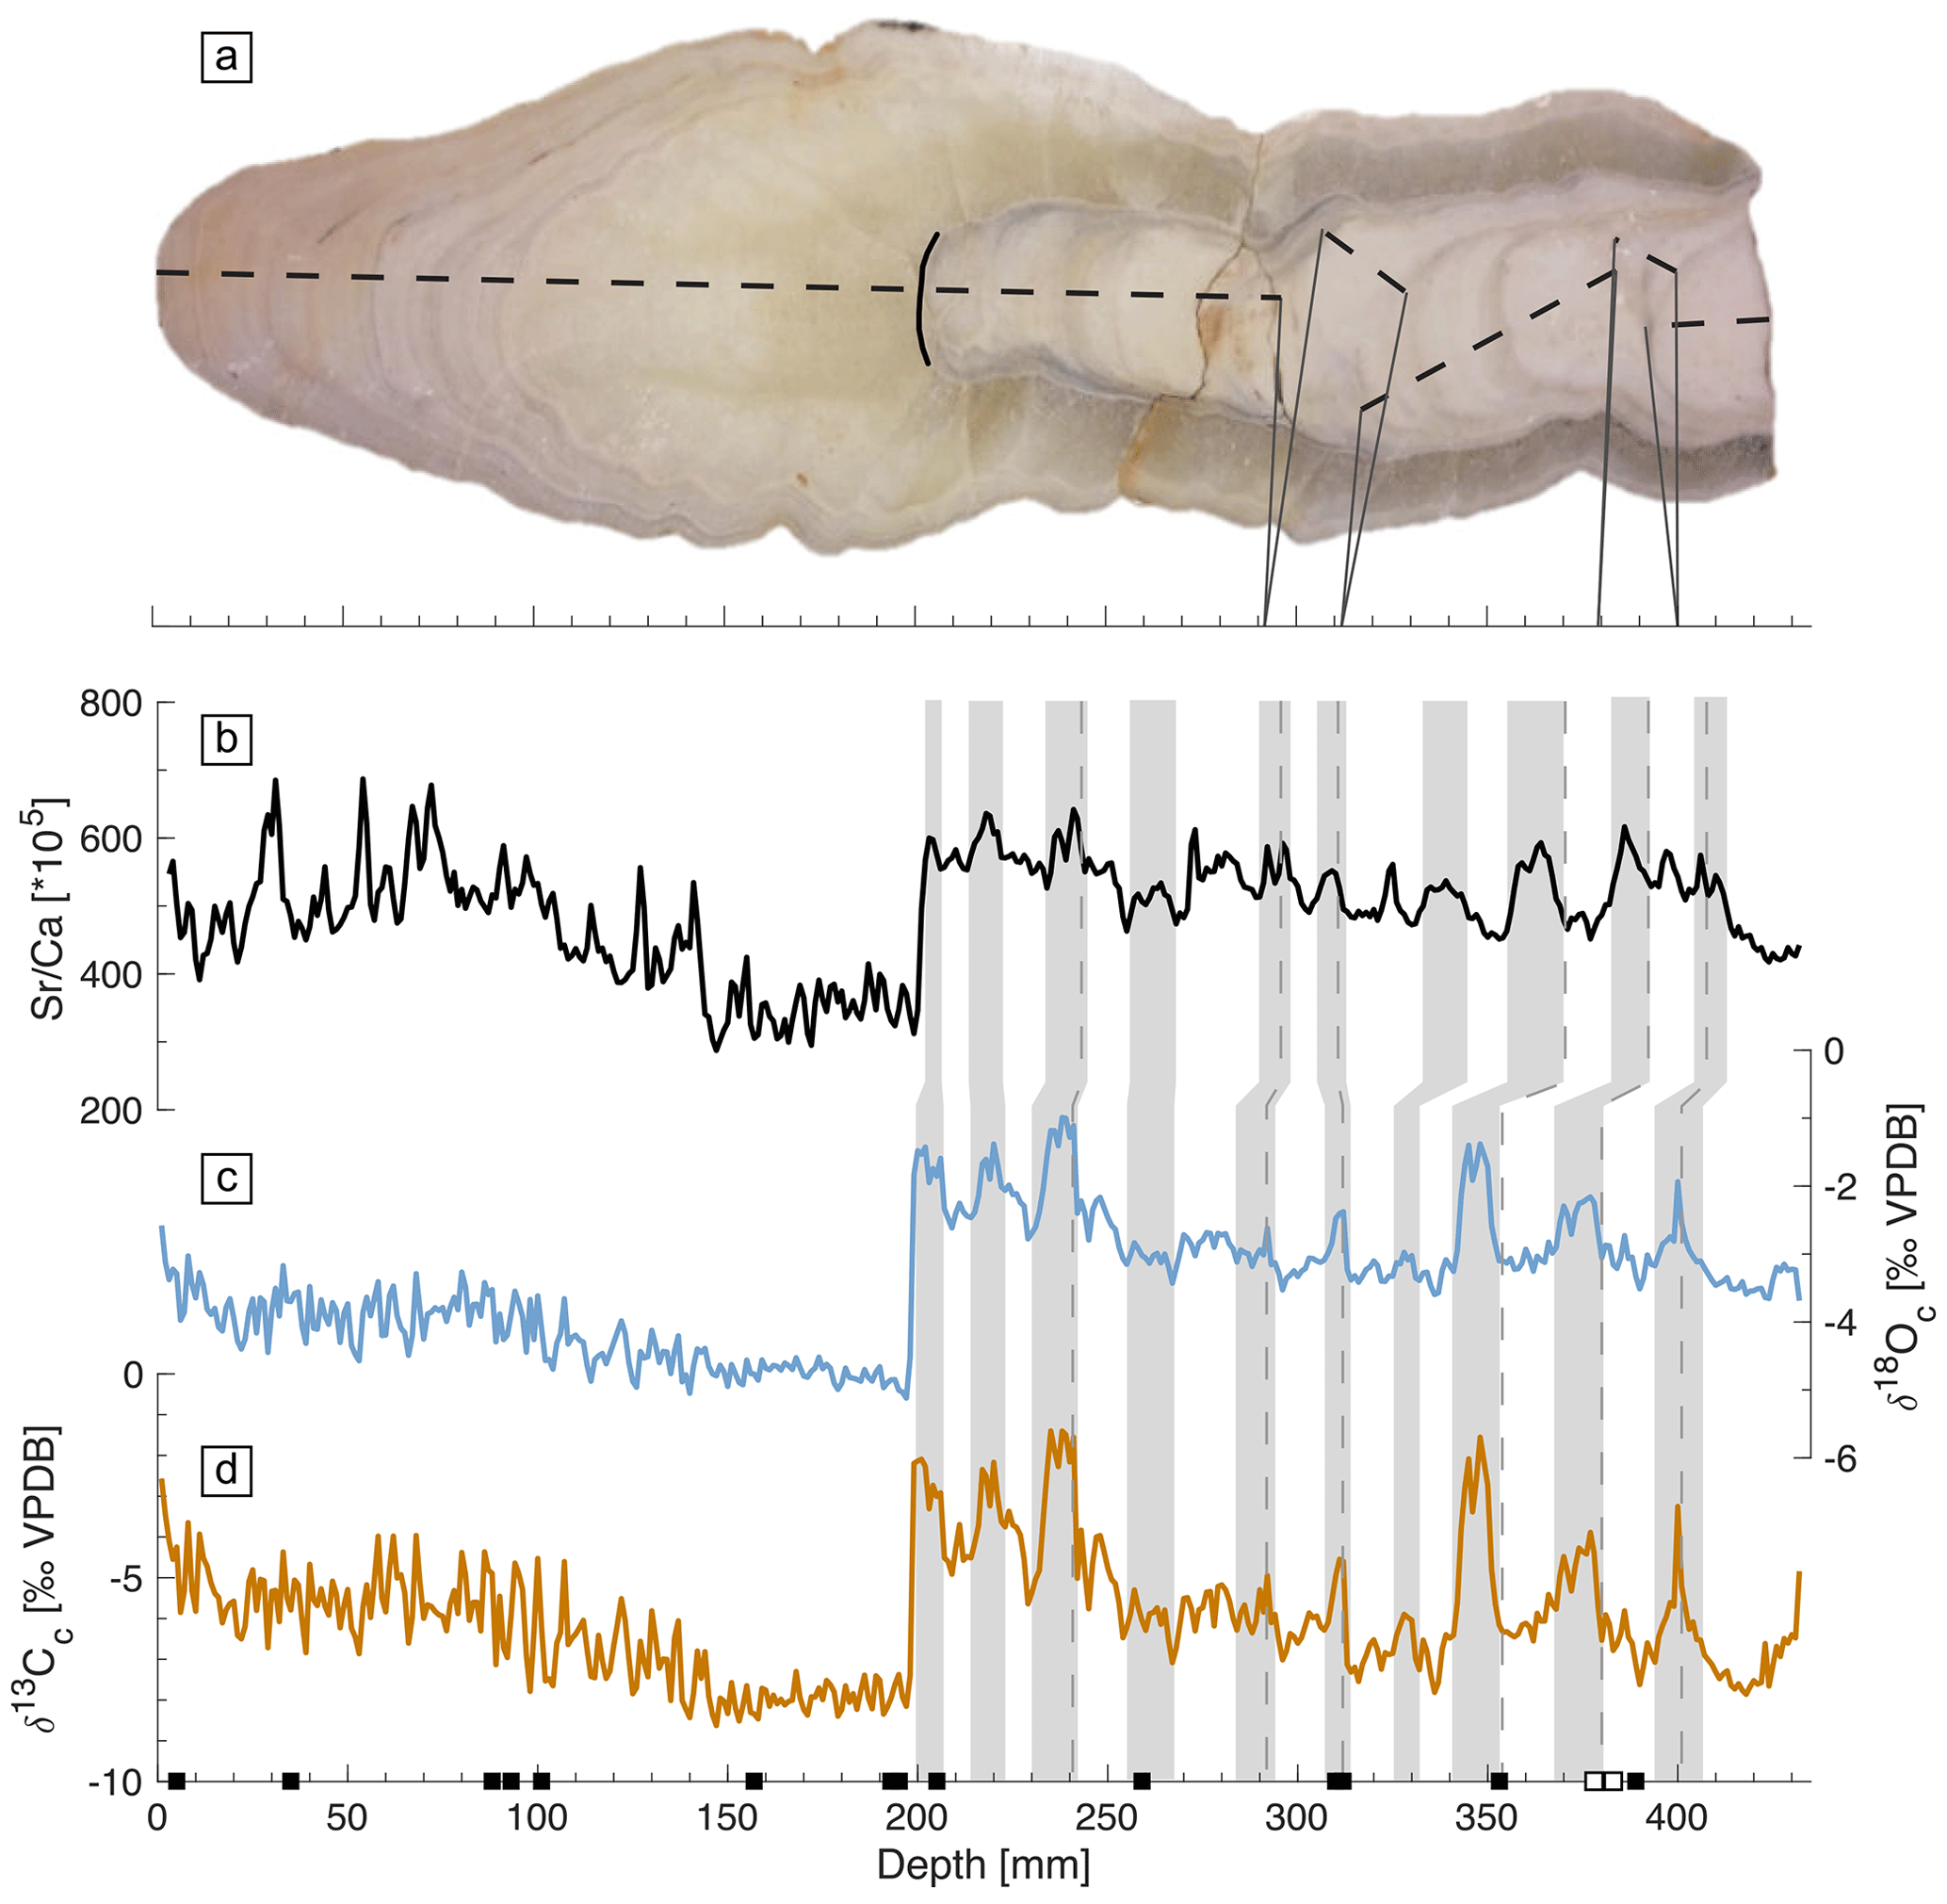
Figure 2(a) BL3 stalagmite. Dashed lines indicate the isotope transects along the main growth axes of the speleothem. The solid black line indicates the major hiatus between MIS 3 and the Holocene (see text). Sr Ca and isotope analyses were measured on two different slabs, resulting in slight offsets between the records (illustrated by the gray shading). (b) Sr Ca as count-rate ratios from X-ray fluorescence (XRF) scanning, (c) δ18Oc, (d) δ13Cc. Dashed lines indicate the onset of darker layers in the stalagmite. Dating depths are indicated by the black square symbols on the x axis (the open symbols correspond to the two samples measured at the Isotope Laboratory at Xi’an Jiaotong University).
In this study, we focus mainly on the lower part of BL3, which formed during MIS 3, while the upper part formed during the Holocene. The clear growth axis changes observed at 241, 292, 312, 354, 380 and 401 mm (dashed lines in Fig. 2) are associated with darker layers. The surfaces of these dark layers show slight dissolution features and indicate potential short-term growth interruptions of the stalagmite (Silvia Frisia, personal communication, 2020).
Apart from these dark hiatus layers, inspections of thin sections did not reveal any significant changes in the calcite fabric throughout the MIS 3 part of the sample. The orientation of the calcite crystals in the microcrystalline fabric does not exhibit preferential crystallographic orientation, which is indicated by the tipped terminations of small intra-crystalline fluid inclusions. The calcite fabric as a whole is quite porous, which explains its milky appearance. Fluid inclusions, both intra- and inter-crystalline, are abundant but of small size. A large portion of the inclusions is two-phase, containing liquid water and a gas bubble. It is not yet clear whether the gas bubble contains air that might have been trapped during the formation of inclusions or water vapor that would rather indicate post-formation water loss or volume alteration of the inclusions. Mono-phase liquid inclusions, in contrast, were found to be relatively sparse.
2.3 Sample preparation
The sample was cut lengthwise into 1 cm thick slabs. One slab was used for X-ray fluorescence (XRF) scanning, while a second slab cut from the other half of the stalagmite was used for dating, isotopic analyses and microthermometry analyses. Since stable isotopes and trace elements were measured on different slabs, the and the stable isotopes transects show slight offsets which can be accounted for by tracing visible layers in both slabs (gray bars in Fig. 2 connect equivalent features).
2.3.1 U–Th dating
Subsamples for dating were drilled using a Sherline 5410 milling stage mounted with a 1.5 mm drill bit. The chemical separation procedure was largely derived from Edwards (1988). Briefly, ∼ 250 mg of carbonate powder was spiked using a mixed solution of 229Th–233U–236U, calibrated using a Harwell uraninite (HU-1) solution considered at secular equilibrium. After dissolution with concentrated HNO3, Fe precipitates were formed by addition of clean Fe and stepwise addition of NH4OH. After centrifugation the Fe precipitates were dissolved in HCl and loaded onto AG1X8 resin, where Th was separated from U. Each fraction was then purified by another pass through AG1X8 resin for Th and U-TEVA resin for U. Isotopic ratios were measured at the Department of Earth Sciences at the University of Bergen in dry plasma mode on a Nu Plasma II instrument upgraded with a Plasma 3 source. Isotopic ratios were measured by peak jumping on a secondary electron multiplier (SEM). Mass bias was corrected using the spike ratio. A HU-1 solution was used as a standard solution to monitor analytical sessions. Activity ratios were calculated using decay constant values from Cheng et al. (2013). Ages were calculated using the Excel Isoplot add-in 3.75 (Ludwig, 2003) without decay constant uncertainties. All U series data reported in tables and figures are presented with an uncertainty of ±2 SD. The bulk Earth ratio of 3.8 was used to correct 230Th ages for detrital Th contamination (Taylor and McLennan, 1985). Two samples were additionally dated at the Isotope Laboratory at Xi'an Jiaotong University (see supplement).
2.3.2 Trace elements
ratios can be rapidly obtained by non-destructive XRF scanning (Scroxton et al., 2018). For this study, ratios were measured on an ITRAX XRF core scanner from Cox Analytical Systems (Gothenburg, Sweden) using a 3 kW molybdenum (Mo) X-ray tube. The voltage was set to 28 kV, current to 28 mA, resolution to 200 µm and exposure time to 20 s (Rokkan, 2019). The slab on which the XRF scanning was performed was further cut in smaller pieces and placed onto a flat plexiglass support inserted on top of the rail system. The stalagmite pieces were rotated so that the scans were parallel to the growth axes. The data presented here are the average of three parallel scans performed a few millimeters apart.
2.3.3 Calcite stable isotopes
Using the milling stage, carbonate powder was milled continuously in 1 mm increments along transects following the growth axis of BL3. Oxygen and carbon isotope ratios were measured on 30–50 µg samples following routine protocols at FARLAB (Facility for advanced isotopic research and monitoring of weather, climate and biogeochemical cycling) on a Thermo Fisher Scientific MAT253 isotope ratio mass spectrometer with a Kiel IV carbonate preparation device. The δ13Cc and δ18Oc values were calibrated against an in-house marble standard and NBS18 and are expressed in per mil (‰) against Vienna Peedee Belemnite (VPDB). Reproducibility of standard measurements was better than 0.10 ‰ (1 SD) for δ18O and better than 0.05 ‰ (1 SD) for δ13C.
2.3.4 Microthermometry (liquid–vapor homogenization temperature)
The microthermometric approach uses the density of water in stalagmite fluid inclusions as a proxy to reconstruct cave temperature. The application of the microthermometry method to fluid inclusions in stalagmites is described in detail by Krüger et al. (2011) and sample preparation is described in Løland et al. (2022). Briefly, blocks of 20 mm width and 30–40 mm length were cut from the second slab alongside the isotope transects. Then, ∼ 300 µm thick sections were cut from the calcite blocks with a low-speed saw (Buehler Isomet), and these unpolished thick sections were broken into smaller pieces of ∼ 4 × 4 mm to fit on the sample holder of the microscope heating/freezing stage (Linkam THMS600). Individual mono-phase fluid inclusions were selected for analysis and cooled to 5 ∘C. At this temperature the inclusion water is in a metastable liquid state, and a femtosecond laser pulse was used to nucleate a vapor bubble (Krüger et al., 2007). Upon subsequent heating the vapor bubble becomes progressively smaller and eventually disappears at the liquid–vapor homogenization temperatures (Th(obs)). The measured Th(obs) values were then corrected for surface tension effects using an additional measurement of vapor bubble radius at known temperature, and a thermodynamic model (Marti et al., 2012) was used to calculate the water density and thus the formation temperature of the fluid inclusion. Information on the original density of the former drip water can be obtained only from mono-phase liquid fluid inclusions. Measurements of Th(obs) and of the bubble radii were challenging because of the small size of the inclusions (100–3000 µm3). In some cases, the collapse of the vapor bubble at Th(obs) could not be observed directly. In these situations, a temperature cycling procedure with stepwise heating and subsequent cooling was applied to determine the homogenization temperature precisely. Bubble images for the radius measurements were taken at 5.1 ∘C, at which the vapor bubble in a calcite confined system reaches maximum size. Between 5 and 20 inclusions were measured in triplicate for each layer, depending on the number and size of the inclusions. Mean temperatures of coeval inclusions from the same growth layers were considered a best estimate of the stalagmite formation temperature at the respective sample position. Temperature uncertainties are reported as 2 standard error (SE) of the mean.
2.3.5 Fluid inclusion water isotopes
The remaining part of the blocks was divided in 3–5 mm wide lamella cut along the curved stalagmite growth layers using a diamond wire saw (Well 3421). These layer-parallel samples were then split into coeval subsamples of about 0.2–0.4 g for replicate measurements of fluid inclusion water isotopes. A total of 31 layers were analyzed, 25 at FARLAB in Bergen and 6 at the University of Bern. The analytical setup in Bergen is described by Sodemann et al. (2023). Briefly, aliquots of > 100 mg were crushed in a heated (120 ∘C) crusher device (similar to that described by De Graaf et al., 2020) connected to a Picarro L2130-i laser spectrometer. A micro-drop device ensures a stable humidity background in the air stream that purges the crusher. After loading the sample into the preheated crusher, it took about 15–20 min to achieve a stable water background in the system. The fluid inclusion water was then released by crushing the sample, and its isotopic composition was determined by subtracting the water background from the signal (Affolter et al., 2014). The analytical setup in Bern is described in Affolter et al. (2014).
FIWI analyses could be performed only in the MIS 3 part of the stalagmite and on the topmost layers because water yields from the columnar fabric of the Holocene part were too low. Data accuracy and reproducibility were estimated using in-house water standards sealed in borosilicate capillaries and crushed in the analytical line. Reproducibility was < 0.4 ‰ for δ18O and < 1.2 ‰ for δ2H (±1 SD). Results are reported as the average of three replicates per layer and uncertainties are calculated as 1 SD or set as 0.4 ‰ for δ18Ow and 1.2 ‰ for δ2Hw, whichever was larger. FIWI temperatures were calculated using the empirical relationship from Tremaine et al. (2011), with δ18Oc measured on the crushed carbonate remaining after water isotope analyses. Uncertainties are reported as ±1 SD and include error propagation of both water and calcite δ18O.
3.1 U–Th dating and age model
A total of 21 dates were obtained and range from 1.29 ± 0.01 to 47.54 ± 0.37 ka (see supplementary material). Two dates (at 428 and 339 mm) were rejected as clear outliers. The age–depth model was calculated using the StalAge algorithm in R (Scholz and Hoffmann, 2011) as two distinct sections, before and after the hiatus, and is reported with a 95 % confidence interval. The two dates analyzed at the Isotope Laboratory at Xi'an Jiaotong University have been included in the age–depth model. The age–depth model (Fig. S5) displays an almost linear growth from 48.4 to 45.2 ka with an average growth rate of 0.07 mm a−1 except for ∼ 46.0 to 46.4 ka, when the growth appeared to have been faster with an average growth rate of 0.19 mm a−1. After the hiatus, the growth was slower from 7.6 to 3.6 ka (0.06 mm a−1) and faster from 3.6 to 1.5 ka (0.09 mm a−1).
3.2 Trace elements
The count ratios range from 288 to 687 (Figs. 2 and S6). For the lower part (MIS 3 section), a series of positive excursions of variable amplitude are overprinted on the baseline signal. The baseline itself increases slightly from 432 to 260 mm (48.4 to 46 ka), followed by a more pronounced increase after 260 mm (46 ka).
After the hiatus (Holocene section), the signal drops markedly with an average value of 348 between 200 and 150 mm (7.6 to 3.5 ka), followed by a gradual increase between 150 and 90 mm (3.5 to 2.9 ka) to values of 500. From 90 mm towards the top of the stalagmite (2.9 to 1.5 ka), values remain high with large variability. The Holocene section is characterized by an overall higher-frequency variability.
3.3 Calcite stable isotopes
Bottom (MIS 3) and top (Holocene) part δ18Oc values range from −3.7 ‰ to −1.0 ‰ and from −5.1 ‰ to −2.6 ‰, respectively. δ13Cc values range from −7.9 ‰ to −1.4 ‰ for the bottom (MIS 3) part and from −8.6 ‰ to −2.6 ‰ in the top (Holocene) section. δ18Oc and δ13Cc closely follow the same pattern. As with the record, the isotopic baseline of the bottom (MIS 3) section displays little variation from 432 to 260 mm (48.4 to 46 ka) followed by an increase after 260 mm (46 ka) of up to 1 ‰ in δ18Oc and 3 ‰ in δ13Cc. A series of peaks is superimposed on the baseline in both the δ18Oc and δ13Cc records and corresponds to similar peaks in the signal and the presence of dark layers in the sample. The amplitude of these excursions varies from 0.9 ‰ to 1.7 ‰ for δ18Oc and from 2.3 ‰ to 5.1 ‰ for δ13Cc. The top (Holocene) part displays lower values in both δ18Oc and δ13Cc immediately after the hiatus with little variation until 150 mm (3.5 ka), followed by a gradual increase until 90 mm (2.9 ka) and high values throughout the rest of the record.
3.4 Microthermometry
A total of 17 layers were analyzed including 1 in the Holocene part for comparison with the present-day temperature. Stalagmite formation temperatures reconstructed from the topmost Holocene part of BL3 (microcrystalline fabric), dated at 1.8 ka, indicate an average value of 17.6 ± 0.6 ∘C (2 SE), which is close to the present-day cave temperature (17.5 ± 0.5 ∘C) derived from cave monitoring. Most samples display slightly skewed (towards either low or high values) Gaussian-like distributions and a scatter of the temperature data within the individual layers ranging between 3 and 6 ∘C (see Fig. S7). Some samples however show a larger range (7–9 ∘C) with semi-uniform (i.e., flatter) distributions and larger standard error of the mean; nonetheless, these samples provided mean temperatures similar to adjacent samples with smaller ranges (Fig. S5). Standard errors of the mean range from 0.5 to 2.0 ∘C. The considerably larger errors compared to the study of Løland et al. (2022) are at least partly due to the lower number of Th. In general, the reconstructed temperatures are similar throughout the MIS 3 part of the stalagmite (Figs. 3 and S7), ranging from 17.7 ± 1.1 ∘C to 20.7 ± 1.3 ∘C (2 SE). Apparent differences between data points are within the error and therefore not interpreted here. That being said, the temperature record at face value suggests more variability from 46.5 to 45.3 ka, with the highest temperature found for ∼ 45.8 ka (Figs. 3 and S7). The average temperature observed in the MIS 3 part is 18.8 ± 0.5 ∘C (mean and standard deviation across all average temperatures).
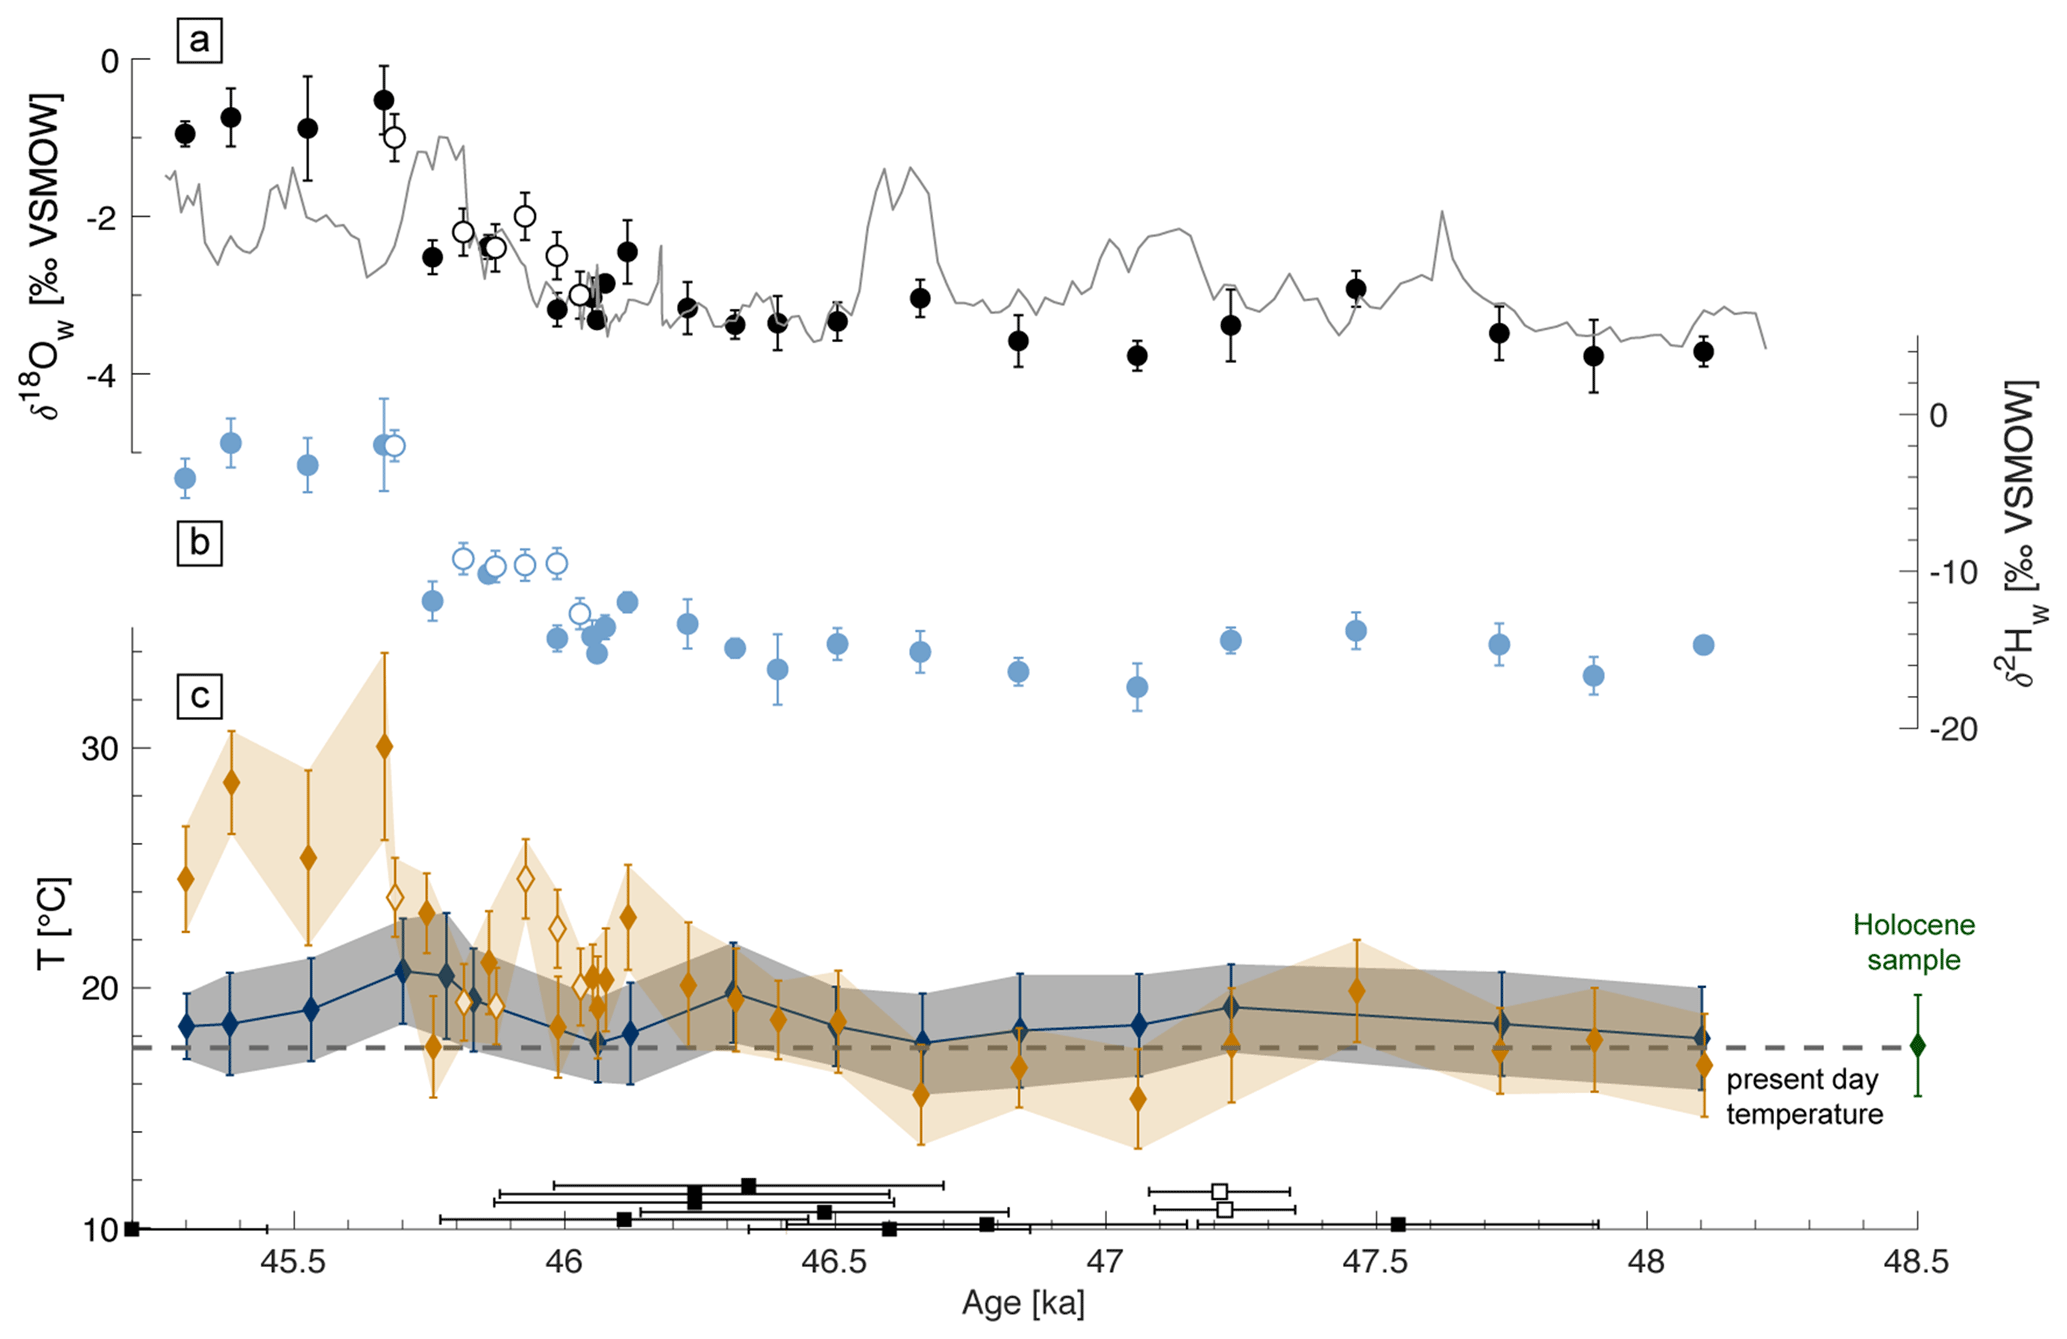
Figure 3BL3 proxy data vs. age. (a) δ18Oc (gray line) and δ18Ow (black circles), (b) δ2Hw (light blue circles) and (c) temperature reconstructions from fluid inclusion water isotopes (ochre diamonds) and microthermometry (dark blue line and diamonds). Open symbols correspond to samples analyzed at the University of Bern. In (c), the dashed line indicates the present-day temperature in the cave and the dark green diamond on the right corresponds to the topmost sample (microthermometry data). The black squares at the bottom indicate the U–Th dates and their associated error bars (2 SE). The open square symbols correspond to the two samples measured at the Isotope Laboratory at Xi’an Jiaotong University.
3.5 Fluid inclusion water isotopes
The FIWI data are distributed in two clusters in a cross-plot of δ2Hw versus δ18Ow (Fig. 4). The older cluster comprises samples from the base of BL3 to ∼ 46 ka and plots along the local meteoric water line (LMWL – from GNIP station at Cape Town Airport from 1961 to 2013) with values ranging from −3.8 ‰ to −2.4 ‰ and from −17.4 ‰ to −10.2 ‰ for δ18Ow and δ2Hw, respectively. Samples younger than ∼ 46 ka plot as a distinct cluster, slightly off the LMWL, and with higher values ranging from −1.0 ‰ to −0.5 ‰ and from −4.7 ‰ to −2.0 ‰ for δ18Ow and δ2Hw, respectively. Time series of both δ18Ow and d2Hw profiles display trends similar to the δ18Oc baseline with little variations from 48.3 to 46 ka followed by an increase after (Fig. 3).
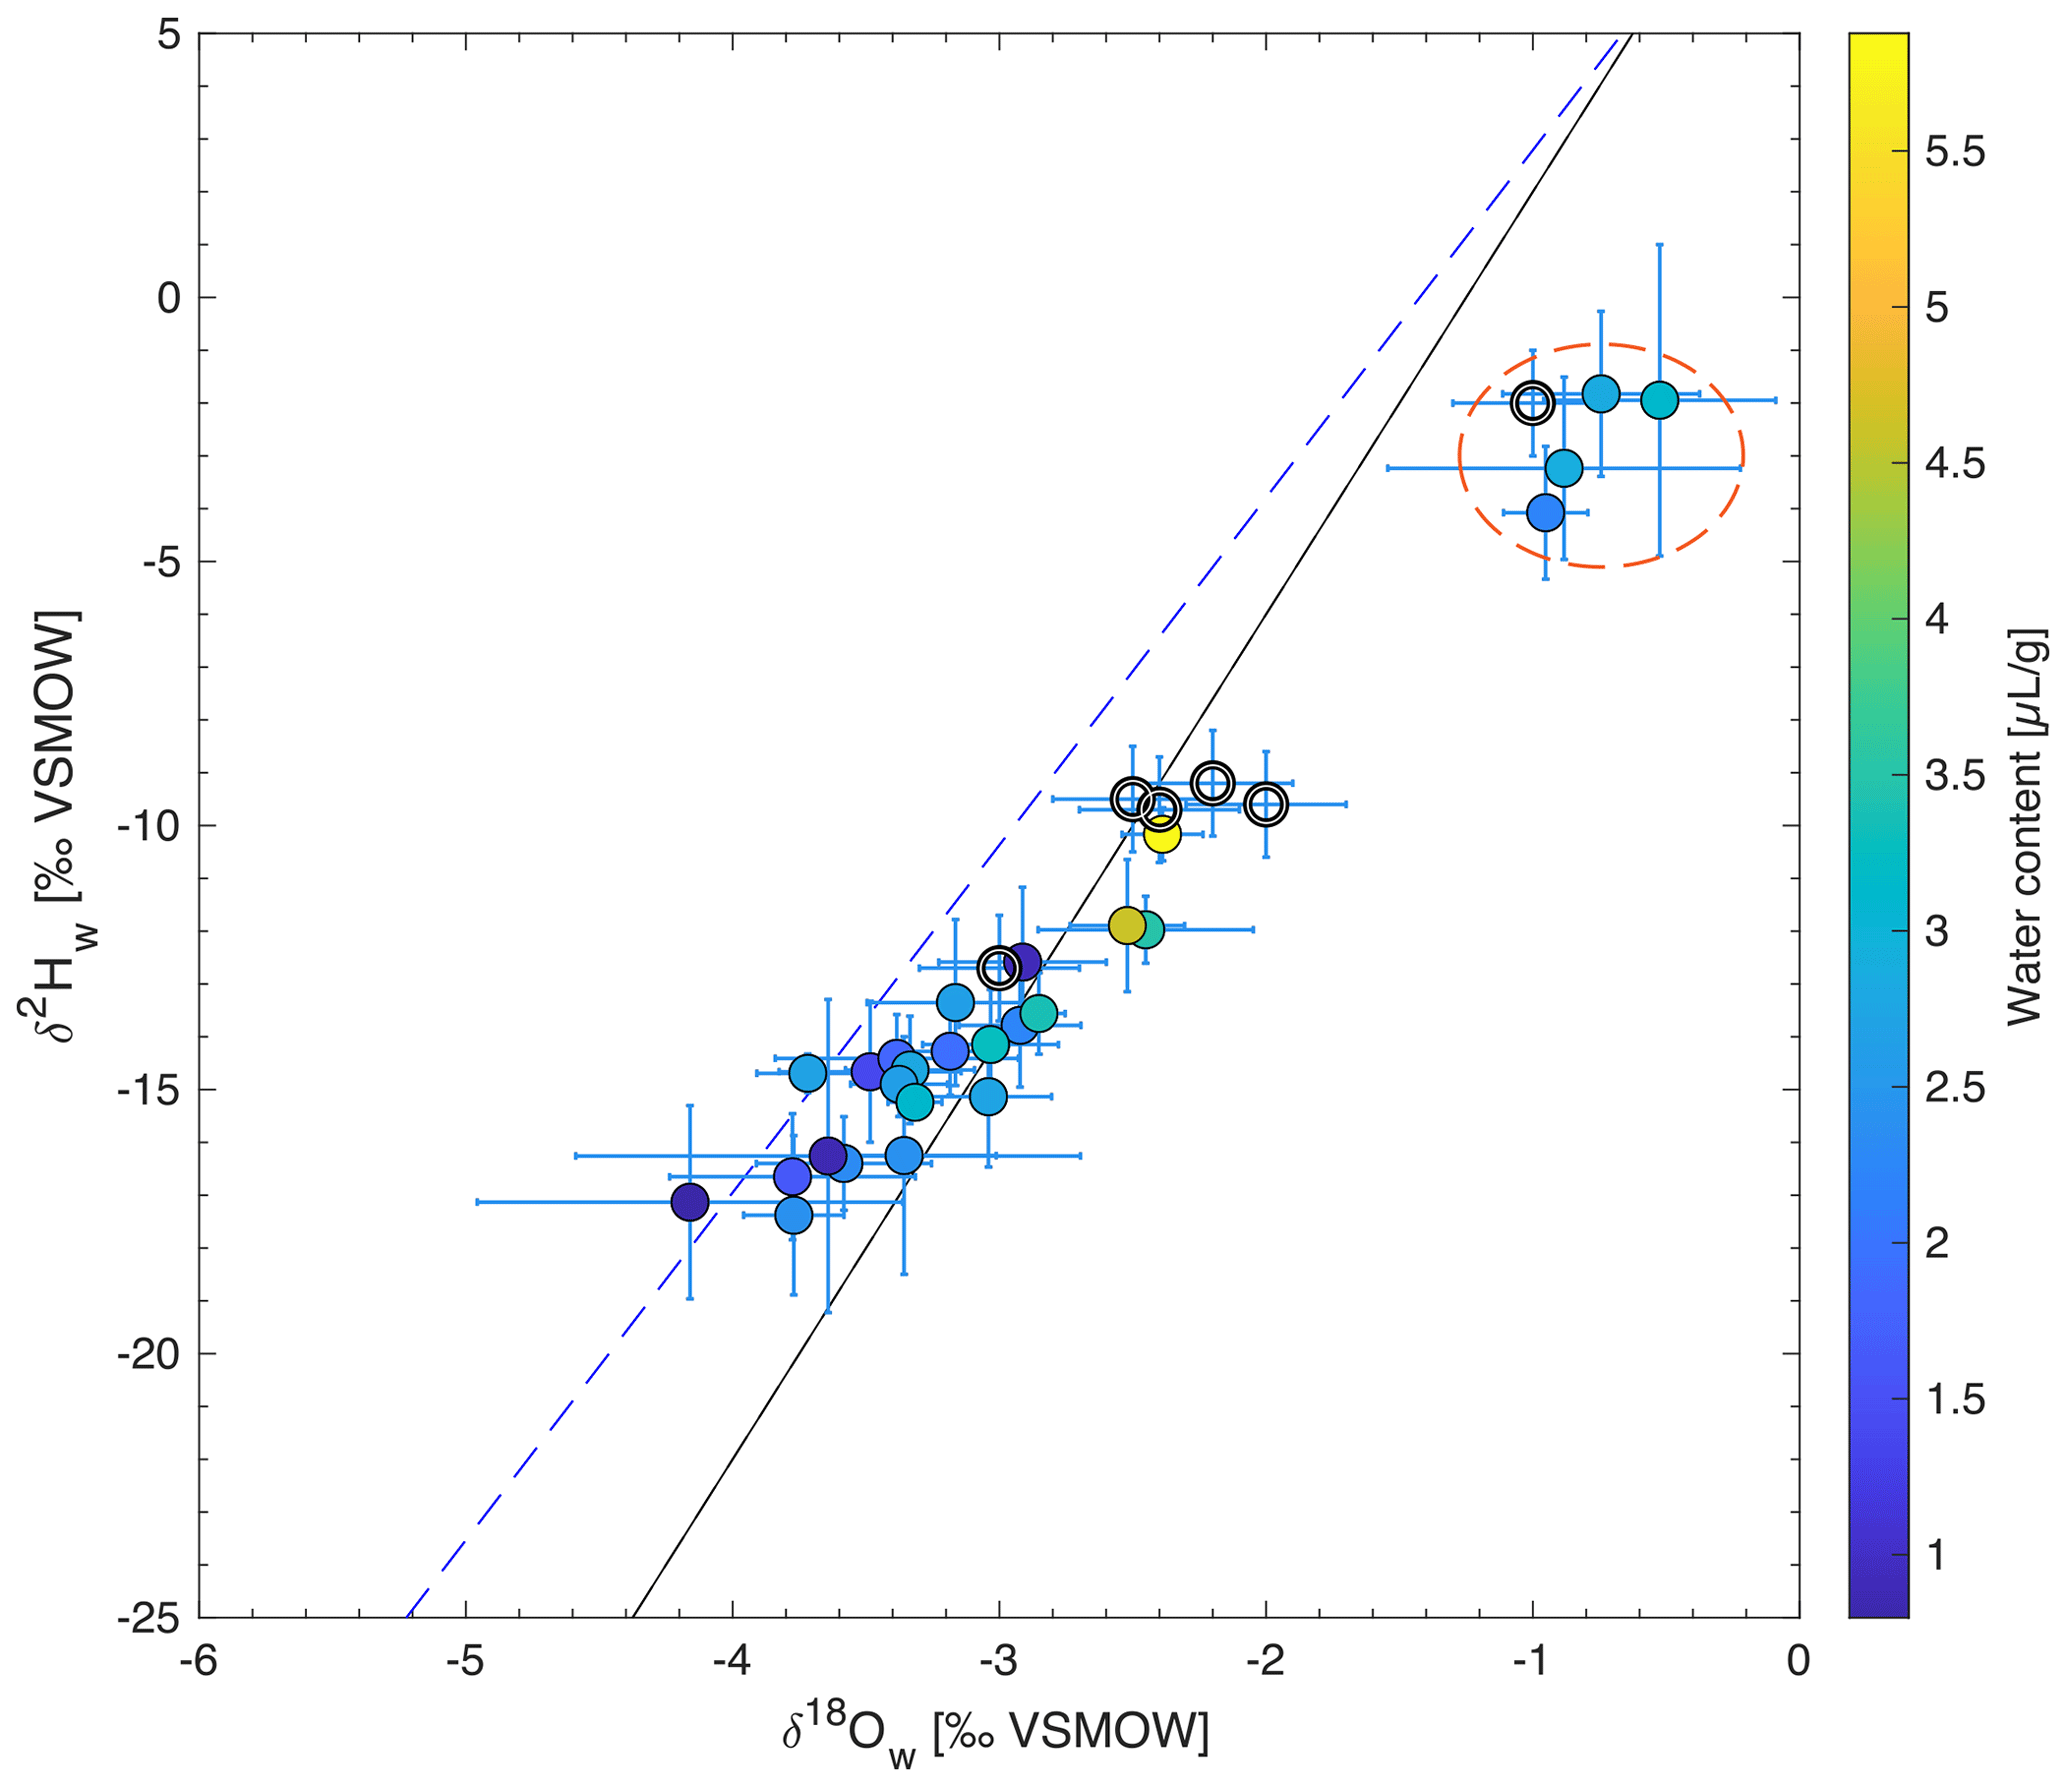
Figure 4Fluid inclusion water isotope data plotted in δ2H−w vs. δ18Ow space. Lines indicate the global (black) and local (dashed blue – from GNIP station at Cape Town airport from 1961 to 2013) meteoric water lines. The color bar on the right indicates the water content for each sample. The red dashed ellipse marks the youngest data cluster discussed in the text. Open circles correspond to samples analyzed at the University of Bern. Error bars show ±1 SD.
There are three possible ways of calculating cave temperature based on the available dataset. The first method is by estimating today's δ2H relationship with temperature and applying it to the past considering this relationship has not significantly changed over time (e.g., Affolter et al., 2019). At Mossel Bay (east of Bloukrantz cave in the YRZ), Braun et al. (2017) found that there is a weak correlation (R= 0.4) between δ2H and temperature (δ2H = 2.7(±0.6) × T−54(±10)). Applying this relationship results in temperature estimates 4–5 ∘C lower than microthermometry and standard deviations > 4 ∘C (1 SD). The second approach is to calculate δ18Ow from the measured δ2Hw using a modern δ18Ow vs. δ2Hw relationship (i.e., LMWL) and then calculating the temperature using the Tremaine et al. (2011) equation (e.g., Meckler et al., 2015). This approach is often favored as δ2Hw is less impacted than δ18Ow by fractionation processes in the cave or the analytical system; it relies however on the assumption that the LMWL has not changed significantly over time. At Bloukrantz cave this approach results in a FIWI temperature on average ∼ 4 ∘C lower than microthermometry and a larger standard deviations compared to the third approach (Fig. S8). The third approach is to calculate temperatures using the equation of Tremaine et al. (2011) with measured δ18Oc and δ18Ow. This last approach is the one we selected as we believe it is the most likely to render actual temperature variation in the cave. The calculated temperatures range from 15.4 to 21.1 ∘C from 48.3 to 46 ka and are in good agreement with liquid–vapor homogenization temperatures (Figs. 3 and S8) with the exception of the peaks in δ18Oc, where FIWI temperatures are ∼ 3 ∘C colder. After 46 ka, FIWI temperatures depart from the microthermometry results with positive offsets of 5 to 15 ∘C. d excess values are fairly constant throughout the record with an average value of 9.7 ± 1.9 (1 SD), except for the younger samples that display decreasing values starting at ∼ 46 ka (Fig. S9).
4.1 Hydroclimate
Interpreting isotopic and geochemical proxies in speleothems is not straightforward as epikarst and cave processes, directly or indirectly linked to climate, can alter the proxy signals (e.g., Fairchild and Baker, 2012b; Mickler et al., 2004; Oster et al., 2012). The BL3 record displays a strong correlation between δ18Oc and δ13Cc (R2 values ≥ 0.9) that can reflect out-of-equilibrium precipitation. Trace element incorporation (e.g., Sr) in the carbonate matrix is related to hydroclimate changes, and higher values are commonly interpreted to reflect prior carbonate precipitation – PCP (Baker et al., 1997; Fairchild et al., 2000; Fairchild and Treble, 2009; Frisia et al., 2011; Wassenburg et al., 2020). PCP can be defined as carbonate precipitation upstream of the final drip site, either in the epikarst or in the cave itself, during (i) periods of lower cave pCO2 prompting CO2 degassing and precipitation of carbonate or (ii) drier periods when an increased proportion of air in the lower epikarst and/or longer residence time of the water on the cave ceiling/stalactites allow CO2 degassing and precipitation along the flow path. During PCP, many trace elements including Sr preferentially remain in the solution (Morse and Bender, 1990), appearing enriched over Ca in the subsequent carbonate precipitating on the stalagmite. PCP also changes both δ13Cc and δ18Oc towards higher values as light isotopes will be removed from the dissolved inorganic carbon (DIC) reservoir during CO2 degassing (Deininger et al., 2021; Dreybrodt, 2008; Hansen et al., 2019), with increases of up to 2 ‰ and 7 ‰, respectively, for δ18Oc and δ13Cc at T= 20∘C (Hansen et al., 2019). From our dataset, we observe a slope of 2.45 for the δ13Cc vs. δ18Oc correlation, which points to incomplete O isotope buffering between the DIC and H2O reservoir, based on the Rayleigh distillation model developed by Mickler et al. (2006). In this model, a vertical slope corresponds to complete buffering, while a slope of 0.52 is the theoretical limit for a system with no buffering. The rate of recharge, illustrated by the drip rate, and cave pCO2 are considered to be the primary controls on PCP (Fohlmeister et al., 2020; Oster et al., 2012), with both lower cave pCO2 and lower drip rate, favoring PCP either in the lower epikarst or at the cave ceiling (Frisia et al., 2011). Individually, ratios, δ18Oc and δ13Cc can be influenced by a variety of mechanisms (e.g., Fairchild et al., 2000; Fohlmeister et al., 2020; Lachniet, 2009); however, the correlation of the three proxies and the fact that the relative amplitude among peaks in both δ18Oc and δ13Cc is similar indicate that these proxies are influenced by a common mechanism. We hence propose that stable isotope and ratios in stalagmite BL3 are controlled primarily by PCP.
Major growth direction changes and dark layers are concomitant with each peak and further examination of these layers reveals signs of dissolution/erosion on top of organic-rich layers. These observations could point to microbial activity during periods of lower drip rate, allowing bacterial communities to colonize the stalagmite surface (Silvia Frisia, personal communication, 2022). The layers therefore appear to correspond to short hiatuses, indicating that drip water availability rather than ventilation drives PCP in Bloukrantz cave. A likely scenario is therefore that periodic drying episodes caused both the observed variations in the geochemical parameters and the visual changes in the speleothem. As conditions became drier, the drip rate would have decreased, allowing for more PCP as for example during the period with lower RH in 2018 when there was no active dripping in the cave (Fig. S2). Eventually, calcite growth would stop, allowing for dust to settle at the top (i.e., dark layers) and alteration of stalagmite surfaces until growth resumed (with or without growth direction change) under wetter conditions.
In addition to the pronounced peaks, both the ratio and the isotope profiles display an increase in the baseline after ∼ 46 ka that indicates general drying if the same interpretation is applied (i.e., higher values reflect drier conditions). Interestingly, this increase in the baseline at ∼ 46 ka corresponds to a thinning of the stalagmite's width (see Fig. 2) likely due to slower drip rate as conditions became drier (Fairchild and Baker, 2012a). Overall, the record from 48.3 to 45.2 ka can thus be interpreted as variable precipitation from 48.3 to 45.2 ka, with short, markedly drier episodes and overall drying after ∼ 46 ka. Based on our age model, the duration of the dry phases was ∼ 200 ± 200 years, with relatively large uncertainty due to the 0.3 %–0.8 % uncertainty of the U–Th dates. We also note that the duration of the isotopic peaks could have been even shorter if unresolved hiatuses are present. Despite the remaining uncertainty in the duration of the dry phases, it is clear that they represent processes operating on sub-millennial (centennial or decadal) timescales.
Comparison with other paleoclimate records is hampered by the scarcity of regional high-resolution records and by the relative short time period covered by our data (< 3 kyr). That being said, the Antarctic temperature record based on δ18O from the EPICA Dronning Maud Land (EDML) ice core (Barbante et al., 2006; Epica Community Members et al., 2010) shows some similarities. Notably, a cooling phase starting at ∼ 45.9 ka at EDML appears to coincide with what we interpret as overall drying at Bloukrantz cave (Fig. 5). Cooling in Antarctica has been associated with an equatorward shift of the southern westerlies belt, causing a northward extension of the winter rainfall zone along the west coast of Africa (Chase and Meadows, 2007; Engelbrecht et al., 2019; Stuut et al., 2002). This is illustrated in core MD96-2094 from Walvis Ridge off southwest Africa (19∘59.97′ S, 9∘15.87′ E) where the aridity index developed by Stuut et al. (2002) starts decreasing around 46 ka, continuing until 40 ka, matching a speleothem growth period in northern Namibia (18∘15.42′ S, 13∘53.68′ E; Raislback et al., 2016) and indicating increased rainfall due to northward movement of the westerlies. Similarly, off southeast Africa, on the Agulhas Plateau, an increase in ice-rafted debris at ∼ 46.1 ka and a gradual decrease in Agulhas Leakage Fauna both in the Cape Basin record (Peeters et al., 2004) and in core CD 154 17-17K (Simon et al., 2013) are associated with a northward shift of the subtropical front. These observations have been interpreted as a northward shift of both atmospheric (southern westerlies belt) and oceanic (subtropical front) circulation systems as a result of cooling in Antarctica. On land, a speleothem record from Wolkberg cave, in the Limpopo Province in the northeastern part of South Africa (Holzkämper et al., 2009), spanning the period of ∼ 59 to 46 ka, displays a hiatus at 46.3 ka, coinciding with the onset of overall drier conditions at Bloukrantz cave. The presence of hiatus(es) is generally not systematically linked to drier conditions; however, other records offer some line of evidence for lower precipitations in the summer rainfall zone. The speleothem record from Lobatse cave in Botswana (Holmgren et al., 1995) presents a sharp increase (∼ 6 ‰) in δ13Cc at ∼ 46 ka followed by constant high δ13Cc values and a hiatus at 43.2 ka. This signal was interpreted as drier conditions in the northeastern part of South Africa (in the SRZ). Further away, in southwestern Madagascar (24∘06′ S, 43∘46′ E) a speleothem growth period from ∼ 48 to 46 ka has been linked to Antarctic isotope maxima (i.e., warmer periods) and high solar summer irradiation, allowing the southward expansion of the intertropical convergence zone and associated rain-bearing system to reach southwestern Madagascar (Burns et al., 2022). The growth period of these records collectively points to overall drier conditions in the summer rainfall zone between 46 and 43 ka and correlates well with the reconstructed rainfall amount at Tswaing crater (Partridge et al., 1997) that shows a decrease starting at 50 ka and reaches a minimum at 44 ka.
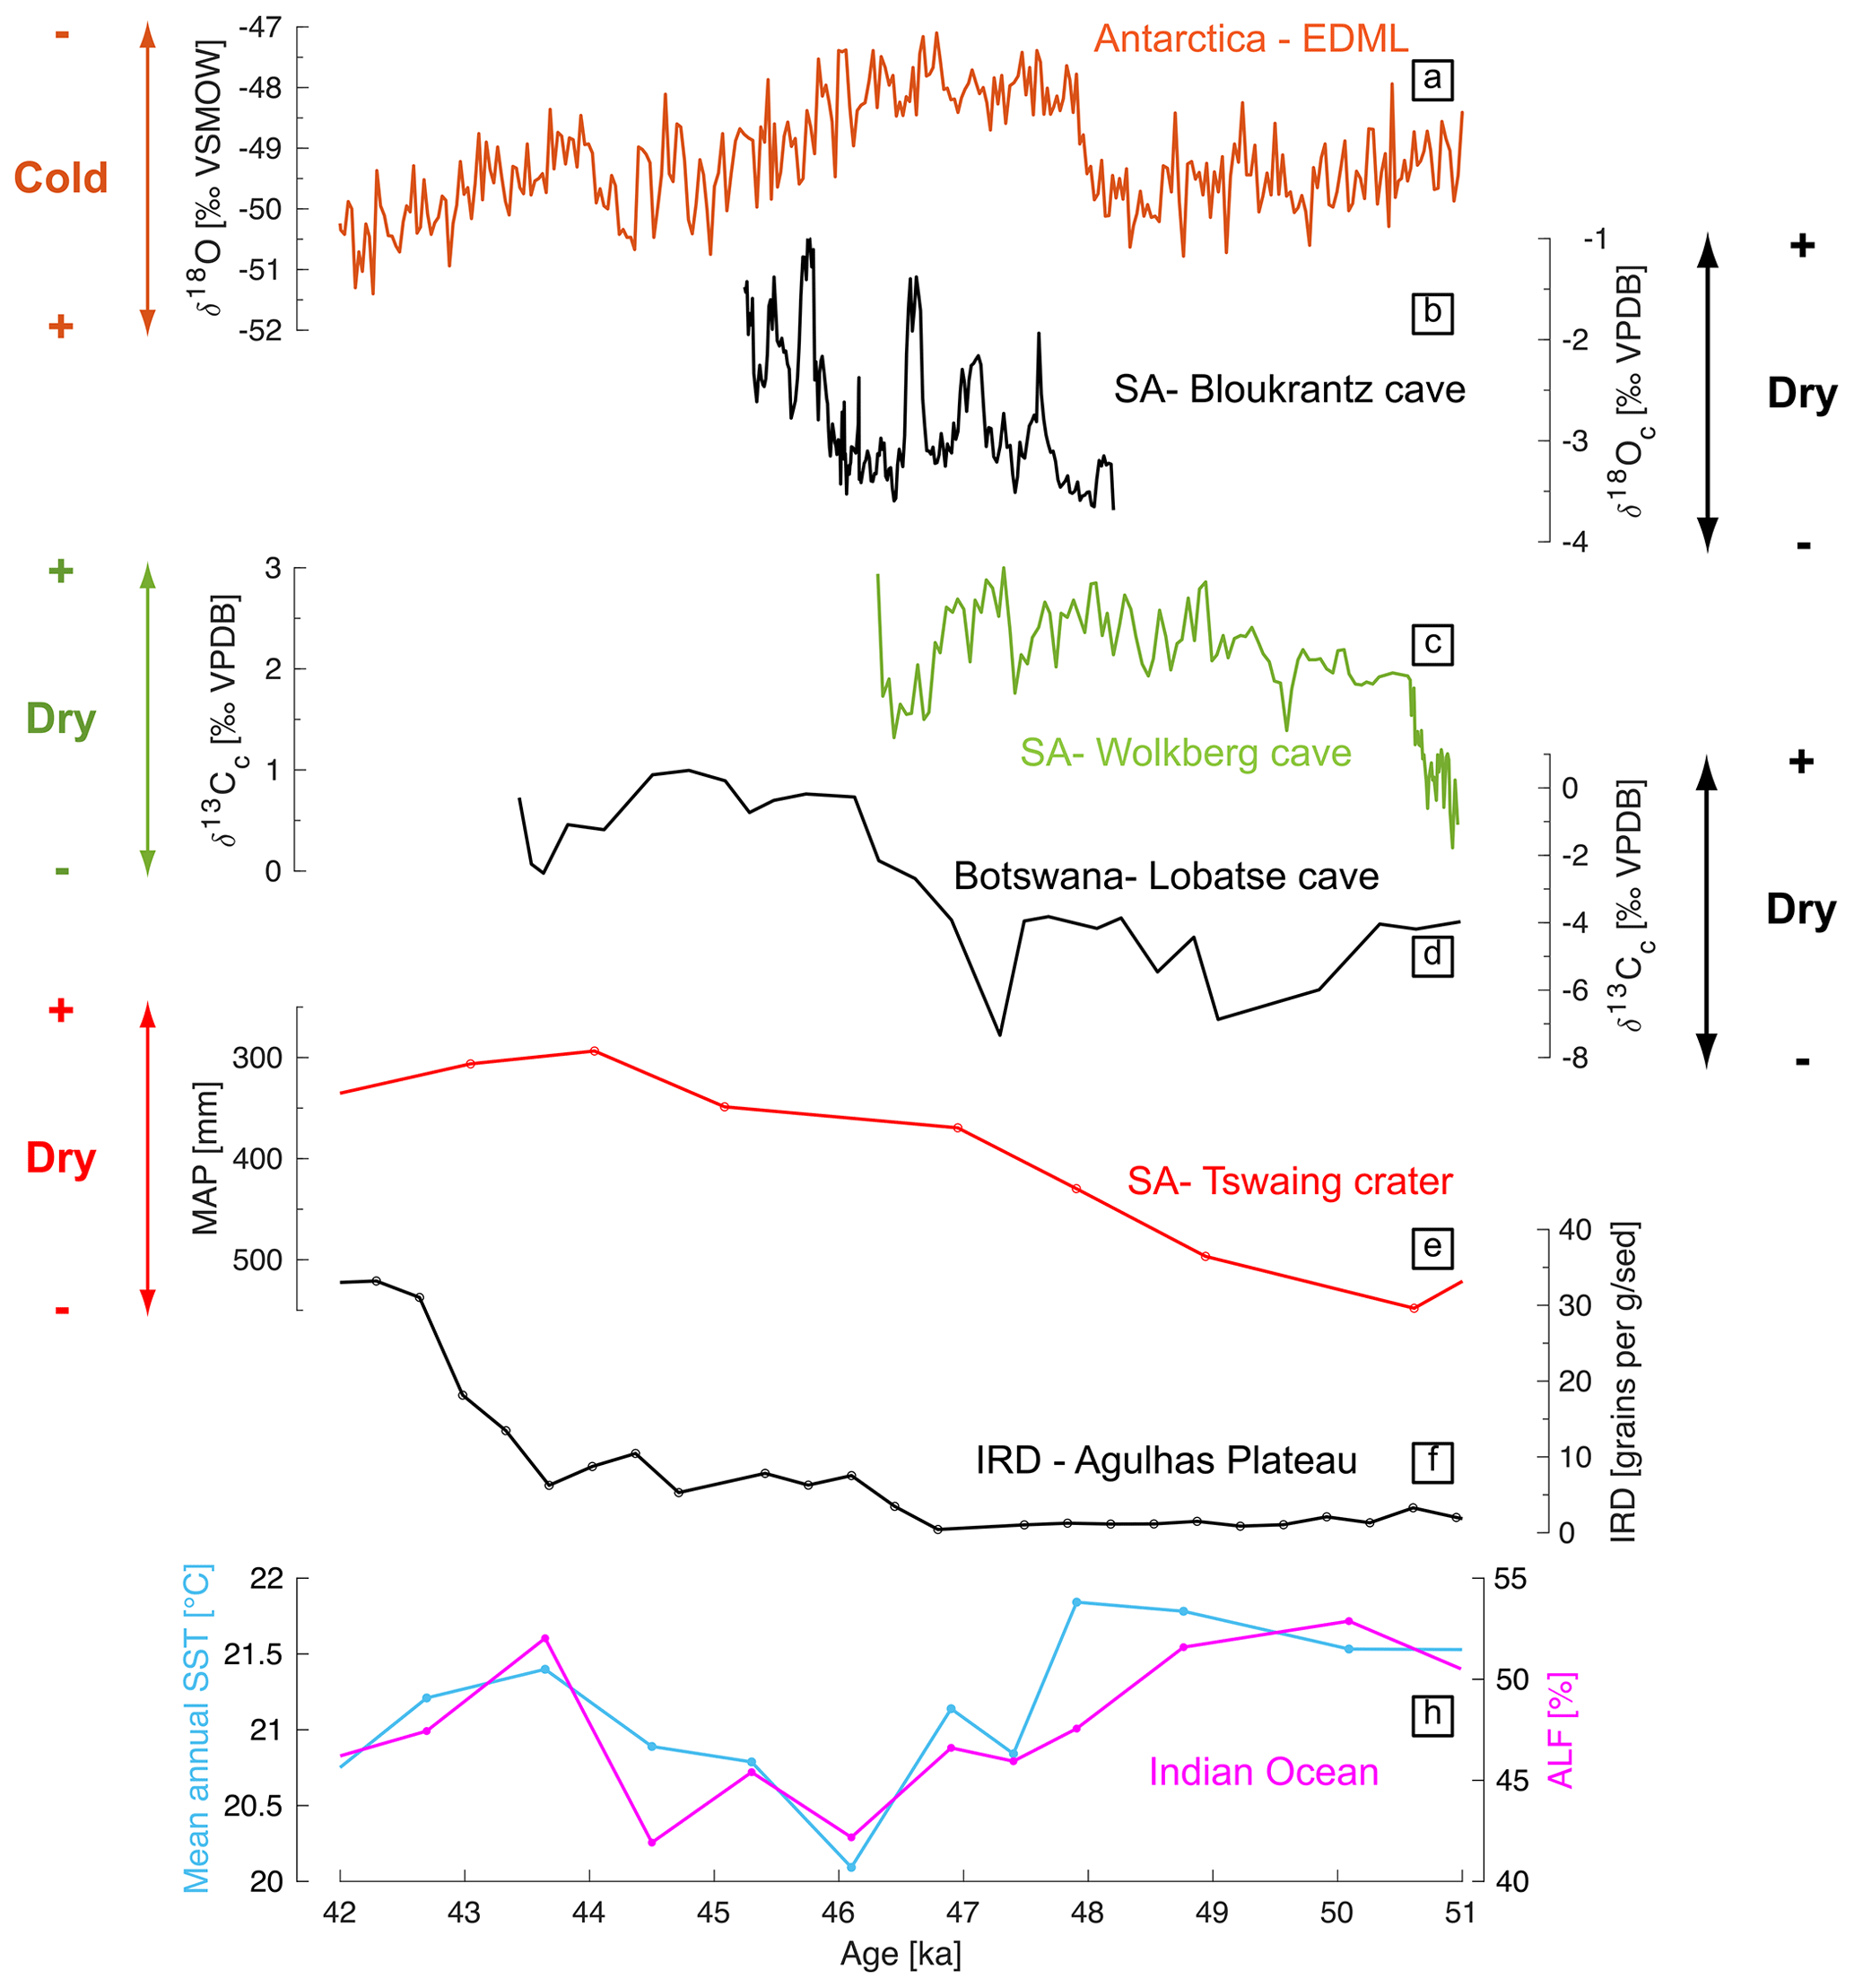
Figure 5Comparison to other climate records: (a) δ18O from the EPICA Dronning Maud Land (EDML) ice core in the Atlantic sector of the Antarctic Ice Sheet (EPICA community members 2006), (b) δ18Oc from Bloukrantz cave in the YRZ (this study), (c) δ13Cc from Wolkberg cave in the SRZ (Holzkämper et al., 2009), (d) δ13Cc from Lobatse cave in the SRZ (Holmgren et al., 1995), (e) annual precipitation reconstruction from Tswaing crater in the SRZ (Partridge et al., 1997), (f) ice-rafted debris (IRD) from core MD02-2588 on the southern Agulhas Plateau (Simon et al., 2013) and (g) mean annual sea surface temperature and Agulhas leakage fauna reconstructed from core CD154 17-17K in the southwest Indian Ocean (Simon et al., 2013).
In combination with these lines of evidence from the SRZ, the overall drier conditions at Bloukrantz cave at 46 ka and the subsequent stop in growth at 45.3 ka could be explained by reduced summer rainfall through a northward shift of the southern westerlies belt. Such northward expansion of the WRZ has been modeled for Last Glacial Maximum conditions (Engelbrecht et al., 2019). In the simulation, this northward shift of the westerlies was paired with drier conditions along a narrow stretch along the south coast due to bergwind conditions along the Cape Fold mountains. Our data indeed suggest that with Antarctic cooling during MIS 3, that winter rainfall did not provide sufficient moisture to sustain carbonate growth at Bloukrantz cave and that the northward expansion of the WRZ is not matched by a similar eastward expansion and/or is linked to reduced westerlies intensity.
In contrast to the overall drying trend, the repeated apparent drying we observed in our record in the form of peaks in isotope ratios and Sr Ca is not directly matched in the isotopic record from Lobatse cave or Wolkberg cave. However, the Wolkberg record displays some marked variability in aragonite/calcite content with shifts from 100 % calcite to > 90 % aragonite on sub-millennial to millennial timescales (Holzkämper et al., 2009). Holzkämper et al. (2009) tentatively linked higher aragonite content to drier conditions as factors controlling the formation of aragonite are low drip rates, higher temperature and high Mg concentration in the drip water, the latter likely linked to decreased precipitation and longer residence time in the epikarst (Frisia et al., 2002). This could suggest that these sub-millennial events are not restricted to the southern Cape coastal area but may have been more regional.
4.2 Temperature
The good agreement between the youngest (Holocene) microthermometry estimate with measured cave temperature (green diamond in Fig. 3c) shows that the microthermometry method can provide reliable cave temperatures for Bloukrantz cave, despite the challenges posed by the small size of the fluid inclusions in BL3 and scarcity of monophase liquid inclusions. Microthermometry temperatures during the MIS 3 section of our record reveal an average temperature of 18.8 ± 0.5 ∘C, i.e., about 1 ∘C warmer compared to present day (Fig. 3c). The slightly warmer temperature is noteworthy given that the time period covered by the record is within the last glacial period, with colder-than-Holocene temperatures in most parts of the world. Our results suggest that, in the southern Cape region of South Africa, the overall globally cooler conditions are offset by other influences, such as changes in ocean circulation or the coastline distance due to lower relative sea level. Offshore of southern Africa, reconstructed SSTs for MIS 3 are > 1–4 ∘C colder than modern day in the Indian (Fig. S10; Simon et al., 2013), Southern (Dyez et al., 2014) and Atlantic (Kirst et al., 1999) sectors. The Southern sector (Dyez et al., 2014) records the smallest temperature offset, 1.0 ∘C colder for MIS 3 than for modern day, compared to 2.8 and 4.1 ∘C in the Indian Ocean and Atlantic Ocean, respectively. Moreover, a 70 m lower relative sea level during the interval covered by our record (Grant et al., 2012) would have shifted the coastline seawards by almost 10 km (Jacobs et al., 2020). Göktürk et al. (2023) simulated that such a coastline shift would result in drier conditions and more pronounced continentality along the coastline of the southern Cape region, with higher (lower) daily max (min) temperature and overall higher mean annual temperature, which could explain why temperatures greater than at present day are recorded at Bloukrantz cave.
Interestingly, no significant changes in temperature are found during most of the and isotope peaks, suggesting that the process(es) influencing the calcite composition are not related to temperature. The peaks observed in the calcite-based proxies are also not apparent in the FIWI signal. When PCP occurs, δ18O and δ13C of the DIC increase as primary calcite is precipitated; the δ18O of the DIC will then gradually decrease due to re-equilibration with the water over time (Deininger et al., 2021; Hansen et al., 2019). If the time between PCP and the subsequent calcite precipitation on the stalagmite is not long enough to allow for O isotope equilibration with H2O, δ18Oc of the stalagmite calcite will be elevated compared to what would be expected from the δ18Ow and the cave temperature (Deininger et al., 2021; Dreybrodt and Fohlmeister, 2022; Hansen et al., 2019). Indeed, while FIWI temperatures calculated using the T–α relationship from Tremaine et al. (2011) show generally very good agreement with microthermometry from 48.3 to 45.8 ka, they deviate during the isotopic peaks, with FIWI-T ∼ 3 ∘C colder than the corresponding microthermometry. The FIWI results thus further support our interpretation of the isotope peaks as internal cave processes controlled by hydroclimate.
After 46 ka, FIWI temperatures clearly depart from microthermometry estimates with values 5 to 15 ∘C warmer. In δ18Ow vs. δ2Hw space, these younger samples plot as a distinct cluster away from the LMWL, in contrast to the samples from before ∼ 46 ka (Fig. 4). Such departure from the LMWL has been observed in other studies (Van Breukelen et al., 2008; Wainer et al., 2011; Warken et al., 2022) and could point either to analytical artifacts (e.g., Fernandez et al., 2023; Matthews et al., 2021) or to in-cave processes such as evaporation (Warken et al., 2022). Water content in the samples can in some cases track potential water loss during the analytical procedure as fabric amenable to leaking will result in both lower water content and a departure from the MWL (Fernandez et al., 2023; Matthews et al., 2021). Here, the water content displays little variation through most of the record (Figs. 4 and S7), except for two samples with higher water content at ∼ 45.9 ka, just before the FIWI data depart from the LMWL. In addition, replicate measurements of the younger samples do not show any trend in δ18Ow vs. δ2Hw space as would be expected from variable partial loss of water during heating of the samples (Fernandez et al., 2023). Further, no changes in the speleothem fabric were detected that could explain a change in behavior during analysis for these samples. We thus do not have any evidence that suggests analytical artifacts could have caused the departure of the younger MIS 3 samples away from the LMWL.
An alternative explanation could be in-cave evaporation (e.g., Warken et al., 2022). Using a Craig–Gordon evaporation model (Craig and Gordon, 1965) with an n value of 1 (i.e., non-turbulent atmosphere), and the average δ2Hw and δ18Ow values from the data points > 46 ka as a starting point, < 5 % loss to evaporation under RH between 80 % and 85 % could explain the isotopic values of the younger samples. These are not unrealistic conditions, as RH of 86 % has been measured when no dripping was observed in the cave (Fig. S2). Cave evaporation occurs when relative humidity decreases as a consequence of (i) better ventilation, when the cave air is partially replaced by outside air with a lower RH, or (ii) lower drip rate, decreasing the water supply to the cave and thus the RH. Wind-induced changes in ventilation seem unlikely given the cave geometry, whereas changes in ventilation induced by thermal convection (Fairchild and Baker, 2012c) are not supported by the apparently constant microthermometry temperatures during most of the record. We hence suggest that slower drip rate and lower water supply could be the cause for lower RH, leading to evaporation in the cave and elevated δ18Ow and δ2Hw of the younger samples at the end of the MIS 3 section. This interpretation is also in line with the calcite-based proxies, suggesting a drying trend leading up to the prominent growth hiatus.
In summary, multiple lines of evidence from our data suggest that temperature was stable during most of the record, with an average value of 18.8 ± 0.5 ∘C, slightly higher than present-day temperature, whereas precipitation was variable, with marked short drier episodes and overall drier conditions after 46 ka.
This study presents a 3 kyr, high-resolution and multi-proxy record of temperature and hydroclimate at the southern coast of South Africa during MIS 3 (45.2–48.3 ka). Based on fluid inclusion microthermometry, we reconstruct an average cave temperature for the MIS 3 section of the stalagmite of 18.8 ± 0.5 ∘C, slightly warmer compared to the present day. This difference could be due to increased continentality. We find generally good agreement between the microthermometry and water isotope-based temperature estimates, with exceptions during parts of the record where other proxies indicated drier conditions. During the investigated time interval of MIS 3, precipitation at the site appears to have been highly variable. Short episodes of higher δ18Oc, δ13Cc and values are likely linked to prior carbonate precipitation and to drier conditions. These fluctuations in hydroclimate do not appear to be accompanied by substantial changes in temperature. After 46 ka, a trend in the calcite proxy baseline and a distinctly different isotope signal in the fluid inclusions is interpreted to reflect overall drier conditions with potential evaporation in the cave. Drier conditions between 46 and 43 ka are also observed in other records from the summer rainfall zone, whereas wetter conditions were reconstructed further north in Namibia. Given coeval cooling at Dronning Maud Land in Antarctica, these observations suggest the potential influence of the Antarctic Ice Sheet through a northward displacement of the southern westerly wind belt shifting the rain pattern over South Africa.
All results from this study are available in the Supplement to this publication.
The supplement related to this article is available online at: https://doi.org/10.5194/cp-19-1847-2023-supplement.
Study design: JM, ANM, SEL; methodology and data acquisition: JM, TB, HAR, AFB, YK, JA, SA, ML; visualization and original draft preparation: JM; writing and editing: JM, ANM, SEL, TB, HAR, AFB, YK, JA, SA, ML.
The contact author has declared that none of the authors has any competing interests.
Publisher’s note: Copernicus Publications remains neutral with regard to jurisdictional claims in published maps and institutional affiliations.
We thank the South African Heritage Resources Agency (SAHRA), Heritage Western Cape (HWC) and Cape Nature for granting the permits to enter the De Hoop Nature Reserve and collect speleothem samples for scientific analysis. We thank Ole Fredrik Unhammer, Magnus Mathisen Haaland, Sverre Asknes and Simon Armitage for their help with fieldwork. We thank Samantha Mienies at Wits University for curating the samples and helping with the permits. We thank Silvia Frisia at the University of Newcastle for help with the petrographic observations. We thank Harald Sodemann at the University of Bergen for advice on the microdrop system. We thank Hai Cheng and Xuexue Jia for supplementary U–Th dating performed during the Covid-19 lockdown. We also thank Steffen Holzkämper, Karen Holmgren, Margit Simon, Brian Chase and Kerstin Braun for respectively providing the Wolkberg cave speleothem data, the Lobatse cave speleothem data, the Tswaing crater data, the Cape Basin Record data and the Cango cave data. We thank both Kerstin Braun and Nick Scroxton for their thorough review.
This research has been supported by the Norges Forskningsråd (grant nos. 262618, 245907 and 226171/F50) and the Swiss National Science Foundation under grant nos. SNF-132646 (Stalclim), SNF-147674 (Stalclim II) and SNF-159563.
This paper was edited by Qiuzhen Yin and reviewed by Kerstin Braun and Nick Scroxton.
Adigun, J.: Investigating the archaeological implications of environmental change during the Middle Stone Age: a contribution from the geochemical analysis of speleothems in the southern Cape, South Africa, Faculty of Science, University of the Witwatersrand, Johannesburg, https://wiredspace.wits.ac.za/handle/10539/21240 (last access: 21 August 2023), 2016.
Affek, H. P., Bar-Matthews, M., Ayalon, A., Matthews, A., and Eiler, J. M.: Glacial/interglacial temperature variations in Soreq cave speleothems as recorded by “clumped isotope” thermometry, Geochim. Cosmochim. Ac., 72, 5351–5360, https://doi.org/10.1016/j.gca.2008.06.031, 2008.
Affolter, S., Fleitmann, D., and Leuenberger, M.: New online method for water isotope analysis of speleothem fluid inclusions using laser absorption spectroscopy (WS-CRDS), Clim. Past, 10, 1291–1304, https://doi.org/10.5194/cp-10-1291-2014, 2014.
Affolter, S., Häuselmann, A., Fleitmann, D., Edwards, R. L., Cheng, H., and Leuenberger, M.: Central Europe temperature constrained by speleothem fluid inclusion water isotopes over the past 14 000 years, Sci. Adv., 5, eaav3809, https://doi.org/10.1126/sciadv.aav3809, 2019.
Andersen, K. K., Azuma, N., Barnola, J. M., Bigler, M., Biscaye, P., Caillon, N., Chappellaz, J., Clausen, H. B., Dahl-Jensen, D., Fischer, H., Flückiger, J., Fritzsche, D., Fujii, Y., Goto-Azuma, K., Grønvold, K., Gundestrup, N. S., Hansson, M., Huber, C., Hvidberg, C. S., Johnsen, S. J., Jonsell, U., Jouzel, J., Kipfstuhl, S., Landais, A., Leuenberger, M., Lorrain, R., Masson-Delmotte, V., Miller, H., Motoyama, H., Narita, H., Popp, T., Rasmussen, S. O., Raynaud, D., Rothlisberger, R., Ruth, U., Samyn, D., Schwander, J., Shoji, H., Siggard-Andersen, M. L., Steffensen, J. P., Stocker, T., Sveinbjörnsdóttir, A. E., Svensson, A., Takata, M., Tison, J. L., Thorsteinsson, T., Watanabe, O., Wilhelms, F., and White, J. W. C.: High-resolution record of Northern Hemisphere climate extending into the last interglacial period, Nature, 431, 147–151, https://doi.org/10.1038/nature02805, 2004.
Baker, A., Ito, E., Smart, P. L., and McEwan, R. F.: Elevated and variable values of 13C in speleothems in a British cave system, Chem. Geol., 136, 263–270, https://doi.org/10.1016/S0009-2541(96)00129-5, 1997.
Bar-Matthews, M., Marean, C. W., Jacobs, Z., Karkanas, P., Fisher, E. C., Herries, A. I. R., Brown, K., Williams, H. M., Bernatchez, J., Ayalon, A., and Nilssen, P. J.: A high resolution and continuous isotopic speleothem record of paleoclimate and paleoenvironment from 90 to 53 ka from Pinnacle Point on the south coast of South Africa, Quaternary Sci. Rev., 29, 2131–2145, https://doi.org/10.1016/j.quascirev.2010.05.009, 2010.
Barbante, C., Barnola, J. M., Becagli, S., Beer, J., Bigler, M., Boutron, C., Blunier, T., Castellano, E., Cattani, O., Chappellaz, J., Dahl-Jensen, D., Debret, M., Delmonte, B., Dick, D., Falourd, S., Faria, S., Federer, U., Fischer, H., Freitag, J., Frenzel, A., Fritzsche, D., Fundel, F., Gabrielli, P., Gaspari, V., Gersonde, R., Graf, W., Grigoriev, D., Hamann, I., Hansson, M., Hoffmann, G., Hutterli, M. A., Huybrechts, P., Isaksson, E., Johnsen, S., Jouzel, J., Kaczmarska, M., Karlin, T., Kaufmann, P., Kipfstuhl, S., Kohno, M., Lambert, F., Lambrecht, A., Lambrecht, A., Landais, A., Lawer, G., Leuenberger, M., Littot, G., Loulergue, L., Lüthi, D., Maggi, V., Marino, F., Masson-Delmotte, V., Meyer, H., Miller, H., Mulvaney, R., Narcisi, B., Oerlemans, J., Oerter, H., Parrenin, F., Petit, J. R., Raisbeck, G., Raynaud, D., Röthlisberger, R., Ruth, U., Rybak, O., Severi, M., Schmitt, J., Schwander, J., Siegenthaler, U., Siggaard-Andersen, M. L., Spahni, R., Steffensen, J. P., Stenni, B., Stocker, T. F., Tison, J. L., Traversi, R., Udisti, R., Valero-Delgado, F., van den Broeke, M. R., van de Wal, R. S. W., Wagenbach, D., Wegner, A., Weiler, K., Wilhelms, F., Winther, J. G., and Wolff, E.: One-to-one coupling of glacial climate variability in Greenland and Antarctica, Nature, 444, 195–198, https://doi.org/10.1038/nature05301, 2006.
Blyth, A. J. and Schouten, S.: Calibrating the glycerol dialkyl glycerol tetraether temperature signal in speleothems, Geochim. Cosmochim. Ac., 109, 312–328, https://doi.org/10.1016/j.gca.2013.02.009, 2013.
Braun, K., Bar-Matthews, M., Ayalon, A., Zilberman, T., and Matthews, A.: Rainfall isotopic variability at the intersection between winter and summer rainfall regimes in coastal South Africa (Mossel Bay, Western Cape Province), S. Afr. J. Geol., 120, 323–340, https://doi.org/10.25131/gssajg.120.3.323, 2017.
Braun, K., Nehme, C., Pickering, R., Rogerson, M., and Scroxton, N.: A Window into Africa’s Past Hydroclimates: The SISAL_v1 Database Contribution, Quaternary, 2, 4, https://doi.org/10.3390/quat2010004, 2019a.
Braun, K., Bar-Matthews, M., Matthews, A., Ayalon, A., Cowling, R. M., Karkanas, P., Fisher, E. C., Dyez, K., Zilberman, T., and Marean, C. W.: Late Pleistocene records of speleothem stable isotopic compositions from Pinnacle Point on the South African south coast, Quaternary Res., 91, 265–288, https://doi.org/10.1017/qua.2018.61, 2019b.
Braun, K., Bar-Matthews, M., Matthews, A., Ayalon, A., Zilberman, T., Cowling, R. M., Fisher, E. C., Herries, A. I. R., Brink, J. S., and Marean, C. W.: Comparison of climate and environment on the edge of the Palaeo-Agulhas Plain to the Little Karoo (South Africa) in Marine Isotope Stages 5–3 as indicated by speleothems, Quaternary Sci. Rev., 235, 105803, https://doi.org/10.1016/j.quascirev.2019.06.025, 2020.
Burns, S. J., McGee, D., Scroxton, N., Kinsley, C. W., Godfrey, L. R., Faina, P., and Ranivoharimanana, L.: Southern Hemisphere controls on ITCZ variability in southwest Madagascar over the past 117 000 years, Quaternary Sci. Rev., 276, 107317, https://doi.org/10.1016/j.quascirev.2021.107317, 2022.
Carr, A. S., Thomas, D. S. G., Bateman, M. D., Meadows, M. E., and Chase, B.: Late Quaternary palaeoenvironments of the winter-rainfall zone of southern Africa: Palynological and sedimentological evidence from the Agulhas Plain, Palaeogeogr. Palaeocl., 239, 147–165, https://doi.org/10.1016/j.palaeo.2006.01.014, 2006.
Chase, B. M.: South African palaeoenvironments during marine oxygen isotope stage 4: a context for the Howiesons Poort and Still Bay industries, J. Archaeol. Sci., 37, 1359–1366, https://doi.org/10.1016/j.jas.2009.12.040, 2010.
Chase, B. M. and Meadows, M. E.: Late Quaternary dynamics of southern Africa's winter rainfall zone, Earth-Sci. Rev., 84, 103–138, https://doi.org/10.1016/j.earscirev.2007.06.002, 2007.
Chase, B., Harris, C., de Wit, M. J., Kramers, J., Doel, S., and Stankiewicz, J.: South African speleothems reveal influence of high- and low-latitude forcing over the past 113.5 k.y, Geology, 49, 1353–1357, https://doi.org/10.1130/G49323.1, 2021.
Cheng, H., Lawrence Edwards, R., Shen, C.-C., Polyak, V. J., Asmerom, Y., Woodhead, J., Hellstrom, J., Wang, Y., Kong, X., Spötl, C., Wang, X., and Calvin Alexander, E.: Improvements in 230Th dating, 230Th and 234U half-life values, and U–Th isotopic measurements by multi-collector inductively coupled plasma mass spectrometry, Earth Planet. Sc. Lett., 371–372, 82–91, https://doi.org/10.1016/j.epsl.2013.04.006, 2013.
Craig, H. and Gordon, L. I.: Deuterium and oxygen 18 variations in the ocean and the marine atmosphere, in: Stable Isotopes in Oceanographic Studies and Paleotempertures, edited by: Tongiorgi, E., Consiglio Nazionale delle Ricerche, Laboratorio di Geologia Nucleare, Pisa, 9–130, 1965.
d'Errico, F.: The invisible frontier. A multiple species model for the origin of behavioral modernity, Evol. Anthropol., 12, 188–202, https://doi.org/10.1002/evan.10113, 2003.
de Graaf, S., Vonhof, H. B., Weissbach, T., Wassenburg, J. A., Levy, E. J., Kluge, T., and Haug, G. H.: A comparison of isotope ratio mass spectrometry and cavity ring-down spectroscopy techniques for isotope analysis of fluid inclusion water, Rapid Commun. Mass Sp., 34, e8837, https://doi.org/10.1002/rcm.8837, 2020.
Deininger, M., Hansen, M., Fohlmeister, J., Schröder-Ritzrau, A., Burstyn, Y., and Scholz, D.: Are oxygen isotope fractionation factors between calcite and water derived from speleothems systematically biased due to prior calcite precipitation (PCP)?, Geochim. Cosmochim. Ac., 305, 212–227, https://doi.org/10.1016/j.gca.2021.03.026, 2021.
Dreybrodt, W.: Evolution of the isotopic composition of carbon and oxygen in a calcite precipitating solution and the related isotopic composition of calcite in stalagmites, Geochim. Cosmochim. Ac., 72, 4712–4724, https://doi.org/10.1016/j.gca.2008.07.022, 2008.
Dreybrodt, W. and Fohlmeister, J.: The impact of outgassing of CO2 and prior calcium precipitation to the isotope composition of calcite precipitated on stalagmites. Implications for reconstructing climate information from proxies, Chem. Geol., 589, 120676, https://doi.org/10.1016/j.chemgeo.2021.120676, 2022.
Dyez, K. A., Zahn, R., and Hall, I. R.: Multicentennial Agulhas leakage variability and links to North Atlantic climate during the past 80 000 years, Paleoceanography, 29, 1238–1248, https://doi.org/10.1002/2014PA002698, 2014.
Edwards, R. L.: High precision thorium-230 ages of corals and the timing of sea level fluctuations in the late Quaternary, Ph.D. thesis, California Institute of California, https://resolver.caltech.edu/CaltechETD:etd-10112005-103528 (last access: 23 August 2023), 1988.
Engelbrecht, C. J., Landman, W. A., Engelbrecht, F. A., and Malherbe, J.: A synoptic decomposition of rainfall over the Cape south coast of South Africa, Clim. Dynam., 44, 2589–2607, https://doi.org/10.1007/s00382-014-2230-5, 2015.
Engelbrecht, F. A., Marean, C. W., Cowling, R. M., Engelbrecht, C. J., Neumann, F. H., Scott, L., Nkoana, R., O'Neal, D., Fisher, E., Shook, E., Franklin, J., Thatcher, M., McGregor, J. L., Van der Merwe, J., Dedekind, Z., and Difford, M.: Downscaling Last Glacial Maximum climate over southern Africa, Quaternary Sci. Rev., 226, 105879, https://doi.org/10.1016/j.quascirev.2019.105879, 2019.
Epica Community Members: Stable oxygen isotopes of ice core EDML, PANGAEA [data set], https://doi.org/10.1594/PANGAEA.754444, 2010.
Epstein, S., Buchsbaum, R., Lowenstam, H., and Urey, H. C.: Carbonate-Water Istotopic Temperature Scale, Geol. Soc. Am. Bull., 62, 417–426, https://doi.org/10.1130/0016-7606(1951)62[417:CITS]2.0.CO;2, 1951.
Epstein, S., Buchsbaum, R., Lowenstam, H. A., and Urey, H. C.: Revised Carbonate-Water Isotopic Temperature Scale, Geol. Soc. Am. Bull., 64, 1315–1325, https://doi.org/10.1130/0016-7606(1953)64[1315:RCITS]2.0.CO;2, 1953.
Fairchild, I. J. and Baker, A.: The Architecture of Speleothems, in: Speleothem Science, Wiley Online Books, 205–244, https://doi.org/10.1002/9781444361094.ch4, 2012a.
Fairchild, I. J. and Baker, A.: The Holocene Epoch: Testing the Climate and Environmental Proxies, in: Speleothem Science, Wiley Online Books, 324-=352, https://doi.org/10.1002/9781444361094.ch11, 2012b.
Fairchild, I. J. and Baker, A.: The Speleothem Incubator, in: Speleothem Science, Wiley Online Books, 105–147, https://doi.org/10.1002/9781444361094.ch4, 2012c.
Fairchild, I. J. and Treble, P. C.: Trace elements in speleothems as recorders of environmental change, Quaternary Sci. Rev., 28, 449–468, https://doi.org/10.1016/j.quascirev.2008.11.007, 2009.
Fairchild, I. J., Borsato, A., Tooth, A. F., Frisia, S., Hawkesworth, C. J., Huang, Y., McDermott, F., and Spiro, B.: Controls on trace element (Sr–Mg) compositions of carbonate cave waters: implications for speleothem climatic records, Chem. Geol., 166, 255–269, https://doi.org/10.1016/S0009-2541(99)00216-8, 2000.
Fernandez, A., Løland, M. H., Maccali, J., Krüger, Y., Vonhof, H. B., Sodemann, H., and Meckler, A. N.: Characterisation and correction of evaporative artifacts in speleothem fluid inclusion isotope analysis as applied to a stalagmite from Borneo, ESS Open Archive, https://doi.org/10.22541/essoar.167340715.57808428/v1, 2023.
Fohlmeister, J., Voarintsoa, N. R. G., Lechleitner, F. A., Boyd, M., Brandtstätter, S., Jacobson, M. J., and Oster, J. L.: Main controls on the stable carbon isotope composition of speleothems, Geochim. Cosmochim. Ac., 279, 67–87, https://doi.org/10.1016/j.gca.2020.03.042, 2020.
Frisia, S.: Microstratigraphic logging of calcite fabrics in speleothems as tool for palaeoclimate studies, Int. J. Speleol., 44, 1–16, https://doi.org/10.5038/1827-806X.44.1.1, 2015.
Frisia, S., Borsato, A., Fairchild, I. J., McDermott, F., and Selmo, E. M.: Aragonite-calcite relationships in speleothems (Grotte de Clamouse, France): Environment, fabrics, and carbonate geochemistry, J. Sediment. Res., 72, 687–699, https://doi.org/10.1306/020702720687, 2002.
Frisia, S., Fairchild, I. J., Fohlmeister, J., Miorandi, R., Spötl, C., and Borsato, A.: Carbon mass-balance modelling and carbon isotope exchange processes in dynamic caves, Geochim. Cosmochim. Ac., 75, 380–400, https://doi.org/10.1016/j.gca.2010.10.021, 2011.
Göktürk, O. M., Sobolowski, S. P., Simon, M. H., Zhang, Z., and Jansen, E.: Sensitivity of coastal southern African climate to changes in coastline position and associated land extent over the last glacial, Quaternary Sci. Rev., 300, 107893, https://doi.org/10.1016/j.quascirev.2022.107893, 2023.
Grant, K. M., Rohling, E. J., Bar-Matthews, M., Ayalon, A., Medina-Elizalde, M., Ramsey, C. B., Satow, C., and Roberts, A. P.: Rapid coupling between ice volume and polar temperature over the past 150 000 years, Nature, 491, 744–747, https://doi.org/10.1038/nature11593, 2012.
Hansen, M., Scholz, D., Schöne, B. R., and Spötl, C.: Simulating speleothem growth in the laboratory: Determination of the stable isotope fractionation (δ13C and δ18O) between H2O, DIC and CaCO3, Chem. Geol., 509, 20–44, https://doi.org/10.1016/j.chemgeo.2018.12.012, 2019.
Henshilwood, C. S., D'Errico, F., Van Niekerk, K. L., Coquinot, Y., Jacobs, Z., Lauritzen, S. E., Menu, M., and García-Moreno, R.: A 100 000-year-old ochre-processing workshop at Blombos Cave, South Africa, Science, 334, 219–222, https://doi.org/10.1126/science.1211535, 2011.
Henshilwood, C. S., van Niekerk, K. L., Wurz, S., Delagnes, A., Armitage, S. J., Rifkin, R. F., Douze, K., Keene, P., Haaland, M. M., Reynard, J., Discamps, E., and Mienies, S. S.: Klipdrift Shelter, southern Cape, South Africa: preliminary report on the Howiesons Poort layers, J. Archaeol. Sci., 45, 284–303, https://doi.org/10.1016/j.jas.2014.01.033, 2014.
Holmgren, K., Karlén, W., and Shaw, P. A.: Paleoclimatic Significance of the Stable Isotopic Composition and Petrology of a Late Pleistocene Stalagmite from Botswana, Quaternary Res., 43, 320–328, https://doi.org/10.1006/qres.1995.1038, 1995.
Holzkämper, S., Holmgren, K., Lee-Thorp, J., Talma, S., Mangini, A., and Partridge, T.: Late Pleistocene stalagmite growth in Wolkberg Cave, South Africa, Earth Planet. Sc. Lett., 282, 212-221, https://doi.org/10.1016/j.epsl.2009.03.016, 2009.
Huber, C., Leuenberger, M., Spahni, R., Flückiger, J., Schwander, J., Stocker, T. F., Johnsen, S., Landais, A., and Jouzel, J.: Isotope calibrated Greenland temperature record over Marine Isotope Stage 3 and its relation to CH4, Earth Planet. Sc. Lett., 243, 504–519, https://doi.org/10.1016/j.epsl.2006.01.002, 2006.
Jacobs, Z., Jones, B. G., Cawthra, H. C., Henshilwood, C. S., and Roberts, R. G.: The chronological, sedimentary and environmental context for the archaeological deposits at Blombos Cave, South Africa, Quaternary Sci. Rev., 235, 105850, https://doi.org/10.1016/j.quascirev.2019.07.032, 2020.
Kindler, P., Guillevic, M., Baumgartner, M., Schwander, J., Landais, A., and Leuenberger, M.: Temperature reconstruction from 10 to 120 kyr b2k from the NGRIP ice core, Clim. Past, 10, 887–902, https://doi.org/10.5194/cp-10-887-2014, 2014.
Kirst, G. J., Schneider, R. R., Müller, P. J., von Storch, I., and Wefer, G.: Late Quaternary Temperature Variability in the Benguela Current System Derived from Alkenones, Quaternary Res., 52, 92–103, https://doi.org/10.1006/qres.1999.2040, 1999.
Kluge, T., Marx, T., Scholz, D., Niggemann, S., Mangini, A., and Aeschbach-Hertig, W.: A new tool for palaeoclimate reconstruction: Noble gas temperatures from fluid inclusions in speleothems, Earth Planet. Sc. Lett., 269, 408–415, https://doi.org/10.1016/j.epsl.2008.02.030, 2008.
Krüger, Y., Marti, D., Staub, R. H., Fleitmann, D., and Frenz, M.: Liquid-vapour homogenisation of fluid inclusions in stalagmites: Evaluation of a new thermometer for palaeoclimate research, Chem. Geol., 289, 39–47, https://doi.org/10.1016/j.chemgeo.2011.07.009, 2011.
Lachniet, M. S.: Climatic and environmental controls on speleothem oxygen-isotope values, Quaternary Sci. Rev., 28, 412–432, https://doi.org/10.1016/j.quascirev.2008.10.021, 2009.
Løland, M. H., Krüger, Y., Fernandez, A., Buckingham, F., Carolin, S. A., Sodemann, H., Adkins, J. F., Cobb, K. M., and Meckler, A. N.: Evolution of tropical land temperature across the last glacial termination, Nat. Commun., 13, 5158, https://doi.org/10.1038/s41467-022-32712-3, 2022.
Ludwig, K. R.: User's Manual for Isoplot 3.00: A Geochronological Toolkit for Microsoft Excel, Berkeley Geochronology Center Special Publication, https://www.bgc.org/isoplot (last access: 24 August 2023), 2003.
Marean, C. W., Bar-Matthews, M., Bernatchez, J., Fisher, E., Goldberg, P., Herries, A. I. R., Jacobs, Z., Jerardino, A., Karkanas, P., Minichillo, T., Nilssen, P. J., Thompson, E., Watts, I., and Williams, H. M.: Early human use of marine resources and pigment in South Africa during the Middle Pleistocene, Nature, 449, 905–908, https://doi.org/10.1038/nature06204, 2007.
Marti, D., Kruger, Y., Fleitmann, D., Frenz, M., and Ricka, J.: The effect of surface tension on liquid-gas equilibria in isochoric systems and its application to fluid inclusions, Fluid Phase Equilibr., 314, 13–21, https://doi.org/10.1016/j.fluid.2011.08.010, 2012.
Matthews, A., Affek, H. P., Ayalon, A., Vonhof, H. B., and Bar-Matthews, M.: Eastern Mediterranean climate change deduced from the Soreq Cave fluid inclusion stable isotopes and carbonate clumped isotopes record of the last 160 ka, Quaternary Sci. Rev., 272, 107223, https://doi.org/10.1016/j.quascirev.2021.107223, 2021.
McCrea, J. M.: On the Isotopic Chemistry of Carbonates and a Paleotemperature Scale, J. Chem. Phys., 18, 849–857, https://doi.org/10.1063/1.1747785, 1950.
Meckler, A. N., Affolter, S., Dublyansky, Y. V., Krüger, Y., Vogel, N., Bernasconi, S. M., Frenz, M., Kipfer, R., Leuenberger, M., Spötl, C., Carolin, S., Cobb, K. M., Moerman, J., Adkins, J. F., and Fleitmann, D.: Glacial-interglacial temperature change in the tropical West Pacific: A comparison of stalagmite-based paleo-thermometers, Quaternary Sci. Rev., 127, 90–116, https://doi.org/10.1016/j.quascirev.2015.06.015, 2015.
Mickler, P. J., Banner, J. L., Stern, L., Asmerom, Y., Edwards, R. L., and Ito, E.: Stable isotope variations in modern tropical speleothems: Evaluating equilibrium vs. kinetic isotope effects, Geochim. Cosmochim. Ac., 68, 4381–4393, https://doi.org/10.1016/j.gca.2004.02.012, 2004.
Mickler, P. J., Stern, L. A., and Banner, J. L.: Large kinetic isotope effects in modern speleothems, GSA Bulletin, 118, 65–81, https://doi.org/10.1130/B25698.1, 2006.
Morse, J. W. and Bender, M. L.: Partition coefficients in calcite: Examination of factors influencing the validity of experimental results and their application to natural systems, Chem. Geol., 82, 265–277, https://doi.org/10.1016/0009-2541(90)90085-L, 1990.
Noah, J.: Reconstructing palaeoenvironments during the Middle Stone Age in the southern Cape, South Africa: stable isotope analysis of speleothems from the De Hoop Nature Reserve, Faculty of Science, University of the Wiwatersrand, Johannesburg, http://hdl.handle.net/10539/10083 (last access: 20 August 2023), 2011.
Oster, J. L., Montañez, I. P., and Kelley, N. P.: Response of a modern cave system to large seasonal precipitation variability, Geochim. Cosmochim. Ac., 91, 92–108, https://doi.org/10.1016/j.gca.2012.05.027, 2012.
Partridge, T. C., Demenocal, P. B., Lorentz, S. A., Paiker, M. J., and Vogel, J. C.: Orbital forcing of climate over South Africa: A 200 000-year rainfall record from the pretoria saltpan, Quaternary Sci. Rev., 16, 1125–1133, https://doi.org/10.1016/S0277-3791(97)00005-X, 1997.
Peeters, F. J. C., Acheson, R., Brummer, G.-J. A., de Ruijter, W. P. M., Schneider, R. R., Ganssen, G. M., Ufkes, E., and Kroon, D.: Vigorous exchange between the Indian and Atlantic oceans at the end of the past five glacial periods, Nature, 430, 661–665, https://doi.org/10.1038/nature02785, 2004.
Poulson, T. L. and White, W. B.: The Cave Environment, Science, 165, 971–981, https://doi.org/10.1126/science.165.3897.971, 1969.
Quick, L. J., Meadows, M. E., Bateman, M. D., Kirsten, K. L., Mäusbacher, R., Haberzettl, T., and Chase, B. M.: Vegetation and climate dynamics during the last glacial period in the fynbos-afrotemperate forest ecotone, southern Cape, South Africa, Quater. Int., 404, 136–149, https://doi.org/10.1016/j.quaint.2015.08.027, 2016.
Railsback, L. B., Brook, G. A., Liang, F., Marais, E., Cheng, H., and Edwards, R. L.: A multi-proxy stalagmite record from northwestern Namibia of regional drying with increasing global-scale warmth over the last 47 kyr: The interplay of a globally shifting ITCZ with regional currents, winds, and rainfall, Palaeogeogr., Palaeoclim. 461, 109–121, https://doi.org/10.1016/j.palaeo.2016.08.014, 2016.
Roffe, S. J., Fitchett, J. M., and Curtis, C. J.: Classifying and mapping rainfall seasonality in South Africa: a review, South Afr. Geogr. J., 101, 158–174, https://doi.org/10.1080/03736245.2019.1573151, 2019.
Rokkan, H. A.: Sporelementer i speleothemer – klimasignal og markørhorisonter, Department of Earth sciences, University of Bergen, https://bora.uib.no/bora-xmlui/handle/1956/20933 (last access: 20 August 2023), 2019.
Schlitzer, R.: Interactive analysis and visualization of geoscience data with Ocean Data View, Comput. Geosci., 28, 1211–1218, https://doi.org/10.1016/S0098-3004(02)00040-7, 2002.
Scholz, D. and Hoffmann, D. L.: StalAge – An algorithm designed for construction of speleothem age models, Quat. Geochronol., 6, 369–382, https://doi.org/10.1016/j.quageo.2011.02.002, 2011.
Scroxton, N., Burns, S., Dawson, P., Rhodes, J. M., Brent, K., McGee, D., Heijnis, H., Gadd, P., Hantoro, W., and Gagan, M.: Rapid measurement of strontium in speleothems using core-scanning micro X-ray fluorescence, Chem. Geol., 487, 12–22, https://doi.org/10.1016/j.chemgeo.2018.04.008, 2018.
Siddall, M., Rohling, E. J., Thompson, W. G., and Waelbroeck, C.: Marine isotope stage 3 sea level fluctuations: Data synthesis and new outlook, Rev. Geophys., 46, RG4003, https://doi.org/10.1029/2007RG000226, 2008.
Simon, M. H., Arthur, K. L., Hall, I. R., Peeters, F. J. C., Loveday, B. R., Barker, S., Ziegler, M., and Zahn, R.: Millennial-scale Agulhas Current variability and its implications for salt-leakage through the Indian–Atlantic Ocean Gateway, Earth Planet. Sc. Lett., 383, 101–112, https://doi.org/10.1016/j.epsl.2013.09.035, 2013.
Sodemann, H., Dekhtyareva, A., Fernandez, A., Seidl, A., and Maccali, J.: A flexible device to produce a gas stream with precisely controlled water vapour mixing ratio and isotope composition based on microdrop dispensing technology, Atmos. Meas. Tech. Discuss. [preprint], https://doi.org/10.5194/amt-2023-55, in review, 2023.
Stoll, H. M., Müller, W., and Prieto, M.: I-STAL, a model for interpretation of , and Ba/Ca variations in speleothems and its forward and inverse application on seasonal to millennial scales, Geochem. Geophys. Geosy., 13, Q09004, https://doi.org/10.1029/2012GC004183, 2012.
Strobel, P., Bliedtner, M., Carr, A. S., Struck, J., du Plessis, N., Glaser, B., Meadows, M. E., Quick, L. J., Zech, M., Zech, R., and Haberzettl, T.: Reconstructing Late Quaternary precipitation and its source on the southern Cape coast of South Africa: A multi-proxy paleoenvironmental record from Vankervelsvlei, Quaternary Sci. Rev., 284, 107467, https://doi.org/10.1016/j.quascirev.2022.107467, 2022.
Stuut, J.-B. W., Prins, M. A., Schneider, R. R., Weltje, G. J., Jansen, J. H. F., and Postma, G.: A 300-kyr record of aridity and wind strength in southwestern Africa: inferences from grain-size distributions of sediments on Walvis Ridge, SE Atlantic, Mar. Geol., 180, 221–233, https://doi.org/10.1016/S0025-3227(01)00215-8, 2002.
Talma, A. S. and Vogel, J. C.: Late Quaternary Paleotemperatures Derived from a Speleothem from Cango Caves, Cape Province, South Africa, Quaternary Res., 37, 203–213, https://doi.org/10.1016/0033-5894(92)90082-T, 1992.
Taylor, S. R. and McLennan, S. M.: The Continental Crust: its Composition and Evolution, Geoscience Texts, Blackwell Scientific Publications, Oxford, 312 pp., https://www.osti.gov/biblio/6582885 (last access: 24 August 2023), 1985.
Tremaine, D. M., Froelich, P. N., and Wang, Y.: Speleothem calcite farmed in situ: Modern calibration of δ18O and δ13C paleoclimate proxies in a continuously-monitored natural cave system, Geochim. Cosmochim. Ac., 75, 4929–4950, https://doi.org/10.1016/j.gca.2011.06.005, 2011.
Urey, H. C.: The Thermodynamic Properties of Isotopic Substances, J. Chem. Soc., 1947, 562–581, https://doi.org/10.1039/jr9470000562, 1947.
van Breukelen, M. R., Vonhof, H. B., Hellstrom, J. C., Wester, W. C. G., and Kroon, D.: Fossil dripwater in stalagmites reveals Holocene temperature and rainfall variation in Amazonia, Earth Planet. Sc. Lett., 275, 54–60, https://doi.org/10.1016/j.epsl.2008.07.060, 2008.
Van Meerbeeck, C. J., Renssen, H., and Roche, D. M.: How did Marine Isotope Stage 3 and Last Glacial Maximum climates differ? – Perspectives from equilibrium simulations, Clim. Past, 5, 33–51, https://doi.org/10.5194/cp-5-33-2009, 2009.
Vonhof, H. B., van Breukelen, M. R., Postma, O., Rowe, P. J., Atkinson, T. C., and Kroon, D.: A continuous-flow crushing device for on-line delta H-2 analysis of fluid inclusion water in speleothems, Rapid Commun. Mass Sp., 20, 2553–2558, https://doi.org/10.1002/rcm.2618, 2006.
Wadley, L.: What Stimulated Rapid, Cumulative Innovation After 100,000 Years Ago?, J. Archaeol. Method Th., 28, 120–141, https://doi.org/10.1007/s10816-020-09499-y, 2021.
Wainer, K., Genty, D., Blamart, D., Daëron, M., Bar-Matthews, M., Vonhof, H., Dublyansky, Y., Pons-Branchu, E., Thomas, L., van Calsteren, P., Quinif, Y., and Caillon, N.: Speleothem record of the last 180 ka in Villars cave (SW France): Investigation of a large δ18O shift between MIS6 and MIS5, Quaternary Sci. Rev., 30, 130–146, https://doi.org/10.1016/j.quascirev.2010.07.004, 2011.
Warken, S. F., Weißbach, T., Kluge, T., Vonhof, H., Scholz, D., Vieten, R., Schmidt, M., Winter, A., and Frank, N.: Last glacial millennial-scale hydro-climate and temperature changes in Puerto Rico constrained by speleothem fluid inclusion δ18O and δ2H values, Clim. Past, 18, 167–181, https://doi.org/10.5194/cp-18-167-2022, 2022.
Wassenburg, J. A., Riechelmann, S., Schröder-Ritzrau, A., Riechelmann, D. F. C., Richter, D. K., Immenhauser, A., Terente, M., Constantin, S., Hachenberg, A., Hansen, M., and Scholz, D.: Calcite Mg and Sr partition coefficients in cave environments: Implications for interpreting prior calcite precipitation in speleothems, Geochim. Cosmochim. Ac., 269, 581–596, https://doi.org/10.1016/j.gca.2019.11.011, 2020.
Wassenburg, J. A., Vonhof, H. B., Cheng, H., Martinez-Garcia, A., Ebner, P. R., Li, X. L., Zhang, H. W., Sha, L. J., Tian, Y., Edwards, R. L., Fiebig, J., and Haug, G. H.: Penultimate deglaciation Asian monsoon response to North Atlantic circulation collapse, Nat. Geosci., 14, 937–941, https://doi.org/10.1038/s41561-021-00851-9, 2021.
Wortham, B. E., Montanez, I. P., Swart, P. K., Vonhof, H., and Tabor, C.: Variability in effective moisture inferred from inclusion fluid delta O-18 and delta H-2 values in a central Sierra Nevada stalagmite (CA), Quaternary Sci. Rev., 279, 107399, https://doi.org/10.1016/j.quascirev.2022.107399, 2022.
Wurz, S.: Variability in the Middle Stone Age Lithic Sequence, 115 000–60 000 Years Ago at Klasies River, South Africa, J. Archaeol. Sci., 29, 1001–1015, https://doi.org/10.1006/jasc.2001.0799, 2002.