the Creative Commons Attribution 4.0 License.
the Creative Commons Attribution 4.0 License.
 | 25 Jul 2023
Regional pollen-based Holocene temperature and precipitation patterns depart from the Northern Hemisphere mean trends
Ulrike Herzschuh
Thomas Böhmer
Manuel Chevalier
Raphaël Hébert
Anne Dallmeyer
Chenzhi Li
Xianyong Cao
Odile Peyron
Larisa Nazarova
Elena Y. Novenko
Jungjae Park
Natalia A. Rudaya
Frank Schlütz
Lyudmila S. Shumilovskikh
Pavel E. Tarasov
Yongbo Wang
Ruilin Wen
Qinghai Xu
Zhuo Zheng
A mismatch between model- and proxy-based Holocene climate change, known as the “Holocene conundrum”, may partially originate from the poor spatial coverage of climate reconstructions in, for example, Asia, limiting the number of grid cells for model–data comparisons. Here we investigate hemispheric, latitudinal, and regional mean time series and time-slice anomaly maps of pollen-based reconstructions of mean annual temperature, mean July temperature, and annual precipitation from 1908 records in the Northern Hemisphere extratropics. Temperature trends show strong latitudinal patterns and differ between (sub-)continents. While the circum-Atlantic regions in Europe and eastern North America show a pronounced Middle Holocene temperature maximum, western North America shows only weak changes, and Asia mostly shows a continuous Holocene temperature increase. Likewise, precipitation trends show certain regional peculiarities such as the pronounced Middle Holocene precipitation maximum between 40 and 50∘ N in Asia and Holocene increasing trends in Europe and western North America, which can all be linked with Holocene changes in the regional circulation pattern responding to temperature change. Given a background of strong regional heterogeneity, we conclude that the calculation of global or hemispheric means, which initiated the Holocene conundrum debate, should focus more on understanding the spatiotemporal patterns and their regional drivers.
- Article
(10533 KB) - Full-text XML
- BibTeX
- EndNote


Previous comparisons of proxy-based reconstructions and simulations of global Holocene climate change have yielded major mismatches, a discrepancy termed the “Holocene conundrum” (Liu et al., 2014c; Kaufman and Broadman, 2023). While simulations indicate an increase in Holocene temperature (Liu et al., 2014c), proxy data syntheses instead support a Middle Holocene temperature maximum (Marcott et al., 2013; Kaufman et al., 2020b). Recently, several explanations for this finding were proposed, most of which assign the mismatch to biases in the proxy data with respect to location or seasonality (Marsicek et al., 2018; Bader et al., 2020; Bova et al., 2021; Osman et al., 2021).
Previous temperature reconstructions from continental areas are mainly available from the circum-North Atlantic region and are potentially unrepresentative of the whole Northern Hemisphere temperature change, as the region was strongly impacted by the vanishing Laurentide ice-sheet (Rolandone et al., 2003; Chouinard and Mareschal, 2009). Synthesis studies hitherto included only few records from the large non-glaciated Asian continent (Andreev et al., 2004; Leipe et al., 2015; Melles et al., 2012; Nakagawa et al., 2002; Stebich et al., 2015; Tarasov et al., 2009, 2013). The inclusion of recently compiled Holocene pollen records (Cao et al., 2019; Herzschuh et al., 2019) and high-quality modern pollen datasets (Tarasov et al., 2011; Cao et al., 2014; Davis et al., 2020; Dugerdil et al., 2021) from Asia now allows for higher-quality quantitative reconstructions.
While temperature patterns have often been studied, hemispheric syntheses of quantitative precipitation change during the Holocene are not yet available. A recent study of qualitative moisture proxy data suggests an overall warm and dry Middle Holocene in the Northern Hemisphere midlatitudes, related to the weakened latitudinal temperature gradient (Routson et al., 2019). This trend contrasts with the idea of positive hydrological sensitivity, i.e., that warm climates are wet at a global scale (Trenberth, 2011), which was confirmed from proxy and model studies from monsoonal areas in lower latitudes (Kutzbach, 1981; Wang et al., 2017). However, the study of Routson et al. (2019) only included a few records from the subtropical monsoonal Asia region that is known for complex Holocene moisture patterns (Herzschuh, 2004; Chen et al., 2019; Herzschuh et al., 2019). These and further synthesis studies (Wang et al., 2010, 2020; Chen et al., 2015) also gave a plethora of alternative explanations to characterize these patterns, including interactions between the monsoon and westerlies circulation and evaporation effects.
Pollen spectra are a well-established paleoclimate proxy and quantitative estimates of past climatic change that are mainly derived by applying (transfer functions of) modern pollen–climate calibration sets to fossil pollen records (Birks et al., 2010; Chevalier et al., 2020). Accordingly, pollen-based reconstructions constitute a substantial part of multi-proxy syntheses (e.g., Kaufman et al., 2020b). However, they are derived from different calibration sets and methods, which makes a consistent assessment of inherent reconstruction biases difficult. Pollen data are one of the few land-derived proxies available that can theoretically contain independent information on both temperature and precipitation in the same record (Chevalier et al., 2020; Mauri et al., 2015). Consistent pollen-based reconstructions can thus contribute to better characterizing past temperature and precipitation changes across large landmasses and how these changes co-vary over time (Davis et al., 2003).
Here, we analyze spatiotemporal patterns of pollen-based reconstructions of mean annual temperature (Tann), mean July temperature (TJuly), and mean annual precipitation (Pann) from 1908 sites from the Northern Hemisphere extratropics that were generated using harmonized methods and calibration datasets (LegacyClimate 1.0, Herzschuh et al., 2023a) and have revised chronologies (Li et al., 2022). We address the following questions. First, what are the continental, latitudinal, and regional patterns of Holocene temperature change in the Northern Hemisphere extratropics, and how do our new reconstructions align with the globally averaged trends of a previous global temperature synthesis? Second, what are the continental, latitudinal, and regional patterns of Holocene precipitation change, and how do these changes co-vary with temperature trends?
This study analyzes pollen-based reconstructions provided in the LegacyClimate 1.0 dataset (Herzschuh et al., 2023a). It contains pollen-based reconstructions of TJuly, Tann, and Pann of 2593 records along with transfer function metadata and estimates of reconstruction errors and is accompanied by work analyzing reconstruction biases and presenting reliability tests (Herzschuh et al., 2023a). The fossil pollen records, representing the LegacyPollen 1.0 dataset, were derived from multiple natural archives, most commonly continuous lacustrine and peat accumulations (Herzschuh et al., 2022), and originate from the Neotoma Paleoecology Database (“Neotoma” hereafter; last access: April 2021; Williams et al., 2018), a dataset from eastern and central Asia (Cao et al., 2013; Herzschuh et al., 2019), a dataset from northern Asia (Cao et al., 2019), and a few additional records to fill up some spatial data gaps in Siberia.
The chronologies of LegacyPollen 1.0 are based on revised “Bacon” (Blaauw and Christen, 2011) age–depth models with calibrated ages at each depth provided by Li et al. (2022). Taxa are harmonized to genus level for woody and major herbaceous taxa and to family level for other herbaceous taxa. Along with LegacyClimate 1.0, a taxonomically harmonized modern pollen dataset is provided (a total of 15379 samples; Herzschuh et al., 2023a) that includes datasets from Europe (EMPD2, Davis et al., 2020), Asia (Tarasov et al., 2011; Herzschuh et al., 2019; Dugerdil et al., 2021), and North America (from Neotoma; Whitmore et al., 2005). LegacyClimate 1.0 also provides the climate data for the sites of the modern pollen samples that were derived from WorldClim 2 (Fick and Hijmans, 2017).
LegacyClimate 1.0 provides reconstructions based on different methodologies, including two versions of WA-PLS (weighted-averaging partial least-squares regression, a transfer function-based approach) and MAT (modern analog technique). For each fossil site, we calculated the geographic distance between each modern sampling site and each fossil location and selected a unique calibration set from modern sites within a 2000 km radius (Cao et al., 2014), as it was shown to be a good trade-off between analog quality and quantity (Cao et al., 2017). For WA-PLS, the used component, typically first or second, was identified using model statistics as derived from leave-one-out cross-validation based on the criterion that an additional component be used only if it improves the root-mean-squared error (RMSE) by at least 5 % (ter Braak and Juggins, 1993). A WA-PLS_tailored reconstruction is also provided in the LegacyClimate 1.0 dataset (Herzschuh et al., 2023a), which addresses the problem that co-variation in modern temperature and precipitation data can be transferred into the reconstruction. To reduce the influence of one climate variable on the target variable, the modern range of the non-target variable is reduced by tailoring the modern pollen dataset to a selection of sites with little covariance between the two variables. For example, to reconstruct TJuly we identified the Pann range reconstructed by WA-PLS and extended it by 25 % at both ends. For the selection of sites in the modern training dataset, we then restricted modern Pann to that range accordingly. As such, we keep all information for reconstruction from those modern pollen spectra that cover a wide temperature range but downplay the information from pollen spectra covering a wide precipitation range. However, initial assessments did not show any major differences compared to using the standard WA-PLS-derived reconstruction. Therefore, we do not make use of this dataset for this study so as to be consistent with previous studies. For comparison, we provide a plot with hemispheric, continental, and latitudinal mean curves for TJuly, Tann, and Pann reconstructed by WA-PLS_ tailored in the Supplement. The MAT reconstructions were derived from the seven best analogs that we identified based on the dissimilarity measures between the fossil samples and the modern pollen assemblages using the squared-chord distance metric (Simpson, 2012). MAT reconstructions were highly correlated with those obtained by WA-PLS (Herzschuh et al., 2023a). Here, we opted for the widely used WA-PLS, as it is less sensitive to the size and environmental gradient length of the modern pollen dataset and is thus less affected by spatial autocorrelation effects and can better handle poor analog situations (ter Braak and Juggins, 1993; Telford and Birks, 2011; Cao et al., 2014; Chevalier et al., 2020). Statistical significance tests sensu Telford and Birks (2011) were performed for each site for WA-PLS, WA-PLS_ tailored, and MAT and assessed in Herzschuh et al. (2023a).
Of the 2593 records available in LegacyClimate 1.0, 1908 records with at least five samples that cover at least 4000 years of the Holocene and have a mean temporal resolution of 1000 years or less were included in the time slice comparisons based on this criterion (Fig. 1). The construction of time series to estimate the means of climate variables was further restricted to 957 records that cover the full period of 11 to 1 ka.
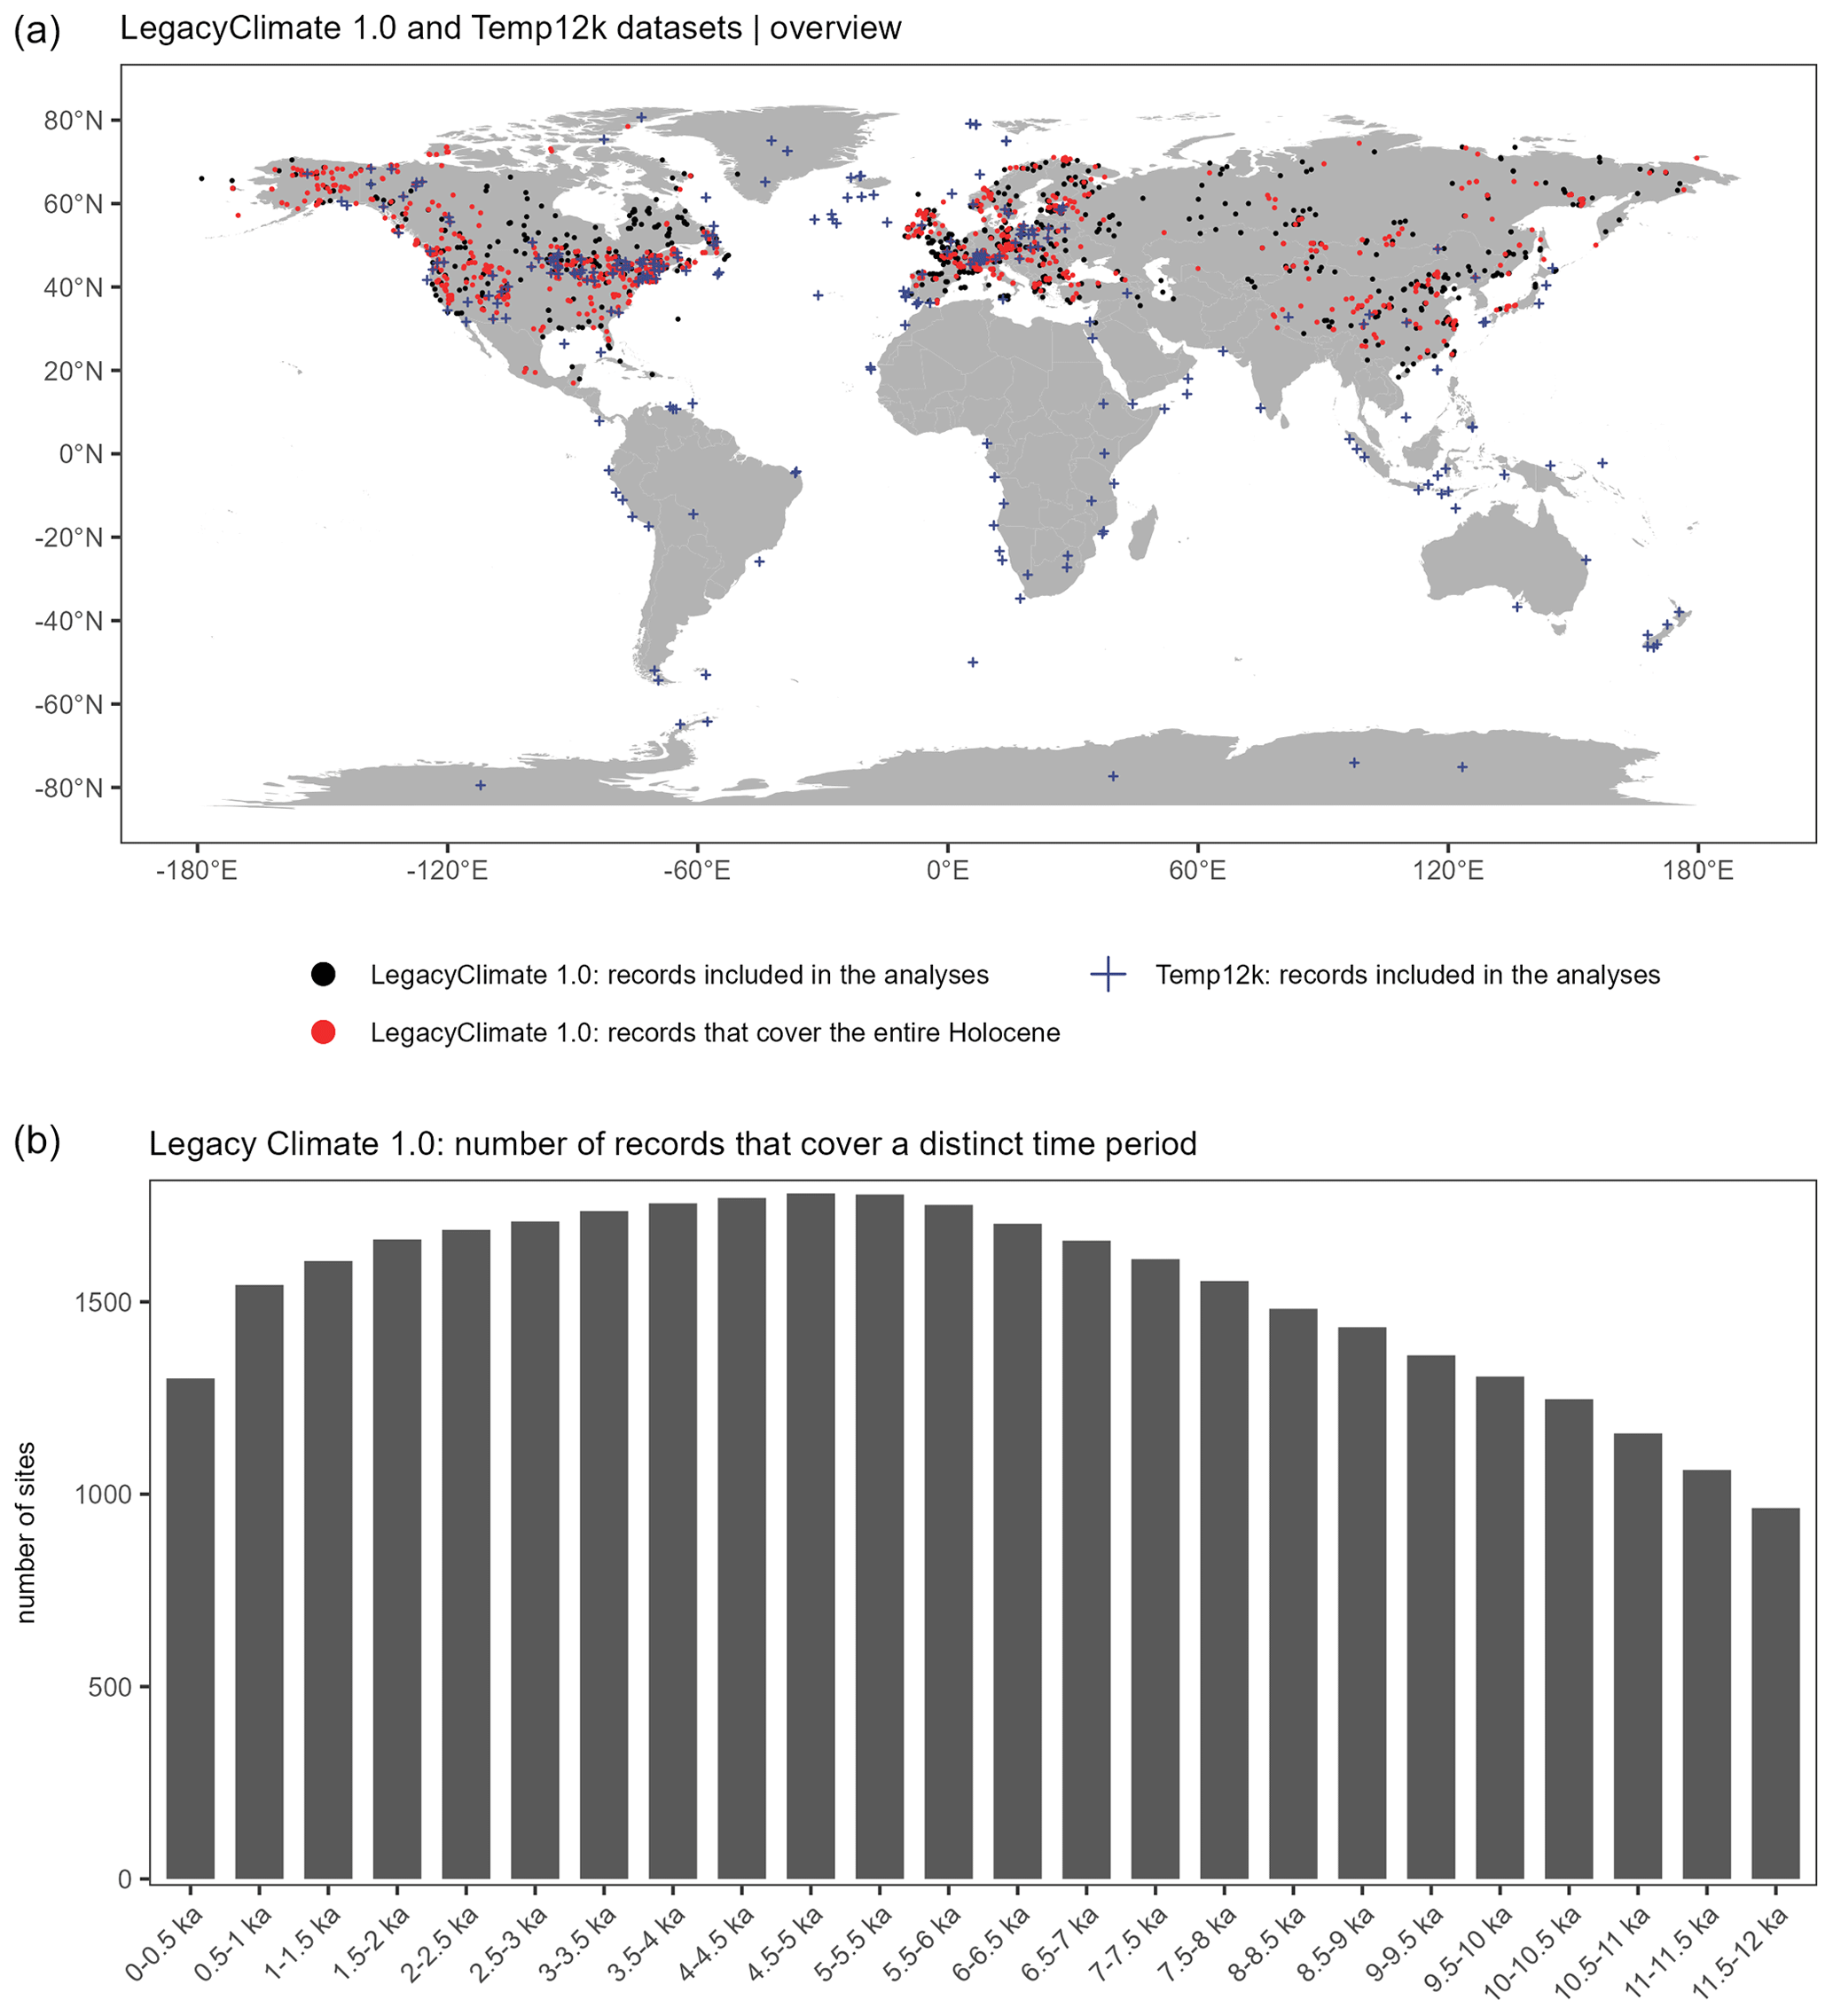
Figure 1(a) Spatial coverage of the LegacyClimate 1.0 (dots) and Temp12k (Kaufman et al., 2020b, crosses) datasets used in this analysis. The map shows sites that cover the entire Holocene (i.e., 11–1 ka) as red symbols and those that cover parts of the Holocene but at least 4000 years in the period between 12 and 0 ka as black symbols. (b) Temporal coverage of the LegacyClimate 1.0 dataset.
The mean root-mean-squared error of prediction (RMSEP; WA-PLS) from all 957 sites included in the time series analyses is 2.4 ± 0.7 ∘C (1 standard deviation) for TJuly, 2.6 ± 0.5 ∘C for Tann, and 244 ± 74 mm for Pann. They show a spatial pattern in that the RMSEPs are higher in areas with steep climate gradients (e.g., central Asia and along the western coast of North America; see Fig. 5 in Herzschuh et al., 2023a). As it has already been shown in previous comparisons, WA-PLS can have higher RMSEPs than MAT, but these do not necessarily reflect a less reliable reconstruction but methodological differences. MAT is known to be more sensitive to spatial autocorrelation, which causes the model performance to be over-optimistic compared to WA-PLS (Cao et al., 2014). In addition, trends and the relative changes, as interpreted in this study, are less sensitive to methodological biases than absolute values.
Derived time series of TJuly, Tann, and Pann were smoothed over a 500-year timescale and resampled at a 100-year resolution using the corit package in R (version 0.0.0.9000, Reschke et al., 2019). Because the original time series are unevenly spaced, we used this package as it is designed to resample irregularly sampled time series to an equidistant spacing (Reschke et al., 2019). The smoothing length of 500 years reflects the typical resolution of the original pollen records. These derived time series were sampled at selected time slices and converted into a regular 2∘ × 2∘ raster grid (by taking the mean of all records located within the grid cell) using the raster package in R (version 3.5-11, R Core Team, 2020; Hijmans et al., 2021).
To calculate zonal, (sub-)continental (i.e., Asia (> 43∘ E), Europe (< 43∘ E), eastern North America (< 104∘ W; Williams et al., 2000) and western North America), and hemispheric means we selected all 957 smoothed and resampled time series of TJuly, Tann, and Pann that cover the full period between 11 and 1 ka and calculated climate anomalies for all three climate variables. Rather than using the anomalies for Pann we calculated the precipitation change as a percentage relative to the 1 ka reference period (Fig. 3) or relative to the younger time slice (Fig. 4). The estimate at 1 ka was used as a reference to calculate the anomalies, as many records either poorly cover or do not cover the last 0.5 ka. Weights proportional to the inverse number of time series per cell in the grid were used to calculate the weighted mean and standard deviation (using the wtd.mean and wtd.var functions from the Hmisc R package, version 5.0-1, Harrell and Dupont, 2023). The weighted standard error was calculated by dividing the weighted standard deviation estimates by the square root of the number of grid cells with at least one record. In total, 436 grid cells between 17 and 79∘ N are covered by one or more time series (Fig. 2).
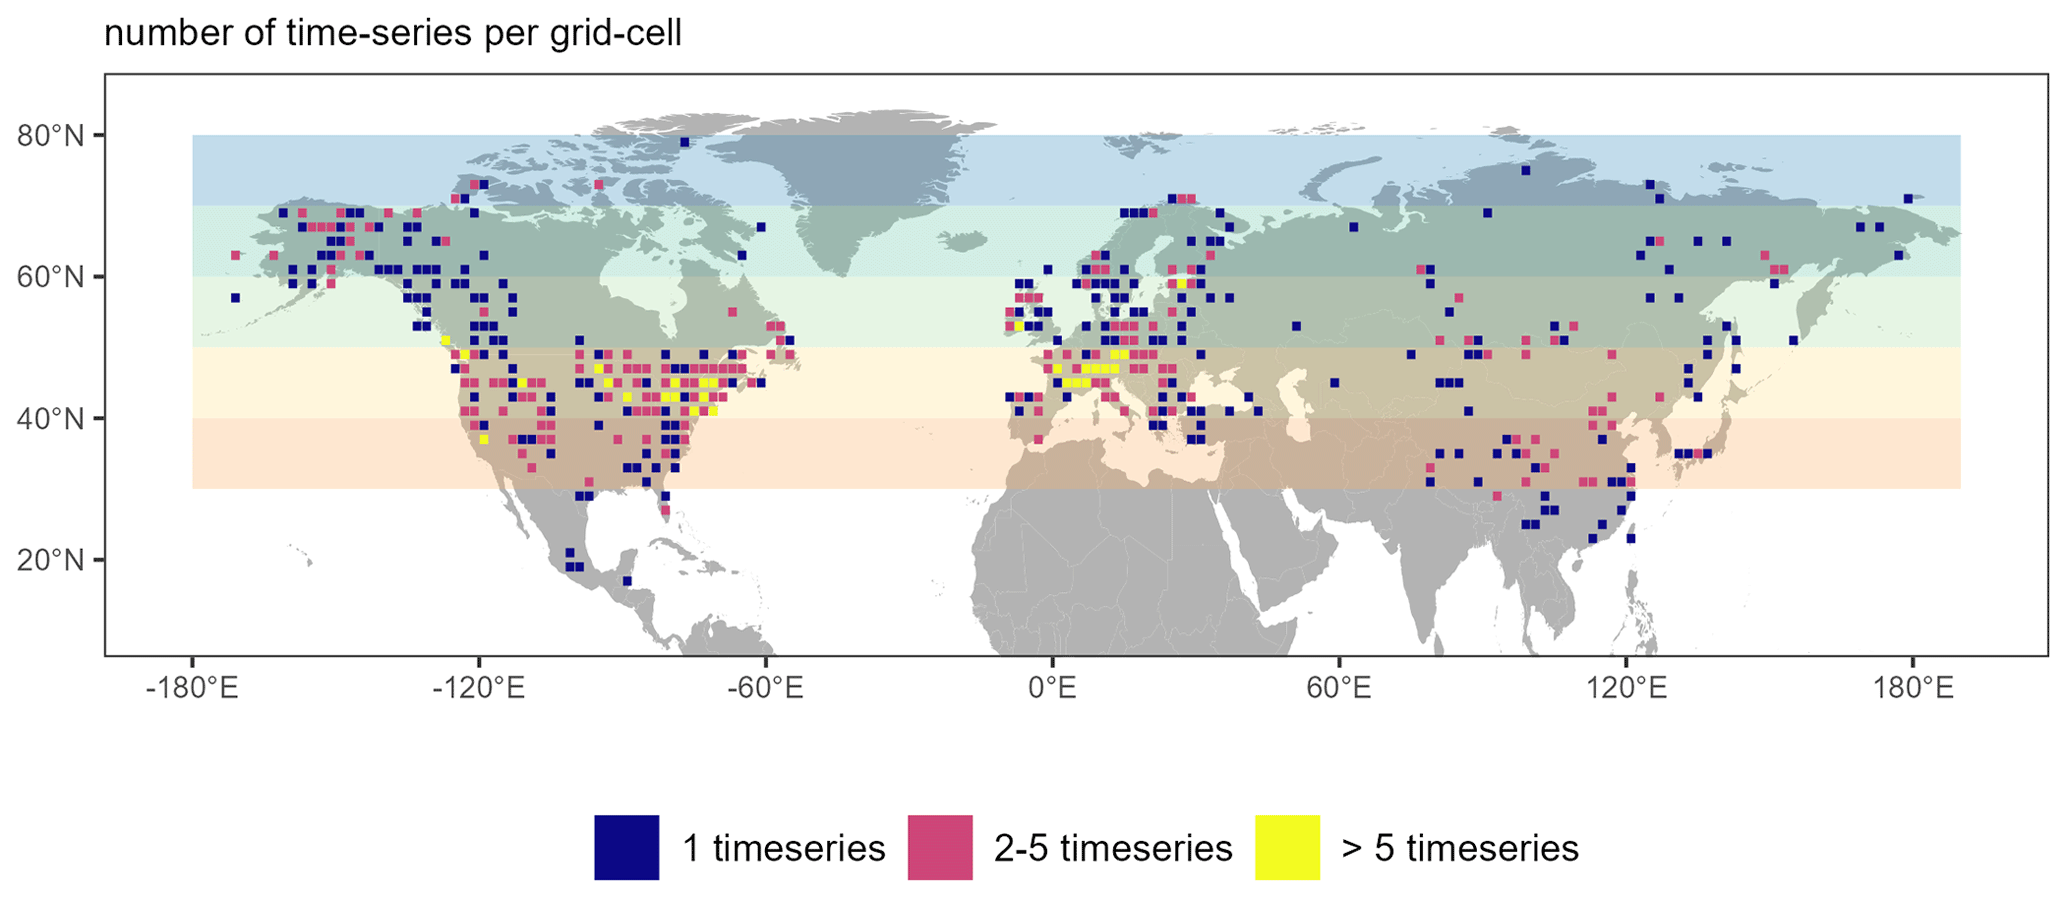
Figure 2Number of time series per grid cell. The map shows the number of time series that are merged into one grid cell. Colored rectangles (as used for the zonal mean curves in Fig. 3) indicate the latitudinal band a respective grid cell belongs to.
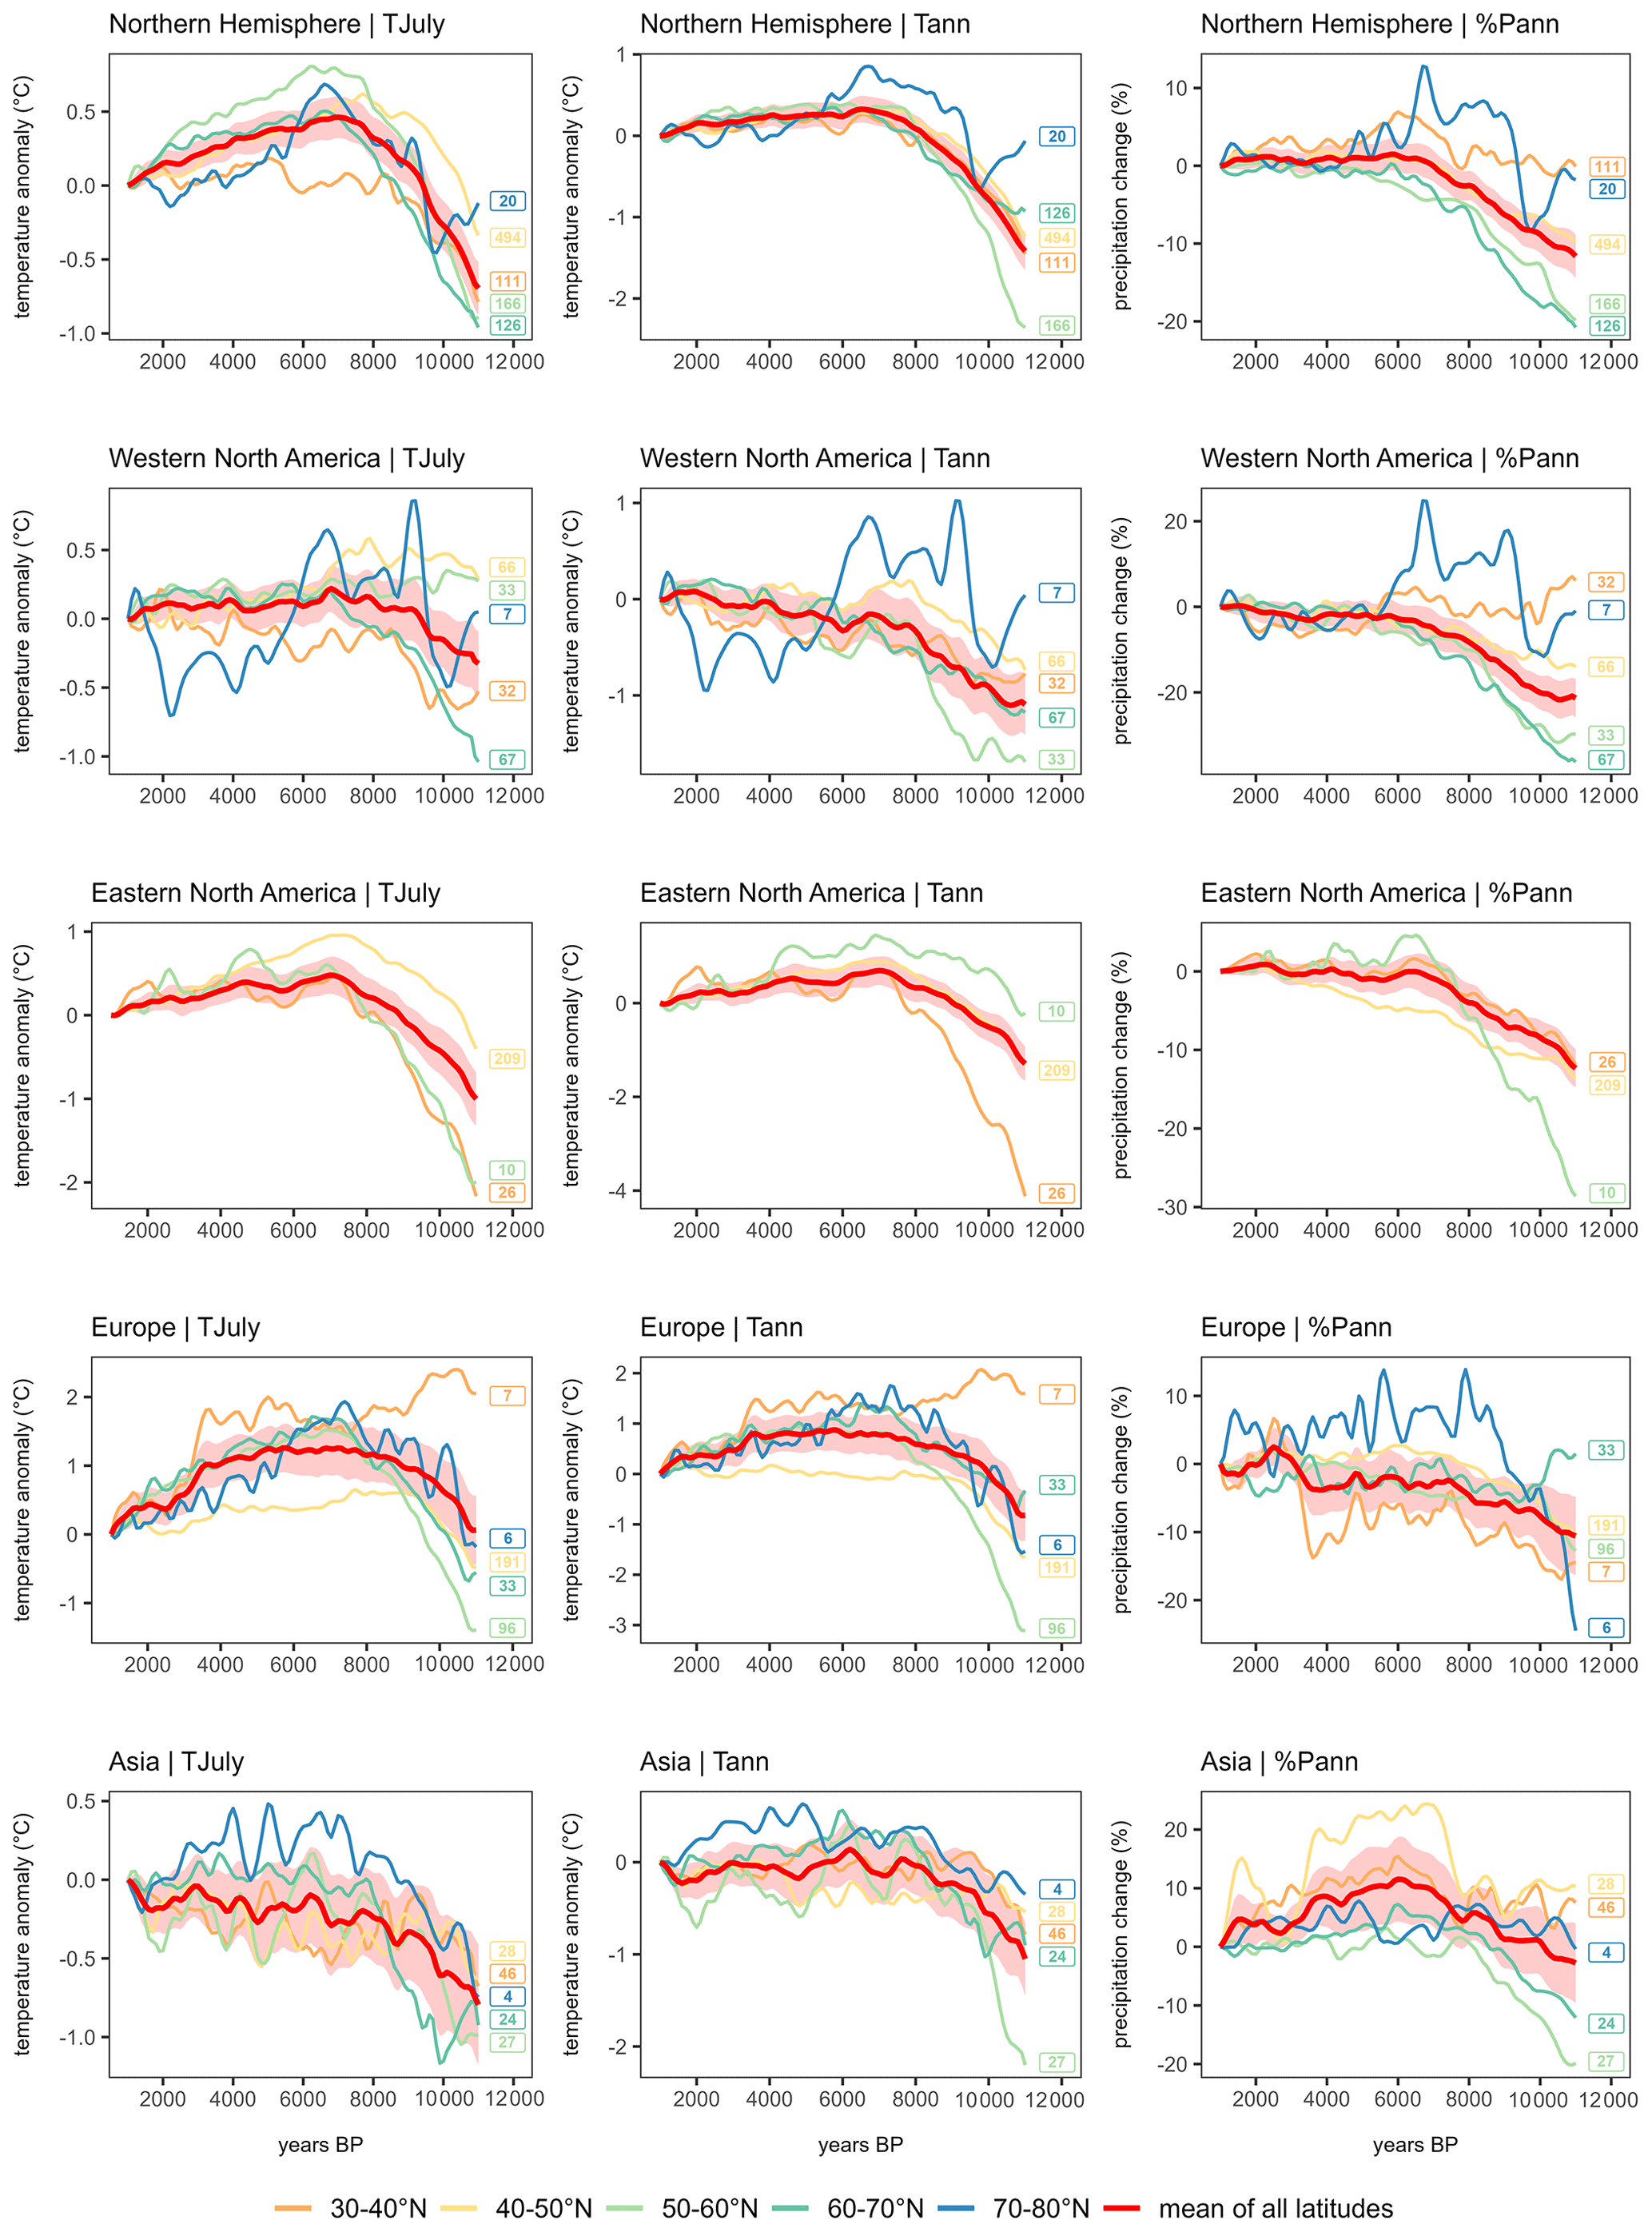
Figure 3Hemispheric, (sub-)continental, and zonal mean curves for TJuly, Tann, and %Pann derived from pollen-based reconstruction with WA-PLS. Curves from zonal bands that contain fewer than three grid cells were excluded. The shading corresponds to the latitude-weighted standard error in the latitude-weighted mean. Labels in corresponding colors indicate the number of grid boxes that contributed to each latitudinal curve.
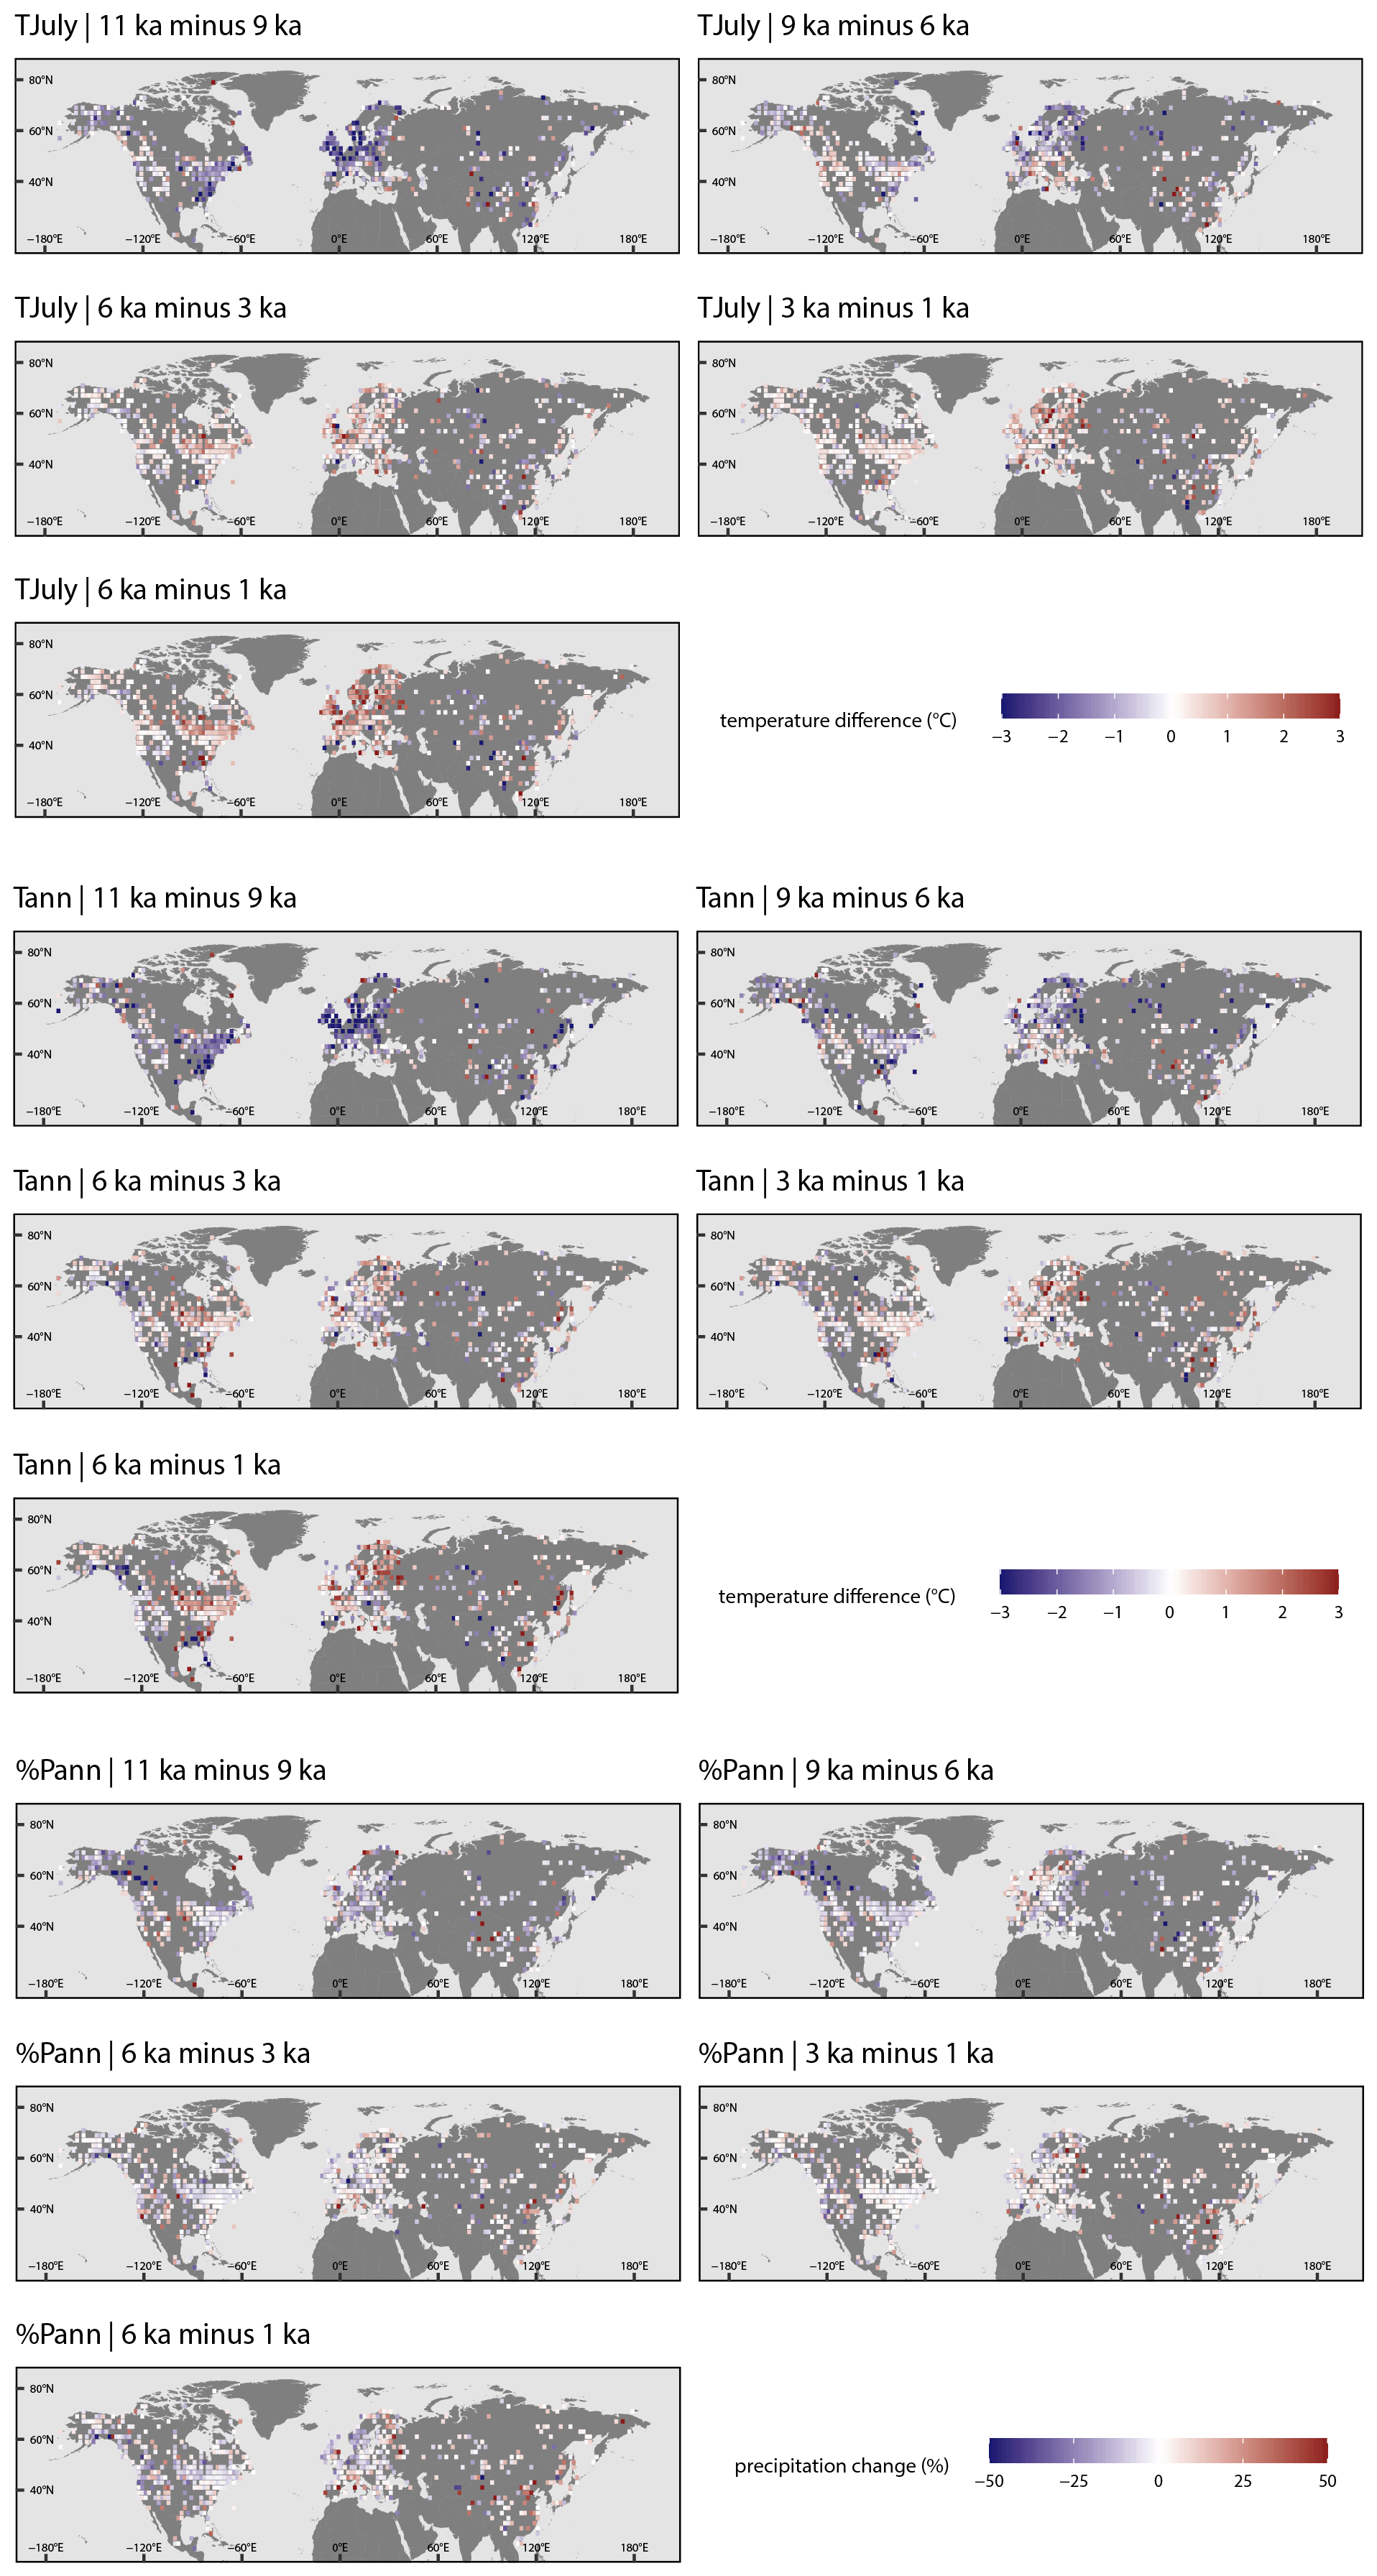
Figure 4Difference maps of TJuly, Tann (∘C), and Pann (as a percentage of the value of the younger time slice) between selected time slices. Color codes for values outside the range were restricted to range maxima. A list with the entire value range and the proportions of values that fall within the restricted range is presented in Table A1. Maps are gridded values averaging the values of records from within the 2∘ × 2∘ grid cell.
The zonal mean over 10∘ bands of (sub-)continents (e.g., for 30–40∘ N of Europe) were calculated and also used to calculate the mean time series of the (sub-)continents, with weights proportional to the terrestrial area in a zonal band based on the WGS84 EASE-Grid 2.0 global projection (Brodzik et al., 2012). Likewise, the area weighting was applied to derive the continental means and hemispheric-wide (zonal) means. We compare the linear trends of all zonal means with each other for each continent, as well as the linear trends of the continental weighted means, taking into account the standard error of each average. We take a Monte Carlo approach to generate ensembles of trend estimates after adding random errors and use a standard t test to assess pairwise whether the means of the ensembles are significantly different.
Furthermore, we extracted 325 records that cover the full Holocene period in the Temp12k dataset (version 1-1-0; https://lipdverse.org/project/temp12k, last access: 8 March 2023; Kaufman et al., 2020b) applying the same restrictions as with the LegacyClimate 1.0 dataset (i.e., at least five samples, a mean temporal resolution of 1000 years or less). Instead of 11.0 ka, we here used a cutoff of 10.5 ka, as many records in this dataset start shortly after 11.0 ka. For 43 sites, more than one temperature time series was stored in the Temp12k dataset. In these cases, we selected the time series with the lowest amount of missing temperature values in the period between 10.5 and 1 ka, leaving 272 records that were used to construct the mean temperature anomaly time series, similar to the approach described for the LegacyClimate 1.0 dataset. We excluded all pollen-based reconstructions from the Temp12k dataset between 30 and 80∘ N (n=117) to avoid duplications with the LegacyClimate 1.0 dataset when integrating both datasets into a joint hemispheric and global mean temperature stack curve.
3.1 Spatiotemporal pattern of temperature reconstructions
The temporal patterns of temperature records covering the entire Holocene (i.e., 11–1 ka) show strong differences between continents (Fig. 3). Europe shows a pronounced Middle Holocene temperature maximum of +1.3 ± −0.4 ∘C for TJuly at 5.7 ka, whereas the Tann maximum is less pronounced (+0.9 ± 0.4 ∘C at 5.8 ka). The Middle Holocene TJuly was weaker and occurred earlier in eastern North America (+0.5 ± 0.2 ∘C at 7.0 ka), while Tann warming was +0.7 ± 0.3 ∘C for the same time period (7.0 ka). Asia (TJuly) and western North America (Tann) show almost no maximum but only some variations around a continuously increasing Holocene trend, with a higher increase rate before 6 ka than after 6 ka.
Aside from these differences among (sub-)continents, certain regional differences exist. Early Holocene cold climate anomalies were most pronounced in latitudes between 45 and 65∘ N, particularly in northern Europe, northeastern Asia, and Alaska (Fig. 4), with a greater than 2.5 ∘C deviation from Holocene Tann maximum values in most records. The most pronounced Tann maximum (more than 1.5 ∘C warmer than the Late Holocene) can be found in Europe north of 60∘ N and eastern North America between 60 and 70∘ N, forming a circum-North Atlantic pattern (Fig. 5). Records from eastern Europe, inner Asia, and southern North America show mostly no Middle Holocene temperature maximum but instead show a Late Holocene maximum. Records with an Early Holocene maximum dominate the central northern part of North America and China, though these areas are characterized by high spatial variability. High ranges of Holocene temperature variations (larger than 5 ∘C) are found in midlatitude Europe, western Canada, the southeastern US, and along the northern Asian Pacific coast.
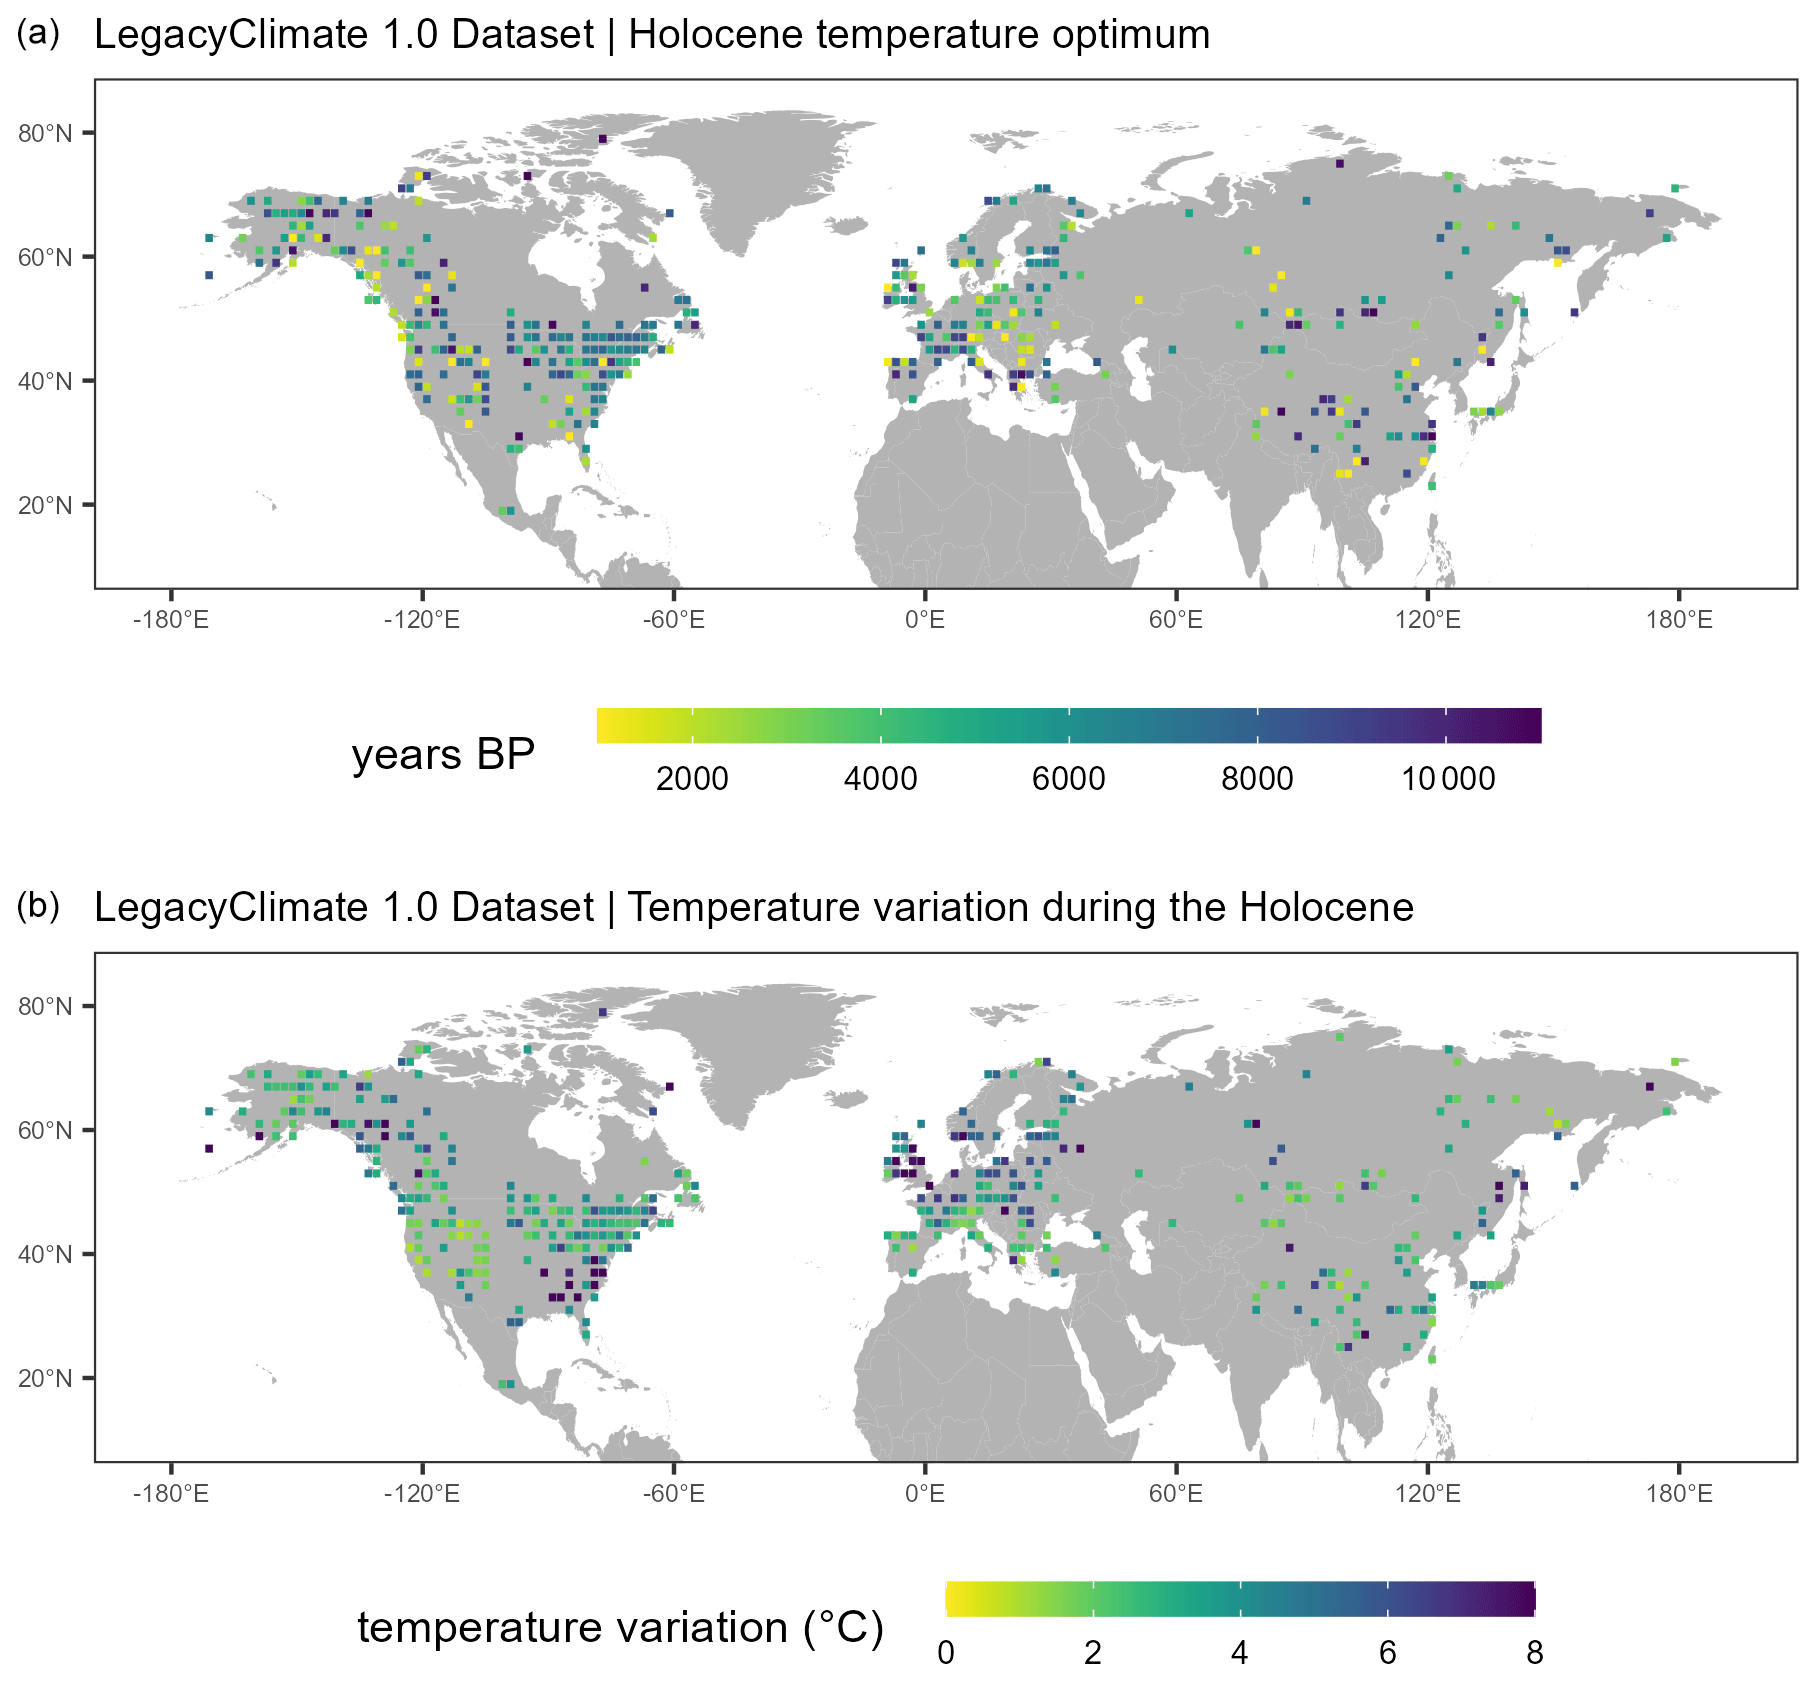
Figure 5Maps indicating the timing of the Tann maximum (a) and the range of Tann variation during the Holocene (11–1 ka, b). Each 2∘ × 2∘ grid cell contains the averaged values of all records located within one grid cell. For each grid cell, the Tann variation was determined as the range between minimum and maximum Tann anomalies. The Tann Holocene temperature maximum is the timing of the anomaly maximum. Color codes for values outside the range were restricted to range maxima.
The averaged Northern Hemisphere north of 30∘ N time series of all records that cover the entire Holocene (Fig. 3) indicate that mean TJuly was lowest at the beginning of the Holocene (−0.7 ± 0.2 ∘C compared to present), increased until 7 ka (+0.5 ± 0.1 ∘C compared to present), and slightly decreased afterwards to reach modern temperatures. Tann was also lowest at the beginning of the Holocene (−1.4 ± 0.2 ∘C compared to present) and reached its maximum of 0.3 ± 0.2 ∘C compared to present at 6.5 ka.
Finally, our revised global temperature curve includes all of our records and those of the Temp12k dataset (Kaufman et al., 2020b) that cover the entire Holocene (Fig. 6; in total, excluding duplicate pollen records, 1098 records). It shows that mean Tann was lowest during the Early Holocene at 10.5 ka with a −0.3 ± 0.3 ∘C anomaly relative to 1 ka and warmest at 6.6 ka with a warming of 0.3 ± 0.3 ∘C. For the Northern Hemisphere extratropics (30–80∘ N), we find that mean Tann was lowest during the Early Holocene at 10.5 ka with a −0.3 ± 0.1 ∘C anomaly relative to 1 ka and warmest at 6.4 ka with a warming of 0.08 ± 0.04 ∘C.
The linear trends of all zonal means are significantly different (p < 0.01) for both TJuly (Table A2) and Tann (Table A3). While the uncertainty range is small in the midlatitudes, they are larger for the 30–40∘ N zonal band (TJuly) and especially for the polar region (TJuly and Tann; Fig. A3). The linear trends for TJuly for all continental means are significantly different despite overlapping uncertainty ranges for several zonal bands, e.g., 40–50 and 50–60∘ N in western North America (Fig. A4); 30–40 and 50–60∘ N in eastern North America (Fig. A5), 30–40 and 40–50∘ N, as well as 50–60 and 60–70∘ N, in Asia (Fig. A7). Large uncertainty ranges can be found in the 30–40∘ N zonal band (Europe, Fig. A6) and the polar region (western North America, Fig. A4; Asia, Fig. A7). The linear trends for Tann reveal similarities between the weighted means of Europe and Asia (Europe vs. Asia: p=0.08; Asia vs. Europe: p=0.9; Table A5). For overlapping uncertainty ranges, similar patterns compared to those of TJuly can be found, except for in eastern North America, where the zonal means of 30–40 and 50–60∘ N are very different to each other, especially in the Early and Middle Holocene (Fig. A5). Similar to TJuly, the largest uncertainty ranges can be found either in the 30–40∘ N or the 70–80∘ N zonal bands. For the weighted continental means the uncertainty ranges of western and eastern North America show a strong overlap, i.e., the TJuly mean of eastern North America mirrors the weighted Northern Hemisphere TJuly mean. TJuly in Asia is lower overall, while in Europe it is higher overall than the Northern Hemispheric mean, but the uncertainty range of both continental means are larger than those in North America (both western and eastern parts) and the Northern Hemisphere. For Tann the uncertainty ranges in all continents show a stronger overlap than for TJuly, with pronounced differences between the western and the eastern parts of North America (Fig. A8).
3.2 Spatiotemporal pattern of precipitation reconstructions
Holocene mean Pann variations (as a percentage of modern value) averaged across the Northern Hemisphere extratropics have patterns that are mostly similar to Tann, with Pann being lowest during the Early Holocene (−11.6 ± 2.8 % at 11 ka compared to 1 ka) and increasing until 5.9 ka before becoming relatively stable (Fig. 3).
In contrast to the averaged Northern Hemisphere pattern, the (sub-)continental precipitation patterns differ from their respective temperature patterns. The mean precipitation time series of western North America and Europe increases from the Early Holocene to the Late Holocene, averaged eastern North America precipitation increased until 6.5 ka and varies slightly around modern values from then, and Asia shows a pronounced maximum between 7 and 5 ka.
Time series maps of latitudinal means and differences (Fig. 4) reveal strong spatial patterns, particularly for Asia. The latitudinal mean time series in Asia show a strong increase toward the Middle Holocene of mostly > 10 %. After ca. 7 ka, certain differences exist: while the 70∘ N mean shows no clear further trend, the other mean curves show a precipitation maximum that is at least 5 % above the Late Holocene minimum. Precipitation maxima (compared with the Late Holocene) are more pronounced and occur later at lower latitudes. Furthermore, the 6–1 ka difference maps reveal that the Middle Holocene moisture maximum in subtropical Asia was most pronounced in eastern central China, with many records even showing > = 50 % higher values at 6 ka compared to 1 ka (Fig. 4).
The Holocene precipitation increase in the other (sub-)continents is particularly strong in the 30–40∘ N bands in subtropical Europe and midlatitude North America with a > 13 % and > 20 % precipitation increase, respectively. In Europe and western and eastern North America the records from 70–80∘ N show an Early Holocene precipitation maximum (particularly pronounced in Alaska), which is in contrast to the trends in almost all other latitudinal bands.
Comparing the linear trends for all zonal means reveals significant differences in all zonal bands for Europe and eastern North America (p<0.01). Similarities in the trends can be found in western North America (70–80∘ N vs. 30–40∘ N: p=0.06) and especially in Asia, where several combinations of zonal trends are not significantly different (i.e., 30–40∘ N vs. 40–50∘ N (p=0.08) and 30–40∘ N vs. 70–80∘ N, p=0.76). For details; see Table A4. All trends in the continental precipitation means are found to be different (p< 0.01; Table A5). The uncertainty ranges for all latitudinal means are small, except for the 70–80∘ N zonal band in the polar region (%Pann; Fig. A3). In western North America the zonal means of 50–60 and 60–70∘ N show a strong overlap in their uncertainty ranges and the largest uncertainty range can be found in the polar region (Fig. A4). In Europe and Asia, the midlatitudes show the smallest uncertainty ranges, while the southernmost and northernmost zonal bands have higher uncertainty ranges (Figs. A6 and A7). Notable is the 40–50∘ N zonal band in Asia, which shows the highest uncertainty range of all continental zonal bands, especially in the Middle Holocene (Fig. A7). Compared to the Northern Hemispheric mean, the continental %Pann mean of eastern North America shows the smallest deviations, although the continental mean only comprises the zonal bands between 30 and 60∘ N. Precipitation changes in western North America are overall lower than the Northern Hemispheric mean, while the precipitation changes in Asia are overall higher (Fig. A8).
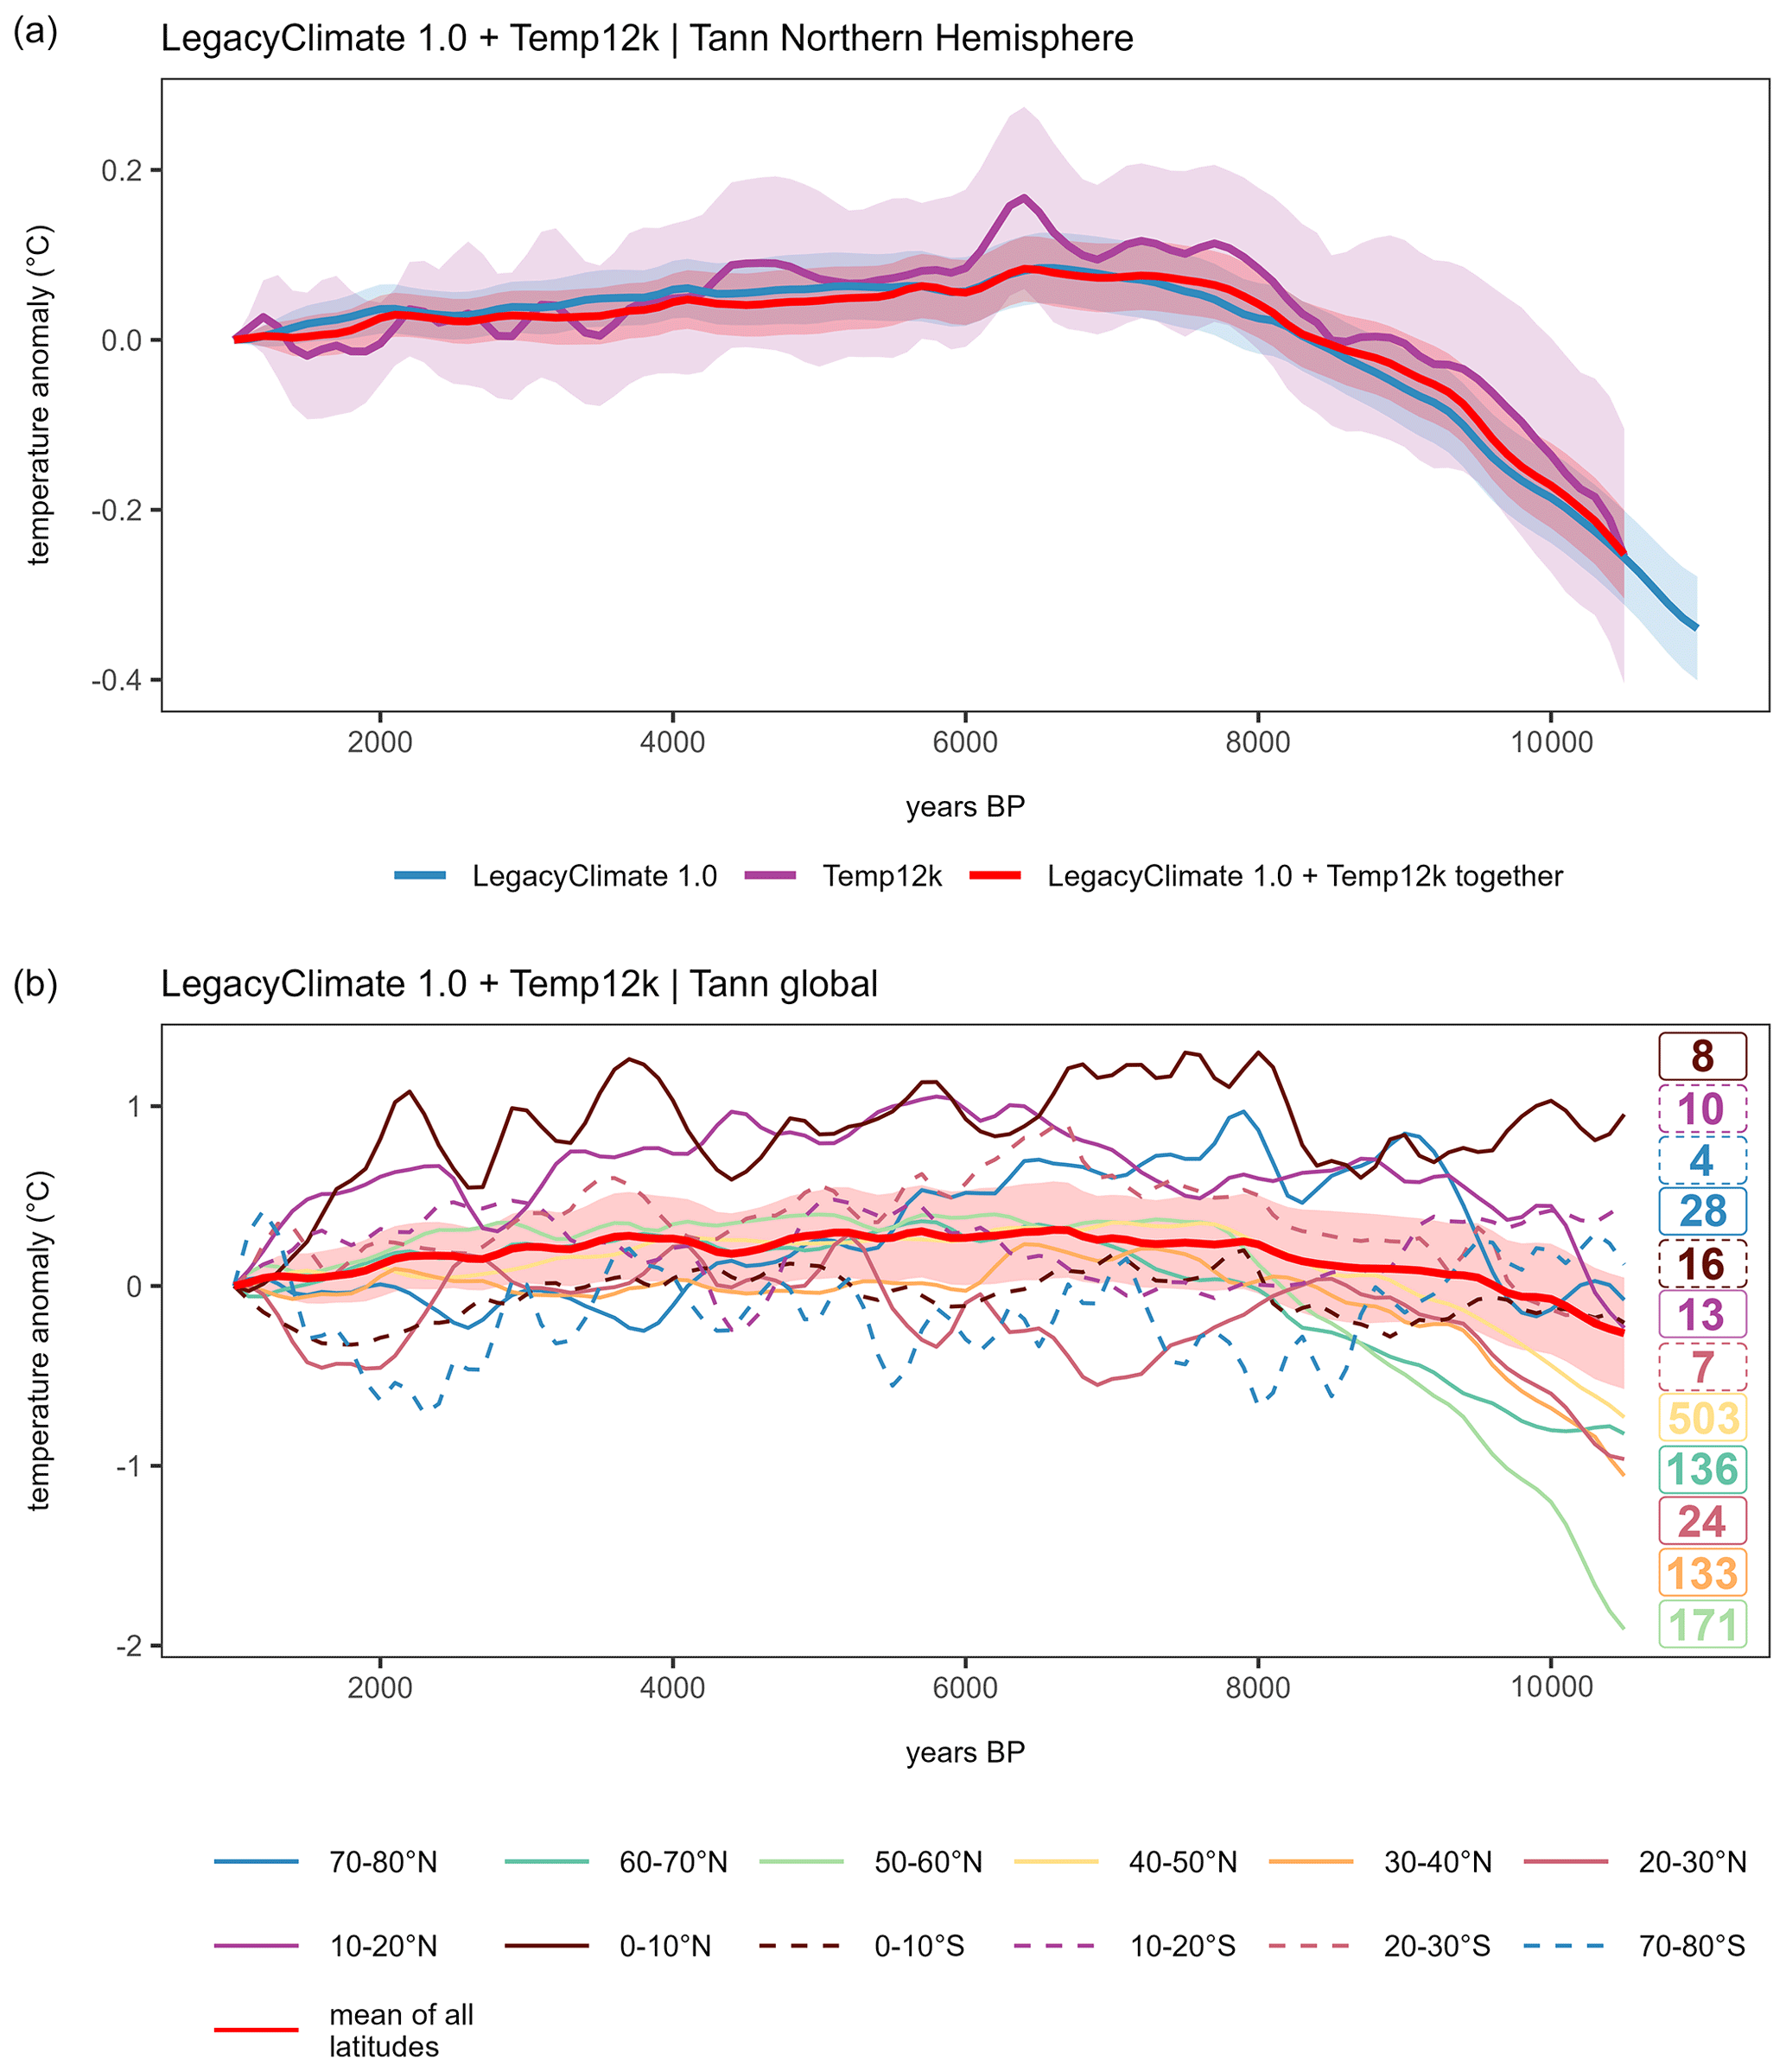
Figure 6Mean curves for temperature. (a) Northern Hemisphere weighted means with shaded weighted standard error (no curves for latitudes): LegacyClimate 1.0 (n=957; blue), Temp12k dataset (n=272; purple; see Sect. 2 for record filter), and LegacyClimate 1.0 + Temp12k mean (n=1098; red). (b) LegacyClimate 1.0 + Temp12k global mean with latitudinal means. Labels in corresponding colors indicate the number of grid boxes that contributed to each latitudinal curve.
4.1 Spatial temperature pattern (in light of the global Holocene temperature curve)
The general pattern of the LegacyClimate 1.0 mean annual temperature curve of the Northern Hemisphere extratropics agrees with those of previous investigations (Marcott et al., 2013; Kaufman et al., 2020b; Kaufman and Broadman, 2023), including a cold Early Holocene, a temperature maximum during the Early to Middle Holocene, and a slight cooling towards the present day (Figs. 2 and A8). Orbital forcings are assumed to have an important influence on the trends in the global mean temperatures, which led to feedback mechanisms like decreased polar sea ice or shifted vegetation ranges and thus to increased temperatures during the Middle Holocene (Kaufman and Broadman, 2023). Subsequently, changes in solar irradiance, an increasing albedo due to land cover changes, and increasing volcanic activity probably contributed to a global cooling during the Late Holocene (Kaufman and Broadman, 2023). Both our LegacyClimate 1.0 and the Temp12k mean temperature curves increase from the Early Holocene to the Middle Holocene by about 0.4 ∘C when the same stacking approach is applied (Fig. 6). However, the LegacyClimate 1.0 stack shows only a minimal temperature decline between the early Middle Holocene maximum and the Late Holocene minimum of ∼ 0.08 ∘C compared to ∼ 0.17 ∘C in the Temp12k stack. We suggest two probable reasons for this finding: (1) a more complete spatial and temporal representativeness of the dataset and (2) a unique methodology to reconstruct a small set of climate variables from pollen data.
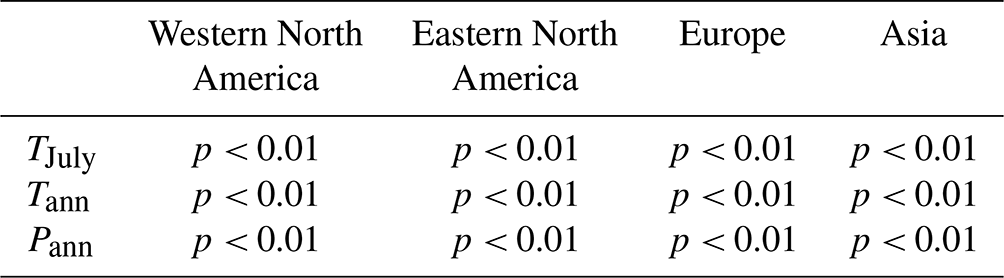
First, our mean annual temperature curve includes about 4 times as many records as the Temp12k dataset (957 records in the LegacyClimate 1.0 dataset vs. 272 records in the Temp12k dataset, Kaufman et al., 2020b; Fig. 1). In particular, Asia is represented by substantially more records in the combined dataset. Our temperature reconstruction from Asia shows an average trend that differs from the overall Northern Hemisphere trend as it has no pronounced Holocene temperature maximum (Fig. A8; Table A6). This is particularly true for Asian Tann records south of 50∘ N and TJuly records south of 60∘ N. This feature has not been recognized so far, likely because Asian temperature reconstructions are mostly lacking in previous compilations (e.g., Marcott et al., 2013; Marsicek et al., 2018; Routson et al., 2019; Kaufman et al., 2020b). Even if the Middle to Late Holocene cooling trend observed in Asia north of 60∘ N (Fig. 2) agrees with the proposed Neoglacial (sub-)Arctic-wide Holocene cooling, the amount of cooling of < 0.5 ∘C is low compared to the cooling observed in other regions (e.g., in Europe where an average cooling of ∼ 1.5 ∘C has been reconstructed; McKay et al., 2018; Fig. 2). As with the differences between eastern and western Eurasia, we find a difference between eastern and western North America. In particular, we can identify a circum-North Atlantic pattern with a strong Early Holocene increase, a pronounced Middle Holocene maximum and strong temperature range, and a circum-North Pacific pattern with an overall weak change. This is likely related to the impact of the decaying Laurentide ice sheet on the North Atlantic, which was probably a stronger driver of Early to Middle Holocene temperature change than insolation (Renssen et al., 2009, 2012; Zhang et al., 2016).
Even if this study shows a less pronounced Holocene temperature maximum, the problem remains that this does not align with the overall Holocene increase in the mean global (and Northern Hemisphere) temperature revealed by Earth system models. Our study points to a strong regionalization of Holocene temperature trends and range of variation in the Northern Hemisphere extratropics, which was also reported in recent studies (e.g., Kaufman et al., 2020b; Osman et al., 2021; Cartapanis et al., 2022). This somehow contradicts the Holocene conundrum concept, which tackled Holocene temperature change mainly by analyzing the global mean and understanding the differences between proxy-based and simulated reconstructions. However, the conundrum debate has since progressed, and recent studies hint at discrepancies in data–model comparisons due to spatiotemporal dynamics related to heterogeneous responses to climate forcing and feedbacks (e.g., the timing of a Holocene thermal maximum between reconstructions from continental and from marine proxy records; Cartapanis et al., 2022). Our finding is in line with recent modeling approaches, which also yield strong regional differences in temperature developments (Bader et al., 2020) allowing for a regional comparison. Recent paleo-data assimilation approaches based on marine temperature reconstructions reveal peculiarities of spatial averaging as one reason for the model–data mismatch (Osman et al., 2021). The error is most pronounced where the number of included records is small. This stresses the importance of good spatial coverage of the records used for the assessment of the mean temperature trend. Including terrestrial reconstructions is crucial. Compared with previous syntheses of terrestrial records, our compilation is notable for its higher record density in Asia, a region for which Earth system models show diverging past climate changes, highly sensitive to boundary conditions and forcing (Bakker et al., 2020; Brierley et al., 2020; Lohmann et al., 2021). Therefore, our reconstruction makes a decisive contribution to locating and clarifying the model–data mismatch in the Northern Hemisphere extratropics. From a proxy perspective, future targets of synthesis studies should focus on the Southern Hemisphere and poorly covered areas in central Asia and Siberia.
Second, standardized methodologies may have contributed to the observed differences between the LegacyClimate 1.0 mean Tann curve and the Temp12k curve. Our Tann reconstruction only includes records of mean annual temperature while the Temp12k product mixes reconstructions of seasonal temperature (mostly TJuly) if Tann is not available from a site. This assumption of equivalence between annual and summer temperature at any given site can impact the trend and amplitude of the stacks. A seasonal bias in the reconstructions may originate from a real, larger Holocene range of summer temperature variations (Bova et al., 2021) or is an artifact introduced by having a larger TJuly range covered by the calibration datasets compared with Tann which is, however, not the case in our calibration sets.
Our pollen-based reconstructions are all performed with WA-PLS, which is known to produce smaller climate amplitudes than MAT (a likewise commonly used method) because it is less sensitive to extreme climate values in the modern pollen dataset (Birks and Simpson 2013; Cao et al., 2017; Nolan et al., 2019). Furthermore, by using a standard area size for our modern pollen datasets, we may have stabilized the regional reconstructions, i.e., equalized the amplitude as the source areas represent rather similar biogeographical and climate ranges. Finally, our reconstructions include only records that cover the entire Holocene period (11–1 ka) and not just parts of it. Hence, all time slices have a similar spatial coverage, and the temporal pattern is not biased by regions where archives are only available in certain periods (e.g., the Late Holocene peatland establishment).
As with all applications of taxa-based transfer functions to fossil records, we assume that both modern and past taxa assemblages (in our case, vegetation) are in equilibrium with climate, the relationships inferred from modern data do not change throughout the Holocene (Birks et al., 2010; Chevalier et al., 2020), and the modern pollen assemblages are not heavily biased by human impact. Differences in global boundary conditions during the Early to Middle Holocene (e.g., lower atmospheric CO2 concentration, different seasonal insolation) however, may have modified these relationships, which could have also dampened the reconstructed amplitudes. Also, vegetation response to climate change may be involve lags (see the ongoing discussion about the so-called “forest conundrum”, i.e., the observation that observed forest maximum lags the simulated temperature maximum; Dallmeyer et al., 2022) and depends on the initial conditions such as the distribution of refugia during the Last Glacial Period (Herzschuh et al., 2016; Herzschuh, 2020). Furthermore, there are areas, especially the densely settled regions in Europe and southeastern Asia, that are affected by human activities throughout the Holocene due to intense animal husbandry, as inferred from the abundance of Plantaginaceae and Rumex as indicators of grazing (Herzschuh et al., 2023a), or due to industrialization since the second half of the 19th century. This probably led to extinction events, especially for disturbance-dependent taxa, and contributed to gaps within the potential bioclimatic space of taxa that form natural communities (Zanon et al., 2018). The absolute effect of these biases is hard to quantify (but see Cleator et al., 2020), and many comparative, multi-proxy Holocene studies have shown that pollen-based reconstructions are as reliable as any other proxy (Kaufmann et al., 2020a; Dugerdil et al., 2021). In contrast, one advantage of single proxy studies is that any biases will affect all the records similarly. As such, even if the actual amplitude of our regional and global stacks might be dampened, the trends and spatial patterns shared by the data are likely to remain correct.
4.2 Spatiotemporal precipitation pattern
Our analyses of the Holocene spatiotemporal precipitation pattern fill a research gap, as syntheses of proxy-based precipitation change on a hemispheric scale during the Holocene are still lacking. Regional syntheses are available for Europe (Mauri et al., 2014, 2015), North America (Ladd et al., 2015; Routson et al., 2021), and eastern Asia (Herzschuh et al., 2019). Interestingly, we observed a similar pattern for Northern Hemisphere-wide averaged Holocene trends of Pann and Tann but differences among corresponding Pann and Tann curves at (sub-)continental and latitudinal scales, e.g., in Asia, where the Pann means are overall higher than the Northern Hemispheric means, while the Tann means are overall lower since ∼ 9 ka (Fig. A8), or for the 30–40∘ N zonal band, where Tann shows an Early to Middle Holocene warming, while no trend in the Pann means could be found for this time period (Fig. A3).
This regional heterogeneity with respect to the precipitation trend (i.e., significantly different trends for the Northern Hemisphere, except for some regions in Asia; see Table A4, Fig. A8) is also seen in recent Earth system model simulations for the last 8000 years (Mauri et al., 2014; Dallmeyer et al., 2021). Although the simulated pattern does not exactly match our reconstructions, they share many similar structures, such as high precipitation in the Early and Middle Holocene in East Asia (Fig. 4). For this region, our reconstruction shows the strongest Middle to Late Holocene precipitation decline worldwide, reflecting the weakening of the East Asian summer monsoon (EASM) in response to the decrease in summer insolation. This trend in moisture has been confirmed by earlier qualitative and quantitative proxy syntheses and modeling studies (Wang et al., 2010; Zheng et al., 2013; Liu et al., 2014a; Herzschuh et al., 2019).
In contrast, many central Asian sites show low Early Holocene precipitation levels (Fig. 4). This anti-phase relationship in EASM to central Asian moisture change is in line with earlier studies (Jin et al., 2012; Chen et al., 2019; Herzschuh et al., 2019; Zhang et al., 2021). The causal mechanisms are still debated. Among other reasons, precipitation–evaporation effects (Herzschuh et al., 2004; Zhang et al., 2011; Kubota et al., 2015), transcending air mass related to the Rodwell–Hoskins response to monsoonal heating (Herzschuh et al., 2004; Wang et al., 2017), effects from winter precipitation (Li et al., 2020), and translocation of the westerly jet stream (Herzschuh et al., 2019) may contribute to the anti-phased precipitation change.
Arctic warming mechanistically should be linked with wetting in the Arctic due to high hydrological sensitivities (Trenberth, 2011). Such a pattern is, for example, obvious for Early to Middle Holocene climate change in most records from Alaska. Interestingly, several records from the northern Arctic coastal region in Russia, northern Norway, and Canada show a wet Early Holocene, which is also observed in simulations (Dallmeyer et al., 2021).
Contrasting the trend in the East Asian monsoon region (Figs. 2 and A7), annual precipitation increases in midlatitude Europe during the Holocene according to our reconstructions (Figs. 2 and A6). Routson et al. (2019) propose a circum-hemispheric midlatitudinal rise in moisture levels over the Holocene based on a semi-quantitative dataset that is strongly concentrated around the circum-Atlantic region. They relate the decreased net precipitation to the weakened Early Holocene latitudinal temperature gradient. Due to polar amplification, the Arctic regions experienced a stronger warming in the climate compared to the equatorial region, which is also supported by our dataset. However, we also see in our reconstructions that this view is too general, but it may explain the precipitation response in Europe as the weakening of the latitudinal temperature gradient is particularly pronounced in Europe in our reconstructions. This change in temperature pattern is probably a result of a dampening in the cyclonic activity along the weaker westerly jet (Chang et al., 2002; Routson et al., 2019; Xu et al., 2020), bearing less precipitation during the Early Holocene compared to modern conditions. With the strengthening of the latitudinal temperature gradient towards the Late Holocene, cyclonic activity enhances, leading to an increase in precipitation over the Holocene.
According to our reconstructions, the precipitation trend in eastern and western North America strongly differs (p< 0.01; Table A5; Fig. A3). While in the eastern part the mean precipitation level is relatively stable in all latitudinal bands except the 50–60∘ N zonal band over the Holocene (Fig. A5), precipitation strongly increases on average in the western part (Fig. A4), driven by a precipitation rise in the midlatitudes (40–70∘ N). In the polar regions and south of 40∘ N, precipitation declines from the Middle Holocene (Figs. 4 and A4). The latter may be related to a decrease in the North American monsoon intensity, in line with the orbital monsoon hypothesis (Kutzbach, 1981; Harrison et al., 2003). In the polar region, modeling studies report northward-shifted storm tracks coinciding with a northward-replaced upper-tropospheric jet stream in the Middle Holocene compared to the Late Holocene, promoting precipitation in the Arctic region and decreasing precipitation at midlatitudes (Zhou et al., 2020; Dallmeyer et al., 2021). With the southward shift of the polar jet during the Holocene, precipitation decreased in the high northern latitudes in North America and increased further south (Liu et al., 2014b).
The rise in moisture levels across the North American continental interior over the course of the Holocene has been proposed before (Grimm et al., 2001; Zhou et al., 2020; Dallmeyer et al., 2021) but has not yet been quantified with continental-wide proxy data. The main drivers of this trend are still being debated: besides shifts in the westerly wind circulation (Seager et al., 2014), weakening subsidence caused by teleconnection with the weakening Northern Hemispheric monsoon systems (Harrison et al., 2003; Dallmeyer et al., 2021), reorganization of the atmospheric circulation around the Bermuda high (Grimm et al., 2001), and changes in the sea surface temperature pattern (Shin et al., 2006) may contribute to an increase in precipitation over the Holocene.
Reconstructing temperature and precipitation from a single dataset implies that they are both important in defining the presence and/or abundance of specific pollen taxa (Salonen et al., 2019). This hypothesis cannot be tested but to some extent has been assessed by several analyses (Juggins, 2013). The WA-PLS reconstruction was also applied with tailored modern calibration sets (i.e., selecting samples so that the correlation between temperature and precipitation in the calibration dataset is reduced). The finding that the reconstructions were generally very similar between those using the full datasets and those using the tailored modern datasets can be taken as an indication that co-variation is not a major issue in these reconstructions (Herzschuh et al., 2023a). This conclusion is also supported by the fact that Tann and Pann records that pass the reconstruction significance test when the impact of the other variable is partialed out (Telford and Birks, 2011) are almost evenly distributed over the Northern Hemisphere records (Herzschuh et al., 2023a). This is also confirmed by the visual inspection of the regional reconstructions in Fig. 3, where we cannot detect correlations between variables within latitudinal zones, as would be expected from dependent reconstructions. This suggests that our reconstructions do reflect distinctive trends from the pollen data.
We investigated Holocene time series of TJuly, Tann, and Pann for the Northern Hemisphere extratropics making use of 2593 pollen-based reconstructions (LegacyClimate 1.0). Compared with previous datasets, we include many more records, particularly from Asia. We present mean curves obtained with the same method for the Northern Hemisphere, the (sub-)continents (Asia, Europe, eastern North America, western North America), and regional zones (i.e., 10∘ latitudinal bands for (sub-)continents), as well as Northern Hemisphere gridded data for selected time slices.
Our results indicate that Holocene climate change shows unique regional patterns. The concept of a Middle Holocene temperature maximum only applies mainly to the middle and high northern latitudes in the circum-North Atlantic region, while records from midlatitude Asia, western North America, and all subtropical areas do not fit into this concept but mostly show an overall Holocene increase or other patterns. As such, the Holocene conundrum, originally proposed as a global feature, may instead apply to a restricted region.
The precipitation trend is roughly similar to the temperature trend at the hemispheric scale, in particular with respect to the strong increase from the Early to Middle Holocene. At the regional scale, the precipitation trends differ from each other and also from the regional temperature trends. The 40–50∘ latitudinal band in Asia shows the most pronounced Middle Holocene precipitation maxima, while many regions show increasing Holocene trends including most of Europe and western North America. We relate these differences to regionally specific circulation mechanisms and their specific relationships with temperature changes.
Given a background of strong regional heterogeneity, the calculation of global or hemispheric means might generally lead to misleading concepts, but the focus should be on understanding the spatiotemporal patterns requiring spatially dense proxy datasets for comparison with simulations.
Table A1Range of values in the difference maps (Fig. 4) and the proportion of values that fall within a restricted range of −3 to +3 ∘C for temperature and −50 % to 50 % for precipitation change.
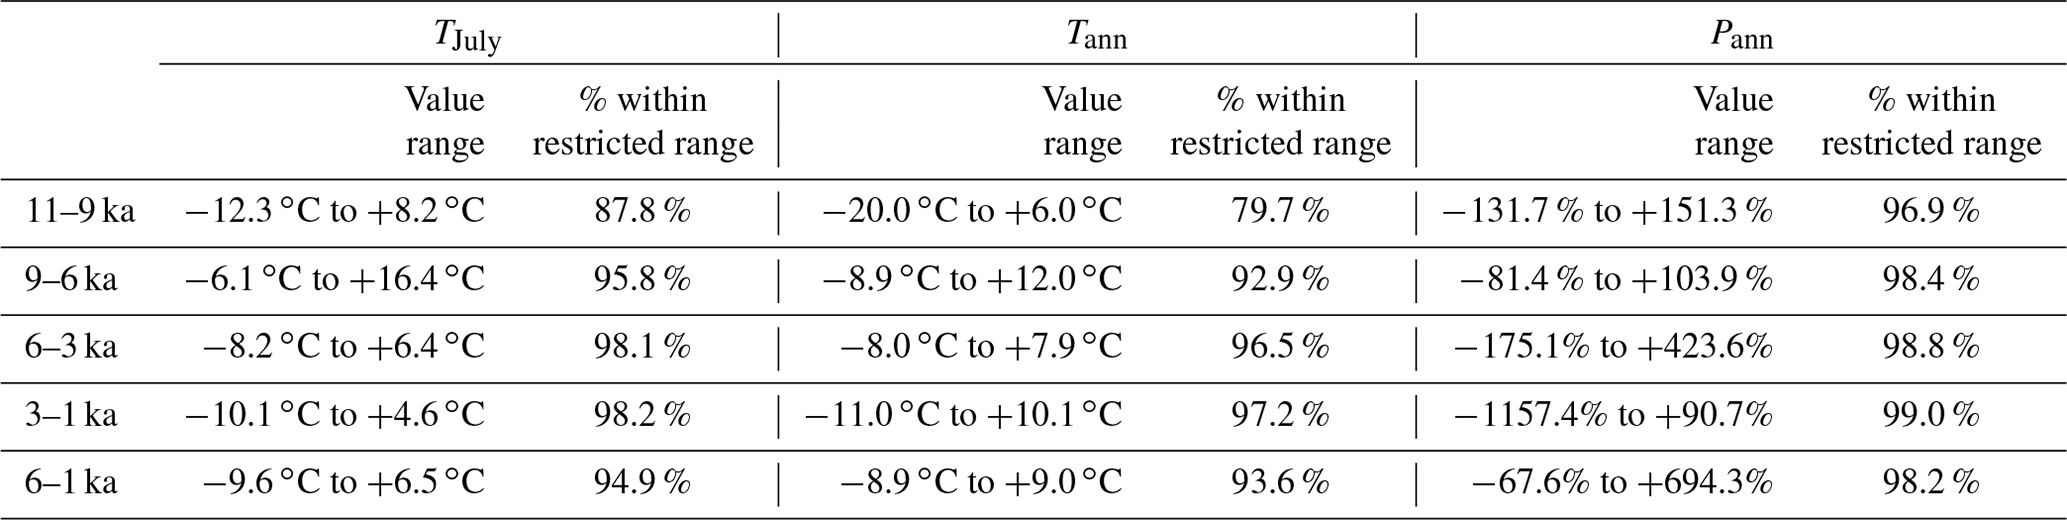
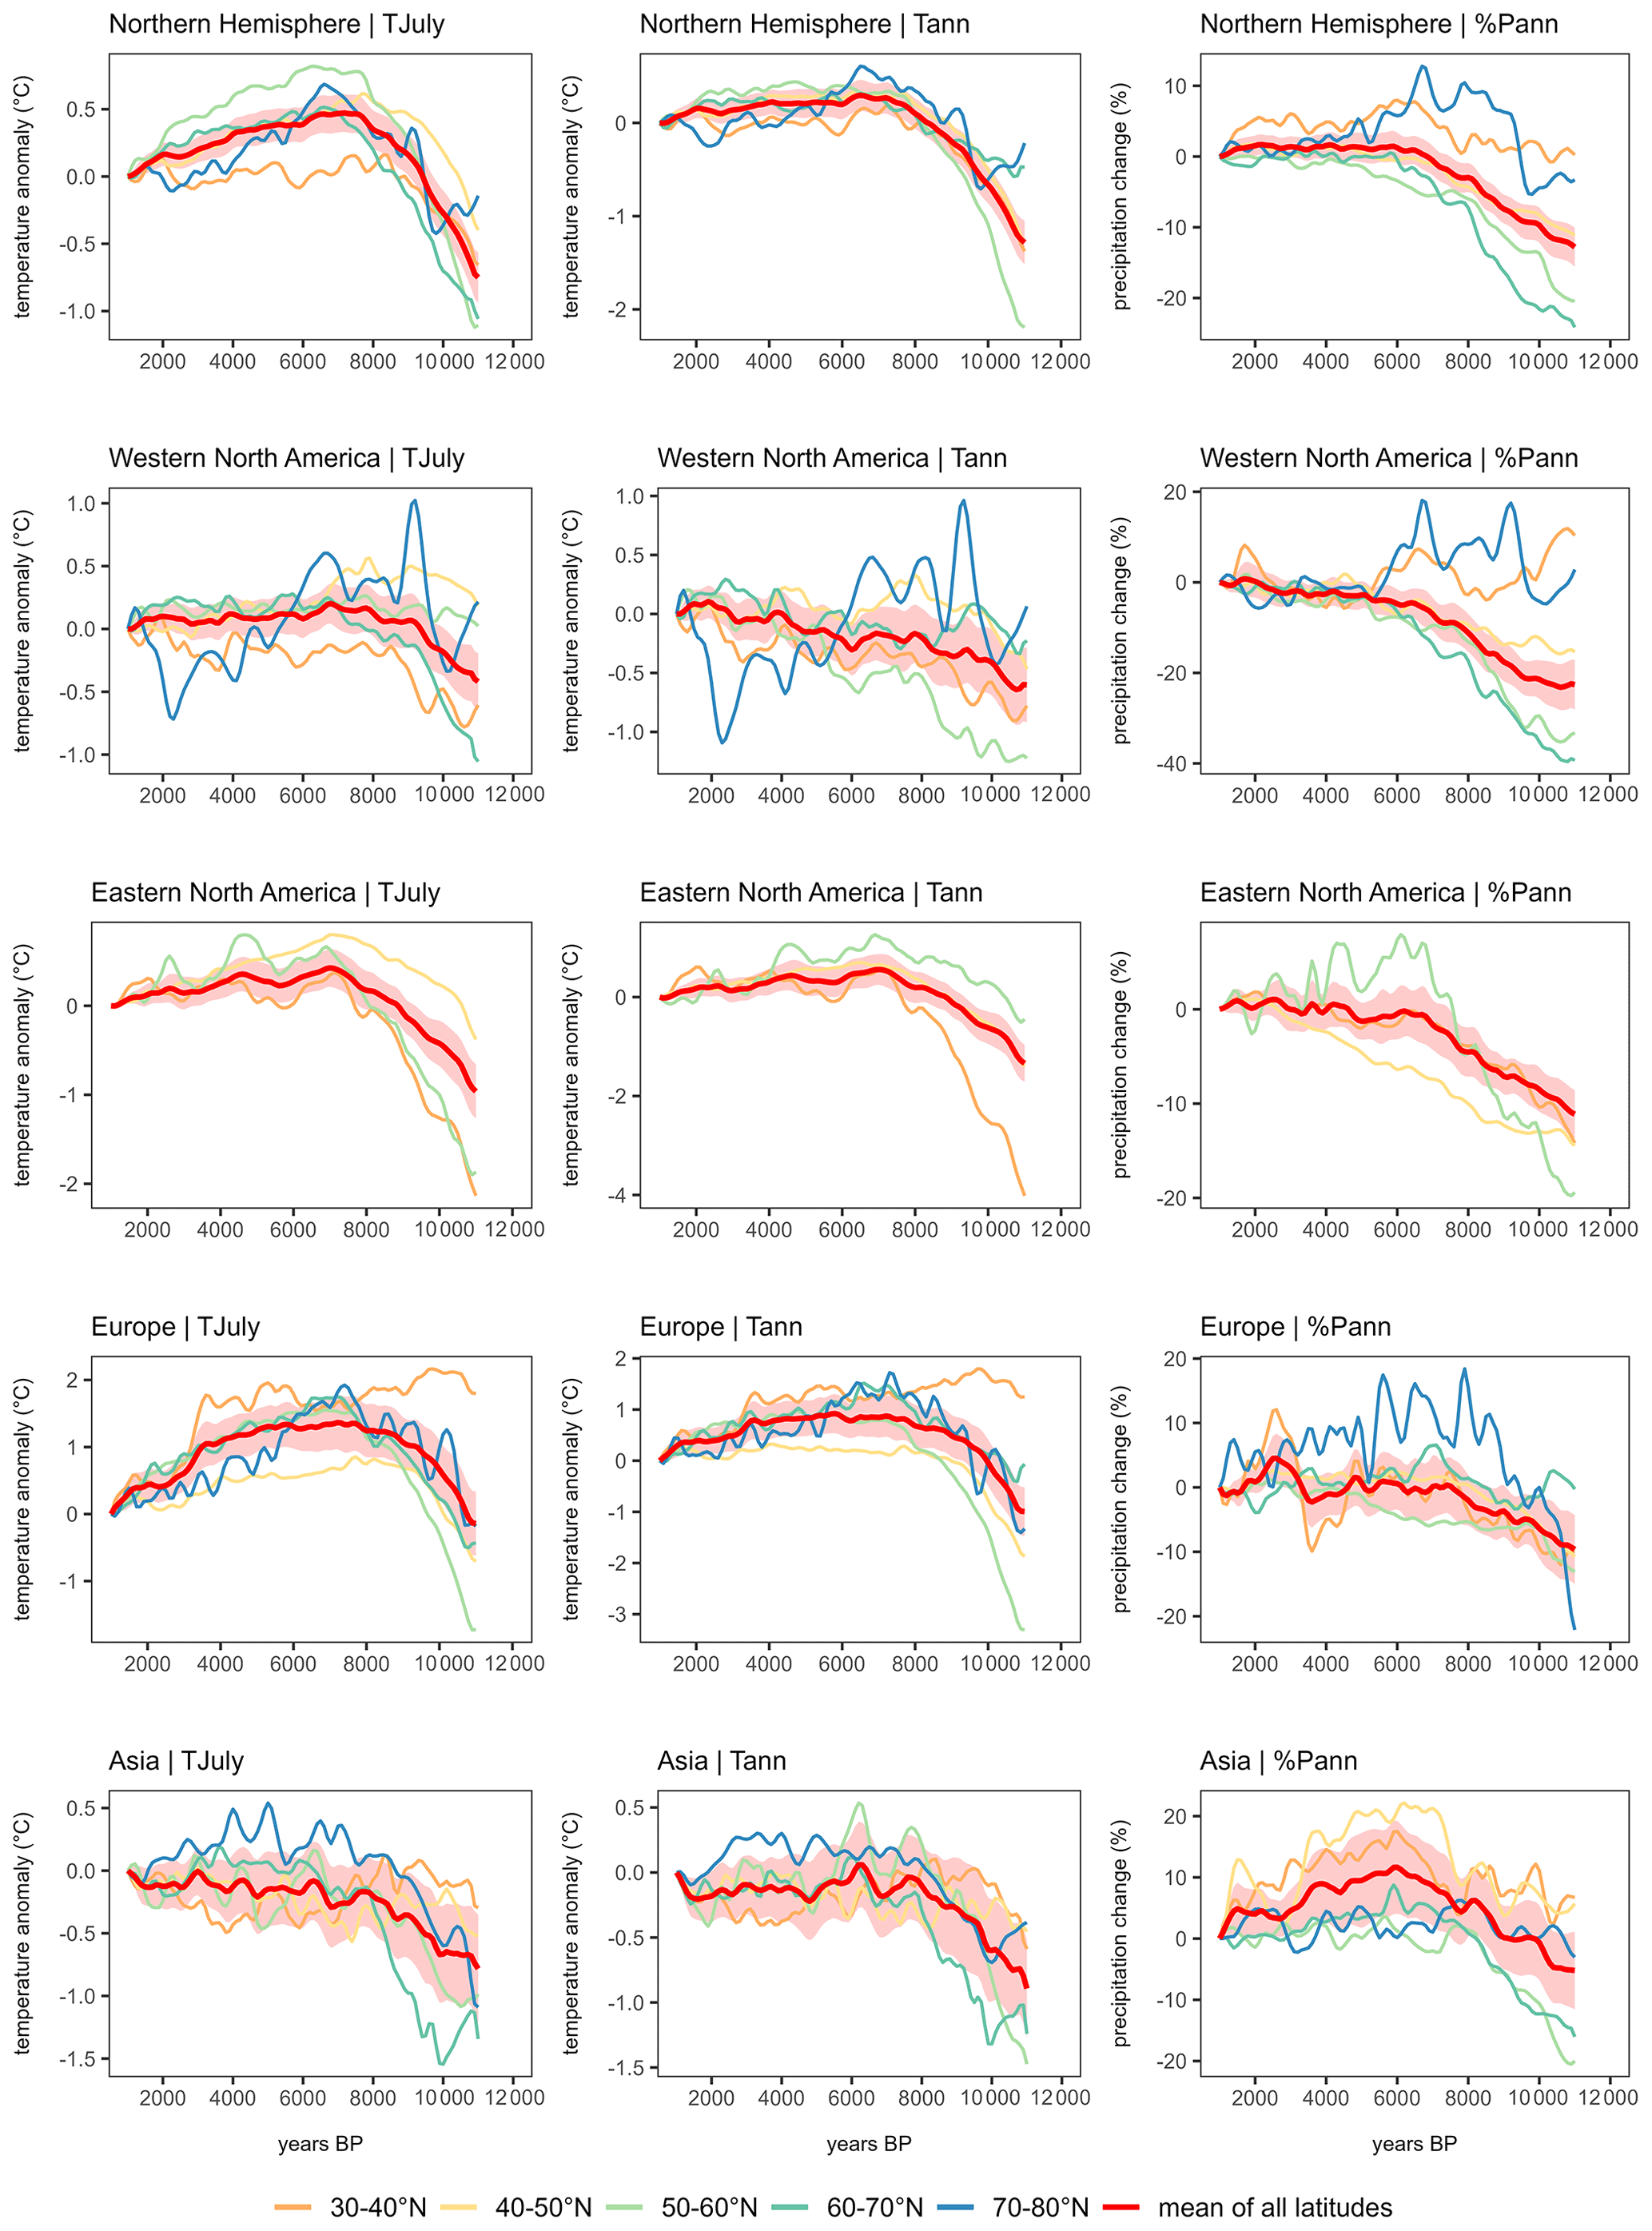
Figure A1Hemispheric, continental, and latitudinal mean curves for TJuly, Tann, and Pann derived from pollen-based reconstruction with WA-PLS_ tailored data. Latitudinal bands that contain fewer than three grid cells are not shown. The shading corresponds to the latitude-weighted standard error of the latitude-weighted mean.
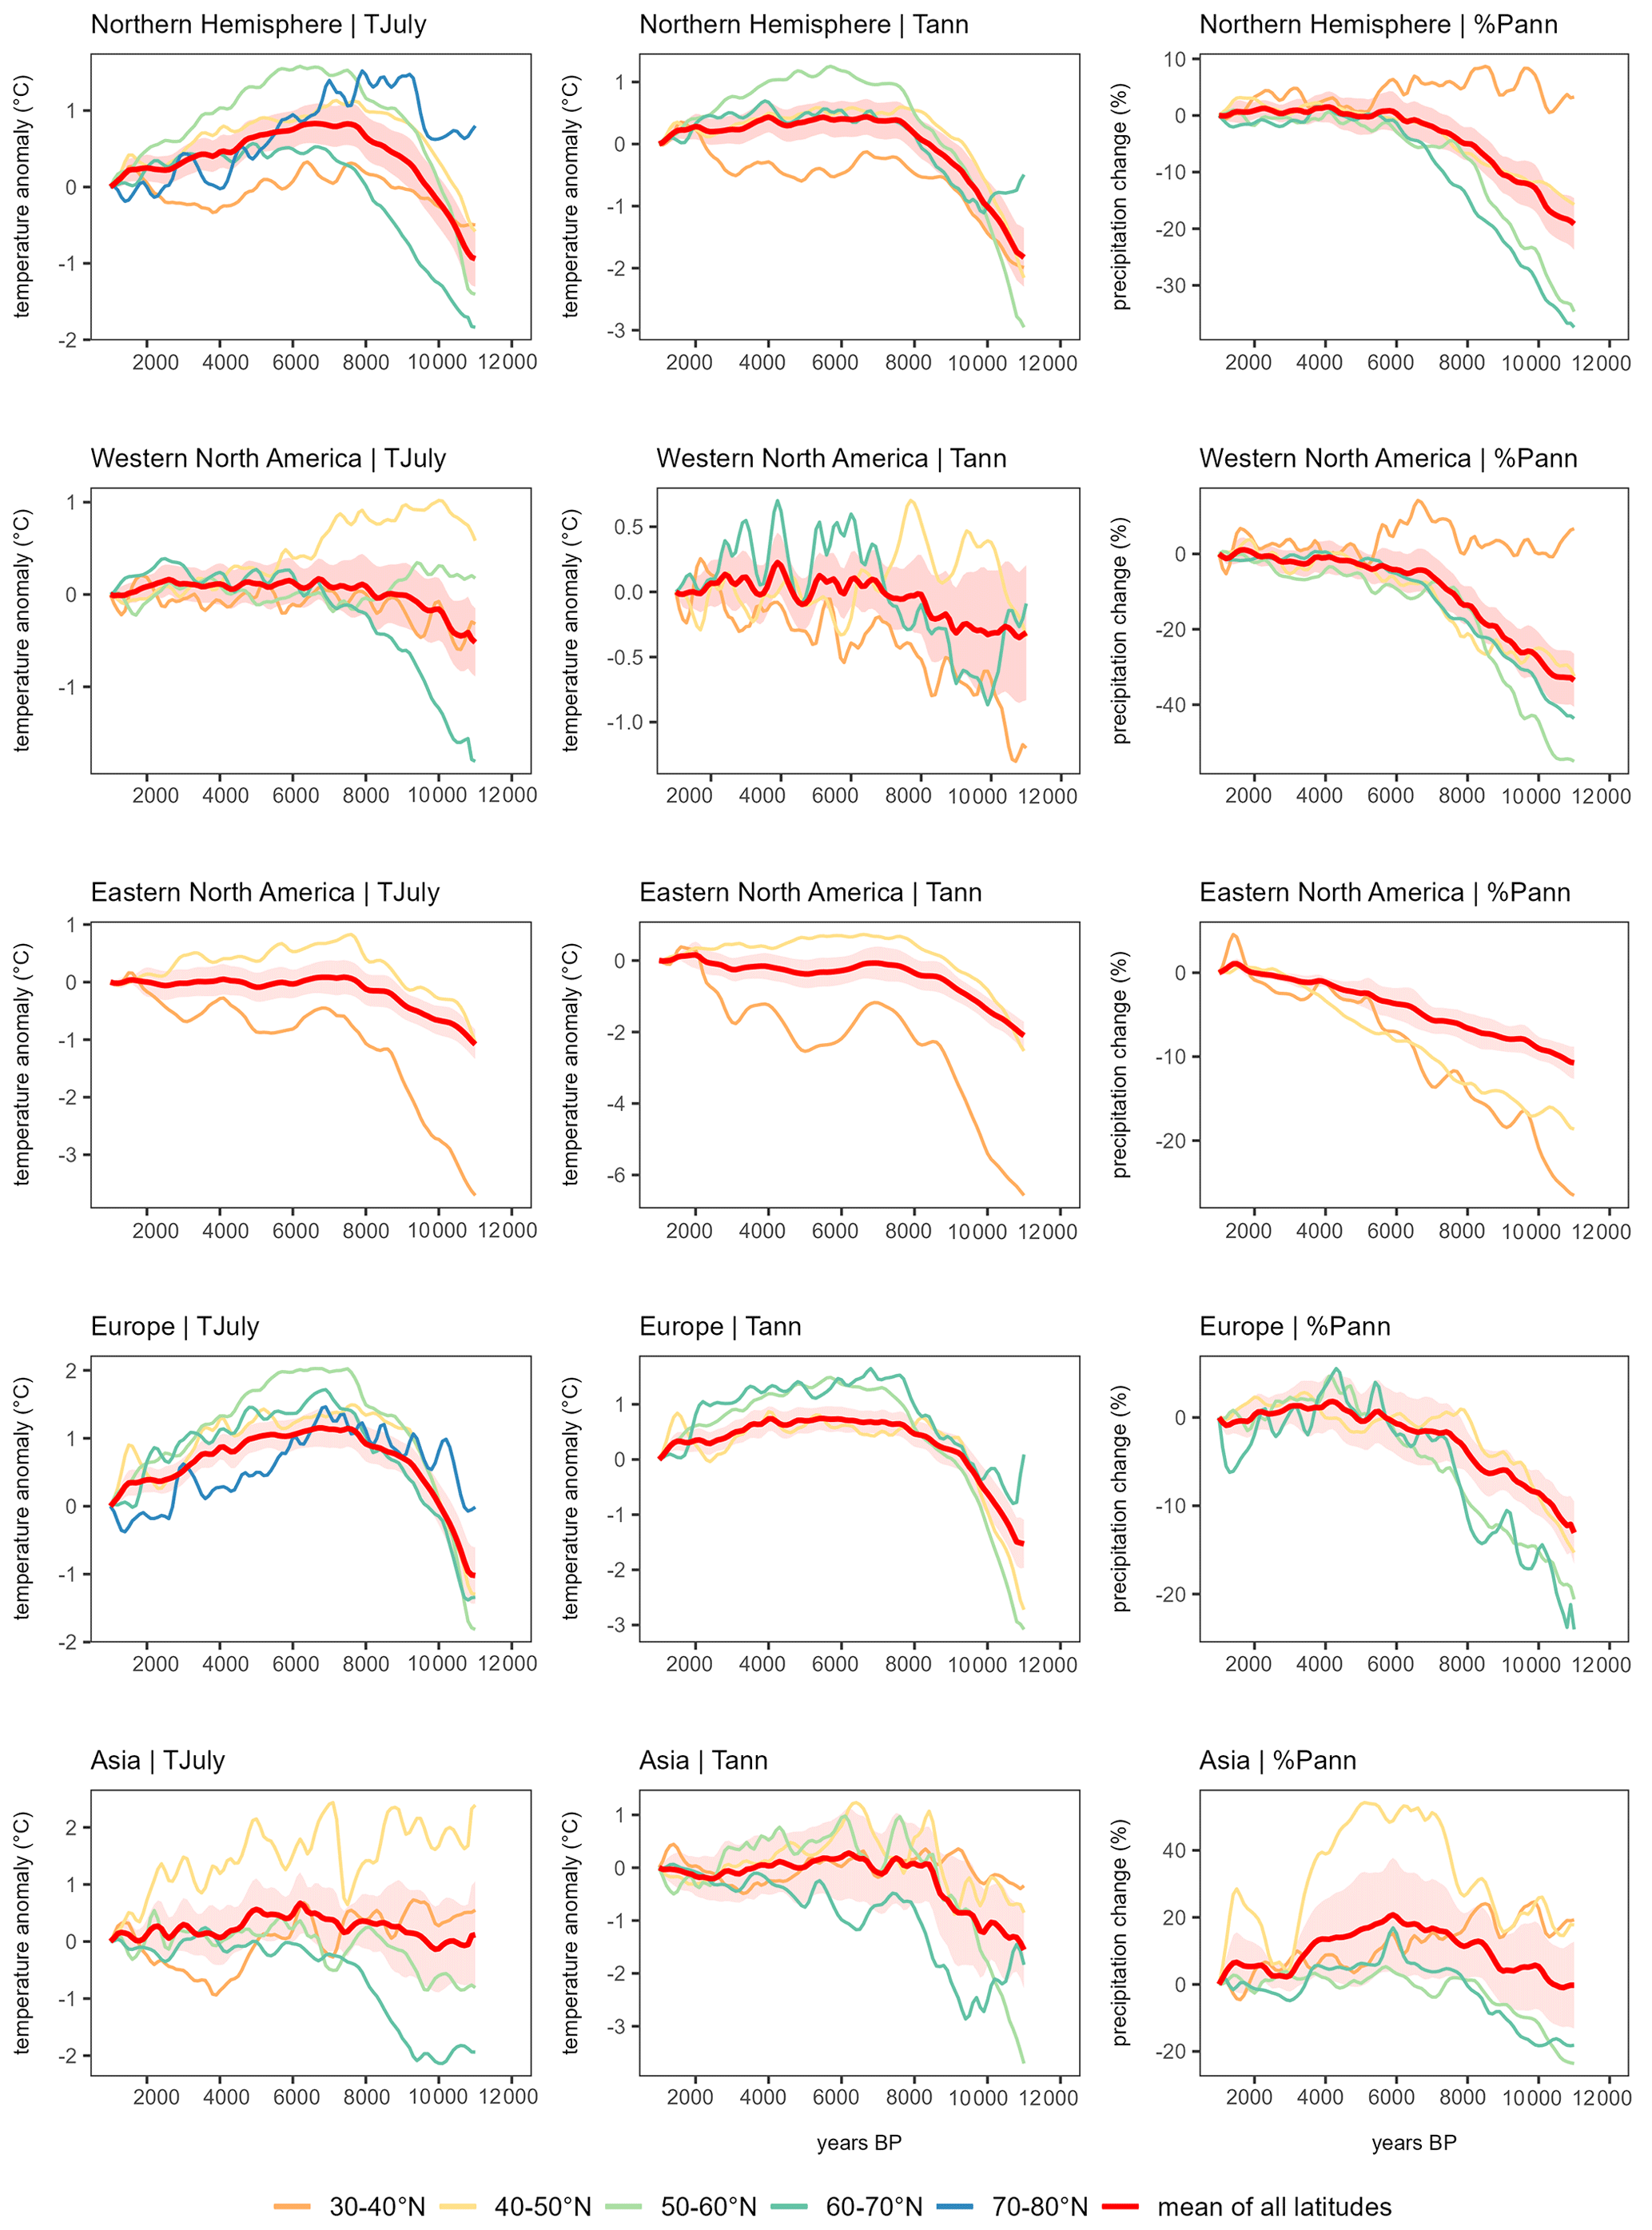
Figure A2Hemispheric, continental, and latitudinal mean curves for TJuly, Tann, and Pann derived from pollen-based reconstruction with WA-PLS_ tailored data with significant records (p< 0.2). Latitudinal bands that contain fewer than three grid cells are not shown. The shading corresponds to the latitude-weighted standard error of the latitude-weighted mean.
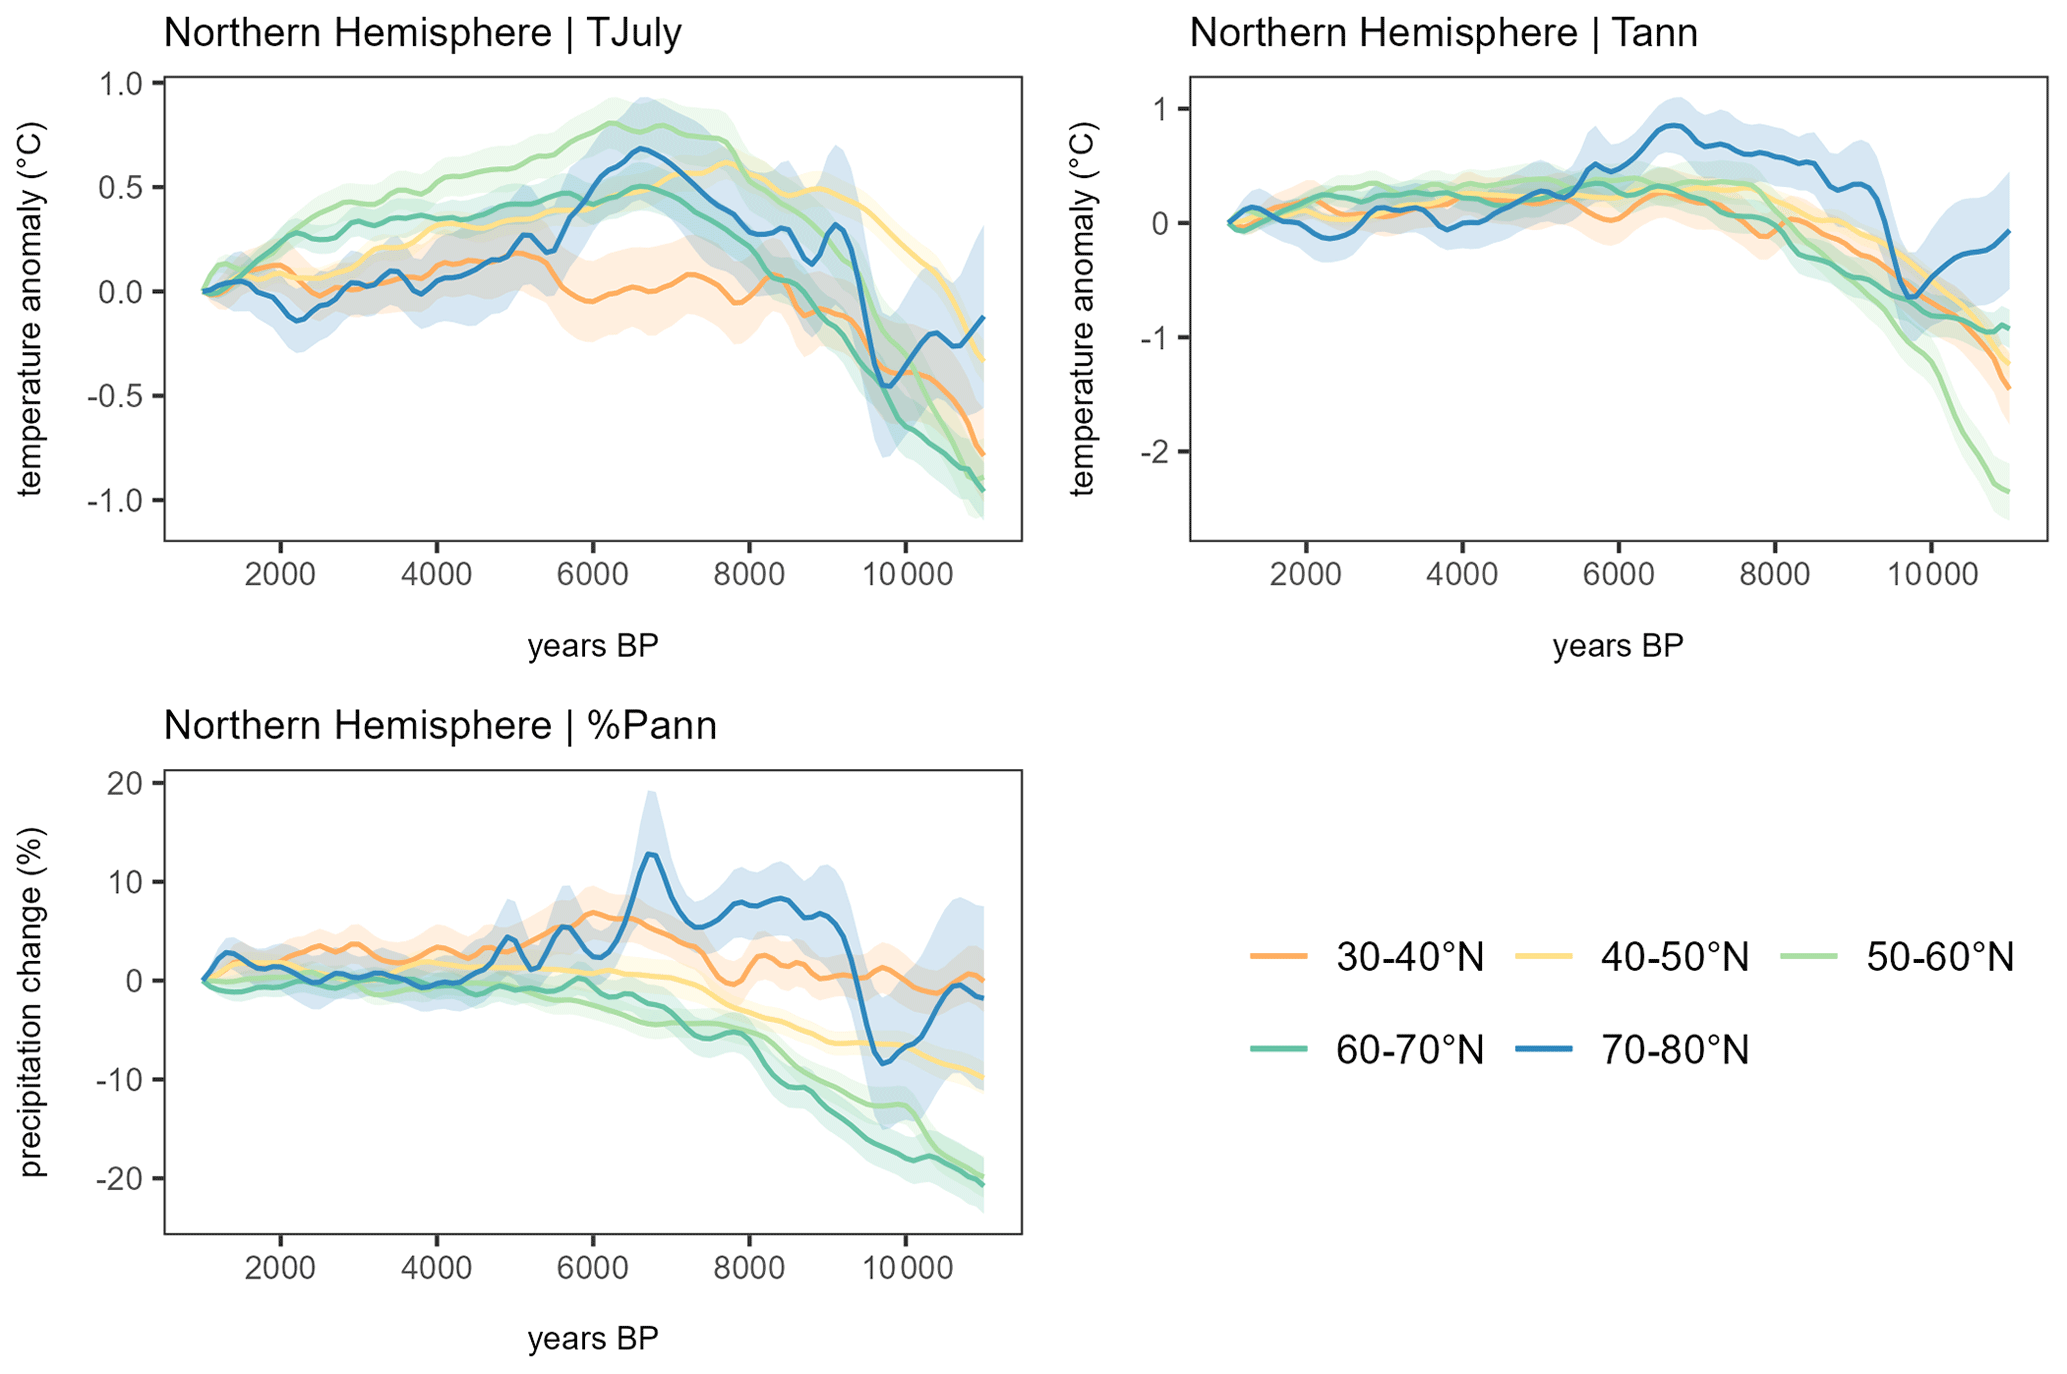
Figure A3Northern Hemispheric latitudinal mean curves with shaded standard errors for TJuly, Tann, and %Pann derived from pollen-based reconstruction with WA-PLS data (latitudinal bands that contain fewer than three grid cells are not shown).
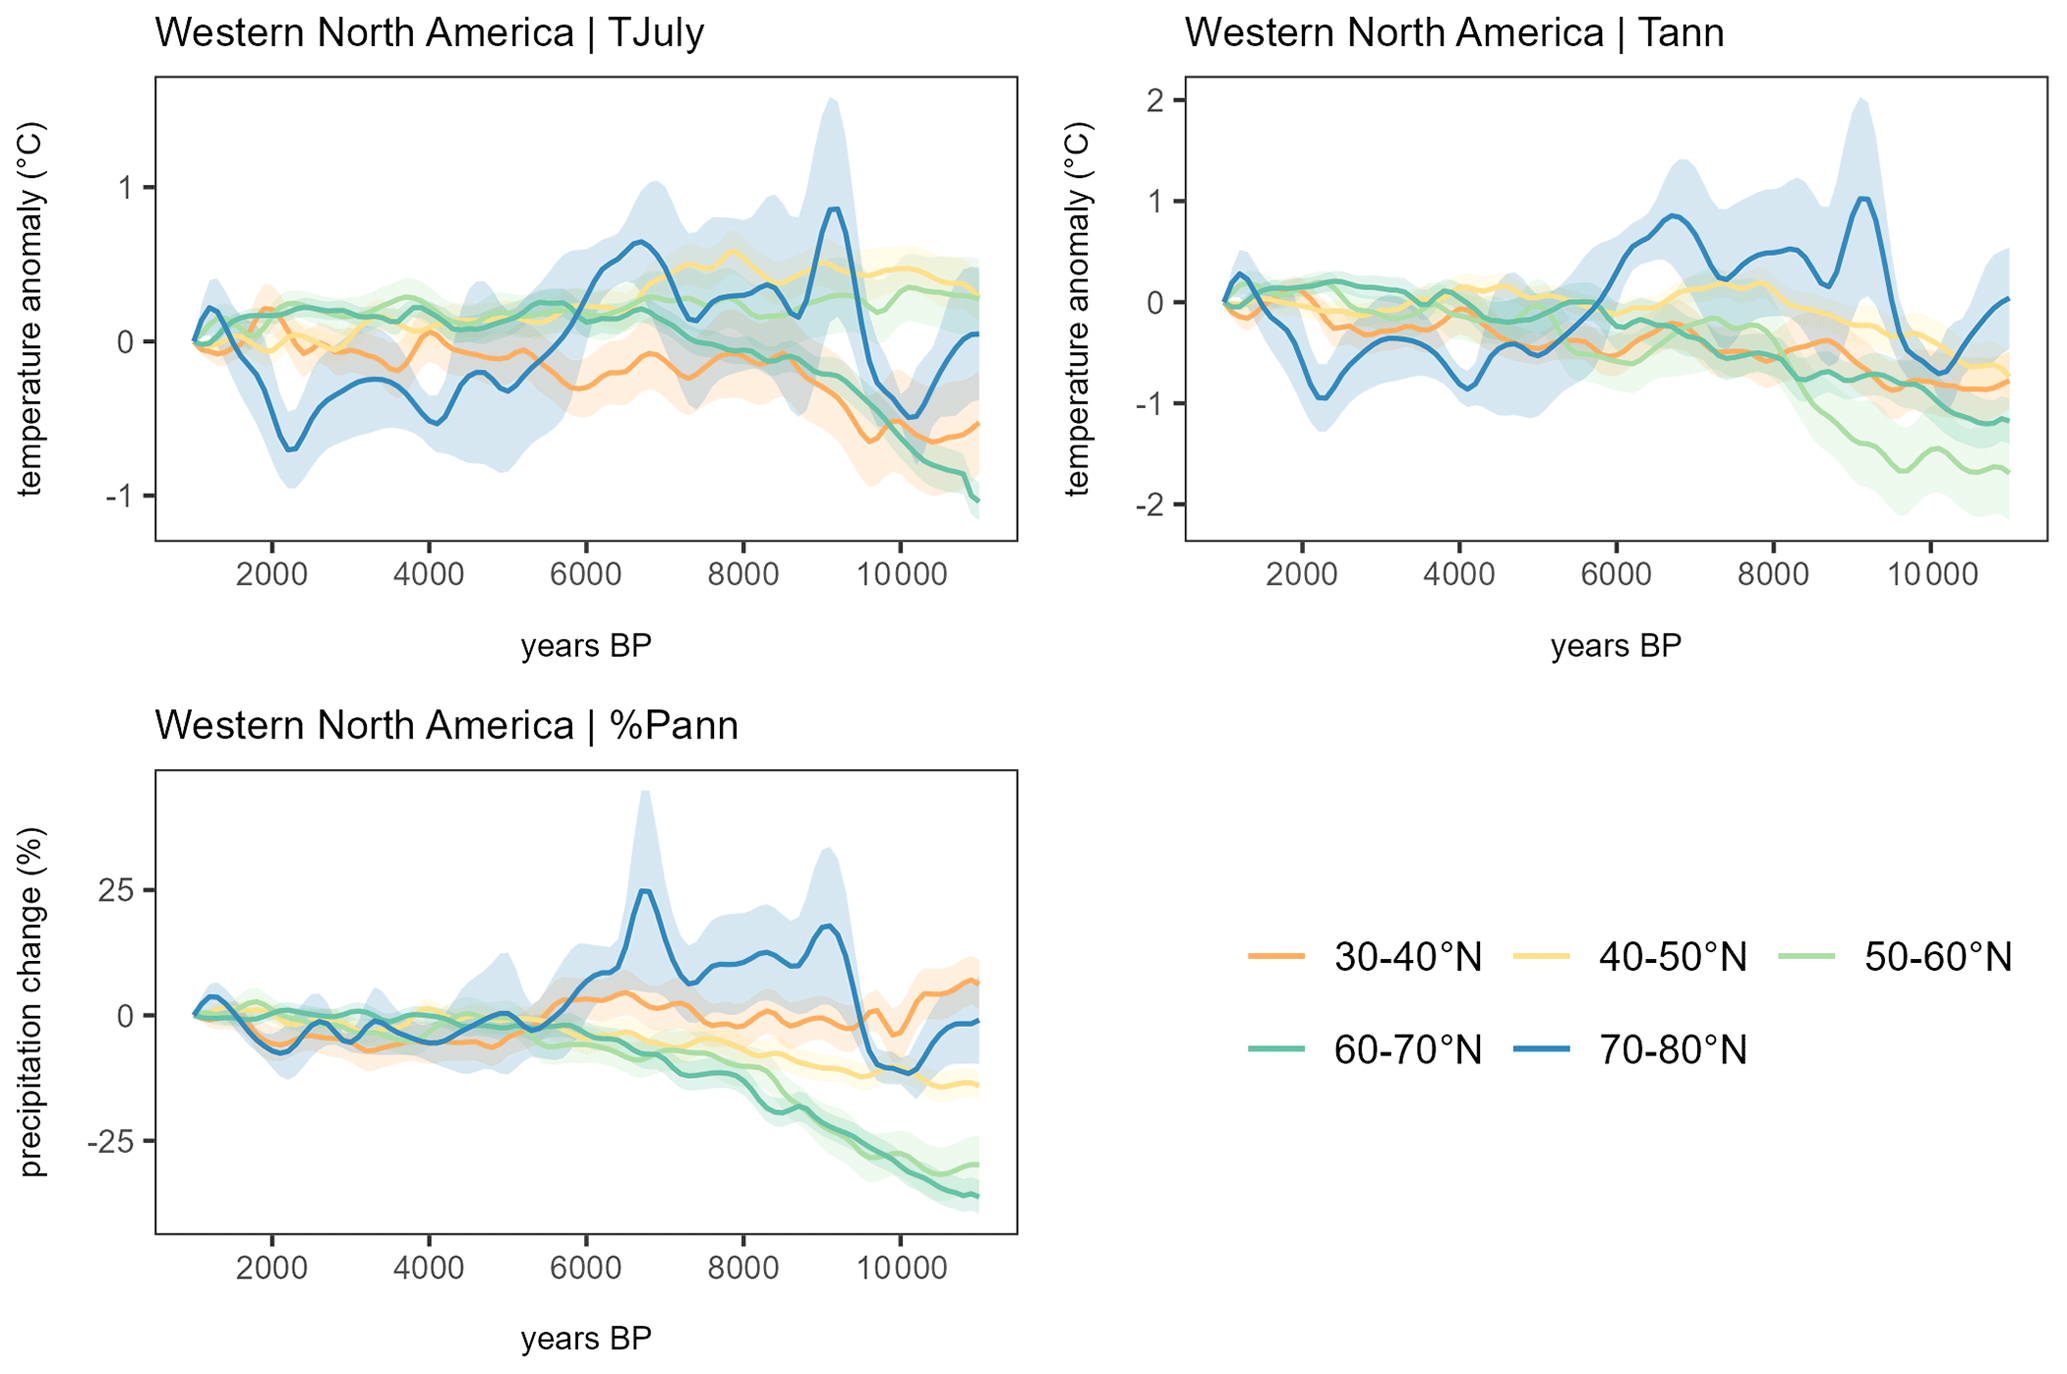
Figure A4Western North American latitudinal mean curves with shaded standard errors for TJuly, Tann, and %Pann derived from pollen-based reconstruction with WA-PLS data (latitudinal bands that contain fewer than three grid cells are not shown).
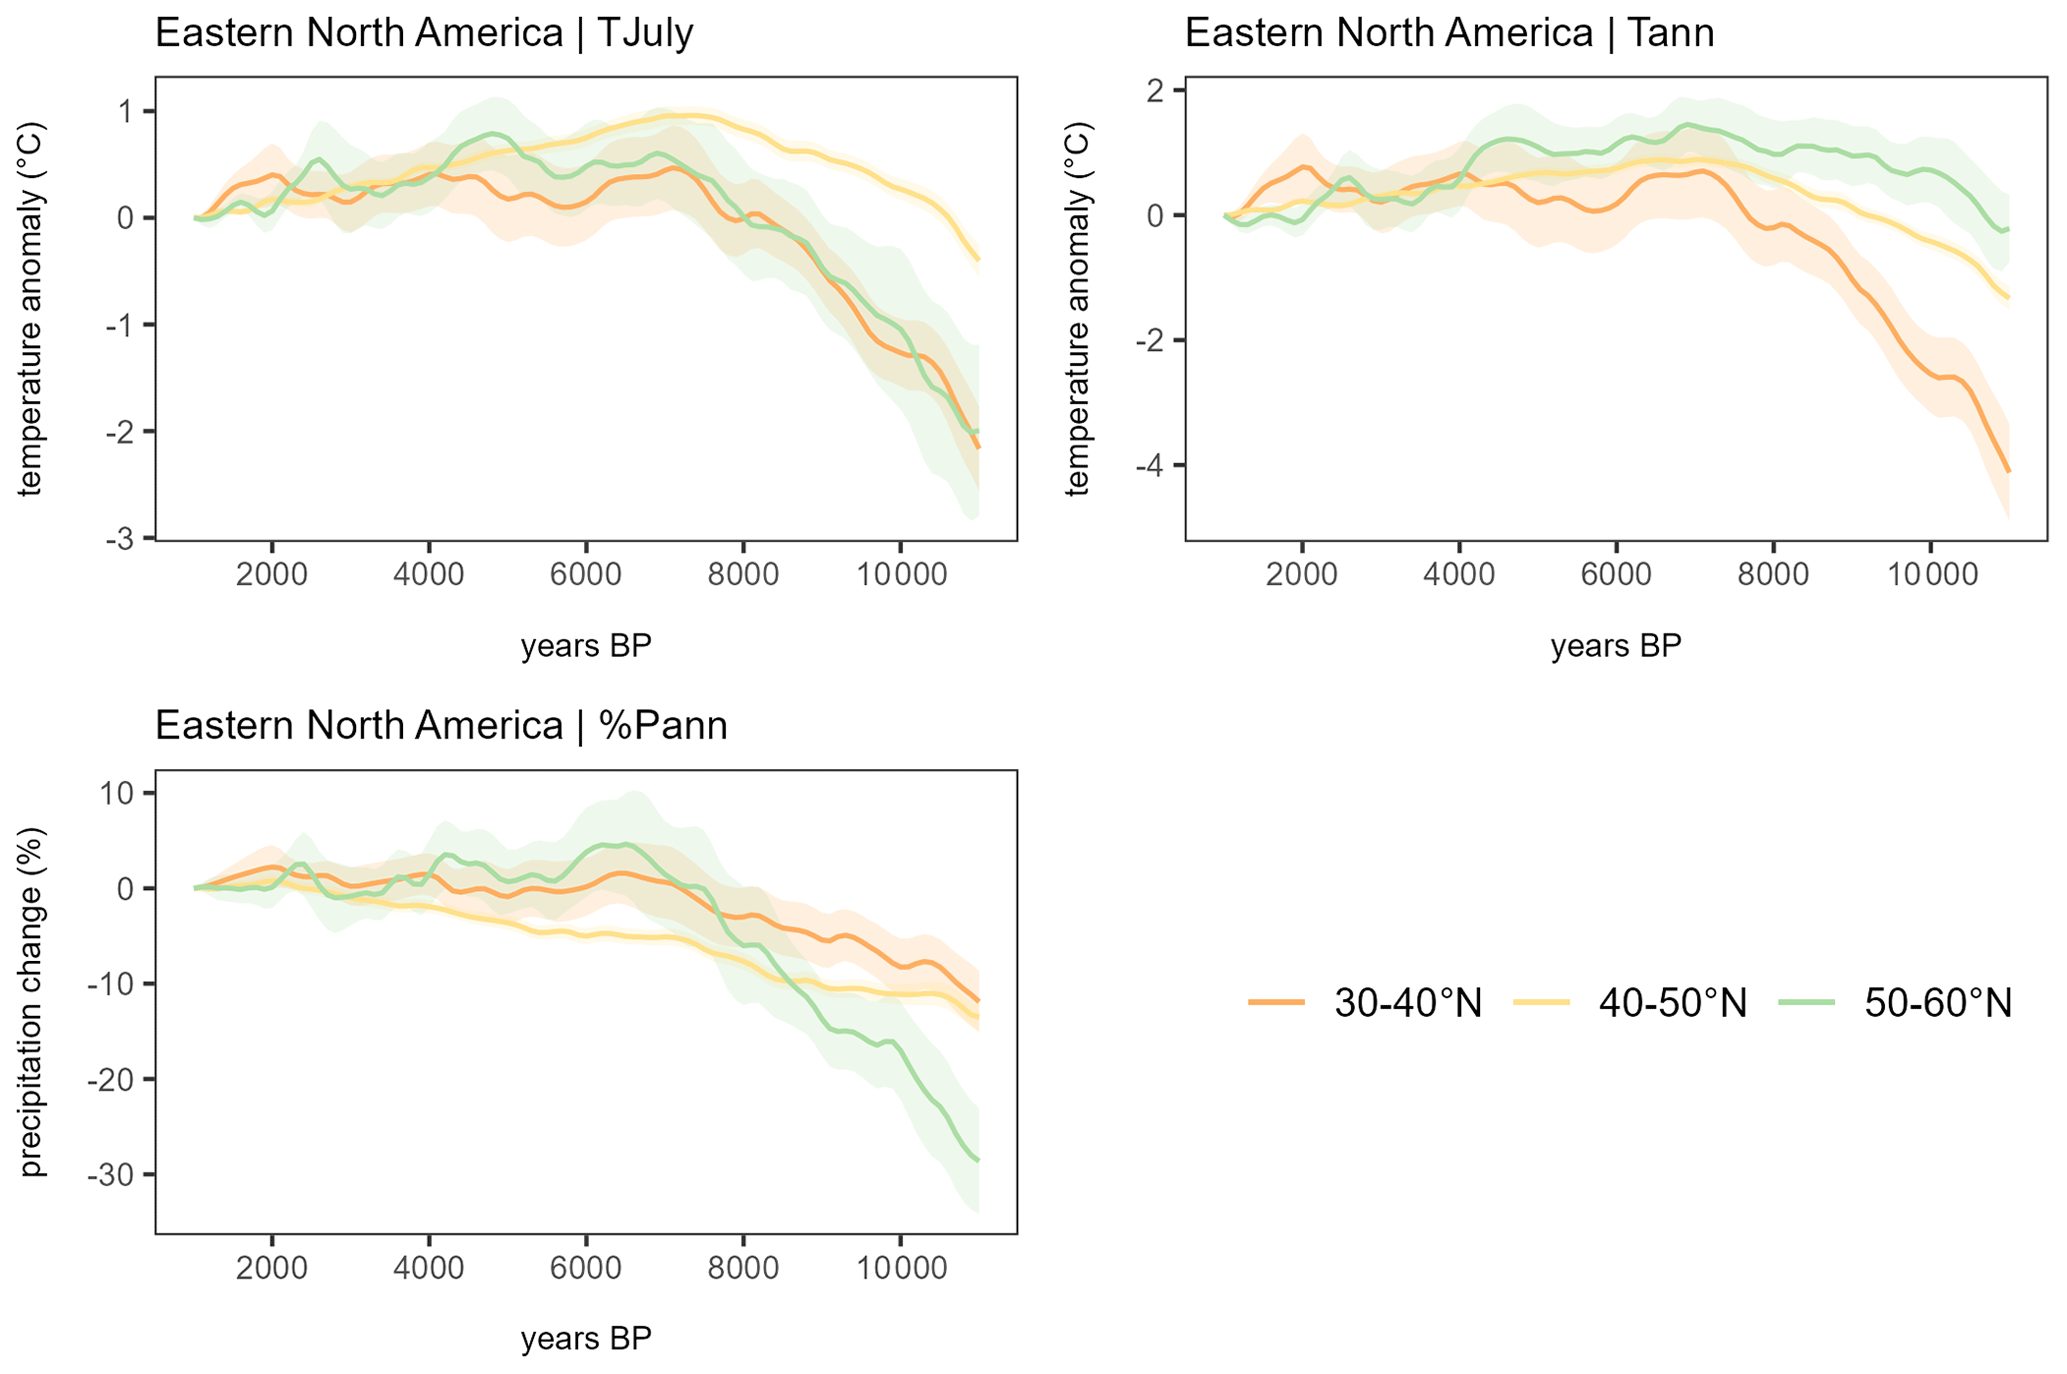
Figure A5Eastern North American latitudinal mean curves with shaded standard errors for TJuly, Tann, and %Pann derived from pollen-based reconstruction with WA-PLS data (latitudinal bands that contain fewer than three grid cells are not shown).
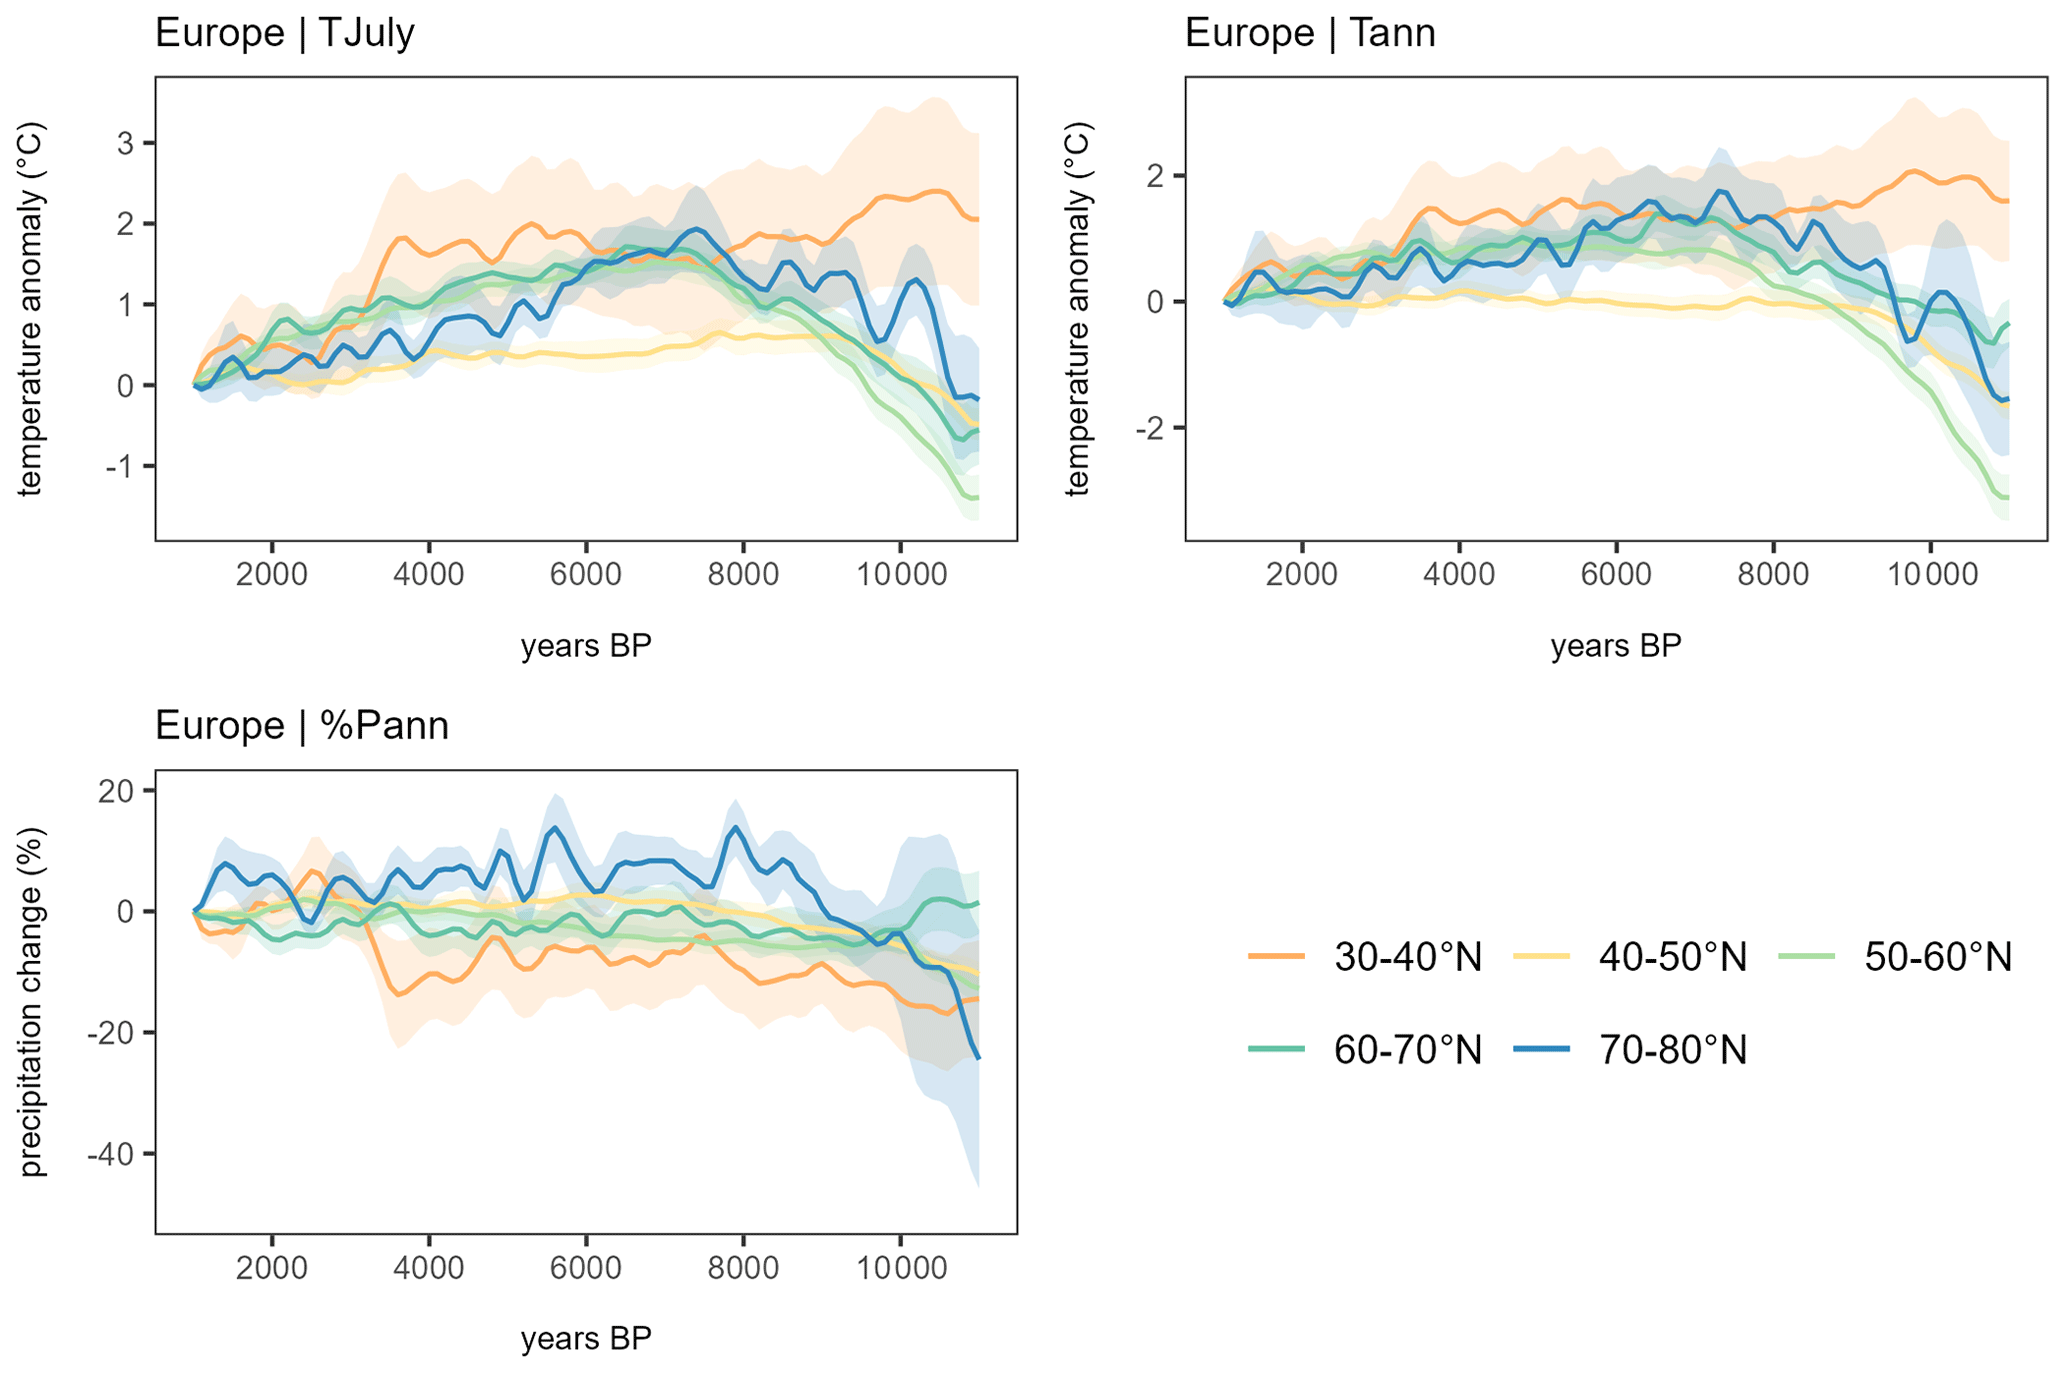
Figure A6European latitudinal mean curves with shaded standard errors for TJuly, Tann, and %Pann derived from pollen-based reconstruction with WA-PLS data (latitudinal bands that contain fewer than three grid cells are not shown).
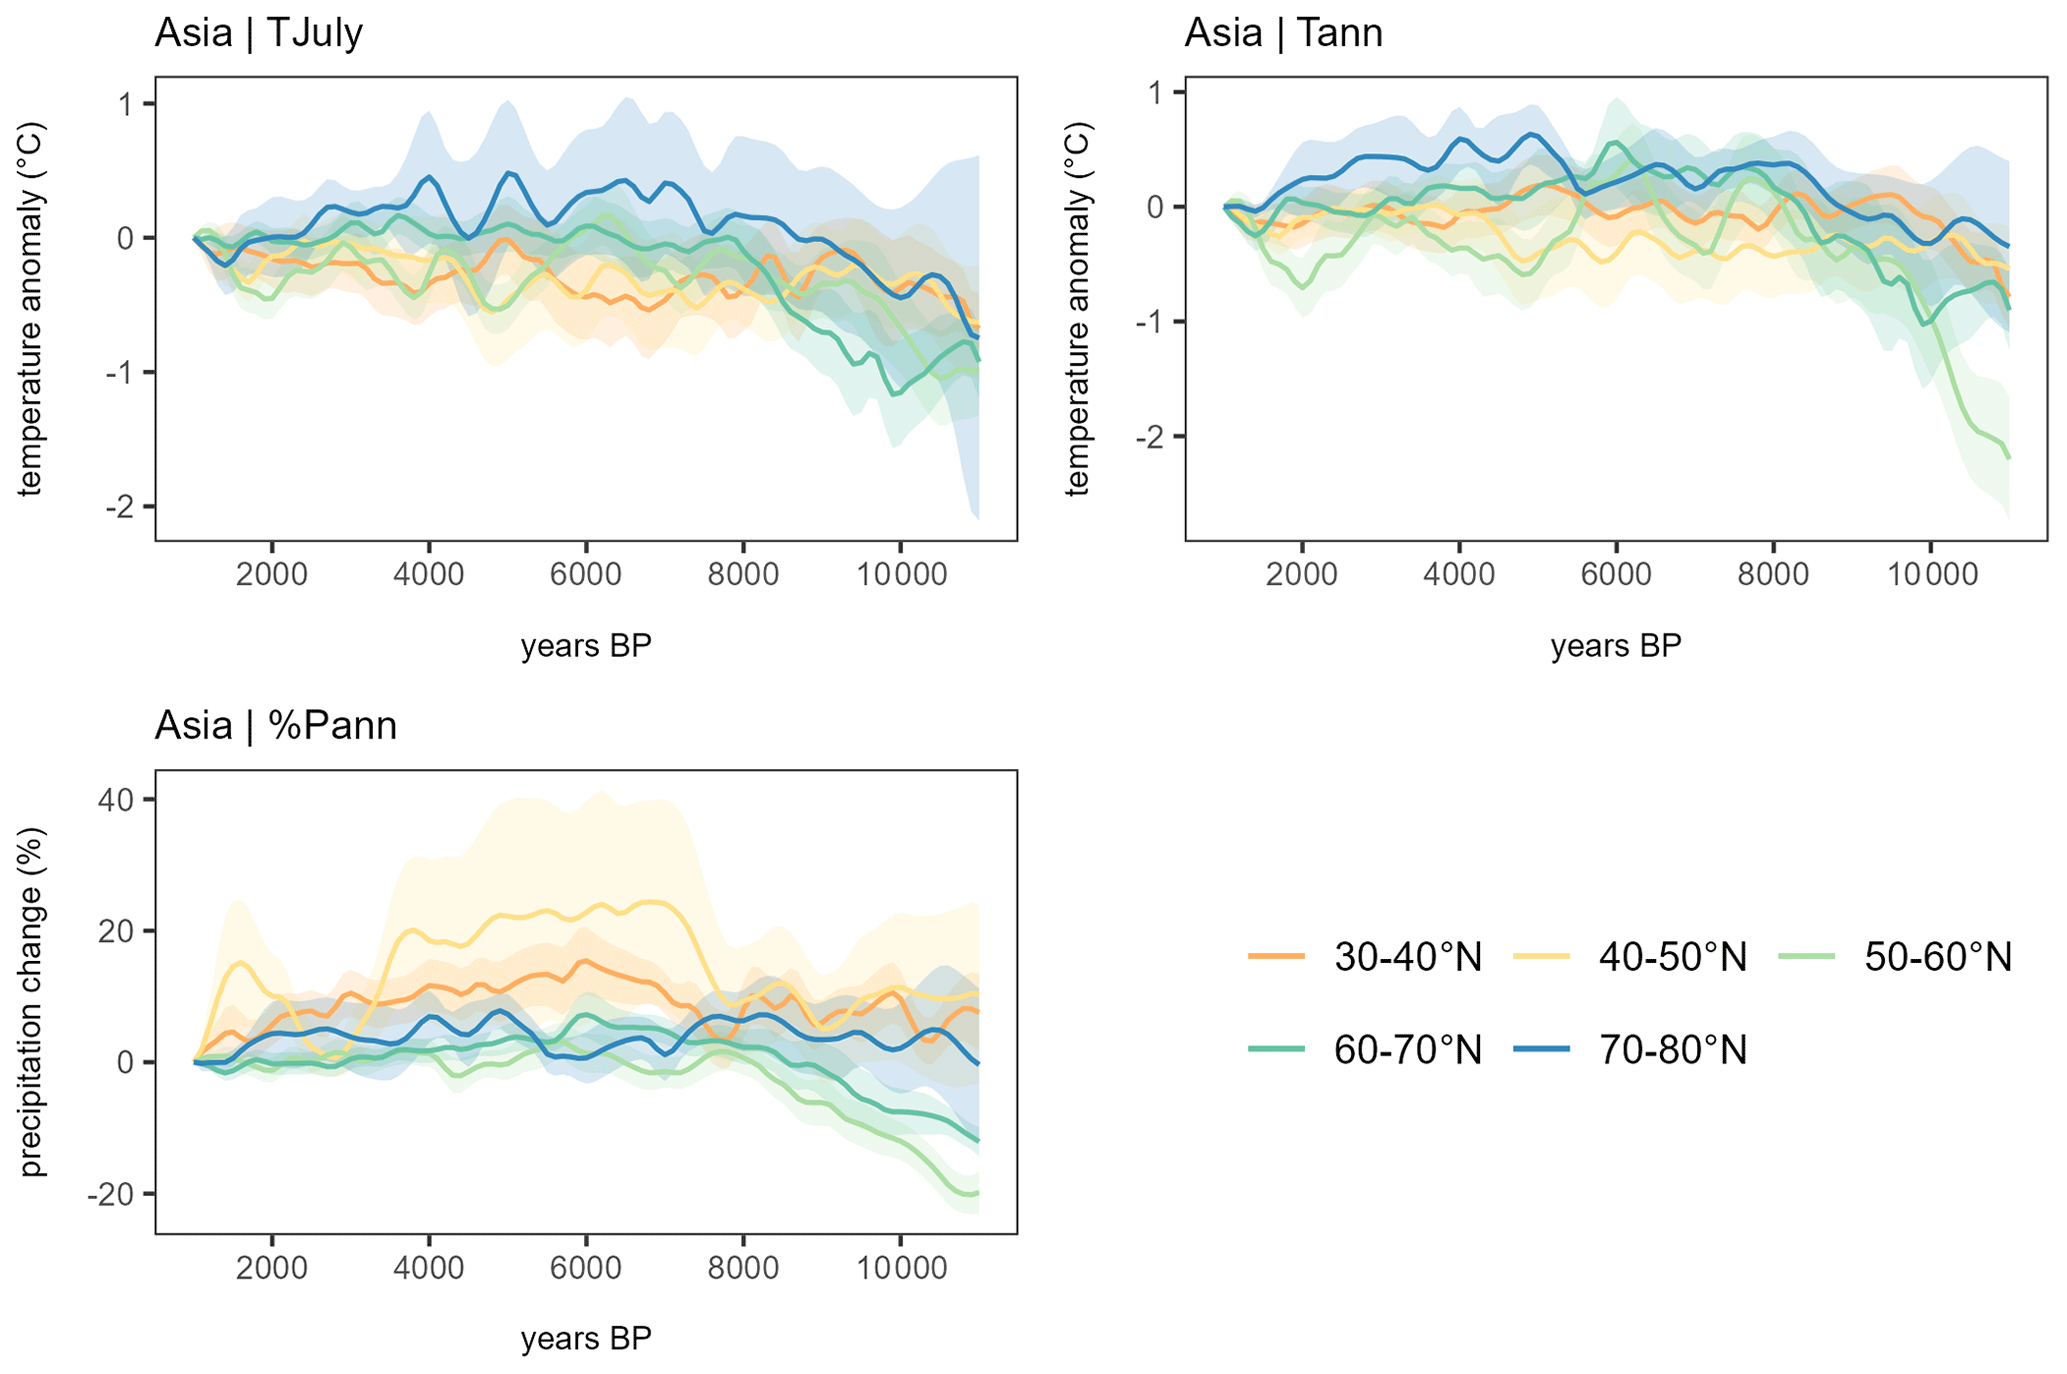
Figure A7Asian latitudinal mean curves with shaded standard errors for TJuly, Tann, and %Pann derived from pollen-based reconstruction with WA-PLS data (latitudinal bands that contain fewer than three grid cells are not shown).
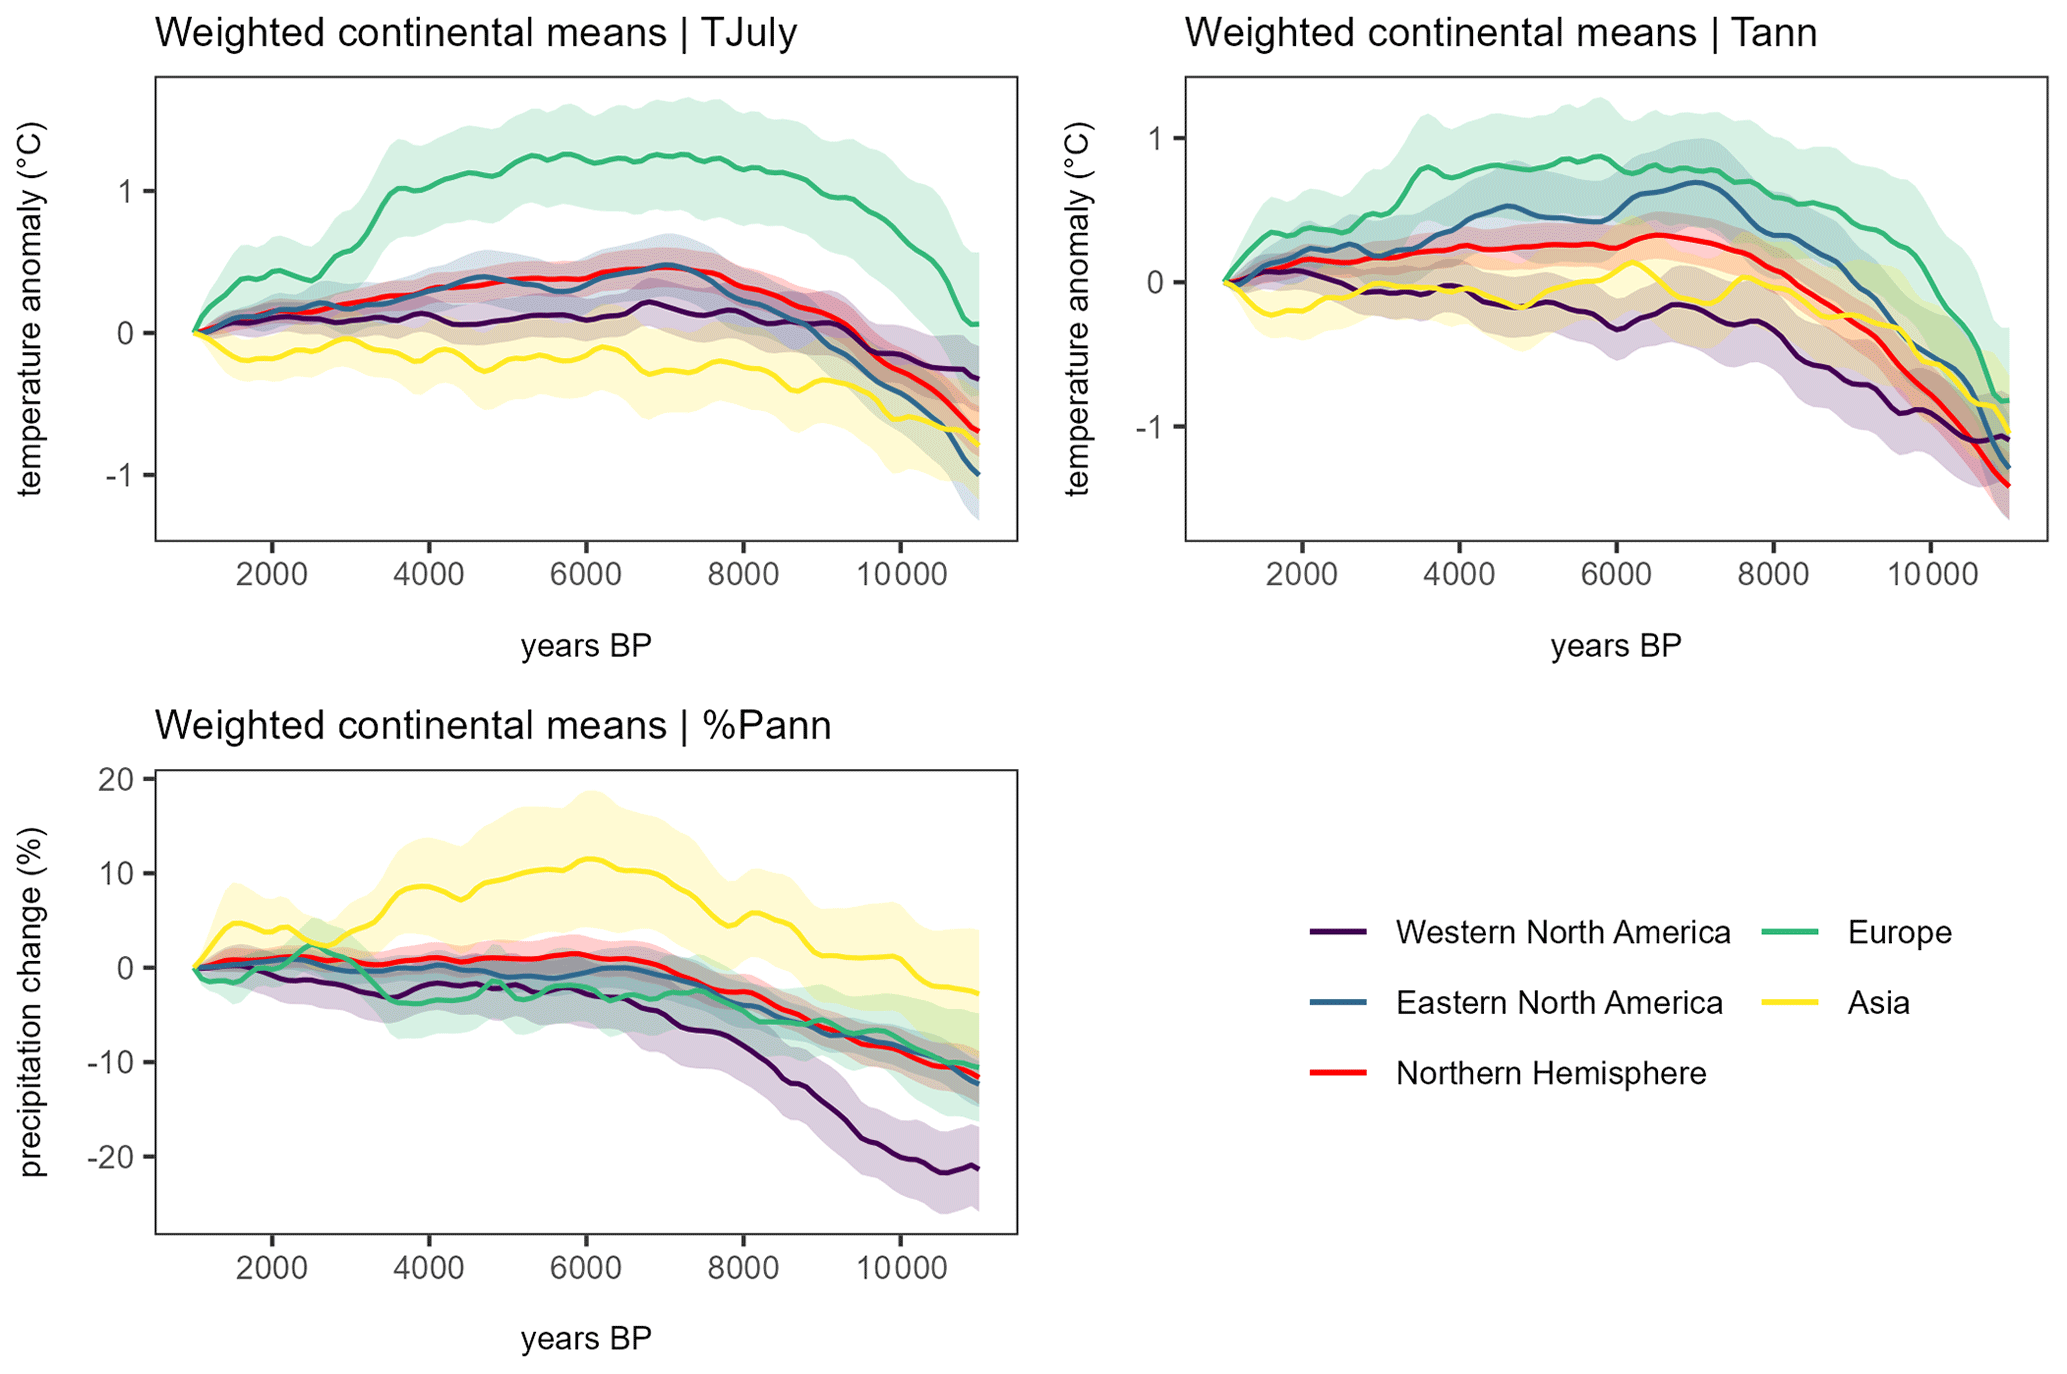
Figure A8Weighted continental means with shaded standard errors for TJuly, Tann, and %Pann derived from pollen-based reconstruction with WA-PLS data.
Table A2Significance values for zonal linear trends derived from a Monte Carlo test comparison for mean July temperatures (TJuly).
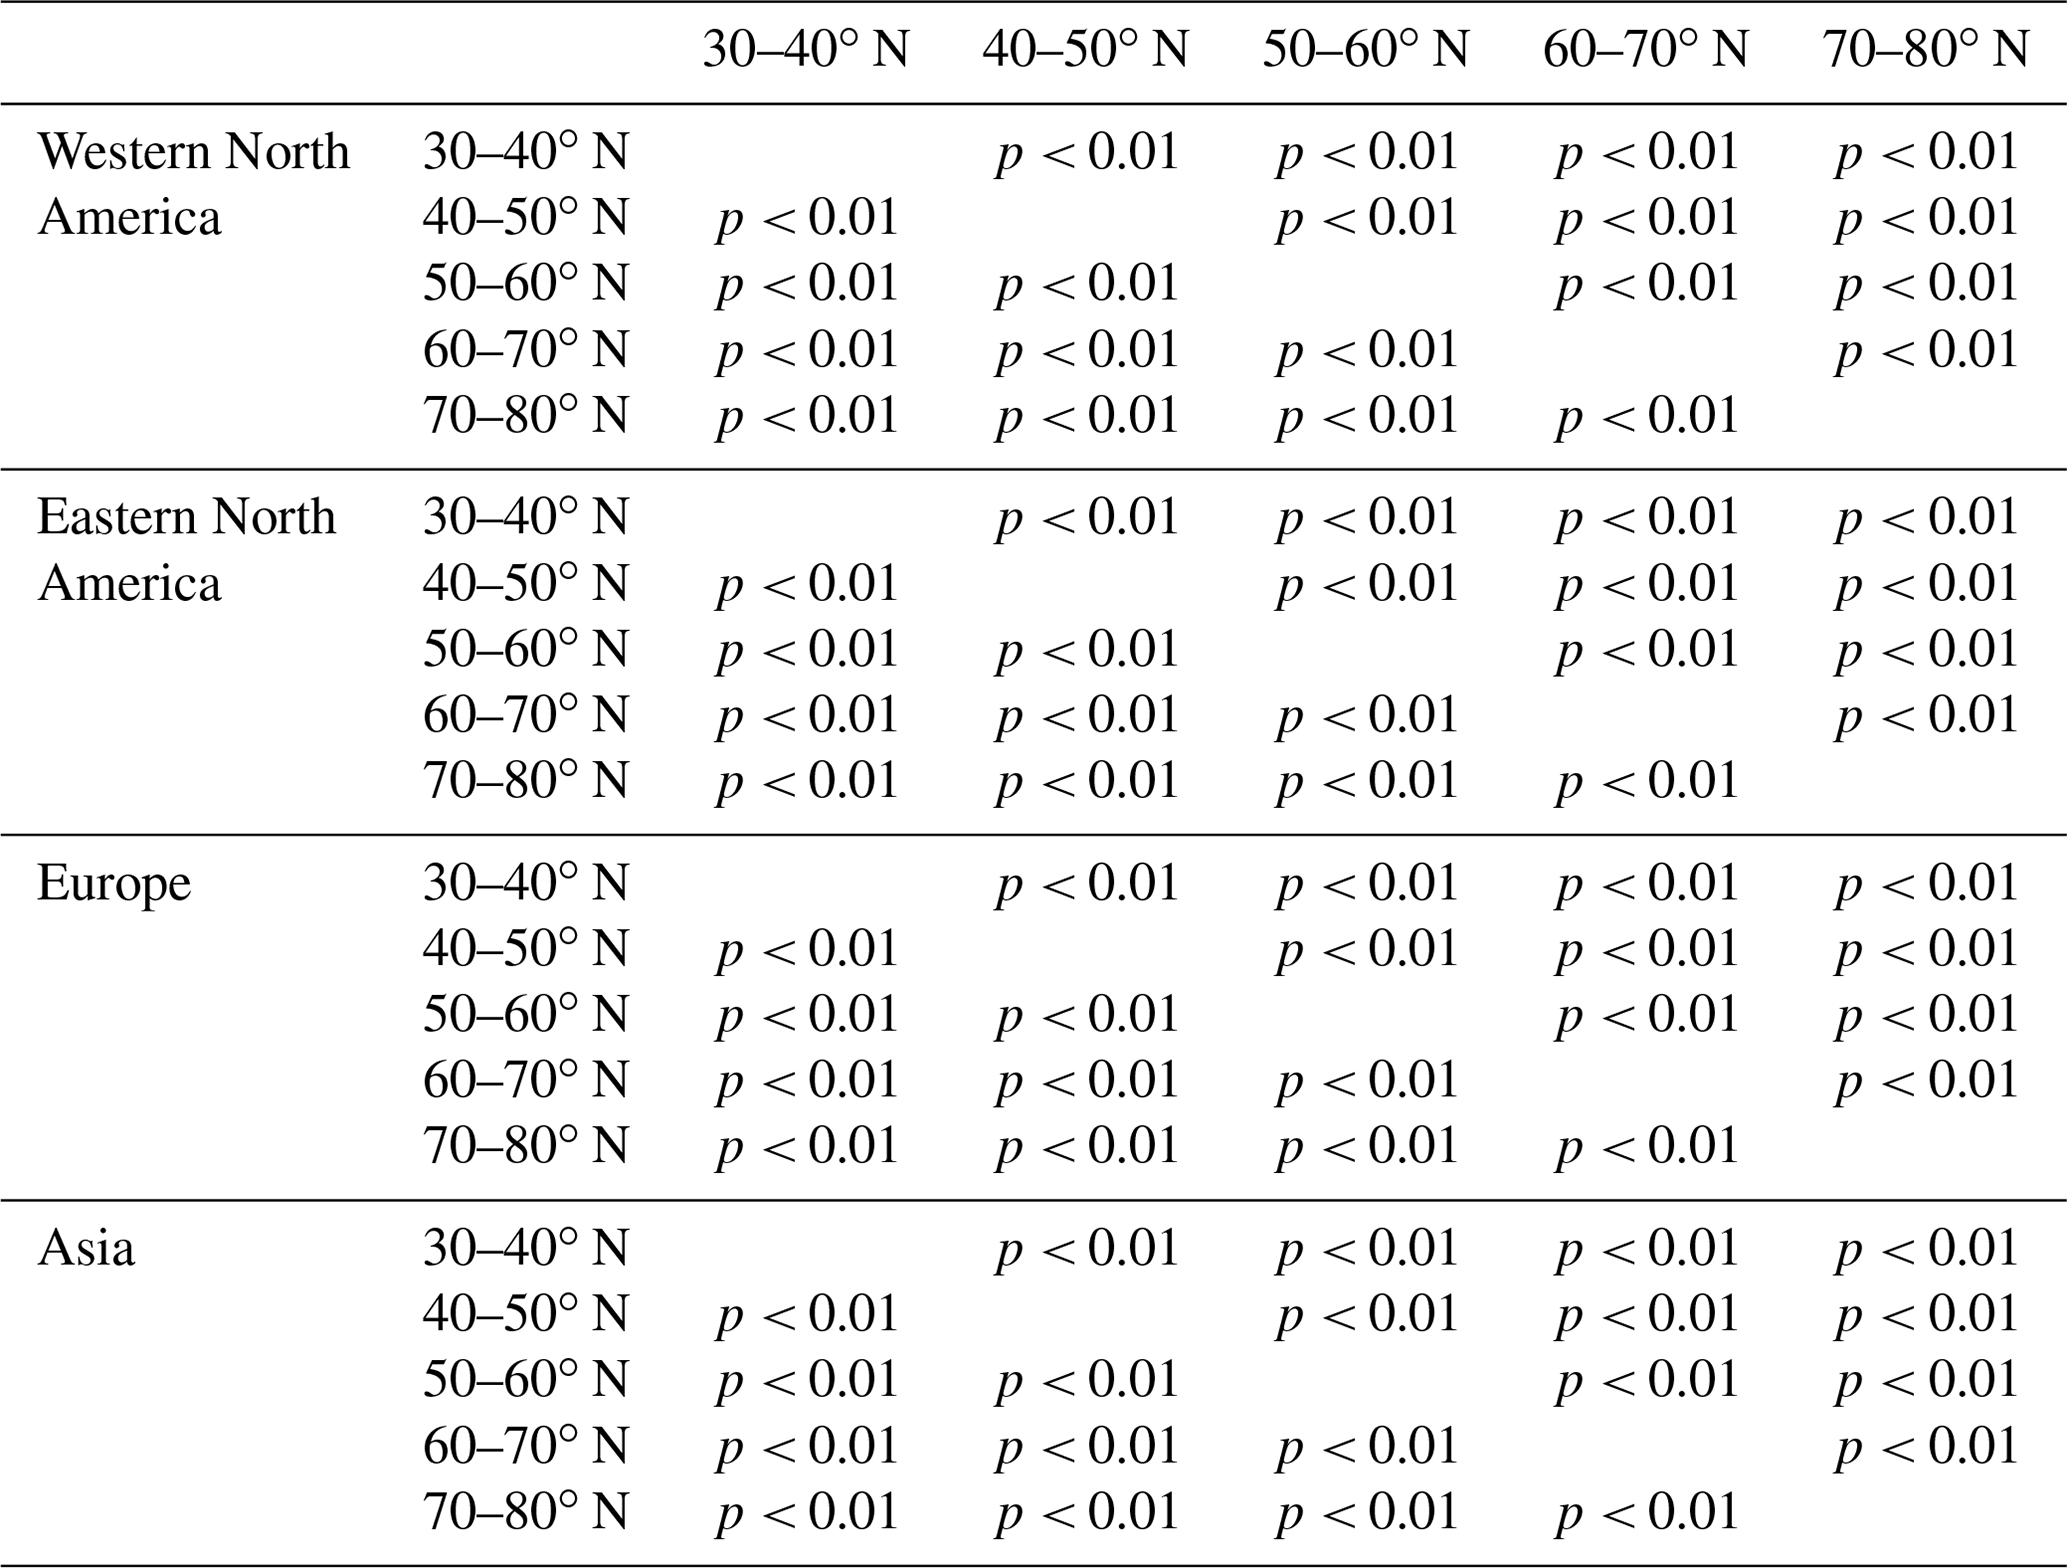
Table A3Significance values for zonal linear trends derived from a Monte Carlo test comparison for mean annual temperatures (Tann).

Table A4Significance values for zonal linear trends derived from a Monte Carlo test comparison for annual precipitation (Pann).
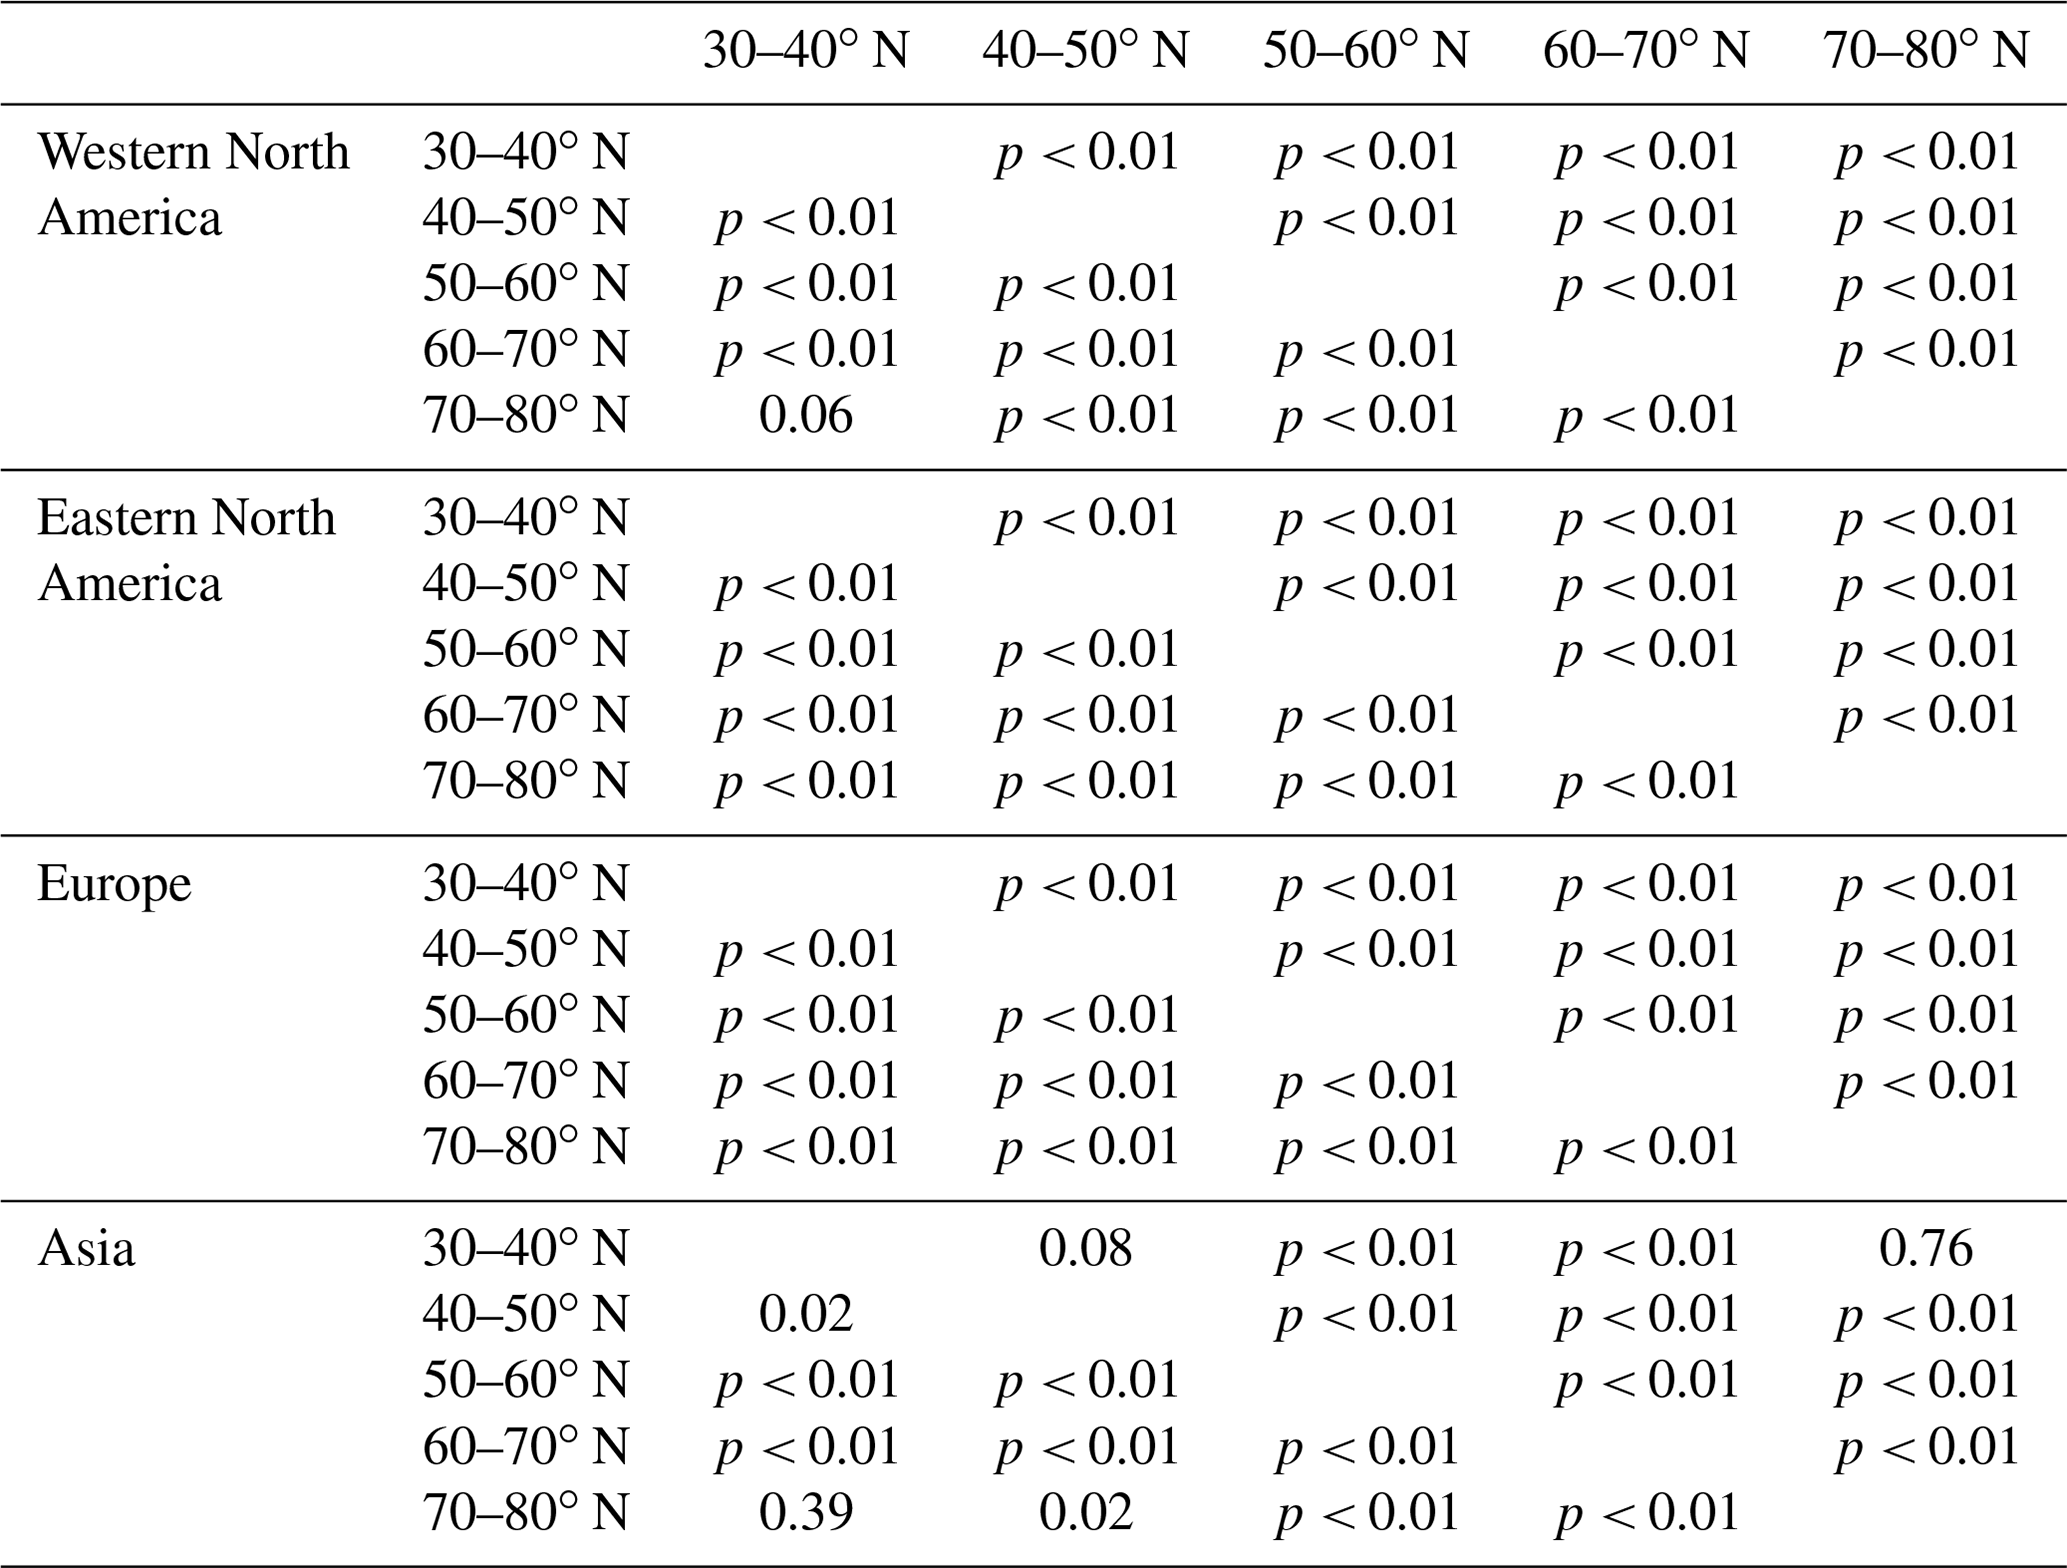
Table A5Significance values for continental means linear trends derived from a Monte Carlo test comparison.
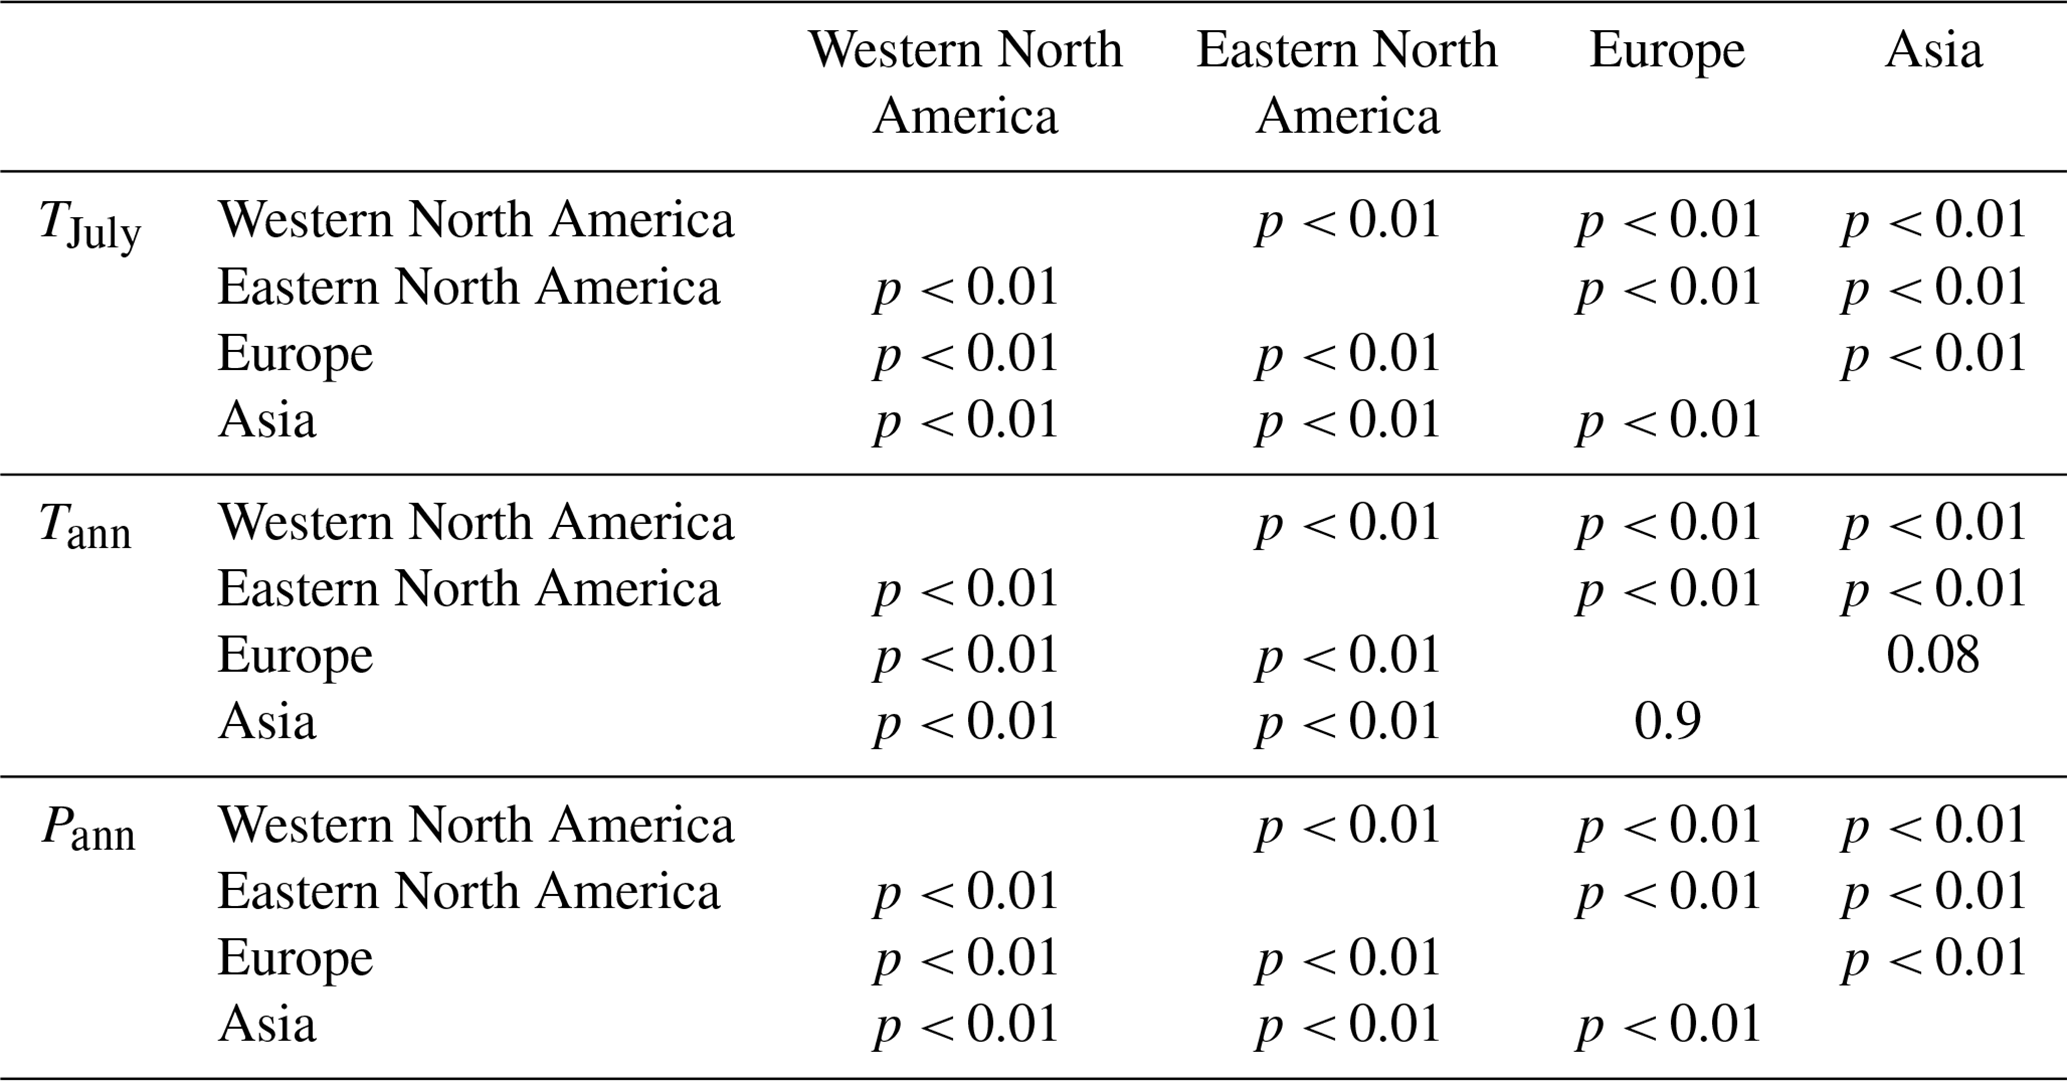
Table A6Significance values for continental means compared to the Northern Hemispheric mean derived from a Monte Carlo test comparison.
The reconstructed TJuly, Tann, and Pann data are available as an open-access compilation through PANGAEA (https://doi.org/10.1594/PANGAEA.930512, Herzschuh et al., 2023b; in the “Other version” section). The dataset files are stored in machine-readable data format (.CSV) and are already separated into western North America, eastern North America, Europe, and Asia for easy access and use.
UH designed the study. The analyses were led by UH and implemented by TB. UH guided the interpretation of the results and collected detailed comments from AD, MC, OP, CL, and RH. All co-authors commented on the initial version of the manuscript.
The contact author has declared that none of the authors has any competing interests.
Publisher's note: Copernicus Publications remains neutral with regard to jurisdictional claims in published maps and institutional affiliations.
We would like to express our gratitude to all the palynologists and geologists who, either directly or indirectly by providing their work to the Neotoma Paleoecology Database, contributed pollen data and chronologies to the dataset. The work of data contributors, data stewards, and the Neotoma community is gratefully acknowledged. We also thank Cathy Jenks for language editing.
This research has been supported by the European Research Council (ERC Glacial Legacy 772852 to Ulrike Herzschuh) and the PalMod Initiative (01LP1510C to Ulrike Herzschuh). Thomas Böhmer, Manuel Chevalier, and Anne Dallmeyer are supported by the German Federal Ministry of Education and Research (BMBF) as a Research for Sustainability initiative (FONA; https://www.fona.de/en, last access: 10 March 2023) through the PalMod Phase II project (grant nos. FKZ 01LP1926D and 01LP1920A). Chenzhi Li holds a scholarship from the Chinese Scholarship Council (grant no. 201908130165). Natalia A. Rudaya's work was supported by the Russian Science Foundation (grant no. 20-17-00110).
The article processing charges for this open-access publication were covered by the Alfred Wegener Institute, Helmholtz Centre for Polar and Marine Research (AWI).
This paper was edited by Julie Loisel and reviewed by two anonymous referees.
Andreev, A., Tarasov, P., Schwamborn, G., Ilyashuk, B., Ilyashuk, E., Bobrov, A., Klimanov, V., Rachold, V., and Hubberten, H.-W.: Holocene paleoenvironmental records from Nikolay Lake, Lena River Delta, Arctic Russia, Palaeogeogr. Palaeocl., 209, 197–217, https://doi.org/10.1016/j.palaeo.2004.02.010, 2004.
Bader, J., Jungclaus, J., Krivova, N., Lorenz, S., Maycock, A., Raddatz, T., Schmidt, H., Toohey, M., Wu, C.-J., and Claussen, M.: Global temperature modes shed light on the Holocene temperature conundrum, Nat. Commun., 11, 4726, https://doi.org/10.1038/s41467-020-18478-6, 2020.
Bakker, P., Rogozhina, I., Merkel, U., and Prange, M.: Hypersensitivity of glacial summer temperatures in Siberia, Clim. Past, 16, 371–386, https://doi.org/10.5194/cp-16-371-2020, 2020.
Birks, H. J. B. and Simpson, G. L.: “Diatoms and pH reconstruction” (1990) revisited, J. Paleolimnol., 49, 363–371, https://doi.org/10.1007/s10933-013-9697-7, 2013.
Birks, H. J. B., Heiri, O., Seppä, H., and Bjune, A. E.: Strengths and Weaknesses of Quantitative Climate Reconstructions Based on Late-Quaternary, Open Ecol. J., 3, 68–110, https://doi.org/10.2174/1874213001003020068, 2010.
Blaauw, M. and Christen, J. A.: Flexible paleoclimate age-depth models using an autoregressive gamma process, Bayesian Anal., 6, 457–474, https://doi.org/10.1214/11-BA618, 2011.
Bova, S., Rosenthal, Y., Liu, Z., Godad, S. P., and Yan, M.: Seasonal origin of the thermal maxima at the Holocene and the last interglacial, Nature, 589, 548–553, https://doi.org/10.1038/s41586-020-03155-x, 2021.
Brierley, C. M., Zhao, A., Harrison, S. P., Braconnot, P., Williams, C. J. R., Thornalley, D. J. R., Shi, X., Peterschmitt, J.-Y., Ohgaito, R., Kaufman, D. S., Kageyama, M., Hargreaves, J. C., Erb, M. P., Emile-Geay, J., D'Agostino, R., Chandan, D., Carré, M., Bartlein, P. J., Zheng, W., Zhang, Z., Zhang, Q., Yang, H., Volodin, E. M., Tomas, R. A., Routson, C., Peltier, W. R., Otto-Bliesner, B., Morozova, P. A., McKay, N. P., Lohmann, G., Legrande, A. N., Guo, C., Cao, J., Brady, E., Annan, J. D., and Abe-Ouchi, A.: Large-scale features and evaluation of the PMIP4-CMIP6 midHolocene simulations, Clim. Past, 16, 1847–1872, https://doi.org/10.5194/cp-16-1847-2020, 2020.
Brodzik, M. J., Billingsley, B., Haran, T., Raup, B., and Savoie, M. H.: EASE-Grid 2.0: Incremental but Significant Improvements for Earth-Gridded Data Sets, IJGI, 1, 32–45, https://doi.org/10.3390/ijgi1010032, 2012.
Cao, X., Ni, J., Herzschuh, U., Wang, Y., and Zhao, Y.: A late Quaternary pollen dataset from eastern continental Asia for vegetation and climate reconstructions: Set up and evaluation, Rev. Palaeobot. Palyno., 194, 21–37, https://doi.org/10.1016/j.revpalbo.2013.02.003, 2013.
Cao, X., Herzschuh, U., Telford, R. J., and Ni, J.: A modern pollen–climate dataset from China and Mongolia: Assessing its potential for climate reconstruction, Rev. Palaeobot. Palyno., 211, 87–96, https://doi.org/10.1016/j.revpalbo.2014.08.007, 2014.
Cao, X., Tian, F., Telford, R. J., Ni, J., Xu, Q., Chen, F., Liu, X., Stebich, M., Zhao, Y., and Herzschuh, U.: Impacts of the spatial extent of pollen-climate calibration-set on the absolute values, range and trends of reconstructed Holocene precipitation, Quaternary Sci. Rev., 178, 37–53, https://doi.org/10.1016/j.quascirev.2017.10.030, 2017.
Cao, X., Tian, F., Dallmeyer, A., and Herzschuh, U.: Northern Hemisphere biome changes (> 30∘ N) since 40 cal ka BP and their driving factors inferred from model-data comparisons, Quaternary Sci. Rev., 220, 291–309, https://doi.org/10.1016/j.quascirev.2019.07.034, 2019.
Cartapanis, O., Jonkers, L., Moffa-Sanchez, P., Jaccard, S. L., and de Vernal, A.: Complex spatio-temporal structure of the Holocene Thermal Maximum, Nat. Commun., 13, 5662, https://doi.org/10.1038/s41467-022-33362-1, 2022.
Chang, E. K. M., Lee, S., and Swanson, K. L.: Storm Track Dynamics, J. Climate, 15, 2163–2183, https://doi.org/10.1175/1520-0442(2002)015<02163:STD>2.0.CO;2, 2002.
Chen, F., Xu, Q., Chen, J., Birks, H. J. B., Liu, J., Zhang, S., Jin, L., An, C., Telford, R. J., Cao, X., Wang, Z., Zhang, X., Selvaraj, K., Lu, H., Li, Y., Zheng, Z., Wang, H., Zhou, A., Dong, G., Zhang, J., Huang, X., Bloemendal, J., and Rao, Z.: East Asian summer monsoon precipitation variability since the last deglaciation, Sci. Rep., 5, 11186, https://doi.org/10.1038/srep11186, 2015.
Chen, F., Chen, J., Huang, W., Chen, S., Huang, X., Jin, L., Jia, J., Zhang, X., An, C., Zhang, J., Zhao, Y., Yu, Z., Zhang, R., Liu, J., Zhou, A., and Feng, S.: Westerlies Asia and monsoonal Asia: Spatiotemporal differences in climate change and possible mechanisms on decadal to sub-orbital timescales, Earth Sci. Rev., 192, 337–354, https://doi.org/10.1016/j.earscirev.2019.03.005, 2019.
Chevalier, M., Davis, B. A. S., Heiri, O., Seppä, H., Chase, B. M., Gajewski, K., Lacourse, T., Telford, R. J., Finsinger, W., Guiot, J., Kühl, N., Maezumi, S. Y., Tipton, J. R., Carter, V. A., Brussel, T., Phelps, L. N., Dawson, A., Zanon, M., Vallé, F., Nolan, C., Mauri, A., de Vernal, A., Izumi, K., Holmström, L., Marsicek, J., Goring, S., Sommer, P. S., Chaput, M., and Kupriyanov, D.: Pollen-based climate reconstruction techniques for late Quaternary studies, Earth Sci. Rev., 210, 103384, https://doi.org/10.1016/j.earscirev.2020.103384, 2020.
Chouinard, C. and Mareschal, J.-C.: Ground surface temperature history in southern Canada: Temperatures at the base of the Laurentide ice sheet and during the Holocene, Earth Planet. Sc. Lett., 277, 280–289, https://doi.org/10.1016/j.epsl.2008.10.026, 2009.
Cleator, S. F., Harrison, S. P., Nichols, N. K., Prentice, I. C., and Roulstone, I.: A new multivariable benchmark for Last Glacial Maximum climate simulations, Clim. Past, 16, 699–712, https://doi.org/10.5194/cp-16-699-2020, 2020.
Dallmeyer, A., Claussen, M., Lorenz, S. J., Sigl, M., Toohey, M., and Herzschuh, U.: Holocene vegetation transitions and their climatic drivers in MPI-ESM1.2, Clim. Past, 17, 2481–2513, https://doi.org/10.5194/cp-17-2481-2021, 2021.
Dallmeyer, A., Kleinen, T., Claussen, M., Weitzel, N., Cao, X., and Herzschuh, U.: The deglacial forest conundrum, Nat. Commun., 13, 6035, https://doi.org/10.1038/s41467-022-33646-6, 2022.
Davis, B. A. S., Brewer, S., Stevenson, A. C., and Guiot, J.: The temperature of Europe during the Holocene reconstructed from pollen data, Quaternary Sci. Rev., 22, 1701–1716, https://doi.org/10.1016/S0277-3791(03)00173-2, 2003.
Davis, B. A. S., Chevalier, M., Sommer, P., Carter, V. A., Finsinger, W., Mauri, A., Phelps, L. N., Zanon, M., Abegglen, R., Åkesson, C. M., Alba-Sánchez, F., Anderson, R. S., Antipina, T. G., Atanassova, J. R., Beer, R., Belyanina, N. I., Blyakharchuk, T. A., Borisova, O. K., Bozilova, E., Bukreeva, G., Bunting, M. J., Clò, E., Colombaroli, D., Combourieu-Nebout, N., Desprat, S., Di Rita, F., Djamali, M., Edwards, K. J., Fall, P. L., Feurdean, A., Fletcher, W., Florenzano, A., Furlanetto, G., Gaceur, E., Galimov, A. T., Gałka, M., García-Moreiras, I., Giesecke, T., Grindean, R., Guido, M. A., Gvozdeva, I. G., Herzschuh, U., Hjelle, K. L., Ivanov, S., Jahns, S., Jankovska, V., Jiménez-Moreno, G., Karpińska-Kołaczek, M., Kitaba, I., Kołaczek, P., Lapteva, E. G., Latałowa, M., Lebreton, V., Leroy, S., Leydet, M., Lopatina, D. A., López-Sáez, J. A., Lotter, A. F., Magri, D., Marinova, E., Matthias, I., Mavridou, A., Mercuri, A. M., Mesa-Fernández, J. M., Mikishin, Y. A., Milecka, K., Montanari, C., Morales-Molino, C., Mrotzek, A., Muñoz Sobrino, C., Naidina, O. D., Nakagawa, T., Nielsen, A. B., Novenko, E. Y., Panajiotidis, S., Panova, N. K., Papadopoulou, M., Pardoe, H. S., Pȩdziszewska, A., Petrenko, T. I., Ramos-Román, M. J., Ravazzi, C., Rösch, M., Ryabogina, N., Sabariego Ruiz, S., Salonen, J. S., Sapelko, T. V., Schofield, J. E., Seppä, H., Shumilovskikh, L., Stivrins, N., Stojakowits, P., Svobodova Svitavska, H., Świȩta-Musznicka, J., Tantau, I., Tinner, W., Tobolski, K., Tonkov, S., Tsakiridou, M., Valsecchi, V., Zanina, O. G., and Zimny, M.: The Eurasian Modern Pollen Database (EMPD), version 2, Earth Syst. Sci. Data, 12, 2423–2445, https://doi.org/10.5194/essd-12-2423-2020, 2020.
Dugerdil, L., Joannin, S., Peyron, O., Jouffroy-Bapicot, I., Vannière, B., Boldgiv, B., Unkelbach, J., Behling, H., and Ménot, G.: Climate reconstructions based on GDGT and pollen surface datasets from Mongolia and Baikal area: calibrations and applicability to extremely cold–dry environments over the Late Holocene, Clim. Past, 17, 1199–1226, https://doi.org/10.5194/cp-17-1199-2021, 2021.
Fick, S. E. and Hijmans, R. J.: WorldClim 2: new 1-km spatial resolution climate surfaces for global land areas, Int. J. Climatol., 37, 4302–4315, https://doi.org/10.1002/joc.5086, 2017.
Grimm, E. C., Lozano-García, S., Behling, H., and Markgraf, V.: Chapter 19 – Holocene Vegetation and Climate Variability in the Americas, in: Interhemispheric Climate Linkages, edited by: Markgraf, V., Academic Press, San Diego, 325–370, https://doi.org/10.1016/B978-012472670-3/50022-7, 2001.
Harrell, F. E. and Dupont, C.: Hmisc: Harrell Miscellaneous, R package version 5.0-1, https://cran.r-project.org/web/packages/Hmisc (last access: 10 March 2023), 2023.
Harrison, S. P., Kutzbach, J. E., Liu, Z., Bartlein, P. J., Otto-Bliesner, B., Muhs, D., Prentice, I. C., and Thompson, R. S.: Mid-Holocene climates of the Americas: a dynamical response to changed seasonality, Clim. Dynam., 20, 663–688, https://doi.org/10.1007/s00382-002-0300-6, 2003.
Herzschuh, U.: Legacy of the Last Glacial on the present-day distribution of deciduous versus evergreen boreal forests, Global Ecol. Biogeogr., 29, 198–206, https://doi.org/10.1111/geb.13018, 2020.
Herzschuh, U., Tarasov, P., Wünnemann, B., and Hartmann, K.: Holocene vegetation and climate of the Alashan Plateau, NW China, reconstructed from pollen data, Palaeogeogr. Palaeocl., 211, 1–17, https://doi.org/10.1016/j.palaeo.2004.04.001, 2004.
Herzschuh, U., Birks, H. J. B., Laepple, T., Andreev, A., Melles, M., and Brigham-Grette, J.: Glacial legacies on interglacial vegetation at the Pliocene-Pleistocene transition in NE Asia, Nat. Commun., 7, 11967, https://doi.org/10.1038/ncomms11967, 2016.
Herzschuh, U., Cao, X., Laepple, T., Dallmeyer, A., Telford, R. J., Ni, J., Chen, F., Kong, Z., Liu, G., Liu, K.-B., Liu, X., Stebich, M., Tang, L., Tian, F., Wang, Y., Wischnewski, J., Xu, Q., Yan, S., Yang, Z., Yu, G., Zhang, Y., Zhao, Y., and Zheng, Z.: Position and orientation of the westerly jet determined Holocene rainfall patterns in China, Nat. Commun., 10, 2376, https://doi.org/10.1038/s41467-019-09866-8, 2019.
Herzschuh, U., Li, C., Böhmer, T., Postl, A. K., Heim, B., Andreev, A. A., Cao, X., Wieczorek, M., and Ni, J.: LegacyPollen 1.0: a taxonomically harmonized global late Quaternary pollen dataset of 2831 records with standardized chronologies, Earth Syst. Sci. Data, 14, 3213–3227, https://doi.org/10.5194/essd-14-3213-2022, 2022.
Herzschuh, U., Böhmer, T., Li, C., Chevalier, M., Hébert, R., Dallmeyer, A., Cao, X., Bigelow, N. H., Nazarova, L., Novenko, E. Y., Park, J., Peyron, O., Rudaya, N. A., Schlütz, F., Shumilovskikh, L. S., Tarasov, P. E., Wang, Y., Wen, R., Xu, Q., and Zheng, Z.: LegacyClimate 1.0: a dataset of pollen-based climate reconstructions from 2594 Northern Hemisphere sites covering the last 30 kyr and beyond, Earth Syst. Sci. Data, 15, 2235–2258, https://doi.org/10.5194/essd-15-2235-2023, 2023a.
Herzschuh, U., Böhmer, T., Li, C., and Cao, X.: Northern Hemisphere temperature and precipitation reconstruction from taxonomically harmonized pollen data set with revised chronologies using WA-PLS and MAT (LegacyClimate 1.0), PANGAEA [data set], https://doi.org/10.1594/PANGAEA.930512, 2023b.
Hijmans, R. J., van Etten, J., Sumner, M., Cheng, J., Baston, D., Bevan, A., Bivand, R., Busetto, L., Canty, M., Fasoli, B., Forrest, D., Ghosh, A., Golicher, D., Gray, J., Greenberg, J. A., Hiemstra, P., Hingee, K., Ilich, A., Institute for Mathematics Applied Geosciences, Karney, C., Mattiuzzi, M., Mosher, S., Naimi, B., Nowosad, J., Pebesma, E., Lamigueiro, O. P., Racine, E. B., Rowlingson, B., Shortridge, A., Venables, B., and Wueest, R.: Raster: Geographic Data Analysis and Modeling, R package version 3.5-11, https://cran.r-project.org/web/packages/raster (last access: 10 March 2023), 2021.
Jin, L., Chen, F., Morrill, C., Otto-Bliesner, B. L., and Rosenbloom, N.: Causes of early Holocene desertification in arid central Asia, Clim. Dynam., 38, 1577–1591, https://doi.org/10.1007/s00382-011-1086-1, 2012.
Juggins, S.: Quantitative reconstructions in palaeolimnology: new paradigm or sick science?, Quaternary Sci. Rev., 64, 20–32, https://doi.org/10.1016/j.quascirev.2012.12.014, 2013.
Kaufman, D., McKay, N., Routson, C., Erb, M., Davis, B., Heiri, O., Jaccard, S., Tierney, J., Dätwyler, C., Axford, Y., Brussel, T., Cartapanis, O., Chase, B., Dawson, A., de Vernal, A., Engels, S., Jonkers, L., Marsicek, J., Moffa-Sánchez, P., Morrill, C., Orsi, A., Rehfeld, K., Saunders, K., Sommer, P. S., Thomas, E., Tonello, M., Tóth, M., Vachula, R., Andreev, A., Bertrand, S., Biskaborn, B., Bringué, M., Brooks, S., Caniupán, M., Chevalier, M., Cwynar, L., Emile-Geay, J., Fegyveresi, J., Feurdean, A., Finsinger, W., Fortin, M.-C., Foster, L., Fox, M., Gajewski, K., Grosjean, M., Hausmann, S., Heinrichs, M., Holmes, N., Ilyashuk, B., Ilyashuk, E., Juggins, S., Khider, D., Koinig, K., Langdon, P., Larocque-Tobler, I., Li, J., Lotter, A., Luoto, T., Mackay, A., Magyari, E., Malevich, S., Mark, B., Massaferro, J., Montade, V., Nazarova, L., Novenko, E., Pařil, P., Pearson, E., Peros, M., Pienitz, R., Płóciennik, M., Porinchu, D., Potito, A., Rees, A., Reinemann, S., Roberts, S., Rolland, N., Salonen, S., Self, A., Seppä, H., Shala, S., St-Jacques, J.-M., Stenni, B., Syrykh, L., Tarrats, P., Taylor, K., van den Bos, V., Velle, G., Wahl, E., Walker, I., Wilmshurst, J., Zhang, E., and Zhilich, S.: A global database of Holocene paleotemperature records, Sci. Data, 7, 115, https://doi.org/10.1038/s41597-020-0445-3, 2020a.
Kaufman, D., McKay, N., Routson, C., Erb, M., Dätwyler, C., Sommer, P. S., Heiri, O., and Davis, B.: Holocene global mean surface temperature, a multi-method reconstruction approach, Sci. Data, 7, 201, https://doi.org/10.1038/s41597-020-0530-7, 2020b.
Kaufman, D. S. and Broadman, E.: Revisiting the Holocene global temperature conundrum, Nature, 614, 425–435, https://doi.org/10.1038/s41586-022-05536-w, 2023.
Kubota, Y., Tada, R., and Kimoto, K.: Changes in East Asian summer monsoon precipitation during the Holocene deduced from a freshwater flux reconstruction of the Changjiang (Yangtze River) based on the oxygen isotope mass balance in the northern East China Sea, Clim. Past, 11, 265–281, https://doi.org/10.5194/cp-11-265-2015, 2015.
Kutzbach, J. E.: Monsoon Climate of the Early Holocene: Climate Experiment with the Earth's Orbital Parameters for 9000 Years Ago, Science, 214, 59–61, https://doi.org/10.1126/science.214.4516.59, 1981.
Ladd, M., Way, R. G., and Viau, A. E.: The impact of using different modern climate data sets in pollen-based paleoclimate reconstructions of North America, Quaternary Sci. Rev., 112, 78–85, https://doi.org/10.1016/j.quascirev.2015.01.020, 2015.
Leipe, C., Nakagawa, T., Gotanda, K., Müller, S., and Tarasov, P. E.: Late Quaternary vegetation and climate dynamics at the northern limit of the East Asian summer monsoon and its regional and global-scale controls, Quaternary Sci. Rev., 116, 57–71, https://doi.org/10.1016/j.quascirev.2015.03.012, 2015.
Li, C., Postl, A. K., Böhmer, T., Cao, X., Dolman, A. M., and Herzschuh, U.: Harmonized chronologies of a global late Quaternary pollen dataset (LegacyAge 1.0), Earth Syst. Sci. Data, 14, 1331–1343, https://doi.org/10.5194/essd-14-1331-2022, 2022.
Li, J., Wang, N., Dodson, J., Yan, H., Zhang, X., Jia, P. W., and Seppä, H.: Holocene negative coupling of summer temperature and moisture availability over southeastern arid Central Asia, Clim. Dynam., 55, 1187–1208, https://doi.org/10.1007/s00382-020-05319-x, 2020.
Liu, Z., Wen, X., Brady, E. C., Otto-Bliesner, B., Yu, G., Lu, H., Cheng, H., Wang, Y., Zheng, W., Ding, Y., Edwards, R. L., Cheng, J., Liu, W., and Yang, H.: Chinese cave records and the East Asia Summer Monsoon, Quaternary Sci. Rev., 83, 115–128, https://doi.org/10.1016/j.quascirev.2013.10.021, 2014a.
Liu, Z., Yoshimura, K., Bowen, G. J., Buenning, N. H., Risi, C., Welker, J. M., and Yuan, F.: Paired oxygen isotope records reveal modern North American atmospheric dynamics during the Holocene, Nat. Commun., 5, 3701, https://doi.org/10.1038/ncomms4701, 2014b.
Liu, Z., Zhu, J., Rosenthal, Y., Zhang, X., Otto-Bliesner, B. L., Timmermann, A., Smith, R. S., Lohmann, G., Zheng, W., and Timm, O. E.: The Holocene temperature conundrum, P. Natl. Acad. Sci., 111, E3501–E3505, https://doi.org/10.1073/pnas.1407229111, 2014c.
Lohmann, G., Wagner, A., and Prange, M.: Resolution of the atmospheric model matters for the Northern Hemisphere Mid-Holocene climate, Dyn. Atmos. Oceans, 93, 101206, https://doi.org/10.1016/j.dynatmoce.2021.101206, 2021.
Marcott, S. A., Shakun, J. D., Clark, P. U., and Mix, A. C.: A Reconstruction of Regional and Global Temperature for the Past 11 300 Years, Science, 339, 1198–1201, https://doi.org/10.1126/science.1228026, 2013.
Marsicek, J., Shuman, B. N., Bartlein, P. J., Shafer, S. L., and Brewer, S.: Reconciling divergent trends and millennial variations in Holocene temperatures, Nature, 554, 92–96, https://doi.org/10.1038/nature25464, 2018.
Mauri, A., Davis, B. A. S., Collins, P. M., and Kaplan, J. O.: The influence of atmospheric circulation on the mid-Holocene climate of Europe: a data–model comparison, Clim. Past, 10, 1925–1938, https://doi.org/10.5194/cp-10-1925-2014, 2014.
Mauri, A., Davis, B. A. S., Collins, P. M., and Kaplan, J. O.: The climate of Europe during the Holocene: a gridded pollen-based reconstruction and its multi-proxy evaluation, Quaternary Sci. Rev., 112, 109–127, https://doi.org/10.1016/j.quascirev.2015.01.013, 2015.
McKay, N. P., Kaufman, D. S., Routson, C. C., Erb, M. P., and Zander, P. D.: The Onset and Rate of Holocene Neoglacial Cooling in the Arctic, Geophys. Res. Lett., 45, 12487–12496, https://doi.org/10.1029/2018GL079773, 2018.
Melles, M., Brigham-Grette, J., Minyuk, P. S., Nowaczyk, N. R., Wennrich, V., DeConto, R. M., Anderson, P. M., Andreev, A. A., Coletti, A., Cook, T. L., Haltia-Hovi, E., Kukkonen, M., Lozhkin, A. V., Rosén, P., Tarasov, P., Vogel, H., and Wagner, B.: 2.8 Million years of Arctic climate change from Lake Elgygytgyn, NE Russia, Science, 337, 315–320, https://doi.org/10.1126/science.1222135, 2012.
Nakagawa, T., Tarasov, P. E., Nishida, K., Gotanda, K., and Yasuda, Y.: Quantitative pollen-based climate reconstruction in central Japan: application to surface and Late Quaternary spectra, Quaternary Sci. Rev., 21, 2099–2113, https://doi.org/10.1016/S0277-3791(02)00014-8, 2002.
Nolan, C., Tipton, J., Booth, R. K., Hooten, M. B., and Jackson, S. T.: Comparing and improving methods for reconstructing peatland water-table depth from testate amoebae, Holocene, 29, 1350–1361, https://doi.org/10.1177/0959683619846969, 2019.
Osman, M. B., Tierney, J. E., Zhu, J., Tardif, R., Hakim, G. J., King, J., and Poulsen, C. J.: Globally resolved surface temperatures since the Last Glacial Maximum, Nature, 599, 239–244, https://doi.org/10.1038/s41586-021-03984-4, 2021.
R Core Team: R: A language and environment for statistical computing, R Foundation for Statistical Computing, Vienna, Austria, https://www.r-project.org/ (last access: 10 March 2023), 2020.
Renssen, H., Seppä, H., Heiri, O., Roche, D. M., Goosse, H., and Fichefet, T.: The spatial and temporal complexity of the Holocene thermal maximum, Nat. Geosci., 2, 411–414, https://doi.org/10.1038/ngeo513, 2009.
Renssen, H., Seppä, H., Crosta, X., Goosse, H., and Roche, D. M.: Global characterization of the Holocene Thermal Maximum, Quaternary Sci. Rev., 48, 7–19, https://doi.org/10.1016/j.quascirev.2012.05.022, 2012.
Reschke, M., Kunz, T., and Laepple, T.: Comparing methods for analysing time scale dependent correlations in irregularly sampled time series data, Comput. Geosci., 123, 65–72, https://doi.org/10.1016/j.cageo.2018.11.009, 2019.
Rolandone, F., Mareschal, J.-C., and Jaupart, C.: Temperatures at the base of the Laurentide Ice Sheet inferred from borehole temperature data, Geophys. Res. Lett., 30, 1944, https://doi.org/10.1029/2003GL018046, 2003.
Routson, C. C., McKay, N. P., Kaufman, D. S., Erb, M. P., Goosse, H., Shuman, B. N., Rodysill, J. R., and Ault, T.: Mid-latitude net precipitation decreased with Arctic warming during the Holocene, Nature, 568, 83–87, https://doi.org/10.1038/s41586-019-1060-3, 2019.
Routson, C. C., Kaufman, D. S., McKay, N. P., Erb, M. P., Arcusa, S. H., Brown, K. J., Kirby, M. E., Marsicek, J. P., Anderson, R. S., Jiménez-Moreno, G., Rodysill, J. R., Lachniet, M. S., Fritz, S. C., Bennett, J. R., Goman, M. F., Metcalfe, S. E., Galloway, J. M., Schoups, G., Wahl, D. B., Morris, J. L., Staines-Urías, F., Dawson, A., Shuman, B. N., Gavin, D. G., Munroe, J. S., and Cumming, B. F.: A multiproxy database of western North American Holocene paleoclimate records, Earth Syst. Sci. Data, 13, 1613–1632, https://doi.org/10.5194/essd-13-1613-2021, 2021.
Salonen, J. S., Korpela, M., Williams, J. W., and Luoto, M.: Machine-learning based reconstructions of primary and secondary climate variables from North American and European fossil pollen data, Sci. Rep., 9, 15805, https://doi.org/10.1038/s41598-019-52293-4, 2019.
Seager, R., Neelin, D., Simpson, I., Liu, H., Henderson, N., Shaw, T., Kushnir, Y., Ting, M., and Cook, B.: Dynamical and Thermodynamical Causes of Large-Scale Changes in the Hydrological Cycle over North America in Response to Global Warming, J. Climate, 27, 7921–7948, https://doi.org/10.1175/JCLI-D-14-00153.1, 2014.
Shin, S.-I., Sardeshmukh, P. D., Webb, R. S., Oglesby, R. J., and Barsugli, J. J.: Understanding the Mid-Holocene Climate, J. Climate, 19, 2801–2817, https://doi.org/10.1175/JCLI3733.1, 2006.
Simpson, G. L.: Analogue Methods in Palaeolimnology, in: Tracking Environmental Change Using Lake Sediments, vol. 5: Data Handling and Numerical Techniques, edited by: Birks, H. J. B., Lotter, A. F., Juggins, S., and Smol, J. P., Springer Netherlands, Dordrecht, 495–522, https://doi.org/10.1007/978-94-007-2745-8_15, 2012.
Stebich, M., Rehfeld, K., Schlütz, F., Tarasov, P. E., Liu, J., and Mingram, J.: Holocene vegetation and climate dynamics of NE China based on the pollen record from Sihailongwan Maar Lake, Quaternary Sci. Rev., 124, 275–289, https://doi.org/10.1016/j.quascirev.2015.07.021, 2015.
Tarasov, P. E., Bezrukova, E. V., and Krivonogov, S. K.: Late Glacial and Holocene changes in vegetation cover and climate in southern Siberia derived from a 15 kyr long pollen record from Lake Kotokel, Clim. Past, 5, 285–295, https://doi.org/10.5194/cp-5-285-2009, 2009.
Tarasov, P. E., Nakagawa, T., Demske, D., Österle, H., Igarashi, Y., Kitagawa, J., Mokhova, L., Bazarova, V., Okuda, M., Gotanda, K., Miyoshi, N., Fujiki, T., Takemura, K., Yonenobu, H., and Fleck, A.: Progress in the reconstruction of Quaternary climate dynamics in the Northwest Pacific: A new modern analogue reference dataset and its application to the 430-kyr pollen record from Lake Biwa, Earth Sci. Rev., 108, 64–79, https://doi.org/10.1016/j.earscirev.2011.06.002, 2011.
Tarasov, P. E., Müller, S., Zech, M., Andreeva, D., Diekmann, B., and Leipe, C.: Last glacial vegetation reconstructions in the extreme-continental eastern Asia: Potentials of pollen and n-alkane biomarker analyses, Quatern. Int., 290–291, 253–263, https://doi.org/10.1016/j.quaint.2012.04.007, 2013.
Telford, R. J. and Birks, H. J. B.: A novel method for assessing the statistical significance of quantitative reconstructions inferred from biotic assemblages, Quaternary Sci. Rev., 30, 1272–1278, https://doi.org/10.1016/j.quascirev.2011.03.002, 2011.
ter Braak, C. J. F. and Juggins, S.: Weighted averaging partial least squares regression (WA-PLS): an improved method for reconstructing environmental variables from species assemblages, Hydrobiologia, 269, 485–502, https://doi.org/10.1007/BF00028046, 1993.
Trenberth, K. E.: Changes in precipitation with climate change, Clim. Res., 47, 123–138, https://doi.org/10.3354/cr00953, 2011.
Wang, N., Jiang, D., and Lang, X.: Mechanisms for Spatially Inhomogeneous Changes in East Asian Summer Monsoon Precipitation during the Mid-Holocene, J. Climate, 33, 2945–2965, https://doi.org/10.1175/JCLI-D-19-0565.1, 2020.
Wang, Y., Liu, X., and Herzschuh, U.: Asynchronous evolution of the Indian and East Asian Summer Monsoon indicated by Holocene moisture patterns in monsoonal central Asia, Earth Sci. Rev., 103, 135–153, https://doi.org/10.1016/j.earscirev.2010.09.004, 2010.
Wang, Y., Bekeschus, B., Handorf, D., Liu, X., Dallmeyer, A., and Herzschuh, U.: Coherent tropical-subtropical Holocene see-saw moisture patterns in the Eastern Hemisphere monsoon systems, Quaternary Sci. Rev., 169, 231–242, https://doi.org/10.1016/j.quascirev.2017.06.006, 2017.
Whitmore, J., Gajewski, K., Sawada, M., Williams, J. W., Shuman, B., Bartlein, P. J., Minckley, T., Viau, A. E., Webb, T., Shafer, S., Anderson, P., and Brubaker, L.: Modern pollen data from North America and Greenland for multi-scale paleoenvironmental applications, Quaternary Sci. Rev., 24, 1828–1848, https://doi.org/10.1016/j.quascirev.2005.03.005, 2005.
Williams, J. W., Webb III, T., Richard, P. H., and Newby, P.: Late Quaternary biomes of Canada and the eastern United States, J. Biogeogr., 27, 585–607, https://doi.org/10.1046/j.1365-2699.2000.00428.x, 2000.
Williams, J. W., Grimm, E. C., Blois, J. L., Charles, D. F., Davis, E. B., Goring, S. J., Graham, R. W., Smith, A. J., Anderson, M., Arroyo-Cabrales, J., Ashworth, A. C., Betancourt, J. L., Bills, B. W., Booth, R. K., Buckland, P. I., Curry, B. B., Giesecke, T., Jackson, S. T., Latorre, C., Nichols, J., Purdum, T., Roth, R. E., Stryker, M., and Takahara, H.: The Neotoma Paleoecology Database, a multiproxy, international, community-curated data resource, Quatern. Res., 89, 156–177, https://doi.org/10.1017/qua.2017.105, 2018.
Xu, C., Yan, M., Ning, L., and Liu, J.: Summer Westerly Jet in Northern Hemisphere during the Mid-Holocene: A Multi-Model Study, Atmosphere, 11, 1193, https://doi.org/10.3390/atmos11111193, 2020.
Zanon, M., Davis, B. A. S., Marquer, L., Brewer, S., and Kaplan, J. O.: European Forest Cover During the Past 12,000 Years: A Palynological Reconstruction Based on Modern Analogs and Remote Sensing, Front. Plant Sci., 9, 253, https://doi.org/10.3389/fpls.2018.00253, 2018.
Zhang, J., Chen, F., Holmes, J. A., Li, H., Guo, X., Wang, J., Li, S., Lü, Y., Zhao, Y., and Qiang, M.: Holocene monsoon climate documented by oxygen and carbon isotopes from lake sediments and peat bogs in China: a review and synthesis, Quaternary Sci. Rev., 30, 1973–1987, https://doi.org/10.1016/j.quascirev.2011.04.023, 2011.
Zhang, Y., Renssen, H., and Seppä, H.: Effects of melting ice sheets and orbital forcing on the early Holocene warming in the extratropical Northern Hemisphere, Clim. Past, 12, 1119–1135, https://doi.org/10.5194/cp-12-1119-2016, 2016.
Zhang, Z., Liu, J., Chen, J., Chen, S., Shen, Z., Chen, J., Liu, X., Wu, D., Sheng, Y., and Chen, F.: Holocene climatic optimum in the East Asian monsoon region of China defined by climatic stability, Earth Sci. Rev., 212, 103450, https://doi.org/10.1016/j.earscirev.2020.103450, 2021.
Zheng, W., Wu, B., He, J., and Yu, Y.: The East Asian Summer Monsoon at mid-Holocene: results from PMIP3 simulations, Clim. Past, 9, 453–466, https://doi.org/10.5194/cp-9-453-2013, 2013.
Zhou, P., Shi, Z., Li, X., and Zhou, W.: Response of Westerly Jet Over the Northern Hemisphere to Astronomical Insolation During the Holocene, Front. Earth Sci., 8, 282, https://doi.org/10.3389/feart.2020.00282, 2020.