the Creative Commons Attribution 4.0 License.
the Creative Commons Attribution 4.0 License.
 | 18 Jul 2023
The weather diaries of the Kirch family: Leipzig, Guben, and Berlin (1677–1774)
Stefan Brönnimann
Yuri Brugnara
Astronomer and calendar maker Gottfried Kirch was a keen weather observer and made weather notes in his diary starting in 1677 in Leipzig. In parallel, his second wife Maria Margaretha Winkelmann started a weather diary in 1700 in Berlin. The diaries also contain instrumental measurements of temperature and later pressure. After the death of Gottfried in 1710 and Maria Margaretha in 1720, observations were continued by their son Christfried and then for another 44 years by their daughter Christine. The last measurements date to 1774. Together, the diaries span almost a century of weather observations. The instrumental measurements constitute the oldest part of Germany's longest temperature series, which was however only available as monthly means up to now. Here we publish the imaged diaries, together amounting to 10 445 images. Further, we present the digitized instrumental series, which will serve as the starting point for a new, daily Berlin series. By comparing the series to neighbouring records, we show that the pressure data are reliable in a quantitative sense, whereas this is true for the temperature data only in a qualitative sense as the temperature scale was not converted.
- Article
(8087 KB) - Full-text XML
-
Supplement
(1884 KB) - BibTeX
- EndNote


Long historical climate records are invaluable to better understand variations in climate and the underlying mechanisms. For a long time, the emphasis was on monthly or seasonal averages, and long meteorological series were often only available in that form. Recently, changes in weather patterns and extremes came into focus. New tools such as reanalyses (e.g. Slivinski et al., 2019) or analogue approaches (Pappert et al., 2022) now allow daily weather to be reconstructed, from which important conclusions can be drawn about decadal to multidecadal variations in weather as well as extreme weather (Brönnimann, 2022). However, many of the long series are not available at daily or sub-daily resolution (i.e. the individual measurements), but rather only as monthly means. It is therefore often required to revisit archives, image and digitize the sub-daily data, and start the homogenization processes anew.
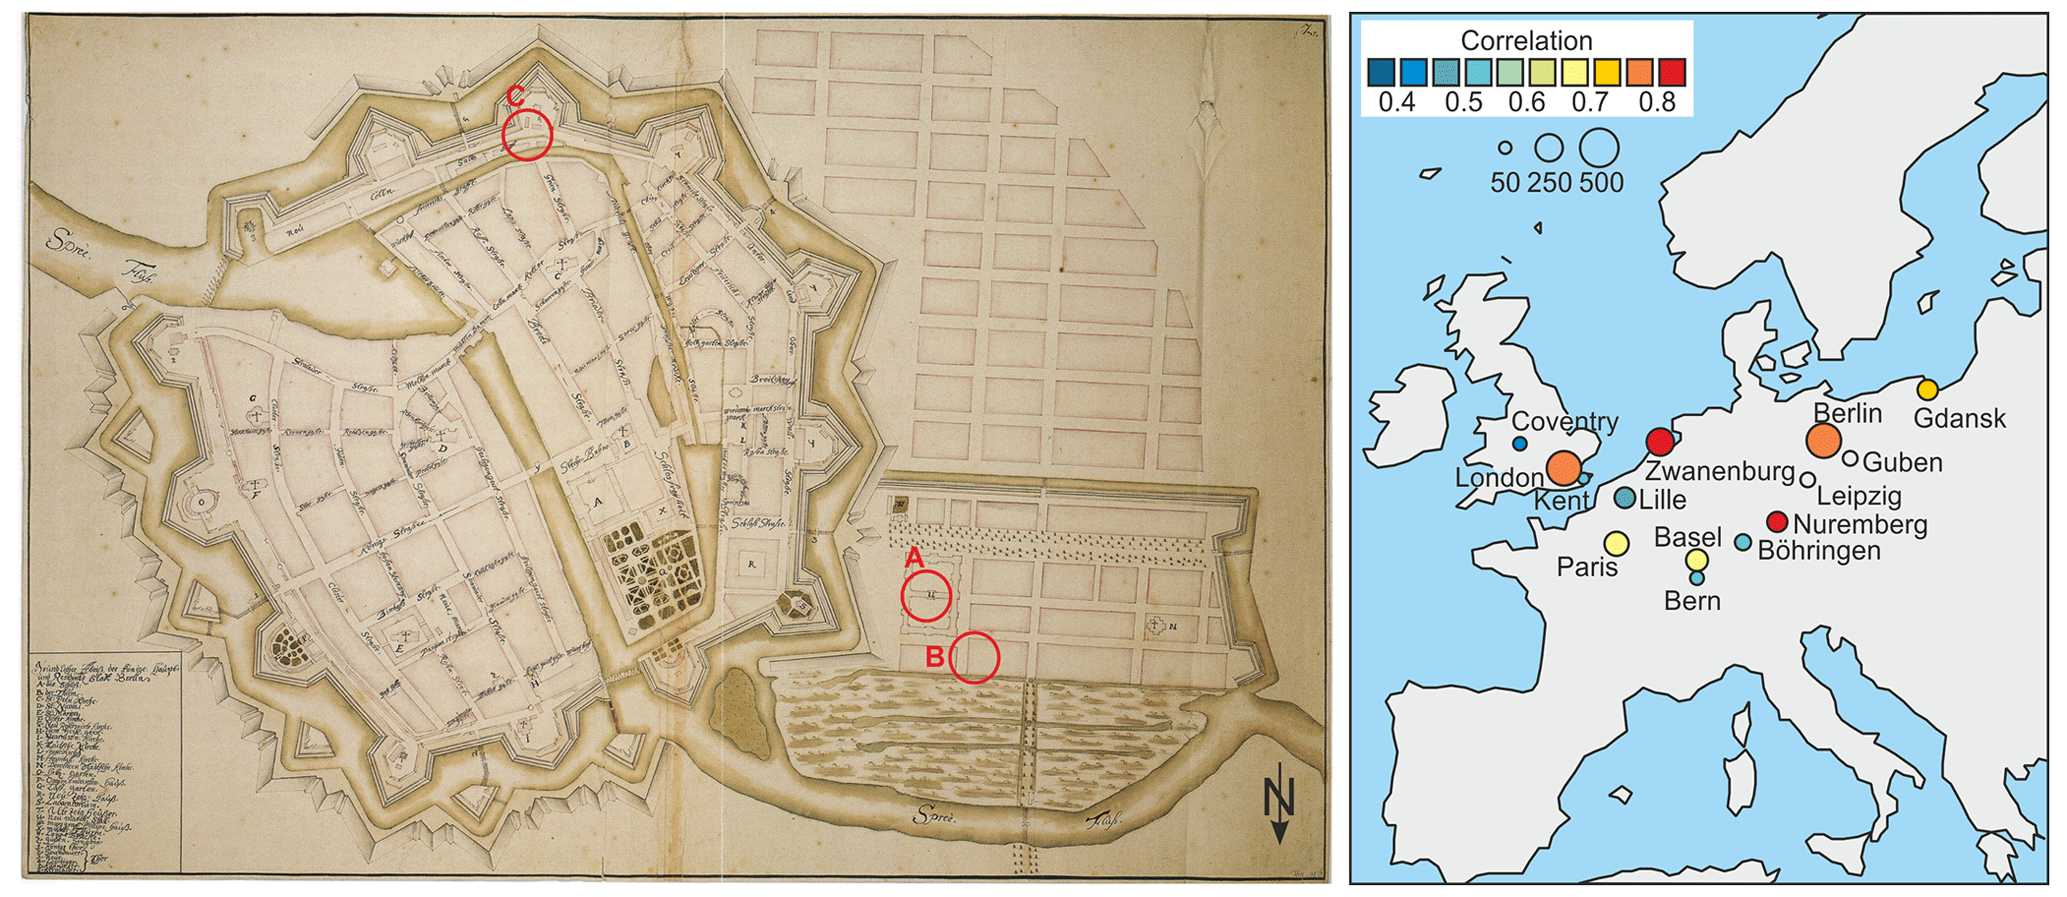
Figure 1Left: map of Berlin in 1712. A: astronomical observatory. B: apartment of the Kirch family until 1712 and from 1716 onward (“Astronomenhaus”). C: house of Baron von Krosigk, where Maria Margaretha observed from 1712–1714 (from map Grundlicher Abriß, der königl. Haupt- und Residenz Stadt Berlin, unknown author, public domain, Wikimedia Commons). Right: locations of other weather observations in the Kirch diaries (Berlin and empty circles) and other locations, coloured according to the Pearson correlation of their pressure records with the Kirch measurements (Berlin, 1730–1770) in the overlapping period (circle area indicates the number of measurements n). For Berlin, the circle shows the correlation with the reconstruction EKF400v2.
In this paper, we present the work of imaging, digitizing, and processing for the case of the longest German record, that from Berlin, which goes back to 1701. Specifically we analyse the weather diary of the Kirch family, covering 1677–1774, which contains some instrumental observations in 1697 and then from 1701 onward. This record has been widely used since the late 18th century. Karl-Ludwig Gronau compiled the measurements and calculated monthly means (Gronau, 1807), supplementing the sometimes sparse measurements in an unknown way. In the 19th century, Johann Heinrich Mädler continued working on a Berlin series and presented a new, extended series (Mädler, 1825). Hellmann (1893) rediscovered the weather diaries of Maria Margaretha Kirch, Lenke (1964) used the Berlin data in his study on the cold winter of 1708/1709, and Pelz (1978) examined the Kirch diaries. However, most other authors did not consult the original diaries. In the German Democratic Republic, Bahr (1966) worked on the history of the Berlin series in the context of her dissertation. Subsequent work led to the publication of a daily temperature series back to 1766, which was recently digitized by Kadow et al. (2016). In western Germany, Pelz (1997) re-homogenized and published the monthly Berlin series (Cubasch and Kadow, 2010). Still missing are the daily and sub-daily temperature series before 1766. Furthermore, although pressure was also measured, it was never digitized or analysed. Therefore, we revisited the original sources, imaged the diary, and digitized most of the instrumental measurements (both temperature and pressure) contained in the sheets.
The paper is organized as follows. Section 2 provides background about the Kirch family and their meteorological observations. Section 3 describes the diary and its history. In Sect. 4 we describe the digitizing, quality control, and comparison with other sources. Results are presented in Sect. 5, and conclusions are drawn in Sect. 6.
2.1 Life and work
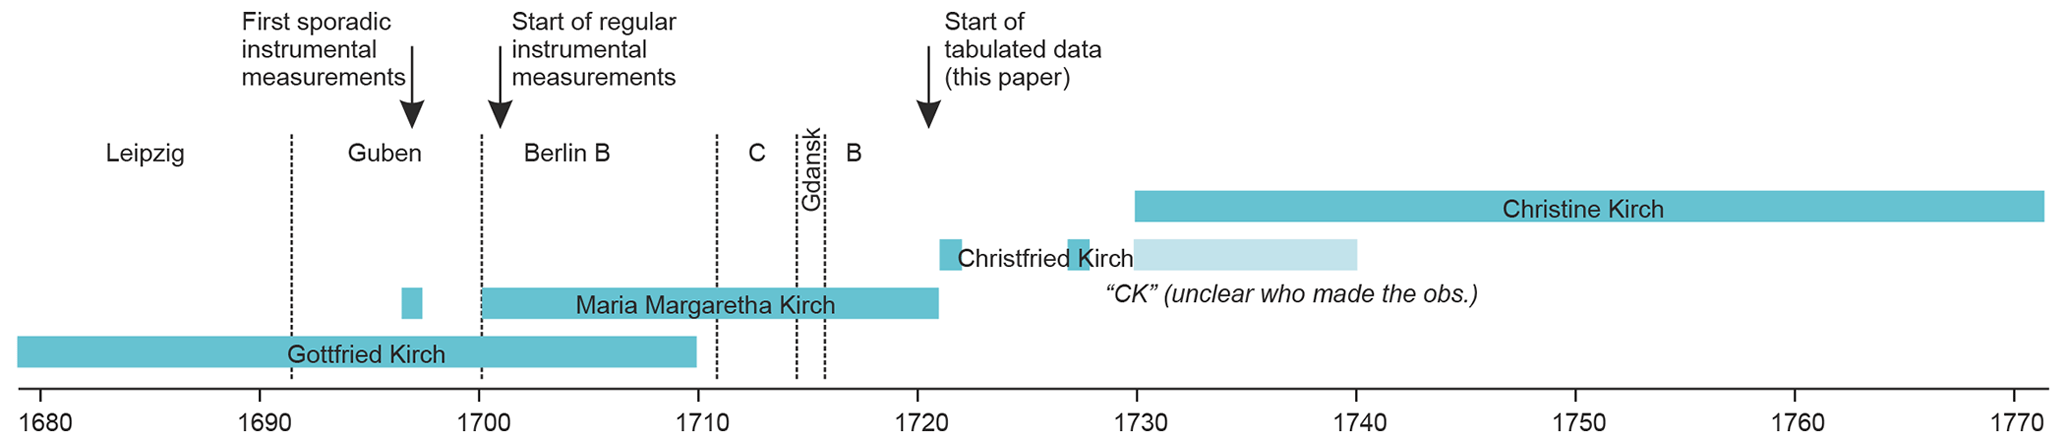
Gottfried Kirch was one of the leading astronomers of the late 17th century. A recent biography (Herbst, 2022) gives a detailed account of his life and work, which is only briefly summarized in the following. Kirch was born in Guben (Fig. 1). In the 1660s he started to publish calendars, which remained an important source of income for the family even after his death. As an astronomer, Kirch became famous in the early 1680s, when he discovered a comet and the star cluster M11. His second wife Maria Margaretha Winkelmann was also an astronomer (but she was not admitted to the University of Halle, to which she applied). She discovered the comet C/1702 H1 and worked on sunspots. Gottfried and Maria Margaretha Kirch had six children, many of whom supported or continued the astronomical and meteorological work. Two of them, Christfried and Christine, had their own weather diaries. Christine was further supported by her sisters Margaretha and Dorothea. Figure 2 show the observers and observation locations on a time axis.
The Kirch family lived in Leipzig from 1676 onward, then moved to Guben in 1692 (Fig. 1). In 1700 Gottfried Kirch was appointed as Royal Astronomer by the newly funded Prussian Academy of Science in Berlin (with Gottfried Wilhelm Leibniz as president). However, the astronomical observatory was not built yet, and for the next 10 years observations were performed in the family's apartment (Fig. 1).
The promised apartment was not ready in 1700, and therefore the family initially stayed at different places. In 1708 they eventually moved into the “Astronomenhaus” at Dorotheenstrasse 10 (Fig. 1). The observatory was just next door (Fig. 3) but was officially opened only in 1711, although observations were made earlier (Siebenhühner, 1996).
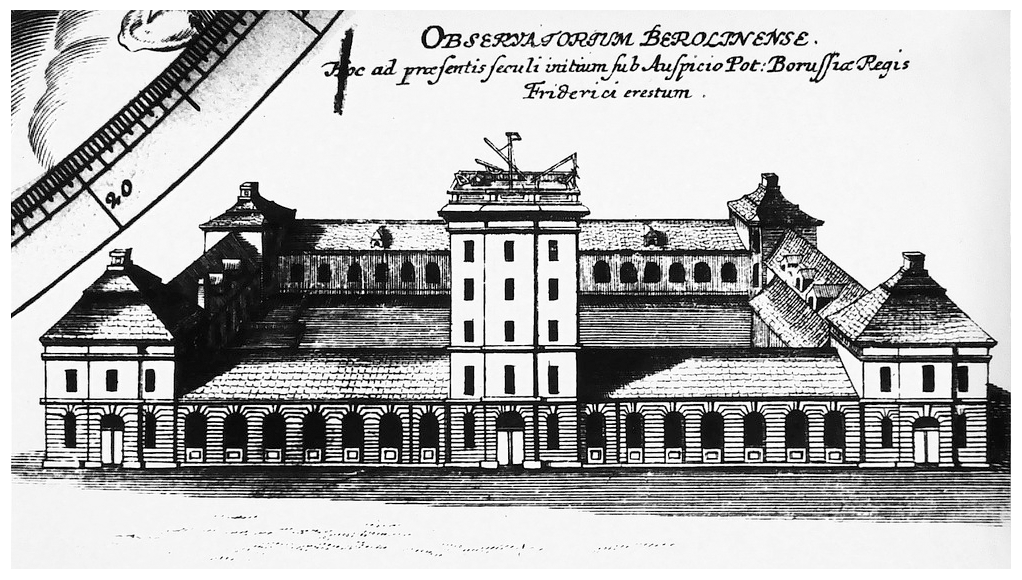
Figure 3The old Berlin astronomical observatory (excerpt from an etching published in the Atlas Coelestis of Johann Gabriel Doppelmayr, 1742, public domain, Wikipedia).
Gottfried Kirch died in 1710. After the death of her husband, Maria Margaretha Kirch and her son Christfried Kirch continued the observations. They decided that Christfried should note the astronomical observations and Maria Margaretha Kirch the weather observations. However, the financial situation became more and more precarious for Maria Margaretha Kirch. Despite her qualification, she could not follow as a director of the observatory but continued to publish the calendars. In 1712, she moved into the house of Baron von Krosigk at Wallstrasse 135 (Fig. 1), where she observed for the next 2 years (however, there was no thermometer). In 1714, she moved to Gdańsk with the children. In 1716, Christfried Kirch became the director of the Berlin observatory, and Maria Margaretha Kirch moved back in with her son at the Astronomenhaus. In 1716 she began to measure again and continued almost until her death on 29 December 1720. The data presented in this article start in 1721 and were presumably all taken at the Astronomenhaus (location B in Fig. 1).
Measurements were continued together by Christfried und Christine Kirch. Christfried died in 1740. Although not officially a member of the Prussian Academy, Christine continued the astronomical observations and was paid by the academy. She also performed meteorological measurements and continued publishing the calendars. Her house was a gathering point for scientists of the 18th century. Leonhard Euler was a frequent visitor, and other guests include Joseph-Nicolas Delisle and Anders Celsius. The last instrumental meteorological measurements date to 30 April 1774. Christine Kirch died in 1782.
2.2 Instruments
Gottfried and Maria Margaretha Kirch had a thermometer (Wetterglas) since 1691. It was a Florentin-type thermometer manufactured by Gottfried Kirch: a glass bulb filled with spirit of wine with a closed tube. However, the thermometer seems to have been broken at some point. The notes clearly speak of an old and a new thermometer, although it is not fully clear when the change took place.
At that time observers made their own temperature scales as there was no agreed-upon scale. According to the description by Kirch, the thermometer had a 60∘ scale. The freezing point was at 20∘, and 40∘ corresponded to a hot summer day. The temperature scale was later analysed by Lenke (1964), who converted the Berlin temperature data for the winter of 1708/1709 to the Celsius scale, though not without difficulties. Later, Christfried und Christine Kirch reportedly used a Fahrenheit thermometer, but the given temperatures are inconsistent with a Fahrenheit scale. Pelz (1978) mentions six different scales that were used in the Kirch diaries, of which only the first one is approximately known.
A barometer was in use since 1709. However, no details are known about the instrument. Likewise, not much is known about the siting of the instruments. According to Lenke (1964), measurements in the Astronomenhaus were made in a north-facing window on the middle floor.
An overview of the weather diaries available for this study is given in Table 1. Gottfried Kirch's diary starts in 1677, when he worked in Leipzig. It contains mostly astronomical observations, but also sporadic weather information that was important for his astronomical observations. Noteworthy is Maria Margaretha's diary, a specific weather diary which starts in August 1700 (plus January to June 1697, containing instrumental measurements made in Guben). The first instrumental measurements in Berlin date to 18 January 1701 (Fig. 4), the day of the coronation of the Prussian King Friedrich I. For several years, the diaries of Gottfried and Maria Margaretha run parallel. The motivation behind the instrumental measurements most likely was checking the calendar (Herbst, 2022).
Table 1Boxes with printouts of the Kirch diaries at the Free University of Berlin, content of the boxes, original archive, and number and availability of microfilms. Note that this table also corresponds to the folder structure in the repository. More information on individual years is given in Pelz (1978).
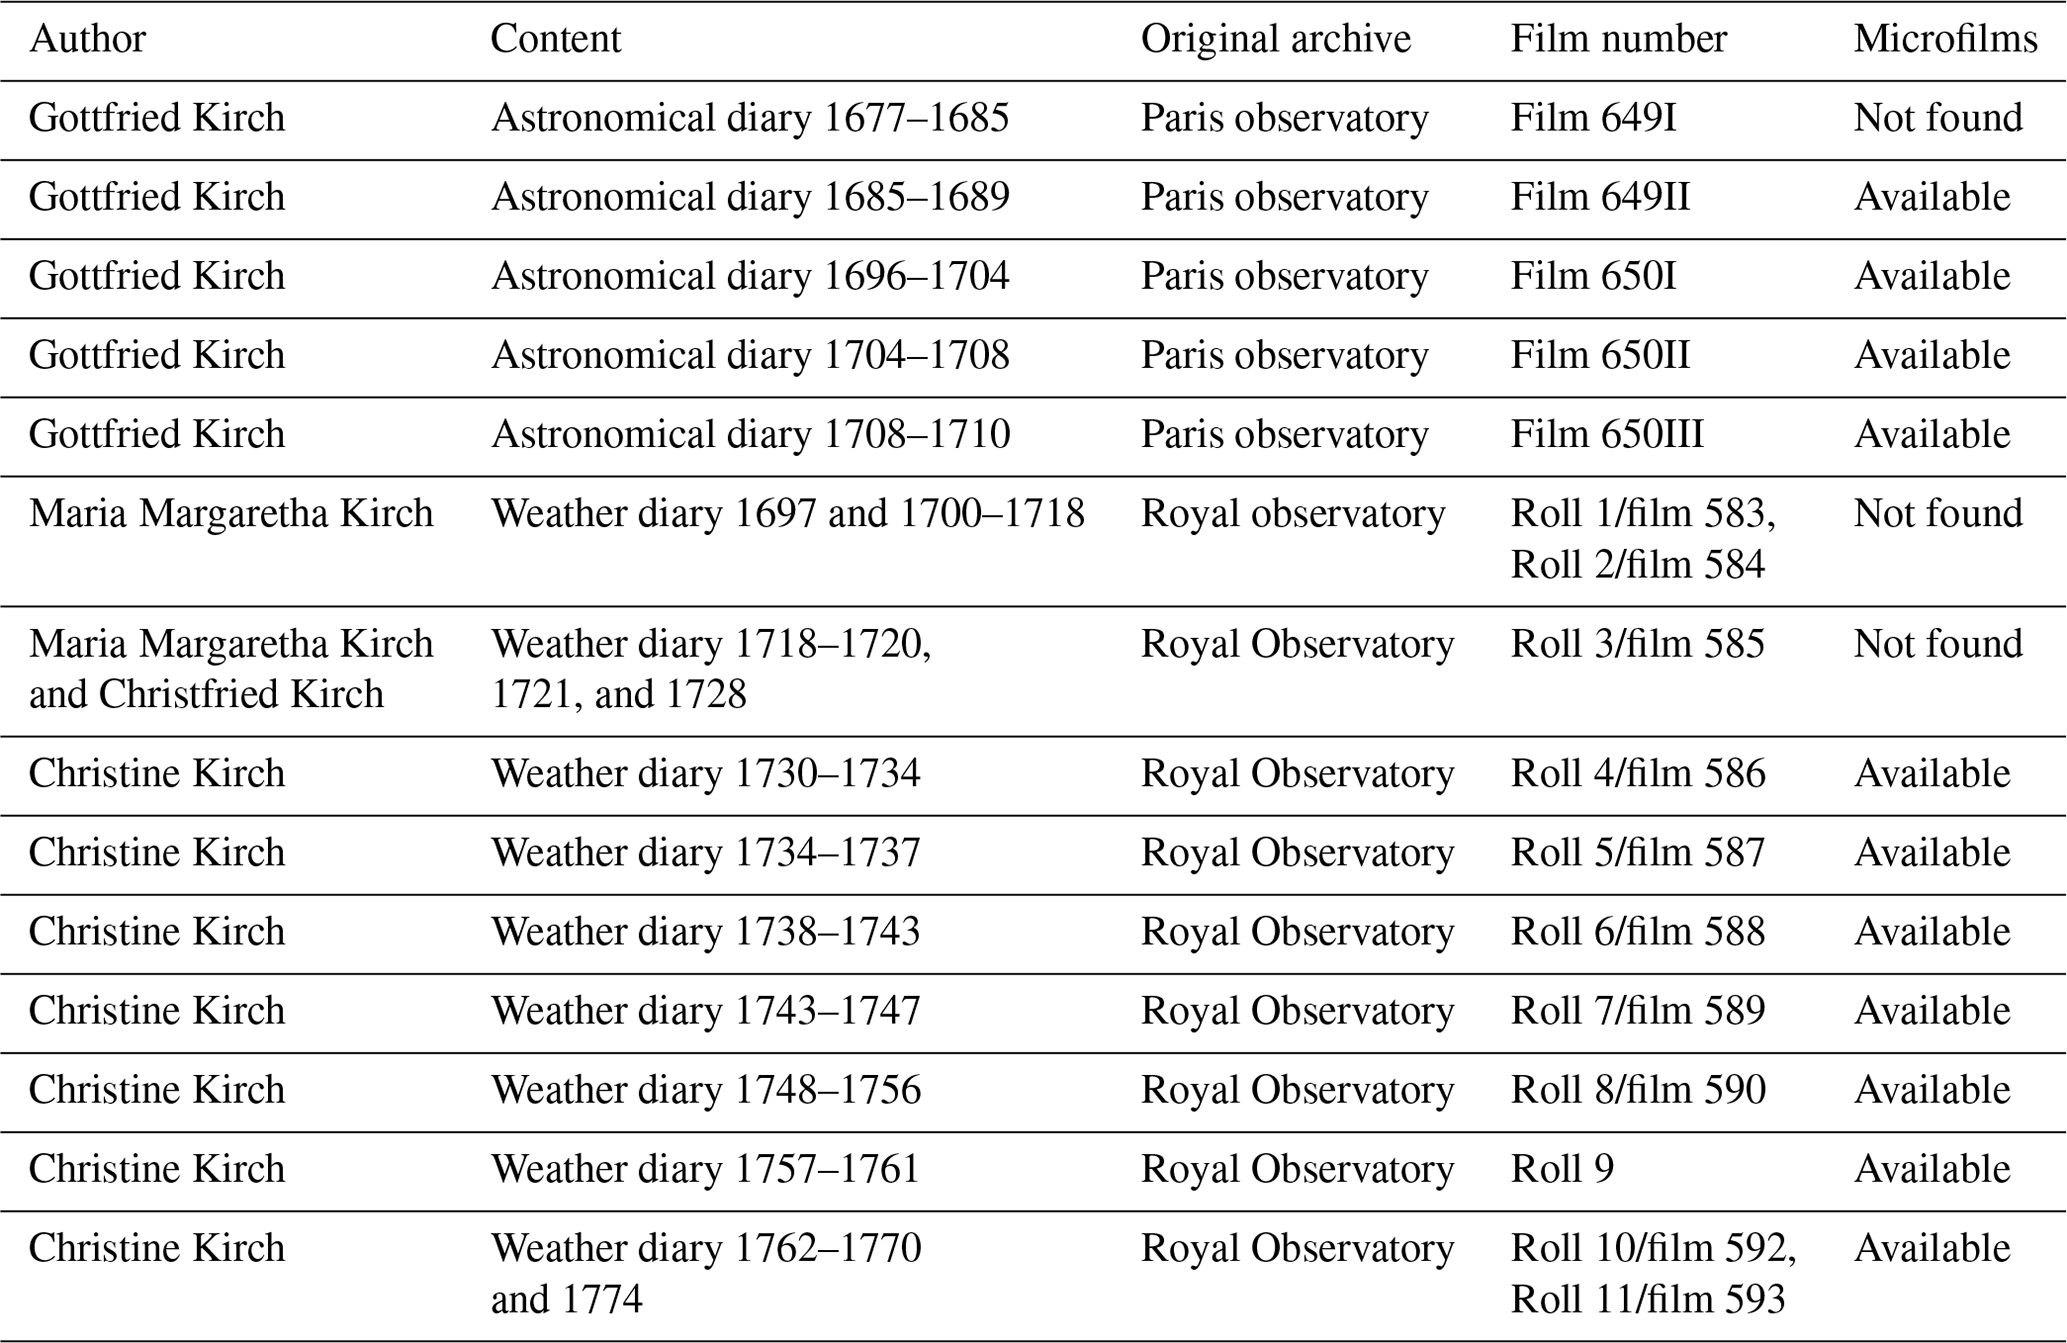
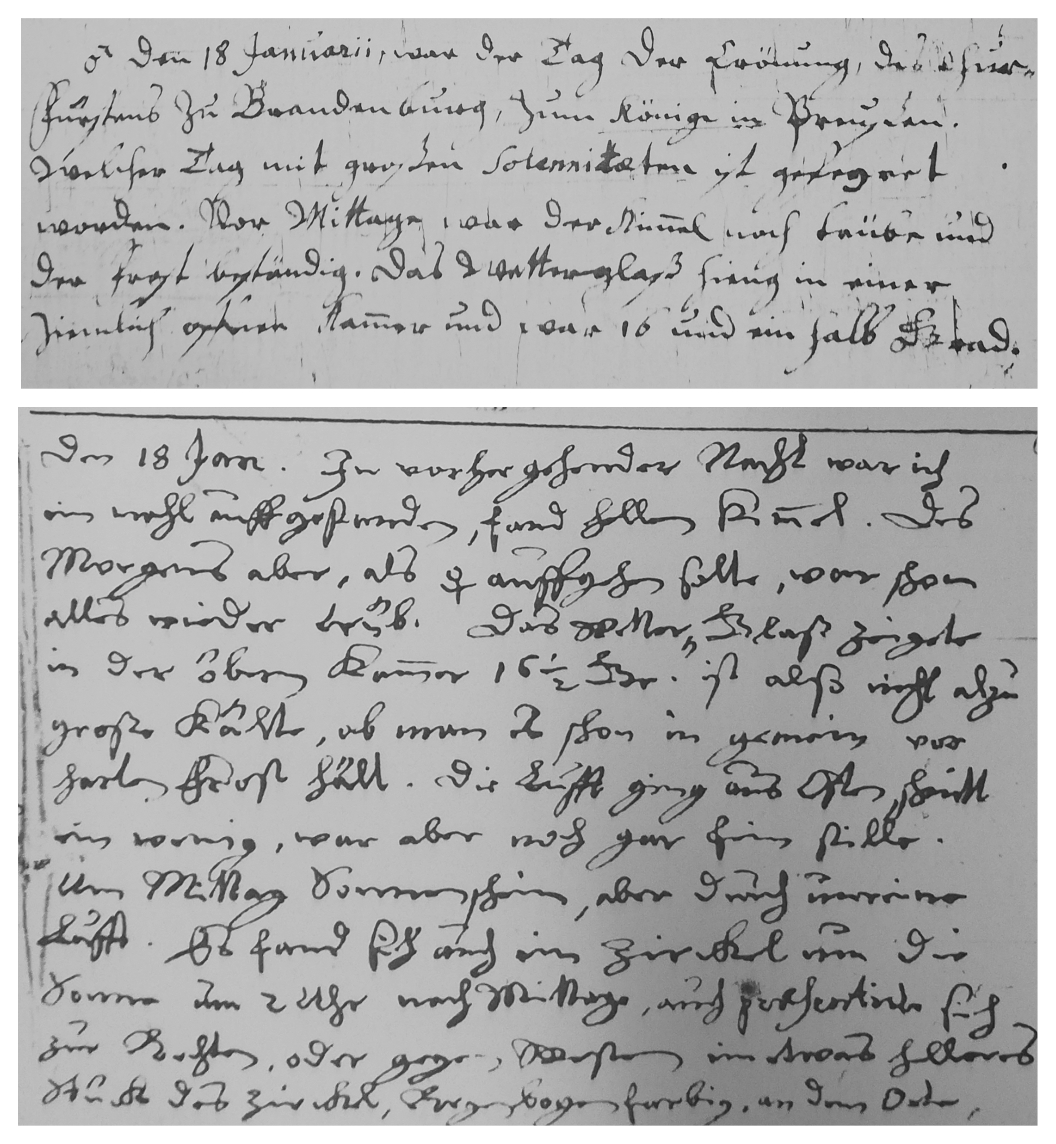
Figure 4First temperature measurement from Berlin on 18 January 1701 from the weather diary of Maria Margaretha Kirch (the Crawford Collection of the Royal Observatory Edinburgh, top) and Gottfried Kirch (Paris observatory, bottom). Both mention that the thermometer was at 16.5 degrees. The last lines of the top excerpt read Das Wetterglas hing in einer ziemlich offenen Kammer und war 16 und ein halb Grad (the weather glass was in an open chamber and was 16 and one-half degrees).
The diaries of both Gottfried and Maria Margaretha end only shortly before their deaths. After 1720, weather data were contained in Christfried's diary, but we only have data for selected years. From 1730 on the weather observations are noted in Christine's diary. Note that an attribution is difficult to make since both signed their observations with “CK”. Most of the observations in our digitized record are from Christine, who was assisted by her sisters. One of the last pages of her diary, from 1770, is displayed in Fig. 5 (there are no entries at all for 1771–1773, and in 1774 there are only entries from January to April).
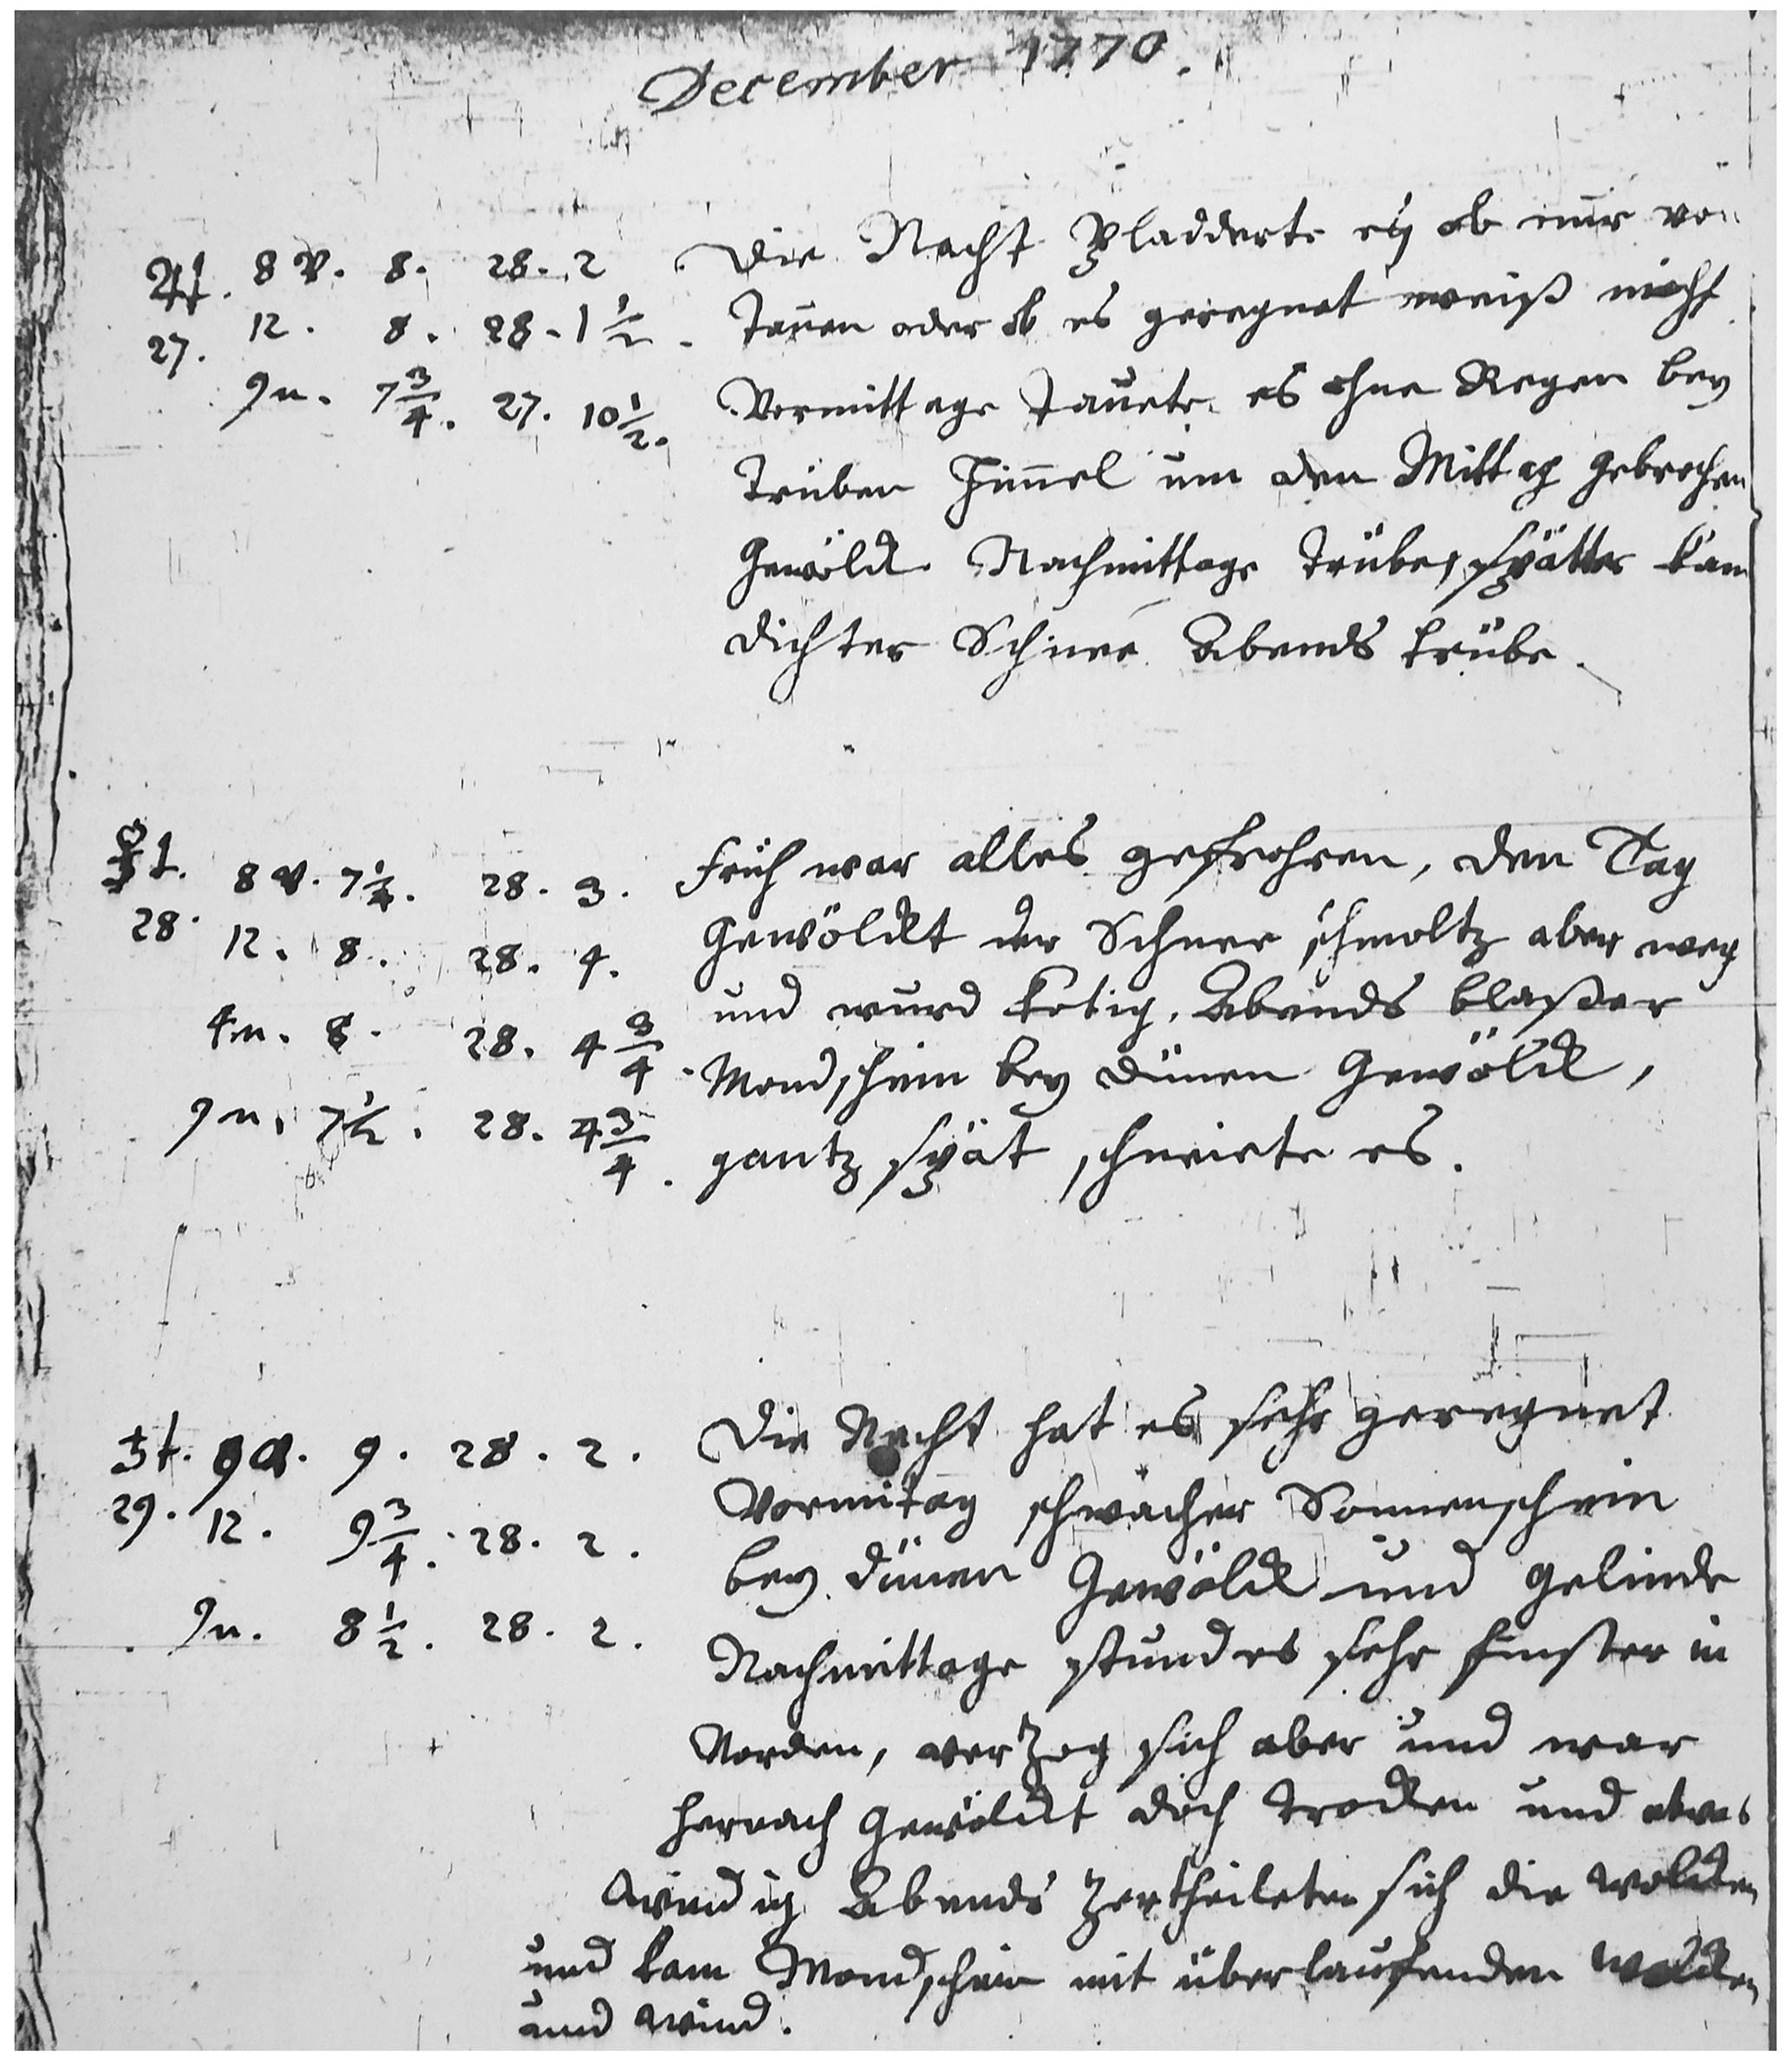
Figure 5Temperature and pressure measurements in 1770 by Christine Kirch (the Crawford Collection of the Royal Observatory Edinburgh).
The diary of Gottfried Kirch was already famous in the 18th century. Several copies must exist. According to Lenke (1964), Joseph-Nicolas Delisle bought Gottfried Kirch's diary from Christine Kirch and gave it to the “Dépôt général de la Marine”. After the French Revolution, the diaries ended up at the Paris observatory, where they remain to the present day. The diaries of Maria Margaretha, Christfried, and Christine Kirch are stored today at the Royal Observatory in Edinburgh. How they ended up there is not known. It seems that for a long time, the location of these diaries was unknown. Hellmann (1893) reports how he searched for them and how they eventually were found in Edinburgh. He then published a transcription of the first years of the diary of Maria Margaretha (Hellmann, 1893).
At the request of the German Weather Service, the Royal Observatory in Edinburgh photographed the Kirch diaries in 1959, and in 1962 the Paris observatory photographed diaries of Gottfried Kirch. In 1977, 16 roles of film were duplicated, and Xerox printouts were made. On this occasion, Pelz (1978) analysed the diaries. The printouts and films are still stored today at the library of the Institute of Meteorology of the Free University of Berlin (Fig. 6). Of the 16 roles of film, only 12 could be found (film 649I of Gottfried Kirch's diary and role nos. 1, 2, and 3 of Maria Margaretha Kirch's diary are missing; see Table 1). Printouts of all films are available.
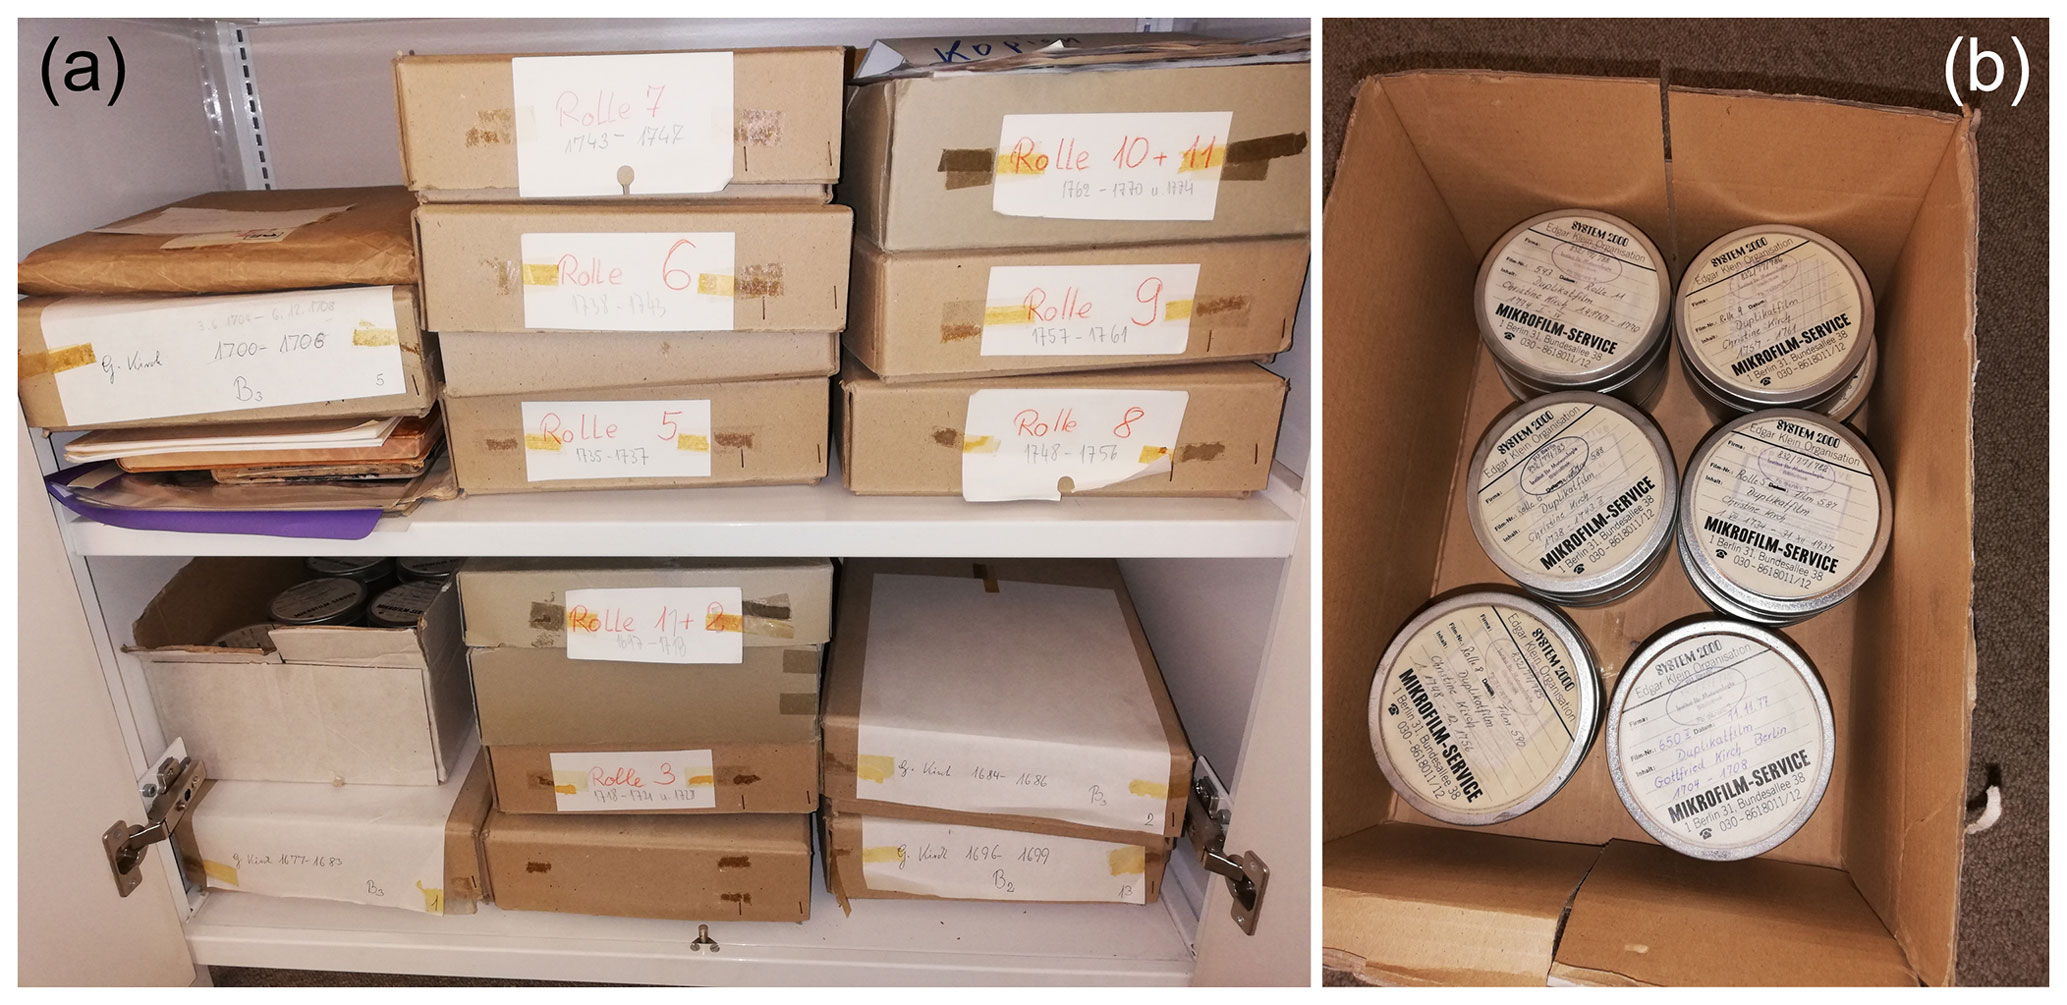
Figure 6(a) The boxes with Xerox printouts photographed at the Free University Berlin. (b) Twelve boxes with microfilms from which the printouts were made.
The printouts were imaged on 6–12 March 2020 by the first author. The paper quality did not allow automatic scanning. Hence the paper sheets were photographed with a handheld smartphone. The impending lockdown due to the COVID pandemic forced us to work quickly. It was decided not to image the part from 1677–1700 since it did not contain instrumental observations, and the ca. 7500 pages from 1700 to 1774 were photographed rather quickly. The imaged data sheets could then be transcribed during the lockdown and following period. In summer 2022, the first author returned to Berlin to also photograph the remaining portion (1677–1700). No data were transcribed from these images; they were merely made to have the diaries imaged in their entirety and to keep the diaries together electronically at one location.
Although first observations already start in the late 17th century, they were often not presented in a tabular form. Measurements were at times quite frequent, but they were often interspersed in the text, as in Fig. 4. Sometimes measurements were organized in tables, but not consistently. We digitized the data only from 1720 onward, when they are presented in a consistently tabular format. The published images accompanying this article also allow digitization of the earlier measurements.
We digitized temperature and pressure measurements. The actual keying work was performed by students of the University of Bern, who received a template and instructions (see spreadsheets in the Supplement; the “Info” tab contains the instructions).
The pressure data were then processed as described in Brugnara et al. (2020) and converted to the station exchange format (SEF; Brunet et al., 2020), except that pressure data could not be corrected to 0 ∘C as no temperature data are available. Temperature was digitized but not converted as the scale is unknown. The quality control (QC) package datarescqc (Brugnara et al., 2019) was used (see also descriptions in Brugnara et al., 2020, and Brunet et al., 2020). When a quality issue was found, this was noted in the “Meta” column of the SEF file (the measurement value itself was not changed). As an example, Fig. 7 shows the digitized tabular data as well as the SEF file for the case of July 1721. The header of the SEF file provides metadata at the station level, including whether the pressure data were temperature-corrected (PTC=N) or gravity-corrected (PGC=Y), and the QC software used. Metadata on the level of individual measurements are indicated in the “Meta” column. In this case, two values are flagged. The information “qc=wmo_time_consistency” means that the pressure change to the next measurement is larger than the threshold recommended by WMO (1993). In this case, the cause is the low value at 23:00 LT (local time) (22:06 UTC), after which pressure jumps back to the previous value. Both jumps are flagged. The conversion from local solar time to UTC does not take into account the equation of time; therefore the difference with UTC is always 54 min.
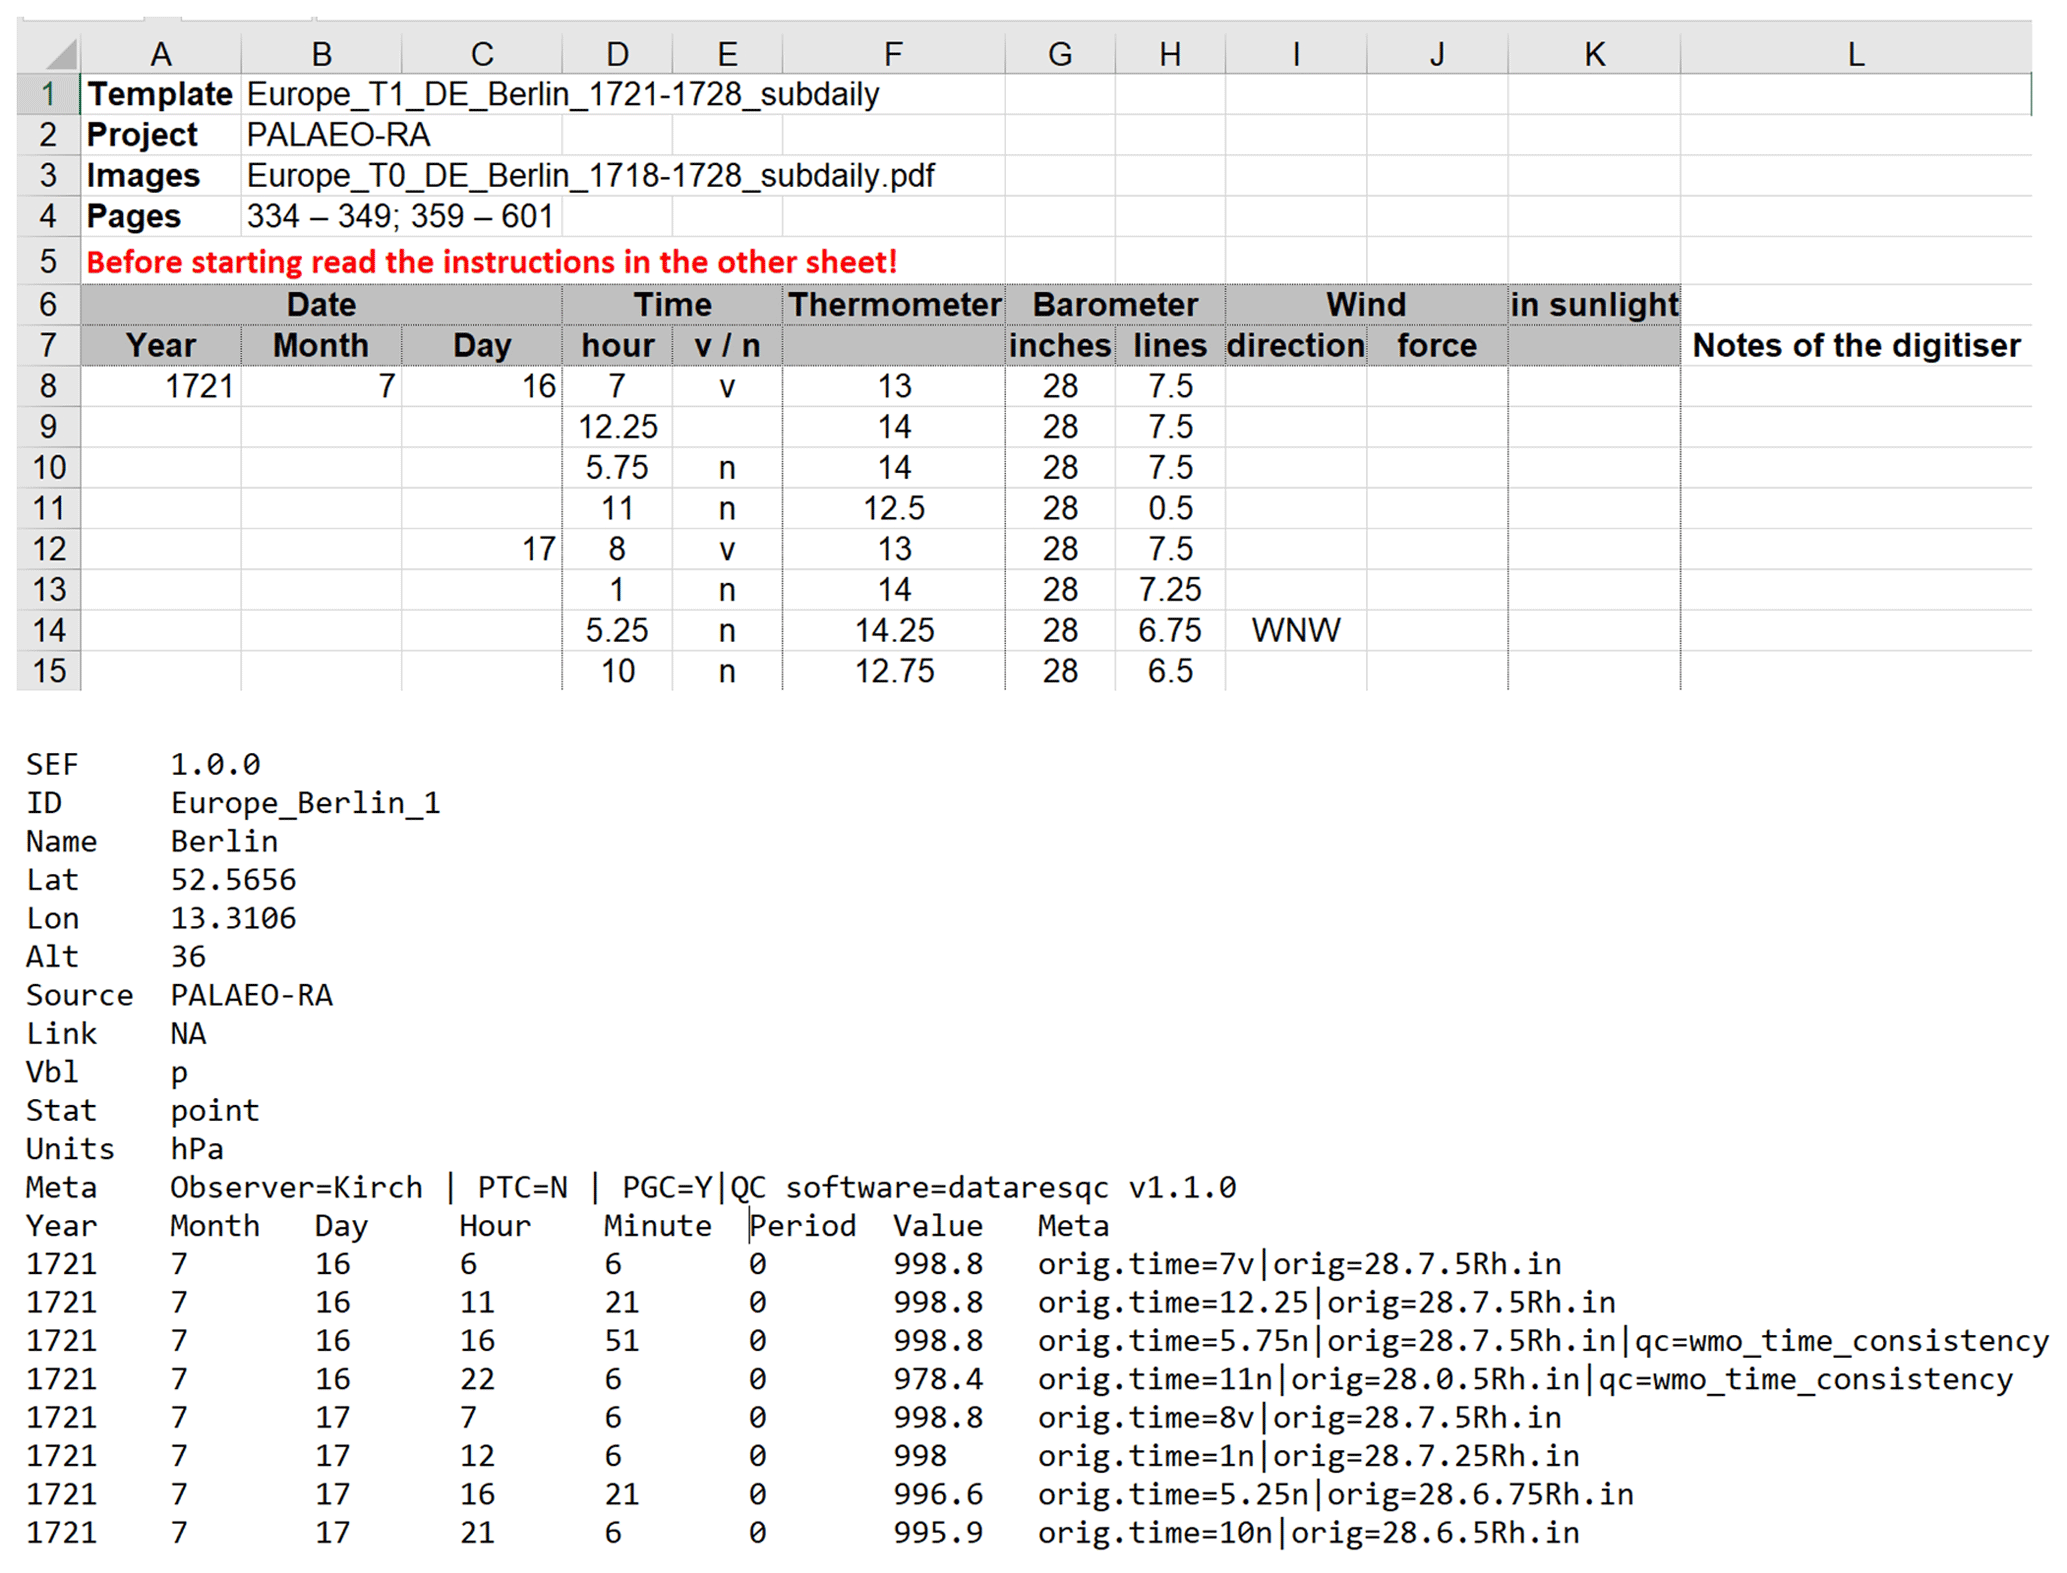
Figure 7Example of the digitized data in the spreadsheet and the corresponding data in SEF format.
The data were submitted to the GLAMOD database of the Copernicus Climate Change Service (Noone et al., 2021). All data, both temperature and pressure, are also published as spreadsheets as a Supplement to this article.
For assessing the Berlin series, we used pressure series from the HCLIM database (Lundstad et al., 2022, 2023). Specifically, we selected monthly data for pressure for all stations in Europe with at least 45 months of overlap. In addition, daily pressure data from Nuremberg were used. Further, we used Gdańsk temperature (in the form of monthly minima and monthly maxima). Finally, we used sea-level pressure from the reconstruction EKF400v2 (Valler et al., 2022) at the grid point closest to Berlin for comparison with the digitized measurements from Berlin (note that Berlin pressure was not used for the reconstruction and hence is independent).
5.1 Digitizing and processing
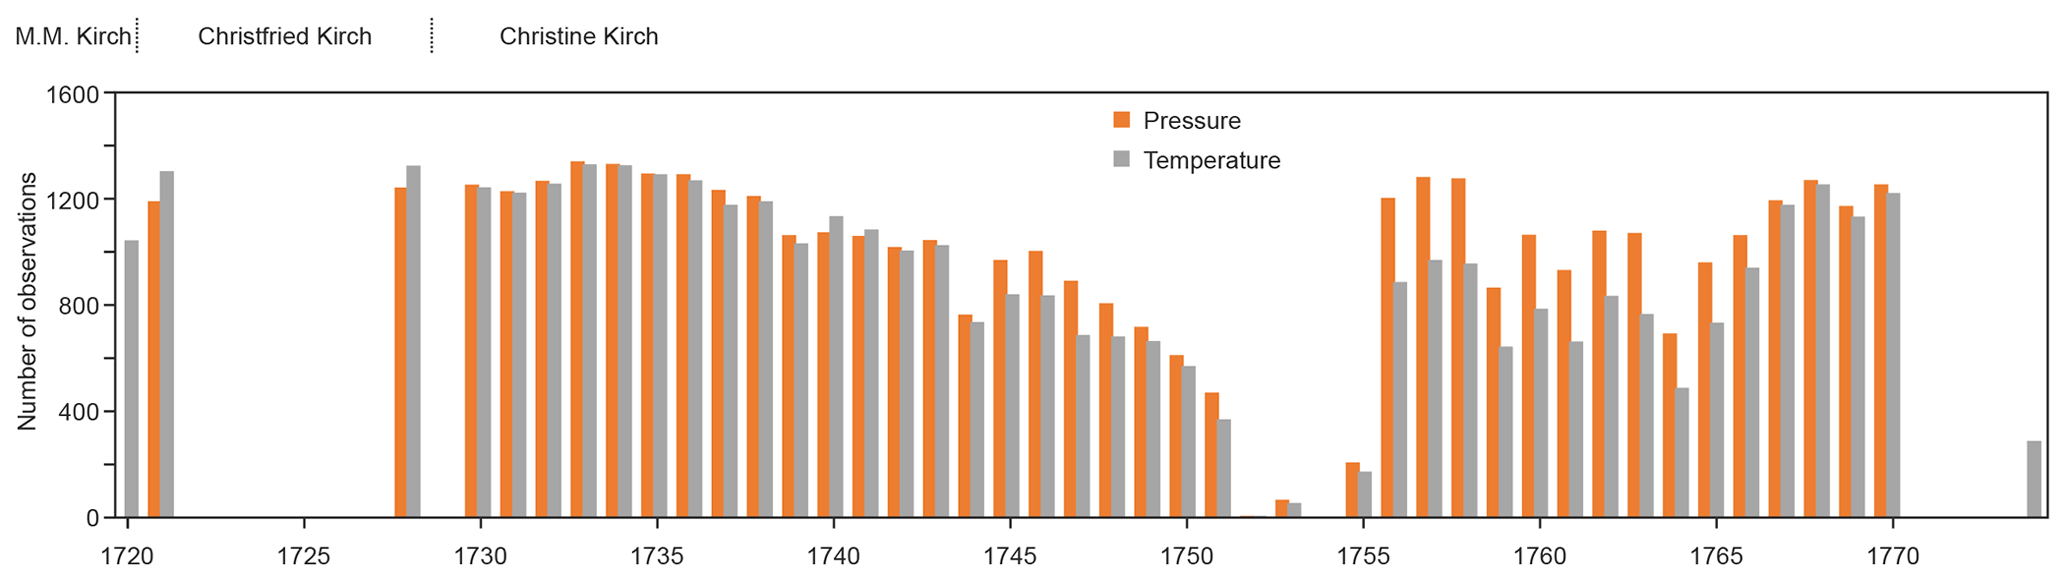
We digitized 42 065 pressure measurements and 39 639 temperature measurements. Of the former, 49 have the flag “wmo_time_consistency”, and two have the flag “duplicate_observation_time”. An overview of the temporal coverage of pressure and temperature data is given in Fig. 8. The data cover the periods 1730 to 1751 and 1756 to 1770 very well, with typically three to four measurements per day. The 1720s and the period 1752–1755 are less well covered. No data are available for the years 1771–1773, and only few pressure measurements are available for 1774.
The time of day of the measurement is always indicated. A histogram of the measurement hours (Fig. 9, top) shows clear peaks, namely between 07:00 and 09:00 UTC, between 11:00 and 12:00 UTC, and between 20:00 and 22:00 UTC. A smaller but distinct peak occurs between 14:00 and 15:00 UTC. Thus, the measurements were taken rather regularly at the usual observing times (local time is approximately 1 h ahead of UTC).
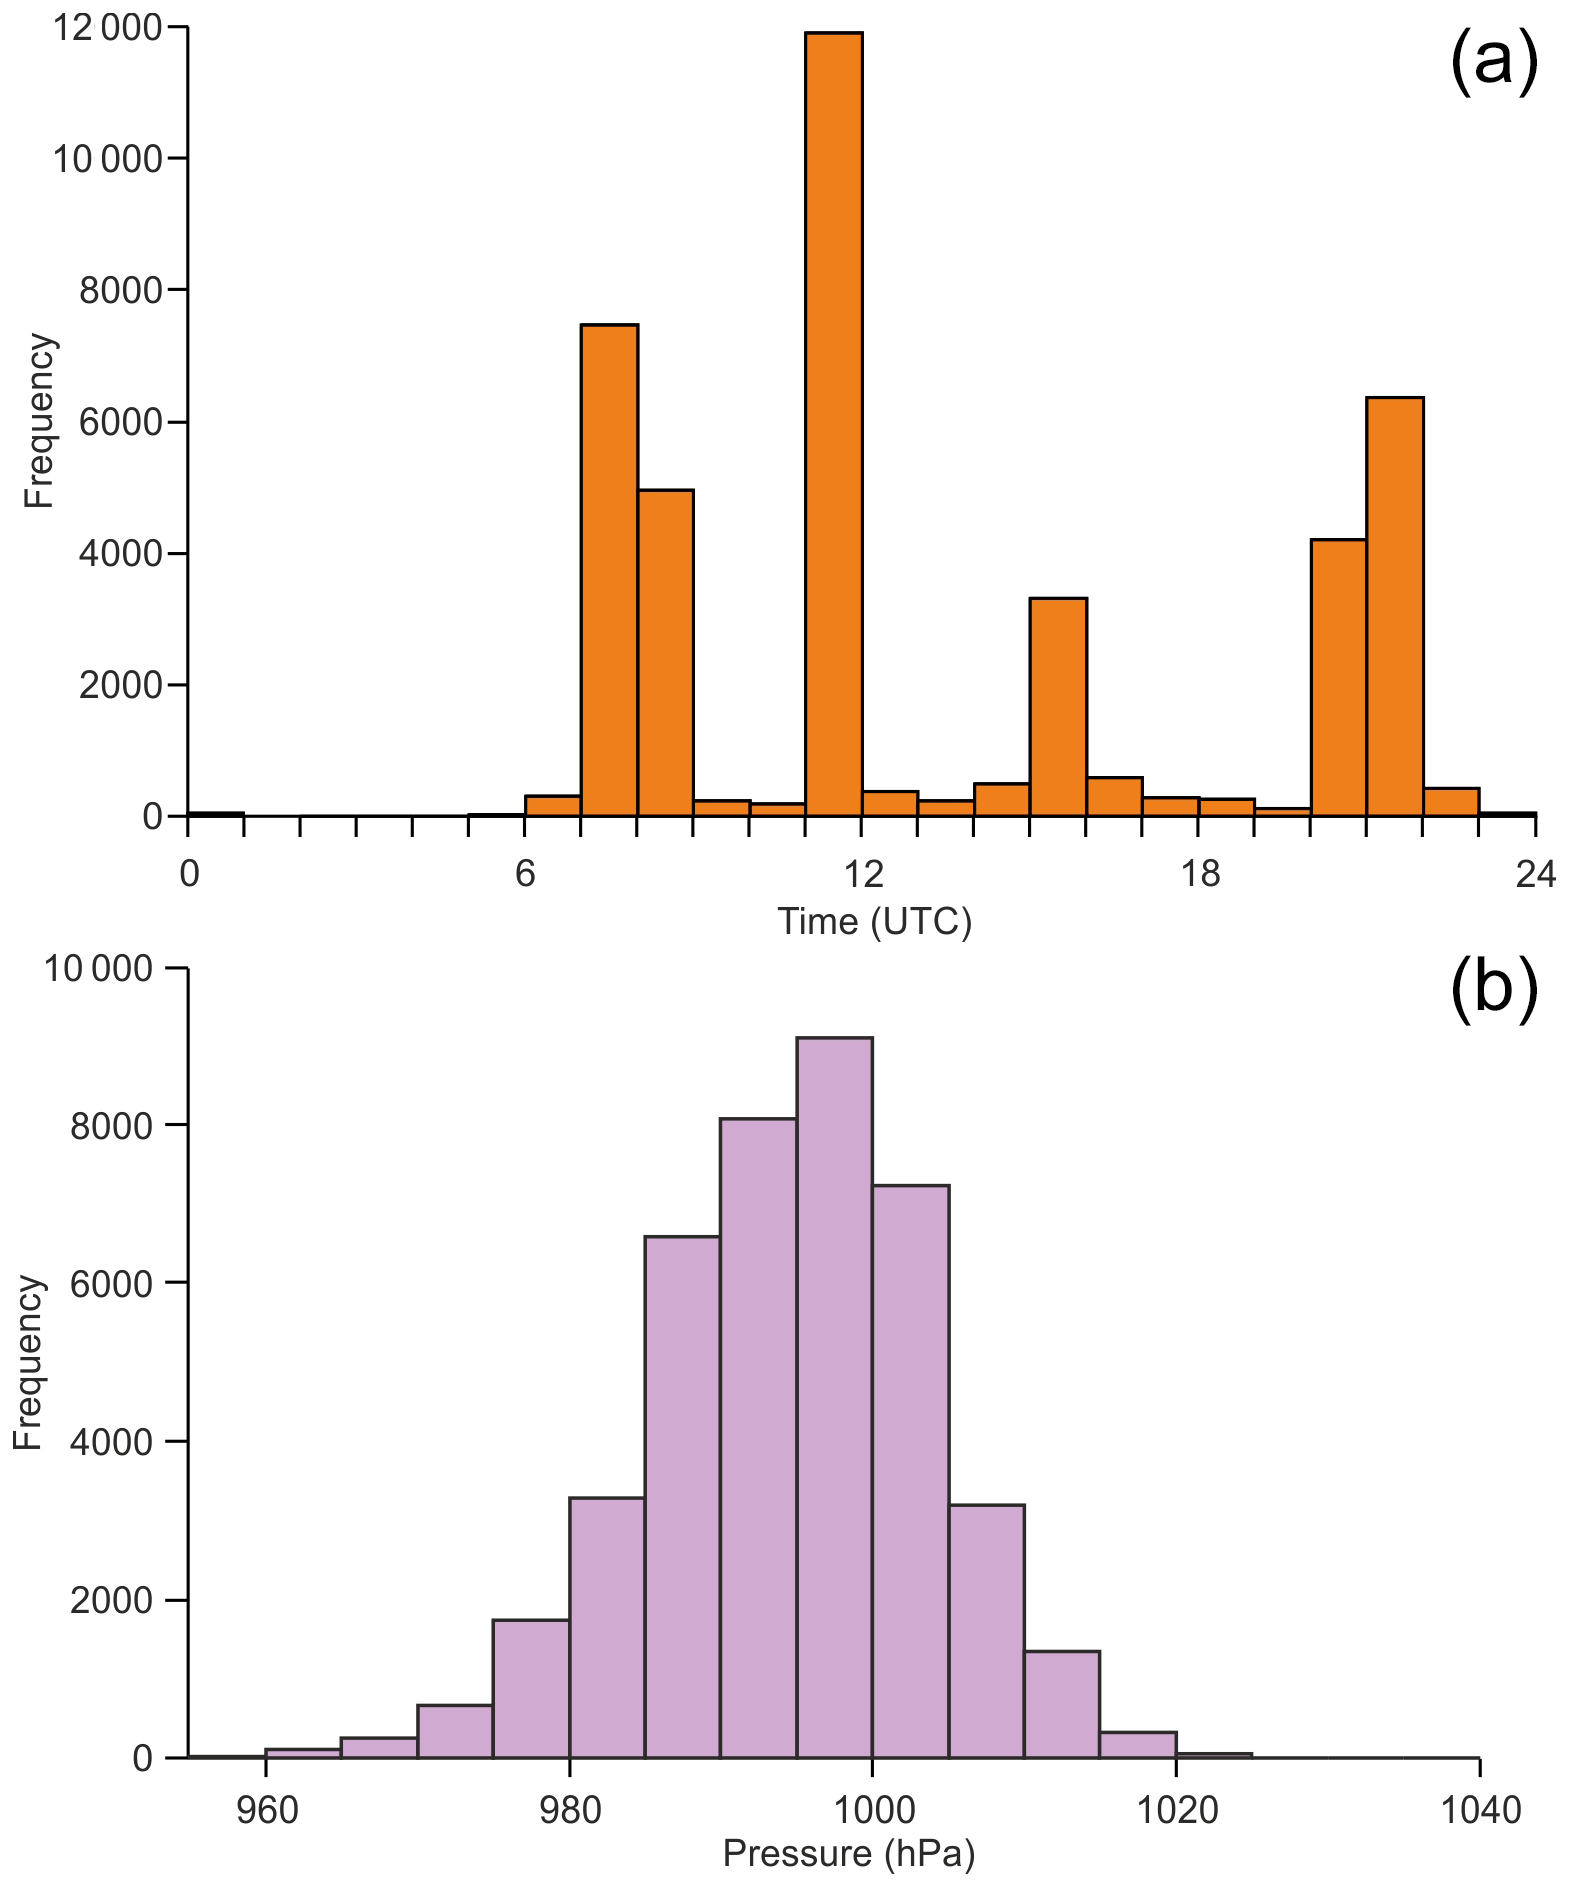
Figure 9(a) Histogram of the time of day (UTC) of measurements. (b) Histogram of pressure measurements.
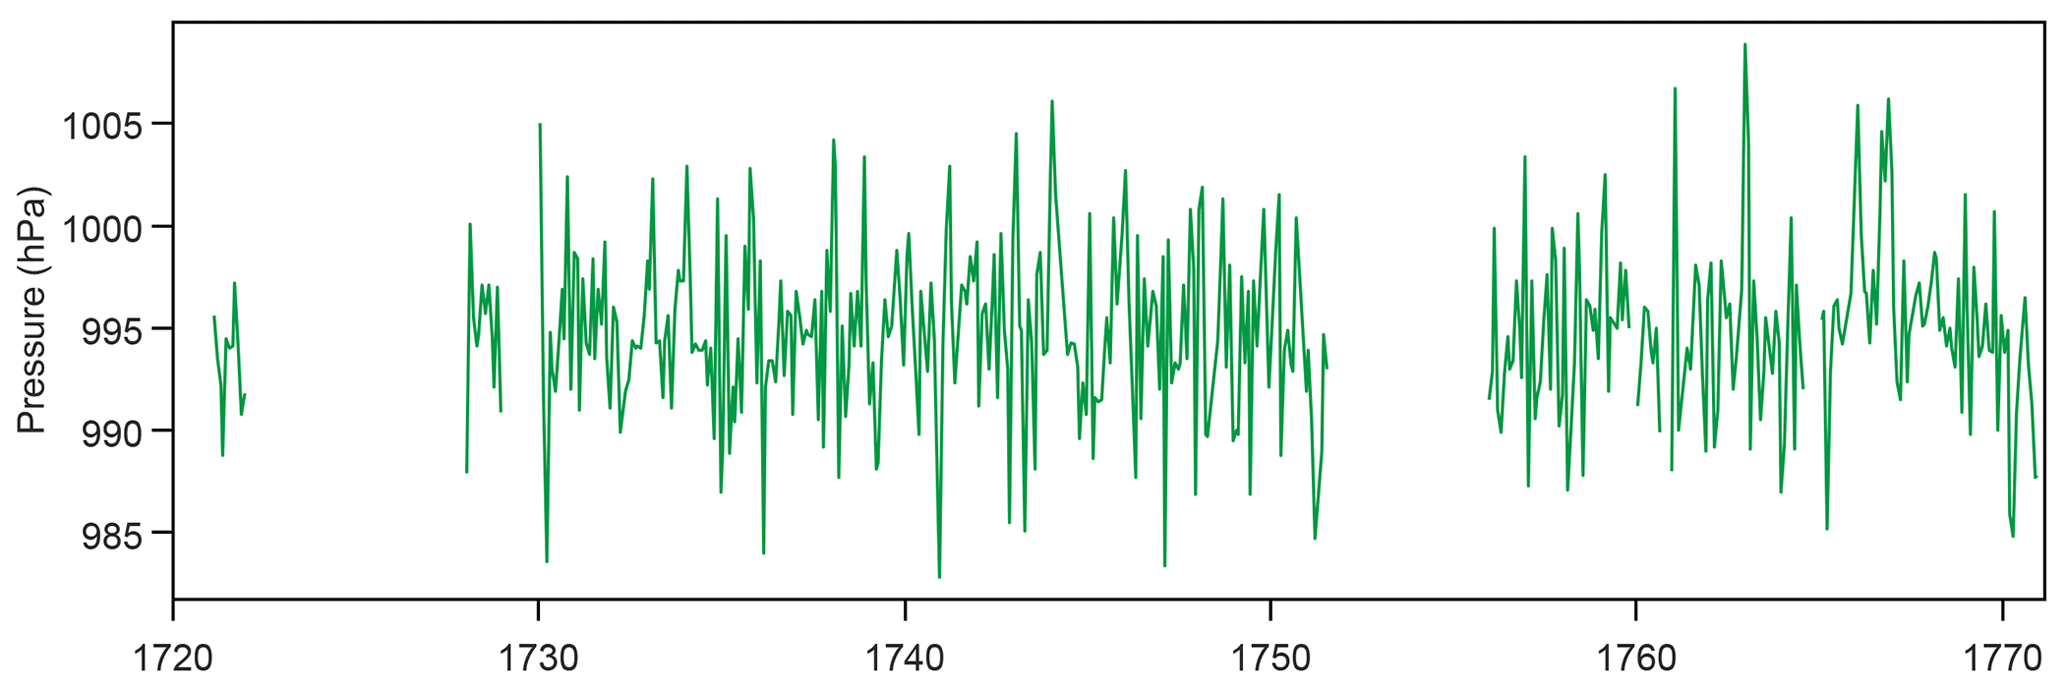
A histogram of all pressure measurements is given in Fig. 9 (bottom). An open question concerns the scale. Pelz (1978) assumes that pressure was not given in the official local scale, Rhineland inches (or Prussian inches, which is the same), as the numbers would otherwise be too low, but in Paris inches. However, assuming Paris inches would lead to numbers that are too high, the difference being 30 hPa. We assumed Rhineland inches, and consequently the average pressure is around 995 hPa, which is too low. We note that homogenization will be necessary to scale the pressure data. That said, the time series of monthly mean pressure (Fig. 10) does not show any obvious systematic change over time.
5.2 Comparison with other sources
First we analysed the pressure data, which we compared with neighbouring series. Correlations on the scale of monthly mean values are shown in Fig. 1 (right). Note that only few series (Paris and London) have been homogenized. Most other series are analysed here in their original form. Nevertheless, results show very high correlations exceeding 0.8 with Nuremberg and Zwanenburg. Also, the correlations at Berlin with EKF400v2 reach almost 0.8, and the correlation with London pressure is in the same range. Somewhat lower but still high correlations (>0.65) are found for Gdańsk, Paris, and Basel. Lower correlations exclusively originate from comparisons with shorter records which are not homogenized and which have not yet been used much in the scientific literature, if at all. Overall this clearly shows that the Berlin pressure data are of high relative quality and thus add information to the existing body of climate data.
5.3 Case study: particularly cold winter of 1739/1740
One of the coldest European winters of the second millennium was 1739/1740 (Schlaak, 1984; Wanner and Luterbacher, 2002; Casty et al., 2005). It exhibits the lowest cold-season temperature of the northern extratropical land areas of the last 3 centuries in a recent reconstruction by Reichen et al. (2002). In fact, results from the spring phenology data from Europe used in that study are summarized in Table 2. Clearly, the spring was extremely late in 1740, although it set the record only in one of the series. In Fig. 11 we present a very simple analysis of daily mean temperature in Berlin from 1738 to 1743. For comparison we also show the monthly minimum and maximum temperatures from Gdańsk, which is over 400 km away. For Berlin, all measurements made on a particular day were averaged without considering possible variations in the time of day of the measurement. Note also that we do not know the scale of temperature, although it is reported that Christfried and Christine Kirch used a Fahrenheit thermometer. The fact that slightly negative values are reached in January 1740 might indicate Fahrenheit temperature (where zero corresponds to −17.8 ∘C), or it might indicate that the liquid dropped below a self-defined scale. The summer values are clearly too low to be degrees Fahrenheit. Despite all these factors and despite the distance between the two sites, we clearly see common variations. For instance, minimum temperatures were low in November 1739, but then high in December 1739 (with high maximum temperatures as well). Then January 1740 had very low minimum temperatures but rather normal maximum temperature.
Table 2Phenological spring data in Europe (from Reichen et al., 2022), rank of the year 1740, and number of years in the record.
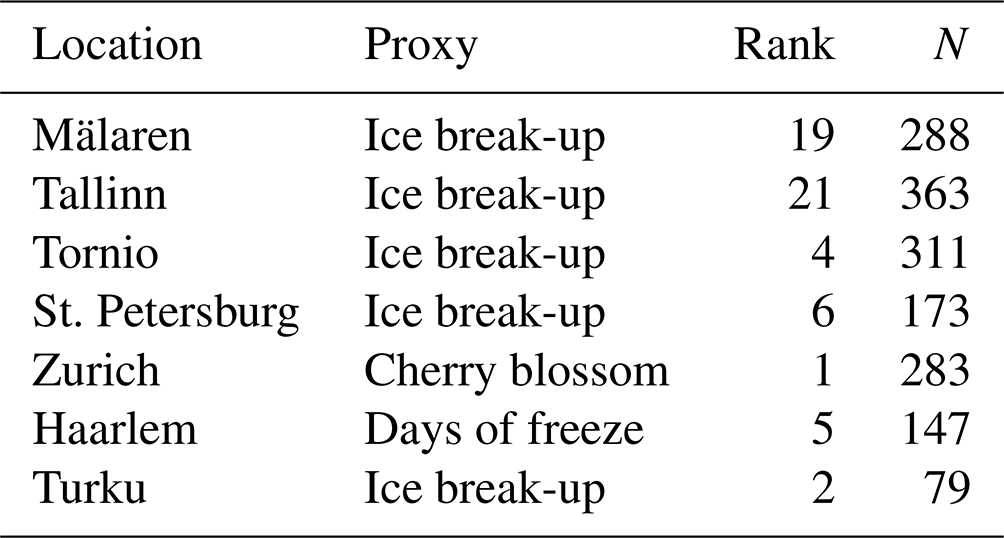
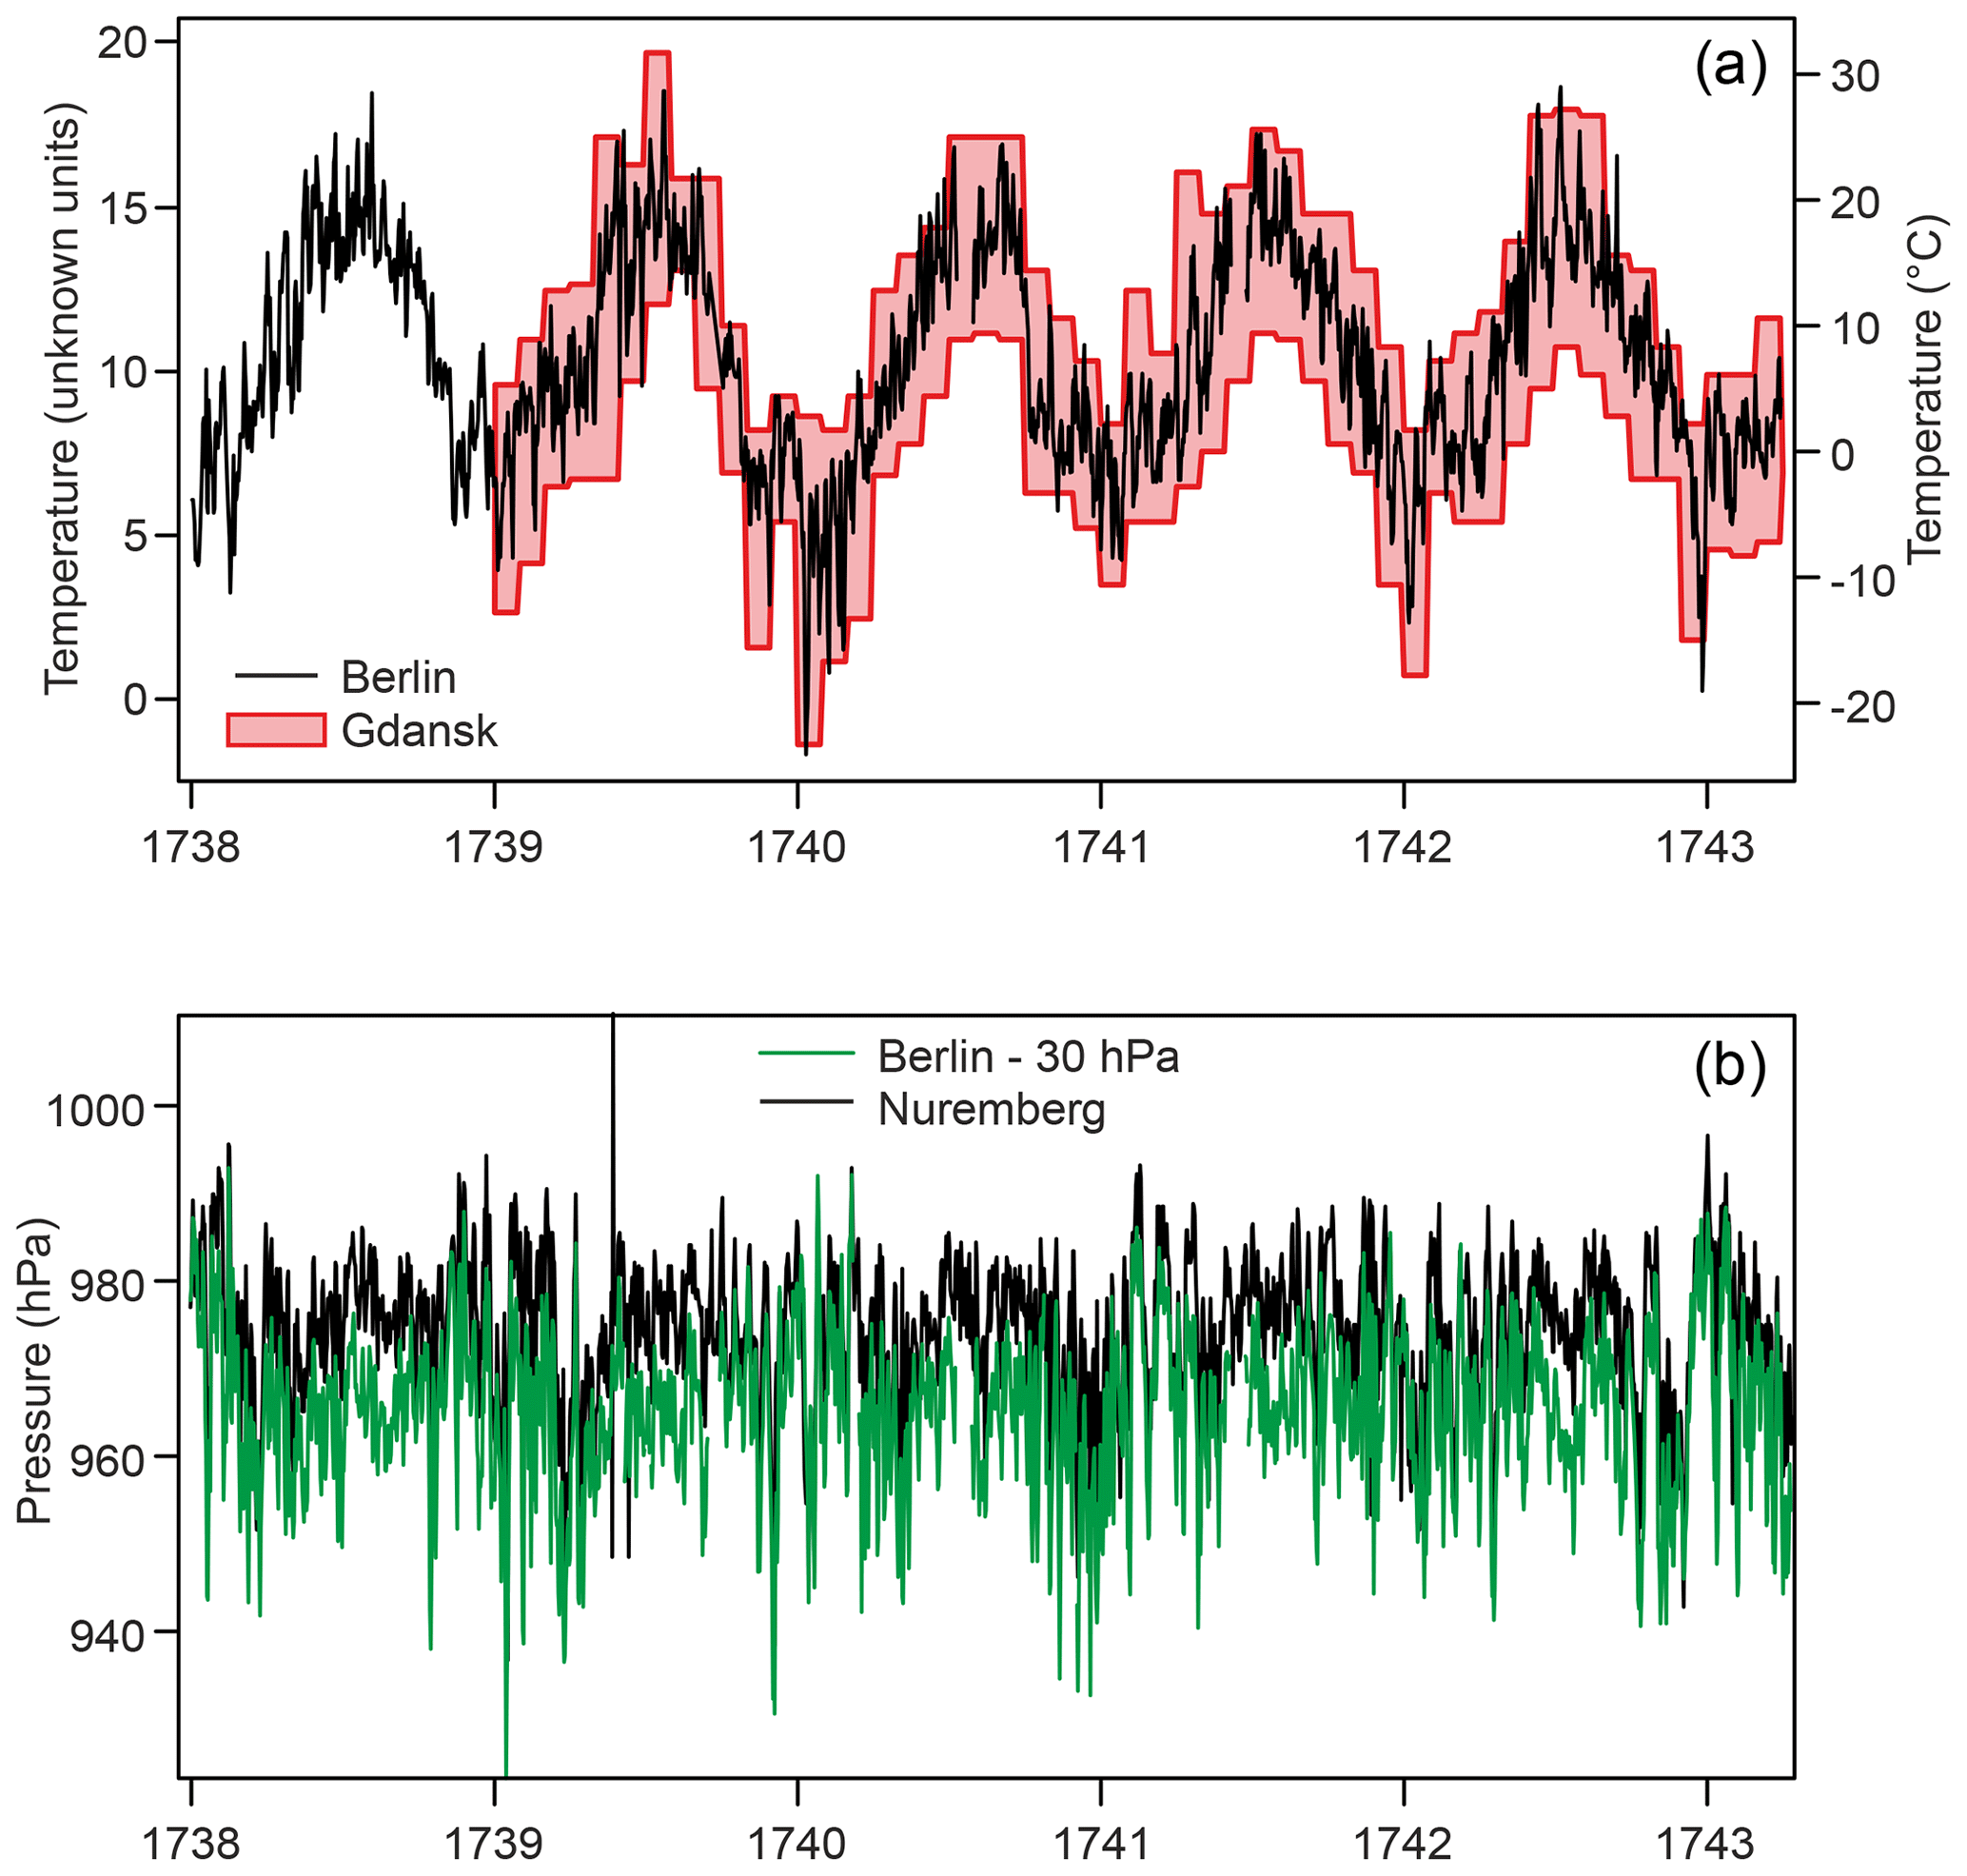
Figure 11(a) Daily averages of temperature from 1738–1742 by Christine Kirch (left axis; note that the temperature scale is not known). Also shown are the monthly minimum and maximum temperatures in Gdańsk (right axis). (b) Daily mean pressure in Berlin (reduced by 30 hPa for comparison) and Nuremberg.
For pressure, we can compare the Berlin series with that from Nuremberg (the observer was Johann Gabriel Doppelmayr, who is also the author of the atlas from which Fig. 3 is taken). The agreement is very good, with a correlation coefficient of 0.83 despite some probable outliers. For the winter of 1739/1740, we find low pressure in December 1739, but then high pressure in January 1740. This is consistent with temperatures.
The Kirch family (Gottfried Kirch, his wife Maria Margaretha Kirch (née Winkelmann), their son Christfried Kirch, and their daughter Christine Kirch) noted the weather for almost a century, from 1677 to 1774. From 1691 onward they used a thermometer, and later they also used a barometer, although regular observations only start in 1701. This body of measurements makes up the first part of the longest meteorological record in Germany. We imaged the diaries, totalling 10 445 images, and made them available in a repository. Moreover, we digitized ca. 82 000 instrumental observations after 1720 and published them. Pressure data could be processed (although a reduction to 0 ∘C could not be performed). Temperature data could not be reduced because of an unknown (and changing) scale but were nevertheless digitized and are published as a Supplement to this paper. Comparisons with other data suggest that the pressure series is trustworthy on the daily as well as monthly scale, although the scale remains uncertain. In fact, correlations with neighbouring series are very high. A brief analysis of the cold winter of 1739/1740 suggests that temperature measurements may also contain useful information, even though the scale remains unknown. The newly digitized series will serve as the starting point for a new, daily Berlin series of temperature and pressure. The Kirch data set will be concatenated with other Berlin series from the 18th century currently under digitization (Daniel Ernst Jablonski, Johann Heinrich Lambert, Carl August Brand, Karl Ludwig Gronau, and others) and homogenized to generate a more complete Berlin series.
The early Berlin data fall into a period in which not many other records are known, and therefore they provide valuable information. However, there are some records with which the Berlin record can be compared. These include, among others (see inventory by Brönnimann et al., 2019), long daily time series from Paris (Pliemon et al., 2022, Cornes et al., 2012a), London (Cornes et al., 2012b), and Zwanenburg/De Bilt; shorter series from Nuremberg, Basel, Geneva, Zurich and Bern (e.g. Brugnara et al., 2022), St. Petersburg, and Uppsala; and several Italian series from the IMPROVE project (Camuffo and Jones, 2002). However, other, non-instrumental weather diaries may also be a good resource for comparisons, including those from Nuremberg (Brönnimann, 2023a), Wrocław (Przybylak and Pospieszyńska, 2010), Gdańsk (Filipiak et al., 2019), and Zurich (see weather diaries in EURO-CLIMHIST; Pfister et al., 2017). All sources taken together may provide a detailed view of weather in the 18th century.
The images of the Kirch diaries can be found at https://doi.org/10.48620/222 (Brönnimann, 2023b).
SEF data files for pressure in Berlin as well as Nuremberg have been submitted to the GLAMOD database of the Copernicus Climate Change Service. They are also attached to this submission, together with the raw files for all variables for Berlin.
The monthly pressure data are part of the HCLIM collection: https://doi.org/10.1594/PANGAEA.940724 (Lundstad et al., 2022).
The supplement related to this article is available online at: https://doi.org/10.5194/cp-19-1435-2023-supplement.
SB imaged the diaries and performed the analyses in the paper, and YB organized the digitization and performed the quality control and all processing and formatting steps of the Berlin data. Both authors wrote the paper.
The contact author has declared that neither of the authors has any competing interests.
Publisher's note: Copernicus Publications remains neutral with regard to jurisdictional claims in published maps and institutional affiliations.
We thank the FU Berlin for allowing us to photograph their material as well as the Paris observatory and the Crawford Collection of the Royal Observatory Edinburgh for allowing us to publish the data under a CC-BY-NC licence. We also thank Klaus-Dieter Herbst for his support and information on the Kirch family. In particular, we thank the students who performed the digitization work.
This research has been supported by the Schweizerischer Nationalfonds zur Förderung der Wissenschaftlichen Forschung (grant no. 188701) and the H2020 European Research Council (grant no. 787574).
This paper was edited by Z. S. Zhang and reviewed by two anonymous referees.
Bahr, R.-M.: Das Klima von Berlin (I). Geschichte der meteorologischen Beobachtungen der Stadt Berlin, in: Bd. 10, Abh. Meteorol. Dienst DDR, 78 pp., 1966.
Brönnimann, S.: From climate to weather reconstructions, PLOS Clim., 1, e0000034, https://doi.org/10.1371/journal.pclm.0000034, 2022.
Brönnimann, S.: The weather diary of Georg Christoph Eimmart for Nuremberg, 1695–1704, Clim. Past, 19, 1345–1357, https://doi.org/10.5194/cp-19-1345-2023, 2023a.
Brönnimann, S.: Photographs of Weather Diaries of the Kirch family, 1677–1774, BORIS Portal [data set], https://doi.org/10.48620/222, 2023b.
Brönnimann, S. Allan, R., Ashcroft, L., Baer, S., Barriendos, M., Brázdil, R., Brugnara, Y., Brunet, M., Brunetti, M., Chimani, B., Cornes, R., Domínguez-Castro, F., Filipiak, J., Founda, D., García Herrera, R., Gergis, J., Grab, S., Hannak, L., Huhtamaa, H., Jacobsen, K. S., Jones, P., Jourdain, S., Kiss, A., Lin, K. E., Lorrey, A., Lundstad, E., Luterbacher, J., Mauelshagen, F., Maugeri, M., Maughan, N., Moberg, A., Neukom, R., Nicholson, S., Noone, S., Nordli, Ø., Ólafsdóttir, K. B., Pearce, P. R., Pfister, L., Pribyl, K., Przybylak, R., Pudmenzky, C., Rasol, D., Reichenbach, D., Řezníčková, L., Rodrigo, F. S., Rohde, R., Rohr, C., Skrynyk, O., Slonosky, V., Thorne, P., Valente, M. A., Vaquero, J. M., Westcottt, N. E., Williamson, F., and Wyszyński, P.: Unlocking pre-1850 instrumental meteorological records: A global inventory, B. Am. Meteorol. Soc., 100, ES389–ES413, 2019.
Brugnara, Y., Gilabert, A., Ventura, C., and Hunziker, S.: dataresqc: Quality control tools for climate data developed by the C3S Data Rescue Service, GitHub [code], https://github.com/c3s-data-rescue-service/dataresqc (last access: 14 June 2023), 2019.
Brugnara, Y., Pfister, L., Villiger, L., Rohr, C., Isotta, F. A., and Brönnimann, S.: Early instrumental meteorological observations in Switzerland: 1708–1873, Earth Syst. Sci. Data, 12, 1179–1190, https://doi.org/10.5194/essd-12-1179-2020, 2020.
Brugnara, Y., Hari, C., Pfister, L., Valler, V., and Brönnimann, S.: Pre-industrial Temperature Variability on the Swiss Plateau Derived from the Instrumental Daily Series of Bern and Zurich, Clim. Past, 18, 2357–2379, https://doi.org/10.5194/cp-18-2357-2022, 2022.
Brunet, M., Brugnara, Y., Noone, S., Stephens, A., Valente, A.A., Ventura, C., Jones, P., Gilabert, A., Brönnimann, S., Luterbacher, J., Allan, R., Brohan, P., and Compo, G. P.: Best Practice Guidelines for Climate Data and Metadata Formatting, Quality Control and Submission, Copernicus Climate Change Services, https://doi.org/10.24381/kctk-8j22, 2020.
Camuffo, D. and Jones, P.: Improved understanding of past climatic variability from early daily European instrumental sources, Climatic Change, 53, 1–4, https://doi.org/10.1023/A:1014902904197, 2002.
Casty, C., Wanner, H., Luterbacher, J., Esper, J., and Böhm, R.: Temperature and precipitation variability in the European Alps since 1500, Int. J. Climatol., 25: 1855-1880, https://doi.org/10.1002/joc.1216, 2005.
Cornes, R. C., Jones, P. D., Briffa, K. R., and Osborn, T. J.: A daily series of mean sea-level pressure for Paris, 1670–2007, Int. J. Climatol., 32, 1135–1150, https://doi.org/10.1002/joc.2349, 2012a.
Cornes, R. C., Jones, P. D., Briffa, K. R., and Osborn, T. J.: A daily series of mean sea-level pressure for London, 1692–2007, Int. J. Climatol., 32, 641–656, 2012b.
Cubasch, U. and Kadow, C.: Die Berliner Temperaturreihe, Acta Histor. Astronom., 41, 112-132, 2010.
Filipiak, J., Przybylak, R., and Oliński, P.: The longest one-man weather chronicle (1721–1786) by Gottfried Reyger for Gdańsk, Poland as a source for improved understanding of past climate variability, Int. J. Climatol., 39, 828–842, https://doi.org/10.1002/joc.5845, 2019.
Gronau, K. L.: Hundertjährige meteorologische Tabellen der Witterung in Berlin von 1701 bis 1800, Ges. natf. Freunde z. Berlin, 1, 124–132, 1807.
Hellmann, G.: Das älteste Berliner Wetter-Buch 1700–1701 von Gottfried Kirch und seiner Frau Margaretha geb. Winkelmann, Dobrzynski & Walter, Berlin, https://www.digi-hub.de/viewer/!toc/BV042013677/181/LOG_0009/ (last access: 18 July 2023), 1893.
Herbst, K.-D.: Gottfried Kirch (1639–1710), Astronom, Kalendermacher, Pietist, Frühaufklärer, Acta Calendariographica – Forschungsberichte 10, Verlag HKD, Jena, 734 pp., ISBN 978-3-941563-27-8, 2022.
Kadow, C., Wentzel, B., Jaekel, I., Bahlo, M., and Cubasch, U.: Berlin Climate Record – Daily Mean Temperature – Inner City – 1766-1934, PANGAEA [data set], https://doi.org/10.1594/PANGAEA.869767, 2016.
Lenke, W.: Untersuchung der ältesten Temperaturmessungen mit Hilfe des strengen Winters 1708–1709, Berichte des Deutschen Wetterdienstes, No. 92, Deutscher Wetterdienst, Offenbach am Main, https://www.deutsche-digitale-bibliothek.de/item/7NYOPM2L5GY22QUEFW5LMZ7OR2GYFDOQ (last access: 18 July 2023), 1964.
Lundstad, E., Brugnara, Y., and Brönnimann, S.: Global Early Instrumental Monthly Meteorological Multivariable Database (HCLIM), PANGAEA [data set], https://doi.org/10.1594/PANGAEA.940724, 2022.
Lundstad, E., Brugnara, Y. Pappert, D., Kopp, J., Hürzeler, A., Andersson, A., Chimani, B., Cornes, R., Demarée, G., Filipiak, J., Gates, L., Ives, G. L., Jones, J. M., Jourdain, S., Kiss, A., Nicholson, S. E., Przybylak, R., Jones, P. D., Rousseau, D., Tinz, B., Rodrigo, F. S., Grab, S., Domínguez-Castro, F., Slonosky, V., Cooper, J., Brunet, N., and Brönnimann, S.: Global historical climate database – HCLIM, Scient. Data, 10, 44, https://doi.org/10.1038/s41597-022-01919-w, 2023.
Mädler, J.-H.: Die mittlere Temperatur Berlins für den Zeitraum 1701–1825 aus 126 410 Beobachtungen berechnet, Zeitschr. f. d. gesamt. Meteorol., 1, 81–88, Kretschmar, Chemnitz, 1825.
Noone, S., Atkinson, C., Berry, D. I., Dunn, R. J. H., Freeman, E., Perez Gonzalez, I., Kennedy, J. J., Kent, E. C., Kettle, A., McNeill, S., Menne, M., Stephens, A., Thorne, P. W., Tucker, W., Voces, C., and Willett, K. M.: Progress towards a holistic land and marine surface meteorological database and a call for additional contributions, Geosci. Data J., 8, 103–120, https://doi.org/10.1002/gdj3.109, 2021.
Pappert, D., Barriendos, M., Brugnara1, Y., Imfeld, N., Jourdain, S., Przybylak, R., Rohr, C., and Brönnimann, S.: Statistical reconstruction of daily temperature and sea-level pressure in Europe for the severe winter 1788/89, Clim. Past, 18, 2545–2565, https://doi.org/10.5194/cp-18-2545-2022, 2022.
Pelz, J.: Die Wettertagebücher der Familie Kirch, 1700 bis 1774, Interne Information der WAG 6 2/78, https://refubium.fu-berlin.de/handle/fub188/24187 (last access: 18 July 2023), 1978.
Pelz, J.: Die Berliner Jahresmitteltemperaturen von 1701 bis 1996, Beilage zur Berliner Wetterkarte 6/97, 1997.
Pfister, C., Rohr, C., and Jover, A. C. C.: Euro-Climhist: eine Datenplattform der Universität Bern zur Witterungs-, Klima- und Katastrophengeschichte, Wasser Energie Luft, 109, 45–48, 2017.
Pliemon, T., Foelsche, U., Rohr, C., and Pfister, C.: Subdaily meteorological measurements of temperature, direction of the movement of the clouds, and cloud cover in the Late Maunder Minimum by Louis Morin in Paris, Clim. Past, 18, 1685–1707, https://doi.org/10.5194/cp-18-1685-2022, 2022.
Przybylak, R. and Pospieszyńska, A.: Air temperature in Wrocław (Breslau) in the period 1710–1721 based on measurements made by David von Grebner, Acta Agrophys., 184, 35-43, 2010.
Reichen, L., Burgdorf, A.-M., Brönnimann, S., Rutishauser, M., Franke, J., Valler, V., Samakinwa, E., Hand, R., and Brugnara, Y.: A Decade of Cold Eurasian Winters Reconstructed for the Early 19th Century, Nat. Commun., 13, 2116, https://doi.org/10.1038/s41467-022-29677-8, 2022.
Schlaak, P.: 300 Jahre Wetterforschung in Berlin. Ihre Geschichte in Persönlichkeitsbildern, in: 100 Jahre Deutsche Meteorologische Gesellschaft in Berlin 1884–1984, edited by: Fortak, H., Deutsche Meteorologische Gesellschaft, Berlin, 86–124, 1984.
Siebenhühner, H.: Das Wetterbuch der “Kirchin”, Fast 75jährige Beobachtungsreihe der Astronomenfamilie Kirch. Berlinische Monatsschrift Heft 10/1996, 83–86, https://berlingeschichte.de/bms/bmstxt96/9610gesb.htm (last access: 18 July 2023), 1996.
Slivinski, L. C., Compo, G. P., Whitaker, J. S., Sardeshmukh, P. D., Giese, B. S., McColl, C., Allan, R., Yin, X., Vose, R., Titchner, H., Kennedy, J., Spencer, L. J., Ashcroft, L., Brönnimann, S., Brunet, M., Camuffo, D., Cornes, R., Cram, T. A., Crouthamel, R., Domínguez-Castro, F., Freeman, J. E., Gergis, J., Hawkins, E., Jones, P. D., Jourdain, S., Kaplan, A., Kubota, H., Le Blancq, F., Lee, T., Lorrey, A., Luterbacher, J., Maugeri, M., Mock, C. J., Moore, G. K., Przybylak, R., Pudmenzky, C., Reason, C., Slonosky, V. C., Smith, C., Tinz, B., Trewin, B., Valente, M. A., Wang, X. L., Wilkinson, C., Wood, K., and Wyszyński, P.: Towards a more reliable historical reanalysis: Improvements to the Twentieth Century Reanalysis system, Q. J. Roy. Meteorol. Soc., 145, 2876–2908, https://doi.org/10.1002/qj.3598, 2019.
Valler, V., Franke, J., Brugnara, Y., and Brönnimann, S.: An updated global atmospheric paleo-reanalysis covering the last 400 years, Geosci. Data J., 9, 89–107, 2022.
Wanner, H. and Luterbacher, J.: The LOTRED approach – a first step towards a “paleoreanalysis” for Europe, Pages News, 10, 9–11, 2002.
WMO: Chapter 6 – Quality Control Procedures. Guide on the Global Data-processing System, World Meteorological Organization, No. 305, VI.1-VI.27, WMO, Geneva, ISBN 92-63-13305-0, 1993.