the Creative Commons Attribution 4.0 License.
the Creative Commons Attribution 4.0 License.
 | 11 Jul 2023
The weather diary of Georg Christoph Eimmart for Nuremberg, 1695–1704
Stefan Brönnimann
Data from weather diaries have long been used to reconstruct past climate. However, they could also be used to reconstruct past weather. Weather reconstructions could help us to better understand the mechanisms behind, and impacts of, climatic changes. However, reconstructing the day-to-day weather requires many diaries from different regions covering the same period, ideally combined with instrumental measurements. In this paper, I describe the weather diary of Georg Christoph Eimmart from Nuremberg, covering the period 1695 to 1704, which was particularly cold in Europe. The diary was imaged from the Russian National Library in St. Petersburg and then digitized. It contains twice-daily weather conditions in symbolic form, wind direction details, and information on precipitation and temperature in text form. Symbols changed during the first 2 years, after which a much-reduced (and stable) set of symbols was used. Re-coding all days according to the later set of symbols, I find no signs of inconsistency over time in symbols, wind direction, and precipitation information extracted from the text. Comparisons with other sources confirm the day-to-day weather information in the diary. For instance, the wind direction in Nuremberg agrees with the daily pressure gradient between Jena and Paris. Three case studies further confirm the meteorological reliability of the information. This is shown on behalf of an 8 d sequence of stormy weather in 1702, a study of the severe winter of 1697/98, and a study of the summer of 1695, which was cold and wet, possibly related to tropical volcanic eruptions. The examples underline the consistency of the weather diary with other information and suggest that weather reconstructions as far back as the late 17th century might become possible. However, the spatial information is limited, and any approach arguably needs to make good use of the temporal sequence of information.
- Article
(9037 KB) - Full-text XML
-
Supplement
(989 KB) - BibTeX
- EndNote


For decades, historians have used data from weather diaries to reconstruct past climate, i.e. to generate monthly or seasonal index series (e.g. Pfister, 1999; see overview in Nash et al., 2021). However, they could also be used to reconstruct past weather day by day. In fact, Manley (1975) described the daily weather during the cold winter of 1683/84 based on instrumental data and data from weather diaries. Kington (1988) and Lamb (1991) reconstructed daily weather types and drew daily weather charts for periods in the 18th, 17th, and even 16th century. They combined sparse observations with expert interpretation in a reproducible way (Kington, 1988).
As weather extremes and changes in weather have come into focus of climate science, reconstructing daily weather is again considered an important goal. García-Herrera et al. (2007), Wheeler et al. (2009), and numerous others have demonstrated the value of carefully reconstructing past extreme weather events. However, the subjective nature of these reconstructions is not without problems (e.g. Jones et al., 2014, and references therein). Furthermore, to produce complete daily data series, automated and objective methods are used rather than time-consuming expert interpretations. Daily weather types (Schwander et al., 2017) and gridded daily weather reconstructions (Imfeld et al., 2022) have been performed for Switzerland back to 1763 and for Europe for the 1780s (Pappert et al., 2022). Other daily indices such as the wind direction over the English Channel reach further back to the late 17th century (Wheeler et al., 2010). Cornes et al. (2012a, b) used daily data of sea level pressure (SLP) from London and Paris to analyse atmospheric circulation and storminess. There are many more examples for analyses of daily weather 300 years back (e.g. Brázdil et al., 2008; Filipiak et al., 2019); a review of approaches is given in Brönnimann (2022). In addition to traditional statistical and numerical methods, new approaches such as machine learning (Brohan, 2022) could possibly replace the expert approach pioneered by Manley, Kington, and Lamb.
The success of any weather reconstruction approach ultimately depends on the available weather data. From the turn of the 17th to the 18th century, several weather diaries are available. The diary from Johann Heinrich Fries in Zurich covering 1684–1718 (Pfister, 1977) can be downloaded from EURO-CLIMHIST (Pfister et al., 2017). The diary of the Kirch family in Leipzig (and Guben) and later Berlin covers 1677–1774 (Herbst, 2022) and was imaged by the author. Further diaries, such as that of David Grebner in Wroclaw covering 1692–1710 (Przybylak and Pospieszyńska, 2010) and Joseph Dietrich in Einsiedeln covering 1670–1704 (Rohr and Schwarz-Zanetti, 2022), are under digitization (not considered here). There are also a number of instrumental records from the late 17th and early 18th century (see Brönnimann et al., 2019a; Lundstad et al., 2023), many of which also have weather descriptions. Combining all these data sets, reconstructing daily weather over Europe back to the late 17th century could become possible.
Here I add another weather diary, namely that of Georg Christoph Eimmart, founder of the first Nuremberg (Nürnberg) astronomical observatory. His weather diary covers the years 1695–1704. This paper describes the diary, its digitization, and (as the diary is mostly kept in symbolic form) its categorization. I then compare Eimmart's observations with other sources of daily weather information.
The turn of the 17th to the 18th century is not only interesting as a test case as to how far back daily weather reconstruction can reach, but it is also climatically interesting. It fell into the so-called “late Maunder Minimum” (Luterbacher et al., 2001), with particularly low temperatures in Europe coinciding with low solar activity. At the same time, several volcanic eruptions (Hekla and Serua in 1693, Komagatake in 1694) might have affected the climate (see Burgdorf, 2022).
The paper is organized as follows. Section 2 provides background about the observer and the diary. Section 3 then describes the digitization and the data used for comparison. Results are presented in Sect. 4. A brief discussion then follows in Sect. 5, and conclusions are drawn in Sect. 6.
Georg Christoph Eimmart (1638–1705) is known as the founder of the first Nuremberg astronomical observatory (the following text is based on Gaab, 2005, 2022). Eimmart attended the “Gymnasio poetico” at Regensburg and enrolled in 1655 at the University of Jena, where he studied mathematics. In 1658 he returned to Regensburg. After the death of his father, he moved to Nuremberg (following his sister) around 1660. He worked as an engraver and got involved in the management of the Academy of Painting founded in 1662, and from 1699 until shortly before his death he was director of this institution.
Using the money earned with his artistic activity, Eimmart set up an observatory at Vestnertor, north of Nuremberg Castle (Fig. 1), in 1678. At the end of the 17th century this observatory was the most well known in Germany (Gaab, 2005). During special celestial events, the observatory was opened to the public. In 1699, Eimmart was admitted to the Parisian Academy of Sciences, and at Leibniz's suggestion 2 years later, he was also admitted as an external member of the Prussian Academy of Sciences.
The written legacy of Georg Christoph Eimmart can be found today in the Russian National Library in St. Petersburg. Volume 40 of that legacy is the “Diarium tempestatum” (see also Gaab, 2022). It covers the period 1 January 1695 to 25 November 1704 over 120 pages. The first 3 months are written in ink, and the remaining pages are in pencil. The diary is structured into tables and contains only observations and no measurements (although a sketch of an instrument is found on a verso page, Fig. 2; all other verso pages are empty). The table is structured in columns, which on the first page are labelled as “Dies; Qualitas Aeris; Temperam: cal: et frig:; Ventus”. There is an apparent gap from 19 to 28 February 1700 (“Incipit Dies 1. Martiy”), which is due to the change from the Julian to the Gregorian calendar. Another (real) gap of 4 weeks occurs in January–February 1703.
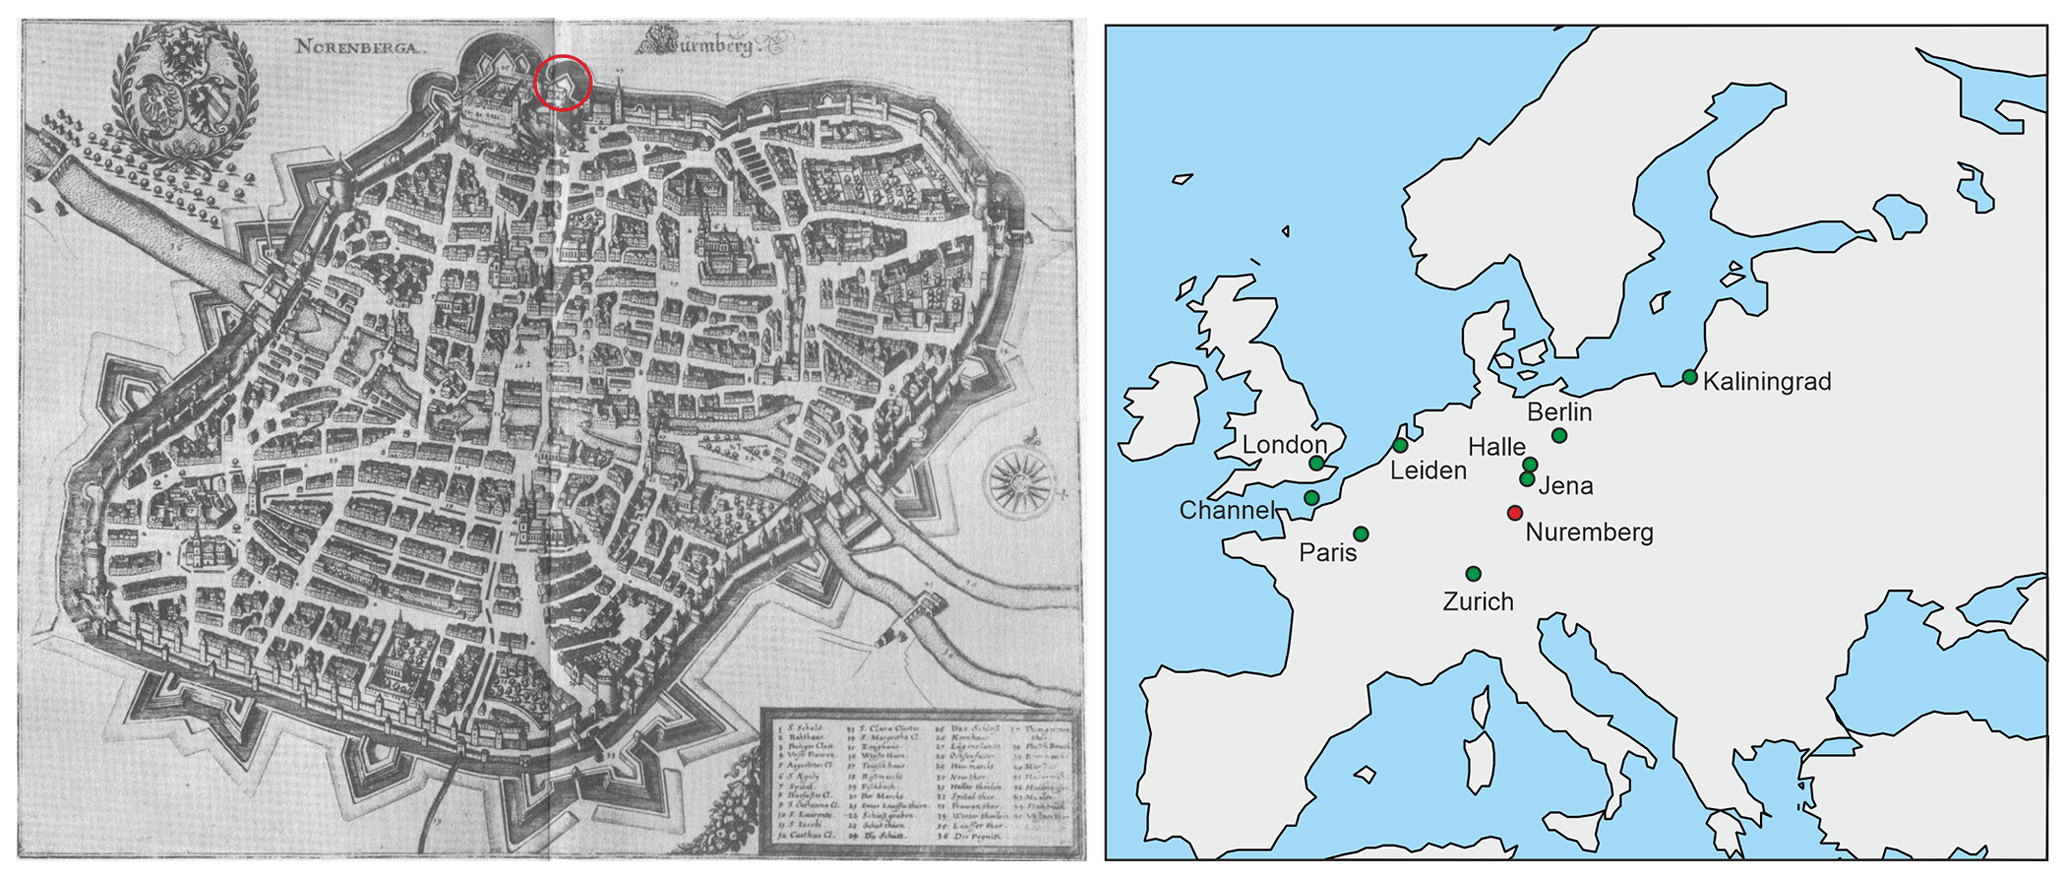
Figure 1(left) Map of Nuremberg, 1642 (engraving by Matthäus Merian from Germaniae, Edition Topographia Franconiae, 1642; Wikimedia Commons, public domain) with the location of the observatory. (right) Location of other weather observation series used in this study (dark green: instrumental measurements; light green: observations).
An interesting aspect of the diary is that it is in its majority symbolic. This means that the entries are mostly given as symbols, are sometimes given in words, and are sometimes given using both. In the first 2 years, each column (1 month, August 1695, has four columns, all others have three) has a distinct set of symbols that is used (see Fig. 3). Particularly in the first 2 years, there are often several symbols in the same cell. After 2–3 years, however, the distinction between columns 1 and 2 gets lost, while the wind column remains unchanged until the end of the diary. Some of the symbols, particularly those used in the second column (on temperature), vanish, and those used in the first column also appear in the second. A much-reduced set of symbols is used in both columns after ca. 1697. There are mostly just three symbols: full sun, upper half of sun, and long dash.
Wind is given in cardinal or intercardinal direction plus a symbol probably referring to changing winds. Sometimes several wind directions are mentioned in the same cell (see example in Fig. 2), which might indicate several observations per day.
In addition to symbols and wind direction, there are also occasional Latin expressions such as “nebula”, “pluvia per intervalla”, or “nix”. They describe phenomena related to precipitation (rain snow, thunderstorm, lightning, rainbows), wind speed, and temperature. Occasionally other aspects are mentioned (changeable weather, clarity of the sky). Words are sometimes written across both columns (sometimes even also across the wind column), which leads to the hypothesis that from ca. 1697 onward (after the same symbols are used in both columns) Eimmart wrote twice-daily observations, where the first column refers to morning and the second to afternoon. This is supported by the fact that “tonitru” (thunder) appears only 6 times in the first column but 33 times in the second column. Likewise, “aestus” (heat) appears 23 times in the first column and 47 times in the second column. However, there is no text to prove this hypothesis.
The text entries are not independent of the symbols. In about half of the cases, text entries replace symbolic entries; i.e. these fields do not have a symbol for the sky conditions. For the other half of cases with text entries, these complement existing symbols. Sometimes the text refers specifically to precipitation that has fallen during the night. In a few instances, an additional row is even added between two rows noting nocturnal rain or nocturnal storms, or this is made clear by subdividing cells. Overall, there are slightly more text entries in the second column than in the first. Text entries in the third column are rare.
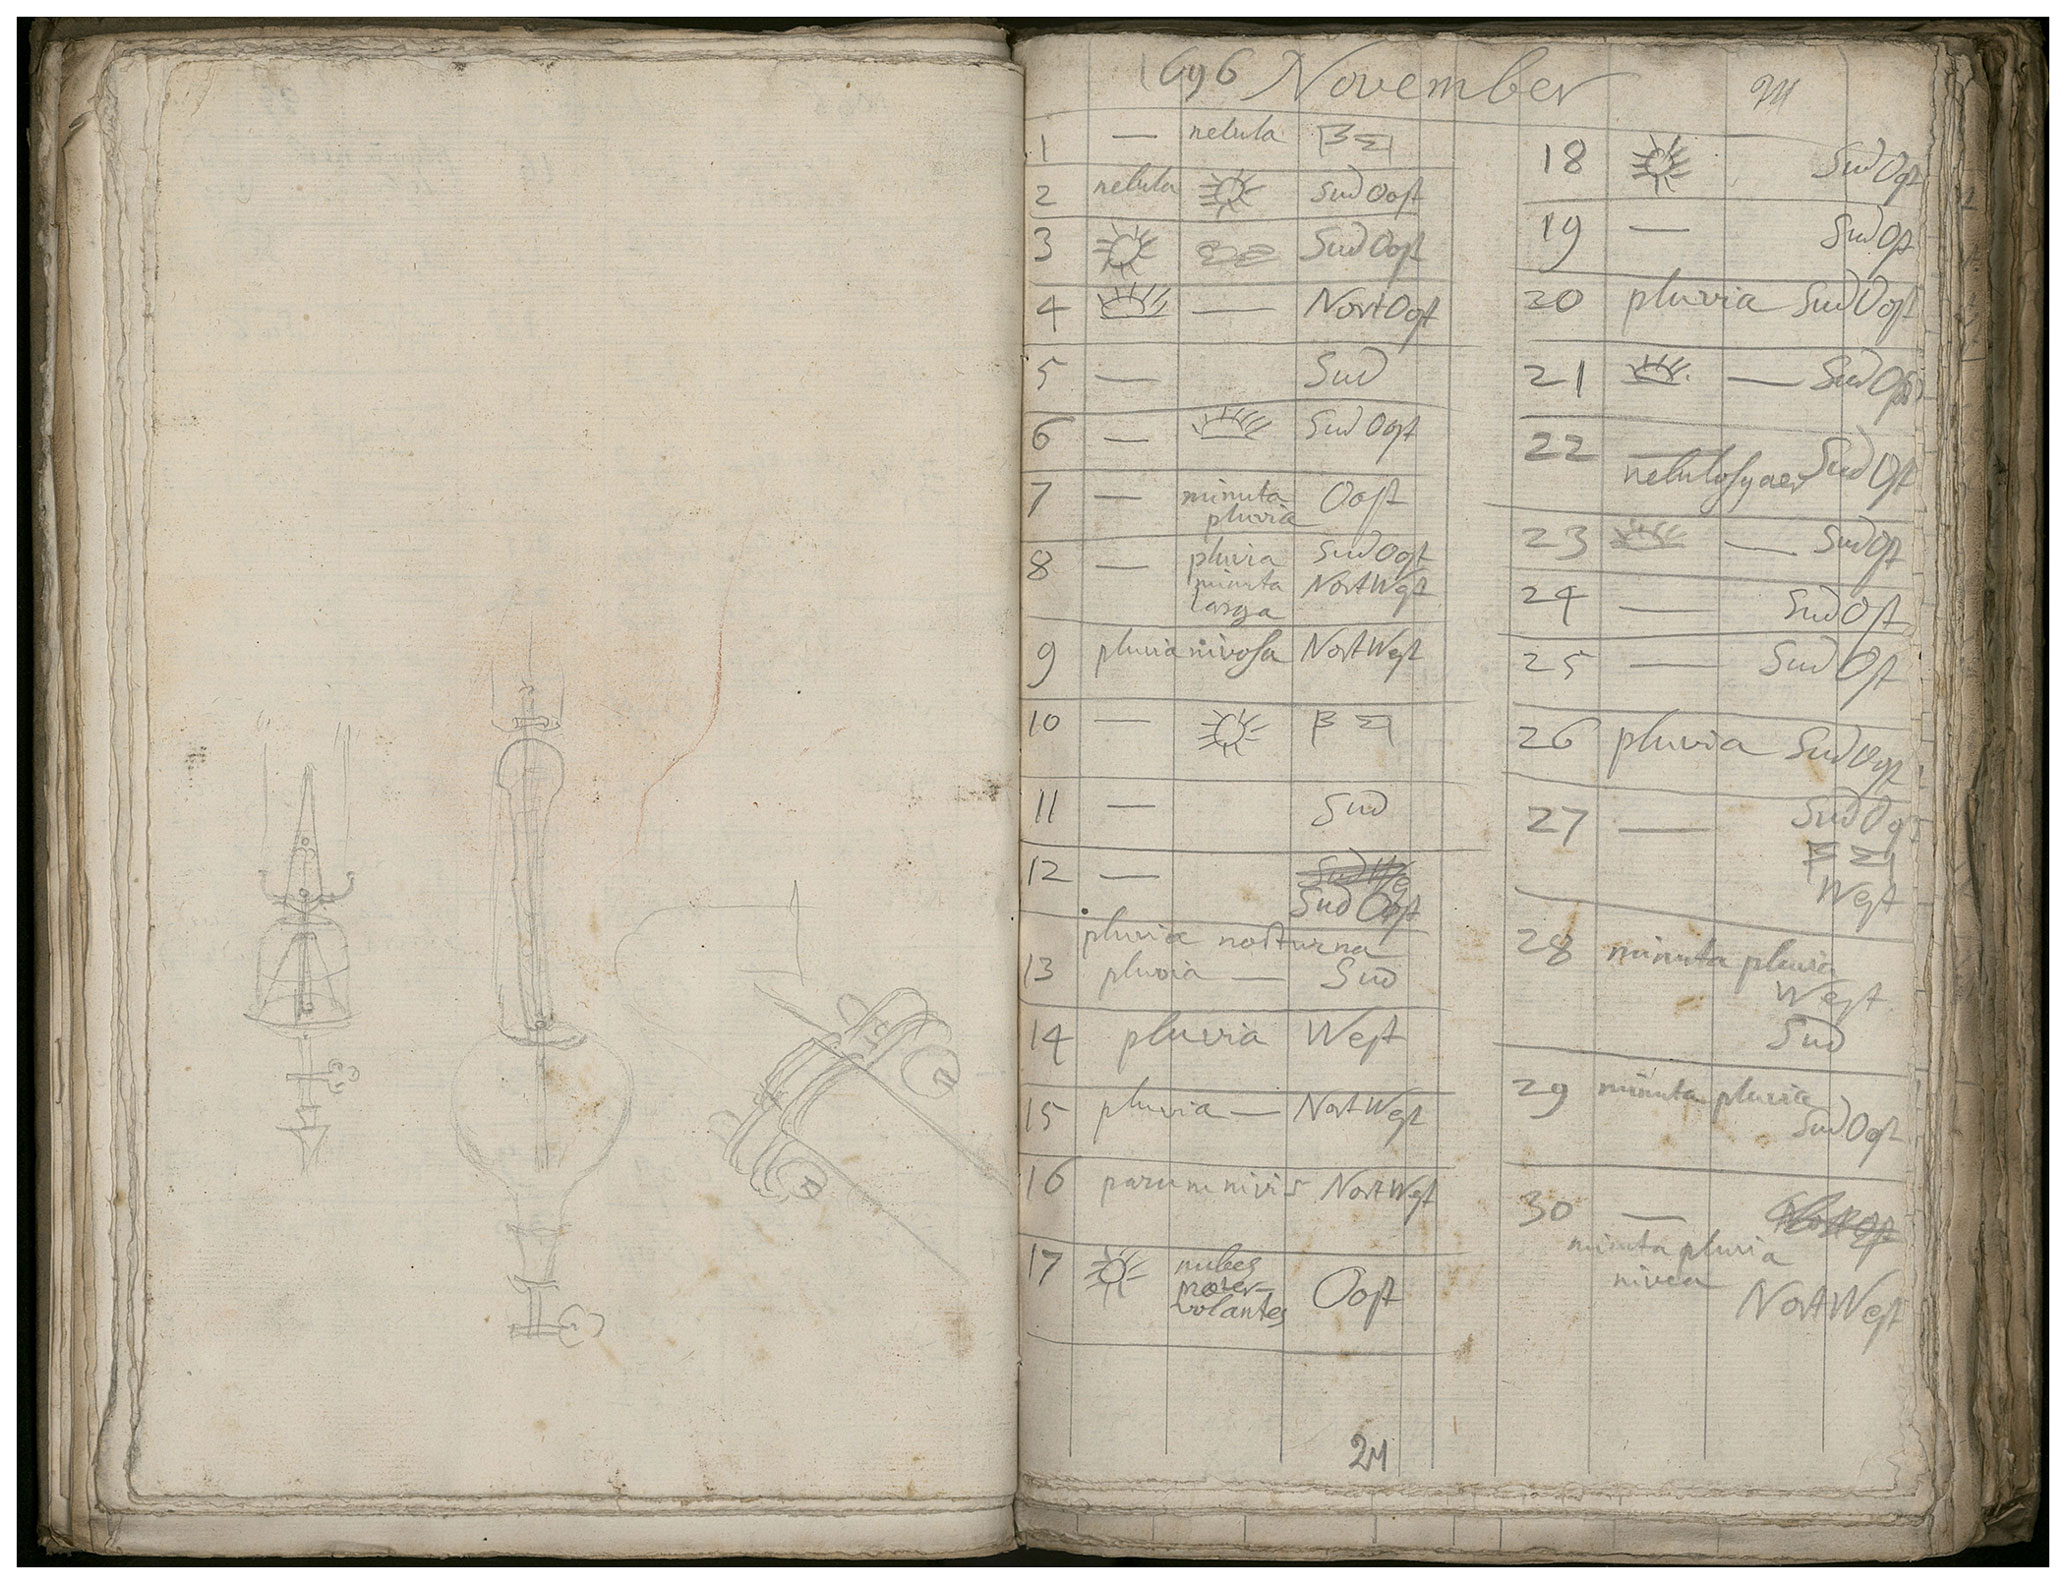
Figure 2Eimmart's diary for November 1696 from the National Library of Russia, St. Petersburg. The left page shows sketches of scientific instruments (© National Library of Russia, St. Petersburg).
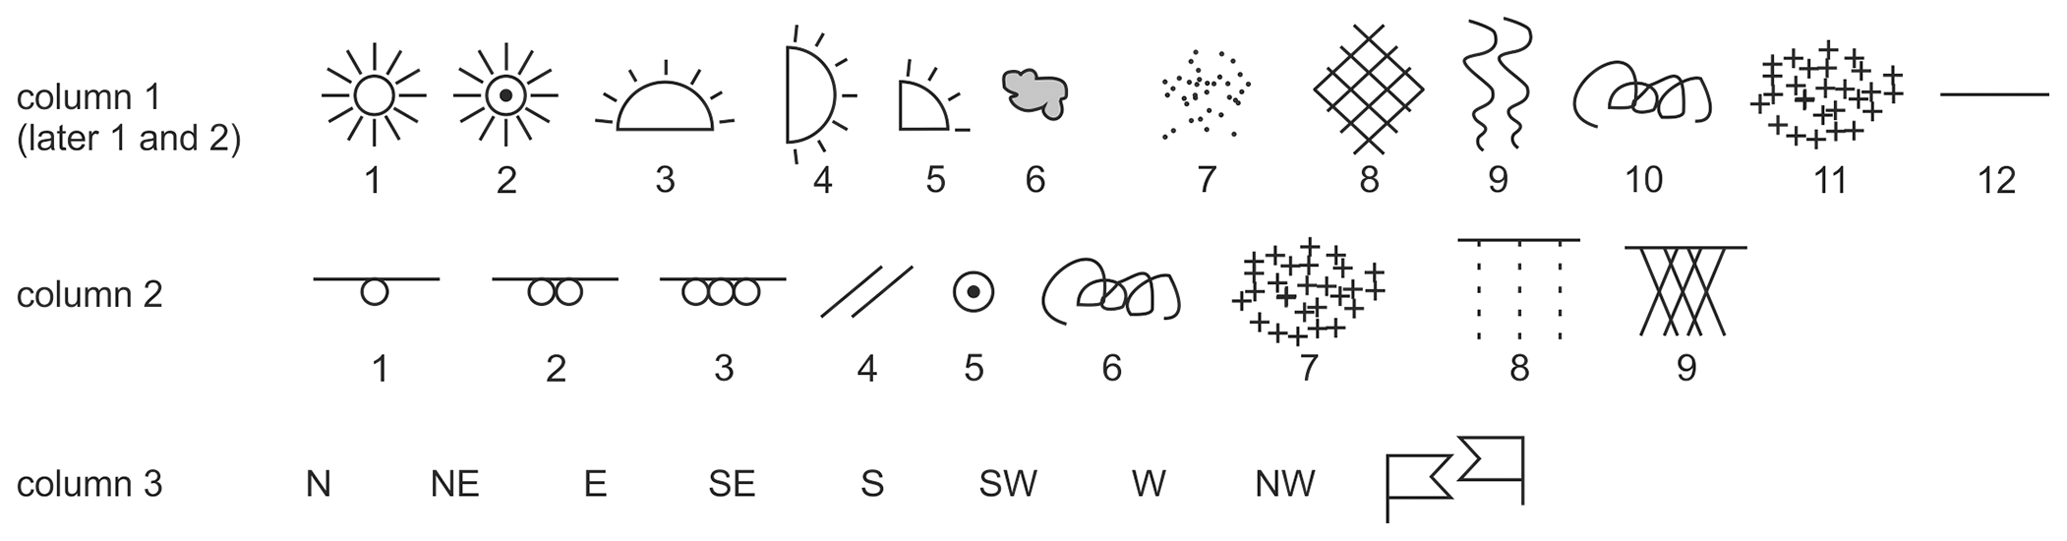
Before digitizing, an inventory of all symbols appearing in the diary was compiled (Fig. 3), and a code was assigned to each symbol. Then symbols were digitized as codes. For the text I use an additional column. I transcribed the Latin words as accurately as possible; some illegible words are marked with “$”. Eimmart abbreviated some words with a symbol resembling “y”, which I transcribed as “y” (e.g. “frigy”). Words written over two fields are assigned to both fields with a corresponding bracket (e.g. “pluvius[“and” ]pluvius”; for the special case of August 1695, with four columns, I kept the three-column structure but assigned words across several columns only to one, with a note “[2 columns]”). A pipe symbol “|” is used to indicate line breaks within a cell. In case of nocturnal weather, when the diary makes it clear to which night this refers, I add it to the following day (the weather diary also mostly does it this way) with a note “[previous night: …]”. Within the text, Eimmart sometimes uses a symbol for the Sun, which I transcribed as “[solaris]”.
From this raw transcription I generated several derived variables. First, I categorized the text entries related to precipitation into snow (“nix”, “nivigit”, or similar), rain (“pluvia”), or rain and snow. In the category rain I also included expressions such as “tonitru” (thunder) or “nebula pluviosa” (rainy fog) but not “tempestas” (storm). To these I also added symbols 7 to 9 (rain) and 11 (snow) of Fig. 3, column 1, as well as symbols 7 (snow), 8 and 9 (rain) of Fig. 3, column 2. Note that these almost exclusively appear in the first 9 months. This variable is called precipitation.
Second, I formed a unified code based on the three main symbols used after 1697, namely “sunny” (full sun), “partly sunny” (half sun), and “cloudy” (horizontal line). For this, I grouped symbols 1 (column 1), 2 (column 1), and 5 (column 2) to the sunny category; symbols 3 to 5 (column 1) and any combination of a symbols 1–5 (column 1) with another symbol as the partly sunny category; and categories 6 and 12 (column 1) to the cloudy category. All days for which the diary indicates a weather symbol (76 % in column 1, 60 % in column 2) are thus assigned one of the three categories. This variable is called “WeatherSymb”.
Third, for most of the days with missing symbols, there is a text entry. In a further step, I also generated a code for these entries. The terms “serenum” (clear) and “sunidy” were coded as sunny; “coelum varium” (changeable), “pluvia per intervalla” (occasional rain), “pluvia minuta” (little rain), “tonitru” (thunder), and symbol 8 (column 2) were coded as partly sunny; and the terms “pluvia”, “pluvia tota dia”, “nebula”, and symbol 9 (column 2) were coded as cloudy. In this way, 97 % (80 %) of the days in column 1 (column 2) could be coded. The smaller amount in column 2 is due to the fact that many of the text entries refer to temperature and winds. This variable is called “WeatherSymbText”.
Eimmart's diary entries were then compared with daily weather information from other sources (see Fig. 1 for locations). This includes a weather diary from Zurich; pressure measurements from London (Cornes, 2012a), Paris (Cornes, 2012b), Leiden, Halle, and Jena (Lundstad et al., 2023; see Supplement); temperature measurements from Paris (Rousseau, 2009; Pliemon et al., 2022), Berlin, Halle, and Kaliningrad (Lundstad et al., 2023; see Supplement); and wind direction information from ships in the English Channel (Wheeler et al., 2010; Barriopedro et al., 2014). Note that, first, many of the series only overlap partly with the Eimmart diary, thus limiting comparisons, and, second, their quality is mostly unknown. For instance, the Halle records of both temperature and pressure did not seem to be usable in their present form and were discarded. The following comparisons address the internal temporal consistency, the temporal agreement of the diary with other time series, the spatial consistency across Europe, and the consistency of daily wind direction with a large-scale pressure gradient.
More comparability options would exist on a monthly scale by comparing with monthly reconstructions. However, it is not straight forward to aggregate the daily weather information to a monthly level, and the focus of this paper is on the daily scale. However, I compared the weather diary with other documentary series (Burgdorf et al., 2023) and with monthly climate reconstructions for two specific cases, namely the summer of 1695 and the winter of 1697/98. For these case studies I used the ensemble mean of the reconstruction EKF400v2, which is a global, three-dimensional climate reconstruction based on data assimilation (Valler et al., 2022).
4.1 Time consistency of symbols, wind direction, and text
As a first step I analysed the frequency of each symbol per month over both columns. Due to the large number of symbols used, especially at the beginning, I ignored the temperature-related symbols (symbols 1–4, column 2), which only appear in the first 4 months, and grouped the symbols remaining related to the general weather characteristics and the sky into four main categories (see Fig. 4). I then counted each use of a symbol and divided it by the total number of symbols in that month. There might be several symbols per day or just one. Note also that text is ignored here.
The results (Fig. 4a) show what was already observed during the digitization, namely that in the beginning many different symbols appeared, whereas later basically only three symbols were used. The grey category of symbols vanishes almost completely, and from around 1698 onward the use of the symbols is rather consistent. Figure 4b shows the results obtained when simply ignoring they grey category of symbols. Their frequency over time changes less, but many days have no category. The corresponding figure for variable WeatherSymb (Fig. 4c) shows slightly different behaviour in the first years compared to later years. When text entries are also categorized (variable WeatherSymbText, Fig. 4d), no obvious inhomogeneity is seen. The figure resembles Fig. 4b, but now almost all days have a category. Note that cloudy conditions are more frequent because most text entries concern rain.
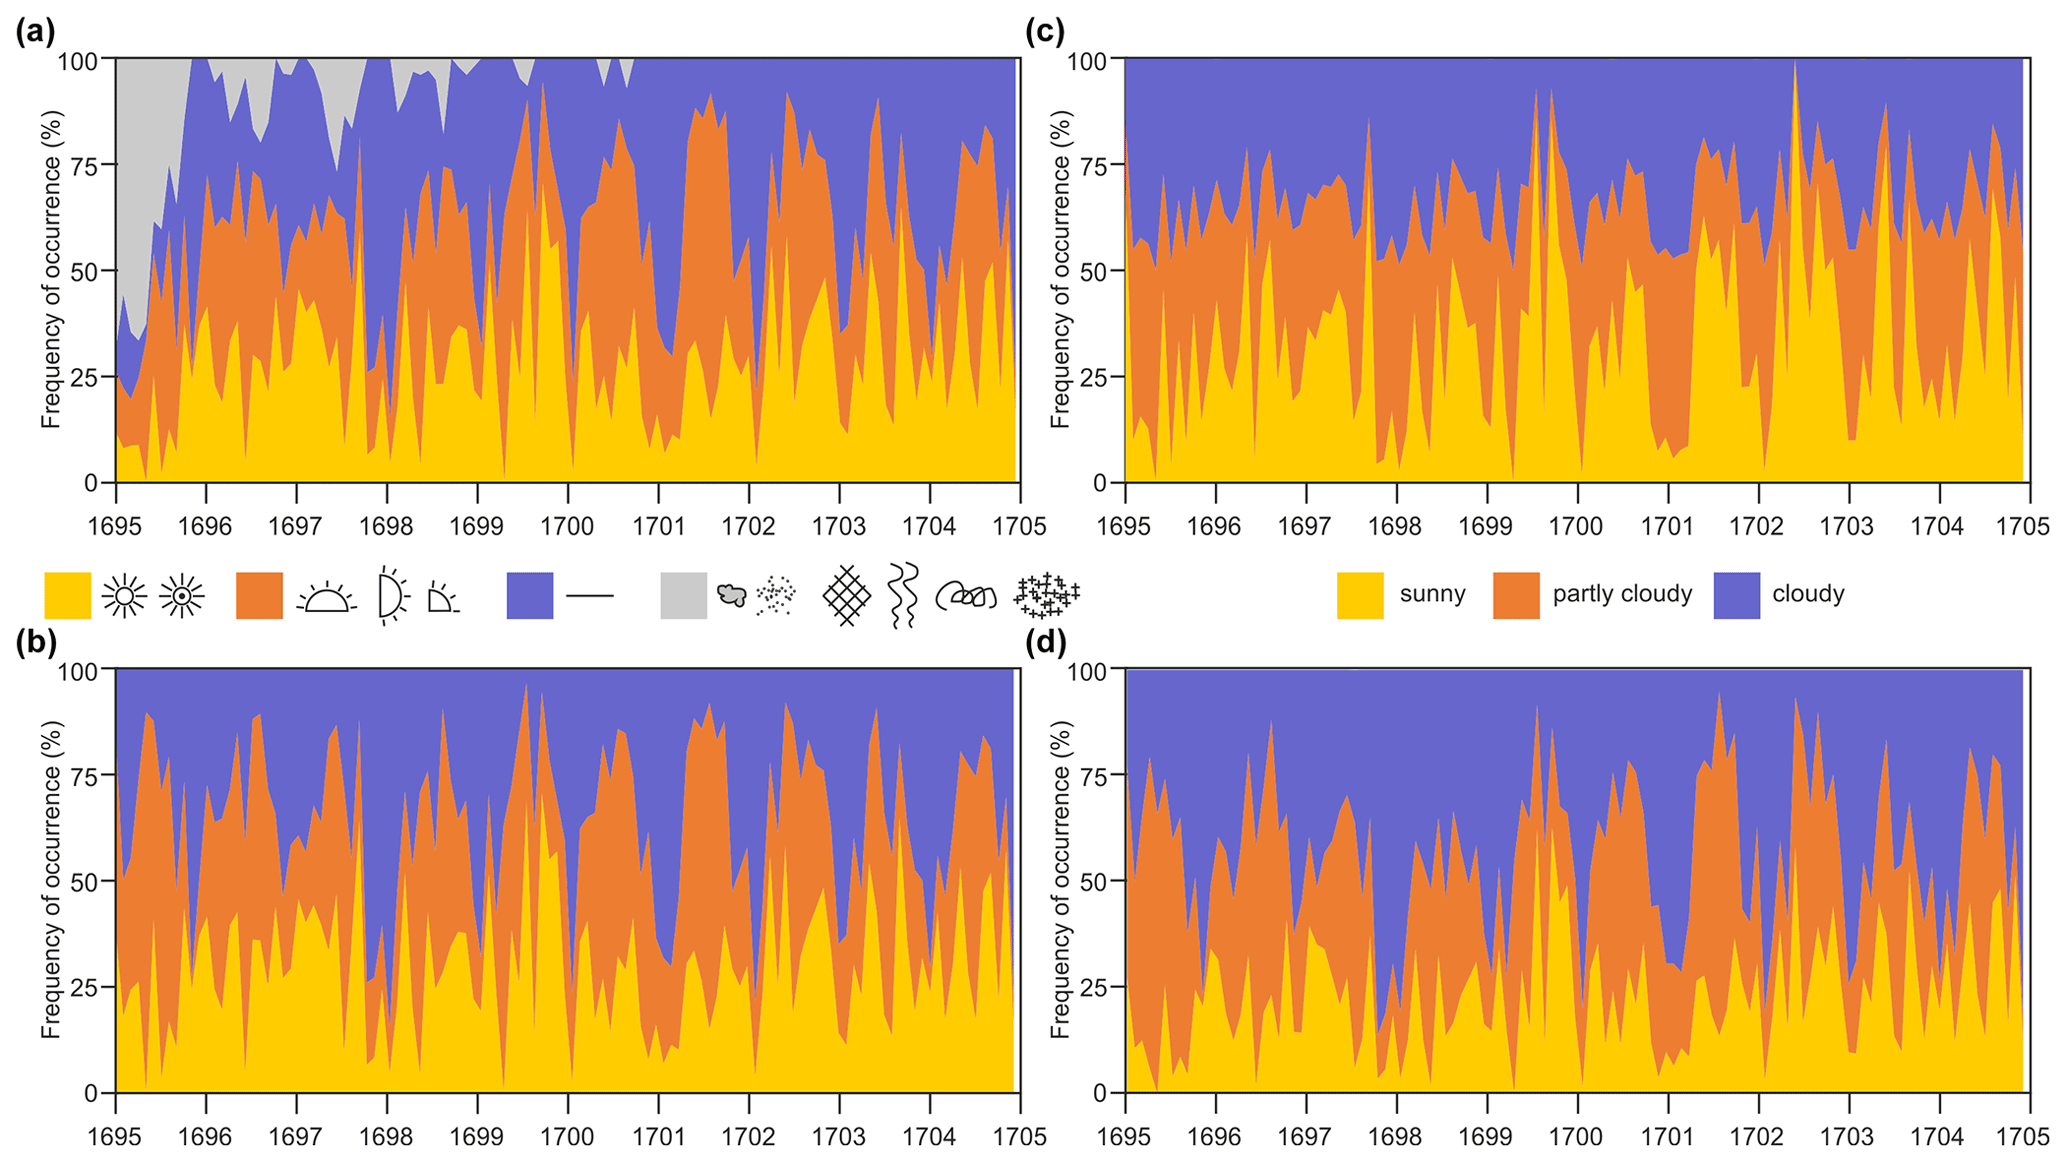
Figure 4Frequency of occurrence of weather symbols per month relative to all symbols in that month: (a) all symbols (grouped into four categories), (b) only the first three categories, (c) variable WeatherSymb, (d) variable WeatherSymbText.
Similar to the process used for the weather symbols, I also analysed the wind direction. I counted the letters for the cardinal directions (N, E, S, W, as well as one letter for mixed values), divided the counts by the number of letters per day, and then averaged the number per month. Note that in this procedure NW counts as two letters (each weighted half) and N as one. This allows a first, albeit simple, visualization of the data (Fig. 5a). Results show variations in occurrence, but no obvious inhomogeneity is seen in this plot.
The same was also done for the variable precipitation with its categories “snow”, “rain and snow”, and “rain” (Fig. 5b). Variability in precipitation is high, but once again there is no evidence for an inhomogeneity. Figure 5 indicates a decrease in rain days over the 10 years. However, this might be a true climatic signal. The large spike in the beginning of the series, in summer 1695, will be analysed later and is arguably real.
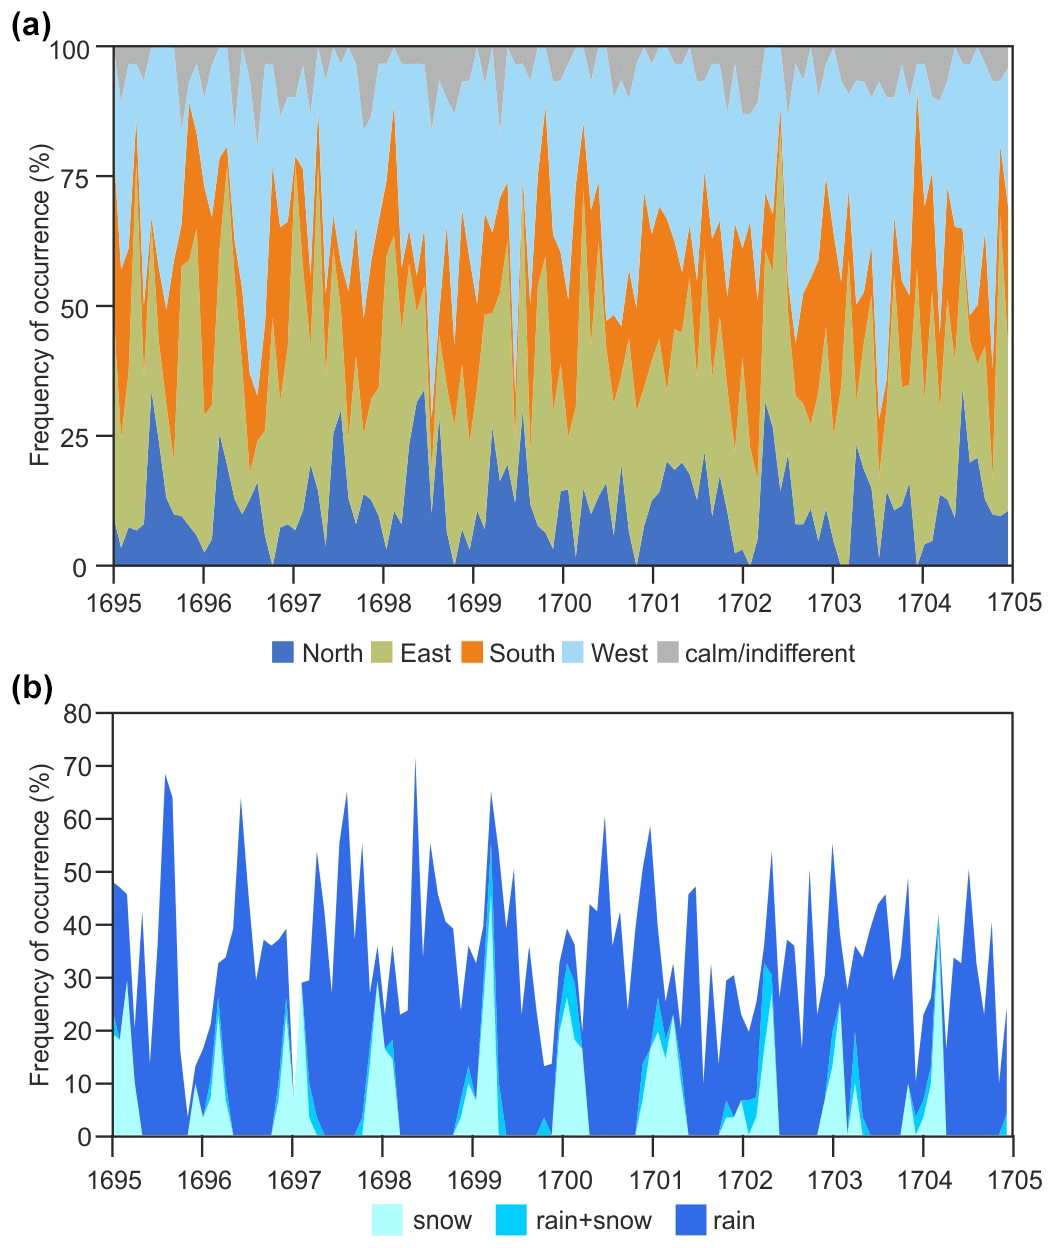
Figure 5Frequency of occurrence of (a) cardinal wind directions per month and (b) days with snow, rain and snow, or rain.
4.2 Analysis of the wind direction
As a next step I compared the daily wind direction in Nuremberg with the daily SLP gradient between Jena and Paris in the year 1702 (the only year for which data from Jena are available). A positive gradient is expected to correlate with winds from the south or east, whereas a negative gradient is expected to correlate with winds from the north or west. I therefore grouped the winds accordingly (S, SE, E, SW vs. W, NW, N, NE). Most of the days had only one wind direction. If more than one was noted, I excluded days that would fall into both categories.
To calculate the pressure gradient between Jena and Paris, I reduced the Jena data to sea level. As no temperature information was available, I assumed a sinusoidal seasonal cycle of temperature varying between −4 ∘C (in January) and 20 ∘C (in July). As the SLP data obtained in this way were clearly too low in Jena, I added the mean difference between Jena and Paris such that both series have the same mean. I analysed the data using a contingency table and by stratifying the SLP difference according to the wind direction.
The contingency table (Table 1) clearly shows a very strong association between pressure gradient and wind direction in the expected sense. A statistical test (Fisher's exact t) confirms the high significance of the results. However, while there are more cases with a negative than with a positive SLP difference (note that the average difference is zero), there are clearly more cases with an easterly-to-south-westerly wind than a westerly-to-north-easterly wind. The histogram of SLP difference (Fig. 6) also clearly shows a difference in the SLP gradient depending on the wind direction. Note that deviations are expected. Apart from the measurement errors and errors in the reduction to SLP, it should be noted that the SLP gradient may not be the best proxy for wind. Furthermore, Paris is relatively far away, and the wind over land is not geostrophic. Thermo-topographic winds or topographically channelled winds may overlay the large-scale flow. Wind is a variable with a high variability, and observations provide only a snapshot. Note that the time of day of observations is also not known. In light of these uncertainties, the clear presence of a signal is therefore encouraging.
Table 1Contingency table of wind observations in Nuremberg and SLP differences between Jena and Paris. The p value refers to Fisher's exact t.
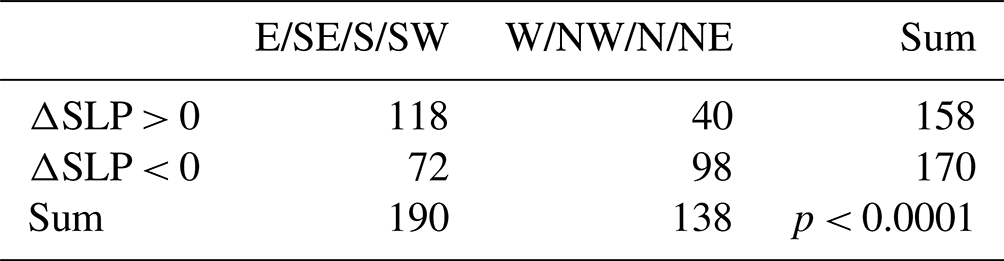
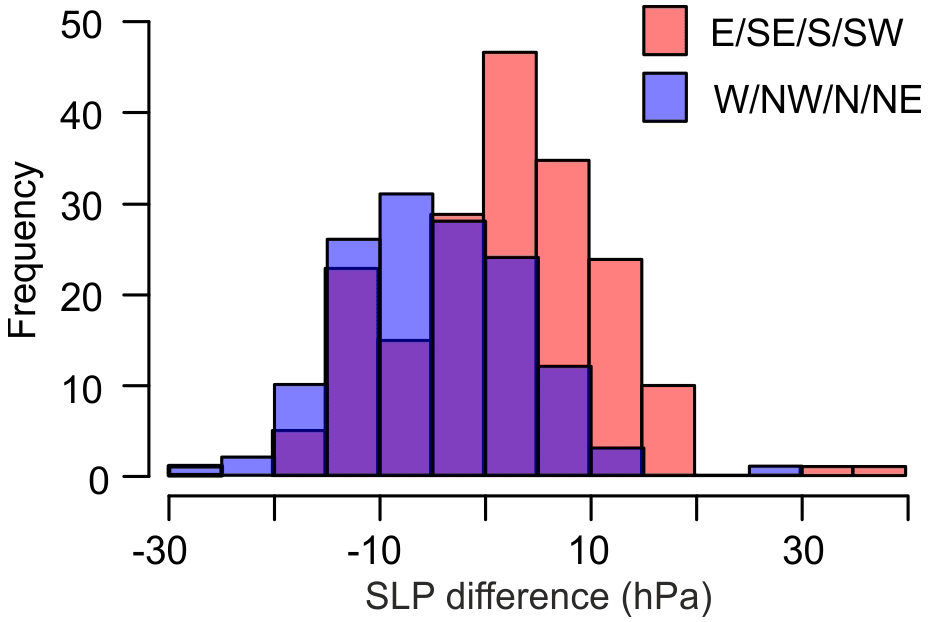
Figure 6Histograms of SLP difference between Jena and Paris stratified by the wind direction in Eimmart's diary.
4.3 Case studies
4.3.1 Weather maps for October–November 1702
Next I analysed the entries in Eimmart's diary together with all other available information for an 8 d sequence in 1702. The sequence was chosen as a strong storm was noted in this period in the observations from Kaliningrad in the night from 31 October to 1 November (Anonymous, 1703). Note that the year 1702 is arguably the year with the best data coverage within the 1695–1704 period. Instrumental data are available from Jena, Paris, London, Berlin, and Kaliningrad, and weather observations are available from Jena, Kaliningrad, Zürich, Nuremberg, and the English Channel. For display purposes, I deseasonalized (by fitting the first two harmonics of the seasonal cycle) and standardized the instrumental data with respect to the year 1702 and expressed the anomalies in standard deviations. For Berlin, where the observation hours change rapidly, I only used the 8 d displayed, chose the observation closest to 08:00 LT (local time) and standardized the temperatures.
The sequence of maps (Fig. 7) starts with mild temperatures, sunny or changeable weather, and moderately low pressure across Europe. The next day pressure increased in Paris and Jena, and it remained rather warm. Pressure remained low over Kaliningrad. The next 3 d saw a clear pressure increase over London, Paris, and Jena with westerly flow. Temperatures were high, especially on 30 October. Pressure and temperature then both decreased on the day of the storm. Pressure increased right after the passing of the storm, accompanied by a marked temperature decrease and mostly sunny weather.
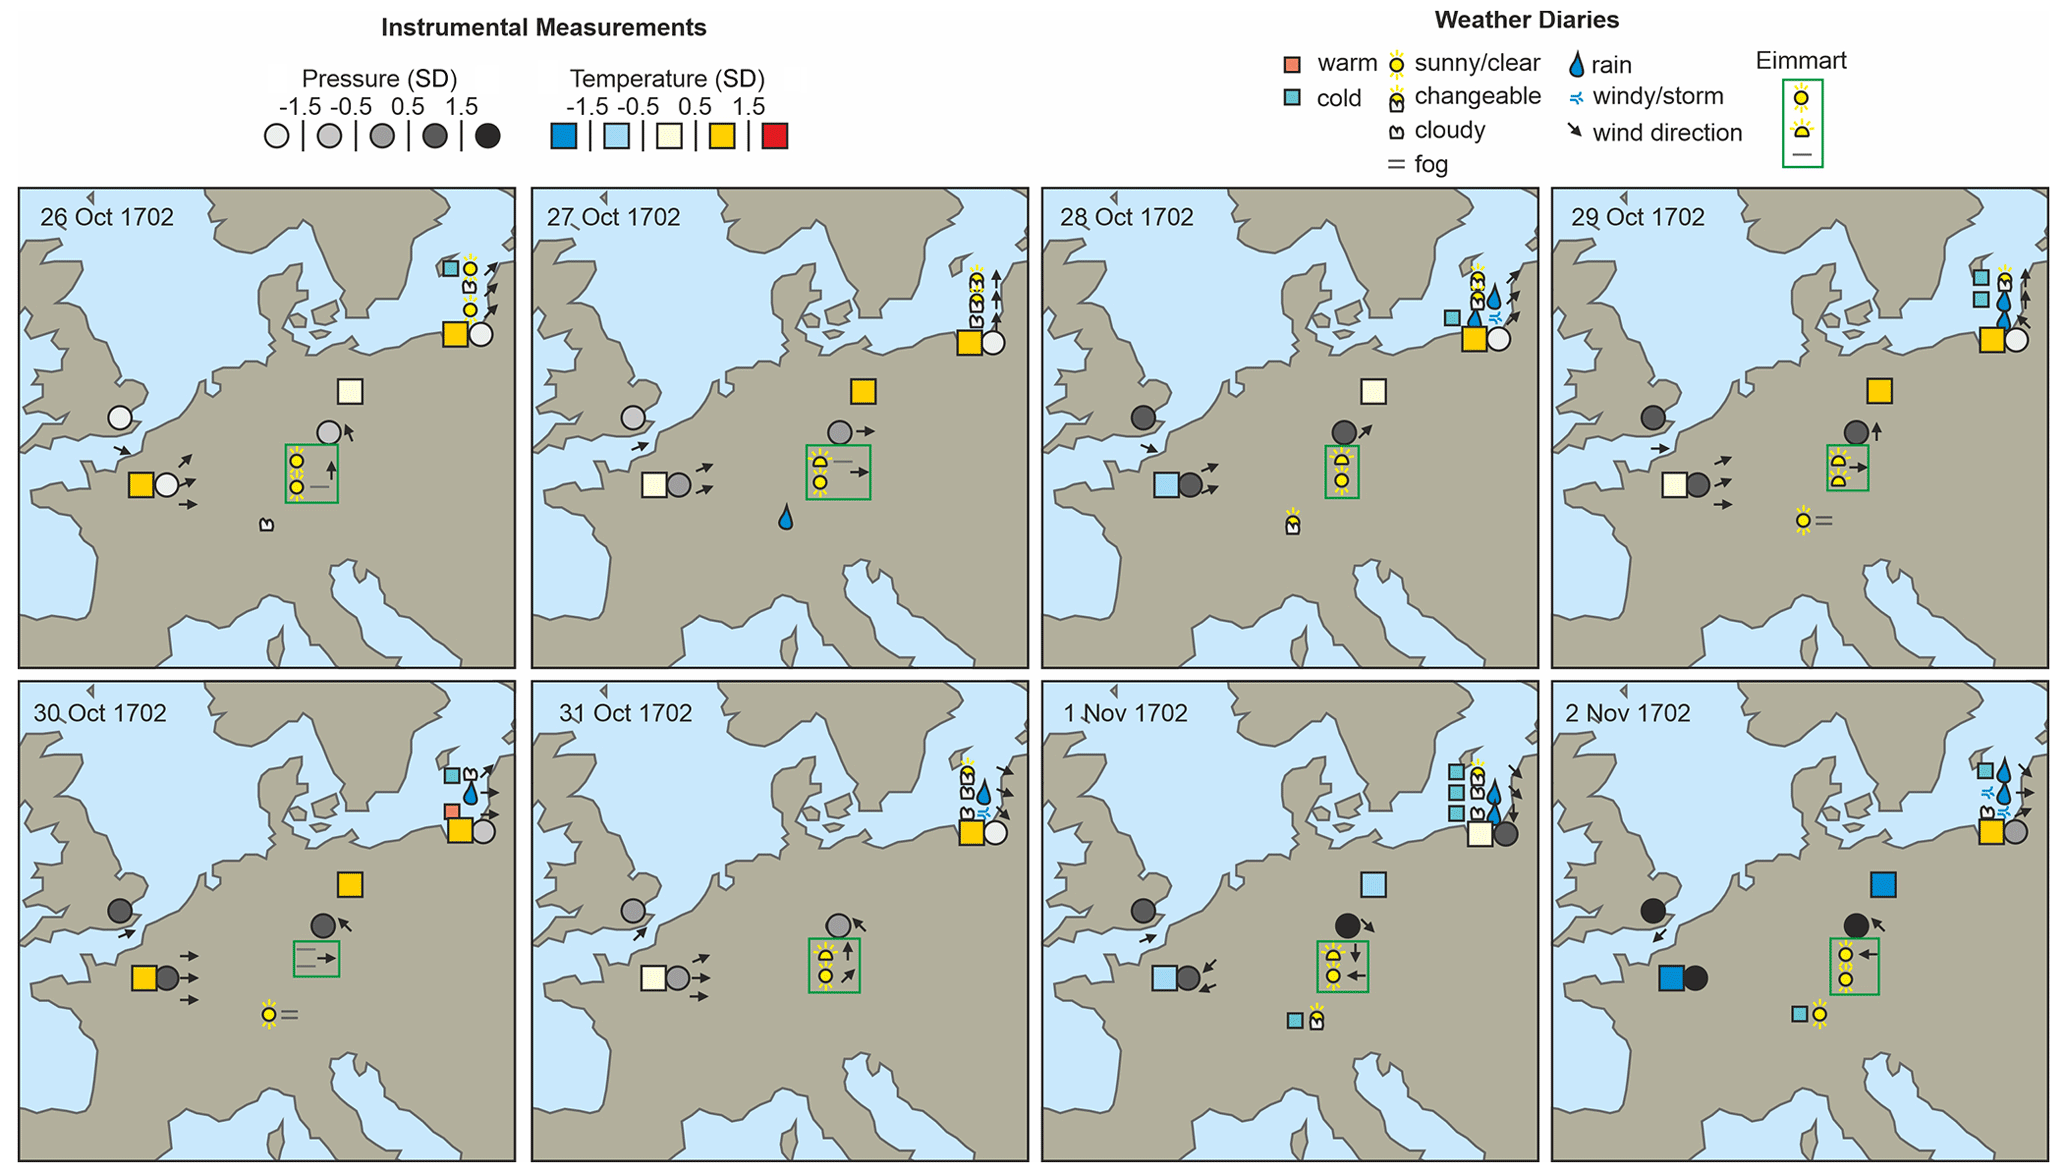
Figure 7Maps of pressure, wind, and temperature for an 8 d sequence in 1702. A vertical sequence of symbols at the same location indicates sub-daily data (progressing from top to bottom).
While this sequence is plausible, the spatial information is insufficient to draw weather maps. There could have been a quick succession of passing depressions over northern Europe that may have gone unnoticed. However, the maps depict the high-pressure system to the south. Also, the passage of a cold front on 1 November is clearly seen.
4.3.2 The harsh winter of 1687/88
The second case study relates to the harsh winter of 1697/98. This winter is particularly well known in England (Kington, 1999), where it was the coldest among six very cold winters in the 1690s. However, the winter was also cold over central Europe (Pfister and Wanner, 2021). A number of European weather series exist on a daily scale for this winter, including pressure in London, Paris, and Leiden; temperature in Paris; wind over the English Channel; cloud motion and cloud cover from Paris; and weather observations from Zurich and Nuremberg. All observations are shown as time series in Fig. 8.
Temperature measurements in Paris and notes on temperature in the Zurich series point to a sequence of many cold spells during the entire winter and spring. For Nuremberg, notes on temperature are more sparse, but they also agree with the two other series. According to Kington (1999), the first snow in London fell on 24 November. In Nuremberg and Zurich, snowfall is reported on 22 November. We also see periods of higher temperature and thawing weather (or rainfall), such as in early December. A snowy and cold period follows at all sites in mid-December. January was particularly cold in Paris, London, and Zurich. A notable pressure drop occurred in Paris on 1 February 1698, arguably associated with a warm front (Kington, 1999). Temperatures increased everywhere, and precipitation fell as rain in Nuremberg (note that the temperature increase here occurred ca. 2 d later than in Paris). The first half of March was again cold at all sites. Cold spells again occurred in late April and early May. In fact, May 1698 is still the coldest May on record in the central England temperature series. This brief analysis shows that the daily series are consistent with each other. Even wind directions agree well for locations close to each other (e.g. English Channel and Paris).
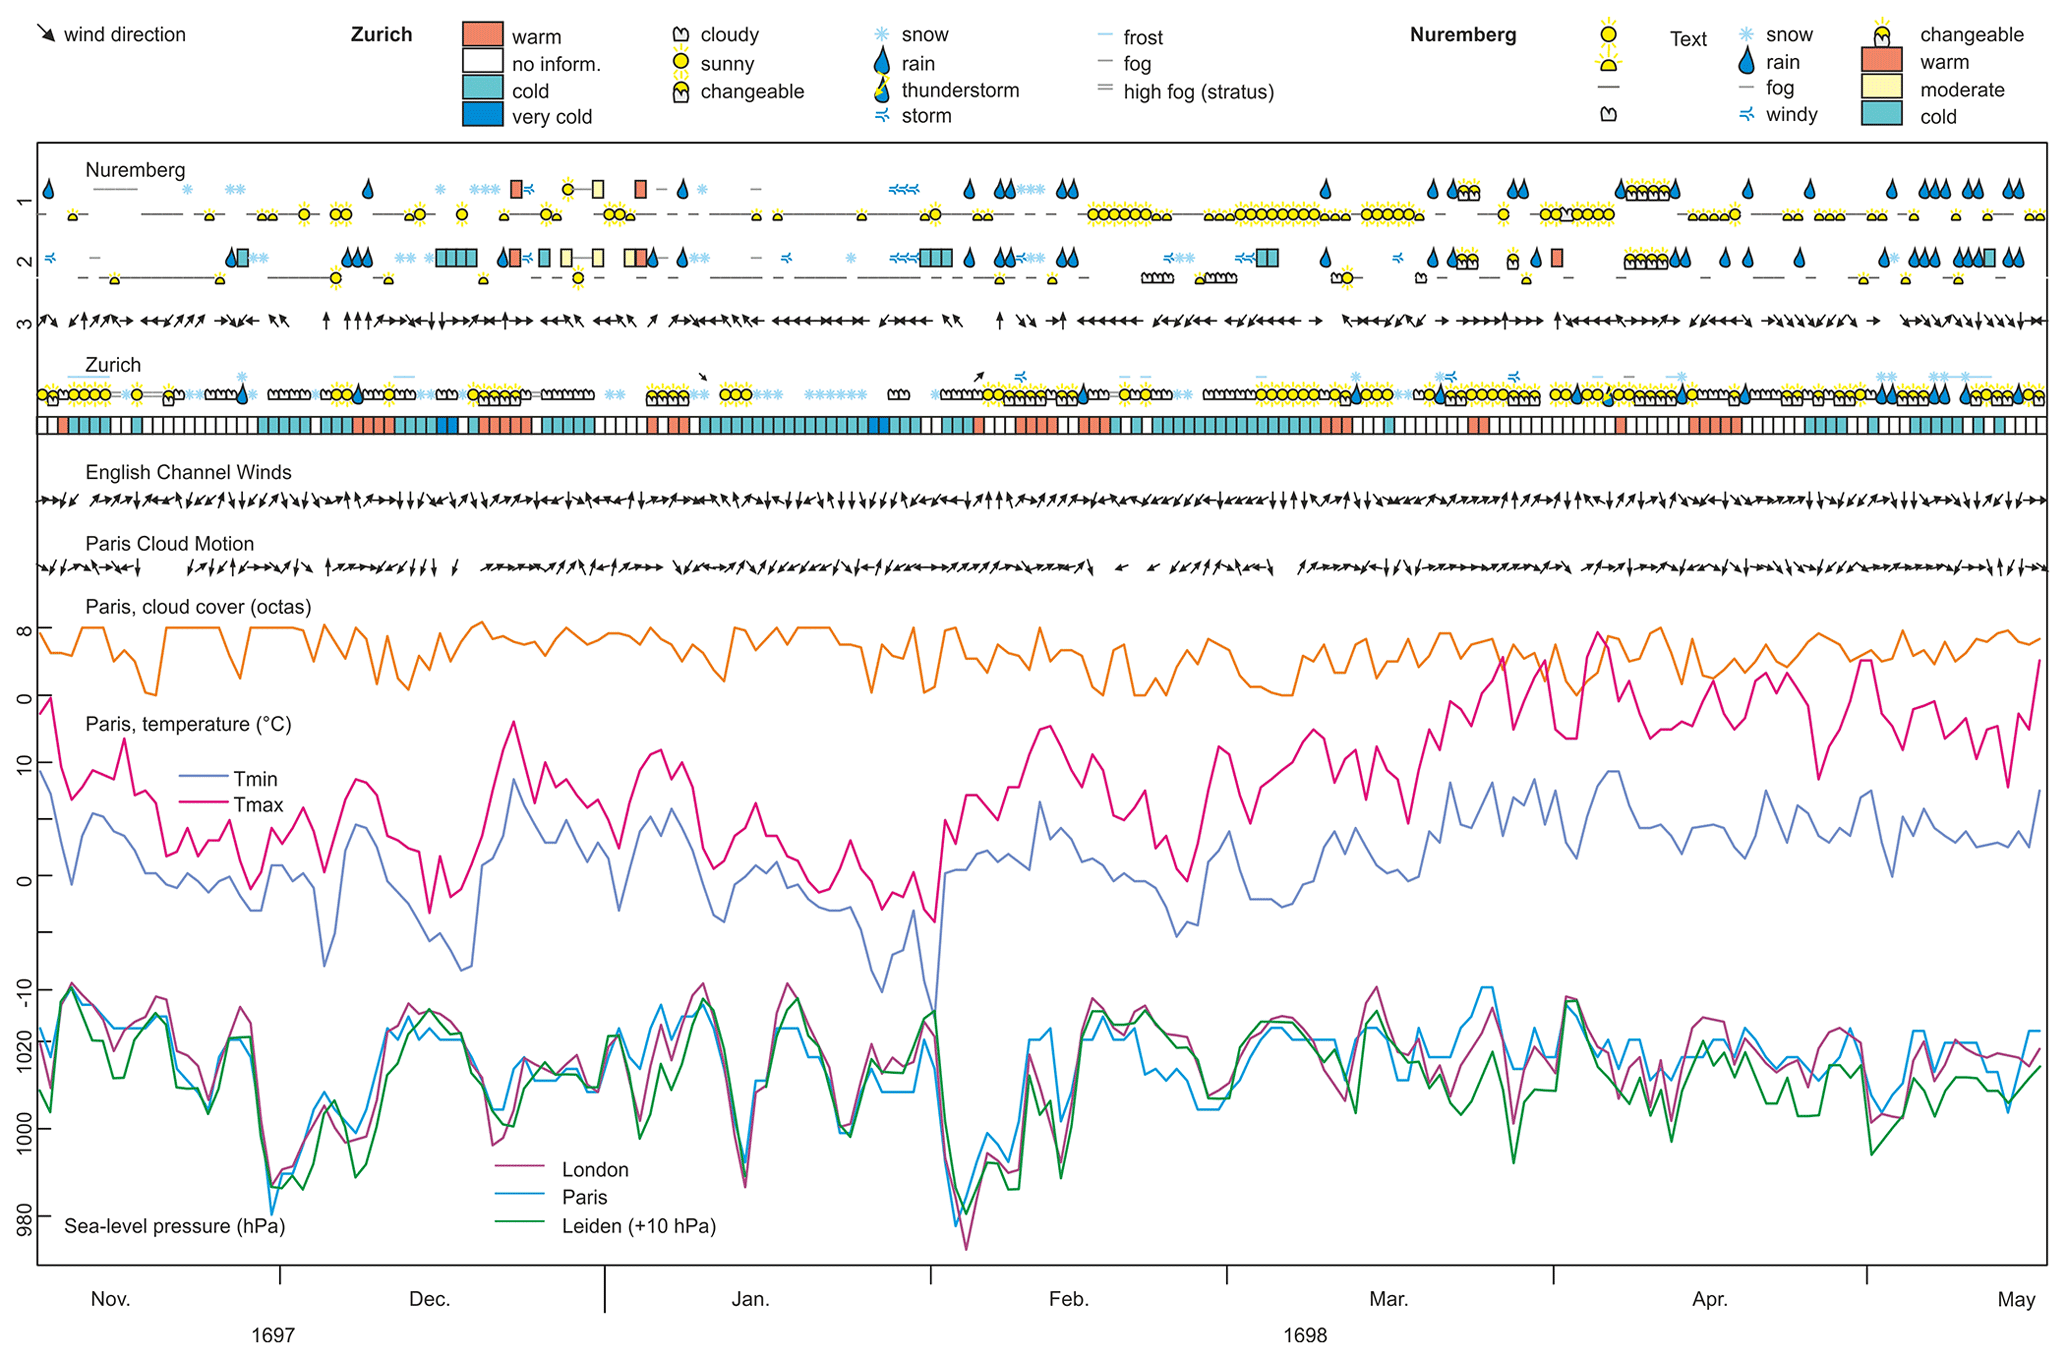
Figure 8Daily weather in the winter 1697/98. For Nuremberg, 1 to 3 marks the columns, which have been subdivided into text entries that were transformed into symbols (upper line) and symbolic entries (lower line).
As a further opportunity for comparison, I considered the chronicle by Johann Laurentz Bünti (Bünti, 1973) from central Switzerland, which points to snowfall on 3 and 8 May and again on 21 May (“Hierauff folget den 3. May ein Schnee […] Den 8.ten May hat man wiederum im ganzen Boden Schnee.”). Bünti writes that precipitation was very high and that it fell as snow in the mountains, such that there was more snow in the mountains in May 1698 than in many winters.
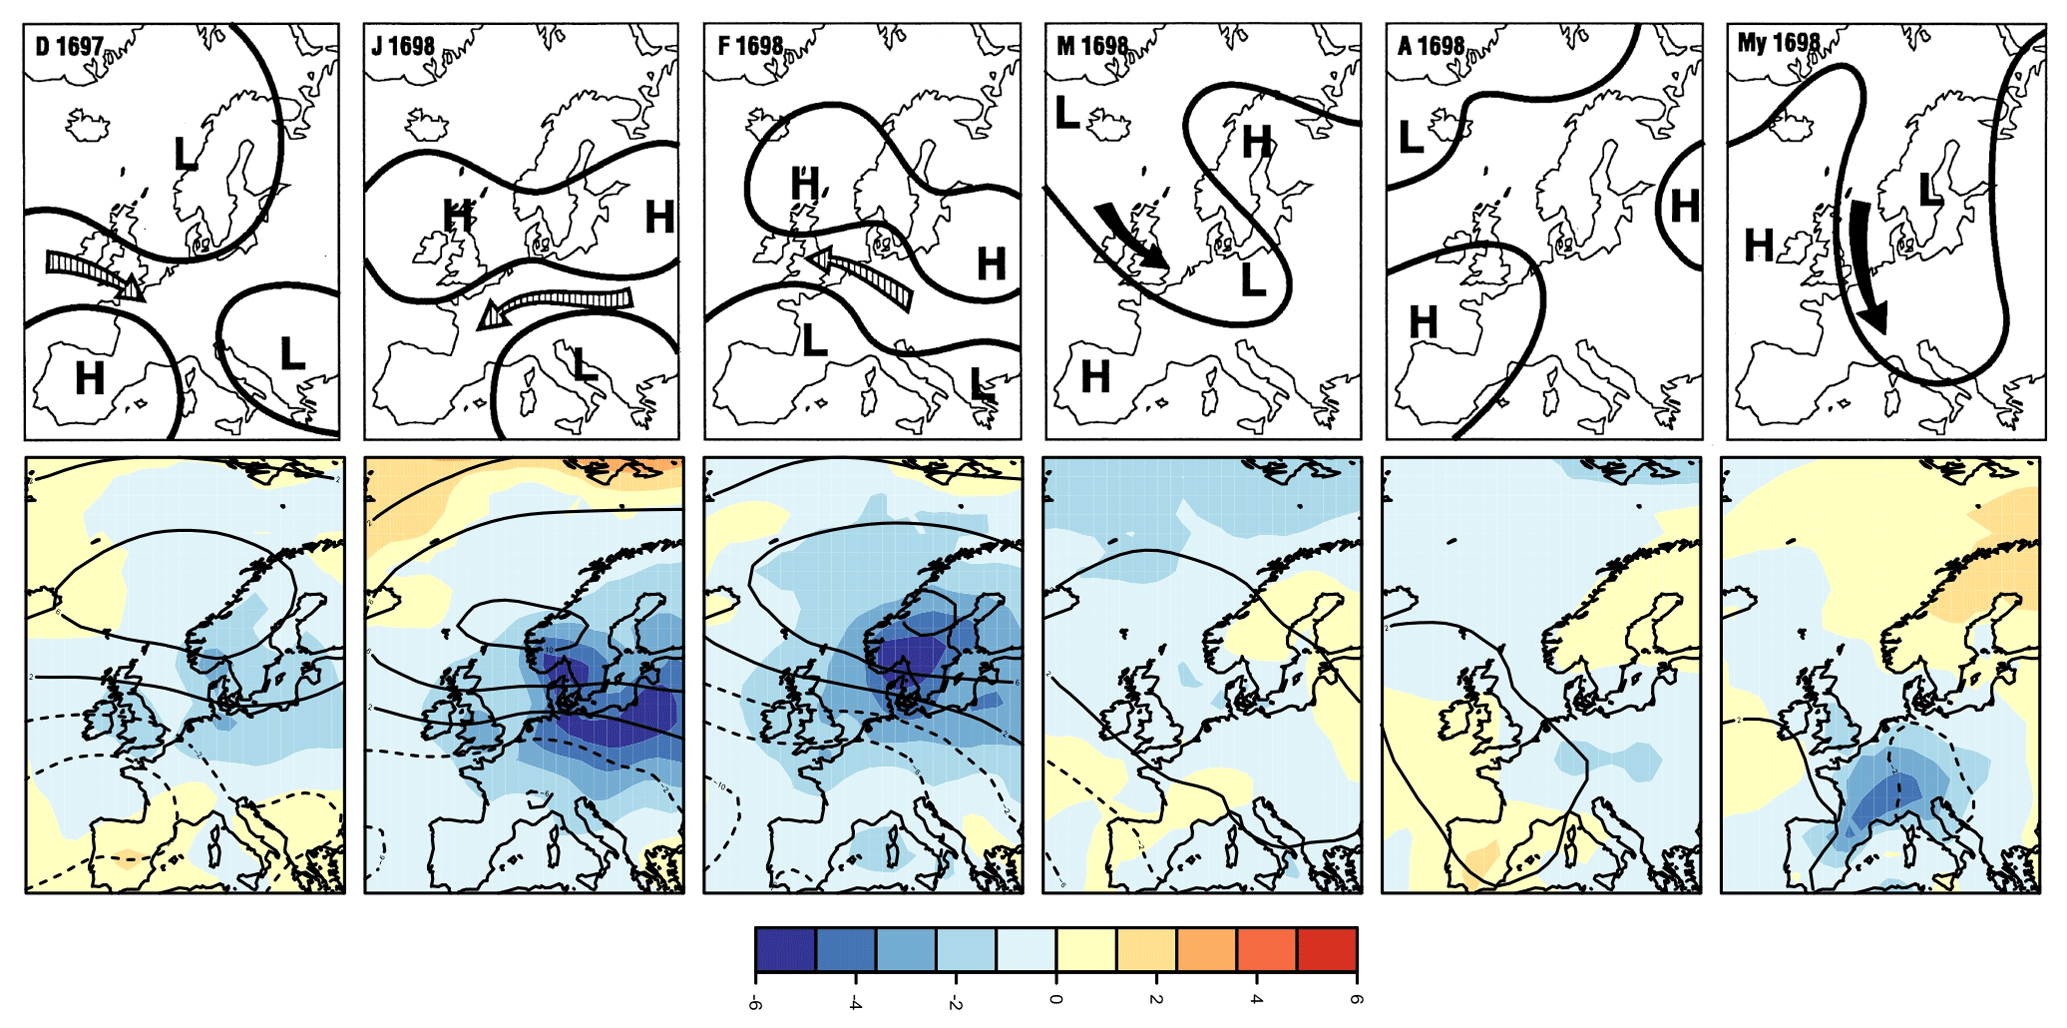
Figure 9Monthly temperature (colours) and pressure anomalies (contour, in hPa) relative to the period 1698/99 to 1727/28 from EKF400v2 (top) and an expert reconstruction of the pressure distribution and main flow for the same months from Wanner et al. (1995).
To further investigate this winter, I analysed temperature and pressure anomalies in the monthly reconstruction EKF400v2 (Fig. 9). The fields are expressed as anomalies from the subsequent 30-year period. The December–February patterns in sea level pressure resemble the positive easterly index in Mellado-Cano et al. (2020), and in fact easterly wind components are soon found in winds in the English Channel, cloud motion in Paris, and Eimmart's observations in Nuremberg. Figure 9 also shows hand-drawn pressure maps by Wanner et al. (1995). These fields have no scale (and are here compared with anomalies). However, analysing the position of highs and lows (or positive and negative anomalies), I find a mostly good agreement, indicating that the data assimilation approach and an expert approach give consistent results. Into these we can now embed the weather diaries. The fields show that January and February were actually even colder in central Europe than in western Europe. In January, Eimmart notes mostly easterly winds and a horizontal line, arguably denoting a persistent stratus. These features stand out over the 10-year period and are also clearly seen in Fig. 4 (increased blue area) and Fig. 5 (increased green area denoting easterly winds). This is very closely in line with the monthly charts shown in Fig. 9. The cold spells in May seemed to have had more pronounced effects in Zurich than in nearby Nuremberg, consistent in the reconstructed fields, the hand-drawn fields, and the diary entries.
4.3.3 The summer of 1695
Finally, I also analysed the summer of 1695, which is known as a very cold summer (July 1695 was the second coldest July in the central England temperature series behind 1816). The summer was also cold in Switzerland. Bünti (1973) writes that 1695 was a late and wet year, with frequent summer snowfall events in the Alps (“Sonsten ist dissess 1695. Jahr ein spätes und nasses Jahr gesein; im Summer [wurden] offt die Alpen überschnyt”).
For this case, I analysed the variables “Precipitation” and WeatherSymbText from Eimmart's diary and temperature and weather conditions in Zurich in June to August. I compared the frequencies in 1695 to those obtained in 1696–1704 (Fig. 10). I also compared the result to documentary climate data for that summer and to EKF400v2. For comparison, I standardized both based on the 1696–1704 period (EKF400v2 is also shown as anomalies without standardizing). Although this is a small sample, it is the longest statistical analysis the Eimmart diary allows.
The summer of 1695 was clearly less sunny in Eimmart's diary, while cloudy conditions were more frequent. Also, there were more days with precipitation in June–August 1695 than for the average of all other summers. Very similar behaviour is found in Zurich, where sunny conditions were less frequent and “changeable” conditions were more frequent. A clear signal is also found in the temperature notes of Zurich. Cold days were about twice as frequent in 1695 than in the reference period, mostly at the expense of very warm days. For Nuremberg there are too few temperature notes for an analysis.
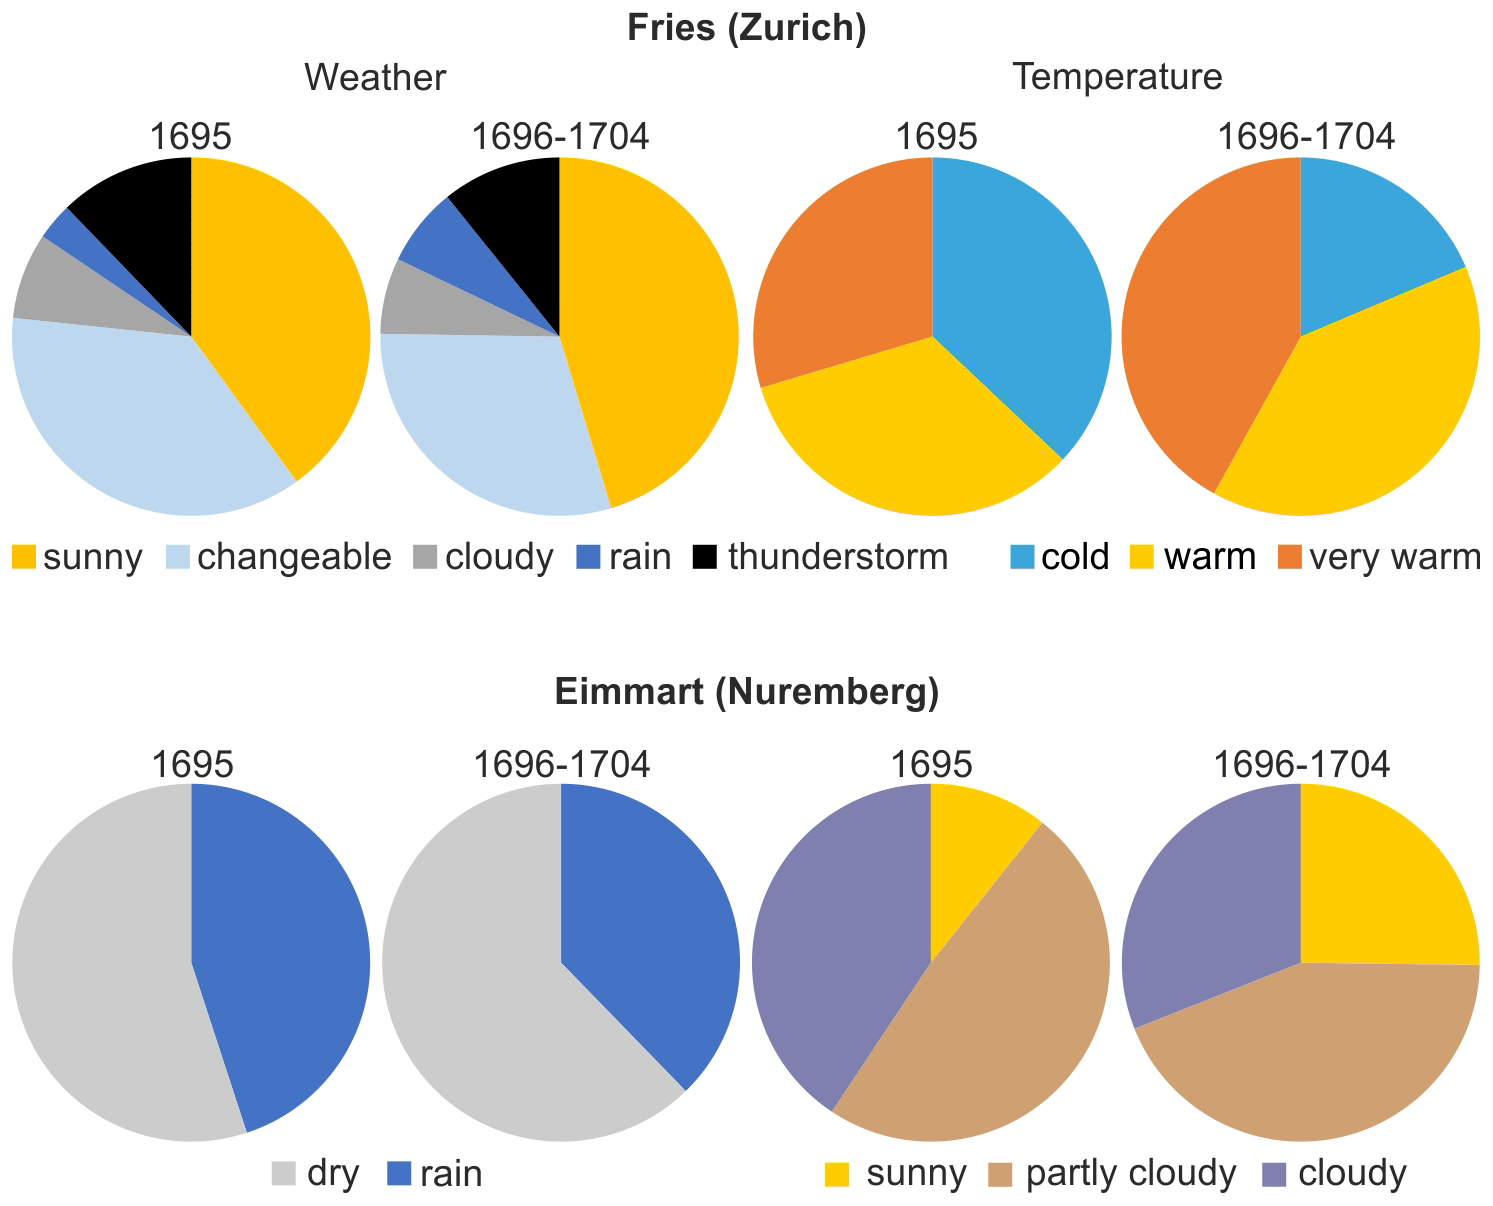
Figure 10Frequency of weather descriptions in the diaries of Eimmart (Nuremberg) and Fries (Zurich) for the summer (June–August) of 1695 and for the remaining nine summers of Eimmart's observation period.
The two diaries can now be compared to two further sources on that summer: documentary data (Fig. 11, top, Supplement) and reconstructions (Fig. 11, bottom). Both sources show that it was cold particularly in the north-east of the domain, less so in western France and Spain. The documentary data indicate no specifically cold period in Italy, whereas the reconstruction suggests somewhat lower temperatures (note that the documentary data and reconstructions are largely independent, and only the monthly index series indicated in Fig. 11, top, with “JJA” were assimilated into EKF400v2). Zurich and Nuremberg were both in a region that was affected by the adverse weather, although this was not in the core region of this climatic anomaly.
The weather diary by Georg Christoph Eimmart from Nuremberg, covering the period 1695 to 1704, might be a useful addition to the compilations of existing weather diaries. The diary stands out in that it is mostly symbolic for sky conditions and is expanded with wind direction data and text information for precipitation and temperature. Although there are quite large changes in the use of symbols and in text in the first 1–2 years, derived variables that group sky conditions and precipitation each into three categories according to both symbols and text show no sign of inhomogeneity. The same result is found for wind direction. Observations seem to have been performed in a consistent manner over 10 years.
The diary compares well with other sources of information, such as the diary from Fries in Zurich. It also compares well with instrumental data, as demonstrated by comparing wind direction with a large-scale SLP gradient. This confirms that the diary has useful information not only on climate but also on the daily weather. Combining this diary with other available observation series shows that there is spatial information in the combination of all weather data. Some features, such as the passing of a cold front, can be clearly seen, but it is still difficult to draw detailed weather maps directly from this information. Several more series will be available in the near future and might further help towards that aim. However, there is also information in the time sequence of weather at each of these sites. Given the sparse information in space, it is essential to also exploit the information in the time sequence. Novel approaches such as deep-learning algorithms might potentially be used for weather reconstruction but arguably would have to make use of time sequences in order to be successful. Such methods first need to be tested extensively in long data sets generated from recent products using tools such as synthetic weather diaries (Brönnimann, 2020).
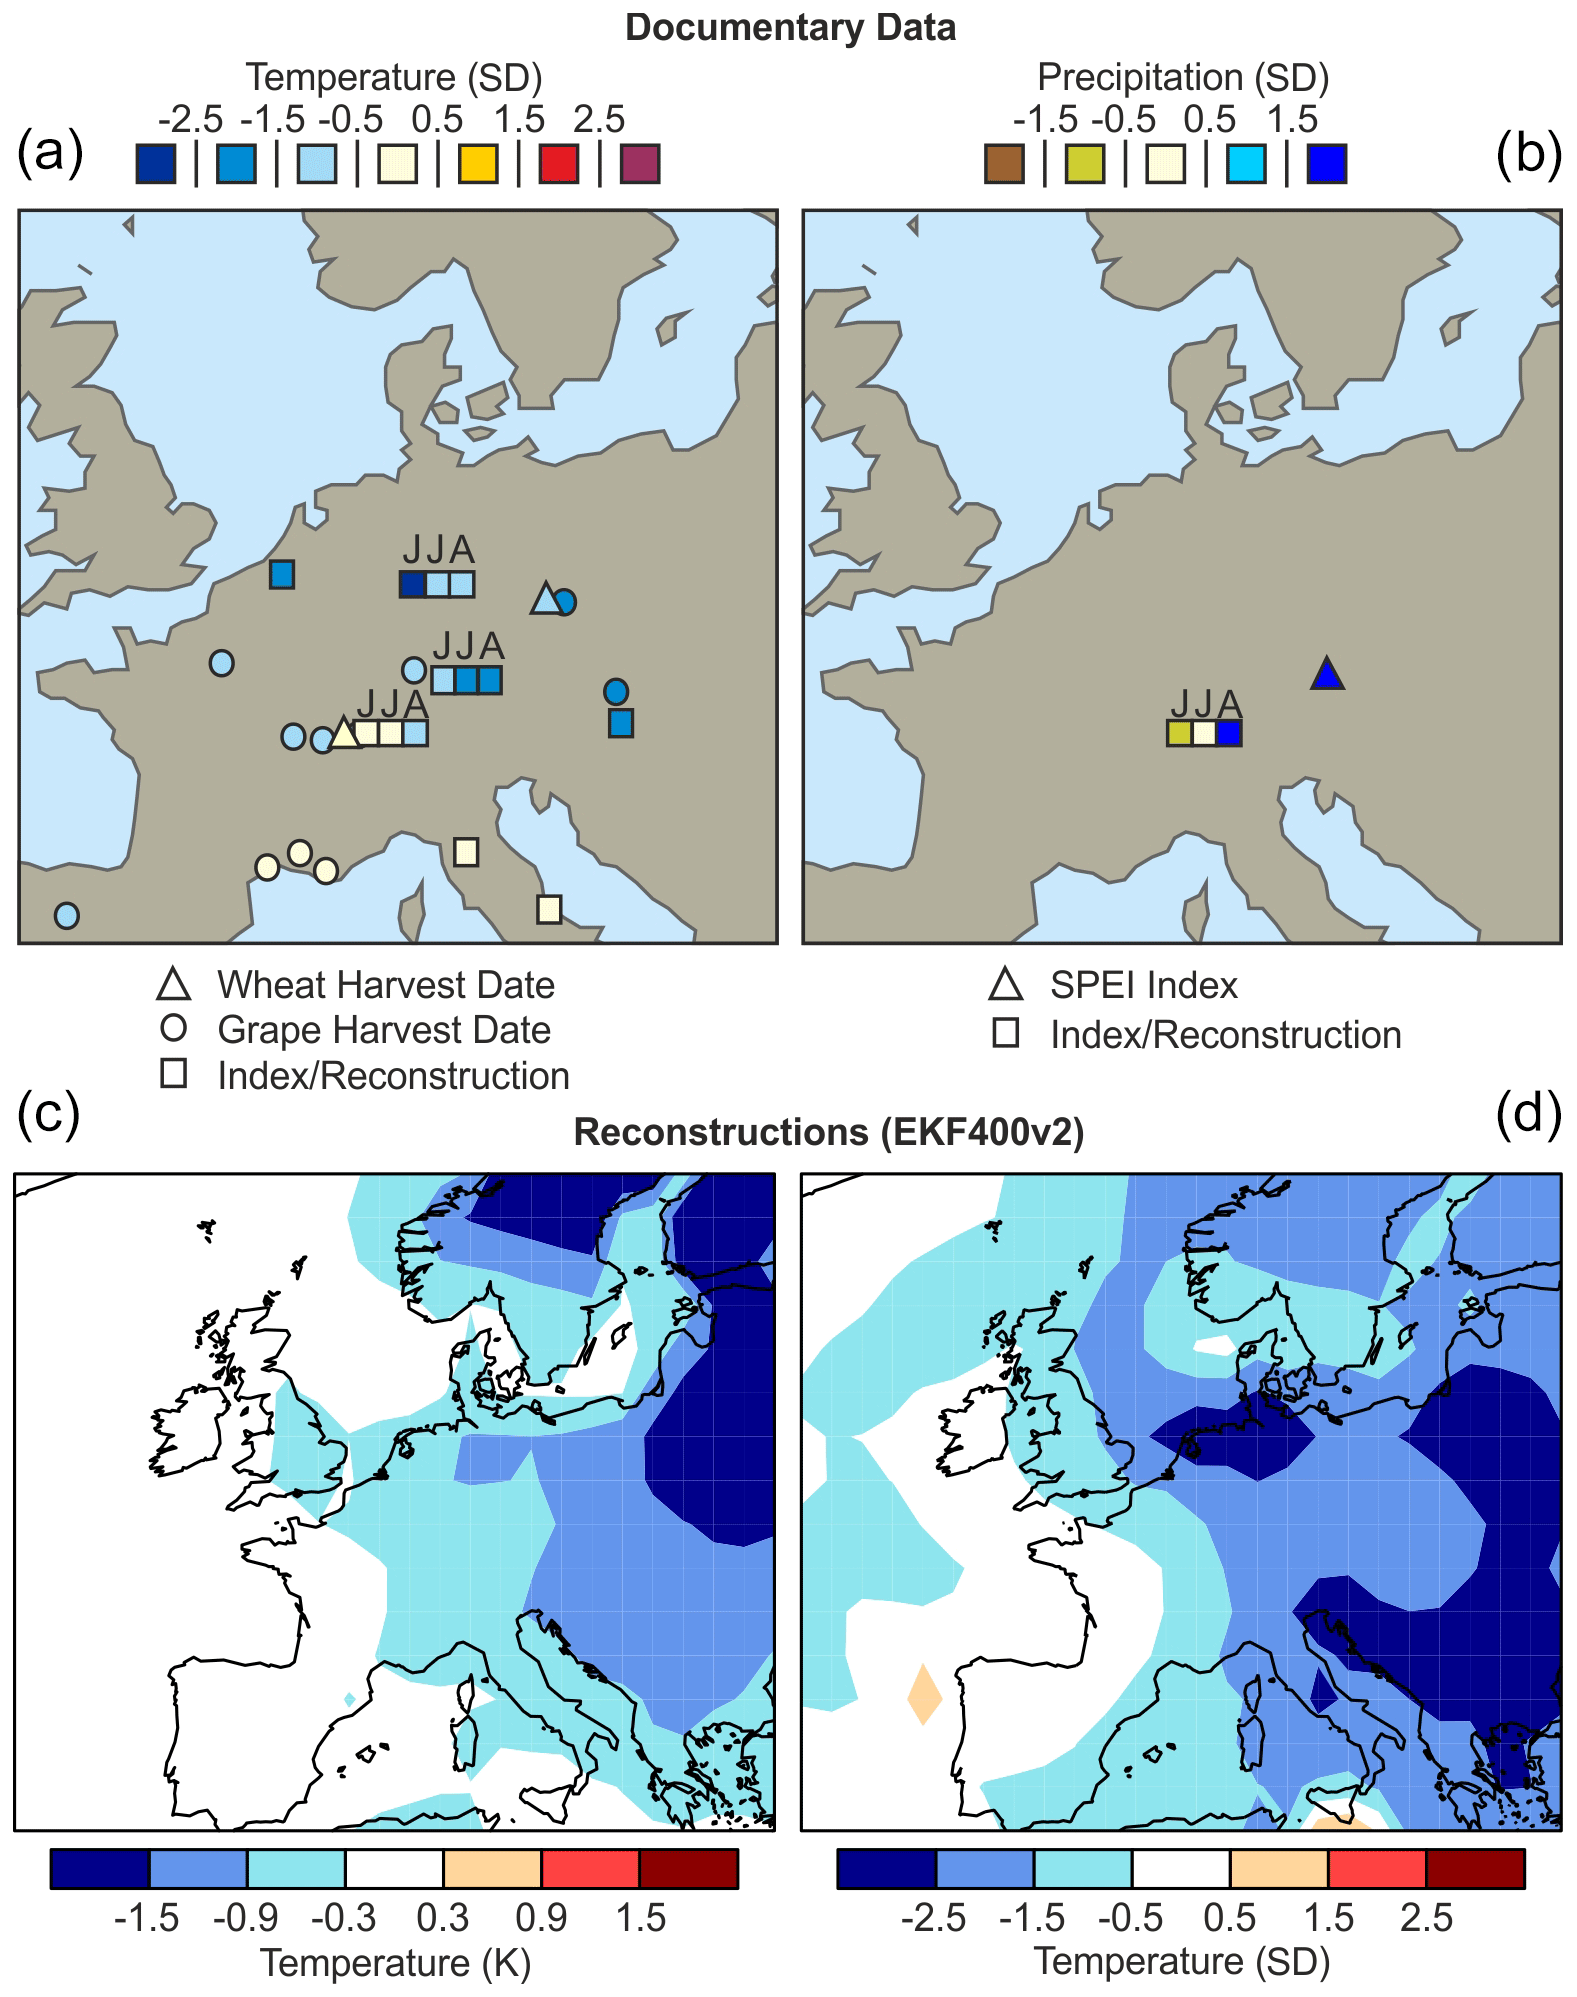
Figure 11(a–b) Standardized anomalies (relative to 1696–1704) of documentary data from Burgdorf et al. (2023) for temperature and precipitation. (c–d) Anomaly (left) and standardized anomaly (right, both relative to 1696–1704) of temperature in EKF400v2. Note that EKF400v2 includes the four monthly series shown in the top row (three temperature indices and one precipitation index) but not the other series.
Finally, the diary, together with other sources of information, provides some insights into the climate processes in the 1690s, a period that was characterized by cold winters in Europe and also cold and rainy summers. The winters such as 1697/98 were likely characterized by frequent blocking and a meridionalization of circulation. This is also seen in Eimmart's diary. The pressure difference between Paris and London (Cornes et al., 2012a, b) exhibits its lowest values (winter average) in the 1690s (the winters 1695, 1694, 1692, and 1698 occupy ranks 1, 2, 4, and 11). The North Atlantic Oscillation index calculated from EKF400v2 also shows low values in these years (see Brönnimann, 2022).
These winters fell into the so-called late Maunder Minimum (Luterbacher et al., 2001), when sunspot activity was very low. In fact, these cold winters have often been attributed to low solar activity. A more meridional circulation with more frequent blocking events due to low solar activity would be in line with statistical analyses of later data (Woollings et al., 2010). In addition to solar forcing, volcanic eruptions could also have played a role. Eruptions occurred in 1693 (Hekla, Serua) and 1694 (Komagatake), and although winters following volcanic eruptions sometimes show a winter warming in north-eastern Europe, this dynamical effect does not always appear, and cold seasons following volcanic eruptions may also be cold. The summer case (1695) shows the cooling expected following a volcanic eruption (Raible et al., 2016); documentary data confirm this also on a hemispheric scale (Burgdorf, 2022). Whether cold winters and cold summers in the 1690s are related remains to be studied. There are several possible memory effects that might help to maintain the cooling from the summer to the next winter and spring, including the oceans (Raible et al., 2016) and Eurasian snow cover (Reichen et al., 2022). All factors together may have generated a decade of cold weather similar to the early 19th century (Brönnimann et al., 2019b), when both summers and winters were cold particularly over Eurasia. Historical weather diaries could help to further shed light on climate mechanisms operating on a decadal scale related to volcanic eruptions and a solar minimum. However, more weather and climate data are needed for this.
The first instrumental series in Nuremberg covers 1718–1730 (observer: Rost, 3–4× daily), and another series (observer: Doppelmayr, daily) covers 1732–1743 (see Brönnimann et al., 2019a). Both were digitized and are included in the electronic Supplement. Both also contain wind direction, such that a 1695–1743 record of sub-daily wind could be generated. However, homogeneity needs to be assessed.
This paper describes the digitization of the weather diary of Georg Christoph Eimmart. The diary contains information on sky conditions (in symbolic form), precipitation, temperature, and wind in Nuremberg for the period 1695–1704. It is relevant as the 1690s were a particularly cold decade in Europe. At the same time, this approximately marks the period back to which daily reconstructions of weather might be possible. The newly digitized diary might contribute towards this aim.
The diary structure changes during the first ca. 2 years, but afterwards the diary is consistent (wind data are consistent throughout the period). Comparisons with other series from Europe show that the diary provides useful and usable information on the daily weather. For instance, the local daily wind direction in Nuremberg agrees with the large-scale pressure gradient. The usefulness is further demonstrated on behalf of several case studies, covering a storm passage in October–November 1702, the cold winter of 1697/98, and the cold summer of 1695. These cases also show that the spatial information at the daily level is inevitably sparse in the late 17th century. Any approach to reconstruct the daily weather during this time arguably needs to make use of the temporal and spatial information contained in all available data sources.
R code to produce Figs. 9 and 11 is given in the Supplement.
The diary is in the Supplement, EKF400v2 is available from DKRZ/WDCC (https://doi.org/10.26050/WDCC/EKF400_v2.0, Franke et al., 2022), the Fries diary is available from EURO-CLIMHIST (https://www.euroclimhist.unibe.ch, Pfister et al., 2017), pressure data from Paris and London are available from the Climatic Research Unit (https://crudata.uea.ac.uk/cru/data/parislondon/, last access: 10 July 2023; Cornes et al. 2012a, b), and data of cloud cover and direction and temperature from Paris are available from Pliemon et al. (2022). Documentary data are available from https://doi.org/10.48620/167 (Burgdorf et al., 2022).
Additional files include the diary in xls; the data files for Jena, Kaliningrad, Leiden, and Nuremberg (instrumental data) in the SEF format and xls; an ASCII file with the documentary data (Fig. 10); R code; and a readme file. The supplement related to this article is available online at: https://doi.org/10.5194/cp-19-1345-2023-supplement.
The author has declared that there are no competing interests.
Publisher's note: Copernicus Publications remains neutral with regard to jurisdictional claims in published maps and institutional affiliations.
I would like to thank Andrey Martynov for his help in obtaining the diary, Juhyeong Han for her help in digitizing it, and Yuri Brugnara for coordinating the digitizing work. Hans Gaab and Klaus-Dieter Herbst pointed me to the diary. I also thank Heinz Wanner for the hand-drawn reconstructions and Rolando Garcia-Herrera for providing the wind data. The simulations underlying EKF400v2 were performed at the Swiss Supercomputer Centre (CSCS).
This research has been supported by the Schweizerischer Nationalfonds zur Förderung der Wissenschaftlichen Forschung (grant no. 188701) and the European Research Council, H2020 European Research Council (grant no. 787574).
This paper was edited by Chantal Camenisch and reviewed by two anonymous referees.
Anonymous: Curiöser Wetter-Calender/ Oder Beschreibung des Gewitters/ Wie solches im Jahr 1702. in der Königl. Preuß. Residenz-Stadt Königsberg/von Tag zu Tage/durchs ganze Jahr observiret und auffgezeichnet worden. Kaliningrad, 61 pp., http://resolver.staatsbibliothek-berlin.de/SBB0000599300000000 (last access: 10 July 2023), 1703.
Barriopedro, D., Gallego, D., Álvarez-Castro, M. C., García-Herrera, R., Wheeler, D., Peña-Ortiz, C., and Barbosa, S. M.: Witnessing North Atlantic westerlies variability from ships' logbooks (1685–2008), Clim. Dynam., 43, 939–955, 2014.
Brázdil, R., Kiss, A., Luterbacher, J., and Valášek, H.: Weather patterns in eastern Slovakia 1717–1730, based on records from the Breslau meteorological network, Int. J. Climatol., 28, 1639–1651, 2008.
Brohan, P.: Machine Learning for Data Assimilation, http://brohan.org/Proxy_20CR/ (last access: 2 July 2023), 2022.
Brönnimann, S.: Synthetic weather diaries: concept and application to Swiss weather in 1816, Clim. Past, 16, 1937–1952, https://doi.org/10.5194/cp-16-1937-2020, 2020.
Brönnimann, S.: From climate to weather reconstructions, PLOS Climate, 1, e0000034, https://doi.org/10.1371/journal.pclm.0000034, 2022.
Brönnimann, S. Allan, R., Ashcroft, L., Baer, S., Barriendos, M., Brázdil, R., Brugnara, Y., Brunet, M., Brunetti, M., Chimani, B., Cornes, R., Domínguez-Castro, F., Filipiak, J., Founda, D., García Herrera, R., Gergis, J., Grab, S., Hannak, L., Huhtamaa, H., Jacobsen, K. S., Jones, P., Jourdain, S., Kiss, A., Lin, K. E., Lorrey, A., Lundstad, E., Luterbacher, J., Mauelshagen, F., Maugeri, M., Maughan, N., Moberg, A., Neukom, R., Nicholson, S., Noone, S., Nordli, Ø., Ólafsdóttir, K. B., Pearce, P. R, Pfister, L., Pribyl, K., Przybylak, R., Pudmenzky, C., Rasol, D., Reichenbach, D., Řezníčková, L., Rodrigo, F. S., Rohde, R., Rohr, C., Skrynyk, O., Slonosky, V., Thorne, P., Valente, M. A., Vaquero, J. M., Westcottt, N. E., Williamson, F., and Wyszyński, P.: Unlocking pre-1850 instrumental meteorological records: A global inventory, B. Am. Meteorol. Soc., 100, ES389–ES413, 2019a.
Brönnimann, S., Franke, J., Nussbaumer, S. U., Zumbühl, H. J., Steiner, D., Trachsel, M., Hegerl, G. C., Schurer, A., Worni, M., Malik, A., Flückiger, J., and Raible, C. C.: Last phase of the Little Ice Age forced by volcanic eruptions, Nat. Geosci., 12, 650–656, 2019b.
Bünti, J. L.: Chronik des Johann Laurentz Bünti, Landammann, 1661–1736. Beiträge zur Geschichte Nidwaldens 34, Stans, Historischer Verein Nidwalden, 418 pp., https://www.e-periodica.ch/digbib/view?pid=bgn-001:1973:34::4#4 (;ast access: 2 July 2023), 1973.
Burgdorf, A.-M.: A global inventory of quantitative documentary evidence related to climate since the 15th century, Clim. Past, 18, 1407–1428, https://doi.org/10.5194/cp-18-1407-2022, 2022.
Burgdorf, A.-M., Bronnimann, S., Adamson, G., Amano, T., Aono, Y., Barriopedro, D., Bullon, T., Camenisch, C., Camuffo, D., Daux, V., del Rosario Prieto, M., Dobrovolny, P., Gallego, D., Garcia-Herrera, R., Gergis, J., Grab, S., Hannaford, M. J., Holopainen, J., Kelso, C., Kern, Z., Kiss, A., Lin Kuan-Hui, E., Loader, N. J., Mozny, M., Nash, D., Nicholson, S. E., Pfister, C., Rodrigo, F. S., Rutishauser, T., Sharma, S., Takacs, K., Vargas, E. T., and Vega, I.: DOCU-CLIM: A global documentary climate dataset for climate reconstructions, BORIS Portal [data set], https://doi.org/10.48620/167, 2022.
Burgdorf, A.-M., Bronnimann, S., Adamson, G., Amano, T., Aono, Y., Barriopedro, D., Bullon, T., Camenisch, C., Camuffo, D., Daux, V., del Rosario Prieto, M., Dobrovolny, P., Gallego, D., Garcia-Herrera, R., Gergis, J., Grab, S., Hannaford, M. J., Holopainen, J., Kelso, C., Kern, Z., Kiss, A., Lin Kuan-Hui, E., Loader, N. J., Mozny, M., Nash, D., Nicholson, S. E., Pfister, C., Rodrigo, F. S., Rutishauser, T., Sharma, S., Takacs, K., Vargas, E. T., and Vega, I.: DOCU-CLIM: A global documentary climate dataset for climate reconstructions. Scientific Data, 10, 402, https://doi.org/10.1038/s41597-023-02303-y, 2023.
Cornes R. C., Jones, P. D., Briffa, K. R., and Osborn, T. J.: A daily series of mean sea-level pressure for London, 1692–2007, Int. J. Climatol., 32, 641–656, 2012a (data available at: https://crudata.uea.ac.uk/cru/data/parislondon/).
Cornes, R. C., Jones, P. D., Briffa, K. R., and Osborn, T. J.: A daily series of mean sea-level pressure for Paris, 1670–2007, Int. J. Climatol., 32, 1135–1150, https://doi.org/10.1002/joc.2349, 2012b (data available at: https://crudata.uea.ac.uk/cru/data/parislondon/).
Filipiak, J., Przybylak, R., and Oliński, P.: The longest one-man weather chronicle (1721–1786) by Gottfried Reyger for Gdańsk, Poland as a source for improved understanding of past climate variability, Int. J. Climatol., 39, 828–842, https://doi.org/10.1002/joc.5845, 2019.
Franke, J., Valler, V., Brugnara, Y., and Brönnimann, S.: Ensemble Kalman Fitting Paleo-Reanalysis Version 2 (EKF400_v2), World Data Center for Climate (WDCC) at DKRZ [data set], https://doi.org/10.26050/WDCC/EKF400_v2.0, 2022.
Gaab, H.: Zur Geschichte der Eimmart-Sternwarte. “Nürnberg […] der beste ort pro studio Astronomiae in gantz Deutschland”, Regiomontanusbote Spezial, Vol. 18, Nuremberg, 65 pp., https://www.naa.net/rb/rb_2005-s_a.php (last access: 10 July 2023), 2005.
Gaab, H: Die Eimmart-Sternwarte, https://www.astronomie-nuernberg.de/index.php?category=eimmart&page=eimmart-sternwarte (last access: 15 December 2022), 2022.
García-Herrera, R., Gimeno, L., Ribera, P., Hernández, E., González, E., and Fernández, G.: Identification of Caribbean basin hurricanes from Spanish documentary sources, Clim. Change, 83, 55–85, 2007.
Herbst, K.-D.: Gottfried Kirch (1639–1710) – Astronom und Kalendermacher, https://gottfried-kirch-edition.de/ (last access: 15 December 2022), 2022.
Imfeld, N., Pfister, L., Brugnara, Y., and Brönnimann, S.: 250 years of daily weather: Temperature and precipitation fields for Switzerland since 1763, EGUsphere [preprint], https://doi.org/10.5194/egusphere-2022-1140, 2022.
Jones, P. D., Osborn, T. J., Harpham, C., and Briffa, K. R.: The development of Lamb weather types: from subjective analysis of weather charts to objective approaches using reanalyses, Weather, 69, 128–132, https://doi.org/10.1002/wea.2255, 2014.
Kington, J.: The severe winter of 1697/8, Weather, 54, 43–49, 1999.
Kington, J. A.: The Weather of the 1780s Over Europe, Cambridge University Press, Cambridge, https://doi.org/10.1017/CBO9780511735721, 1988.
Lamb, H. H.: British Isles daily wind and weather patterns 1588, 1781–86, 1972–91 and shorter early sequences (in 1532, 1570 and other years, notably 1688, 1689, 1694, 1697, 1703, 1717, 1783–4, 1791, 1792, 1795, 1822, 1825, 1829, 1845, 1846, 1849, 1850, 1854–5, Climate Monitor, 20, 47–70, 1991.
Luterbacher, J., Rickli, R., Xoplaki, E., Tinguely, C., Beck, C., Pfister, C., and Wanner, H.: The Late Maunder Minimum (1675–1715) – A Key Period for Studying Decadal Scale Climatic Change in Europe, Climatic Change, 49, 441–462, https://doi.org/10.1023/A:1010667524422, 2001.
Lundstad, E., Brugnara, Y. Pappert, D., Kopp, J., Hürzeler, A., Andersson, A., Chimani, B., Cornes, R., Demarée, G., Filipiak, J., Gates, L., Ives, G. L., Jones, J. M., Jourdain, S., Kiss, A., Nicholson, S. E., Przybylak, R., Jones, P. D., Rousseau, D., Tinz, B., Rodrigo, F. S., Grab, S., Domínguez-Castro, F., Slonosky, V., Cooper, J., Brunet, N. and Brönnimann, S.: Global historical climate database HCLIM, Scientific Data, 10, 44, https://doi.org/10.1038/s41597-022-01919-w, 2023.
Manley, G.: 1684: The coldest winter in the English instrumental record, Weather, 66, 382–388, 1975.
Mellado-Cano, J., Barriopedro, D., García-Herrera, R., and Trigo, R.: New observational insights into the atmospheric circulation over the Euro-Atlantic sector since 1685, Clim. Dynam., 54, 823–841, https://doi.org/10.1007/s00382-019-05029-z, 2020.
Nash, D. J., Adamson, G. C. D., Ashcroft, L., Bauch, M., Camenisch, C., Degroot, D., Gergis, J., Jusopović, A., Labbé, T., Lin, K.-H. E., Nicholson, S. D., Pei, Q., del Rosario Prieto, M., Rack, U., Rojas, F., and White, S.: Climate indices in historical climate reconstructions: a global state of the art, Clim. Past, 17, 1273–1314, https://doi.org/10.5194/cp-17-1273-2021, 2021.
Pappert, D., Barriendos, M., Brugnara, Y., Imfeld, N., Jourdain, S., Przybylak, R., Rohr, C., and Brönnimann, S.: Statistical reconstruction of daily temperature and sea level pressure in Europe for the severe winter 1788/89, Clim. Past, 18, 2545–2565, https://doi.org/10.5194/cp-18-2545-2022, 2022.
Pfister, C.: Zum Klima des Raumes Zürich im späten 17. und frühen 18. Jahrhundert, Vierteljahrsschr. Naturf. Ges. Zürich, 122, 447–471, 1977.
Pfister C.: Wetternachhersage: 500 Jahre Klimavariationen und Naturkatastrophen (1496–1995), Haupt Verlag, Bern, ISBN 325805696X, 1999.
Pfister C. and Wanner H.: Climate and Society in Europe, Haupt Verlag, Bern, ISBN 9783258082349, 2021.
Pfister, C., Rohr, C., and Jover, A. C. C.: Euro-Climhist: eine Datenplattform der Universität Bern zur Witterungs-, Klima- und Katastrophengeschichte, Wasser Energie Luft, 109, 45–48, 2017 (data available at: https://www.euroclimhist.unibe.ch, last access: 2 July 2023).
Pliemon, T., Foelsche, U., Rohr, C., and Pfister, C.: Subdaily meteorological measurements of temperature, direction of the movement of the clouds, and cloud cover in the Late Maunder Minimum by Louis Morin in Paris, Clim. Past, 18, 1685–1707, https://doi.org/10.5194/cp-18-1685-2022, 2022.
Przybylak, R. and Pospieszyńska, A.: Air temperature in Wrocław (Breslau) in the period 1710–1721 based on measurements made by David von Grebner, Acta Agrophysica, 184, 35–43, 2010.
Raible, C. C., Brönnimann, S., Auchmann, R., Brohan, P., Frölicher, T. L., Graf, H.-F., Jones, P., Luterbacher, J., Muthers, S., Neukom, R., Robock, A., Self, S., Sudrajat, A., Timmreck, C., and Wegmann, M.: Tambora 1815 as a test case for high impact volcanic eruptions: Earth system effects, WIREs Climate Change, 7, 569–589, https://doi.org/10.1002/wcc.407, 2016.
Reichen, L., Burgdorf, A.-M., Brönnimann, S., Rutishauser, M., Franke, J., Valler, V., Samakinwa, E., Hand, R., and Brugnara, Y.: A Decade of Cold Eurasian Winters Reconstructed for the Early 19th Century, Nat. Commun., 13, 2116, https://doi.org/10.1038/s41467-022-29677-8, 2022.
Rohr, C. and Schwarz-Zanetti, G.: Das Kloster-Tagebuch des Einsiedler Paters Joseph Dietrich, 1670–1704. 1670–1704, http://www.dietrich-edition.unibe.ch/Ueber_das_Projekt.html (last access: 15 December 2022), 2022.
Rousseau, D.: Les températures mensuelles en région parisienne de 1676 à 2008, La météorologie, 67, 43–55, 2009.
Schwander, M., Brönnimann, S., Delaygue, G., Rohrer, M., Auchmann, R., and Brugnara, Y.: Reconstruction of Central European daily weather types back to 1763, Int. J. Climatol., 37, 30–44, https://doi.org/10.1002/joc.4974, 2017.
Valler, V., Franke, J., Brugnara, Y., and Brönnimann, S.: An updated global atmospheric paleo-reanalysis covering the last 400 years, Geosci. Data J., 9, 89–107, https://doi.org/10.1002/gdj3.121, 2022.
Wanner, H., Pfister, C., Brázdil, R., Frich, P., Frydendahl, K., Jónsson, T., Kington, J., Lamb, H. H., Rosenørn, S., and Wishman, E.: Wintertime European circulation patterns during the Late Maunder Minimum cooling period (1675–1704), Theor. Appl. Climatol., 51, 167–175. https://doi.org/10.1007/BF00867443, 1995.
Wheeler, D., Garcia-Herrera, R., Vaquero, J. M., Chenoweth, M., and Mock, C. J.: Reconstructing The Trajectory of The August 1680 Hurricane From Contemporary Records, B. Am. Meteorol. Soc., 90, 971–978, https://doi.org/10.1175/2009BAMS2649.1, 2009.
Wheeler, D., Garcia-Herrera, R., Wilkinson, C. W., and Ward, C.: Atmospheric circulation and storminess derived from Royal Navy logbooks: 1685 to 1750, Climatic Change, 101, 257–280, https://doi.org/10.1007/s10584-009-9732-x, 2010.
Woollings, T., Lockwood, M., Masato, G., Bell, C., and Gray, L.: Enhanced signature of solar variability in Eurasian winter climate, Geophys. Res. Lett., 37, L20805, https://doi.org/10.1029/2010GL044601, 2010.
- Abstract
- Introduction
- Georg Christoph Eimmart and his weather diary
- Digitizing and formatting the diary and comparison to other data sources
- Results
- Discussion
- Conclusions
- Code availability
- Data availability
- Competing interests
- Disclaimer
- Acknowledgements
- Financial support
- Review statement
- References
- Supplement