the Creative Commons Attribution 4.0 License.
the Creative Commons Attribution 4.0 License.
A paleoprecipitation and paleotemperature reconstruction of the Last Interglacial in the southeastern Alps
Charlotte Honiat
Gabriella Koltai
Yuri Dublyansky
R. Lawrence Edwards
Haiwei Zhang
Hai Cheng
Christoph Spötl
The Last Interglacial (LIG, ∼130–116 ka) was one of the warmest interglacials of the past 800 000 years and an important test bed for future climate conditions warmer than today. LIG temperature reconstructions from marine records and paleoclimate models show that middle and high northern latitudes were considerably warmer (by about 2 to 5 ∘C) compared to today. In central Europe, the LIG has been widely studied using pollen and more recently chironomids preserved in lake sediments. While these bio-archives document temperature changes across the LIG, they are commonly poorly constrained chronologically. Speleothems and fluid inclusions contained therein offer superior age control and provide information on past climate, including qualitative and partly also quantitative records of temperature and precipitation. Here, we present a precisely dated fluid-inclusion record based on seven speleothems from two caves in the southeastern Alps (Obir and Katerloch) and use a δ2H transfer function to reconstruct regional LIG temperatures. We report a temperature change across the glacial–interglacial transition of 5.2±3.1 ∘C and peak temperatures at ∼127 ka of 2.4±2.8 ∘C above today's mean (1973–2002). The fluid-inclusion δ2H record of these speleothems exhibits millennial-scale events during the LIG that are not well expressed in the δ18Ocalcite. The early LIG in the southeastern Alps was marked by an important climate instability followed by progressively more stable conditions. Our record suggests that the southeastern Alps predominantly received Atlantic-derived moisture during the early and middle LIG, while more Mediterranean moisture reached the study site at the end of the LIG, buffering the speleothem δ18Ocalcite signal. The return towards colder conditions is marked by an increase in δ13C starting at ∼118 ka, indicating a decline in the vegetation and soil activity.
- Article
(11708 KB) - Full-text XML
-
Supplement
(410 KB) - BibTeX
- EndNote
The Last Interglacial (LIG, also known as Marine Isotope Stage (MIS) 5e or Eemian; ∼130 to 115 ka) was the most recent time period before the Holocene when the global climate was as warm or even warmer than today (Fischer et al., 2018; Otto-Bliesner et al., 2021). Given that modern global temperatures are approaching the warmth of the LIG (Bova et al., 2021), this most recent interglacial prior to anthropogenic impact currently receives substantial interest from the paleoclimate community as it provides an important benchmark for even warmer conditions and a case to study the response of the hydrological cycle to differently distributed radiative forcing (Scussolini et al., 2019). Surface temperature anomalies during the LIG were not evenly distributed around the globe, and some regions, notably the high northern latitudes, experienced a disproportionally large warming (CAPE-Last Interglacial Project Members, 2006; Thomas et al., 2020).
The most widely available LIG temperature reconstructions include sea surface temperature (SST) estimates derived from various inorganic and organic proxies of deep-sea sediments (e.g., Martrat et al., 2007; Tzedakis et al., 2018) with substantial differences due to incoherent chronologies (Capron et al., 2017). Climate model simulations of the LIG based on SSTs and ice-core-based temperatures show that land masses were considerably warmer (by about 2 to 5 ∘C) at middle and high northern latitudes (Bakker et al., 2014). For Central Europe, previous studies found that summer temperatures may have been about 1–2 ∘C higher than present day (Kaspar, 2005; Lunt et al., 2013). Pollen (Kühl and Litt, 2007) and chironomids (Bolland et al., 2021) retrieved from European lake sediments provide constraints on summer (July) air temperatures but unfortunately lack sufficiently precise age control to define details of the LIG temperature evolution (Govin et al., 2015).
Speleothems are terrestrial archives that can be dated with high accuracy and precision, and different analytical methods allow us to obtain proxy information of past climate (Fairchild and Baker, 2012). Previous speleothem-based studies from Europe provided mostly qualitative temperature information (e.g., Meyer et al., 2008; Moseley et al., 2015; Häuselmann et al., 2015; Vansteenberge et al., 2016). Two recent speleothem studies from Alpine caves used the stable isotopic composition of fluid inclusions to quantitatively constrain the intra-LIG temperature evolution. Both studies consistently showed that the Alps experienced temperatures of up to ∼4 ∘C warmer than today (1961–1990) at elevations close to ∼2000 m a.s.l. (Johnston et al., 2018; Wilcox et al., 2020).
In this study we extend our research in the Alps to lower-elevation regions on the southeastern fringe of this mountain range by analyzing fluid inclusions – small pockets of drip water trapped in speleothems during their growth (Schwarcz et al., 1976). Paleotemperature information can be derived from such inclusions by studying: (1) their stable isotopic composition (e.g., Wainer et al., 2011; Affolter et al., 2019), (2) their homogenization temperature (e.g., Krüger et al., 2011; Meckler et al., 2015) and (3) the concentration of noble gases dissolved in the inclusion water (e.g., Kluge et al., 2008; Vogel et al., 2013; Ghadiri et al., 2018). In this study, we use the first stable isotope-based approach to quantitatively assess the temperature evolution across the LIG based on a set of seven well-dated stalagmites from two caves on the southeastern fringe of the Alps, Obir and Katerloch. Such physically based paleotemperature data are of particular importance because speleothem proxy data are tightly anchored to a radiometrically determined chronology allowing detailed comparisons across different archives and models.
2.1 Obir caves
The Obir massif (46∘30′ N, 14∘23′ E) is part of the Northern Karawanken Mountains close to the Austrian–Slovenian border, in the Austrian province of Carinthia (Fig. 1). The eponymous caves open at ∼1100 m a.s.l. in Middle Triassic limestone and consist of a series of galleries, chamber and shafts encountered in the 19th century during mining for Pb–Zn ores that are now connected by artificial galleries. These caves lack natural entrances and were not known prior to the mining activities (which ceased in the early 20th century). The caves are of hypogene origin and were formed by aggressive, upwelling CO2-rich groundwater prior to or during the uplift of the Northern Karawanken Mountains (Spötl et al., 2021). Therefore, the Obir caves most likely had only limited air exchange with the outside atmosphere prior to the mining activities. Many parts of these caves are decorated by flowstones, stalactites and stalagmites. For simplicity, the Obir caves are divided into three main systems: the Rasslsystem, the Banane system (Fig. A1) and the show cave system. The samples were retrieved at depths of 20 m (Banane System, entrance part; sample OBI118), 45 m (show cave system; sample OBI14), 65 m (Banane System, location Sandgang; sample OBI117) and 80 m (Rasslsystem, Perlenhalle, samples OBI98 and OBI99) below the ground surface.
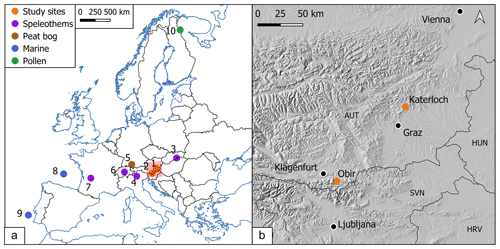
Figure 1(a) Location of the study sites (1) Katerloch and (2) Obir and other sites from which paleoclimate data for the LIG are mentioned in the text: (3) Baradla cave (Demény et al., 2017, 2021), (4) Cesare Battisti cave (Johnston et al., 2018), (5) Füramoos (Bolland et al., 2021), (6) Melchsee-Frutt caves (Wilcox et al., 2020), (7) Villars cave (Wainer et al., 2011), (8) deep-sea cores MD04-2845 (Sánchez Goñi et al., 2018; Salonen et al., 2021) and (9) MD01-2444 (Tzedakis et al., 2018), and (10) pollen sequence from Sokli (Salonen et al., 2018). The transparent red square in (a) marks the enlarged digital elevation map shown in (b).
2.2 Katerloch cave
The second study site, Katerloch cave, is located in the Austrian province of Styria (47∘15′ N, 15∘32′ E), 20 km NNE of the city of Graz and about 115 km from Obir (Fig. 1b). The cave opens in Devonian limestone at an altitude of 901 m a.s.l., follows the general dip of the host rock, and comprises a series of halls and narrow restrictions in between. The entrance hall is connected via two short artificial tunnels with a speleothem-rich chamber below, called the Phantasiehalle, where the samples were retrieved (at an approximate depth of −165 m). These two tunnels were blasted during show cave development in the 1950s, which probably led to an intensification of the cave ventilation.
2.3 Climate at the study sites
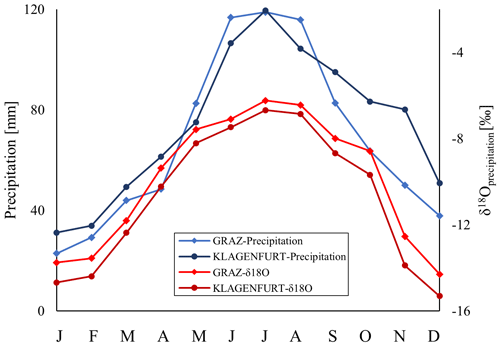
Both cave sites receive Atlantic moisture from the W and NW and are also under the influence of Mediterranean air masses from the south, the latter being most pronounced during spring and autumn (including local summer thunderstorms). During the winter season, the North Atlantic Oscillation influences the regional climate on a multi-annual timescale (Boch et al., 2009). The nearest GNIP (Global Network of Isotopes in Precipitation – https://nucleus.iaea.org/wiser, last access: September 2022) stations are Graz (20 km from Katerloch) and Klagenfurt (15 km from Obir). They provide long (1973 to 2002) time series of stable isotopes in precipitation and air temperature to obtain monthly, seasonal and long-term δ18O/ΔT and δ2H/ΔT relationships (see Fig. A3). The two stations receive similar amounts of annual precipitation (810 mm at Graz and 887 mm at Klagenfurt) and their elevations are also comparable (366 and 442 m a.s.l., respectively).
2.4 Cave microclimate
The microclimate of both caves has been monitored for many years. In Obir cave the air temperature in the interior parts is stable throughout the year (5.8±0.1 ∘C) and is cooler by ∼1 ∘C than the mean annual air temperature (MAAT) of 6.8±0.1 ∘C recorded at the closest weather station of Seeberg (1040 m a.s.l.; ca. 12 km from the cave) (Spötl et al., 2005; Fairchild et al., 2010). Cave air carbon dioxide concentration and its stable C isotopic composition follow a seasonal pattern, reflecting today's efficient air exchange with the outside atmosphere through the artificial adits and gives rise to preferred calcite precipitation during winter (Spötl et al., 2005). It is very likely, however, that the air exchange was more restricted prior to the discovery of the caves.
At Katerloch, the air temperature is 4.0 ∘C in Phantasiehalle and 5.7 ∘C in the deepest Seeparadies chamber (Boch et al., 2011). Both temperatures are lower than the MAAT measured near the cave entrance (8.8 ∘C, 2006–2008) and at the weather station of St. Radegund at 725 m a.s.l. ca. 9 km from the cave (8.5 ∘C; Boch, 2008). This indicates a “cold-trap” behavior of the cave consistent with its sag-type geometry. The cave air circulation was likely weaker in the past, prior to the opening of artificial connections between the large chambers. We therefore consider the temperature of the lowermost chamber (5.7 ∘C) an approximation of the cave temperature before show cave development.
2.5 Isotopic composition of drip water
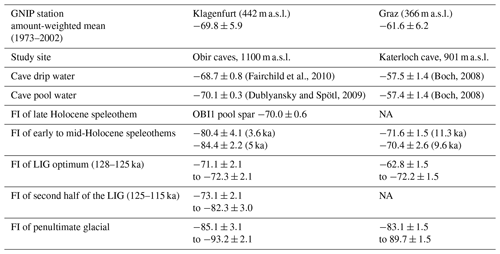
The drip water isotopic composition reflects the meteoric precipitation above the cave but is also affected by processes occurring on the surface (vegetation), in the soil and in the epikarst (Genty et al., 2014). The long-term (1973–2002) weighted mean of regional meteoric precipitation is for δ2H and for δ18O at the Klagenfurt GNIP station and for δ2H and for δ18O at the Graz GNIP station. In this region the seasonal variability of δ18O and δ2H has an amplitude of about 5 ‰ and 30 ‰, respectively.
In Obir, the δ18O and δ2H values of the drip water are fairly constant with mean values of ‰ and ‰ Vienna Standard Mean Ocean Water (VSMOW), respectively (1σ uncertainty; Spötl et al., 2005, and unpublished data by the authors), and lack a seasonal isotopic signal attesting to significant storage and mixing in the (epi)karst. The duration of monitoring in Obir was almost 5 years with visits every 2 months starting in the summer of 1998, with the exception of the period between March 2000 and December 2002, when the frequency of visits was increased to monthly. Drip water δ18O and δ2H values in Katerloch cave are also relatively constant over the year, showing mean values of ‰ and ‰ VSMOW respectively (Boch, 2008); the monitoring interval was 2 months for a period of 2 years.
3.1 Sampling
In the Obir caves, two stalagmites (OBI98, 99) from the Perlenhalle were retrieved with a hammer and a chisel (Rasslsystem; Fig. A1) following reconnaissance drilling (Spötl and Mattey, 2012) and 230Th dating. One broken stalagmite from the Indische Grotte (part of the show cave, OBI14) was at our disposal already, and the other two stalagmites were found broken in the Banane system (OBI117, 118). In Katerloch, stalagmites K2 and K4 were found broken in the Phantasiehalle. Their top parts were missing. See Honiat et al. (2022) for more details on these two samples.
3.2 Petrography
Central slabs were cut from all stalagmites, polished and scanned (Figs. A4 and A5). Small blocks for thin sections were cut along the growth axes of stalagmites K4, K2, OBI98, OBI99 and OBI117. Thin sections were examined petrographically using a Nikon Eclipse polarizing microscope. Additional doubly polished sections about 200 µm thick were prepared for fluid-inclusion petrography of K2 and OBI99 stalagmites.
3.3 230Th dating
Multiple subsamples were drilled from stalagmites OBI14 (8), OBI98 (10), OBI99 (10), OBI117 (13), OBI118 (7), K2 (9) and K4 (9) (Table 1; see Honiat et al., 2022, for 230Th ages for the two Katerloch speleothems); 80 to 150 mg subsamples were drilled from stalagmite slabs along discrete laminae. U and Th were separated from the carbonate matrix and purified in a clean-room laboratory. The samples were prepared following the chemistry procedure as described in Edwards et al. (1987). The measurements were performed using multicollector inductively coupled plasma mass spectrometer (ThermoFisher Neptune Plus, Bremen, Germany) at the University of Minnesota, USA, and at the Xi'an Jiatong University, China, using the technique described by Cheng et al. (2013). Depth–age models were constructed using OxCal (version 4.4) and a Poisson process deposition model (Ramsey, 2008; Ramsey and Lee, 2013).
3.4 Stable isotope composition of calcite
Subsamples for stable isotope analyses were taken along the growth axes of all stalagmites either using a handheld drilling device or a Merchantek micromill. OBI98 and OBI99 were drilled at 2 mm increments, while the sampling resolution of OBI118 was 1 mm. Stalagmites OBI117 and OBI14 were micro-milled at 0.2 mm resolution. The isotope analyses were performed using a Delta V Plus isotope ratio mass spectrometer linked to a Gasbench II (both from ThermoFisher, Bremen, Germany) following the procedure reported by Spötl (2011). Calibration of the instrument was done by using international reference materials and the results are reported in per mill relative to Vienna Pee Dee Belemnite (VPDB). Long-term precision at the 1σ level is 0.06 ‰ and 0.08 ‰ for δ13C and δ18Ocalcite, respectively. The two stalagmites from Katerloch were sampled and analyzed in the same laboratory as reported by Honiat et al. (2022).
3.5 Stable isotope composition of fluid-inclusion water
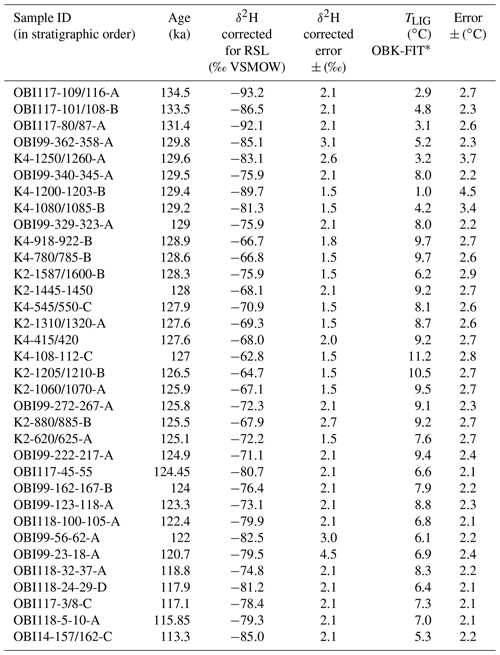
The stable isotopic composition of stalagmite fluid-inclusion water was analyzed using a Delta V Advantage isotope ratio mass spectrometer following crushing and high-temperature conversion as described by Dublyansky and Spötl (2009). A total of 28 subsamples (0.4 to 3.0 g) were cut from OBI99, 22 from OBI117, 16 from OBI118, 4 from OBI14, 3 from OBI98, 17 from K2 and 20 from K4. The δ2H values are reported in per mill relative to Vienna Standard Mean Ocean Water (VSMOW). The average long-term precision of replicate measurements of our in-house calcite standard (a low-temperature calcite spar) is 1.5 ‰ for δ2H for water amounts between 0.2 and 1 µL. In order to be compared to modern-day precipitation, the δ2H values were corrected for the global ice volume effect of 0.064 ‰ m−1 of sea level rise (Duplessy et al., 2007) using global sea level data (Rohling et al., 2019).
4.1 Petrography
The Obir and Katerloch stalagmites consist of coarsely crystalline elongated columnar calcite. In Katerloch, distinct macroscopic lamination is noticeable, consisting of white, porous laminae rich in aqueous inclusions formed during summer alternating with translucent and more compact laminae formed during winter (Boch et al., 2011). No petrographic evidence of hiati was observed in the Katerloch samples. The fabric of the Obir stalagmites is compact columnar, and lamination is hardly visible. Petrographic hiati are locally present; in OBI117 these are marked by thin micrite layers and the presence of opaque organic inclusions (Fig. A6). A hiatus in OBI14 is marked by a slight change in color (pale yellow calcite), and one is marked by a less translucent layer rich in detritus in OBI118.
Primary single-phase fluid inclusions were observed in both K2 and OBI99 stalagmite samples. Fluid inclusions in K2 are inter-crystalline and elongated (see Kendall and Broughton, 1978) in the compact laminae (∼100 to 150 µm in length; Fig. 2d) and large interconnected elongate (up to 500 µm; Fig. 2c) in the white porous laminae. OBI99 contains fewer fluid inclusions that are concentrated along growth layers (Fig. 2a). These inclusions are smaller (10 to 30 µm; Fig. 2b), intra-crystalline, and rounded or pyriform in shape (rounded part oriented towards the base of the layer and a spike pointing in the growth direction; see Lopez-Elorza et al., 2021). Petrographic observations showed that the fluid inclusions in our samples are primary in origin, well preserved, and suitable for bulk instrumental analyses of fluid-inclusion (FI) water stable isotope composition.
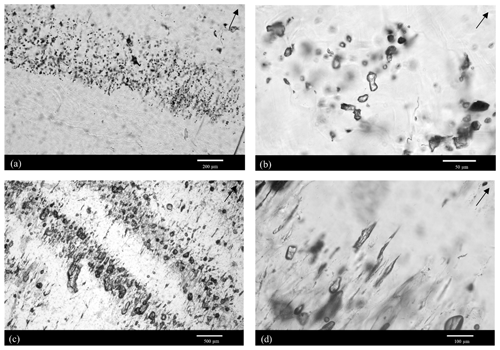
Figure 2Transmitted-light images of fluid-inclusion assemblages in the studied speleothems. (a) Primary fluid inclusions along growth layers in stalagmite OBI99, (b) intra-crystalline fluid inclusions in sample OBI99, (c) primary inclusion-rich and inclusion-poor growth layers in stalagmite K2, and (d) inter-crystalline elongated inclusions in sample K2. The black arrows indicate the growth direction.
4.2 Geochronology
All samples show low U concentrations (between 70 and 280 ppb) but also little detrital Th content, allowing precise dating with relative age uncertainties of 0.4 %–1.6 % (Table 1). Depth–age models are provided in Fig. 3. The average growth rate of the Katerloch stalagmites (0.4 mm a−1; Honiat et al., 2022) is significantly higher than that of the Obir stalagmites (from 0.003 to 0.1 mm a−1).
Table 1The 230Th dating results of Obir stalagmites. Ages are given in years BP with 2σ uncertainties. For dating results of Katerloch stalagmites, see Honiat et al. (2022). The U decay constants are (Jaffey et al., 1971) and (Cheng et al., 2013). The Th decay constant is (Cheng et al., 2013).
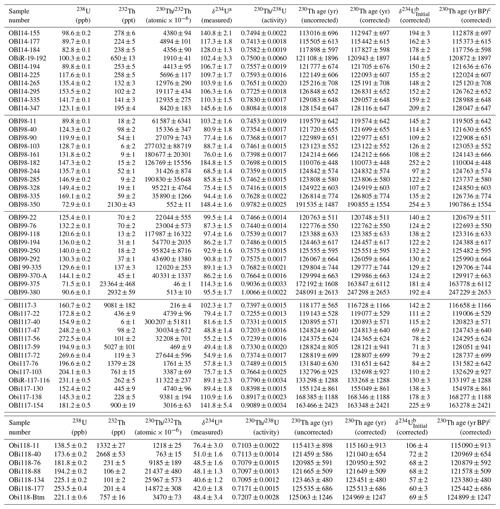
a δ234U = ([234U/238U]. b δ234Uinitial was calculated based on 230Th age (T), i.e., δ234Uinitial=δ234U. Corrected 230Th ages assume the initial 230Th 232Th atomic ratio of . Those are the values for a material at secular equilibrium with a bulk Earth 232Th/238U value of 3.8. The errors are arbitrarily assumed to be 50 %. c BP stands for “Before Present”, where the “Present” is defined as the year 1950 CE.
The OBI14 LIG record started at 130.2±0.5 ka, and the first growth episode lasted until 119.9±0.5 ka. After a short hiatus, growth continued from 119.4±0.7 to 112.6±0.7 ka but with a slower growth rate (Fig. 3). Stalagmite OBI98 started at 126.4±1.0 ka with a short segment of slow growth (0.01 mm a−1) followed by a longer interval of faster growth (0.1 mm a−1) and terminated with a short final segment of again slower growth at 119.5±1 ka (Fig. 3). OBI99 started growing at 129.9±0.6 ka and stopped at 120.1±1.7 ka, with a slow-growing section between 129.4±0.8 and 126.2±0.6 ka. OBI117 started growing at 171.7±2.8 ka and shows several hiati until 116.5±1.1 ka. The oldest part of the record is characterized by a slow growth rate from 135.0±0.8 to 130.3±0.9 ka (Fig. 3). Growth accelerated after a first hiatus (127.9±0.9 to 129.2±0.8 ka), remained constant after a second hiatus (124.2±0.7 to 124.6±0.5 ka), and finally slowed down after a third hiatus (116.5±1.1 to 121.1±0.7 ka).
The record of OBI118 (whose base is missing) started at 126.4±0.9 ka and lasted until 121.8±0.4 ka. Following a short hiatus, the growth rate diminished (121.2±1.1 to 119.5±0.5 ka) and continued to slow down until the end of the record at 115.0±1.3 ka (Fig. 3).
4.3 Calcite stable isotopes
4.3.1 Oxygen isotopes
The five Obir stalagmites yielded a well-replicated δ18Ocalcite record for the LIG. Obir and Katerloch stalagmites also agree in their overall pattern, although the latter exhibit a higher-frequency variability (Fig. 4b). Only stalagmite K4 recorded the onset of the LIG, which is marked by a 2.5 ‰ rise in δ18Ocalcite. The same jump in isotope values is observed in stalagmite OBI117, although the actual glacial–interglacial transition is not recorded due to the presence of a hiatus (Fig. 4b). During the LIG only small-scale variations (∼0.5 ‰) of δ18Ocalcite values are observed (Fig. 4b). The mean δ18Ocalcite values for the interval 126 to 120 ka when all Obir stalagmite records overlap are ‰ for OBI14, ‰ for OBI98, ‰ for OBI99, ‰ for OBI117 and ‰ for OBI118. In Katerloch, K2 and K4 show the same mean δ18Ocalcite value of ‰for the interval where they overlap (126.8 to 128.6 ka).
4.3.2 Carbon isotopes
The transition from the penultimate glacial (MIS 6) to the LIG is partially recorded by δ13C values in stalagmites K4 and OBI117 and is more abrupt than the oxygen isotope shift recorded by stalagmite K4. The latter stalagmite started growing at 129.6±0.4 ka with δ13C values of about −6 ‰. Shortly after the rise in δ18Ocalcite, there is a 4 ‰ drop registered by δ13C. Stalagmite K2 grew between 128.6±0.5 and 125.0±0.7 ka. During this time period, carbon isotope values are stable, in agreement with those of stalagmite K4, and lack a long-term trend (Fig. 4c). The mean δ13C value of K2 and K4 for the interval where the two records overlap (128.6–126.8 ka) is ‰.
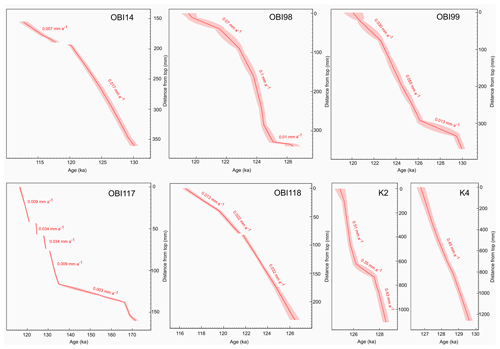
Figure 3Depth–age models for Obir (OBI) and Katerloch (K) stalagmites. The average growth rates are indicated.
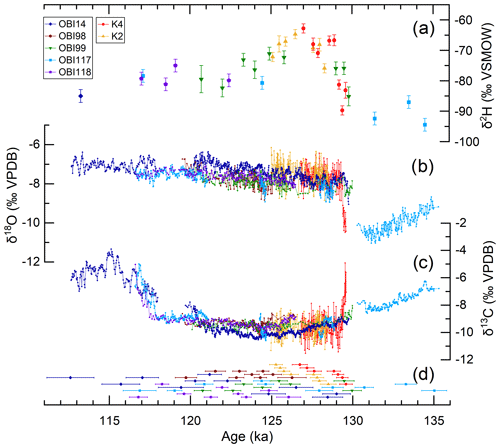
Figure 4(a) Hydrogen isotopic composition of fluid-inclusion water of stalagmites from Obir and Katerloch caves corrected for the ice-volume effect, (b) oxygen and (c) carbon isotopic composition of the calcite, (d) modeled 230Th ages of each stalagmite with their 2σ uncertainties.
The Obir stalagmites show a gradual decrease in δ13C from ‰ at 135 ka to ‰ at 125 ka (Fig. 4c). Only small-scale variations of up to ∼0.5 ‰ are observed during the LIG. The carbon isotope values of the five Obir stalagmites are in good agreement from 130 to 118 ka. Between 118 and 117 ka the values start to rise and are well replicated (within their age model uncertainties) between OBI118, OBI117 and OBI14. At ∼115 ka, the δ13C values reach and partly exceed pre-LIG values (Fig. 4c). The mean δ13C values of the interval 126 to 120 ka when all Obir stalagmites overlap are ‰ for OBI14, ‰ for OBI98, ‰ for OBI99, ‰ for OBI117 and ‰ for OBI118.
4.4 Fluid-inclusion isotopes
A total of 115 calcite subsamples were analyzed, but a significant proportion of the fluid-inclusion measurements (n=38 for the Obir dataset) yielded water amounts too small to obtain reliable isotope results (<0.1 µL; see Fig. A4 for the location of these samples). On the other hand, two Katerloch samples had to be excluded because of too large analyte volumes (>1.5 µL; Fig. A5). Almost all Katerloch samples were duplicated or even triplicated. Not every Obir samples could be duplicated, however, because the replica had low water amounts, and eventually there was insufficient material for sub-sampling individual layers.
The δ2H values of sub-samples of K4 and K2 with water contents of 0.1 to 1 µL replicated within 1.5 ‰. Obir samples, however, are characterized by generally low and variable amounts of water, and the replicated samples yielded a mean standard deviation of ±2.1 ‰ for δ2H. We assign this value to individual measurements and also use it as an uncertainty estimate (Table A2).
In terms of water content, the measured fluid-inclusion data from both caves lack a long-term trend across the LIG.
We also analyzed three Holocene stalagmites for comparison (OBI12 for Obir; K1 and K3 for Katerloch; Table A1). Fluid-inclusion data of modern calcite were already available for Obir cave (sample OBI1; Dublyansky and Spötl, 2009).
The δ2H values of the cave drip water agree with the amount-weighted δ2H mean of modern precipitation for Obir (Table 2) and only a slight difference is seen for Katerloch. The δ2H fluid-inclusion values for the LIG optimum (128–125 ka) were comparable to those of modern day at Obir and are more negative for Katerloch (Table 2). Two samples of a Holocene stalagmite from Obir (3.6 and 5 ka BP) yielded values that are more negative than modern precipitation and LIG optimum samples but close to the values from the second half of the LIG (125–115 ka). Two early Holocene Katerloch samples (11.3 and 9.6 ka) also yielded more negative values than modern precipitation (Table 2). Fluid-inclusion data for penultimate glacial calcite are comparable between the two cave sites and more negative than modern values.
5.1 Reliability of the calcite stable isotope record
5.1.1 Oxygen isotopes
The oxygen isotopic composition of drip water in caves is controlled by different factors such as the oceanic moisture source(s), trajectories of the air masses, altitude of cloud condensation and evapotranspiration in the catchment (Rozanski et al., 1992; McDermott, 2004; Lachniet, 2009). In Obir and Katerloch caves δ18O values of the drip water ( ‰ and ‰, respectively) are closely related to the δ18O values of local meteoric precipitation (mean δ18O values of −9.8 ‰ at the Klagenfurt station and −8.8 ‰ at the Graz station), which principally originates from the Atlantic with a Mediterranean imprint (slightly enriched δ18O values) (Sodemann and Zubler, 2010). The overall oxygen isotope pattern of Obir and Katerloch stalagmites is similar to that of LIG speleothems from other parts of the Alps (Moseley et al., 2015; Wilcox et al., 2020; Luetscher et al., 2021), which also receive predominantly Atlantic-derived moisture, and where δ18Ocalcite primarily reflects atmospheric temperature. The average LIG δ18Ocalcite values of the Katerloch and Obir speleothems are also comparable to those of speleothems in the Italian Alps (Johnston et al., 2018, 2021) and in northeastern Hungary (Demény et al., 2017, 2021), areas that also receive significant moisture from the Western Mediterranean, resulting in slightly enriched δ18O values of drip water compared to sites on the northern side of the Alps. The mean LIG δ18Ocalcite values of Katerloch and Obir speleothems during the LIG are more depleted than the modern ones.
Oxygen isotope samples along single growth laminae (Hendy test) of Obir and Katerloch stalagmites show constant values, supporting calcite precipitation close to O isotopic equilibrium. In addition, the δ18Ocalcite signal is well replicated between the five Obir stalagmites for the time interval they overlap, and likewise for the two Katerloch stalagmites, confirming the robustness of these records (Dorale and Liu, 2009).
5.1.2 Carbon isotopes
The carbon isotope signal in speleothems is primarily controlled by vegetation, carbon dynamics in the soil, cave ventilation and associated kinetic isotope fractionation, and possible prior calcite precipitation in the vadose zone (Fairchild et al., 2006). Although seepage waters in Katerloch cave originate from a well-mixed karst aquifer and thus do not transmit a seasonal signal, a seasonal cycle is observed in the calcite fabric and the C isotopic composition of the stalagmites (Boch et al., 2011). In this cave, the seasonally changing air flow exerts a strong control on the drip water chemistry and hence lamina development, resulting in a white porous inclusion-rich and low-δ13C lamina in summer and a more compact, high-δ13C lamina in winter (Boch et al., 2011). Furthermore, Boch et al. (2009, 2011) performed Hendy tests on calcite from the top of actively growing stalagmites and calcite precipitated on glass plates and observed an enrichment in 13C of up to 4 ‰ with increasing distance from the central axis, suggesting some kinetic isotope fractionation.
In Obir caves, the seasonally changing ventilation also forces degassing of carbon dioxide during the cold season, resulting in enhanced carbon isotope fractionation. This is reflected by 13C enrichment in winter calcite (Spötl et al., 2005).
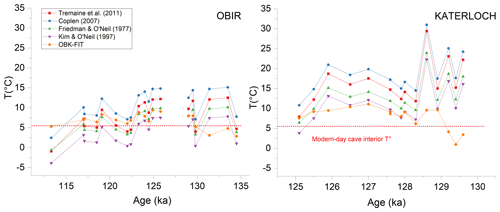
Figure 5Results of paleotemperature calculations for Obir and Katerloch using the local meteoric water line (LMWL) of Klagenfurt and Graz, respectively, based on δ2H data converted to δ18OFI-Calculated using four different water–calcite isotope fractionation equations (in red, blue, green and purple). The orange data show the results of the water isotope–air temperature relationship δ2H (OBK-FIT). The dashed red line indicates the modern cave interior temperature.
In summary, although subject to kinetic fractionation in the cave on an intra-annual scale, soil bioproductivity exerts a strong first-order control on longer-term carbon isotope variations in Katerloch and Obir speleothems, showing amplitudes of >4 ‰. In addition, anthropogenic interference (mining at Obir and show cave development at Katerloch) have likely intensified air exchange between the outside atmosphere and the cave interior at both sites, leading to enhanced degassing and hence kinetic carbon isotope fractionation compared to the LIG.
5.2 Paleo-thermometry using fluid-inclusion stable isotope data
5.2.1 Constraining paleotemperatures using a combination of δ18Ocalcite and δ2H
In order to obtain paleotemperatures, only the stalagmite δ2H values were used because the δ18OFI values in speleothems are influenced by non-climatic parameters (e.g., kinetic isotope fractionation; Affolter et al., 2019). Several studies suggested that the O isotope composition of fluid-inclusion water may also undergo isotope exchange with the host calcite (e.g., Demény et al., 2016, 2021). In addition, δ18OFI values obtained with the Innsbruck FI setup can be inaccurate for samples with low water content, and we therefore do not use these data. Thus, we consider δ2H to be a more robust proxy of paleotemperature as there are no other sources of hydrogen once the water entrapped in the calcite.
We are confident that our δ2H values are reliable for several reasons: (i) a large majority of the measurements are replicated (up to four times), (ii) δ2H values are also replicated between coeval stalagmites and (iii) these data are replicated between the two cave sites located ∼115 km apart.
The δ2H values (after correction for sea level and elevation) were converted to δ18OFI-Calculated using the local meteoric water line (LMWL) from Klagenfurt for Obir (∼15 km from Obir) and from Graz for Katerloch (20 km from Katerloch), which are the nearest stations of the Austrian Network of Isotopes in Precipitation (ANIP; Hager and Foelsche, 2015) with an observation period of 29 years (1973 to 2002). Temperatures were calculated based on equations of Friedman and O'Neil (1977), Kim and O'Neil (1997), Coplen (2007), and Tremaine et al. (2011) using δ18Ocalcite and δ18OFI-Calculated. The equations of Friedman and O'Neil (1977) and Kim and O'Neil (1997) gave realistic temperatures for the LIG for both caves but unrealistically high temperatures for the penultimate glacial, suggesting cave air temperatures of up to ∼10 ∘C at 134 ka for Obir and up to 25 ∘C at 129.5 ka for Katerloch (Fig. 5). The equation of Coplen (2007) yielded unrealistically high temperatures for both Obir and Katerloch LIG records. We therefore do not consider paleotemperature assessments based on the water–calcite isotope equilibrium reliable (Demény et al., 2021).
5.2.2 Water isotope–air temperature relationship
We investigated the temperature dependence of the hydrogen (and oxygen) isotope composition of precipitation water in the study region (i.e., multi-annual modern-day δ2H and δ18O gradients, respectively). As an example, this relationship was investigated by Rozanski et al. (1992) for Central Europe and applied by Affolter et al. (2019) for a 14 kyr record from Milandre cave (Switzerland). This approach was also applied to a LIG record from Alpine caves in Switzerland (Wilcox et al., 2020).
The relationship between mean annual δ18O of precipitation and mean annual air temperature (δ18O) is 0.43±0.18 ‰ ∘C−1 for Klagenfurt (δ2H determined using the LMWL of 3.35±1.40) and 0.32±0.15 ‰ ∘C−1 for Graz (δ2H of 2.66±1.25 ‰ ∘C−1) (both values are for the period 1973–2002; Hager and Foelsche, 2015). Compared to the average European δ18O gradient of 0.59±0.08 ‰ ∘C−1 (Rozanski et al., 1992) the gradient for Klagenfurt is within combined uncertainties, but the gradient for Graz is significantly smaller. The coefficient of correlation between MAAT and weighted mean δ18O annual values at Graz and Klagenfurt sites are small (R2<0.2) in comparison to R2=0.54 of Rozanski et al. (1992). We attribute this to the pronounced seasonality in precipitation. In the following, the δ2H values were calculated from the δ18O values using the corresponding modern LMWL equations. Because it is unclear which δ2H transfer function is appropriate for the LIG, and possible changes in vapor source regions should be considered, we evaluated a range of δ2H relationships (named OBK-FIT), considering both the Klagenfurt and Graz empirical gradients. The OBK-FIT transfer function is anchored at the modern MAAT outside of the cave (6.8±1 ∘C for Obir; 8.8±1 ∘C for Katerloch). The modern δ2H values were corrected for the elevation difference relative to the GNIP stations of Klagenfurt (∼650 m from Obir) and Graz (∼450 m from Katerloch) assuming a LIG lapse rate identical to the modern mean for the Austrian Alps of ∼0.2 ‰ per 100 m for δ18O, i.e., ∼1.6 ‰ per 100 m for δ2H (see Poage, 2001), and annotated δ2Hmodern. We use the mean weighted δ2H values from the two nearest GNIP stations instead of the δ2H drip water values obtained during a few years of cave monitoring because longer-term monitoring at the GNIP stations provides more robust and coherent relationships. The error of the δ2H, δ2Hmodern, δ2H and MAAT values outside the cave and the slope of the LMWL were propagated through the different calculation steps and resulted in a combined paleotemperature uncertainty between 2.1 and 4.5 ∘C. As the uplift since the LIG in this area is negligible (Sternai et al., 2019), no correction was applied.
5.3 Millennial-scale variability in LIG European speleothem fluid-inclusion records
Fluid-inclusion records of LIG speleothems from Europe are scarce (Wainer et al., 2011; Johnston et al., 2018), and very few proxy records cover the full duration of the LIG (Demény et al., 2017; Wilcox et al., 2020). An interesting first observation is that the δ2H variability of published records and our record is more pronounced than the variability of the corresponding δ18Ocalcite records and documents a series of millennial-scale intra-LIG events (Fig. 6).
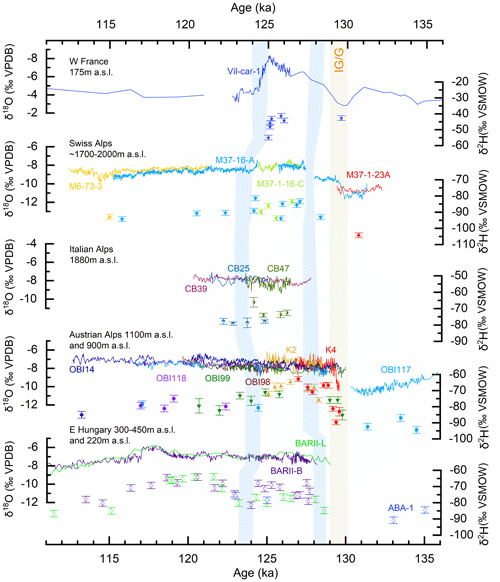
Figure 6Comparison of fluid-inclusion speleothem records arranged from west to east in Europe (from top to bottom): Villars cave, France (45∘30′ N, 0∘50′ E) (Wainer et al., 2011); Neotektonik cave and Schratten cave on Melchsee-Frutt, Switzerland (46∘47′ N, 8∘16′ E) (Wilcox et al., 2020); Cesare Battisti cave, Italy (Johnston et al., 2018) (46∘30′ N, 11∘02′ E); Obir (46∘30′ N, 14∘23′ E) and Katerloch (47∘15′ N, 15∘32′ E) caves (this study); and Baradla (48∘28′ N, 20∘30′ E) and Abaliget (46∘8′ N, 18∘7′ E) caves, Hungary (Demény et al., 2017, 2021). The blue bars represent cooling events, and the yellow bar is the glacial–interglacial transition (IG/G).
The Obir–Katerloch record shows a δ2H rise of up to 25 ‰ across the glacial–interglacial transition. The same amplitude was reported from caves on Melchsee-Frutt (Swiss Alps) and the Pannonian basin (Baradla and Abaliget caves) in Hungary (Fig. 6). Shortly after the onset of the LIG a drop of about ∼10 ‰ in δ2H is captured in our record at ka, in agreement with low δ2H values in the Hungarian record. A second cooling event is observed at ka in our record and is coherent with the expansion of cold water masses in the North Atlantic related to disruptions of the Atlantic Meridional Overturning Circulation (AMOC; Irvalı et al., 2016). The first event in our record was possibly related to cold event C28, a hypothesized Atlantic Ocean meltwater event at ∼128.5 ka (Tzedakis et al., 2018). We correlate the second cooling event to C27, which was also identified in speleothems from Melchsee-Frutt (Swiss Alps) between 125.8±0.5 and 124.6±1.0 ka (Wilcox et al., 2020), which is consistent with our chronology (Fig. 6). The Bigonda speleothem record from the Italian Prealps also suggests a cooling at 124.1±1.8 ka (Fig. 6). This cold event is now well represented in central Europe and is thought to have been an analogue of the 8.2 ka event during the Holocene (Nicholl et al., 2012; Zhou and McManus, 2022). The agreement between our speleothem record and Atlantic deep-sea sediments record emphasizes that the Atlantic Ocean was the predominant moisture source for our study area also during the LIG. Moreover, during this interglacial speleothem records from the SE Italian Alps (Johnston et al., 2018, 2021) show lower δ18Ocalcite values. These authors proposed that a northward shift of the Intertropical Convergence Zone may have allowed more East Atlantic moisture to cross North Africa before turning northwards into the Mediterranean and Adriatic seas and reaching the Alps from the south. Our southeastern Alps records show equally low δ18Ocalcite ( ‰ compared to modern day), adding qualitative support to this model.
The two cold events bracket a climatic optimum from to ka marked by the highest δ2H values in all five published European fluid-inclusion records (Fig. 6). Except for Villars cave, this thermal optimum is less marked in the δ18Ocalcite values of these speleothems (Fig. 6). The variability of both δ2H and δ18Ocalcite values in all records decreases after this optimum showing a slowly decreasing trend until 115 ka, suggesting that this was supra-regional signal across large parts of Europe.
Climate instability during the LIG has also been detected in other European speleothem records that do not include fluid-inclusion isotope data (Drysdale et al., 2009; Regattieri et al., 2014), but their proxy signal is often muted (e.g., Couchoud et al., 2009; Vansteenberge et al., 2019). This is well documented for Alpine speleothems where δ18Ocalcite records commonly show only a small variability during the LIG (Moseley et al., 2015; Wilcox et al., 2020; Luetscher et al., 2021; Honiat et al., 2022). This suggests that the δ18Ocalcite signal may be less sensitive to millennial-scale variability during interglacials than the δ2H data of paleo-drip water. More data from other regions (or archives) are needed to explore this further. In this respect it is noteworthy that the δ18Ocalcite records of most Alpine speleothems studied so far do not show a strong shift at the end of the LIG. One possible explanation for the δ18Ocalcite values to remain at the high interglacial level at the end of the LIG is an increase in the contribution of Mediterranean-sourced moisture at the expense of Atlantic-derived moisture (see Johnston et al., 2021). In contrast, the glacial inception is well recorded by the δ13C values, starting to increase at ∼118 ka in all Alpine speleothem records (Fig. 4 and Wilcox et al., 2020), reflecting a major change in vegetation composition across this mountain range as a result of a lowering of the treeline and a concomitant decrease in soil bioproductivity.
5.4 Paleotemperature reconstructions for the LIG in Europe
The OBK-FIT data indicate a temperature rise at the onset of the LIG of ∘C. After the glacial–interglacial transition an early warm phase occurred from 129.0 to 128.6 ka, followed by a short and rapid cooling event. This first warm phase is well represented in SST reconstructions from the Iberian margin and in speleothems from Baradla cave (the later record is compromised by a major hiatus) and corresponds to a hiatus in Alpine speleothems from Switzerland (Fig. 7). In the Sokli record from Finland (Salonen et al., 2018), whose chronology is tuned to Alpine (for the onset of the LIG; Moseley et al., 2015) and Belgian speleothems (for the demise of the LIG; Vansteenberge et al., 2016), this initial warming occurred at 130.9±1 ka. A summer temperature reconstruction using chironomids from Füramoos (Bolland et al., 2021) in the northern Alpine foreland shows an unconformity in the early LIG and was tuned to marine records, rendering a detailed comparison difficult.
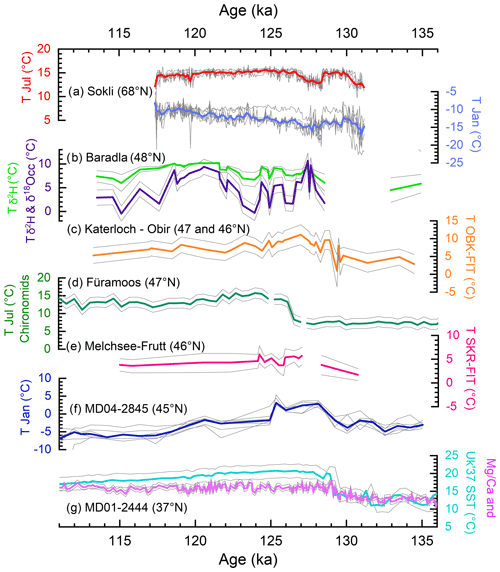
Figure 7Comparison of different paleotemperature reconstructions for the LIG in Europe arranged along a N–S transect and plotted on their published timescales: (a) pollen-based mean July and January temperature reconstructions from Sokli, Finland (Salonen et al., 2018); (b) temperature reconstruction based on speleothem fluid-inclusion data from Baradla cave, Hungary, using the δ2H transfer function (green) and the calcite-water oxygen isotope thermometer based on δ2H and δ18Ocalcite data (purple; although the authors suggested this reconstruction is not robust) (Demény et al., 2021); (c) speleothem fluid-inclusion data using the OBK-FIT data (this study); (d) chironomid-based mean July temperature from Füramoos, Germany (Bolland et al., 2021); (e) speleothem fluid-inclusion data (using the SKR-FIT data) from Switzerland (Wilcox et al., 2020); (f) pollen-based mean January temperature reconstruction from deep-sea core MD04-2845 (Sánchez Goñi et al., 2018; Salonen et al., 2021); and (g) reconstructions of January sea surface temperatures (SST) for deep-sea core MD01-2444, derived from Mg/Ca and alkenone data (Tzedakis et al., 2018). The thin grey lines represent the results from different calibration models for the records from Sokli and core MD04-2845; they represent the error envelopes of the temperature estimates.
The OBK-FIT temperatures reached their maximum between 127.5 and 125.5 ka in agreement with the SKR-FIT record from Switzerland (Wilcox et al., 2020) and a temperature reconstruction from deep-sea sediments in the Bay of Biscay (45∘ N; Sánchez Goñi et al., 2018; Salonen et al., 2021; Fig. 7). We therefore regard this period as the thermal optimum with temperatures possibly ∼2 ∘C higher than modern day (1973–2002) at our sites (2.4±2.8 ∘C for OBK-FIT; 900–1100 m a.s.l.). The SKR-FIT record from the Swiss Alps indicates temperatures up to 4.3±1.4 ∘C higher than modern day (1971–1990) between 127.3±0.7 and 125.9±0.5 ka (Wilcox et al., 2020) at ∼1800 m a.s.l., and the record from Cesare Battisti (Italian Alps) indicates a ∘C temperature anomaly at ∼2000 m a.s.l. for the period of 126.0–125.3 ka with respect to 1961–1990. The climate of the LIG in the Alps, but also at Baradla cave (Hungary) and at the core site MD04-2845 in the Atlantic Ocean, became cooler after ∼124 ka with mean temperatures close to today's values and a lower temperature variability than during the first half of the LIG. In the lacustrine chironomid record from Füramoos, located north of the Alps, a decline in the summer temperature from ∼15.5 ∘C during the mid LIG to 12 ∘C during the late LIG was associated with the decreasing Northern Hemisphere July insolation (Bolland et al., 2021). After 118 ka, temperatures slowly fell below the modern-day values at our study sites, suggesting a gradual rather than abrupt onset of the glacial inception. This gradual cooling was also captured by the Swiss speleothems and in the SSTs from the Bay of Biscay and the Iberian Margin, while a more pronounced cooling is suggested by the Hungarian speleothem record (Fig. 7).
The Obir and Katerloch speleothems provide a well-replicated and precisely dated record of paleotemperatures in the southeastern Alps during the LIG. The regional warming at the glacial–interglacial transition determined using a δ2H fluid-inclusion transfer function (OBK-FIT) was 5.2±3.1 ∘C. The early part of the LIG (∼129 to 124 ka) was marked by peak warm conditions interrupted by short cooling events likely related to meltwater discharge events in the North Atlantic. We report temperatures up to ∘C higher than modern day (1973 to 2002) during the LIG optimum at ∼127 ka. Temperatures then slightly decreased during the mid LIG (124 to 121 ka) and gradually dropped below modern-day temperatures after about 118 ka. The combination of δ2H and δ18Ocalcite proxy data suggests that during the early and mid LIG the southeastern Alps predominantly received moisture from the Atlantic Ocean, whereas the proportion of Mediterranean-derived moisture increased towards the end of the LIG, buffering the δ18Ocalcite signal.
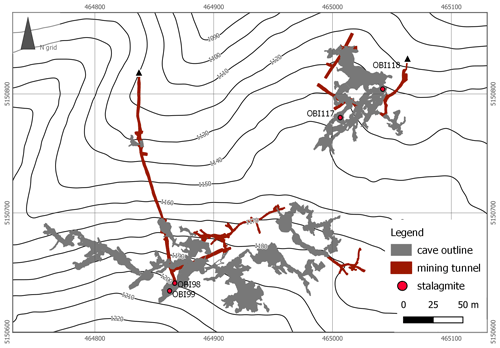
Figure A1Map of the Rasslsystem (left) and the Banane system (right) of the Obir caves, showing the locations of the studied stalagmites. Sample OBI14 was found in the Indische Grotte of the show cave area (not shown).
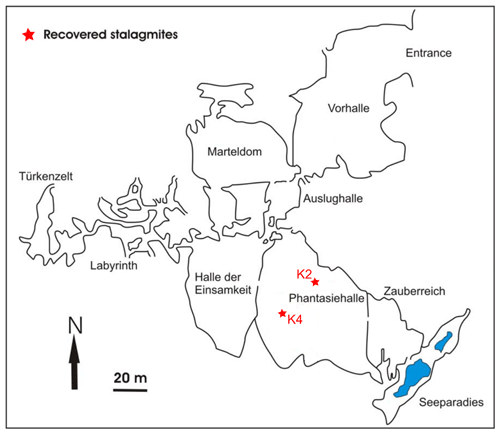
Figure A2Plan view of Katerloch showing the locations of recovered stalagmites (red stars). Map modified after Boch et al. (2011).
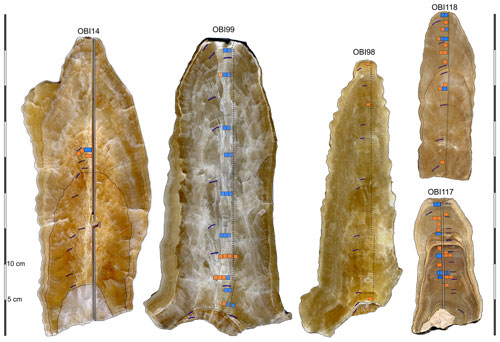
Figure A4Scans of the longitudinal cross sections of the Obir cave stalagmites showing hand-drilled (thin dotted black lines) and micro-milled traces for stable isotopes (vertical grey bars), samples for 230Th dating (purple dots), and fluid inclusions (blue squares; data presented in Table 1) and orange squares (samples yielding < 0.1 µL of water). Note that the fluid-inclusion samples were taken on the opposite half of the respective stalagmite slabs.

Figure A5Scan of the longitudinal cross sections of the studied Katerloch stalagmites, with the sampling trace for stable isotopes (dotted black lines), 230Th dating (purple dots), and fluid inclusions (blue squares; data presented in Table 1). Note that the fluid-inclusion samples were taken on the opposite half of the respective slabs. The top of each stalagmite is shown on the left.

Figure A6Thin-section photomicrographs of the hiatus between 130.3±0.9 and 129.2±0.8 ka in stalagmite OBI117. Note the nucleation event followed by regrowth of calcite crystals. Parallel (a) and crossed (b) nicols and an epifluorescence image (c). The white arrows indicate the growth direction.
Table A1Results of fluid-inclusion measurements for the LIG stalagmites OBI99, OBI117, OBI118, OBI14, K2 and K4 and the Holocene specimens OBI12, K3 and K1. OBI98 is not included because its water content was too low (<0.1 µL). * The δ2H values were corrected for relative sea level (RSL; 0.064 ‰ m−1; Duplessy et al., 2007). Time span represents the duration covered by the respective calcite blocks cut from the stalagmites (based on the growth rate) used for the fluid-inclusion measurements but does not take into account the age model uncertainty.
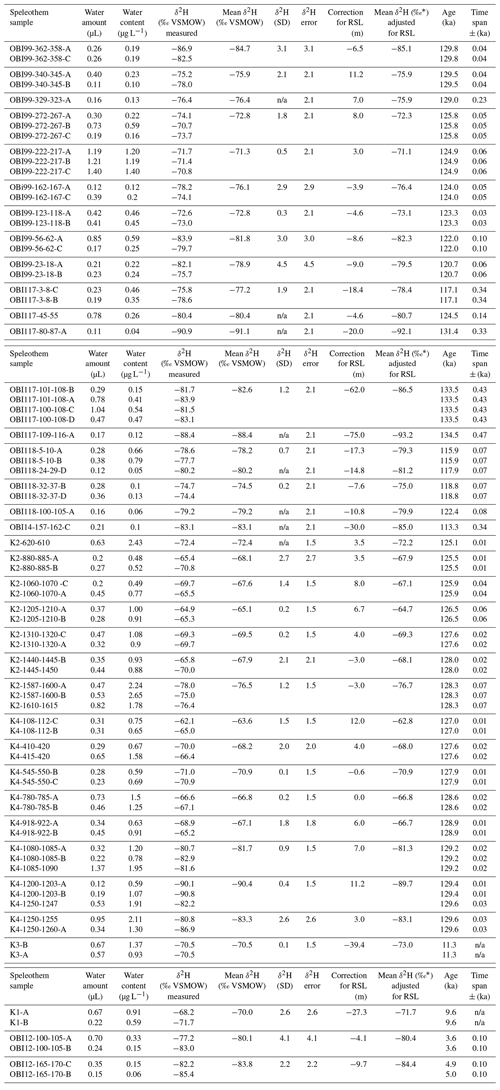
n/a stands for not applicable.
The stable isotope data that support the findings of this study are available as a download excel file in the Supplement and all the data will later be integrated in the SISAL database.
The supplement related to this article is available online at: https://doi.org/10.5194/cp-19-1177-2023-supplement.
CH participated in the fieldwork, wrote the manuscript, and performed most of the analytical work (stable isotopes, U/Th dating, fluid inclusions) and data analysis. GK assisted with the fluid-inclusion analysis and provided manuscript feedback. CS organized the fieldwork and contributed to the manuscript. HZ carried additional U/Th analysis, and RLE and HC supported the U/Th analyses.
The contact author has declared that none of the authors has any competing interests.
Publisher's note: Copernicus Publications remains neutral with regard to jurisdictional claims in published maps and institutional affiliations.
We thank Fritz Geisler and Harald and Andreas Langer for supporting our scientific work in Katerloch and Obir caves. We would like to thank Tanguy Racine for his help during fieldwork, Kathleen Wendt for running preliminary ages on stalagmite OBI117, Marlene Steck for her help in the fluid-inclusion stable isotope laboratory, and Manuela Wimmer for her support with the calcite stable isotope measurements.
This research has been supported by the Austrian Science Fund (grant no. P300040) and the National Natural Science Foundation of China (grant no. 41888101).
This paper was edited by Dominik Fleitmann and reviewed by Attila Demény and Dominique Genty.
Affolter, S., Häuselmann, A., Fleitmann, D., Edwards, R. L., Cheng, H., and Leuenberger, M.: Central Europe temperature constrained by speleothem fluid inclusion water isotopes over the past 14,000 years, Sci. Adv., 5, eaav3809, https://doi.org/10.1126/sciadv.aav3809, 2019.
Bakker, P., Masson-Delmotte, V., Martrat, B., Charbit, S., Renssen, H., Gröger, M., Krebs-Kanzow, U., Lohmann, G., Lunt, D. J., Pfeiffer, M., Phipps, S. J., Prange, M., Ritz, S. P., Schulz, M., Stenni, B., Stone, E. J., and Varma, V.: Temperature trends during the Present and Last Interglacial periods – a multi-model-data comparison, Quaternary Sci. Rev., 99, 224–243, https://doi.org/10.1016/j.quascirev.2014.06.031, 2014.
Boch, R.: Stalagmites from Katerloch Cave, Austria: growth dynamics and high-resolution records of climate change, PhD thesis Univ. Innsbruck, Innsbruck, https://www.researchgate.net/profile/Ronny-Boch-2/publication/305442009_Stalagmites_from_Katerloch_Cave (last access: 31 May 2023), 2008.
Boch, R., Spötl, C., and Kramers, J.: High-resolution isotope records of early Holocene rapid climate change from two coeval stalagmites of Katerloch Cave, Austria, Quaternary Sci. Revi., 28, 2527–2538, https://doi.org/10.1016/j.quascirev.2009.05.015, 2009.
Boch, R., Spötl, C., and Frisia, S.: Origin and palaeoenvironmental significance of lamination in stalagmites from Katerloch Cave, Austria: Origin of lamination in stalagmites, Sedimentology, 58, 508–531, https://doi.org/10.1111/j.1365-3091.2010.01173.x, 2011.
Bolland, A., Kern, O. A., Koutsodendris, A., Pross, J., and Heiri, O.: Chironomid-inferred summer temperature development during the late Rissian glacial, Eemian interglacial and earliest Würmian glacial at Füramoos, southern Germany, Boreas, 51, 496–516, https://doi.org/10.1111/bor.12567, 2021.
Bova, S., Rosenthal, Y., Liu, Z., Godad, S. P., and Yan, M.: Seasonal origin of the thermal maxima at the Holocene and the last interglacial, Nature, 589, 548–553, https://doi.org/10.1038/s41586-020-03155-x, 2021.
CAPE-Last Interglacial Project Members: Last Interglacial Arctic warmth confirms polar amplification of climate change, Quaternary Sci. Rev., 25, 1383–1400, https://doi.org/10.1016/j.quascirev.2006.01.033, 2006.
Capron, E., Govin, A., Feng, R., Otto-Bliesner, B. L., and Wolff, E. W.: Critical evaluation of climate syntheses to benchmark CMIP6/PMIP4 127 ka Last Interglacial simulations in the high-latitude regions, Quaternary Sci. Rev., 168, 137–150, https://doi.org/10.1016/j.quascirev.2017.04.019, 2017.
Cheng, H., Edwards, R. L., Shen, C.-C., Polyak, V. J., Asmerom, Y., Woodhead, J., Hellstrom, J., Wang, Y., Kong, X., Spötl, C., Wang, X., and Calvin Alexander, E.: Improvements in 230Th dating, 230Th and 234U half-life values, and U–Th isotopic measurements by multi-collector inductively coupled plasma mass spectrometry, Earth Planet. Sc. Lett., 371–372, 82–91, https://doi.org/10.1016/j.epsl.2013.04.006, 2013.
Coplen, T. B.: Calibration of the calcite–water oxygen-isotope geothermometer at Devils Hole, Nevada, a natural laboratory, Geochim. Cosmochim. Ac., 71, 3948–3957, https://doi.org/10.1016/j.gca.2007.05.028, 2007.
Couchoud, I., Genty, D., Hoffmann, D., Drysdale, R., and Blamart, D.: Millennial-scale climate variability during the Last Interglacial recorded in a speleothem from south-western France, Quaternary Sci. Rev., 28, 3263–3274, https://doi.org/10.1016/j.quascirev.2009.08.014, 2009.
Demény, A., Czuppon, G., Kern, Z., Leél-Õssy, S., Németh, A., Szabó, M., Tóth, M., Wu, C.-C., Shen, C.-C., Molnár, M., Németh, T., Németh, P., and Óvári, M.: Recrystallization-induced oxygen isotope changes in inclusion-hosted water of speleothems – Paleoclimatological implications, Quatern. Int., 415, 25–32, https://doi.org/10.1016/j.quaint.2015.11.137, 2016.
Demény, A., Kern, Z., Czuppon, G., Németh, A., Leél-Õssy, S., Siklósy, Z., Lin, K., Hu, H.-M., Shen, C.-C., Vennemann, T. W., and Haszpra, L.: Stable isotope compositions of speleothems from the last interglacial – Spatial patterns of climate fluctuations in Europe, Quaternary Sci. Rev., 161, 68–80, https://doi.org/10.1016/j.quascirev.2017.02.012, 2017.
Demény, A., Rinyu, L., Kern, Z., Hatvani, I. G., Czuppon, G., Surányi, G., Leél-Õssy, S., Shen, C.-C., and Koltai, G.: Paleotemperature reconstructions using speleothem fluid inclusion analyses from Hungary, Chem. Geol., 563, 120051, https://doi.org/10.1016/j.chemgeo.2020.120051, 2021.
Dorale, J. A. and Liu, Z.: Limitations of hendy test criteria in judging the paleoclimatic suitability of speleothems and the need for replication, J. Cave Karst Stud., 71, 73–80, 2009.
Drysdale, R. N., Hellstrom, J. C., Zanchetta, G., Fallick, A. E., Sanchez Goni, M. F., Couchoud, I., McDonald, J., Maas, R., Lohmann, G., and Isola, I.: Evidence for obliquity forcing of glacial Termination II, Science, 325, 1527–1531, https://doi.org/10.1126/science.1170371, 2009.
Dublyansky, Y. V. and Spötl, C.: Hydrogen and oxygen isotopes of water from inclusions in minerals: design of a new crushing system and on-line continuous-flow isotope ratio mass spectrometric analysis, Rapid Commun. Mass Spectrom., 23, 2605–2613, https://doi.org/10.1002/rcm.4155, 2009.
Duplessy, J. C., Roche, D. M., and Kageyama, M.: The deep ocean during the Last Interglacial period, Science, 316, 89–91, https://doi.org/10.1126/science.1138582, 2007.
Edwards, R. L., Chen, J. H., Ku, T.-L., and Wasserburg, G. J.: Precise timing of the Last Interglacial period from mass spectrometric determination of Thorium-230 in corals, Science, 236, 1547–1553, https://doi.org/10.1126/science.236.4808.1547, 1987.
Fairchild, I. J., Smith, C. L., Baker, A., Fuller, L., Spötl, C., Mattey, D., McDermott, F., and E.I.M.F.: Modification and preservation of environmental signals in speleothems, Earth-Sci. Rev., 75, 105–153, https://doi.org/10.1016/j.earscirev.2005.08.003, 2006.
Fairchild, I. J., Spötl, C., Frisia, S., Borsato, A., Susini, J., Wynn, P. M., Cauzid, J., and EIMF: Petrology and geochemistry of annually laminated stalagmites from an Alpine cave (Obir, Austria): seasonal cave physiology, in: Tufas and Speleothems: Unravelling the Microbial and Physical Controls, edited by: Pedley, H. M. and Rogerson, M., Geol. Soc. Lond. Spec. Publ., 336, 295–321, https://doi.org/10.1144/SP336.16, 2010.
Fischer, H., Meissner, K. J., Mix, A. C., Abram, N. J., Austermann, J., Brovkin, V., Capron, E., Colombaroli, D., Daniau, A.-L., Dyez, K. A., Felis, T., Finkelstein, S. A., Jaccard, S. L., McClymont, E. L., Rovere, A., Sutter, J., Wolff, E. W., Affolter, S., Bakker, P., Ballesteros-Cánovas, J. A., Barbante, C., Caley, T., Carlson, A. E., Churakova, O., Cortese, G., Cumming, B. F., Davis, B. A. S., de Vernal, A., Emile-Geay, J., Fritz, S. C., Gierz, P., Gottschalk, J., Holloway, M. D., Joos, F., Kucera, M., Loutre, M.-F., Lunt, D. J., Marcisz, K., Marlon, J. R., Martinez, P., Masson-Delmotte, V., Nehrbass-Ahles, C., Otto-Bliesner, B. L., Raible, C. C., Risebrobakken, B., Sánchez Goñi, M. F., Arrigo, J. S., Sarnthein, M., Sjolte, J., Stocker, T. F., Velasquez Alvárez, P. A., Tinner, W., Valdes, P. J., Vogel, H., Wanner, H., Yan, Q., Yu, Z., Ziegler, M., and Zhou, L.: Palaeoclimate constraints on the impact of 2 ∘C anthropogenic warming and beyond, Nat. Geosci., 11, 474–485, https://doi.org/10.1038/s41561-018-0146-0, 2018.
Friedman, I. and O'Neil, J. R.: Compilation of stable isotope fractionation factors of geochemical interest, in: Data of Geochemistry, 6th Edn., edited by: Fleischer, M., US Geol. Survey Prof. Paper 440-KK, US Geological Survey, 1–12, 1977.
Genty, D., Labuhn, I., Hoffmann, G., Danis, P. A., Mestre, O., Bourges, F., Wainer, K., Massault, M., Van Exter, S., Régnier, E., Orengo, P., Falourd, S., and Minster, B.: Rainfall and cave water isotopic relationships in two South-France sites, Geochim. Cosmochim. Ac., 131, 323–343, https://doi.org/10.1016/j.gca.2014.01.043, 2014.
Ghadiri, E., Vogel, N., Brennwald, M. S., Maden, C., Häuselmann, A. D., Fleitmann, D., Cheng, H., and Kipfer, R.: Noble gas based temperature reconstruction on a Swiss stalagmite from the last glacial–interglacial transition and its comparison with other climate records, Earth Planet. Sc. Lett., 495, 192–201, https://doi.org/10.1016/j.epsl.2018.05.019, 2018.
Govin, A., Capron, E., Tzedakis, P. C., Verheyden, S., Ghaleb, B., Hillaire-Marcel, C., St-Onge, G., Stoner, J. S., Bassinot, F., Bazin, L., Blunier, T., Combourieu-Nebout, N., El Ouahabi, A., Genty, D., Gersonde, R., Jimenez-Amat, P., Landais, A., Martrat, B., Masson-Delmotte, V., Parrenin, F., Seidenkrantz, M.-S., Veres, D., Waelbroeck, C., and Zahn, R.: Sequence of events from the onset to the demise of the Last Interglacial: Evaluating strengths and limitations of chronologies used in climatic archives, Quaternary Sci. Rev., 129, 1–36, https://doi.org/10.1016/j.quascirev.2015.09.018, 2015.
Hager, B. and Foelsche, U.: Stable isotope composition of precipitation in Austria, Aust. J. Earth Sci. 108, 2–13, https://doi.org/10.17738/ajes.2015.0012, 2015.
Häuselmann, A. D., Fleitmann, D., Cheng, H., Tabersky, D., Günther, D., and Edwards, R. L.: Timing and nature of the penultimate deglaciation in a high alpine stalagmite from Switzerland, Quaternary Sci. Rev., 126, 264–275, https://doi.org/10.1016/j.quascirev.2015.08.026, 2015.
Honiat, C., Festi, D., Wilcox, P. S., Edwards, R. L., Cheng, H., and Spötl, C.: Early Last Interglacial environmental changes recorded by speleothems from Katerloch (south-east Austria), J. Quaternary Sci., 37, 664–676, https://doi.org/10.1002/jqs.3398, 2022.
Irvalı, N., Ninnemann, U. S., Kleiven, H. (Kikki) F., Galaasen, E. V., Morley, A., and Rosenthal, Y.: Evidence for regional cooling, frontal advances, and East Greenland Ice Sheet changes during the demise of the last interglacial, Quaternary Sci. Rev., 150, 184–199, https://doi.org/10.1016/j.quascirev.2016.08.029, 2016.
Jaffey, A. H., Flynn, K. F., Glendenin, L. E., Bentley, W. C., and Essling, A. M.: Precision Measurement of Half-Lives and Specific Activities of U235 and U238, Phys. Rev. C, 4, 1889–1906, https://doi.org/10.1103/PhysRevC.4.1889, 1971.
Johnston, V. E., Borsato, A., Frisia, S., Spötl, C., Dublyansky, Y., Töchterle, P., Hellstrom, J. C., Bajo, P., Edwards, R. L., and Cheng, H.: Evidence of thermophilisation and elevation-dependent warming during the Last Interglacial in the Italian Alps, Sci. Rep., 8, 2680, https://doi.org/10.1038/s41598-018-21027-3, 2018.
Johnston, V. E., Borsato, A., Frisia, S., Spötl, C., Hellstrom, J. C., Cheng, H., and Edwards, R. L.: Last interglacial hydroclimate in the Italian Prealps reconstructed from speleothem multi-proxy records (Bigonda Cave, NE Italy), Quaternary Sci. Rev., 272, 107243, https://doi.org/10.1016/j.quascirev.2021.107243, 2021.
Kaspar, F.: A model-data comparison of European temperatures in the Eemian interglacial, Geophys. Res. Lett., 32, L11703, https://doi.org/10.1029/2005GL022456, 2005.
Kendall, A. C. and Broughton, P. L.: Origin of fabrics in speleothems composed of columnar calcite crystals, J. Sediment Petrol., 48, 519–538, 1978.
Kim, S.-T. and O'Neil, J. R.: Equilibrium and nonequilibrium oxygen isotope effects in synthetic carbonates, Geochim. Cosmochim. Ac., 61, 3461–3475, https://doi.org/10.1016/S0016-7037(97)00169-5, 1997.
Kluge, T., Marx, T., Scholz, D., Niggemann, S., Mangini, A., and Aeschbach-Hertig, W.: A new tool for palaeoclimate reconstruction: Noble gas temperatures from fluid inclusions in speleothems, Earth Planet. Sc. Lett., 269, 408–415, https://doi.org/10.1016/j.epsl.2008.02.030, 2008.
Krüger, Y., Marti, D., Staub, R. H., Fleitmann, D., and Frenz, M.: Liquid–vapour homogenisation of fluid inclusions in stalagmites: Evaluation of a new thermometer for palaeoclimate research, Chem. Geol., 289, 39–47, https://doi.org/10.1016/j.chemgeo.2011.07.009, 2011.
Kühl, N. and Litt, T.: Quantitative time-series reconstructions of Holsteinian and Eemian temperatures using botanical data, in: Developments https://doi.org/10.1016/S1571-0866(07)80041-8, 2007.
Lachniet, M. S.: Climatic and environmental controls on speleothem oxygen-isotope values, Quaternary Sci. Rev., 28, 412–432, https://doi.org/10.1016/j.quascirev.2008.10.021, 2009.
Lopez-Elorza, M., Muñoz-García, M. B., González-Acebrón, L., and Martín-Chivelet, J.: Fluid-inclusion petrography in calcite stalagmites: Implications for entrapment processes, J. Sediment Res., 91, 1206–1226, https://doi.org/10.2110/jsr.2021.016, 2021.
Luetscher, M., Moseley, G. E., Festi, D., Hof, F., Edwards, R. L., and Spötl, C.: A Last Interglacial speleothem record from the Sieben Hengste cave system (Switzerland): Implications for alpine paleovegetation, Quaternary Sci. Rev., 262, 106974, https://doi.org/10.1016/j.quascirev.2021.106974, 2021.
Lunt, D. J., Abe-Ouchi, A., Bakker, P., Berger, A., Braconnot, P., Charbit, S., Fischer, N., Herold, N., Jungclaus, J. H., Khon, V. C., Krebs-Kanzow, U., Langebroek, P. M., Lohmann, G., Nisancioglu, K. H., Otto-Bliesner, B. L., Park, W., Pfeiffer, M., Phipps, S. J., Prange, M., Rachmayani, R., Renssen, H., Rosenbloom, N., Schneider, B., Stone, E. J., Takahashi, K., Wei, W., Yin, Q., and Zhang, Z. S.: A multi-model assessment of last interglacial temperatures, Clim. Past, 9, 699–717, https://doi.org/10.5194/cp-9-699-2013, 2013.
Martrat, B., Grimalt, J. O., Shackleton, N. J., de Abreu, L., Hutterli, M. A., and Stocker, T. F.: Four climate cycles of recurring deep and surface water destabilizations on the Iberian Margin, Science, 317, 502–507, https://doi.org/10.1126/science.1139994, 2007.
McDermott, F.: Palaeo-climate reconstruction from stable isotope variations in speleothems: a review, Quaternary Sci. Rev., 23, 901–918, https://doi.org/10.1016/j.quascirev.2003.06.021, 2004.
Meckler, A. N., Affolter, S., Dublyansky, Y. V., Krüger, Y., Vogel, N., Bernasconi, S. M., Frenz, M., Kipfer, R., Leuenberger, M., Spötl, C., Carolin, S., Cobb, K. M., Moerman, J., Adkins, J. F., and Fleitmann, D.: Glacial–interglacial temperature change in the tropical West Pacific: A comparison of stalagmite-based paleo-thermometers, Quaternary Sci. Rev., 127, 90–116, https://doi.org/10.1016/j.quascirev.2015.06.015, 2015.
Meyer, M. C., Spötl, C., and Mangini, A.: The demise of the Last Interglacial recorded in isotopically dated speleothems from the Alps, Quaternary Sci. Rev., 27, 476–496, https://doi.org/10.1016/j.quascirev.2007.11.005, 2008.
Moseley, G. E., Spötl, C., Cheng, H., Boch, R., Min, A., and Edwards, R. L.: Termination-II interstadial/stadial climate change recorded in two stalagmites from the north European Alps, Quaternary Sci. Rev., 127, 229–239, https://doi.org/10.1016/j.quascirev.2015.07.012, 2015.
Nicholl, J. A. L., Hodell, D. A., Naafs, B. D. A., Hillaire-Marcel, C., Channell, J. E. T., and Romero, O. E.: A Laurentide outburst flooding event during the last interglacial period, Nat. Geosci., 5, 901–904, https://doi.org/10.1038/ngeo1622, 2012.
Otto-Bliesner, B. L., Brady, E. C., Zhao, A., Brierley, C. M., Axford, Y., Capron, E., Govin, A., Hoffman, J. S., Isaacs, E., Kageyama, M., Scussolini, P., Tzedakis, P. C., Williams, C. J. R., Wolff, E., Abe-Ouchi, A., Braconnot, P., Ramos Buarque, S., Cao, J., de Vernal, A., Guarino, M. V., Guo, C., LeGrande, A. N., Lohmann, G., Meissner, K. J., Menviel, L., Morozova, P. A., Nisancioglu, K. H., O'ishi, R., Salas y Mélia, D., Shi, X., Sicard, M., Sime, L., Stepanek, C., Tomas, R., Volodin, E., Yeung, N. K. H., Zhang, Q., Zhang, Z., and Zheng, W.: Large-scale features of Last Interglacial climate: results from evaluating the lig127k; simulations for the Coupled Model Intercomparison Project (CMIP6)–Paleoclimate Modeling Intercomparison Project (PMIP4), Clim. Past, 17, 63–94, https://doi.org/10.5194/cp-17-63-2021, 2021.
Poage, M. A.: Empirical relationships between elevation and the stable isotope composition of precipitation and surface waters: considerations for studies of paleoelevation change, Am. J. Sci., 301, 1–15, https://doi.org/10.2475/ajs.301.1.1, 2001.
Ramsey, C. B.: Deposition models for chronological records, Quaternary Sci. Rev., 27, 42–60, https://doi.org/10.1016/j.quascirev.2007.01.019, 2008.
Ramsey, C. B. and Lee, S.: Recent and planned developments of the program OxCal, Radiocarbon, 55, 720–730, https://doi.org/10.1017/S0033822200057878, 2013.
Regattieri, E., Zanchetta, G., Drysdale, R. N., Isola, I., Hellstrom, J. C., and Roncioni, A.: A continuous stable isotope record from the penultimate glacial maximum to the Last Interglacial (159–121 ka) from Tana Che Urla Cave (Apuan Alps, central Italy), Quatern. Res., 82, 450–461, https://doi.org/10.1016/j.yqres.2014.05.005, 2014.
Rohling, E. J., Hibbert, F. D., Grant, K. M., Galaasen, E. V., Irvalý, N., Kleiven, H. F., Marino, G., Ninnemann, U., Roberts, A. P., Rosenthal, Y., Schulz, H., Williams, F. H., and Yu, J.: Asynchronous Antarctic and Greenland ice-volume contributions to the last interglacial sea-level highstand, Nat. Commun., 10, 5040, https://doi.org/10.1038/s41467-019-12874-3, 2019.
Rozanski, K., Araguas-Araguas, L., and Gonfiantini, R.: Relation between long-term trends of oxygen-18 isotope composition of precipitation and climate, Science, 258, 981–985, https://doi.org/10.1126/science.258.5084.981, 1992.
Salonen, J. S., Helmens, K. F., Brendryen, J., Kuosmanen, N., Väliranta, M., Goring, S., Korpela, M., Kylander, M., Philip, A., Plikk, A., Renssen, H., and Luoto, M.: Abrupt high-latitude climate events and decoupled seasonal trends during the Eemian, Nat. Commun., 9, 2851, https://doi.org/10.1038/s41467-018-05314-1, 2018.
Salonen, J. S., Sánchez-Goñi, M. F., Renssen, H., and Plikk, A.: Contrasting northern and southern European winter climate trends during the Last Interglacial, Geology, 49, 1220–1224, https://doi.org/10.1130/G49007.1, 2021.
Sánchez Goñi, M. F., Desprat, S., Fletcher, W. J., Morales-Molino, C., Naughton, F., Oliveira, D., Urrego, D. H., and Zorzi, C.: Pollen from the deep-sea: a breakthrough in the mystery of the ice ages, Front. Plant Sci., 9, 38, https://doi.org/10.3389/fpls.2018.00038, 2018.
Schwarcz, H. P., Harmon, R. S., Thompson, P., and Ford, D. C.: Stable isotope studies of fluid inclusions in speleothems and their paleoclimatic significance, Geochim. Cosmochim. Ac., 40, 657–665, https://doi.org/10.1016/0016-7037(76)90111-3, 1976.
Scussolini, P., Bakker, P., Guo, C., Stepanek, C., Zhang, Q., Braconnot, P., Cao, J., Guarino, M.-V., Coumou, D., Prange, M., Ward, P. J., Renssen, H., Kageyama, M., Otto-Bliesner, B., and Aerts, J. C. J. H.: Agreement between reconstructed and modeled boreal precipitation of the Last Interglacial, Sci. Adv., 5, eaax7047, https://doi.org/10.1126/sciadv.aax7047, 2019.
Sodemann, H. and Zubler, E.: Seasonal and inter-annual variability of the moisture sources for Alpine precipitation during 1995–2002, Int. J. Climatol., 30, 947–961, https://doi.org/10.1002/joc.1932, 2010.
Spötl, C.: Long-term performance of the Gasbench isotope ratio mass spectrometry system for the stable isotope analysis of carbonate microsamples, Rapid Commun. Mass Spectrom., 25, 1683–1685, https://doi.org/10.1002/rcm.5037, 2011.
Spötl, C. and Mattey, D.: Scientific drilling of speleothems – a technical note, Int. J. Speleol., 41, 29–34, https://doi.org/10.5038/1827-806X.41.1.4, 2012.
Spötl, C., Fairchild, I. J., and Tooth, A. F.: Cave air control on dripwater geochemistry, Obir Caves (Austria): Implications for speleothem deposition in dynamically ventilated caves, Geochim. Cosmochim. Ac., 69, 2451–2468, https://doi.org/10.1016/j.gca.2004.12.009, 2005.
Spötl, C., Koltai, G., Jarosch, A. H., and Cheng, H.: Increased autumn and winter precipitation during the Last Glacial Maximum in the European Alps, Nature Commun., 12, 1839, https://doi.org/10.1038/s41467-021-22090-7, 2021.
Sternai, P., Sue, C., Husson, L., Serpelloni, E., Becker, T. W., Willett, S. D., Faccenna, C., Di Giulio, A., Spada, G., Jolivet, L., Valla, P., Petit, C., Nocquet, J.-M., Walpersdorf, A., and Castelltort, S.: Present-day uplift of the European Alps: Evaluating mechanisms and models of their relative contributions, Earth-Sci. Rev., 190, 589–604, https://doi.org/10.1016/j.earscirev.2019.01.005, 2019.
Thomas, Z. A., Jones, R. T., Turney, C. S. M., Golledge, N., Fogwill, C., Bradshaw, C. J. A., Menviel, L., McKay, N. P., Bird, M., Palmer, J., Kershaw, P., Wilmshurst, J., and Muscheler, R.: Tipping elements and amplified polar warming during the Last Interglacial, Quaternary Sci. Rev., 233, 106222, https://doi.org/10.1016/j.quascirev.2020.106222, 2020.
Tremaine, D. M., Froelich, P. N., and Wang, Y.: Speleothem calcite farmed in situ: Modern calibration of δ18O and δ13C paleoclimate proxies in a continuously-monitored natural cave system, Geochim. Cosmochim. Ac., 75, 4929–4950, https://doi.org/10.1016/j.gca.2011.06.005, 2011.
Tzedakis, P. C., Drysdale, R. N., Margari, V., Skinner, L. C., Menviel, L., Rhodes, R. H., Taschetto, A. S., Hodell, D. A., Crowhurst, S. J., Hellstrom, J. C., Fallick, A. E., Grimalt, J. O., McManus, J. F., Martrat, B., Mokeddem, Z., Parrenin, F., Regattieri, E., Roe, K., and Zanchetta, G.: Enhanced climate instability in the North Atlantic and southern Europe during the Last Interglacial, Nat. Commun., 9, 4235, https://doi.org/10.1038/s41467-018-06683-3, 2018.
Vansteenberge, S., Verheyden, S., Cheng, H., Edwards, R. L., Keppens, E., and Claeys, P.: Paleoclimate in continental northwestern Europe during the Eemian and early Weichselian (125–97 ka): insights from a Belgian speleothem, Clim. Past, 12, 1445–1458, https://doi.org/10.5194/cp-12-1445-2016, 2016.
Vansteenberge, S., Verheyden, S., Genty, D., Blamart, D., Goderis, S., Van Malderen, S. J. M., Vanhaecke, F., Hodel, F., Gillikin, D., Ek, C., Quinif, Y., Cheng, H., Edwards, R. L., and Claeys, P.: Characterizing the Eemian-Weichselian transition in northwestern Europe with three multiproxy speleothem archives from the Belgian Han-sur-Lesse and Remouchamps cave systems, Quaternary Sci. Rev., 208, 21–37, https://doi.org/10.1016/j.quascirev.2019.01.011, 2019.
Vogel, N., Brennwald, M. S., Fleitmann, D., Wieler, R., Maden, C., Süsli, A., and Kipfer, R.: A combined vacuum crushing and sieving (CVCS) system designed to determine noble gas paleotemperatures from stalagmite samples, Geochem. Geophy. Geosy., 14, 2432–2444, https://doi.org/10.1002/ggge.20164, 2013.
Wainer, K., Genty, D., Blamart, D., Daëron, M., Bar-Matthews, M., Vonhof, H., Dublyansky, Y., Pons-Branchu, E., Thomas, L., van Calsteren, P., Quinif, Y., and Caillon, N.: Speleothem record of the last 180 ka in Villars cave (SW France): Investigation of a large δ18O shift between MIS6 and MIS5, Quaternary Sci. Rev., 30, 130–146, https://doi.org/10.1016/j.quascirev.2010.07.004, 2011.
Wilcox, P. S., Honiat, C., Trüssel, M., Edwards, R. L., and Spötl, C.: Exceptional warmth and climate instability occurred in the European Alps during the Last Interglacial period, Commun. Earth Environ., 1, 57, https://doi.org/10.1038/s43247-020-00063-w, 2020.
Zhou, Y. and McManus, J.: Extensive evidence for a last interglacial Laurentide outburst (LILO) event, Geology, 50, 934–938, https://doi.org/10.1130/G49956.1, 2022.


