the Creative Commons Attribution 4.0 License.
the Creative Commons Attribution 4.0 License.
 | 15 Mar 2022
Magnitude, frequency and climate forcing of global volcanism during the last glacial period as seen in Greenland and Antarctic ice cores (60–9 ka)
Christine S. Hvidberg
Johannes Lohmann
Steffen Kristiansen
Dorthe Dahl-Jensen
Jørgen Peder Steffensen
Sune Olander Rasmussen
Eliza Cook
Helle Astrid Kjær
Bo M. Vinther
Hubertus Fischer
Thomas Stocker
Michael Sigl
Matthias Bigler
Mirko Severi
Rita Traversi
Robert Mulvaney
Large volcanic eruptions occurring in the last glacial period can be detected by their accompanying sulfuric acid deposition in continuous ice cores. Here we employ continuous sulfate and sulfur records from three Greenland and three Antarctic ice cores to estimate the emission strength, the frequency and the climatic forcing of large volcanic eruptions that occurred during the second half of the last glacial period and the early Holocene, 60–9 kyr before 2000 CE (b2k). Over most of the investigated interval the ice cores are synchronized, making it possible to distinguish large eruptions with a global sulfate distribution from eruptions detectable in one hemisphere only. Due to limited data resolution and large variability in the sulfate background signal, particularly in the Greenland glacial climate, we only list Greenland sulfate depositions larger than 20 kg km−2 and Antarctic sulfate depositions larger than 10 kg km−2. With those restrictions, we identify 1113 volcanic eruptions in Greenland and 737 eruptions in Antarctica within the 51 kyr period – for which the sulfate deposition of 85 eruptions is found at both poles (bipolar eruptions). Based on the ratio of Greenland and Antarctic sulfate deposition, we estimate the latitudinal band of the bipolar eruptions and assess their approximate climatic forcing based on established methods. A total of 25 of the identified bipolar eruptions are larger than any volcanic eruption occurring in the last 2500 years, and 69 eruptions are estimated to have larger sulfur emission strengths than the Tambora, Indonesia, eruption (1815 CE). Throughout the investigated period, the frequency of volcanic eruptions is rather constant and comparable to that of recent times. During the deglacial period (16–9 ka b2k), however, there is a notable increase in the frequency of volcanic events recorded in Greenland and an obvious increase in the fraction of very large eruptions. For Antarctica, the deglacial period cannot be distinguished from other periods. This confirms the suggestion that the isostatic unloading of the Northern Hemisphere (NH) ice sheets may be related to the enhanced NH volcanic activity. Our ice-core-based volcanic sulfate records provide the atmospheric sulfate burden and estimates of climate forcing for further research on climate impact and understanding the mechanism of the Earth system.
- Article
(1797 KB) - Full-text XML
-
Supplement
(35768 KB) - BibTeX
- EndNote


The dispersal of gas, aerosols and ash particles by volcanic eruptions plays a major role in the climate system (Gao et al., 2007; Robock, 2000). Large volcanic eruptions injecting sulfuric gases into the stratosphere and forming sulfate aerosols have a global or hemispheric cooling effect of several degrees lasting for several years after the eruption (Sigl et al., 2015; Sinnl et al., 2021).
Estimations of volcanic stratospheric sulfur injections and of the timing and frequency of large volcanic eruptions are essential for the ability to understand and model past and future global climate conditions (Timmreck et al., 2016). For the last 1200 to 2500 years, the ice-core-based volcanic forcing records derived from Greenland and Antarctica (Crowley and Unterman, 2013; Gao et al., 2008; Toohey and Sigl, 2017) provide an essential forcing record for climate model simulations (Jungclaus et al., 2017), supporting detection and attribution studies (Schurer et al., 2014), including those applied in the IPCC. However, so far the global ice-core-based volcanic record of the last glacial period has been poorly documented.
1.1 Ice-core records of volcanic sulfate deposition
Several studies have reconstructed the volcanic sulfate deposition for part or all of the Holocene in Greenland (Cole-Dai et al., 2009; Gao et al., 2008; Sigl et al., 2013) or in Antarctica (Kurbatov et al., 2006; Castellano et al., 2004; Plummer et al., 2012; Nardin et al., 2020; Cole-Dai et al., 2021). Sigl et al. (2015) applied accurately dated ice cores synchronized between the two hemispheres to reconstruct global volcanism over the last 2500 years. This so-called bipolar synchronization allows distinguishing large global eruptions from those of hemispheric or more regional impact. During the last 2500 years, they identified 50 global (bipolar) volcanic eruptions, 5 of which had a sulfur emission strength larger than or similar to the Tambora eruption occurring in Indonesia in 1815 CE. Prior to the last glacial maximum no bipolar volcanic sulfate deposition record is currently available from ice cores.
One conclusion drawn from historical eruptions is that there is a significant variability of the same volcanic event in the sulfate deposition records derived from different ice cores on both a regional and a local scale (Sigl et al., 2014; Gao et al., 2007). Some of this regional variability can be explained by the difference in sulfate deposition fluxes at different locations. For example, in Antarctica where geographical distances are large, the sulfate deposition at a specific site will be strongly dependent on factors such as the location of the eruption, governing wind patterns and seasonality. Another reason for the lateral sulfate deposition variability is the amount and patchiness of snowfall, which may locally enhance the sulfate deposition for high snowfall areas compared to low snowfall areas for a volcanic event. Moreover, there may be more absent sulfate deposition events caused by post-depositional processes on the snow surface, such as wind erosion (Gautier et al., 2016). The spatial variability of sulfate deposition in Antarctica was studied at 19 sites covering the past 2000 years by Sigl et al. (2014), and here both accumulation and post-deposition effects were found to be important factors. In particular, on the East Antarctic Plateau where snow accumulation is very low, the sulfate deposition is lower than at more coastal and higher-accumulation sites in Antarctica. The snow accumulation effect is also observed in Greenland (Gao et al., 2007), although the effect is much less pronounced here because the accumulation rates are less variable in central Greenland than in different parts of Antarctica. In order to reduce the accumulation bias, Gao et al. (2008) selected five large low-latitude volcanic events from 54 Arctic and Antarctic ice cores and calculated the mean ratio of deposition in individual ice cores; they then applied the deposition ratio between different cores to correct the sulfate deposition for all events in all cores to obtain the Arctic and Antarctic mean sulfate depositions. In general, it is clear that more robust volcanic deposition patterns can be obtained when larger sets of ice cores are included, and preferably ice cores from high-accumulation sites should be applied (Gao et al., 2007; Sigl et al., 2014).
One complication related to the derivation of volcanic sulfate deposition in ice cores is the thinning of the ice layers with increasing depth and age. Due to glacier flow, the annual layers and thus the volcano-derived sulfate deposition become thinned with depth, an effect that is most pronounced at high-accumulation sites and close to bedrock. In central Greenland, typical thinning rates of annual layers in the 60–10 ka range are 50 %–90 % depending on age and local flow conditions (Johnsen et al., 2001). To calculate the sulfate deposition of a specific eruption from a measured ice concentration a correction for the thinning at the corresponding depth is needed to obtain the past accumulation rate at the time of snowfall. Thinning functions are obtained from ice-flow modeling, and thus there is a site-specific dependency on accurate flow modeling associated with the sulfate deposition determination.
1.2 Studies of the frequency of volcanic eruptions
The volcanic sulfate record of the Greenland GISP2 ice core has been investigated by Zielinski et al. (1997), who found that there was increased volcanic activity during the deglacial period (22–8 ka b2k) compared to the average activity of the last glacial cycle. This is interpreted as being related to the tectonic isostatic response to the melting of the large ice sheets during that period. Based on the global volcanic databases (Siebert and Simkin, 2002; Bryson et al., 2006), Huybers and Langmuir (2009) found that volcanism increased 2 to 6 times during the deglacial period of 12–7 ka b2k compared to the average level of eruptions during the 40–0 ka b2k interval.
In Antarctica, Castellano et al. (2004) determined the frequency of volcanic eruptions over the last 45 kyr based on the EPICA Dome C (EDC) ice core. They found a rather constant level of volcanic activity throughout that period except for the most recent millennia, when the activity shows an increase. Kurbatov et al. (2006) detected volcanic signals during the last 12 kyr in the Siple Dome A ice core from West Antarctica. They found that the number of volcanic sulfate signals is decreasing with age, possibly related to the relatively low sampling resolution in the deeper part of that core. Recently, Cole-Dai et al. (2021) used the high-accumulation WAIS Divide ice core to determine a fairly constant Holocene eruption frequency with larger-than-Tambora (1815 CE) events occurring approximately once per millennium. Note, however, that all these reconstructions differ in their volcanic signal detection method, which may lead to different trends in peak frequencies.
1.3 Volcanic events identified in ice cores with tephra and sulfate peak synchronization
The ice-core volcanic source identification is important as it helps to constrain the magnitude – interpreted here as sulfur emission strength rather than the mass of material erupted (Pyle, 2015) – and the climate forcing of the eruption. Furthermore, it allows for a more detailed comparison to modeling studies. In historical times, the volcanic origin of an ice-core acidity spike may be corroborated by a precise dating of the ice core (Sigl et al., 2015). Further back in time, as the uncertainty of both the ice-core dating and the identification of the erupting volcanoes increases, the origin of a volcanic ice-core layer can only be determined if it is associated with a volcanic ash (tephra) deposition in the ice (Gronvold et al., 1995). However, tephra layers do not always coincide with sulfate peaks (Davies et al., 2010), and most volcanic sulfate signals have no tephra associated with them.
In the last glacial period, many Greenland tephra deposits have been associated with Icelandic eruptions, while around a dozen of identified tephra layers originate in North America and eastern Asia (Abbott and Davies, 2012; Bourne et al., 2015; Davies et al., 2014). In Antarctica, tephra layers have been identified and associated with eruptions occurring within Antarctica and in the Southern Hemisphere (Narcisi et al., 2005, 2010, 2012). Recently, Mcconnell et al. (2017) identified tephra from the long-lasting and halogen-rich Antarctic Mount Takahe eruption that occurred around 17.80 ka. Tephra of the Oruanui eruption from the Taupo volcano in present-day New Zealand has been identified and dated to 25.32 ka before 1950 CE (BP) in the West Antarctic Ice Sheet Divide ice core (WDC) (Dunbar et al., 2017).
Volcanic eruptions generally do not deposit tephra in both Greenland and Antarctica, so the bipolar synchronization of sulfur spikes in the ice cores is dependent on an alternative matching technique. Svensson et al. (2020) applied annual layer counting in both Greenland and Antarctic ice cores to match patterns of volcanic eruptions leading to the identification of some 80 bipolar eruptions in the 60–12 ka interval. For the Holocene, a bipolar synchronization of volcanic eruptions was released with the AICC2012 timescale (Veres et al., 2013). Using sulfur isotopes, it has recently become possible to test if sulfate has indeed reached the stratosphere, which is a prerequisite for being globally distributed, as the sulfate undergoes characteristic isotope fractionation in the stratosphere (Burke et al., 2019; Gautier et al., 2018; Crick et al., 2021; Baroni et al., 2008), but these analyses are still scarce for the last glacial period.
1.4 Extending the ice-core volcanic record into the last glacial period
Here we extend the ice-core record of sulfate deposition in Greenland and Antarctica by employing sulfate records from three Greenland and three Antarctic ice cores in the interval 60–9 ka (in one core we use elemental sulfur measurements, but for the sake of brevity we will refer to sulfate records). We investigate the sulfur emission strengths (i.e., defining the climate impact potential) and the frequency of volcanic eruptions detected in either Greenland or Antarctica. For eruptions identified in both hemispheres, we estimate the climate forcing using modern analogs and determine the occurrence of very large eruptions. Unless otherwise stated, all ages provided in this work are relative to the year 2000 CE.
2.1 Ice-core records
For Greenland we used the North Greenland Eemian Ice Drilling ice core (NEEM) (Dahl-Jensen et al., 2013), the North Greenland Ice Core Project ice core (NGRIP2) (North Greenland Ice Core Project members, 2004) and the Greenland Ice Sheet Project 2 ice core (GISP2) (Grootes et al., 1993). In Antarctica we used the WDC ice core (WAIS Divide Project Members, 2013, 2015), the EPICA Dome C ice core (EDC) (EPICA community, 2004) and the EPICA Dronning Maud Land ice core (EDML) (EPICA community, 2006).
The sulfate records were obtained by different analytical methods and with different temporal resolution as detailed in Table S1 in the Supplement. For NGRIP the concentration was obtained by a continuous flow analysis (CFA) system (Bigler, 2004; Röthlisberger et al., 2000). For WDC, sulfur was measured by ICP-MS coupled to a CFA system (Sigl et al., 2016). For EDC and EDML, was measured by fast ion chromatography (FIC) coupled to a CFA system (Severi et al., 2015). For GISP2 and for a second NGRIP profile, was obtained from discrete samples by ion chromatography (IC) (Clausen et al., 1997; Mayewski et al., 1993; Siggaard-Andersen, 2004). The temporal resolution of the sulfate records decreases with ice-core depth and ranges from sub-annual for the CFA profiles to decadal for the lower-resolution discrete profiles (Table S1 and Fig. S2 in the Supplement). The high-resolution NGRIP and WDC records have been resampled to annual resolution, which we see as an upper limit for the effective resolution during the oldest part of the analysis in last glacial. As discussed in Sect. 3.4, we also resample these records to lower resolution in order to obtain comparable resolution throughout the investigated period and in order to investigate eruption occurrences among stadial and interstadial periods. Minor data gaps were interpolated using linear interpolation, and larger gaps are indicated as missing data. Sulfur and sulfate records were corrected for the sea-salt sulfur contribution based on sodium concentrations as a sea-salt tracer by assuming 0.084 for the ratio of (Bowen et al., 1979), except for EDC. In all cases, the sea-salt correction is less than 15 % of the measured sulfate background signal, giving a slight change to the non-sea-salt sulfur. In a previous study of WDC for the Holocene period, methanesulfonic acid (MSA) was used to make a minor correction of the Antarctic sulfur signal (Cole-Dai et al., 2021). As there are no continuous MSA records available for WDC over the investigated period, we do not make this correction here.
For the 12–9 ka interval, the Greenland sulfate deposition is based on the NGRIP and GISP2 records only, as the NEEM dataset is not available.
Apart from using the sulfate records, the depth assignment of the volcanic peaks was occasionally assisted by application of other high-resolution records that also are indicators of volcanic sulfate deposition. Those include the electrical conductivity measurement (ECM) profile, the dielectric profiling (DEP) and the liquid conductivity records, which are also available for most of the applied cores (Table S1 for a complete list of records and references).
2.2 Background signal determination and volcanic peak detection
To determine the biogenic sulfate background level of the ice-core sulfate records and detect volcanic peaks above this background, we apply robust peak detection methods similar to those applied for Holocene records (Fischer et al., 1998; Karlof et al., 2005; Gao et al., 2007; Sigl et al., 2013), which allow for a change with sulfate background variability over time. A running median filter with a width of 50–180 years was applied to estimate the non-volcanic background signal. Due to the different depth resolution of the individual records and because of the highly variable and abruptly changing background levels of the Greenland sulfate levels across Dansgaard–Oeschger (DO) events, it was necessary to apply different filter widths for different records (Fig. S1a–y and Table S1). A second iteration of a reduced running median (RRM) filter using the same filter widths was applied after removal of the spikes identified in the first iteration. For the coarse-resolution NGRIP IC sulfate record, a continuous background determination was not possible and the background was estimated manually for selected events only.
For all records, a volcanic detection threshold was estimated as RRM plus 3 times the running median of absolute deviations from the RRM (RMAD) using the same window widths as for the background determination (Fig. S1a–y). In Greenland, the RMAD value varies strongly across DO events due to the much greater background variability during stadial periods compared to interstadials (Table S2). This implies that the volcanic spikes may not be detected for the time windows covering the fast transitions from stadials and interstadials (lasting on the order of decades to up to about 150 years; Capron et al., 2021) when the background variability changes in a short time. Thus, the volcano frequency found in these short intervals may be impacted, but the volcanic frequency outside these short intervals is not affected. The duration of a volcanic event is estimated from the depth interval of the sulfate spike that is above the RRM, and the sulfate deposition associated with the event is calculated by integrating the sulfate concentrations above the RRM across the duration of the event. The volcanic sulfate peak area S (kg km−2) is calculated as follows:
where y is the non-sea-salt (nss) sulfate concentration in units of parts per billion (ppb), 0.917 is the ice-water density (g cm−3), and the sulfate layer in the ice core is constrained between the depths D1 and D2 in meters of ice equivalent. At shallow depth, the temporal duration of the sulfate deposition can be determined precisely, but in the last glacial period peak broadening by diffusion hampers such a determination, which is not considered in this work.
2.3 Correction for ice-flow and layer thinning
As the volcanic layer is buried in the ice sheet, the layer is being thinned by ice flow. In order to calculate the amount of sulfate deposited on the ice sheet at the time of the eruption a correction for the thinning of the volcanic layer in the ice must be applied.
Here SF is the accumulated sulfate flux (kg km−2) and T is the layer thinning (the ratio between the layer thickness in the ice core and the original layer thickness). The layer thinning has been calculated by site-specific ice-flow models (thinning function) that we applied here (Hvidberg et al., 1997; Johnsen et al., 2001; Rasmussen et al., 2013; Fudge et al., 2016; Bazin et al., 2013; Veres et al., 2013) (Table S1 and Fig. S2c). During the last glacial period, the layer thinning can be significant. For the Greenland cores, the thinning rate ranges from a 60 % reduction of the original layer thickness (T=0.4) at 12 ka b2k to as much as 90 % (T=0.1) at 60 ka b2k (Table S1). For Antarctica, the thinning rate is most significant for the high-accumulation WDC core, in which it approaches 95 % (T=0.05) at 60 ka b2k (WAIS Divide Project Members, 2013; Buizert et al., 2015), whereas the EDC core exhibits a modest thinning of 30 % (T=0.7) at 60 ka b2k (Fig. S2c). For the WDC core, we apply the thinning function of WAIS Divide Project Members (2013) for the upper 2800 m, whereas below 2800 m we apply a simple linear fit to the gas-based thinning function (Buizert et al., 2015) that has large and possibly unrealistic wiggles (Fig. S2c). As the volcanic sulfate deposition scales with the amount of thinning, an inaccurate thinning factor has large implications for the calculated sulfate depositions.
For high-snow-accumulation sites, such as those in Greenland and coastal Antarctica, it is quite likely that wet deposition dominates the sulfate deposition at present day (Kreutz et al., 2000; Schupbach et al., 2018). During the last glacial period, dry deposition may have played a more important role, giving rise to a potential bias of our glacial sulfate deposition estimates. We do not attempt to make any corrections for this effect.
2.4 Correction of volcanic signals for low-resolution data
As the depth resolution of the sulfate records for the GISP2 and NEEM cores is relatively low (Fig. S2a), adjacent acidity peaks may be merged into falsely large acidity spikes. We made a manual correction for this effect by comparing to the corresponding higher-resolution ECM and DEP records (depth resolution of 1 cm or higher) of the same core (WAIS Divide Project Members, 2013; Parrenin et al., 2012; Taylor et al., 1997) and removed or split falsely large peaks according to the associated ECM or DEP peaks. The specific correction for volcanic signals is indicated in Table S3.
2.5 Volcanic sulfate deposition records
We generate three lists of volcanic sulfate deposition for the 60–9 ka period: one for eruptions identified in the Greenland ice cores (Table S3), one for eruptions identified in the Antarctic ice cores (Table S4), and one for global (bipolar) eruptions identified in both Greenland and Antarctica (Table S5). The bipolar list contains the large global eruptions identified by Svensson et al. (2020) and also two large bipolar eruptions found in Veres et al. (2013) for the 12–9 ka period. Furthermore, two additional bipolar eruptions at 44.75 and 44.76 ka b2k have been included by applying the same methods as described in Svensson et al. (2020). For the bipolar list, no bipolar eruptions were unambiguously identified in the 24.5–16.5 ka period, not because they may not have existed but because ice-core synchronization is very difficult in this period. Therefore, the list covers only an effective period of 43 kyr. The list of NH volcanism contains only volcanic deposits larger than 20 kg km−2 in any of the applied Greenland ice cores, and the list containing the Southern Hemisphere includes all deposition events larger than 10 kg km−2 for the Antarctic ice cores, which biases our list to larger eruptions. This cutoff is necessary because of the highly variable sulfate background in the Greenland cold periods of the last glacial predominantly associated with mineral dust (e.g., gypsum; Svensson et al., 2000) (Table S2). A sulfate deposition of 20 kg km−2 corresponds to half the Greenland deposition from the 1815 CE Tambora eruption (Sigl et al., 2015), and thus only quite large events in terms of total sulfur injections into the atmosphere are detected in this work. If the cutoff is set at a lower value, a large number of presumably non-volcanic spikes will be identified in stadial periods. A similar cutoff applied to the sulfate deposition record of the last 2000 years (Sigl et al., 2013) reduces the number of identified eruptions in Greenland from 138 to 49 events. Likewise, for Antarctica, we only identify events that are referred to as “large” or “very large” by Cole-Dai et al. (2021).
When eruptions are detected in several ice cores in Greenland or Antarctica, we provide the sulfate deposition value for each core, the range spanned by all the cores and the calculated average sulfate deposition value. The average Greenland sulfate deposition is calculated by the simple mean of the three cores due to their similar sulfate deposition levels and proximity of the ice-coring sites (Fig. S3). In Antarctica, however, the ice-core sites are far apart and the EDC core generally has the lowest sulfate deposition due to low snow accumulation or a reduced amount of sulfate reaching the remote EDC ice-coring site. Therefore, when there is only a sulfate signal present in one or two cores, the average sulfate deposition of Antarctica is calculated with a rescaling factor, similar to the method applied by Gao et al. (2008). The scaling factor is based on the relative ratio of sulfate deposition from the 30 largest eruptions (in terms of the sulfate deposition) in the three cores in the period of 60–9 ka. For the 30 largest eruptions identified in Antarctica, the ratio of the sulfate deposition among the three Antarctic cores is = (Fig. S3).
The volcanic sulfate deposition uncertainty estimate is obtained from the error propagation in Eqs. (1) and (2). For NGRIP, NEEM, GISP2 and WDC, we apply an estimated 21 % uncertainty of the sulfate concentration levels independent of the analytical method (Fig. S3e), an estimated 10 % uncertainty of the applied thinning functions and a 15 % uncertainty related to the varying temporal resolution of the sulfate records. This leads to an error estimate of up to 26 % for individual deposition events that we apply as an error estimate for all the derived sulfate depositions. For EDC and EDML, the low accumulation leads to an additional large local variability in sulfate deposition of up to 29 % (Gautier et al., 2016), so for those cores we arrive at a combined error estimate of 40 % for individual deposition events. When there are sulfate signals from three ice cores in one hemisphere, we used the standard deviation of the rescaled volcanic sulfate depositions for all ice cores to estimate the uncertainty for the average area volcanic sulfate deposition. When there is a common signal in fewer than three cores, we use the maximum uncertainty of the volcanic sulfate deposition from the individual cores.
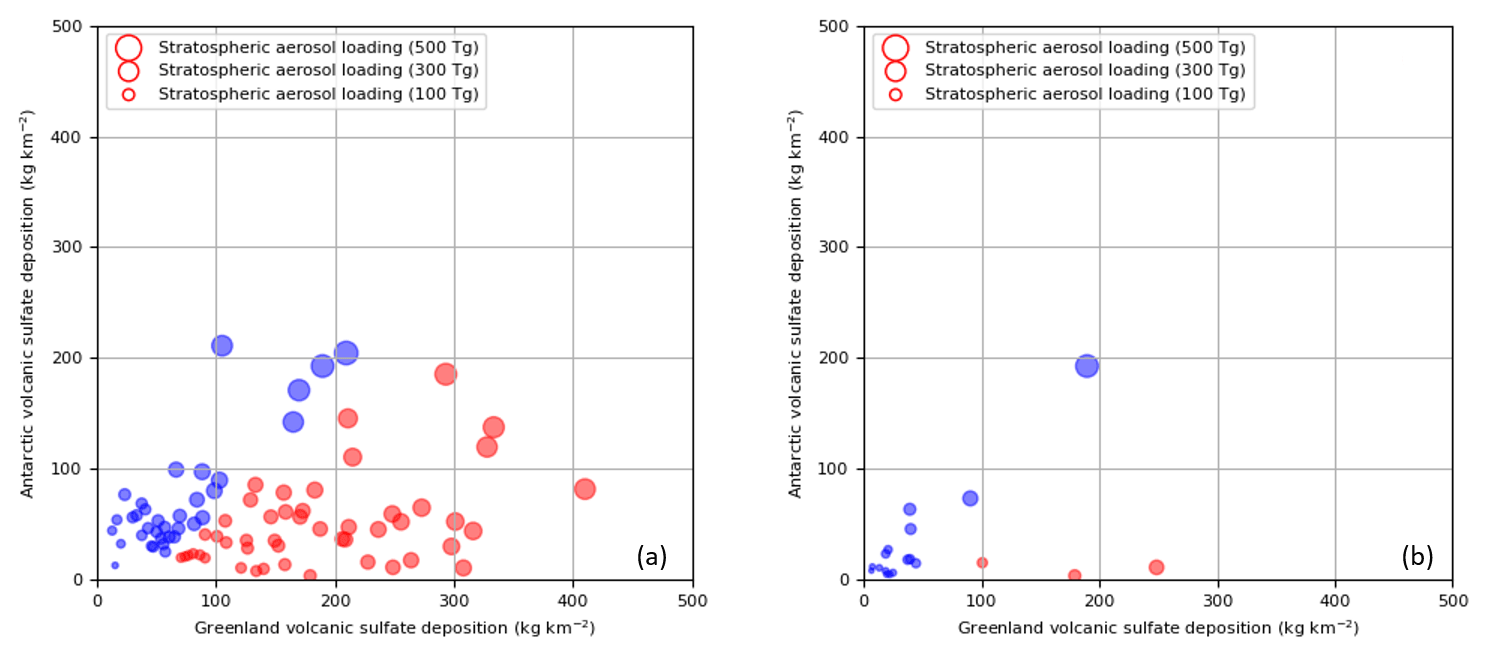
Figure 1Relationship between Greenland and Antarctic volcanic sulfate deposition for the large bipolar volcanic eruptions. The size of the circle relates to the stratospheric sulfate aerosol loading. (a) Volcanoes in the last glacial period are classified by a support vector machine (SVM) model with latitudinal bands: above 40∘ N in red circles, below 40∘ N in blue circles. (b) Volcanoes of the last 2500 years for which the eruption site is known (listed in Table S6) are classified with the latitudinal bands as for (a).
2.6 Latitudinal band assignment of bipolar volcanic eruptions
The volcanic sulfate deposition in Greenland and Antarctica shows a distribution pattern related to the latitudinal band of the eruption site (Fig. 1) (Marshall et al., 2019). To estimate the latitudinal band of bipolar volcanic eruptions of unknown origin, we applied the support vector machine (SVM) classification model of Hastie et al. (2009) and Vapnik (1998) that is based on a kernel function generation and logistic regression. The model was trained using 4 eruptions from the last glacial period and 17 eruptions from the last 2 millennia for which the eruption site is known from the deposit tephra in the ice (Fig. 1b and Table S6). The input values of each eruption for the model on the training set are the average Greenland sulfate deposition, the average Antarctic sulfate deposition and the latitudinal band of the eruption site (above 40∘ N, 40∘ N–40∘ S or below 40∘ S). The cross-validation is performed on the training set consisting of 10 % of the total training eruptions selected at random. Then, this trained model is applied to give a best estimate of the latitudinal band of the bipolar eruptions for which the eruption site is unknown. The model output parameters – kernel scale, box constraints and Bayesian optimization – show that the model has good performance (Fig. S4). Due to the low number of known volcanoes erupted in the high latitudes of the Southern Hemisphere, the method does not allow unambiguous identification of eruptions potentially located in this region. The bipolar eruptions of unknown origin are thus predicted into two latitudinal bands – above 40∘ N (NHHL) and below 40∘ N (LL or SH) (Table S5). The latitudinal band assignment for the four bipolar eruptions at the onset of the Younger Dryas period (Table S5) is similar to that expected from comparing the relative sulfate deposition in Greenland and Antarctica (Abbott et al., 2021). A weakness of the method is that the training set mostly consists of volcanic eruptions for which the sulfate deposition is much smaller than that of the large eruptions occurring during the last glacial period. Details of the SVM method are provided in Hastie et al. (2009, p. 17).
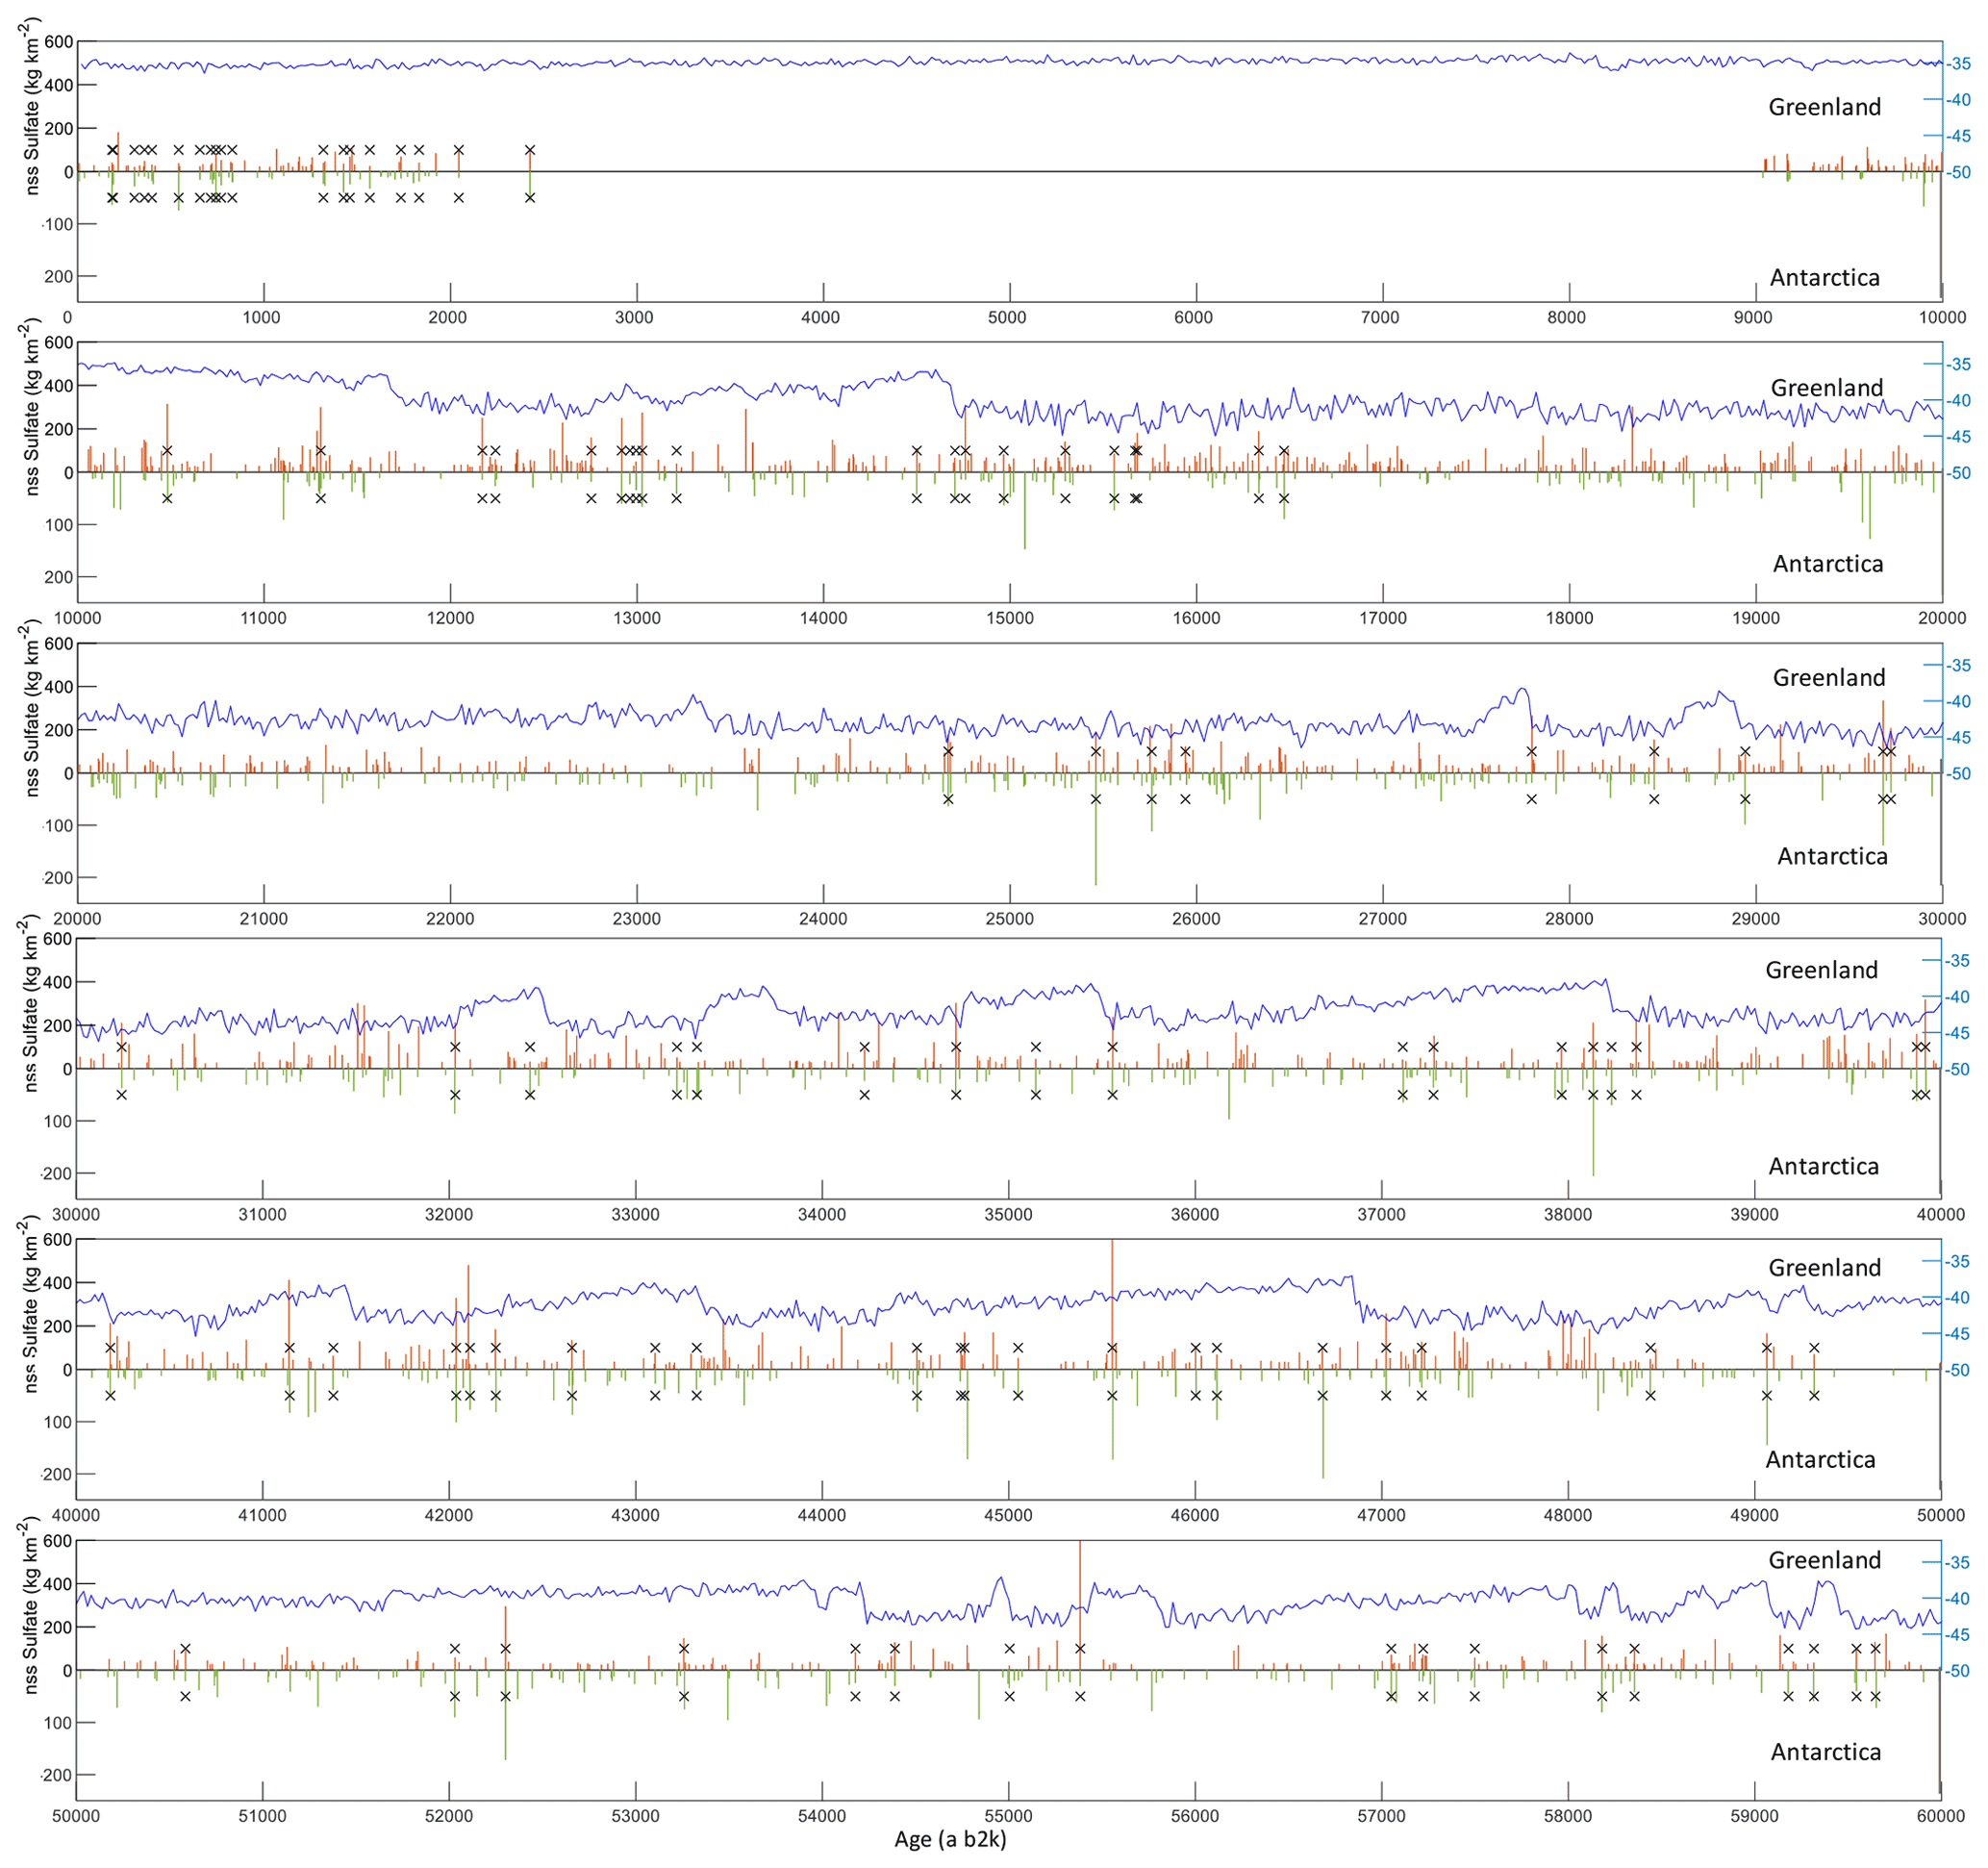
Figure 2The average volcanic sulfate deposition in Greenland and Antarctica (60–9 ka; 2.5–0 ka adapted from Sigl et al., 2013, 2015). The blue curve shows δ18O of the NGRIP core. Greenland volcanic sulfate depositions larger than 20 kg km−2 (cyan bars) and Antarctic volcanic sulfate deposition larger than 10 kg km−2 (black bars) are shown. Bipolar volcanic eruptions are indicated with an “x”.
3.1 The Greenland volcanic sulfate deposition record (60–9 ka)
The sulfate deposition records derived from the NGRIP, NEEM and GISP2 ice cores are displayed in Figs. 2 and S1a–y. The background level of the sulfate signal in the Greenland cores is in the range of 50–200 ppb, with both the absolute level and the signal variability being much higher in stadial periods than in interstadial periods (Table S2). At the abrupt climate transitions during the last glacial period the sulfate background changes abruptly, making it difficult to determine the background level and volcanic detection limits (see Sect. 2.2). The higher background level and variability during the stadial periods are partly due to the lower snow accumulation during these periods.
Using a 20 kg km−2 deposition threshold, 1113 volcanic events are identified in Greenland in total (Table S3). Table S7 shows the number of volcanoes detected from one, two or three Greenland ice cores. NGRIP has the highest event detection rate because of its superior depth resolution. Depth resolution becomes increasingly critical in the cold climate of the investigated period where annual layers get down to a few centimeters of layer thickness (Fig. S2d).
The difference in sulfate deposition among the cores reflects the spatial variability in sulfate deposition within Greenland to some degree but is also strongly influenced by the sulfate analytical measurement technique (IC, FIC, CFA), the data resolution, the thinning correction made for each site and possibly the accumulation rates. A comparison of the sulfate deposition between NGRIP, NEEM and GISP2 for the 30 largest volcanoes with identified signals in Antarctica ice cores shows that there is a very large spread in the signal from event to event (Fig. S3a–d). Due to the large variability of sulfate deposition values among the cores, we provide the full range of sulfate deposition values spanned by the cores as well as the average sulfate deposition value when an eruption is identified in several ice cores.
Figure S3e shows a comparison between the 57 largest volcanic events identified in the NGRIP ice core, as derived from the high-resolution CFA record and from the lower-resolution IC record (Table S5). This comparison illustrates the differences in calculated sulfate depositions due to the analytic method and record resolution only, as the sulfate deposition and the thinning factor uncertainties are eliminated. It is obvious from the comparison that the derived sulfate deposition of a single event in a single core should not be taken at face value; there are very large uncertainties in addition to the variability caused by the spatial distribution pattern. Still, being the first systematic compilation of large volcanic eruptions from the last glacial period, the estimated depositions provide a good estimate of the order of sulfur emission strength and the frequency of large volcanic eruptions in Greenland.
Out of the 1113 volcanic events identified in Greenland we identify 10 very large events with sulfate deposition estimated to be larger than 300 kg km−2, with 9 having an Antarctic counterpart indicating their global impact. We identify 87 volcanic events with sulfate deposition larger than 135 kg km−2, thereby exceeding the Icelandic Laki eruption occurring in 1783 CE, which produced the largest Greenland sulfate deposition in the last 2500 years (Sigl et al., 2015). The largest sulfate deposition in Greenland is by far the North Atlantic Ash Zone (NAAZ II) event occurring at 55.38 ka b2k (Rutledal et al., 2020; Austin et al., 2004). The sulfate deposition of this event is in the range of 866–1436 kg km−2, which is more than a factor of 2 higher than any other event occurring in the investigated period. The second largest event is an unknown eruption occurring at 45.55 ka b2k with a sulfate deposition in the range 200–849 kg km−2. Those and other large events will be discussed in more detail in Sect. 4.4.
3.2 The Antarctic volcanic sulfate deposition record (60–9 ka)
The volcanic sulfate deposition extracted from the EDML, EDC and WDC ice cores is shown in Figs. 2 and S1a–y. The sulfate background level in Antarctica is comparable to that of Greenland (Table S2), but there is much less signal variability and an absence of abrupt shifts associated with Greenland DO transitions, making volcanic signal detection more robust. In total, 737 (344) volcanic sulfate deposition values estimated to be larger than 10 (20) kg km−2 are identified in the Antarctic ice cores (Tables S4 and S7). WDC has the highest accumulation of the three records, but as the deepest part of the applied WDC record is close to bedrock, layer thinning becomes very significant here (WAIS Divide Project Members, 2013), creating a loss of measured ice-core temporal resolution (Table S1). Therefore, in the deepest section of the WDC core, fewer eruptions are detected compared to EDML and EDC, and the derived WDC sulfate deposition has a very strong dependency on the applied thinning function. EDC has the lowest accumulation of the three and also the lowest temporal resolution of the sulfate record. Therefore, smaller events are generally not detected in the EDC core, and the low accumulation contributes to some eruptions being partly or entirely absent from the record (Gautier et al., 2016).
The volcanic depositions of the 30 largest events in Antarctica are compared among the cores in Fig. S3. In general, there are large differences among the sulfate deposition in the different cores for the same events, primarily owing to the large gradient of accumulation rates and spatially different transport pathways over Antarctica (Sigl et al., 2014). The influence of different analytical techniques (FIC or CFA-ICP-MS) and the temporal resolution of the records may also account for some of the variability, in addition to post-depositional processes (Gautier et al., 2018).
In the 60–9 ka period, there are 31 large volcanic events with a sulfate deposition larger than 78.2 kg km−2, which is the largest volcanic deposition in Antarctica over the most recent 2500 years (Sigl et al., 2015). A total of 48 volcanic events have a sulfate deposition larger than 64 kg km−2, corresponding to the Antarctic sulfate deposition of the Kuwae 1458 CE eruption (Sigl et al., 2015). Among the 50 largest eruptions, 28 are also identified in Greenland ice cores. The largest volcanic signal detected in Antarctica occurred at around 46.69 ka b2k with a sulfate deposition of 121.0–369.4 kg km−2.
3.3 The bipolar volcanic sulfate deposition record (60–9 ka)
For the 60–9 ka period, the 85 bipolar volcanic eruptions that have been identified in both Greenland and Antarctic ice cores (Veres et al., 2013; Svensson et al., 2020) are listed separately in Table S5. We note that no bipolar eruptions have been identified in the interval 24.5–16.5 ka because of the general difficulty to synchronize ice cores in this period (Seierstad et al., 2014). A total of 28 out of the 85 bipolar eruptions have been identified in all six ice cores. Two of the bipolar volcanic eruptions are known from Greenland ice-core tephra deposits to be of Icelandic origin: the Vedde ash eruption (12.17 ka b2k) (Mortensen et al., 2005) and the NAAZ II eruption (55.38 ka b2k) (Rutledal et al., 2020). Furthermore, there are tephra deposits in Greenland from the Japanese Towada-H eruption (ca. 15.68 ka b2k) (Bourne et al., 2016). In Antarctica there is tephra deposited from the New Zealand Oruanui, Taupo, eruption (ca. 25.32 ka) (Dunbar et al., 2017) (Table S6). For the bipolar eruptions the volcanic forcing can be estimated using methods previously applied to Holocene eruptions (see Sect. 4.3).
3.4 Relationship between data resolution and the volcanic eruption record of the last glacial (60–9 ka)
To investigate the frequency of different size categories of volcanic eruptions over time, we need to consider the sample resolution of the underlying sulfate records (Fig. S2a and b). As we go back in time, the layer thinning becomes stronger, which makes it increasingly difficult to detect smaller eruptions signals. Depending on the ice-core sample resolution, the apparent number of smaller eruptions decreases relatively faster with increasing age (or depth) than the larger eruptions, as the former will no longer exceed the detection threshold determined by the background signal due to smoothing of the records (Fig. S5). The effect is seen when the frequency of detected eruptions is separated into fractions of sulfate deposition sizes. We separated the eruptions according to the 0.7 and 0.9 quantiles of the volcanic sulfate deposition distribution, which for Greenland are 68 and 140 kg km−2 and for Antarctica 25 and 50 kg km−2. When considering the frequency of volcanic eruptions across the investigated period, we should preferably have the same or at least a comparable temporal sulfate sample resolution throughout the period in order to minimize this age (or depth) bias.
For Greenland, only the NGRIP sulfate record has high (sub-annual) resolution for most of the investigated interval (Fig. S2b). Therefore, the number of eruptions detected in different periods will depend strongly on the NGRIP sample resolution. The NGRIP sulfate has an effective resolution of 8–20 mm due to smoothing of the record in the ice and – most importantly – signal dispersion during the measurement. Using an approach similar to that of Rasmussen et al. (2005), we performed a spectral analysis of the NGRIP sulfate record to determine a signal cutoff of around 2 cm, which is comparable to that of other components analyzed with the same setup (Bigler et al., 2011) (Fig. S6). 2 cm corresponds to about two annual layers in NGRIP in the climatically coldest and oldest sections of the investigated interval. In Table S8 and Fig. S5 we investigate the effect of increased smoothing of the NGRIP sulfate record for the detection of sulfate spikes. As expected the number of detected eruptions decreases with increased smoothing; however, with 3-year smoothing, the number of larger sulfate spikes starts to increase as adjacent sulfate peaks merge.

Figure 3Number (a) and volcanic sulfate deposition (b) of volcanoes per millennium detected in Greenland and Antarctic ice-core sulfate records with relatively similar data resolution for the last 2500 years and the late glacial period. Positive values represent Greenland volcanoes, and negative values represent Antarctic volcanoes. The volcanic eruptions are grouped into three size fractions based on the 0.7 and 0.9 quantiles of the volcanic sulfate deposition distribution. For Greenland the classes are separated at 68 and 140 kg km−2, and for Antarctica the separation is made at 25 and 50 kg km−2. The magnitude of volcanoes is represented by the average volcanic sulfate deposition in Greenland or in Antarctica. The records used for the figure are as follows: for the last 2000 years (911–1911 CE and 89–911 CE), the volcanic sulfate deposition is based on the NEEM S1 and NGRIP cores for Greenland and on the WDC core for Antarctica (Sigl et al. 2013) using smoothed 2-year resolution sulfate records. For the period 60–9 ka the Greenland sulfate deposition is derived from NEEM, GISP2 and NGRIP. For GISP2, the data were smoothed to 5 years in the period of 14–9 ka, and for the period older than 14 ka only large volcanic sulfate signals are detected. The NGRIP sulfate record has been smoothed to 2-year resolution throughout. For the period 60–9 ka the Antarctic sulfate deposition is derived from EDML, EDC and WDC sulfate records. The WDC sulfate record has been smoothed to 2-year resolution.
As a compromise between compensating for the decreasing resolution of the record with depth and at the same time avoiding a strong influence of the peak merging effect, we smoothed the NGRIP sulfate record to 2-year resolution for the eruption frequency analysis, knowing that this eliminates a fraction of the smaller eruptions in the younger section of the record. With the 2-year smoothing there is probably still a bias towards a higher detection rate in the stadial periods due to the high signal variability of the sulfate record in those periods (see discussion in Sect. 4.1). The GISP2 sulfate record has lower than 10-year resolution in the 60–14 ka period (Fig. S2), so in this period we can only use the GISP2 sulfate record to estimate the sulfate deposition of the larger eruptions. The NEEM sulfate record has a constant resolution of 10 years, and we use this record throughout the investigated period. In Fig. 3 we show the records of detected Greenland eruptions per millennium with the sulfate deposition grouped into three size fractions.
For Antarctica, EDML and EDC have fairly constant thinning rates for the 60–9 ka period (Fig. S2c), whereas WDC has very strong thinning in the oldest part of the period due to the high accumulation rate (Fig. S2c). Spectral analysis of the Antarctic sulfate records shows that the effective resolution (Table S1) and the signal cutoff are around 2 cm, 3 cm and 1 cm for EDML, EDC and WDC, respectively (Fig. S6). In order to have comparable resolution throughout the investigated period, we smoothed the entire WDC sulfate record to 2-year resolution to homogenize the record resolution across the investigated period. For EDML the corresponding effective signal resolution is 1–2 years for the entire period, so we keep the original resolution of the EDML sulfate record for the entire period. The EDC sulfate record has almost constant resolution, so we apply this record throughout the investigated period. The result of the frequency analysis is discussed in Sect. 4.1.
In the following we investigate possible climate–volcano links on different timescales, estimate the last glacial volcanic forcing and compare the glacial volcanic record to that of the last 2500 years. Many studies have discussed a possible impact of climate on the frequency and magnitude of volcanic eruptions (Cooper et al., 2018). In particular, the melting of the large ice sheets at the end of the last glacial period and the corresponding sea level rise are thought to have created crustal stress imbalances and increased the volcanic eruption frequency in that period (Watt et al., 2013; Huybers and Langmuir, 2009; Zielinski et al., 1996, 1997).
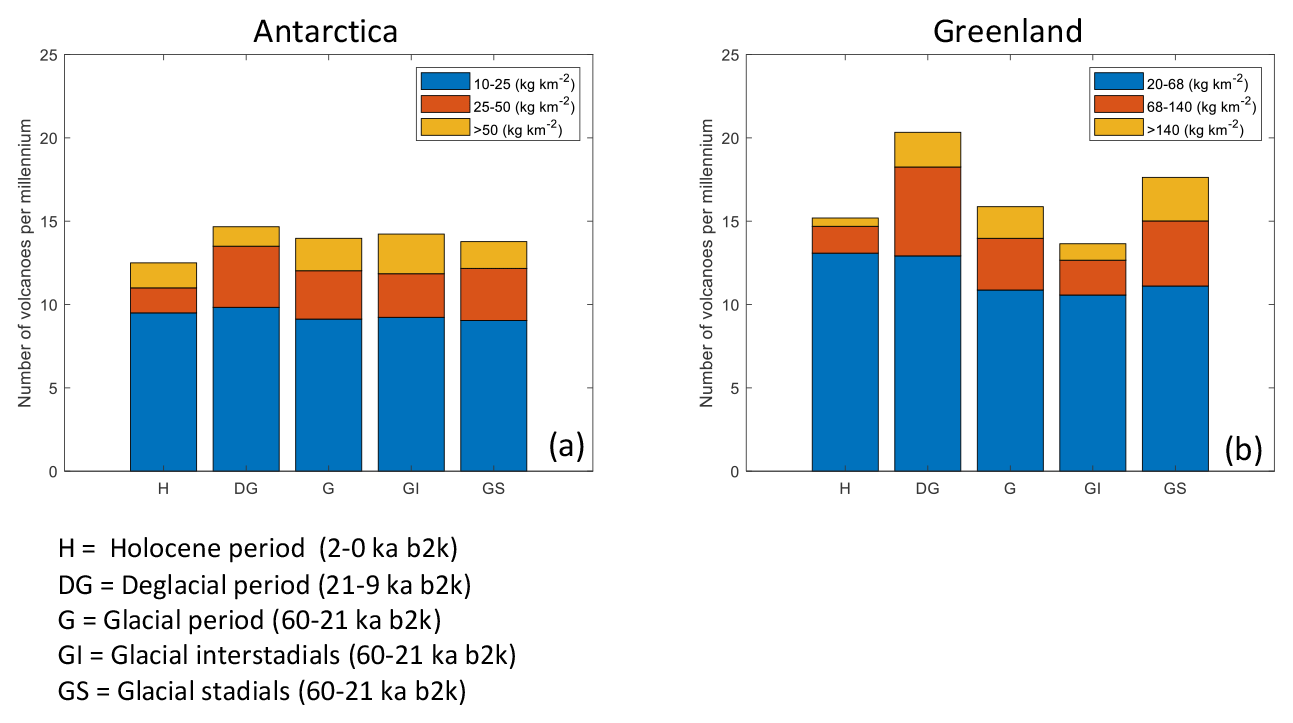
Figure 4Comparison of the number of volcanic eruptions per millennium detected in (a) Antarctic and (b) Greenland ice cores grouped for different climatic periods with relatively similar data resolution for the last 2500 years and the late glacial period. The applied datasets and smoothing are the same as used for Fig. 3. The detected eruptions are classified into three size fractions similar to the approach in Fig. 3.
4.1 Millennium-scale volcanic eruption variability
We investigate the variability in eruption frequency and sulfur emission strength with the DO cycles by separating the detected volcanic eruptions according to the climate of “cold” and “milder” periods and applying the onset and termination of DO events defined by Rasmussen et al. (2014). Cold periods constitute the stadial periods from 21 to 60 ka b2k, covering a total of 21.8 kyr. Mild periods are the remaining periods that include all of the interstadial periods from 21 to 60 ka b2k, adding up to 17.2 kyr. We grouped the detected eruptions according to the size of deposited sulfate and also investigated the effect of smoothing the NGRIP sulfate record to 1-, 2-, 3- and 5-year resolution (Fig. S7). For Antarctica, the number of detected eruptions (per millennium) is very similar for stadial and interstadial periods, independent of deposition size categories and record smoothing (Fig. 4). For Greenland, however, the number of volcanic eruptions is higher in stadial periods than in interstadial periods (Fig. 4); in the smaller deposition category (20–68 kg km−2) this effect decreases with increasing NGRIP sulfate record smoothing (Fig. S7).
This observed difference leaves us two options: either there is a true millennium-scale volcanic eruption variability related to northern hemispheric climate variability during the last glacial period, or the dependency is an artifact caused by the very different properties of the Greenland sulfate record in stadial and interstadial periods. In Greenland, the variability of the sulfate background level is high in cold periods, stadials and the Last Glacial Maximum (LGM), and it is low in milder periods such as interstadials (see Sect. 3.1). We try to take this difference into account by employing the variability-dependent RMAD to determine the eruption detection limit, but because of the very different character of the sulfate profiles in cold and milder periods there is still the possibility of having a climate-related detection bias of sulfate spikes that is unrelated to the actual volcanic eruption record. For example, in cold periods, it could be that strong seasonal sulfate spikes associated with marine or terrestrial (non-volcanic) sulfate production could be detected as smaller volcanic eruptions. For recent times, Gao et al. (2007) have demonstrated that the volcanic sulfate deposition is accumulation-dependent to some degree, with increased accumulation leading to higher sulfate deposition. Since, however, the highest accumulation occurs in the interstadial periods, this effect would lead to relatively higher sulfate deposition in interstadial periods, which is the opposite of what is observed.
We investigated the effect of possible seasonal sulfate contributions of non-volcanic origin with a smoothing exercise whereby successively increased smoothing of the NGRIP sulfate record increasingly eliminates the detection of smaller short-lived (seasonal) sulfate spikes. Figures S5 and S7 as well as Table S8 show the number of sulfate spikes detected in stadial and interstadial periods as a function of the degree of smoothing. It is seen that for cold periods, the number of detected small and short-lived sulfate spikes decreases significantly with increased smoothing, whereas the effect is almost absent for milder periods. This suggests that the higher number of detected sulfate spikes in cold periods is mainly due to spikes of periodic duration in the sulfate background, which we believe are less likely to be of volcanic origin. For volcanic eruptions that are large enough to inject sulfate into the stratosphere modern observations show that the sulfate fallout will typically last several years. We thus conclude that the apparent increased volcanism detected in cold periods is most likely an artifact caused by non-volcanic seasonal contributions from high-sulfate marine or terrestrial sources. It could, for example, be contributions from gypsum that is known to have high deposition fluxes in Greenland during stadial periods (Legrand and Mayewski, 1997). Indeed, for bipolar events we do observe a higher correlation in stadial periods than in interstadial periods between the volcanic sulfate deposition and both insoluble dust concentration and sodium concentration (Fig. S10). We cannot, however, exclude the possibility that other mechanisms such as different atmospheric circulation patterns, or a different sulfate deposition process in terms of dry versus wet deposition, also affect the Greenland volcanic detection rates in stadial versus interstadial periods. We note that because an increased smoothing of the sulfate record mostly decreases the number of smaller detected sulfate depositions, the effect of smoothing on the large accumulated sulfate deposition over time is less important (Fig. S5 and Table S8).
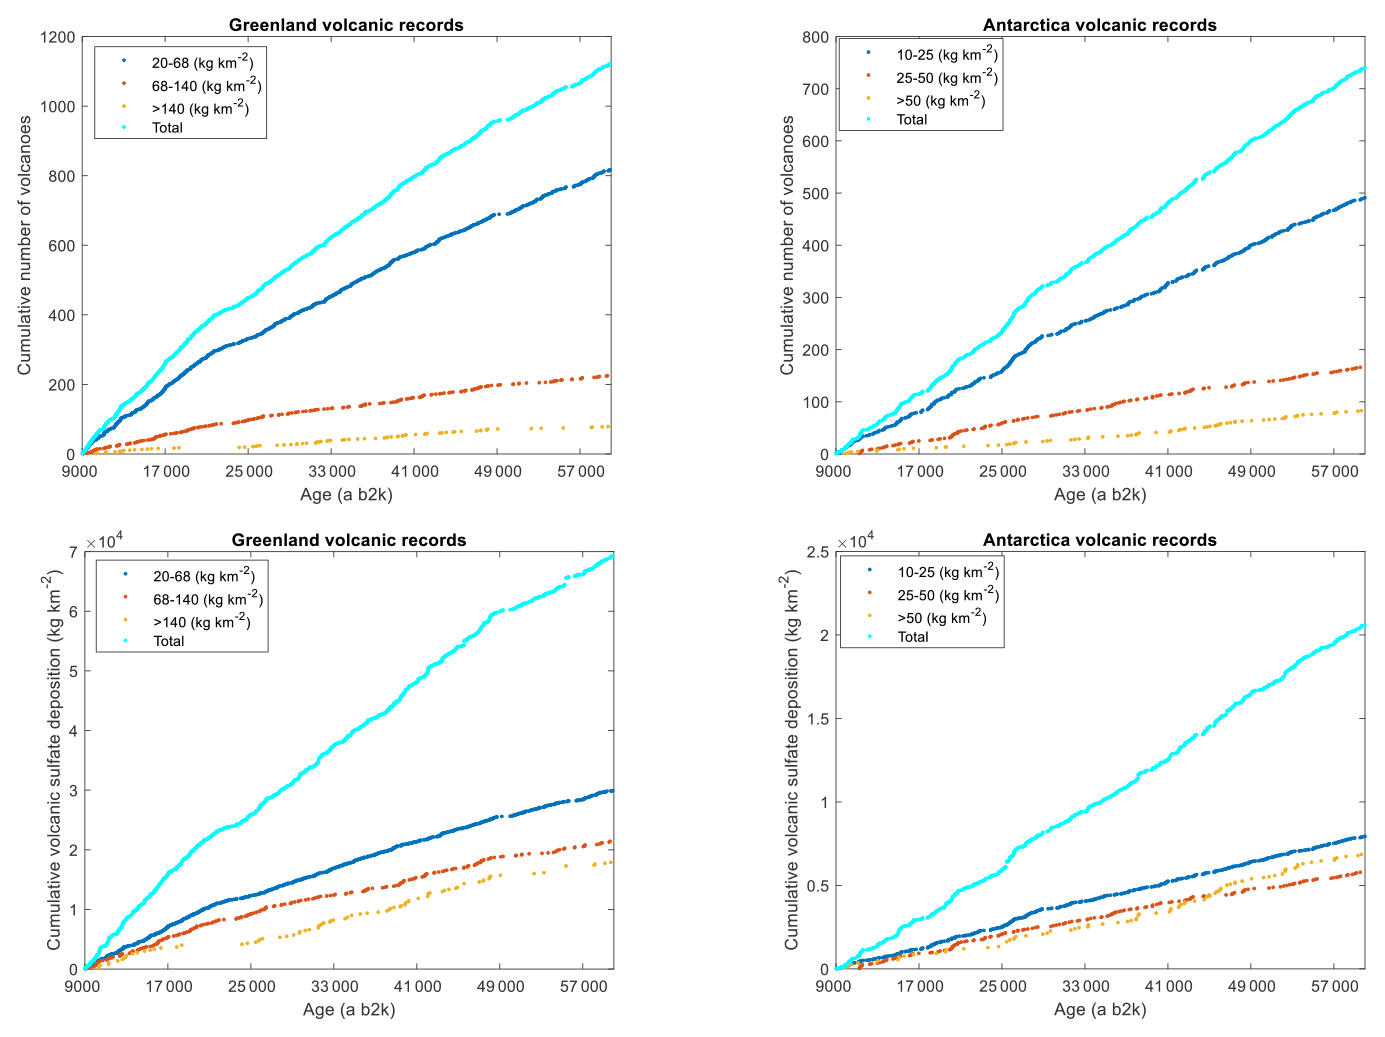
Figure 5Cumulative number and sulfate deposition of volcanoes with time (same as in Fig. 2 and Tables S3 and S4) for three classified size fractions (same fractions as in Fig. 3) of volcanoes for Greenland and Antarctica (60–9 ka).
4.2 Long-term volcanic eruption variability
In order to estimate the long-term pattern of volcanic activity, the accumulated number of volcanic eruptions and resulting sulfate deposition in Greenland and Antarctica over the investigated period are compared in Fig. 5 (same data as applied in Fig. 2). The cumulative volcanic number (sulfate deposition) in Greenland is larger than in Antarctica by a factor of 3.2 (4.7), considering only sulfate depositions larger than 20 kg km−2 at both poles. We attributed this mainly to the larger number of volcanoes situated in the NH, but it is possibly also related to the proximity of Iceland to Greenland and to other volcanic regions located upwind of Greenland, as well as to the differing atmospheric circulation patterns between the two hemispheres (Toohey et al., 2019). In terms of cumulated volcanic number there is some temporal variability that could be climate-related, but overall the eruption frequency is rather constant in comparison to the geological record from the Large Magnitude Explosive Volcanic Eruptions (LaMEVE) database (Brown et al., 2014), most likely because the ice-core preservation and identification are much more homogeneous over time than that of radiometrically dated eruptions.
The number of volcanic eruptions per millennium shows a fairly constant level for both Greenland and for Antarctica (Figs. 3, S8 and S9). The early Holocene increase in global volcanism as suggested by Watt et al. (2013) is not identified in our record. Neither is the periodicity of Campanian eruptions as identified by Kutterolf et al. (2019), but this pattern could be masked by eruptions from elsewhere.
Based on the EDC sulfate record, Castellano et al. (2004) determined the Antarctic volcanic sulfate deposition to be fairly constant over the last 45 kyr, except for an increase during the last 2000 years. The eruption frequency level of 5–10 eruptions per millennium determined in that study is on the low side compared to the present study, in particular for the older part of the period (Fig. 3). This is likely because the EDC sulfate record has low resolution and could not pick up all of the smaller short-lived eruptions and also because the low accumulation at the EDC site does not record some eruptions (see the Methods and Results sections). Over the 60–9 ka interval we have detected 225 volcanic eruptions in EDC compared to 513 and 496 in the higher-resolution WDC and EDML records, respectively (Table S4).
Recently, Cole-Dai et al. (2021) compiled a Holocene volcanic record from the high-resolution sulfate record of the high-accumulation WDC ice core. The authors determine fairly constant Holocene volcanic activity with the identification of 426 eruptions, 162 and 44 of which have sulfate depositions larger than 10 and 30 kg km−2, respectively. Those numbers are very comparable to our findings for Antarctica in the period of 11–9 ka (Fig. 3).
Based on the same GISP2 sulfate dataset as applied in the present study and after introducing a rescaling to compensate for the decreasing sample resolution with depth, Zielinski et al. (1996, 1997) identified an enhanced northern hemispheric volcanic eruption frequency in the deglacial period (17–6 ka) compared to the 60–0 ka average. In our three-core Greenland sulfate deposition compilation, we also found an increased volcanic eruption frequency over the deglacial period, which is 34 % higher than the late Holocene period (2–0 ka), especially for the fraction of large sulfate deposition events (Figs. 3 and 4). In Antarctica, neither the detected eruption frequency nor the total sulfate deposition over the deglacial period is higher than the average for the full 60–9 ka interval. We therefore conclude that the increased large eruptions occurring in the deglacial period are mostly of northern hemispheric origin. This hypothesis is supported by the elevated number of tephra deposits identified in Iceland records (Maclennan et al., 2002) and in Greenland during the deglacial period; they are mostly of Icelandic origin, but a few are from Japanese and unknown origins (Bourne et al., 2016; Zielinski et al., 1997; Mortensen et al., 2005; Gronvold et al., 1995). Van Vliet-Lanoe et al. (2020) found that the enhanced volcanic activity in southern Iceland is most likely related to stress unlocking during deglaciation events and to rifting events at the melting margin of the ice sheet. In the period of 14.6–13.1 ka in southeastern Alaska, enhanced volcanic activity from the Mount Edgecumbe Volcanic Field has also been observed by Praetorius et al. (2016).
Table 1The number and frequency of large bipolar volcanic eruptions for the last 2500 years and for the last glacial and early Holocene (this study). The climate forcing is calculated using the SAOD scaling of Aubry et al. (2020) and the radiative forcing conversion from Marshall et al. (2020).
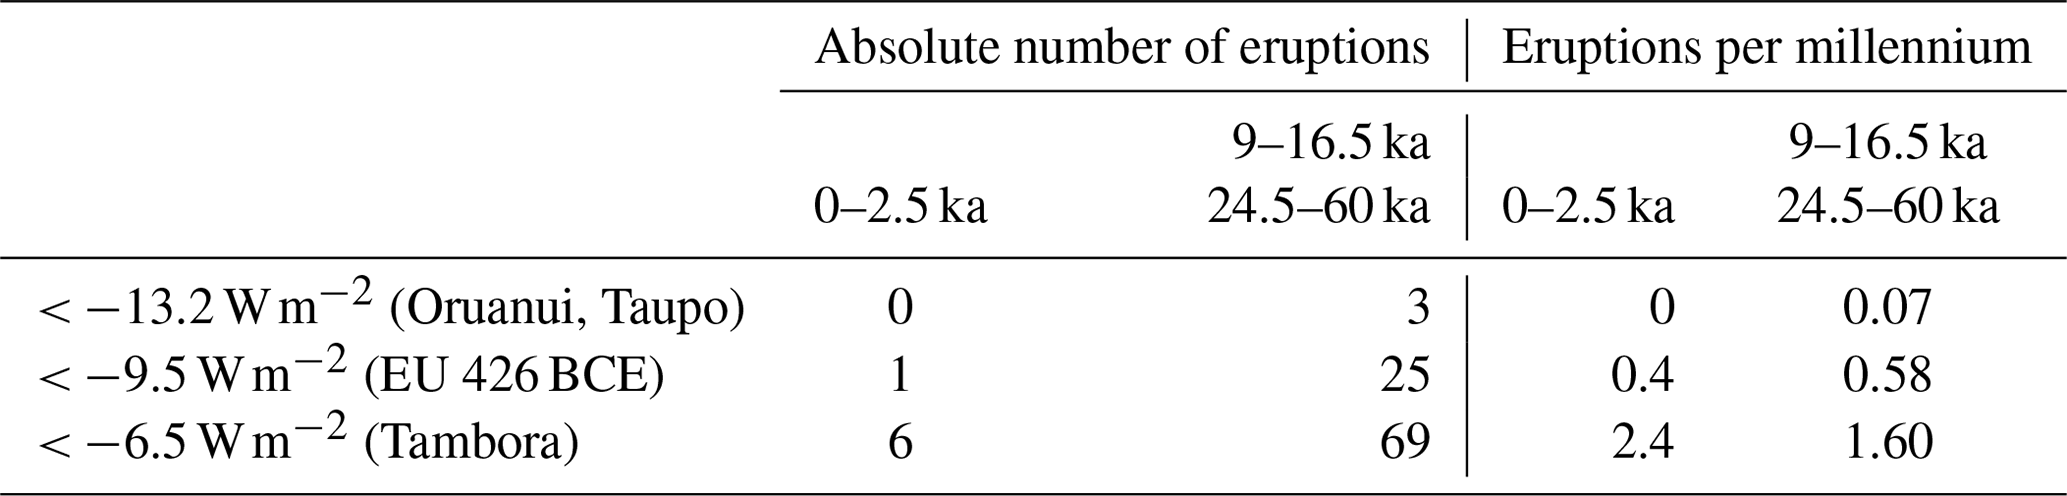
For the glacial period (60–21 ka), the frequency of detected eruptions is similar to that of the last 2000 years when comparing the same sulfate deposition fractions (Fig. 4). We note that for the last 2000 years only eruptions with sulfate depositions larger than 20 kg km−2 are included, and in order to make the profiles comparable the sulfate records have been smoothed with a 2-year filter. The apparent increase in global volcanism over the last millennia in the geologic records (Brown et al., 2014) is therefore most likely due to an underrepresentation of older eruption identifications (Papale, 2018; Deligne et al., 2010). When it comes to sulfur emission strengths of eruptions and accumulated sulfate deposition, however, the last 2000 years appear to be underrepresented in very large eruptions compared to long periods of the last glacial period (Table 1).
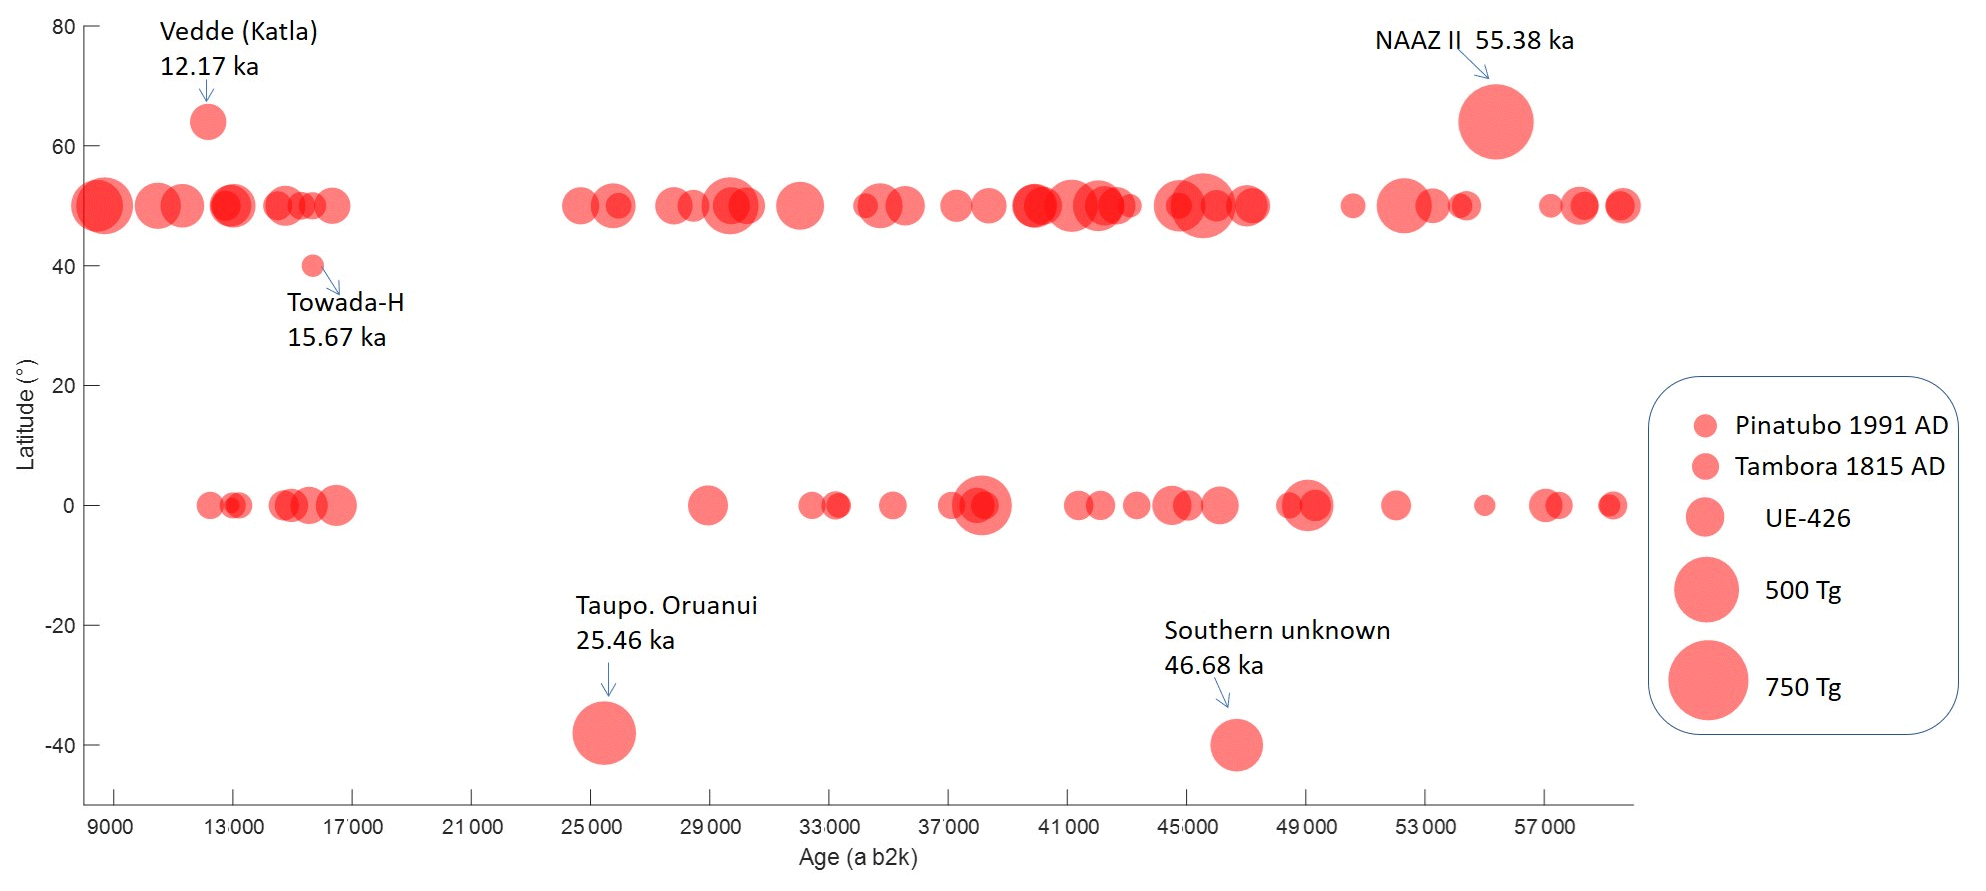
Figure 6Schematic of the latitudinal location for the identified bipolar volcanic eruptions (Table S5). Volcanoes for which the eruption site is predicted above 40∘ N are marked at 50∘ N, and those predicted below 40∘ N are marked at the Equator. Volcanic locations that are known from ice-core tephra deposits are indicated by name and age of the eruption (Table S5). Due to its high relative sulfate deposition in Antarctica, the eruption at 46.68 ka, marked at 40∘ S in the figure, is very likely from the Southern Hemisphere, but the eruption site is unknown. The size of the circles represents the strength of volcanic stratospheric aerosol loading.
4.3 Estimating the volcanic forcing of the last glacial 60–9 ka
To estimate the volcanic radiative forcing from eruptions occurring in the last glacial and early Holocene we need to (i) constrain the sulfate stratospheric aerosol loading (we applied the method of Gao et al., 2007), (ii) convert the stratospheric aerosol loading into the global mean stratospheric aerosol optical depth (SAOD) (we applied the methods of Crowley and Unterman, 2013, and that of Aubry et al., 2020), and (iii) convert global mean SAOD to the global mean radiative forcing (we applied the methods of Hansen et al., 2005, and that of Marshall et al., 2020). The global stratospheric sulfate aerosol loading requires a separation of NH high-latitude eruptions from other eruptions, as the two eruption groups are scaled differently (Gao et al., 2007). We defined NH high-latitude eruption as eruptions that occurred at a latitude above 40∘ N. To identify the NH high-latitude eruptions, we applied a support vector machine learning classifier model (SVM – see Methods section) that is trained by the bipolar sulfate deposition of volcanic eruptions for which the eruption site is known. We applied 17 Holocene and 4 glacial volcanic eruptions of known origin (Table S6) to predict that 50 out of 85 bipolar eruptions of unknown origin are likely to have occurred in the NH high latitudes (Figs. 1 and 6). We then reconstruct the volcanic radiative forcing using three different approaches.
-
The global mean SAOD is obtained using the method of Crowley and Unterman (2013), and the radiative forcing calculation applies the scaling factor of Hansen et al. (2005). Here the volcanic radiative forcing is calibrated against Pinatubo 1991 CE (at 15∘ N). This approach is similar to the one used by Sigl et al. (2015).
-
The global mean SAOD is obtained using the scaling factor of Aubry et al. (2020), and the radiative forcing calculation applies the scaling factor of Hansen et al. (2005). This approach is similar as IPCC AR5.
-
The global mean SAOD is obtained using the scaling factor of Aubry et al. (2020), and the radiative forcing calculation applies the scaling factor of Marshall et al. (2020), which considers rapid aerosol adjustment for large volcanic eruptions.
All of the reconstructed volcanic radiative forcings are calibrated and evaluated based on modern volcanic eruptions, and they are therefore potentially biased when applied to the eruptions occurring in the very different glacial climate (see Sect. 4.1). Table S5 and Fig. S11 present the reconstructed volcanic radiative forcing of individual volcanic events using the three approaches. The reconstructed volcanic forcing obtained by methods (2) and (3) is significantly weaker than that obtained by method (1) by a factor of 1.3 and 2.8, respectively, when integrated over all events. In the following, we adopt method (3) to present the reconstructed volcanic forcing values.
Having estimated the volcanic forcing of the glacial and early Holocene eruptions, we can compare it to the well-constrained eruptions that occurred over the last 2500 years (Sigl et al., 2015). In Table 1 we compare the number of eruptions with a climate forcing larger than Oruanui, Taupo at 25.32 ka, the unidentified eruption of 426 BCE, and Tambora in 1815 CE for the periods of 2.5–0 and 60–9 ka. Note that the investigated period of the last glacial and the early Holocene covers some 43 kyr (60–9 ka minus the section of no identified bipolar eruptions at 24.5 to 16.5 ka). Among the 85 bipolar events investigated in the last glacial and early Holocene, 3 eruptions are found to be larger than Oruanui, Taupo, and 25 eruptions are found to be larger than the largest eruption of the past 2500 years.
Based on geological evidence, the occurrence of large volcanic eruptions was estimated in terms of their VEI (volcanic explosivity index), which is based on the volume of ejected magma. The average occurrence rate of VEI-7 (VEI-8) volcanoes discovered in the last 125 kyr (2600 kyr) is 0.3 (0.01) per millennium based on databases of LaMEVE and GVP (Papale, 2018). From ice-core records, we cannot directly derive the VEI, but the estimated volcanic radiative forcing is likely to be another good indicator of volcanic eruption magnitude. The average rate of volcanoes in the 60–9 ka interval with a climate forcing larger than the 1815 CE Tambora eruption (VEI-7) is 1.60 per millennium (Table 1). In the same interval, we have four eruptions with a climate forcing larger than or equal to the 25.32 ka Taupo Oruanui (VEI-8) eruption. Of those, the Icelandic 55.38 ka NAAZ II volcanic event is likely to be overestimated due to its proximity to Greenland (see Sect. 4.4.). Thus, we identify three eruptions with a climate forcing larger than or equal to Taupo Oruanui at 25.47 ka, occurring at a rate of 0.07 eruptions per millennium. Those ice-core-based eruption frequency estimates are thus about 5.3 times larger than those based on geological evidence for Tambora in 1815 CE and 7 times larger than Taupo Oruanui at 25.32 ka, resting on the observation that there is a positive relationship between the volume of ejected magma and the emission of sulfur gas for a volcanic eruption (Table S6).
Table 2The largest bipolar volcanic eruptions of the last glacial period and early Holocene ranked by the volcanic aerosol forcing that is derived from the average Greenland and Antarctic volcanic sulfate depositions. The stratospheric aerosol loading was estimated according to Gao et al. (2007), and the radiative volcanic aerosol forcing was reconstructed with a scaling factor of SAOD obtained from Aubry et al. (2020) and a scaling factor to obtain the radiative forcing following Marshall et al. (2020) (Sect. 4.3). “NHHL” refers to high-latitude Northern Hemisphere locations of volcanoes, meaning above 40∘ N; “LL or SH” refers to low-latitude or Southern Hemisphere locations, meaning below 40∘ N. “Number of ice cores” refers to the number of ice cores in Greenland and Antarctica in which the volcanic sulfate signal has been detected.

4.4 Large and notable volcanic eruptions of the last glacial period (60–9 ka)
The largest eruptions of the last glacial period and early Holocene are ranked by the average climate forcing in Table 2. The highest ranking on the list is the Icelandic eruption associated with the NAAZ II occurring in GS-15.2 at 55.4 ka b2k (Gronvold et al., 1995; Zielinski et al., 1997). The sulfate deposition in Greenland from this eruption is enormous (almost 15 times higher than the deposition for Laki in 1783 CE), but no sulfate or only very little sulfate is deposited in Antarctica. With its close proximity to Greenland, it is therefore likely that a large fraction of the sulfate was transported to Greenland through the troposphere, and thus the estimated climatic forcing of −15.9 W m−2 is probably overestimated and should not be taken at face value. From the marine sediment records, the NAAZ II layer consists of different Icelandic events (Rutledal et al., 2020). For the above reasons, the eruption should not be considered the largest eruption of the last 60 kyr in a global context. The very wide range of sulfate deposition of 866.2–1435.6 kg km−2 among the Greenland ice-core records (Table S5) is probably due to a combination of (1) a true geographical variability in deposition in Greenland, (2) the quite significant and possibly inaccurate correction for layer thinning at great depth in the ice cores for this eruption, and (3) an unexplained difference related to the different analytical methods applied (see Results section).
The second largest event on the list occurred in GI-12 at 45.56 ka b2k and is identified in all Greenland and Antarctic ice cores, but the deposition at EDC is very low, most likely due to its low accumulation and the low time resolution of the sulfate record. The eruption is of unknown origin, but based on its relative Greenland and Antarctic sulfate deposition, it occurred in the NH extratropical area, and its climate forcing is estimated to be −15.0 W m−2.
Number 3 on the list of large eruptions occurred at 38.13 ka b2k, 100 years after the onset of GI-8 and 11 years before the occurrence of the Faroe Marine Ash Zone III (FMAZ III) tephra in Greenland (Davies et al., 2012). The eruption is detected in all ice cores (but there is a data gap for the WDC sulfur in this interval), and with very similar Greenland and Antarctic sulfate depositions this is most likely a low-latitude eruption with an estimated average climate forcing of −13.6 W m−2, about 2 times that of Tambora (1815 CE).
The fourth largest bipolar ice-sheet sulfate deposits are from the New Zealand Taupo, Oruanui, eruption that occurred in GS-3 at 25.32 ka, verified by the presence of a tephra deposit in Antarctica (Dunbar et al., 2017). The estimated average climate forcing of the eruption is −13.2 W m−2, about 1.5 times that of Samalas 1257 CE (−9.1 W m−2) (Sigl et al., 2015), which caused large variability in atmospheric temperature in the global climate for several years (Lim et al., 2016), prolonged the drought in North America and led to famine (Herweijer et al., 2007). Despite its magnitude, the sulfate deposition of the eruption is undetected in the Greenland GISP2 ice core, which has the lowest temporal sulfate data resolution of all the cores used in this time period.
In GS-5.1 at 29.68 ka b2k there is a pair of volcanic eruptions separated by some 40 years, the younger of which ranks seventh on the list of the largest eruptions. The estimated climatic forcing of this eruption is −12.5 W m−2, and it has a clear NH signature in the bipolar sulfate distribution. There is no associated tephra deposit in the ice cores, but we speculate that the event originates from the Italian Campi Flegrei Y-3 eruption, being the only bipolar volcanic eruption of that magnitude within a range of several millennia. The Y-3 eruption is independently carbon-14 dated to 29.0 ka b2k (Albert et al., 2015).
Number 8 on the list of the largest eruptions occurred at 46.68 ka b2k in GI-12 and is the only eruption in this study apart from the 25.32 ka Taupo, Oruanui, eruption that has a clear southern hemispheric origin. The Antarctic sulfate deposition of the eruption is approximately twice that in Greenland (Fig. 1), and the eruption has an average estimated climatic forcing of −12.3 W m−2 or about 0.9 times that of Oruanui.
Right after the onset of GS-9 at 39.92 ka b2k there is another pair of large eruptions separated by some 46 years. These are number 14 (39 915 a b2k; −10.6 W m−2) and number 38 (39 869 a b2k; −8.8 W m−2) of the large eruptions listed in Table 2. Both eruptions have bipolar sulfate distributions suggesting a NH eruption. Because of their magnitude and their stratigraphic setting right at the onset of GS-9 these volcanic events are both possible candidates for the Italian Y-5 Campanian Ignimbrite eruption. There is no tephra evidence for this suggestion in the ice cores, but tephra from this eruption has been identified in the Black Sea in a very similar stratigraphic setting at the onset of GS-9, and the eruption is independently dated by to 39.9 ± 0.1 ka b2k (Giaccio et al., 2017).
In the late GI-1 right before the onset of GS-1–Younger Dryas there is a quadruplet of bipolar eruptions covering a period of 110 years (Svensson et al., 2020). The oldest (13 028 a b2k; −10.5 W m−2) and the youngest (12 917 a b2k; −10.0 W m−2) of those eruptions are number 16 and 17 on the list of large eruptions. Both eruptions are likely to have occurred in the NH above 40∘ N. The 12 917 b2k eruption has been suggested as a candidate for the Laacher See eruption (LSE) that occurred in the East Eifel region in present-day Germany (Brauer et al., 1999; Baldini et al., 2018), but no tephra has been identified in the ice cores from this eruption. A recent publication, however, suggested that the LSE was around 130 years older (Reinig et al., 2021) and is synchronous instead (within age uncertainty) with the oldest event of this quadruplet of bipolar eruptions, but also with some minor sulfate signals. Stratospheric sulfur injections and changes in aerosol optical depth have recently been independently estimated in the late GI-1 based on a subset of four ice cores with less stringent cutoff criteria (Abbott et al., 2021), indicating that this time period experienced stronger volcanic forcing than any other comparable period during the Common Era.
The Vedde ash layer (number 36 in Table 2) originates from a significant eruption from Katla, Iceland, with widespread tephra deposition in Greenland (Mortensen et al., 2005; Gronvold et al., 1995) and the North Atlantic region in the middle of GS-1–Younger Dryas at 12.17 ka (Lane et al., 2012). Surprisingly, this Icelandic eruption not only deposited large amounts of sulfate in Greenland but also a much smaller amount in Antarctica, where it is identified in the WDC and EDML sulfate profiles, suggesting that it had a large stratospheric injection. The average volcanic forcing is estimated to about −8.8 W m−2, but this value has to be taken with caution as some of the sulfate could have made it to Greenland through the troposphere.
We have employed three Greenland and three Antarctic sulfate–sulfur ice-core records to document the global volcanic activity over the period 60–9 ka b2k. Detection of volcanic signals in the last glacial is challenging due to extensive layer thinning of the ice cores with depth and a highly variable sulfate background level in the Greenland ice cores across DO events. Due to those challenges, we limited ourselves to identifying Greenland (Antarctica) eruptions with sulfate deposition larger than 20 (10) kg km−2, which for Greenland is about half the volcanic sulfate deposition of Tambora in 1815 CE and for Antarctica comparable to the Pinatubo 1991 CE eruption.
With those restrictions we identified 1113 volcanic eruptions in Greenland and 737 volcanic eruptions in Antarctica, verifying the NH to be the most volcanically active. Of those, 85 volcanic eruptions had a global impact (bipolar volcanos) as they were previously identified in Greenland and Antarctic ice-core records. Compared to the past 2500 years, the ratio of bipolar volcanoes to total identified volcanic events is very low in last glacial period, highlighting the challenges of robust synchronization over the glacial period. Based on the hemispheric partitioning of sulfate deposition following well-known historical eruptions, we determined if the bipolar volcanoes are likely to be situated above or below 40∘ N latitude. We then estimated their climatic impact potential in terms of radiative forcing based on established methods. Throughout the investigated period, we find that 69 volcanoes are larger than the Tambora 1815 CE eruption, and 1 unknown volcano occurring at 45.56 ka b2k in the NH and 1 unknown volcano at 38.13 ka b2k in low latitudes or in the Southern Hemisphere are larger than the Taupo, Oruanui, eruption occurring at 25.32 ka in present-day New Zealand. The Icelandic NAAZ II eruption (55.38 ka b2k) has by far left the largest sulfate deposition in Greenland, but due to its minor sulfate deposition in Antarctica, it is thought that only a fraction of the sulfur gases was injected into the stratosphere. In general, we observe significantly higher occurrences of very large eruptions (VEI-7 or larger) than estimated from the geological record, indicating that ice cores provide a more complete picture of volcanic activity in the past.
Overall, the frequency of volcanic eruptions per millennium is rather constant throughout the investigated period and comparable to that of the most recent millennia. In agreement with previous studies, however, we find elevated levels of volcanic activity in the NH during the deglacial period (16–9 ka b2k). In particular, many very large eruptions occurred in this interval, quite likely associated with the redistribution of mass related to the meltdown of the major glacial ice sheets in this period. In contrast, an apparent increase in northern hemispheric volcanic activity in cold stadial periods compared to milder interstadial periods is likely to be an artifact due to the highly variable nature of the Greenland sulfate signal of those periods. It is unlikely to be related to the sea level variations occurring in parallel to stadial–interstadial changes, which are much smaller than the sea level increases that occurred over the glacial termination.
The high-resolution NGRIP CFA sulfate dataset is available as the Supplement for this publication. All other applied datasets are available elsewhere.
The supplement related to this article is available online at: https://doi.org/10.5194/cp-18-485-2022-supplement.
The initial idea was designed by AS. Datasets were collected by AS and JL. JL analyzed the data and created the figures. JL and AS prepared the paper. All authors contributed to the discussion and commented on the paper.
The contact author has declared that neither they nor their co-authors have any competing interests.
Publisher's note: Copernicus Publications remains neutral with regard to jurisdictional claims in published maps and institutional affiliations.
This article is part of the special issue “Interdisciplinary studies of volcanic impacts on climate and society”. It is not associated with a conference.
Anders Svensson, Christine S. Hvidberg, Jørgen P. Steffensen, Bo M. Vinther, Sune O. Rasmussen and Dorthe Dahl-Jensen acknowledge support from the Villum Foundation. Jiamei Lin acknowledges support from the China Scholarship Council. The authors thank the editor Matthew Toohey, three reviewers (Chaochao Gao, Eric Wolff, Jihong Cole-Dai), and commenting authors from the community (Alan Robock, Thomas Aubry, Lauren Marshall and Anja Schmidt) for their constructive comments that greatly improved this paper.
This research has been supported by the Villum Fonden (IceFlow grant no. 00016572) and the China Scholarship Council (grant no. 201904910426).
This paper was edited by Matthew Toohey and reviewed by Eric Wolff, Chaochao Gao, and Jihong Cole-Dai.
Abbott, P. M. and Davies, S. M.: Volcanism and the Greenland ice-cores: the tephra record, Earth-Sci. Rev., 115, 173–191, https://doi.org/10.1016/j.earscirev.2012.09.001, 2012.
Abbott, P. M., Niemeier, U., Timmreck, C., Riede, F., McConnell, J. R., Severie, M., Fischer, H., Svensson, A., Toohey, M., Reinig, F., and Sigl, M.: Volcanic climate forcing preceding the inception of the Younger Dryas: Implications for tracing the Laacher See eruption, Quaternary Sci. Rev., 274, 1–9, https://doi.org/10.1016/j.quascirev.2021.107260, 2021.
Albert, P. G., Hardiman, M., Keller, J., Tomlinson, E. L., Smith, V. C., Bourne, A. J., Wulf, S., Zanchetta, G., Sulpizio, R., Muller, U. C., Pross, J., Ottolini, L., Matthews, I. P., Blockley, S. P. E., and Menzies, M. A.: Revisiting the Y-3 tephrostratigraphic marker: a new diagnostic glass geochemistry, age estimate, and details on its climatostratigraphical context, Quaternary Sci. Rev., 118, 105–121, https://doi.org/10.1016/j.quascirev.2014.04.002, 2015.
Aubry, T. J., Toohey, M., Marshall, L., Schmidt, A., and Jellinek, A. M.: A New Volcanic Stratospheric Sulfate Aerosol Forcing Emulator (EVA_H): Comparison With Interactive Stratospheric Aerosol Models, J. Geophys. Res.-Atmos., 125, e2019JD031303, https://doi.org/10.1029/2019JD031303, 2020.
Austin, W. E. N., Wilson, L. J., and Hunt, J. B.: The age and chronostratigraphical significance of North Atlantic Ash Zone II, J. Quaternary Sci., 19, 137–146, https://doi.org/10.1002/jqs.821, 2004.
Baldini, J. U. L., Brown, R. J., and Mawdsley, N.: Evaluating the link between the sulfur-rich Laacher See volcanic eruption and the Younger Dryas climate anomaly, Clim. Past, 14, 969–990, https://doi.org/10.5194/cp-14-969-2018, 2018.
Baroni, M., Savarino, J., Cole-Dai, J. H., Rai, V. K., and Thiemens, M. H.: Anomalous sulfur isotope compositions of volcanic sulfate over the last millennium in Antarctic ice cores, J. Geophys. Res., 113, D20112, https://doi.org/10.1029/2008JD010185, 2008.
Bazin, L., Landais, A., Lemieux-Dudon, B., Toyé Mahamadou Kele, H., Veres, D., Parrenin, F., Martinerie, P., Ritz, C., Capron, E., Lipenkov, V., Loutre, M.-F., Raynaud, D., Vinther, B., Svensson, A., Rasmussen, S. O., Severi, M., Blunier, T., Leuenberger, M., Fischer, H., Masson-Delmotte, V., Chappellaz, J., and Wolff, E.: An optimized multi-proxy, multi-site Antarctic ice and gas orbital chronology (AICC2012): 120–800 ka, Clim. Past, 9, 1715–1731, https://doi.org/10.5194/cp-9-1715-2013, 2013.
Bigler, M.: Hochauflösende Spurenstoffmessungen an polaren Eisbohrkernen: Glazio-chemische und klimatische Prozessstudien, PhD dissertation, Physics Institute, University of Bern, Switzerland, 2004.
Bigler, M., Svensson, A., Kettner, E., Vallelonga, P., Nielsen, M. E., and Steffensen, J. P.: Optimization of High-Resolution Continuous Flow Analysis for Transient Climate Signals in Ice Cores, Environ. Sci. Technol., 45, 4483–4489, https://doi.org/10.1021/es200118j, 2011.
Bourne, A. J., Cook, E., Abbott, P. M., Seierstad, I. K., Steffensen, J. P., Svensson, A., Fischer, H., Schupbach, S., and Davies, S. M.: A tephra lattice for Greenland and a reconstruction of volcanic events spanning 25–45 ka b2k, Quaternary Sci. Rev., 118, 122–141, https://doi.org/10.1016/j.quascirev.2014.07.017, 2015.
Bourne, A. J., Abbott, P. M., Albert, P. G., Cook, E., Pearce, N. J. G., Ponomareva, V., Svensson, A., and Davies, S. M.: Underestimated risks of recurrent long-range ash dispersal from northern Pacific Arc volcanoes, Sci. Rep.-UK, 6, 29837, https://doi.org/10.1038/srep29837, 2016.
Bowen, H. J. M.: Environmental Chemistry of the Elements, Academic Press, London, 333 pp., 1979.
Brauer, A., Endres, C., and Negendank, J. F. W.: Lateglacial calendar year chronology based on annually laminated sediments from Lake Meerfelder Maar, Germany, Quatern. Int., 61, 17–25, https://doi.org/10.1016/s1040-6182(99)00014-2, 1999.
Brown, S. K., Crosweller, H. S., Sparks, R. S. J., Cottrell. E, Deligne, N. I., Guerrero, N. O., Hobbs, L., Kiyosugi, K., Loughlin, S. C., Siebert, L., and Takarada, S.: Characterisation of the Quaternary eruption record: analysis of the Large Magnitude Explosive Volcanic Eruptions (LaMEVE) database, J. Appl. Volcanol., 3, 5, https://doi.org/10.1186/2191-5040-3-5, 2014.
Bryson, R. U., Bryson, R. A., and Ruter, A.: A calibrated radiocarbon database of late Quaternary volcanic eruptions, eEarth Discuss., 1, 123–134, https://doi.org/10.5194/eed-1-123-2006, 2006.
Buizert, C., Cuffey, K. M., Severinghaus, J. P., Baggenstos, D., Fudge, T. J., Steig, E. J., Markle, B. R., Winstrup, M., Rhodes, R. H., Brook, E. J., Sowers, T. A., Clow, G. D., Cheng, H., Edwards, R. L., Sigl, M., McConnell, J. R., and Taylor, K. C.: The WAIS Divide deep ice core WD2014 chronology – Part 1: Methane synchronization (68–31 ka BP) and the gas age–ice age difference, Clim. Past, 11, 153–173, https://doi.org/10.5194/cp-11-153-2015, 2015.
Burke, A., Moore, K. A., Sigl, M., Nita, D. C., McConnell, J. R., and Adkins, J. F.: Stratospheric eruptions from tropical and extra-tropical volcanoes constrained using high-resolution sulfur isotopes in ice cores, Earth Planet. Sc. Lett., 521, 113–119, https://doi.org/10.1016/j.epsl.2019.06.006, 2019.
Capron, E., Rasmussen, S. O., Popp, T. J., Erhardt, T., Fischer, H., Landais, A., Pedro, J. B., Vettoretti, G., Grinsted, A., Gkinis, V., Vaughn, B., Svensson, A., Vinther, B. M., and White, J. W. C.: The anatomy of past abrupt warmings recorded in Greenland ice, Nat. Commun., 12, 2106, https://doi.org/10.1038/s41467-021-22241-w, 2021.
Castellano, E., Becagli, S., Jouzel, J., Migliori, A., Severi, M., Steffensen, J. P., Traversi, R., and Udisti, R.: Volcanic eruption frequency over the last 45 ky as recorded in Epica-Dome C ice core (East Antarctica) and its relationship with climatic changes, Global Planet. Change, 42, 195–205, https://doi.org/10.1016/j.gloplacha.2003.11.007, 2004.
Clausen, H. B., Hammer, C. U., Hvidberg, C. S., DahlJensen, D., Steffensen, J. P., Kipfstuhl, J., and Legrand, M.: A comparison of the volcanic records over the past 4000 years from the Greenland Ice Core Project and Dye 3 Greenland Ice Cores, J. Geophys. Res., 102, 26707–26723, https://doi.org/10.1029/97jc00587, 1997.
Cole-Dai, J., Ferris, D., Lanciki, A., Savarino, J., Baroni, M., and Thiemens, M. H.: Cold decade (AD 1810–1819) caused by Tambora (1815) and another (1809) stratospheric volcanic eruption, Geophys. Res. Lett., 36, L22703, https://doi.org/10.1029/2009GL040882, 2009.
Cole-Dai, J., Ferris, D. G., Kennedy, J. A., Michael, S., and McConnell, J.: Comprehensive Record of Volcanic Eruptions in the Holocene (11,000 years) From the WAIS Divide, Antarctica Ice Core, J. Geophys. Res.-Atmos., 126, e2020JD032855, https://doi.org/10.1029/2020JD032855, 2021.
Cooper, C. L., Swindles, G. T., Savov, I. P., Schmidt, A., and Bacon, K. L.: Evaluating the relationship between climate change and volcanism, Earth-Sci. Rev., 177, 238–247, https://doi.org/10.1016/j.earscirev.2017.11.009, 2018.
Crick, L., Burke, A., Hutchison, W., Kohno, M., Moore, K. A., Savarino, J., Doyle, E. A., Mahony, S., Kipfstuhl, S., Rae, J. W. B., Steele, R. C. J., Sparks, R. S. J., and Wolff, E. W.: New insights into the ∼ 74 ka Toba eruption from sulfur isotopes of polar ice cores, Clim. Past, 17, 2119–2137, https://doi.org/10.5194/cp-17-2119-2021, 2021.
Crowley, T. J. and Unterman, M. B.: Technical details concerning development of a 1200 yr proxy index for global volcanism, Earth Syst. Sci. Data, 5, 187–197, https://doi.org/10.5194/essd-5-187-2013, 2013.
Dahl-Jensen, D., Albert, M. R., Aldahan, A., Azuma, N., Balslev-Clausen, D., Baumgartner, M., Berggren, A. M., Bigler, M., Binder, T., Blunier, T., Bourgeois, J. C., Brook, E. J., Buchardt, S. L., Buizert, C., Capron, E., Chappellaz, J., Chung, J., Clausen, H. B., Cvijanovic, I., Davies, S. M., Ditlevsen, P., Eicher, O., Fischer, H., Fisher, D. A., Fleet, L. G., Gfeller, G., Gkinis, V., Gogineni, S., Goto-Azuma, K., Grinsted, A., Gudlaugsdottir, H., Guillevic, M., Hansen, S. B., Hansson, M., Hirabayashi, M., Hong, S., Hur, S. D., Huybrechts, P., Hvidberg, C. S., Iizuka, Y., Jenk, T., Johnsen, S. J., Jones, T. R., Jouzel, J., Karlsson, N. B., Kawamura, K., Keegan, K., Kettner, E., Kipfstuhl, S., Kjaer, H. A., Koutnik, M., Kuramoto, T., Kohler, P., Laepple, T., Landais, A., Langen, P. L., Larsen, L. B., Leuenberger, D., Leuenberger, M., Leuschen, C., Li, J., Lipenkov, V., Martinerie, P., Maselli, O. J., Masson-Delmotte, V., McConnell, J. R., Miller, H., Mini, O., Miyamoto, A., Montagnat-Rentier, M., Mulvaney, R., Muscheler, R., Orsi, A. J., Paden, J., Panton, C., Pattyn, F., Petit, J. R., Pol, K., Popp, T., Possnert, G., Prie, F., Prokopiou, M., Quiquet, A., Rasmussen, S. O., Raynaud, D., Ren, J., Reutenauer, C., Ritz, C., Rockmann, T., Rosen, J. L., Rubino, M., Rybak, O., Samyn, D., Sapart, C. J., Schilt, A., Schmidt, A. M. Z., Schwander, J., Schupbach, S., Seierstad, I., Severinghaus, J. P., Sheldon, S., Simonsen, S. B., Sjolte, J., Solgaard, A. M., Sowers, T., Sperlich, P., Steen-Larsen, H. C., Steffen, K., Steffensen, J. P., Steinhage, D., Stocker, T. F., Stowasser, C., Sturevik, A. S., Sturges, W. T., Sveinbjornsdottir, A., Svensson, A., Tison, J. L., Uetake, J., Vallelonga, P., van de Wal, R. S. W., van der Wel, G., Vaughn, B. H., Vinther, B., Waddington, E., Wegner, A., Weikusat, I., White, J. W. C., Wilhelms, F., Winstrup, M., Witrant, E., Wolff, E. W., Xiao, C., Zheng, J., and Community, N.: Eemian interglacial reconstructed from a Greenland folded ice core, Nature, 493, 489–494, https://doi.org/10.1038/nature11789, 2013.
Davies, S. M., Wastegard, S., Abbott, P. M., Barbante, C., Bigler, M., Johnsen, S. J., Rasmussen, T. L., Steffensen, J. P., and Svensson, A.: Tracing volcanic events in the NGRIP ice-core and synchronising North Atlantic marine records during the last glacial period, Earth Planet. Sc. Lett., 294, 69–79, https://doi.org/10.1016/j.epsl.2010.03.004, 2010.
Davies, S. M., Abbott, P. M., Pearce, N. J. G., Wastegard, S., and Blockley, S. P. E.: Integrating the INTIMATE records using tephrochronology: rising to the challenge, Quaternary Sci. Rev., 36, 11–27, https://doi.org/10.1016/j.quascirev.2011.04.005, 2012.
Davies, S. M., Abbott, P. M., Meara, R. H., Pearce, N. J. G., Austin, W. E. N., Chapman, M. R., Svensson, A., Bigler, M., Rasmussen, T. L., Rasmussen, S. O., and Farmer, E. J.: A North Atlantic tephrostratigraphical framework for 130–60 ka b2k: new tephra discoveries, marine-based correlations, and future challenges, Quaternary Sci. Rev., 106, 101–121, https://doi.org/10.1016/j.quascirev.2014.03.024, 2014.
Deligne, N. I., Coles, S. G., and Sparks, R. S. J.: Recurrence rates of large explosive volcanic eruptions, J. Geophys. Res., 115, B06203, https://doi.org/10.1029/2009JB006554, 2010.
Dunbar, N. W., Iverson, N. A., Van Eaton, A. R., Sigl, M., Alloway, B. V., Kurbatov, A. V., Mastin, L. G., McConnell, J. R., and Wilson, C. J. N.: New Zealand supereruption provides time marker for the Last Glacial Maximum in Antarctica, Sci. Rep.-UK, 7, 12238, https://doi.org/10.1038/s41598-017-11758-0, 2017.
EPICA community members: Eight glacial cycles from an Antarctic ice core, Nature, 429, 623–628, https://doi.org/10.1038/nature02599, 2004.
EPICA Community Members: One-to-one coupling of glacial climate variability in Greenland and Antarctica, Nature, 444, 195–198, https://doi.org/10.1038/nature05301, 2006.
Fischer, H., Wagenbach, D., and Kipfstuhl, J.: Sulfate and nitrate firn concentrations on the Greenland ice sheet – 2. Temporal anthropogenic deposition changes, J. Geophys. Res.-Atmos., 103, 21935–21942, https://doi.org/10.1029/98jd01886, 1998.
Fudge, T. J., Markle, B. R., Cuffey, K. M., Buizert, C., Taylor, K. C., Steig, E. J., Waddington, E. D., Conway, H., and Koutnik, M.: Variable relationship between accumulation and temperature in West Antarctica for the past 31,000 years, Geophys. Res. Lett., 43, 3795–3803, https://doi.org/10.1002/2016GL068356, 2016.
Gao, C. C., Robock, A., and Ammann, C.: Volcanic forcing of climate over the past 1500 years: An improved ice core-based index for climate models, J. Geophys. Res., 113, D23111, https://doi.org/10.1029/2008JD010239, 2008.
Gao, C. H., Oman, L., Robock, A., and Stenchikov, G. L.: Atmospheric volcanic loading derived from bipolar ice cores: Accounting for the spatial distribution of volcanic deposition, J. Geophys. Res., 112, D09109, https://doi.org/10.1029/2006JD007461, 2007.
Gautier, E., Savarino, J., Erbland, J., Lanciki, A., and Possenti, P.: Variability of sulfate signal in ice core records based on five replicate cores, Clim. Past, 12, 103–113, https://doi.org/10.5194/cp-12-103-2016, 2016.
Gautier, E., Savarino, J., Erbland, J., and Farquhar, J.: SO2 Oxidation Kinetics Leave a Consistent Isotopic Imprint on Volcanic Ice Core Sulfate, J. Geophys. Res.-Atmos., 123, 9801–9812, https://doi.org/10.1029/2018jd028456, 2018.
Giaccio, B., Hajdas, I., Isaia, R., Deino, A., and Nomade, S.: High-precision 14C and 40Ar/39Ar dating of the Campanian Ignimbrite (Y-5) reconciles the time-scales of climatic-cultural processes at 40 ka, Sci. Rep.-UK, 7, 45940, https://doi.org/10.1038/srep45940, 2017.
Gronvold, K., Oskarsson, N., Johnsen, S. J., Clausen, H. B., Hammer, C. U., Bond, G., and Bard, E.: Ash layers from Iceland in the Greenland GRIP ice core correlated with oceanic and land sediments, Earth Planet. Sc. Lett., 135, 149–155, https://doi.org/10.1016/0012-821x(95)00145-3, 1995.
Grootes, P. M., Stuiver, M., White, J. W. C., Johnsen, S., and Jouzel, J.: Comparison of oxygen isotope records from the GISP2 and GRIP Greenland ice cores, Nature, 366, 552–554, https://doi.org/10.1038/366552a0, 1993.
Hansen, J., Sato, M., Ruedy, R., Nazarenko, L., Lacis, A., Schmidt, G. A., Russell, G., Aleinov, I., Bauer, M., Bauer, S., Bell, N., Cairns, B., Canuto, V., Chandler, M., Cheng, Y., Genio, A. Del, Faluvegi, G., Fleming, E., Friend, A., Hall, T., Jackman, C., Kelley, M., Kiang, N., Koch, D., Lean, J., Lerner, J., Lo, K., Menon, S., Miller, R., Minnis, P., Novakov, T., Oinas, V., Perlwitz, J., Perlwitz, J., Rind, D., Romanou, A., Shindell, D., Stone, P., Sun, S., Tausnev, N., Thresher, D., Wielicki, B., Wong, T., Yao, M., and Zhang, S.: Efficacy of climate forcings, J. Geophys. Res., 110, D18104, https://doi.org/10.1029/2005JD005776, 2005.
Hastie, T., Tibshirani, R., and Friedman, J.: The Elements of Statistical Learning: Data Mining, Inference, and Prediction, 2nd edn., Springer, New York, NY, USA, https://doi.org/10.1007/978-0-387-84858-7, 2009.
Herweijer, C., Seager, R., Cook, E. R., and Emile-Geay, J.: North American droughts of the last millennium from a gridded network of tree-ring data, J. Climate, 20, 1353–1376, https://doi.org/10.1175/jcli4042.1, 2007.
Huybers, P. and Langmuir, C.: Feedback between deglaciation, volcanism, and atmospheric CO2, Earth Planet. Sc. Lett., 286, 479–491, https://doi.org/10.1016/j.epsl.2009.07.014, 2009.
Hvidberg, C. S., DahlJensen, D., and Waddington, E. D.: Ice flow between the Greenland Ice Core Project and Greenland Ice Sheet Project 2 boreholes in central Greenland, J. Geophys. Res., 102, 26851–26859, https://doi.org/10.1029/97JC00268, 1997.
Johnsen, S. J., DahlJensen, D., Gundestrup, N., Steffensen, J. P., Clausen, H. B., Miller, H., Masson-Delmotte, V., Sveinbjörnsdottir, A. E., and White, J.: Oxygen isotope and palaeotemperature records from six Greenland ice-core stations: Camp Century, Dye-3, GRIP, GISP2, Renland and NorthGRIP, J. Quaternary Sci., 16, 299–307, https://doi.org/10.1002/jqs.622, 2001.
Jungclaus, J. H., Bard, E., Baroni, M., Braconnot, P., Cao, J., Chini, L. P., Egorova, T., Evans, M., González-Rouco, J. F., Goosse, H., Hurtt, G. C., Joos, F., Kaplan, J. O., Khodri, M., Klein Goldewijk, K., Krivova, N., LeGrande, A. N., Lorenz, S. J., Luterbacher, J., Man, W., Maycock, A. C., Meinshausen, M., Moberg, A., Muscheler, R., Nehrbass-Ahles, C., Otto-Bliesner, B. I., Phipps, S. J., Pongratz, J., Rozanov, E., Schmidt, G. A., Schmidt, H., Schmutz, W., Schurer, A., Shapiro, A. I., Sigl, M., Smerdon, J. E., Solanki, S. K., Timmreck, C., Toohey, M., Usoskin, I. G., Wagner, S., Wu, C.-J., Yeo, K. L., Zanchettin, D., Zhang, Q., and Zorita, E.: The PMIP4 contribution to CMIP6 – Part 3: The last millennium, scientific objective, and experimental design for the PMIP4 past1000 simulations, Geosci. Model Dev., 10, 4005–4033, https://doi.org/10.5194/gmd-10-4005-2017, 2017.
Karlof, L., Oigard, T. A., Godtliebsen, F., Kaczmarska, M., and Fischer, H.: Statistical techniques to select detection thresholds for peak signals in ice-core data, J. Glaciol., 51, 655–662, https://doi.org/10.3189/172756505781829115, 2005.
Kreutz, K. J., Mayewski, P. A., Meeker, L. D., Twickler, M. S., and Whitlow, S. I.: The effect of spatial and temporal accumulation rate variability in West Antarctica on soluble ion deposition, Geophys. Res. Lett., 27, 2517–2520, https://doi.org/10.1029/2000gl011499, 2000.
Kurbatov, A. V., Zielinski, G. A., Dunbar, N. W., Mayewski, P. A., Meyerson, E. A., Sneed, S. B., and Taylor, K. C.: A 12,000 year record of explosive volcanism in the Siple Dome Ice Core, West Antarctica, J. Geophys. Res., 111, D12307, https://doi.org/10.1029/2005jd006072, 2006.
Kutterolf, S., Schindlbeck, J. C., Jegen, M., Freundt, A., and Straub, S. M.: Milankovitch frequencies in tephra records at volcanic arcs: The relation of kyr-scale cyclic variations in volcanism to global climate changes, Quaternary Sci. Rev., 204, 1–16, https://doi.org/10.1016/j.quascirev.2018.11.004, 2019.
Lane, C. S., Blockley, S. P. E., Mangerud, J., Smith, V. C., Lohne, O. S., Tomlinson, E. L., Matthews, I. P., and Lotter, A. F.: Was the 12.1 ka Icelandic Vedde Ash one of a kind?, Quaternary Sci. Rev., 33, 87–99, https://doi.org/10.1016/j.quascirev.2011.11.011, 2012.
Legrand, M. and Mayewski, P.: Glaciochemistry of polar ice cores: A review, Rev. Geophys., 35, 219–243, https://doi.org/10.1029/96rg03527, 1997.
Lim, H. G., Yeh, S. W., Kug, J. S., Park, Y. G., Park, J. H., Park, R., and Song, C. K.: Threshold of the volcanic forcing that leads the El Nino-like warming in the last millennium: results from the ERIK simulation, Clim. Dynam., 46, 3725–3736, https://doi.org/10.1007/s00382-015-2799-3, 2016.
Maclennan, J., Jull, M., McKenzie, D., Slater, L., and Gronvold, K.: The link between volcanism and deglaciation in Iceland, Geochem. Geophy. Geosy., 3, 1062, https://doi.org/10.1029/2001gc000282, 2002.
Marshall, L., Johnson, J. S., Mann, G. W., Lee, L., Dhomse, S. S., Regayre, L., Yoshioka, M., Carslaw, K. S., and Schmidt, A.: Exploring How Eruption Source Parameters Affect Volcanic Radiative Forcing Using Statistical Emulation, J. Geophys. Res.-Atmos., 124, 964–985, https://doi.org/10.1029/2018jd028675, 2019,.
Marshall, L. R., Smith, C. J., Forster, P. M., Aubry, T. J., Andrews, T., and Schmidt, A.: Large Variations in Volcanic Aerosol Forcing Efficiency Due to Eruption Source Parameters and Rapid Adjustments, Geophys. Res. Lett., 47, e2020GL090241, https://doi.org/10.1029/2020gl090241, 2020.
Mayewski, P. A., Holdsworth, G., Spencer, M. J., Whitlow, S., Twickler, M., Morrison, M. C., Ferland, K. K., and Meeker, L. D.: Ice-core sulfate from three northern hemisphere sites: Source and temperature forcing implications, Atmos. Environ. A-Gen., 27, 2915–2919, https://doi.org/10.1016/0960-1686(93)90323-q, 1993.
McConnell, J. R., Burke, A., Dunbar, N. W., Kohler, P., Thomas, J. L., Arienzo, M. M., Chellman, N. J., Maselli, O. J., Sigl, M., Adkins, J. F., Baggenstos, D., Burkhart, J. F., Brook, E. J., Buizert, C., Cole-Dai, J., Fudge, T. J., Knorr, G., Graf, H. F., Grieman, M. M., Iverson, N., McGwire, K. C., Mulvaney, R., Paris, G., Rhodes, R. H., Saltzman, E. S., Severinghaus, J. P., Steffensen, J. P., Taylor, K. C., and Winckler, G.: Synchronous volcanic eruptions and abrupt climate change similar to 17.7 ka plausibly linked by stratospheric ozone depletion, P. Natl. Acad. Sci. USA, 114, 10035–10040, https://doi.org/10.1073/pnas.1705595114, 2017.
Mortensen, A. K., Bigler, M., Gronvold, K., Steffensen, J. P., and Johnsen, S. J.: Volcanic ash layers from the Last Glacial Termination in the NGRIP ice core, J. Quaternary Sci., 20, 209–219, https://doi.org/10.1002/jqs.908, 2005.
Narcisi, B., Petit, J. R., Delmonte, B., Basile-Doelsch, I., and Maggi, V.: Characteristics and sources of tephra layers in the EPICA-Dome C ice record (East Antarctica): Implications for past atmospheric circulation and ice core stratigraphic correlations, Earth Planet. Sc. Lett., 239, 253–265, https://doi.org/10.1016/j.epsl.2005.09.005, 2005.
Narcisi, B., Petit, J. R., and Chappellaz, J.: A 70 ka record of explosive eruptions from the TALDICE ice core (Talos Dome, East Antarctic plateau), J. Quaternary Sci., 25, 844–849, https://doi.org/10.1002/jqs.1427, 2010.
Narcisi, B., Petit, J. R., Delmonte, B., Scarchilli, C., and Stenni, B.: A 16,000-yr tephra framework for the Antarctic ice sheet: a contribution from the new Tabs Dome core, Quaternary Sci. Rev., 49, 52–63, https://doi.org/10.1016/j.quascirev.2012.06.011, 2012.
Nardin, R., Amore, A., Becagli, S., Caiazzo, L., Frezzotti, M., Severi, M., Stenni, B., and Traversi, R.: Volcanic Fluxes Over the Last Millennium as Recorded in the Gv7 Ice Core (Northern Victoria Land, Antarctica), Geosciences, 10, 38, https://doi.org/10.3390/geosciences10010038, 2020.
North Greenland Ice Core Project members: High-resolution record of Northern Hemisphere climate extending into the last interglacial period, Nature, 431, 147–151, https://doi.org/10.1038/nature02805, 2004.
Papale, P.: Global time-size distribution of volcanic eruptions on Earth, Sci. Rep.-UK, 8, 6838, https://doi.org/10.1038/s41598-018-25286-y, 2018.
Parrenin, F., Petit, J.-R., Masson-Delmotte, V., Wolff, E., Basile-Doelsch, I., Jouzel, J., Lipenkov, V., Rasmussen, S. O., Schwander, J., Severi, M., Udisti, R., Veres, D., and Vinther, B. M.: Volcanic synchronisation between the EPICA Dome C and Vostok ice cores (Antarctica) 0–145 kyr BP, Clim. Past, 8, 1031–1045, https://doi.org/10.5194/cp-8-1031-2012, 2012.
Plummer, C. T., Curran, M. A. J., van Ommen, T. D., Rasmussen, S. O., Moy, A. D., Vance, T. R., Clausen, H. B., Vinther, B. M., and Mayewski, P. A.: An independently dated 2000-yr volcanic record from Law Dome, East Antarctica, including a new perspective on the dating of the 1450s CE eruption of Kuwae, Vanuatu, Clim. Past, 8, 1929–1940, https://doi.org/10.5194/cp-8-1929-2012, 2012.
Praetorius, S., Mix, A., Jensen, B., Froese, D., Milne, G., Wolhowe, M., Addison, J., and Prahl, F.: Interaction between climate, volcanism, and isostatic rebound in Southeast Alaska during the last deglaciation, Earth Planet. Sc. Lett., 452, 79–89, https://doi.org/10.1016/j.epsl.2016.07.033, 2016.
Pyle, D. M.: Chapter 13 – Sizes of Volcanic Eruptions, in: The Encyclopedia of Volcanoes, 2nd edn., edited by: Sigurdsson, H., Academic Press, Amsterdam, 2015.
Rasmussen, S. O., Andersen, K. K., Johnsen, S. J., Bigler, M., and McCormack, T.: Deconvolution-based resolution enhancement of chemical ice core records obtained by continuous flow analysis, J. Geophys. Res., 110, D17304, https://doi.org/10.1029/2004JD005717, 2005.
Rasmussen, S. O., Abbott, P. M., Blunier, T., Bourne, A. J., Brook, E., Buchardt, S. L., Buizert, C., Chappellaz, J., Clausen, H. B., Cook, E., Dahl-Jensen, D., Davies, S. M., Guillevic, M., Kipfstuhl, S., Laepple, T., Seierstad, I. K., Severinghaus, J. P., Steffensen, J. P., Stowasser, C., Svensson, A., Vallelonga, P., Vinther, B. M., Wilhelms, F., and Winstrup, M.: A first chronology for the North Greenland Eemian Ice Drilling (NEEM) ice core, Clim. Past, 9, 2713–2730, https://doi.org/10.5194/cp-9-2713-2013, 2013.
Rasmussen, S. O., Bigler, M., Blockley, S. P., Blunier, T., Buchardt, S. L., Clausen, H. B., Cvijanovic, I., Dahl-Jensen, D., Johnsen, S. J., Fischer, H., Gkinis, V., Guillevic, M., Hoek, W. Z., Lowe, J. J., Pedro, J. B., Popp, T., Seierstad, I. K., Steffensen, J. P., Svensson, A. M., Vallelonga, P., Vinther, B. M., Walker, M. J. C., Wheatley, J. J., and Winstrup, M.: A stratigraphic framework for abrupt climatic changes during the Last Glacial period based on three synchronized Greenland ice-core records: refining and extending the INTIMATE event stratigraphy, Quaternary Sci. Rev., 106, 14–28, https://doi.org/10.1016/j.quascirev.2014.09.007, 2014.
Reinig, F., Wacker, L., Jöris, O., Oppenheimer, C., Guidobaldi, Giulia Nievergelt, D., Adolphi, F., Cherubini, P., Engels, S., Esper, J., Land, A., Lane, C., Pfanz, H., Remmele, S., Sigl, M., Sookdeo, A., and Büntgen, U.: Precise date for the Laacher See eruption synchronizes the Younger Dryas, Nature, 595, 66–69, 2021.
Robock, A.: Volcanic eruptions and climate, Rev. Geophys., 38, 191–219, https://doi.org/10.1029/1998rg000054, 2000.
Röthlisberger, R., Bigler, M., Hutterli, M., Sommer, S., Stauffer, B., Junghans, H. G., and Wagenbach, D.: Technique for continuous high-resolution analysis of trace substances in firn and ice cores, Environ. Sci. Technol., 34, 338–342, 2000.
Rutledal, S., Berben, S. M. P., Dokken, T. M., van der Bilt, W. G. M., Cederstrom, J. M., and Jansen, E.: Tephra horizons identified in the western North Atlantic and Nordic Seas during the Last Glacial Period: Extending the marine tephra framework, Quaternary Sci. Rev., 240, 106247, https://doi.org/10.1016/j.quascirev.2020.106247, 2020.
Schupbach, S., Fischer, H., Bigler, M., Erhardt, T., Gfeller, G., Leuenberger, D., Mini, O., Mulvaney, R., Abram, N. J., Fleet, L., Frey, M. M., Thomas, E., Svensson, A., Dahl-Jensen, D., Kettner, E., Kjaer, H., Seierstad, I., Steffensen, J. P., Rasmussen, S. O., Vallelonga, P., Winstrup, M., Wegner, A., Twarloh, B., Wolff, K., Schmidt, K., Goto-Azuma, K., Kuramoto, T., Hirabayashi, M., Uetake, J., Zheng, J., Bourgeois, J., Fisher, D., Zhiheng, D., Xiao, C., Legrand, M., Spolaor, A., Gabrieli, J., Barbante, C., Kang, J. H., Hur, S. D., Hong, S. B., Hwang, H. J., Hong, S., Hansson, M., Iizuka, Y., Oyabu, I., Muscheler, R., Adolphi, F., Maselli, O., McConnell, J., and Wolff, E. W.: Greenland records of aerosol source and atmospheric lifetime changes from the Eemian to the Holocene, Nat. Commun., 9, 1476, https://doi.org/10.1038/s41467-018-03924-3, 2018.
Schurer, A. P., Tett, S. F. B., and Hegerl, G. C.: Small influence of solar variability on climate over the past millennium, Nat. Geosci., 7, 104–108, https://doi.org/10.1038/ngeo2040, 2014.
Seierstad, I. K., Abbott, P. M., Bigler, M., Blunier, T., Bourne, A. J., Brook, E., Buchardt, S. L., Buizert, C., Clausen, H. B., Cook, E., Dahl-Jensen, D., Davies, S. M., Guillevic, M., Johnsen, S. J., Pedersen, D. S., Popp, T. J., Rasmussen, S. O., Severinghaus, J. P., Svensson, A., and Vinther, B. M.: Consistently dated records from the Greenland GRIP, GISP2 and NGRIP ice cores for the past 104 ka reveal regional millennial-scale δ18O gradients with possible Heinrich event imprint, Quaternary Sci. Rev., 106, 29–46, https://doi.org/10.1016/j.quascirev.2014.10.032, 2014.
Severi, M., Becagli, S., Traversi, R., and Udisti, R.: Recovering Paleo-Records from Antarctic Ice-Cores by Coupling a Continuous Melting Device and Fast Ion Chromatography, Anal. Chem., 87, 11441–11447, https://doi.org/10.1021/acs.analchem.5b02961, 2015.
Siebert, L. and Simkin, T.: Volcanoes of the world: an illustrated catalog of Holocene volcanoes and their eruptions, Global Volcanism Program, Digital Information Series, GVP-3, Smithsonian Institution, https://volcano.si.edu/search_volcano.cfm (last access: 14 February 2022), 2002.
Siggaard-Andersen, M. L.: Analysis of soluble ions from dust and sea salt over the last glacial cycle in polar deep ice cores, PhD thesis, University of Bremen, 2004.
Sigl, M., McConnell, J. R., Layman, L., Maselli, O., McGwire, K., Pasteris, D., Dahl-Jensen, D., Steffensen, J. P., Vinther, B., Edwards, R., Mulvaney, R., and Kipfstuhl, S.: A new bipolar ice core record of volcanism from WAIS Divide and NEEM and implications for climate forcing of the last 2000 years, J. Geophys. Res.-Atmos., 118, 1151–1169, https://doi.org/10.1029/2012jd018603, 2013.
Sigl, M., McConnell, J. R., Toohey, M., Curran, M., Das, S. B., Edwards, R., Isaksson, E., Kawamura, K., Kipfstuhl, S., Kruger, K., Layman, L., Maselli, O. J., Motizuki, Y., Motoyama, H., Pasteris, D. R., and Severi, M.: Insights from Antarctica on volcanic forcing during the Common Era, Nat. Clim. Change, 4, 693–697, https://doi.org/10.1038/nclimate2293, 2014.
Sigl, M., Winstrup, M., McConnell, J. R., Welten, K. C., Plunkett, G., Ludlow, F., Buntgen, U., Caffee, M., Chellman, N., Dahl-Jensen, D., Fischer, H., Kipfstuhl, S., Kostick, C., Maselli, O. J., Mekhaldi, F., Mulvaney, R., Muscheler, R., Pasteris, D. R., Pilcher, J. R., Salzer, M., Schupbach, S., Steffensen, J. P., Vinther, B. M., and Woodruff, T. E.: Timing and climate forcing of volcanic eruptions for the past 2,500 years, Nature, 523, 543–549, https://doi.org/10.1038/nature14565, 2015.
Sigl, M., Fudge, T. J., Winstrup, M., Cole-Dai, J., Ferris, D., McConnell, J. R., Taylor, K. C., Welten, K. C., Woodruff, T. E., Adolphi, F., Bisiaux, M., Brook, E. J., Buizert, C., Caffee, M. W., Dunbar, N. W., Edwards, R., Geng, L., Iverson, N., Koffman, B., Layman, L., Maselli, O. J., McGwire, K., Muscheler, R., Nishiizumi, K., Pasteris, D. R., Rhodes, R. H., and Sowers, T. A.: The WAIS Divide deep ice core WD2014 chronology – Part 2: Annual-layer counting (0–31 ka BP), Clim. Past, 12, 769–786, https://doi.org/10.5194/cp-12-769-2016, 2016.
Sinnl, G., Winstrup, M., Erhardt, T., Cook, E., Jensen, C., Svensson, A., Vinther, B. M., Muscheler, R., and Rasmussen, S. O.: A multi-ice-core, annual-layer-counted Greenland ice-core chronology for the last 3800 years: GICC21, Clim. Past Discuss. [preprint], https://doi.org/10.5194/cp-2021-155, in review, 2021.
Svensson, A., Biscaye, P. E., and Grousset, F. E.: Characterization of late glacial continental dust in the Greenland Ice Core Project ice core, J. Geophys. Res.-Atmos., 105, 4637–4656, https://doi.org/10.1029/1999jd901093, 2000.
Svensson, A., Dahl-Jensen, D., Steffensen, J. P., Blunier, T., Rasmussen, S. O., Vinther, B. M., Vallelonga, P., Capron, E., Gkinis, V., Cook, E., Kjær, H. A., Muscheler, R., Kipfstuhl, S., Wilhelms, F., Stocker, T. F., Fischer, H., Adolphi, F., Erhardt, T., Sigl, M., Landais, A., Parrenin, F., Buizert, C., McConnell, J. R., Severi, M., Mulvaney, R., and Bigler, M.: Bipolar volcanic synchronization of abrupt climate change in Greenland and Antarctic ice cores during the last glacial period, Clim. Past, 16, 1565–1580, https://doi.org/10.5194/cp-16-1565-2020, 2020.
Taylor, K. C., Alley, R. B., Lamorey, G. W., and Mayewski, P.: Electrical measurements on the Greenland Ice Sheet Project 2 core, J. Geophys. Res.-Oceans, 102, 26511–26517, https://doi.org/10.1029/96jc02500, 1997.
Timmreck, C., Pohlmann, H., Illing, S., and Kadow, C.: The impact of stratospheric volcanic aerosol on decadal-scale climate predictions, Geophys. Res. Lett., 43, 834–842, https://doi.org/10.1002/2015gl067431, 2016.
Toohey, M. and Sigl, M.: Volcanic stratospheric sulfur injections and aerosol optical depth from 500 BCE to 1900 CE, Earth Syst. Sci. Data, 9, 809–831, https://doi.org/10.5194/essd-9-809-2017, 2017.
Toohey, M., Kruger, K., Schmidt, H., Timmreck, C., Sigl, M., Stoffel, M., and Wilson, R.: Disproportionately strong climate forcing from extratropical explosive volcanic eruptions, Nat. Geosci., 12, 100–107, https://doi.org/10.1038/s41561-018-0286-2, 2019.
Van Vliet-Lanoe, B., Bergerat, F., Allemand, P., Innocentd, C., Guillou, H., Cavailhes, T., Gudmundsson, A., Chazot, G., Schneider, J. L., Grandjean, P., Liorzou, C., and Passot, S.: Tectonism and volcanism enhanced by deglaciation events in southern Iceland, Quaternary Res., 94, 94–120, https://doi.org/10.1017/qua.2019.68, 2020.
Vapnik, V.: The Support Vector Method of Function Estimation, in: Nonlinear Modeling, edited by: Suykens, J. A. K. and Vandewalle, J., Springer, Boston, MA, https://doi.org/10.1007/978-1-4615-5703-6_3, 1998.
Veres, D., Bazin, L., Landais, A., Toyé Mahamadou Kele, H., Lemieux-Dudon, B., Parrenin, F., Martinerie, P., Blayo, E., Blunier, T., Capron, E., Chappellaz, J., Rasmussen, S. O., Severi, M., Svensson, A., Vinther, B., and Wolff, E. W.: The Antarctic ice core chronology (AICC2012): an optimized multi-parameter and multi-site dating approach for the last 120 thousand years, Clim. Past, 9, 1733–1748, https://doi.org/10.5194/cp-9-1733-2013, 2013.
WAIS Divide Project Members: Onset of deglacial warming in West Antarctica driven by local orbital forcing, Nature, 500, 440–444, https://doi.org/10.1038/nature12376, 2013.
WAIS Divide Project Members: Precise interpolar phasing of abrupt climate change during the last ice age, Nature, 520, 661–665, https://doi.org/10.1038/nature14401, 2015.
Watt, S. F. L., Pyle, D. M., and Mather, T. A.: The volcanic response to deglaciation: Evidence from glaciated arcs and a reassessment of global eruption records, Earth-Sci. Rev., 122, 77–102, https://doi.org/10.1016/j.earscirev.2013.03.007, 2013.
Zielinski, G. A., Mayewski, P. A., Meeker, L. D., Whitlow, S., and Twickler, M. S.: A 110,000-yr record of explosive volcanism from the GISP2 (Greenland) ice core, Quaternary Res., 45, 109–118, https://doi.org/10.1006/qres.1996.0013, 1996.
Zielinski, G. A., Mayewski, P. A., Meeker, L. D., Gronvold, K., Germani, M. S., Whitlow, S., Twickler, M. S., and Taylor, K.: Volcanic aerosol records and tephrochronology of the Summit, Greenland, ice cores, J. Geophys. Res.-Oceans, 102, 26625–26640, https://doi.org/10.1029/96jc03547, 1997.