the Creative Commons Attribution 4.0 License.
the Creative Commons Attribution 4.0 License.
 | 22 Nov 2022
Accurately calibrated X-ray fluorescence core scanning (XRF-CS) record of Ti ∕ Al reveals Early Pleistocene aridity and humidity variability over North Africa and its close relationship to low-latitude insolation
Rick Hennekam
Katharine M. Grant
Eelco J. Rohling
Rik Tjallingii
David Heslop
Andrew P. Roberts
Lucas J. Lourens
Gert-Jan Reichart
In eastern Mediterranean sediments, the titanium-to-aluminum ratio () captures relative variability in eolian to river-derived material and predominantly integrates climate signals over the Saharan and Sahel regions. Long time series can, therefore, provide valuable records of North African humidity and aridity changes. X-ray fluorescence core scanning (XRF-CS) can generate near-continuous records with relatively modest effort and in an acceptable amount of time, provided that accurate values are acquired. Calibration of raw XRF-CS data to those of established analytical methods is an important pathway for obtaining the required accuracy. We assess how to obtain reliable XRF-CS calibration by using different calibration reference sample sets for a long sediment record from ODP Site 967 (eastern Mediterranean Sea). The accuracy of reference concentrations and the number of reference samples are important for reliable calibration. Our continuous record allows detailed time series analysis over the past 3 Myr. Near-direct control of low-latitude insolation on the timing and amplitude of North African aridity and humidity is observed from 3 to ∼ 1.2 Ma. In our record, most arid North African intervals (i.e., with the longest period and highest amplitude) occur after the mid-Pleistocene transition (MPT; ∼ 1.2–0.7 Ma), when ice ages intensified. We also observe a subdued relationship between low-latitude insolation and North African climate after the MPT. These findings support the growing consensus that African climate became more sensitive to remote high-latitude climate when a threshold ice volume was reached during the MPT.
- Article
(7049 KB) - Full-text XML
-
Supplement
(12157 KB) - BibTeX
- EndNote


Continuous Pliocene–Pleistocene records that capture North African aridity and humidity variability are sparse. Yet, such records are crucial for understanding links between insolation, high-latitude climate, and low-latitude climate in Africa during the Plio-Pleistocene (deMenocal, 1995; Trauth et al., 2009, 2021), when Northern Hemisphere glaciation intensified (e.g., Shackleton et al., 1984; Mudelsee and Raymo, 2005; Rohling et al., 2021). Moreover, such records are essential for providing climatic context to contemporaneous hominin evolutionary events and out-of-Africa dispersals (Blanchet et al., 2021; deMenocal, 2011; Donges et al., 2011; Groucutt et al., 2015; Kaboth-Bahr et al., 2021; Larrasoaña et al., 2013; Larrasoaña, 2021; Maslin et al., 2014; Potts et al., 2020; Rohling et al., 2013; Trauth et al., 2021). Until now, long (> Myr) and continuous North African records have mainly focused on dust fluxes from subtropical West Africa (Ocean Drilling Program, ODP, Site 659; Tiedemann et al., 1994), the Arabian Peninsula and Horn of Africa (ODP Sites 721/722; Bloemendal and deMenocal, 1989; deMenocal, 1995, 2004), and (sub-)Saharan North Africa (ODP Site 967; Larrasoaña et al., 2003; Grant et al., 2022a) (Fig. 1). Although dust flux reconstructions tend to track large-scale continental aridity changes, they specifically relate to dust source extent, ablation potential, and eolian transportation. Hence, they do not necessarily track the intensity and extent of wet episodes. To date, the only continuous high-resolution records that capture relative humidity and aridity changes in North Africa throughout the Pleistocene are from ODP Site 967: (i) a “wet–dry index” (Grant et al., 2017), which combines a monsoon runoff proxy with an existing eolian record, and (ii) a recently derived record of the ratio of titanium (Ti) to aluminum (Al) spanning the last 5 Myr (Grant et al., 2022a).

Figure 1Location of ODP Site 967 in the eastern Mediterranean Sea, ODP Site 659 in the eastern Atlantic Ocean, and ODP Sites 721 and 722 in the Arabian Sea. The transparent black arrows indicate the main winds that transport dust to these sites (after Trauth et al., 2009).
The ratio in bulk sediments from the eastern Mediterranean Sea has been found to track aridity versus humidity variability in the Sahel and Saharan regions (Lourens et al., 2001; Wehausen and Brumsack, 2000). This proxy relies on the assumption that the eolian fraction that reaches the Levantine basin is enriched in Ti over Al, while the fluvial fraction comprises mainly clays, such as smectites, that are relatively enriched in Al over Ti (Lourens et al., 2001; Wehausen and Brumsack, 2000). Dust fluxes from North Africa toward the eastern Mediterranean Sea were generally enhanced during arid episodes in the source regions (Larrasoaña et al., 2003; Trauth et al., 2009), while riverine sediment fluxes increase during intervals with enhanced humidity and related African continental runoff (Williams et al., 2006). The ODP Site 967 record is, thus, interpreted as a North African aridity and humidity indicator, with high values representing arid intervals and low values corresponding to more humid periods (Lourens et al., 2001).
records from ODP Site 967 and neighboring Site 968 have been used to deduce monsoon variability over North Africa at 0–1.2 and 2.3–3.2 Ma (De Boer et al., 2021; Konijnendijk et al., 2014a, 2015; Lourens et al., 2001). These studies revealed cyclic North African climate variability in tune with insolation during the 2.3–3.2 Ma interval (De Boer et al., 2021; Lourens et al., 2001), which persisted during the 0–1.2 Ma interval, albeit with considerably more lag (up to 3–4 kyr) between precession minima/insolation maxima and North African climate (Konijnendijk et al., 2014a, 2015) depending on sea-level and monsoon changes (Grant et al., 2016). These records were produced using wavelength dispersive X-ray fluorescence (WD-XRF) analyses on molten glass beads (i.e., glass-bead WD-XRF), which is an established accurate and precise geochemical approach (Wehausen and Brumsack, 2000), yet also relatively costly, destructive, and time consuming if a high sampling resolution is required (Wilhelms-Dick et al., 2012). Future work would benefit from relatively rapid, cost-efficient, and non-destructive approaches to produce reliable records, such as XRF core scanning (XRF-CS) (Croudace and Rothwell, 2015; Jansen et al., 1998). Grant et al. (2017) generated geochemical records using XRF-CS on ODP Site 967 sediments, which were calibrated using samples measured by energy-dispersive XRF (ED-XRF) on sediment powders. This resulted in XRF-CS-based elemental concentration and ratio profiles that generally agree well with existing quantitative geochemical data from this core. However, the XRF-CS ratio revealed offsets with conventional measurements (Grant et al., 2017), which prevented its further use for paleoenvironmental purposes. So far, the cause of these offsets remained unexplained. Here, we show how to obtain reliable calibrated XRF-CS profiles using glass-bead WD-XRF-derived calibration samples with relevance to wider use of XRF-CS and potentially other element ratios. We show that appropriate calibration can significantly improve (i.e., making it consistent with other established geochemical methods) the down-core geochemical variability from XRF-CS. This approach allows us to investigate in detail North African climate dynamics from 2.3–1.2 Ma, including the interval prior to the mid-Pleistocene transition (MPT; ∼ 1.2–0.7 Ma; Clark et al., 2006; Chalk et al., 2017; Ford and Raymo, 2020; Berends et al., 2021), when glacial cycles changed fundamentally.
The methodological part of our study focuses on calibration sample selection and the accuracy of calibration concentrations, which are used to convert qualitative values (counts/counts) from XRF-CS into quantitative values (ppm ppm−1) (e.g., Weltje et al., 2015). We use the extensive (N=1060) set of glass-bead WD-XRF measurements of Konijnendijk et al. (2014a, 2015) instead of those produced with polarized ED-XRF on sediment powder samples (N=40) of Grant et al. (2017) because the glass-bead WD-XRF technique is regarded to be more precise and accurate than ED-XRF on sediment powders (Zhan, 2005). The large sample set of Konijnendijk et al. (2014a, 2015) also enables investigation of the number of samples required for accurate XRF-CS calibration. Ultimately, we use the obtained record to study the relationship of North African climate to insolation and latitudinal forcing (low versus high latitude) – with a focus on the 2.3–1.2 Ma interval – which has not yet been investigated in detail. This work is complementary to the concurrently conducted study of Grant et al. (2022a), who also calibrated the ODP Site 967 XRF-CS records with glass-bead WD-XRF samples to obtain a 5 Myr geochemical record. However, Grant et al. (2022a) did not highlight the methodological implications of this calibration; they focused on the relationship between a pronounced geochemical shift at 3.2 Ma and long-term North African climate evolution over the last 5 Myr.
2.1 Setting and chronology
ODP Site 967 is located on the northern flank of Eratosthenes seamount in the Levantine Basin at 34∘04′ N and 32∘43′ E (Fig. 1). Sediments from this site were recovered from a water depth of 2554 m during ODP Leg 160. Dust fluxes to ODP Site 967 are sourced from Algeria, Libya, and western Egypt from 21–30∘ N; this dust is mainly transported during boreal late winter and spring (Larrasoaña et al., 2003; Trauth et al., 2009). Fluvial sediment fluxes from the Nile river into the eastern Mediterranean peak from June to October, when discharge is high under the influence of monsoon-related Nile catchment precipitation (Williams et al., 2006).
We use the composite depth splice and chronology described by Grant et al. (2017, 2022a). The ODP Site 967 chronology is based on peak alignment in principal component 2 (PC2; a proxy associated with monsoon runoff and Mediterranean sapropel deposition, based on principal component analysis of XRF-CS data) to precession minima with zero phase lag, from 0.161 to 3.09 Ma, while ages from 0 to 0.161 Ma are constrained by radiometrically based ages of sapropels and tephra layers (Grant et al., 2016, 2017). Little or no lag to precession minima seems a suitable tuning condition for monsoon maxima not following glacial terminations and before the MPT (Grant et al., 2016, 2017). Exact phasing remains unknown, but the maximum uncertainty is likely on the order of ±3 kyr. This is based on data from the last glacial cycle, which can be radiocarbon-dated, showing an average 3 kyr lag between precession minima and monsoon maxima (e.g., Konijnendijk et al., 2014a).
2.2 XRF-CS and calibration assessment
The equipment settings used for XRF-CS measurements are described by Grant et al. (2017). In short, an Avaatech XRF core scanner was used to measure 90 m of core material at 1 cm intervals with energy settings of 10 and 50 kV, which produced intensity data (counts) for 11 target elements, i.e., Al, Si, S, K, Ca, Ti, Mn, Fe, Sr, Zr, and Ba. These intensity data were then converted into concentrations using the multivariate log-ratio calibration (MLC) approach of Weltje et al. (2015).
The calibration dataset of Grant et al. (2017) was based on 40 ED-XRF analyses of bulk sediment powder samples using a PANalytical Epsilon3 XL instrument. Instead, we use here the 1060 discrete samples from ODP Site 967 measured by Konijnendijk et al. (2014a, 2015) as calibration samples. These glass-bead samples were prepared by melting 600 mg of sediment with 6000 mg of lithium tetraborate, after which WD-XRF was performed with a Philips PW 2400 X-ray spectrometer. Both Grant et al. (2017) and Konijnendijk et al. (2014a, 2015) reported analytical precisions of the ED-XRF and WD-XRF analyses better than 2 % for Al and Ti, but comparison is ambiguous because different standard samples were used (MAG-1 and ISE 921, respectively). Yet, as noted before, glass-bead WD-XRF is established as a more accurate and precise method than sediment powder ED-XRF (Zhan, 2005).
The MLC conversion was implemented using the AvaaXelerate software (Bloemsma, 2015; Weltje et al., 2015) that minimizes the impact of down-core physical property changes and parameterizes non-linear matrix effects. Within the software, we set the sample tolerance (i.e., the allowed maximum distance between a calibration sample and the XRF-CS data) to ±15 mm to allow for minor depth mismatches between calibration samples and XRF-CS measurement depths. Subsequent calibration was performed with all 1060 samples of Konijnendijk et al. (2014a) and subsets thereof: (1) three evenly spaced subsets of 10 %, 5 %, and 2 % of the samples (i.e., 106, 53, and 22 samples, respectively) and (2) two subsets (i.e., 53 and 22 samples) obtained using statistically selected sample positions with the automated calibration sample selection option in the AvaaXelerate software. This sample selection is based on the multivariate geometry of the XRF-CS intensities (Weltje et al., 2005) and provides the minimum of calibration samples based on the variance and number of elements in the XRF-CS dataset (Bloemsma, 2015). Conversion of intensities into concentrations was possible for all target elements except for sulfur, which is known to be semi-quantitative for measurements performed on glass beads due to its partial loss during sample preparation. We calibrated 10 elements simultaneously (Al, Ba, Ca, Fe, K, Mn, Si, Sr, Ti, and Zr) for each calibration approach (see Fig. S1 to S6 in the Supplement for AvaaXelerate results).
The calibrated XRF-CS records were compared with the glass-bead WD-XRF data of Konijnendijk et al. (2014a, 2015) to statistically test the similarity between the (un)calibrated XRF-CS data to this reference record. We tested for equality of variance (F test; α=0.05) and mean (two-tailed tests: one-way analysis of variance, (ANOVA), Student t test, and non-parametric Mann–Whitney test, all at the α=0.05 level). To correct for multiple comparisons, we used the Bonferroni method to adjust the obtained p values. Moreover, we performed an ordinary least squares regression and calculated the Pearson product-moment correlation coefficient (r) to measure linear correlation between the XRF-CS and reference glass-bead WD-XRF data. To do so, the depths of the XRF-CS data were resampled to the same sample intervals of the WD-XRF dataset through linear interpolation using Analyseries v1.1.1 (Paillard et al., 1996).
Calibration of the XRF-CS data, as performed here, corresponds closely to that performed by Grant et al. (2022a), both using glass-bead WD-XRF calibration samples. These studies were conducted in parallel and with close collaboration; thus, knowledge transfer on appropriate calibration occurred at an early stage. Considering the match between the calibrated XRF-CS data from our study and those of Grant et al. (2022a) – as shown below – we recommend the Grant et al. (2022a) data for other paleoenvironmental studies (see “Data availability” section).
3.1 Accuracy of TiAl time series from XRF-CS
XRF-CS records are shown in Fig. 2 prior to calibration (intensities in Fig. 2a and log ratios of these intensities in Fig. 2b) and after calibration (Fig. 2c–i) versus the reference data obtained using WD-XRF on glass beads (Konijnendijk et al., 2014a). Statistical test results (Table 1) for comparisons between XRF-CS data and reference data indicate that uncalibrated (counts/counts; Fig. 2a) ratios have no similarity at the α=0.05 level to the WD-XRF results and relatively low correlation to these reference data. Likewise, statistical results for log ratios of intensities also have no similarity and low correlation to the reference data (Table 1). The previous Grant et al. (2017) calibration is marginally better, with a slightly higher correlation but still with significantly (α=0.05) different values from the reference data (Table 1). The new calibrations have much higher linear correlation to the reference data (correlation coefficients of 0.60–0.74, depending on how many samples are used; Table 1), while the means of the XRF-CS data become statistically similar to the reference data for calibrations with 5 % (n=53), 10 % (n=106), and all (n=1060) calibration samples (Table 1). The calibration samples that were automatically selected using a clustering algorithm (Bloemsma, 2015) produce only somewhat better results when 22 calibration samples are considered (Fig. 2i versus g, Table 1) and not for 53 samples (Fig. 2h versus f, Table 1). This may be due to the fact that the calibration samples are selected automatically based on the whole XRF-CS dataset (i.e., all calibrated elements) and not specifically Ti and Al data. For other elements, predicted concentrations from the XRF-CS data may better match the calibration sample concentrations (Figs. S1 to S6).
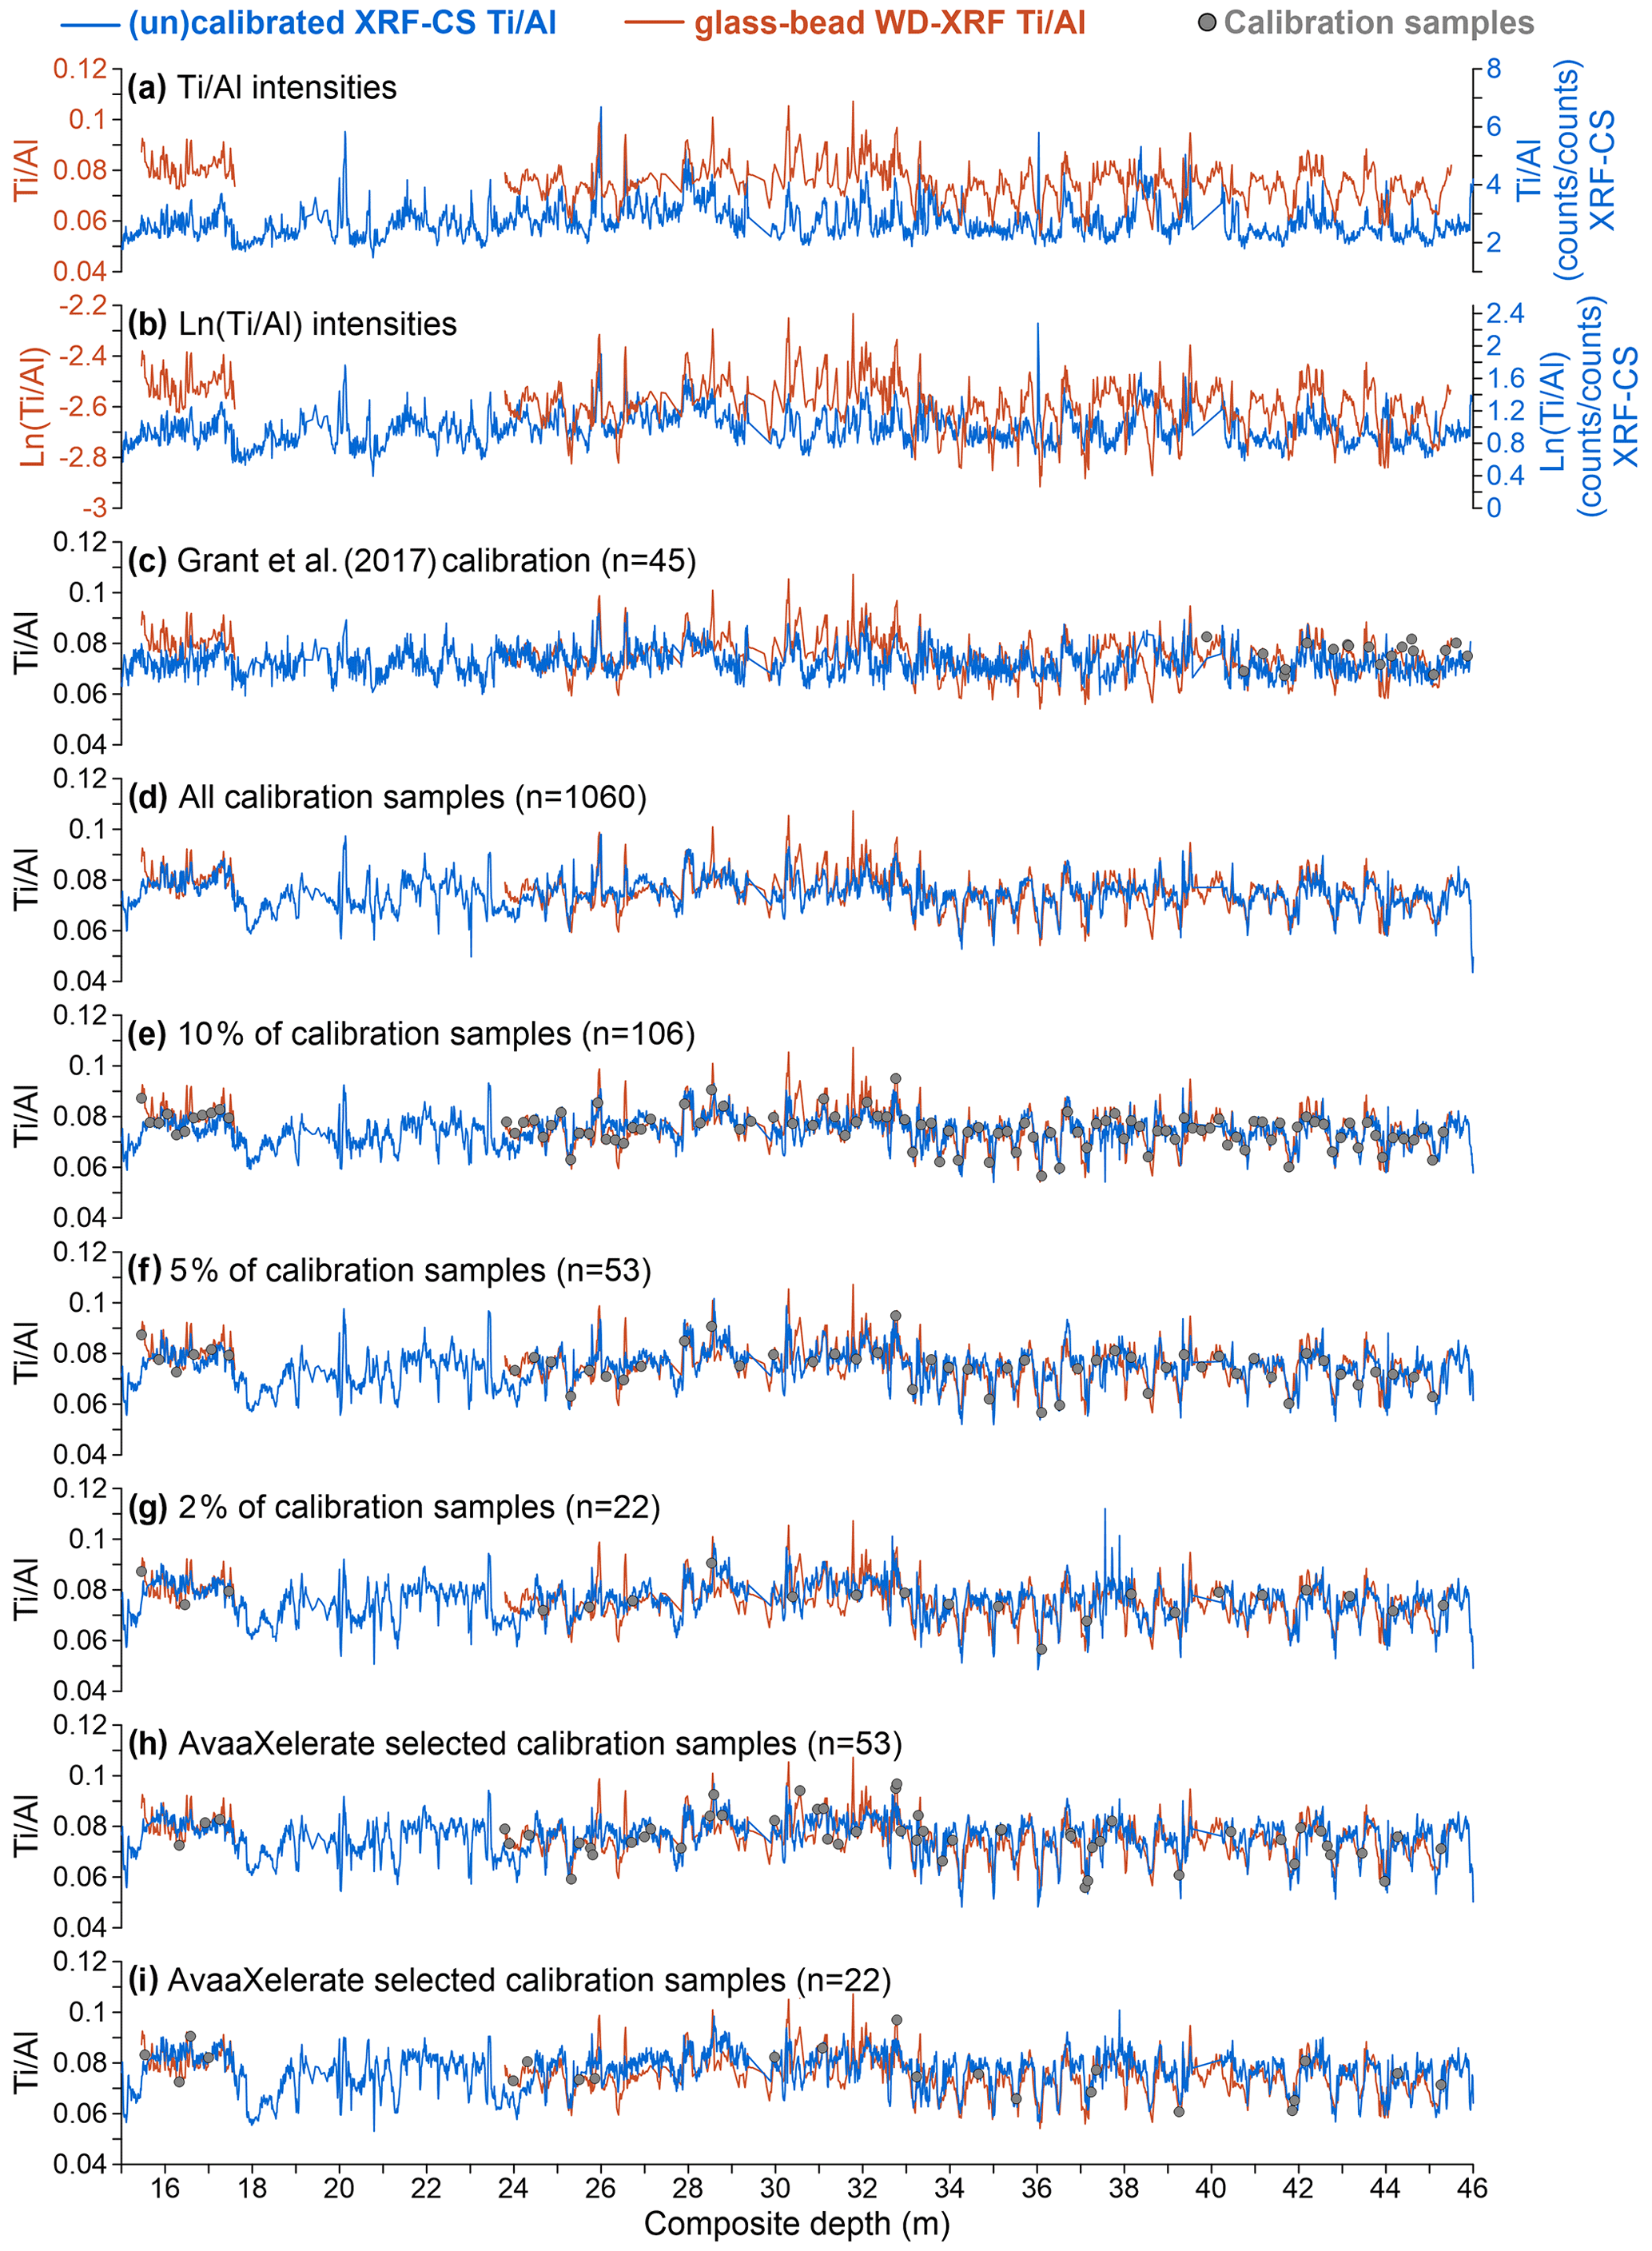
Figure 2Uncalibrated and calibrated ratios (blue) for different XRF-CS calibration strategies versus reference values obtained using glass-bead WD-XRF (orange; Konijnendijk et al., 2014a, 2015). (a) from XRF-CS intensities. (b) Ln() from XRF-CS intensities. (c) using the calibration of Grant et al. (2017). (d) using all 1060 calibration samples from glass-bead WD-XRF (Konijnendijk et al., 2014a, 2015). (e) using 10 % of the samples from glass-bead WD-XRF. (f) using 5 % of the samples from glass-bead WD-XRF. (g) using 2 % of the samples from glass-bead WD-XRF. (h) using the 53 samples selected by AvaaXelerate (Bloemsma, 2015). (i) using the 22 samples selected by AvaaXelerate (Bloemsma, 2015). Gray circles represent data points used as calibration samples. Two high- data points (0.13–0.14) were omitted from the glass-bead WD-XRF record at 26 m for clarity but are incorporated in the statistical calculations. Statistical test results associated with these data are presented in Table 1.
Table 1Statistical test results between XRF-CS data (uncalibrated and calibrated) and reference data. These data are also shown in Fig. 2. The second column indicates the correlation coefficient r calculated between the datasets. The Y (yes) and N (no) markers in the third to sixth columns indicate whether the null hypotheses of equality of variance (third column) and means (fourth to sixth column) could not (Y) or could (N) be rejected at the α = 0.05 significance level. Hence, a Y indicates that the data are statistically similar. The associated p values are shown between brackets. To correct p values for multiple comparisons, we used the Bonferroni method (i.e., multiply the raw p values, as shown here, by the number of tests).
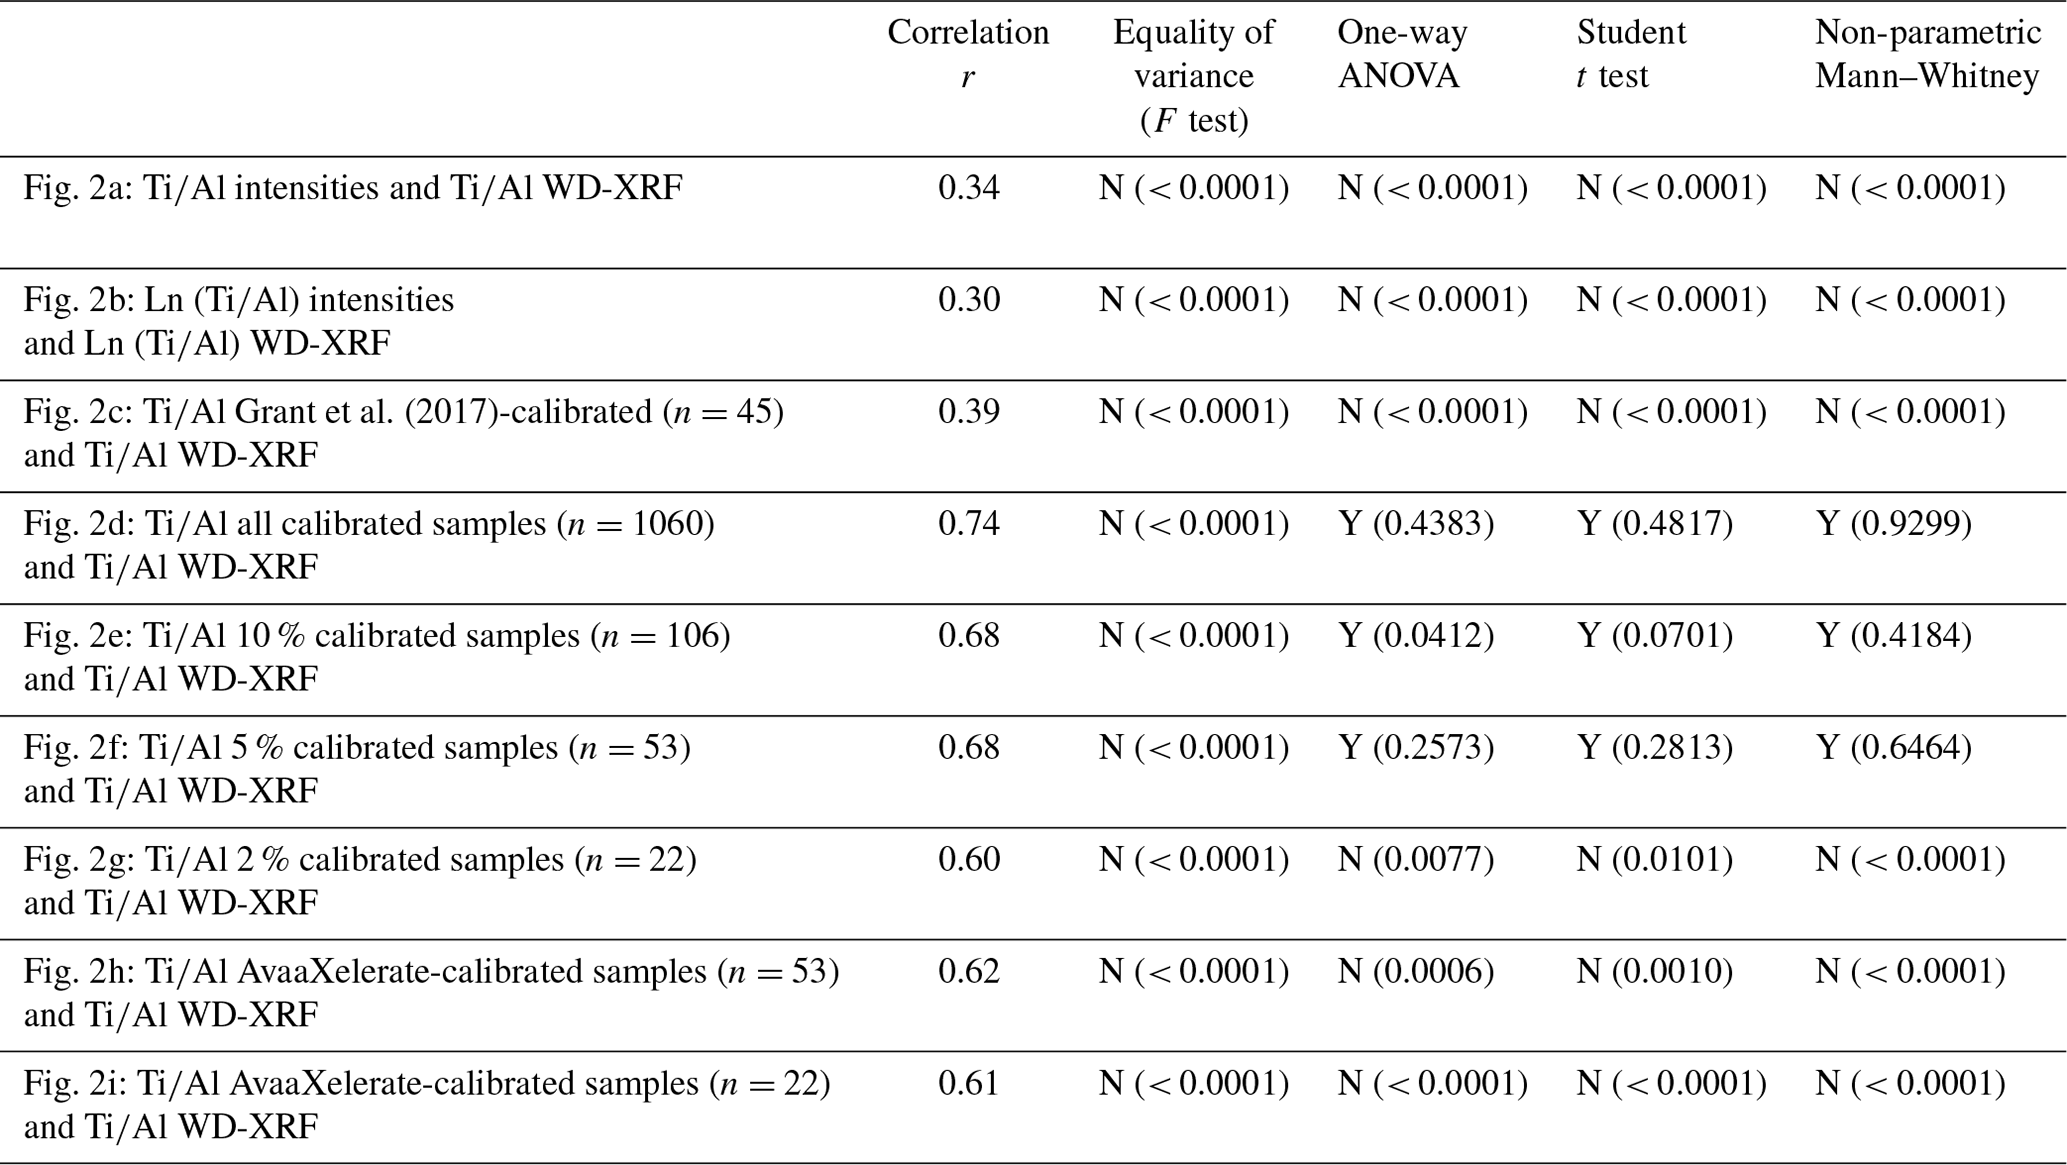
Our results demonstrate that XRF-CS can be used to acquire accurate data, as long as an appropriate number of calibration samples is used (i.e., at least 53 samples here for ; Table 1). Ti and Al are challenging to measure with XRF-CS because they are relatively light elements and hence prone to sedimentary inhomogeneities due to the fact that the XRF signal originates from only the upper few micrometers of sediment (Potts et al., 1997). This may also explain the significant (α=0.05) difference in variance observed between all XRF-CS data and the reference data (Table 1). The reference data have the highest amplitude variability (to more positive values) at turbidite intervals (Konijnendijk et al., 2014a), which typically contain larger grain sizes that may result in ambiguous data for Ti and Al because of their shallow XRF signals and associated grain-size effect (i.e., larger grains are coated in smaller grains, and thus shallow XRF signals from light elements preferentially record the small grain geochemistry). Importantly, all of our new XRF-CS calibrations (Fig. 2d–i) have similar cyclic variations to the WD-XRF reference data, which would likely lead to similar paleoenvironmental interpretations. Uncalibrated XRF-CS ratios and log ratios (Fig. 2a, b), on the other hand, are seemingly unusable for paleoenvironmental purposes.
Mismatch between uncalibrated and reference values is likely due to differences in sample preparation, analytical sensitivity, and matrix effects for the methods used. Matrix effects result from influences of the fluorescence of other elements of interest in the sediment matrix by absorption or enhancement. For instance, Ca likely has a large impact on both Ti and Al because it is an effective absorber of Ti fluorescence and enhances Al fluorescence (Potts and Webb, 1992); it also has large down-core variations at ODP Site 967 (∼ 2–33 wt %; Grant et al., 2022a). Matrix effects and associated analytical sensitivity (i.e., sensitivity to measurement of an element of interest by the XRF scanner, being mainly dependent on X-ray source, measurement geometry, instrument settings, and sample matrix) are approximately constant for WD-XRF analyses performed on well-homogenized glass beads due to the 1:10 dilution and the low atomic weight of the lithium tetraborate flux (e.g., Konijnendijk et al., 2014a; 2015). On the other hand, these parameters vary for XRF-CS measurements, which are performed directly on the split-core surface without sample preparation. Similarly, the quantitative ED-XRF used to analyze sediment powders may have been less accurate for the same reason (Fig. 2c) because these powders have a more variable matrix than fused glass beads. Hence, the substantial improvement of calibrated XRF-CS records (Fig. 2d–i, Table 1) is likely due to the use of WD-XRF calibration data from glass beads. The matrix effects and associated variable element sensitivities that clearly impact the uncalibrated XRF-CS results (Fig. 2a, b) are appropriately accommodated by using these accurately constrained calibration samples with the MLC method of Weltje et al. (2015). This has important implications because there is a general misconception that calibration of XRF-CS data is only necessary to quantify geochemical data, for instance, for flux analysis or mass-balance calculation (see, e.g., p. 529 in Weltje et al., 2015). However, we show that the Weltje et al. (2015) calibration is more powerful than that, rendering elemental variability usable (in this case for ), while (log) ratios of intensity data do not allow a paleo-interpretation.
The high-resolution record measured by XRF-CS, calibrated using all 1060 samples of Konijnendijk et al. (2014a, 2015), was used to reconstruct past aridity and humidity variations over North Africa (see Sect. 3.2). We used the 1060-sample calibration because it has the highest resemblance (i.e., highest p values and highest correlation r) to other analytical techniques (Table 1). The records of Lourens et al. (2001) and the similar calibration of Grant et al. (2022a) independently validate our chosen calibration (Fig. 3a).

Figure 3Calibrated record from XRF-CS (this study; blue) and companion records (orange and black). (a) XRF-CS (blue; this study) versus the calibrated XRF-CS data of Grant et al. (2022a) (orange; plotted behind the overlapping blue line) and the WD-XRF values obtained by Lourens et al. (2001) (black). (b) XRF-CS versus the wet–dry index of Grant et al. (2017). (c) XRF-CS versus Saharan dust supply (Larrasoaña et al., 2003). (d) XRF-CS versus ODP Site 659 dust flux (Tiedemann et al., 1994). (e) XRF-CS versus ODP Site 721/722 dust flux (DeMenocal, 1995, 2004). (f) XRF-CS versus calibrated XRF-CS . and dust records in (b–f) are normalized (i.e., presented as z scores by subtracting the average and dividing by the standard deviation over the same 3-million-year interval) to facilitate comparison.
3.2 Aridity and humidity variability in North Africa over the last 3 Myr
The ODP Site 967 record (this study; Grant et al., 2022a) and wet–dry index of Grant et al. (2017) provide the longest continuous, detailed representations of past North African climate variability (Fig. 3b), including information on humid period intensity compared to the dust proxy records. and the wet–dry index have mostly similar variability throughout the past 3 Myr, and the record confirms the timing and extent of “Green Sahara Periods” reported by Grant et al. (2017).
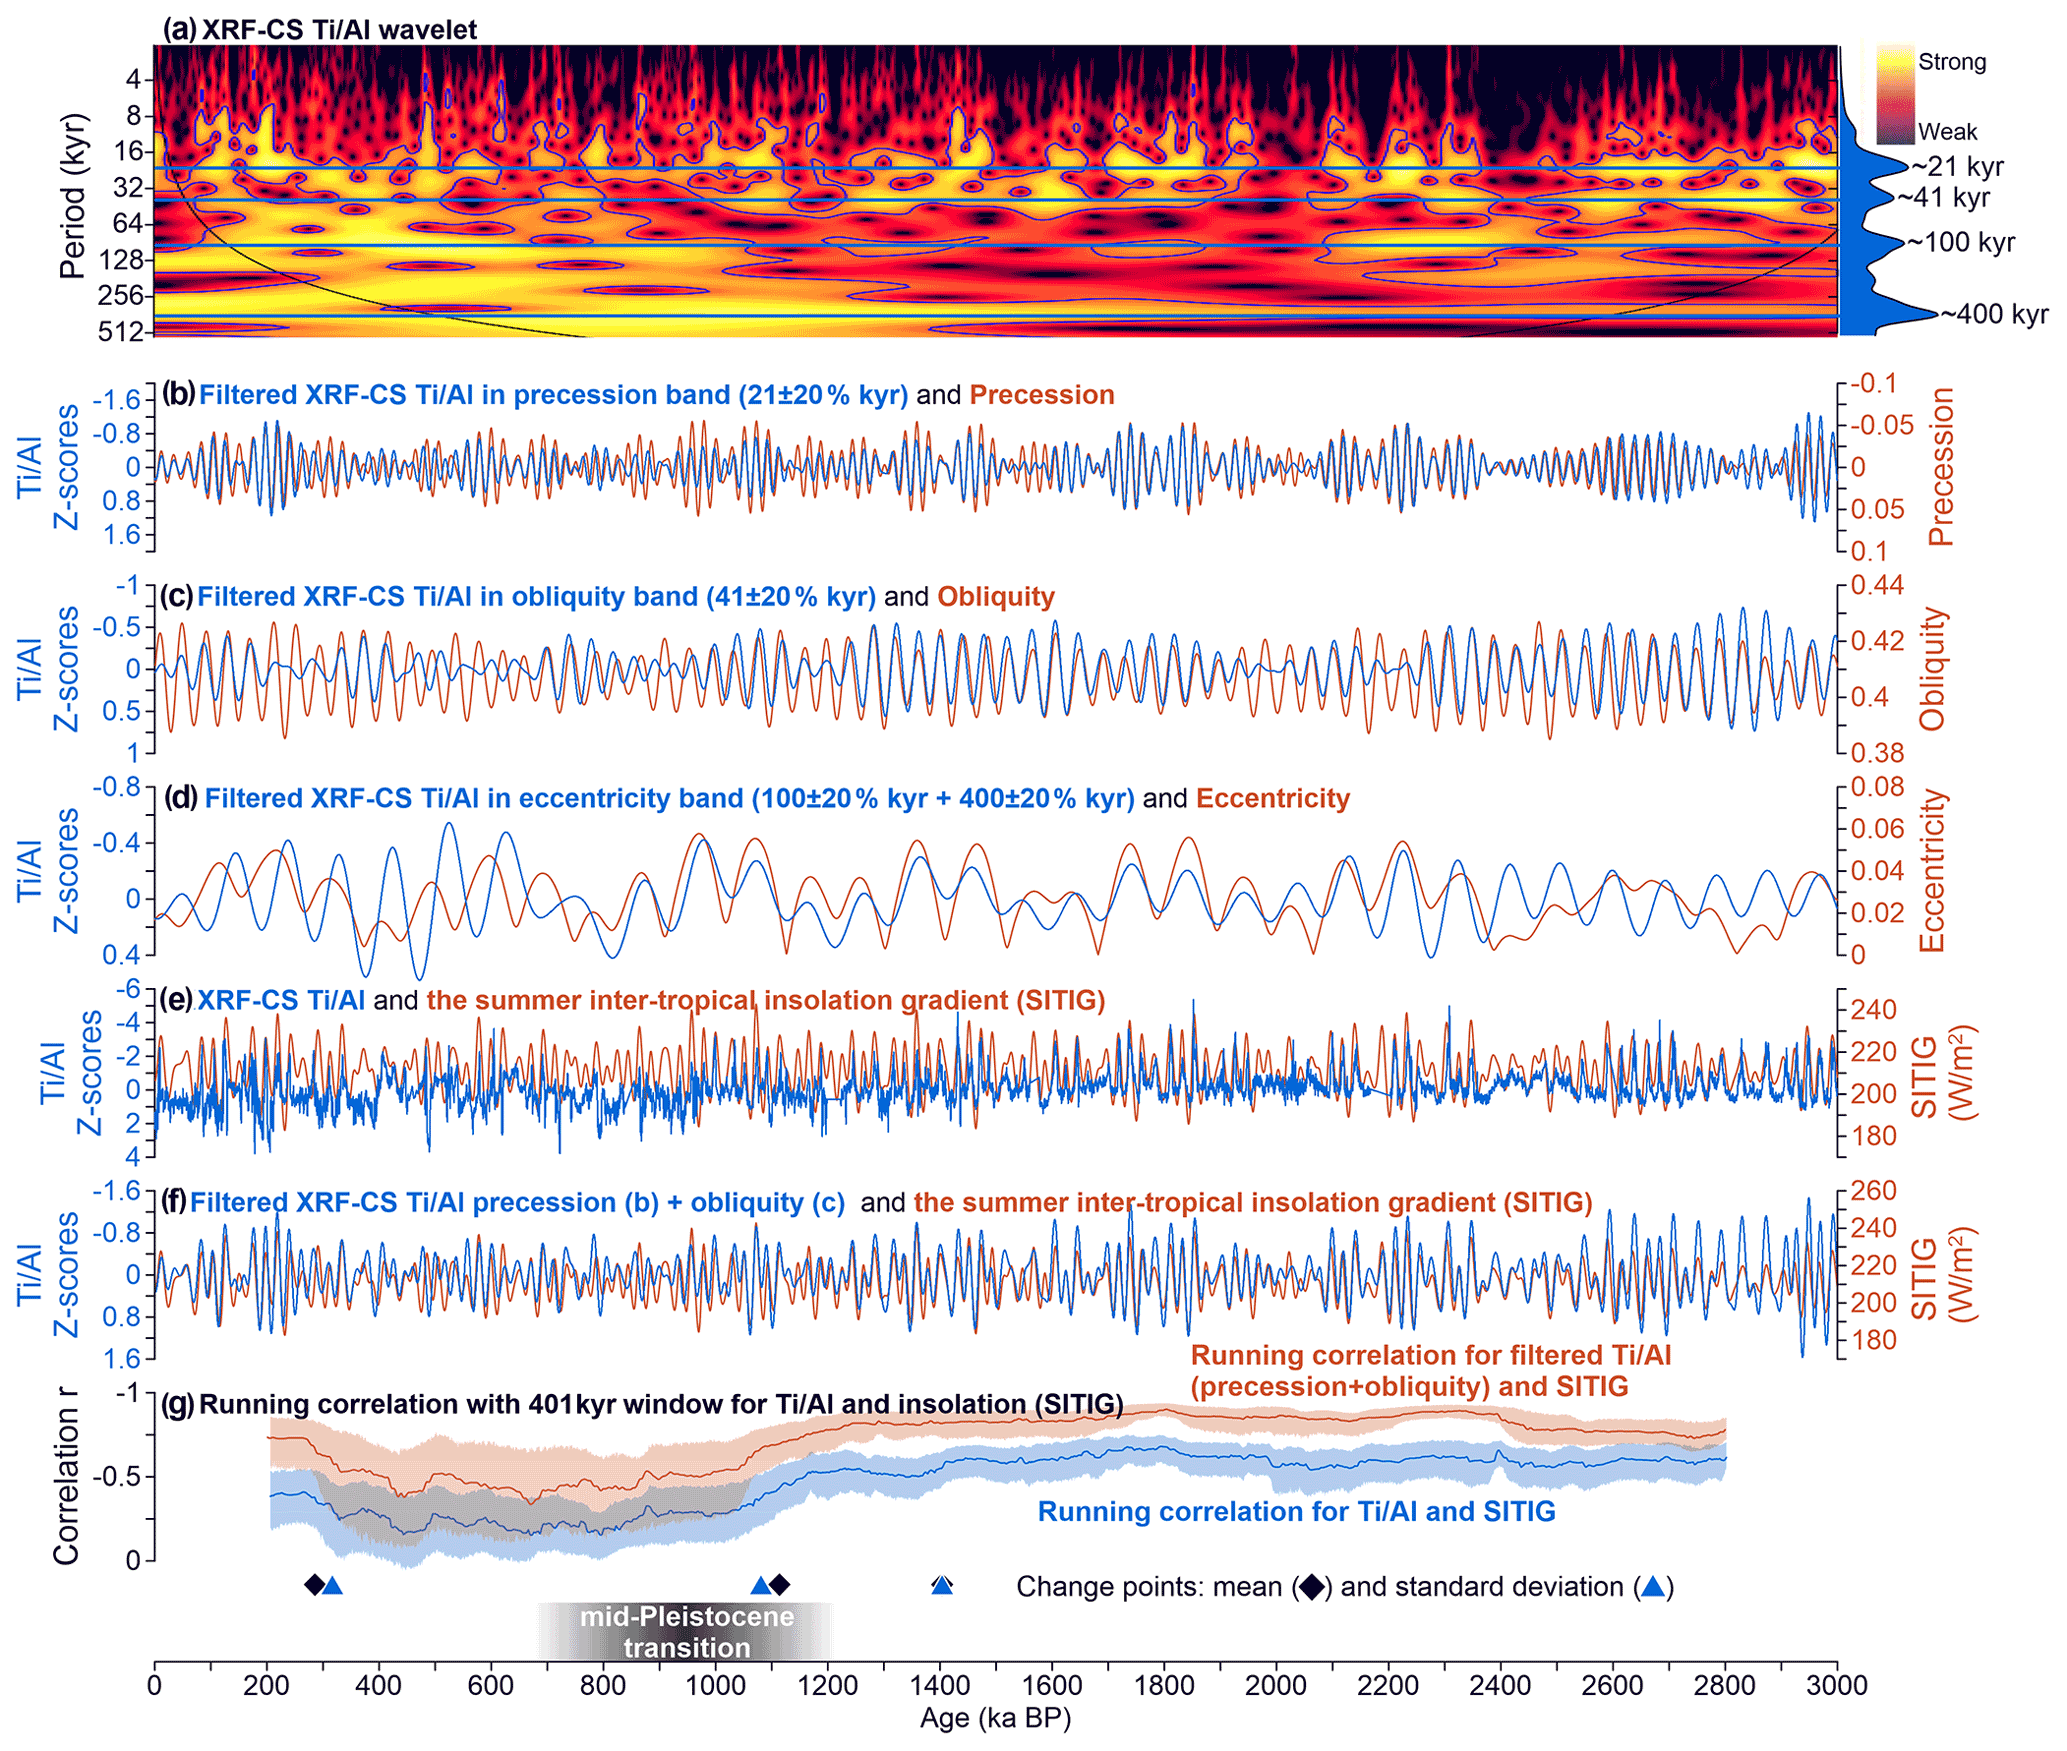
Figure 4Time series analyses of the ODP Site 967 record. (a) Wavelet analysis (Torrence and Compo, 1998) performed with a Morlet wavelet. The record was resampled to 1 kyr resolution before analysis. The cone of influence is indicated by the black line. Blue contour lines indicate the p = 0.05 significance level. The cumulative signal strength is shown on the right. (b) Filtered XRF-CS (blue; 21 % kyr ±20 % kyr) and precession (orange). (c) Filtered XRF-CS (blue; 41 % kyr ±20 % kyr) and obliquity. (d) Filtered XRF-CS (blue; 100 %±20 % plus 400 % kyr ±20 % kyr) and eccentricity. (e) XRF-CS versus the summer inter-tropical insolation gradient (SITIG). (f) Filtered XRF-CS (precession plus obliquity bands) versus SITIG. (g) Running correlation (401 kyr window) for profiles in (e) (blue) and (f) (orange); shadings indicate 95 % confidence intervals. The 401 kyr window was chosen to obtain a relatively smooth running correlation that focuses on long-term changes in variability. Change points in (g) are based on changes in the mean (black diamonds) and standard deviation (blue triangles) of these correlations and were estimated using the MATLAB built-in function “findchangepts” (Killick et al., 2012). Wavelet analysis was done using the Past program (Hammer et al., 2001), while band-pass filtering was performed with Analyseries (Paillard et al., 1996).
The record indicates a clear increase in length and amplitude of arid intervals since ∼ 1 Ma, with the highest values recorded from then on (Fig. 3a). This interval of enhanced intermittent aridity is coeval with the MPT (∼ 1.2–0.7 Ma; Clark et al., 2006; Chalk et al., 2017; Ford and Raymo, 2020; Berends et al., 2021) when ice ages intensified. Similar aridity increases are observed in the Saharan dust supply (Larrasoaña et al., 2003) (Fig. 3c) and in records that capture dust inputs from subtropical West Africa (ODP 659; Tiedemann et al., 1994) (Fig. 3d) and the Arabian Peninsula and Horn of Africa (ODP 721/722; Bloemendal and deMenocal, 1989; deMenocal, 1995, 2004) (Fig. 3e). However, we also observe clear differences between ODP Site 967 and dust records from ODP Sites 659 and 721/722, which may be a result of the lower resolution of those records and chronological inconsistencies with the ODP Site 967 record. In addition, transportation effects by monsoon dynamics might play a role; the dust time series of ODP Sites 659 and 721/722 might record increased dust fluxes not only due to enhanced continental droughts but also due to stronger monsoon winds, which makes their interpretation more ambiguous (Trauth et al., 2009). Transportation impact by monsoon dynamics was likely minimal for the ODP Site 967 dust record (Trauth et al., 2009) and, thus, by extension, also for the ODP Site 967 record. Our Ti/Al record delivers an additional reliable and independent line of evidence that the most arid North African intervals after the MPT were unmatched in the preceding 2 million years.
The ODP Site 967 sapropel stratigraphy provides a relatively precise chronology throughout the record by tuning of sapropel geochemistry to precession minima (Grant et al., 2017, 2022a). Organic-rich sapropel intervals in eastern Mediterranean sediments resulted from reduced deep-water ventilation and increased productivity during humid intervals in North Africa at precession minima (Rohling and Gieskes, 1989; Rohling et al., 2015). Regular peaks (“export productivity”; e.g., De Lange et al., 2008) (Fig. 3f), thus, offer robust chronological constraints, paving the way for detailed time series analysis of the record. Importantly, the record was not used to tune the ODP Site 967 age model, and no lag was applied when tuning sapropel mid-points to precession minima (Grant et al., 2017). Previous studies indicate that precession minima can lead African monsoon maxima by about 3 kyr (Lourens et al., 1996; Ziegler et al., 2010; Konijnendijk et al., 2014a). However, more recent work has shown that such a lag of the African monsoon to insolation only occurred after glacial terminations and principally after the MPT (Grant et al., 2016, 2017). Thus, before the MPT, and especially during the Late Pliocene and Early Pleistocene, any lag was likely smaller or absent (Lourens et al., 2001; Grant et al., 2016, 2017).
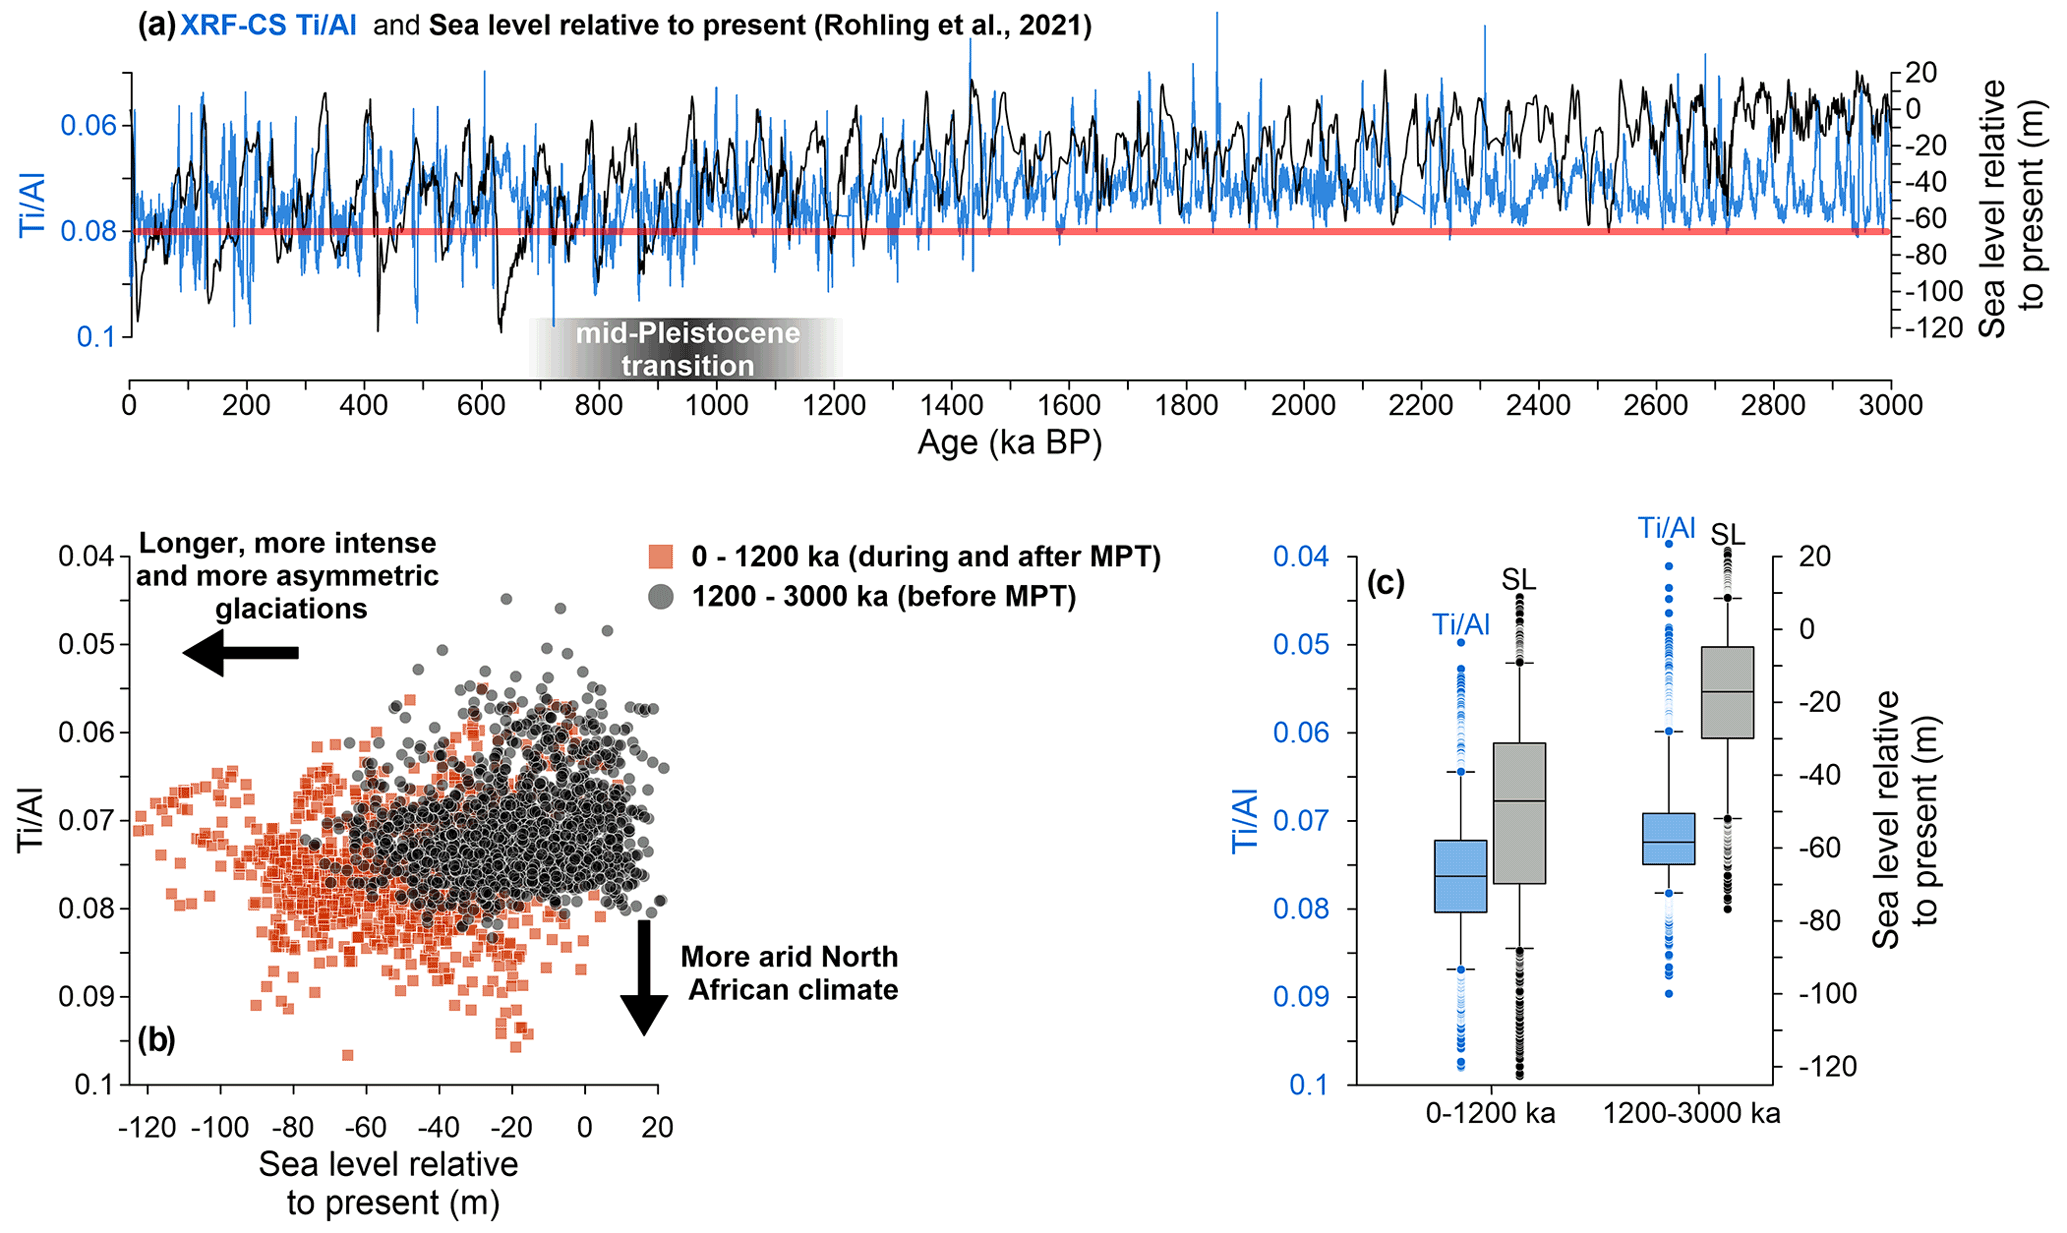
Figure 5ODP Site 967 record and global ice-volume changes. (a) ODP Site 967 (blue) and sea level relative to present (Rohling et al., 2021; black) reconstructed from deep-sea carbonate microfossil-based δ18O of Westerhold et al. (2020). The red line marks −65 m sea level. (b) Cross plot between sea-level (Rohling et al., 2021) and ODP Site 967 data for intervals from 3 to 1.2 Ma (black) and 1.2 to 0 Ma (orange). (c) Box-whisker plots of ODP Site 967 (blue) and sea-level (gray) data (Rohling et al., 2021). Box edges represent the interquartile range; the whiskers represent the 5th and 95th percentiles; data exceeding this range are represented as circles. Tests for equality of variance and means (see “Methods” section) all indicate a significance (all p values < 0.0001) difference between the 0–1.2 and 1.2–3 Ma values for both and sea level.
Wavelet analysis and band-pass filtering highlight strong cyclic variability over the last 3 million years (Fig. 4a–d). In general, we observe the expected enhanced North African humidity coupled to precession minima, obliquity maxima, and eccentricity maxima, and vice versa, for North African aridity (Fig. 4b–d). The 100 and 400 kyr eccentricity bands are stronger after the MPT, in line with other proxy records (e.g., deMenocal, 1995; Kaboth-Bahr et al., 2021). The eccentricity signal is much more apparent in than in the dust record from ODP Site 967 (see Larrasoaña et al., 2003). Eccentricity modulation of precession forcing strongly affects northward penetration of the African rain belt into Saharan and Sahel watersheds, and thus the humidity recorded by . Moreover, eccentricity also impacts the El Niño–Southern Oscillation, which includes the Walker circulation and thus affects pan-African climate (Kaboth-Bahr et al., 2021), offering another mechanism for eccentricity imprint on . The eccentricity modulation of precession forcing is in phase with before the MPT, while the later phase relationship is more variable (Fig. 4d). This may be associated with a substantial climate system change at the MPT that produced a different North African aridity and humidity response on such long timescales. For instance, Trauth et al. (2009) suggested that the African climate response became more susceptible to remote high-latitude climate influences due to the crossing of a threshold ice volume during and after the MPT.
3.3 Forcing of ODP Site 967 TiAl variability
The lag between obliquity forcing and the obliquity signal in the record holds information on low- versus high-latitude controls on North African aridity and humidity. The high-latitude ice sheet response time to obliquity has been approximated to be ∼ 6.5 kyr (Lisiecki and Raymo, 2005; Lourens et al., 2010). Hence, a similar lag in North African aridity and humidity would provide evidence for high-latitude control, while a low-latitude control would instigate a much smaller lag. The relatively small lead (∼ 2 kyr) of obliquity relative to over the 3–1 Ma interval, thus, suggests that high-latitude climate had a relatively limited impact on monsoon activity in North Africa into the MPT (Fig. 4c). This holds true even if a relatively large (and unlikely; see discussion above) lag of ∼ 3 kyr is assumed for most of the Pleistocene because then still lags obliquity considerably less than the ∼ 6.5 kyr ice-volume response to obliquity (Lisiecki and Raymo, 2005; Lourens et al., 2010). These results, therefore, point to an obliquity control on the low latitudes that affected North African aridity and humidity to at least the MPT, which is consistent with data from a high-resolution coupled general circulation model (Bosmans et al., 2015a).
Climate model results produced using a fully coupled ocean–atmosphere general circulation model (Bosmans et al., 2015a, b) also indicate that the cross-equatorial insolation gradient provides a mechanism for the relatively large obliquity signal originating from low latitudes, which influences North African monsoon variability. The 21 June insolation at 65∘ N is often used to tune North African climate variability (Lourens et al., 1996; Ziegler et al., 2010; Konijnendijk et al., 2014a), which presumes a high-latitude control of North African climate. Our results and those of Bosmans et al. (2015a, b) suggest that variability in the summer inter-tropical insolation gradient (SITIG), i.e., the difference in 21 June insolation between 23∘ N and 23∘ S (Lourens and Reichart, 1996), in principle provides a better tuning target curve for North African climate records (Fig. 4e, f). This is in line with plant-wax isotope data, which indicate that monsoon rainfall variability in northwestern Africa is principally controlled by low-latitude insolation gradients (O'Mara et al., 2022).
SITIG and African humidity and aridity (Fig. 4e, g) have a high cross-correlation, which indicates similar amplitude variability (and similar timing, which is inherent to the age model construction). This high correlation is especially visible for insolation (SITIG) and the combined precession–obliquity signals in African humidity and aridity (Fig. 4f, g) from ∼ 3 to 1.2 Ma. This is consistent with earlier research on the 3.2–2.3 Ma interval (De Boer et al., 2021; Lourens et al., 2001), and we show here that the African climate system operated in a similar manner until at least 1.2 Ma (Fig. 4g). During and after the MPT this linear correlation persists, but it is clearly diminished (i.e., with considerably lower correlation r, shifting from −0.9 to about −0.45; Fig. 4g). Moreover, change-point analysis also indicates significant changes in the relationship between SITIG and just before and during the MPT (Fig. 4g). This all suggests that changes in the amplitude during and after the MPT responded more variably (“noisy”) to insolation changes, with a larger lag (∼ 3 kyr; Konijnendijk et al., 2014a). This implies a substantial global climate system change at the MPT that caused a different North African aridity and humidity response to insolation.
We observe North African aridity and humidity changes in parallel with ice age cycle changes at the MPT (i.e., ice ages intensified, lengthened from ∼40 to ∼100 kyr, and became distinctly asymmetrical; Clark et al., 2006). Such large cryosphere changes are represented by sea-level records that reflect global-scale ice sheet melt and growth during (de)glaciation. Comparison of the ODP Site 967 record with sea-level records (e.g., Rohling et al., 2021) indicates that there is no obvious linear correlation between these two records before and after the MPT (Fig. 5a, b). However, the significant change to more intense and asymmetric glacial cycles and more prolonged and arid North African climate variability occurred concurrently, around the MPT (Fig. 5b, c), when glacial sea level started to dip frequently below ∼ 65 m (Fig. 5a). Together with (i) the statistical differences in the relationship between and SITIG before and after the MPT and (ii) the strengthening of wavelengths > 100 kyr in the record at around the same time, this suggests an increased, although non-linear, high-latitude climate impact on North African climate at the MPT. Meltwater discharge events at glacial terminations led to a weakened monsoon system by reducing the Atlantic meridional overturning circulation (e.g., Böhm et al., 2015; Häuselmann et al., 2015; Marino et al., 2015; Menviel et al., 2021; Ziegler et al., 2010) and were probably important for driving the lagged African climate response to insolation. Such large-scale meltwater events did not occur until just after the MPT (Hodell et al., 2008), explaining – at least partially – the more in-phase relationship between North African climate and (low-latitude) insolation before the MPT and the more non-linear response after.
We investigate here XRF-CS calibration of bulk sediment from ODP Site 967 and use a well-calibrated record to analyze responses and forcing of North African aridity and humidity in detail over the past 3 Myr, with a focus on the 2.3–1.2 Ma time interval.
Uncalibrated intensity ratios from XRF-CS can deviate significantly from ratios of the same elements measured by established geochemical methods using discrete samples, due to matrix effects and associated variable element measurement sensitivities. Calibration using the multivariate log-ratio approach of Weltje et al. (2015), which estimates relative matrix effects and element sensitivity with selected calibration samples, efficiently corrects for this. We show that highly accurate calibration measurements are essential for proper calibration of these XRF-CS data and that calibration improves with the number of calibration samples. Here, at least 53 samples were necessary for proper calibration of the ratio, but this number may vary per site depending on sediment matrix and its variability. is a suitable proxy for tracing sedimentation processes in many other environments. Hence, our results are also relevant to studies elsewhere that focus on from XRF-CS. Extending our results to other elements indicates that calibration may result in useful XRF-CS data for paleoenvironmental purposes, even if the initial intensity data for elements did not correspond to reference data.
Our ODP Site 967 record reveals a striking similarity in timing and amplitude between North African aridity and humidity and low-latitude insolation, especially during the 3 to 1.2 Ma interval. A small lead in obliquity to similar frequencies in over that interval points to a low-latitude origin of this signal, which is consistent with climate model simulations. Our analyses imply that African climate became more sensitive to remote high-latitude climate when a threshold ice volume (glacial sea-level equivalent of below ∼ 65 m) was reached around the MPT.
The glass-bead WD-XRF elemental concentration data of Konijnendijk et al. (2014a) can be found in the PANGAEA repository as Konijnendijk et al. (2014b) (https://doi.org/10.1594/PANGAEA.831712). The calibrated XRF-scanning record of Grant et al. (2022a) is similar to the final calibrated XRF-scanning record presented here, as shown above, and is available in the PANGAEA repository as Grant et al. (2022b) (https://doi.org/10.1594/PANGAEA.939929). Raw XRF-scanning data and results of the different calibration approaches used here are included in the Supplement.
The supplement related to this article is available online at: https://doi.org/10.5194/cp-18-2509-2022-supplement.
RH and KMG conceptualized the project. RH conducted XRF-scanning calibration and data analysis, with the consultation of all co-authors, and wrote the manuscript. All co-authors contributed to editing of the manuscript.
The contact author has declared that none of the authors has any competing interests.
Publisher’s note: Copernicus Publications remains neutral with regard to jurisdictional claims in published maps and institutional affiliations.
We acknowledge the two anonymous reviewers whose constructive comments improved the paper.
Rick Hennekam was supported by the Netherlands Organisation for Scientific Research (NWO), with funding for the SCANALOGUE project (grant no. ALWOP.2015.113) awarded to Gert-Jan Reichart. This study was also carried out as part of the Netherlands Earth System Science Centre (NESSC; grant no. 024.002.001), supported by the Dutch Ministry of Education, Culture and Science (OCW). This work was also supported by the Australian Research Council (ARC) through grant nos. DE1900100042 (Katharine M. Grant), LE160100067 (ANZIC Legacy Grant; Katharine M. Grant and Andrew P. Roberts), Australian Laureate Fellowship FL1201000050, grant no. DP200101157 (Eelco J. Rohling), and grant no. DP200100765 (Andrew P. Roberts and David Heslop).
This paper was edited by Dominik Fleitmann and reviewed by two anonymous referees.
Berends, C. J., Köhler, P., Lourens, L. J., and van de Wal, R. S. W.: On the cause of the mid-Pleistocene transition, Rev. Geophys., 59, e2020RG000727, https://doi.org/10.1029/2020RG000727, 2021.
Blanchet, C., Osborne, A. H., Tjallingii, R., Ehrmann, W., Friedrich, T., Timmermann, A., Brückman, W., and Frank, M.: Drivers of river reactivation in North Africa during the last glacial cycle, Nat. Geosci., 14, 97–103, 2021.
Bloemendal, J. and deMenocal, P.: Evidence for a change in the periodicity of tropical climate cycles at 2.4 Myr from whole-core magnetic susceptibility measurements, Nature, 342, 897–900, 1989.
Bloemsma, M. R.: Development of a Modelling Framework for Core Data Integration using XRF Scanning, Delft University of Technology, 229 pp., https://doi.org/10.4233/uuid:95a90787-edc7-4f1f-9e6a-b2453effabdb, 2015.
Böhm, E., Lippold, J., Gutjahr, M., Frank, M., Blaser, P., Antz, B., Fohlmeister, J., Frank, N., Andersen, M., and Deininger, M.: Strong and deep Atlantic meridional overturning circulation during the last glacial cycle, Nature, 517, 73–76, 2015.
Bosmans, J. H. C., Drijfhout, S., Tuenter, E., Hilgen, F. J., and Lourens, L. J.: Response of the North African summer monsoon to precession and obliquity forcings in the EC-Earth GCM, Clim. Dynam., 44, 279–297, 2015a.
Bosmans, J. H. C., Hilgen, F. J., Tuenter, E., and Lourens, L. J.: Obliquity forcing of low-latitude climate, Clim. Past, 11, 1335–1346, https://doi.org/10.5194/cp-11-1335-2015, 2015b.
Chalk, T. B., Hain, M. P., Foster, G. L., Rohling, E. J., Sexton, P. F., Badger, M. P., Cherry, S. G., Hasenfratz, A. P., Haug, G. H., and Jaccard, S. L.: Causes of ice age intensification across the Mid-Pleistocene Transition, P. Natl. Acad. Sci. USA, 114, 13114–13119, 2017.
Clark, P. U., Archer, D., Pollard, D., Blum, J. D., Rial, J. A., Brovkin, V., Mix, A. C., Pisias, N. G., and Roy, M.: The middle Pleistocene transition: characteristics, mechanisms, and implications for long-term changes in atmospheric pCO2, Quaternary Sci. Rev., 25, 3150–3184, 2006.
Croudace, I. W. and Rothwell, R. G.: Micro-XRF Studies of Sediment Cores: Applications of a Non-Destructive Tool for the Environmental Sciences, Springer, Dordrecht, https://doi.org/10.1007/978-94-017-9849-5, 656 pp., 2015.
de Boer, B., Peters, M., and Lourens, L. J.: The transient impact of the African monsoon on Plio-Pleistocene Mediterranean sediments, Clim. Past, 17, 331–344, https://doi.org/10.5194/cp-17-331-2021, 2021.
De Lange, G. J., Thomson, J., Reitz, A., Slomp, C. P., Speranza Principato, M., Erba, E., and Corselli, C.: Synchronous basin-wide formation and redox-controlled preservation of a Mediterranean sapropel, Nat. Geosci., 1, 606–610, 2008.
deMenocal, P. B.: Plio-Pleistocene African climate, Science, 270, 53–59, 1995.
deMenocal, P. B.: African climate change and faunal evolution during the Pliocene–Pleistocene, Earth Planet. Sci. Lett., 220, 3–24, 2004.
deMenocal, P. B.: Climate and human evolution, Science, 331, 540–542, 2011.
Donges, J. F., Donner, R. V., Trauth, M. H., Marwan, N., Schellnhuber, H. -J., and Kurths, J.: Nonlinear detection of paleoclimate-variability transitions possibly related to human evolution, P. Natl. Acad. Sci. USA, 108, 20422–20427, 2011.
Ford, H. L. and Raymo, M.: Regional and global signals in seawater δ18O records across the mid-Pleistocene transition, Geology, 48, 113–117, 2020.
Grant, K. M., Grimm, R., Mikolajewicz, U., Marino, G., Ziegler, M., and Rohling, E. J.: The timing of Mediterranean sapropel deposition relative to insolation, sea-level and African monsoon changes, Quaternary Sci. Rev., 140, 125–141, 2016.
Grant, K. M., Rohling, E. J., Westerhold, T., Zabel, M., Heslop, D., Konijnendijk, T., and Lourens, L. J.: A 3 million year index for North African humidity/aridity and the implication of potential pan-African Humid periods, Quaternary Sci. Rev., 171, 100–118, 2017.
Grant, K. M., Amarathunga, U., Amies, J. D., Hu, P. X., Qian, Y., Penny, T., Rodríguez-Sanz, L., Zhao, X., Heslop, D., Liebrand, D., Hennekam, R., Westerhold, T., Gilmore, S., Lourens, L. J., Roberts, A. P., and Rohling, E. J.: Organic carbon burial in Mediterranean sapropels intensified during Green Sahara Periods since 3.2 Myr ago, Commun. Earth Environ., 3, 1–9, https://doi.org/10.1038/s43247-021-00339-9, 2022a.
Grant, K. M., Amarathunga, U., Amies, J., Hu, P., Qian, Y., Penny, T., Rodriguez-Sanz, L., Zhao, X., Heslop, D., Liebrand, D., Hennekam, R., Westerhold, T., Gilmore, S., Lourens, L. J., Roberts, A., and Rohling, E. J.: Plio-Pleistocene scanning XRF, stable isotope, and environmental magnetic data from ODP Site 967, Pangaea [data set], https://doi.org/10.1594/PANGAEA.939929, 2022b.
Groucutt, H. S., Petraglia, M. D., Bailey, G., Scerri, E. M., Parton, A., Clark-Balzan, L., Jennings, R. P., Lewis, L., Blinkhorn, J., and Drake, N. A.: Rethinking the dispersal of Homo sapiens out of Africa, Evolutionary Anthropology: Issues, News, and Reviews, 24, 149–164, 2015.
Hammer, Ø., Harper, D. A. T., and Ryan, P. D.: Past: Paleontological statistics software package for education and data analysis, Palaeontol. Electro., 4, 1–9, 2001.
Häuselmann, A. D., Fleitmann, D., Cheng, H., Tabersky, D., Günther, D., and Edwards, R. L.: Timing and nature of the penultimate deglaciation in a high alpine stalagmite from Switzerland, Quaternary Sci. Rev., 126, 264–275, 2015.
Hodell, D., Channell, J. E. T., Curtis, J. H., Romero, O., and Röhl, U.: Onset of “Hudson Strait” Heinrich events in the eastern North Atlantic at the end of the middle Pleistocene transition (640 ka)?, Paleoceanography, 23, PA001591, https://doi.org/10.1029/2008PA001591, 2008.
Jansen, J. H. F., Van der Gaast, S. J., Koster, B., and Vaars, A. J.: CORTEX, a shipboard XRF-scanner for element analyses in split sediment cores, Mar. Geol., 151, 143–153, 1998.
Kaboth-Bahr, S., Gosling, W. D., Vogelsang, R., Bahr, A., Scerri, E. M., Asrat, A., Cohen, A. S., Düsing, W., Foerster, V., Lamb, H. F., Maslin, M. A., Roberts, H. M., Schäbitz, F., and Trauth, M. H.: Paleo-ENSO influence on African environments and early modern humans, P. Natl. Acad. Sci. USA, 118, e2018277118, https://doi.org/10.1073/pnas.2018277118, 2021.
Killick, R., Fearnhead, O., and Eckley, I. A.: Optimal detection of changepoints with a linear computational cost, J. Am. Stat. Assoc., 107, 1590–1598, 2012.
Konijnendijk, T. Y. M., Ziegler, M., and Lourens, L. J.: Chronological constraints on Pleistocene sapropel depositions from high-resolution geochemical records of ODP Sites 967 and 968, Newslett. Strat., 47, 263–282, Schweizbart Science Publisher, https://doi.org/10.1127/0078-0421/2014/0047, 2014a.
Konijnendijk, T. Y. M., Ziegler, M., and Lourens, L. J.: High-resolution elemental concentration measurements of ODP Sites 160-967 and 160-968, Pangaea [data set], https://doi.org/10.1594/PANGAEA.831712, 2014b.
Konijnendijk, T., Ziegler, M., and Lourens, L. J.: On the timing and forcing mechanisms of late Pleistocene glacial terminations: Insights from a new high-resolution benthic stable oxygen isotope record of the eastern Mediterranean, Quaternary Sci. Rev., 129, 308–320, 2015.
Larrasoaña, J. C., Roberts, A. P., Rohling, E. J., Winklhofer, M., and Wehausen, R.: Three million years of monsoon variability over the northern Sahara, Clim. Dynam., 21, 689–698, 2003.
Larrasoaña, J. C., Roberts, A. P., and Rohling, E. J.: Dynamics of green Sahara periods and their role in hominin evolution, Plos One, 8, e76514, https://doi.org/10.1371/journal.pone.0076514, 2013.
Larrasoaña, J. C.: A review of West African monsoon penetration during Green Sahara periods; implications for human evolution and dispersals over the last three million years, Oxford Open Climate Change, 1, kgab011, https://doi.org/10.1093/oxfclm/kgab011, 2021.
Lisiecki, L. E. and Raymo, M. E.: A Pliocene-Pleistocene stack of 57 globally distributed benthic δ18O records, Paleoceanography, 20, PA1003, https://doi.org/10.1029/2004PA001071, 2005.
Lourens, L. J. and Reichart, G.-J.: Low-latitude forcing of glacial cycles, Reichart, G.-J., PhD thesis, Geologica Ultraiectina, 154, 153–168, 1996.
Lourens, L. J., Antonarakou, A., Hilgen, F. J., van Hoof, A. A. M., Vergnaud-Grazzini, C., and Zachariasse, W. J.: Evaluation of the Plio-Pleistocene astronomical timescale, Paleoceanography, 11, 391–413, 1996.
Lourens, L. J., Wehausen, R., and Brumsack, H. J.: Geological constraints on tidal dissipation and dynamical ellipticity of the Earth over the past three million years, Nature, 409, 1029–1033, 2001.
Lourens, L. J., Becker, J., Bintanja, R., Hilgen, F. J., Tuenter, E., Van de Wal, R. S., and Ziegler, M.: Linear and non-linear response of late Neogene glacial cycles to obliquity forcing and implications for the Milankovitch theory, Quaternary Sci. Rev., 29, 352–365, 2010.
Marino, G., Rohling, E. J., Rodriguez-Sanz, L., Grant, K. M., Heslop, D., Roberts, A. P., Stanford, J. D., and Yu, J.: Bipolar seesaw control on last interglacial sea level, Nature, 522, 197–201, 2015.
Maslin, M. A., Brierley, C. M., Milner, A. M., Shultz, S., Trauth, M. H., and Wilson, K. E.: East African climate pulses and early human evolution, Quaternary Sci. Rev., 101, 1–17, 2014.
Menviel, L., Govin, A., Avenas, A., Meissner, K. J., Grant, K. M., and Tzedakis, P. C.: Drivers of the evolution and amplitude of African Humid Periods, Commun. Earth Environ., 2, 1–11, 2021.
Mudelsee, M. and Raymo, M. E.: Slow dynamics of the Northern Hemisphere glaciation, Paleoceanography, 20, PA4022, https://doi.org/10.1029/2005PA001153, 2005.
O'Mara, N. A., Skonieczny, C., McGee, D., Winckler, G., Bory, A. J. M., Bradtmiller, L. I., Malaizé, B., and Polissar, P. J.: Pleistocene drivers of Northwest African hydroclimate and vegetation, Nat. Commun., 13, 3552, https://doi.org/10.1038/s41467-022-31120-x, 2022.
Paillard, D., Labeyrie, L., and Yiou, P.: Macintosh Program performs time-series analysis, Eos Trans. Am. Geophys. Union, 77, 379–379, 1996.
Potts, P. J. and Webb, P. C.: X-ray fluorescence spectrometry, in: Geoanalysis, edited by: Hall, G. E. M., J. Geochem. Ex., 44, 251–296, 1992.
Potts, P. J., Williams-Thorpe, O., and Webb, P. C.: The bulk analysis of silicate rocks by portable X-ray fluorescence: Effect of sample mineralogy in relation to the size of the excited volume, Geostand. Geoanalyt. Res., 21, 29–41, 1997.
Potts, R., Dommain, R., Moerman, J. W., Behrensmeyer, A. K., Deino, A. L., Riedl, S., Beverly, E. J., Brown, E. T., Deocampo, D., and Kinyanjui, R.: Increased ecological resource variability during a critical transition in hominin evolution, Sci. Adv., 6, eabc8975, https://doi.org/10.1126/sciadv.abc8975, 2020.
Rohling, E. J. and Gieskes, W. W. C.: Late Quaternary changes in Mediterranean Intermediate Water density and formation rate, Paleoceanography, 4, 531–545, 1989.
Rohling, E. J., Grant, K. M., Roberts, A. P., and Larrasoaña, J. C.: Paleoclimate variability in the Mediterranean and Red Sea regions during the last 500,000 years: implications for hominin migrations, Curr. Anthropol., 54, S183–S201, 2013.
Rohling, E. J., Marino, G., and Grant, K. M.: Mediterranean climate and oceanography, and the periodic development of anoxic events (sapropels), Earth-Sci. Rev., 143, 62–97, 2015.
Rohling, E. J., Yu, J., Heslop, D., Foster, G. L., Opdyke, B., and Roberts, A. P.: Sea level and deep-sea temperature reconstructions suggest quasi-stable states and critical transitions over the past 40 million years, Sci. Adv., 7, eabf5326, https://doi.org/10.1126/sciadv.abf5326, 2021.
Shackleton, N. J., Backman, J., Zimmerman, H., Kent, D. V., Hall, M. A., Roberts, D. G., Schnitker, D., Baldauf, J. G., Desprairies, A., Homrighausen, R., Huddlestun, P., Keene, J. B., Kaltenback, A. J., Krumsiek, K. A. O., Morton, A. C., Murray, J. W., and Westberg-Smith, J.: Oxygen isotope calibration of the onset of ice-rafting and history of glaciation in the North Atlantic region, Nature, 307, 620–623, 1984.
Tiedemann, R., Sarnthein, M., and Shackleton, N. J.: Astronomic timescale for the Pliocene Atlantic δ18O and dust flux records of Ocean Drilling Program Site 659, Paleoceanography, 9, 619–638, 1994.
Torrence, C. and Compo, G. P.: A practical guide to wavelet analysis, B. Am. Meteorol. Soc., 79, 61–78, 1998.
Trauth, M. H., Larrasoaña, J. C., and Mudelsee, M.: Trends, rhythms and events in Plio-Pleistocene African climate, Quaternary Sci. Rev., 28, 399–411, 2009.
Trauth, M. H., Asrat, A., Berner, N., Bibi, F., Foerster, V., Grove, M., Kaboth-Bahr, S., Maslin, M.A., Mudelsee, M., and Schäbitz, F.: Northern Hemisphere Glaciation, African climate and human evolution, Quaternary Sci. Rev., 268, 107095, https://doi.org/10.1016/j.quascirev.2021.107095, 2021.
Wehausen, R. and Brumsack, H. J.: Chemical cycles in Pliocene sapropel-bearing and sapropel-barren eastern Mediterranean sediments, Palaeogeogr. Palaeoclimatol. Palaeoecol., 158, 325–352, 2000.
Weltje, G. J., Bloemsma, M. R., Tjallingii, R., Heslop, D., Röhl, U., and Croudace, I. W.: Prediction of geochemical composition from XRF core scanner data: A new multivariate approach including automatic selection of calibration samples and quantification of uncertainties, Micro-XRF Studies of Sediment Cores, 507–534, 2015.
Westerhold, T., Marwan, N., Drury, A. J., Liebrand, D., Agnini, C., Anagnostou, E., Barnet, J. S., Bohaty, S. M., Vleeschouwer, D., Frederichs, T., Hodell, D. A., Holbourn, A. E., Kroon, D., Lauretano, V., Littler, K., Lourens, L. J., Lyle, M., Pälike, H., Röhl, U., Tian, J., Wilkens, R. H., Wilson, P. A., and Zachos, J. C.: An astronomically dated record of Earth's climate and its predictability over the last 66 million years, Science, 369, 1383–1387, 2020.
Wilhelms-Dick, D., Westerhold, T., Röhl, U., Wilhelms, F., Vogt, C., Hanebuth, T. J. J., Römmermann, H., Kriews, M., and Kasten, S.: A comparison of mm scale resolution techniques for element analysis in sediment cores, J. Analyt. Atom. Spectro., 27, 1574–1584, 2012.
Williams, M., Talbot, M., Aharon, P., Abdl Salaam, Y., Williams, F., and Inge Brendeland, K.: Abrupt return of the summer monsoon 15,000 years ago: New supporting evidence from the lower White Nile valley and Lake Albert, Quaternary Sci. Rev., 25, 2651–2665, 2006.
Zhan, X.: Application of polarized EDXRF in geochemical sample analysis and comparison with WDXRF, X-Ray Spectrometry, 34, 207–212, 2005.