the Creative Commons Attribution 4.0 License.
the Creative Commons Attribution 4.0 License.
 | 09 Nov 2022
Wet season rainfall characteristics and temporal changes for Cape Town, South Africa, 1841–2018
Nothabo Elizabeth Ndebele
Stefan Grab
Herbert Hove
Wet seasons may be characterized by the frequency of wet–dry days, duration of wet–dry spells and season length. These properties are investigated for Cape Town using rainfall data from four weather stations in the Cape Town metropolitan area located at the South African Astronomical Observatory (SAAO), Maitland, Kirstenbosch and Cape Town International airport. The primary focus is on the long SAAO daily rainfall record dating back to 1841, with the specific aim to statistically assess attributes of the wet season (April to October) and its temporal variability over the period 1841–2018. The decade 1950–1959 had significantly high frequencies of wet days, but there was a subsequent significant decline in wet days at the SAAO (−1 d per decade) and Maitland (−1.1 d per decade) during the period 1950–2018. A significant decline in wet days also occurred at the SAAO between 1880 and 1940 (−3.3 d per decade, p=0.005). Dry spells longer than 5 d have become more prevalent since the beginning of the 20th century. A rain-based definition for the onset and termination of the wet season is presented using 5 d running sums and pentad means; these were applied to each year containing adequate daily data, so as to track changes during the wet season. We identify a recent decadal decline in mean wet season length (−1.4 d per decade) since ca. 1940, particularly between 1941–1994 (−4.2 d per decade), such that wet seasons since 2000 have only averaged 182 d in length while the long-term (1841–2018) average is 188 d. This decline is attributed to an increased incidence of late onsets (after 15 April) and early terminations (earlier than 18 October) of the wet season, or a combination of both, particularly since the year 2000. Interannual variability in wet season characteristics is associated with solar (sunspot) cycles and fluctuations in the Southern Oscillation Index and Southern Annular Mode.
- Article
(14167 KB) - Full-text XML
-
Supplement
(868 KB) - BibTeX
- EndNote


Temporal characteristics of seasonal rainfall vary across regions and climates of the world (Knoben et al., 2019). In Africa, wet seasons are either unimodal (concentrated over only one peak rainfall period per 12-month cycle, e.g. southern Africa) or bimodal (two temporally separated wet seasons per 12-month cycle, e.g. south coast of South Africa and large parts of east and west Africa) (Camberlin et al., 2009; Amekudzi et al., 2015). Understanding the nature and potential changes to such wet seasons is important to several sectors, most particularly agriculture, water resource planning and health (Hachigonta et al., 2008; Singh and Ranade, 2010). To this end, considerable scientific interest has focused on establishing the onset and termination dates of the annual wet season(s) and how these may have changed over recent decades (e.g. Mupangwa et al., 2011; Owusu and Waylen, 2013; Oguntunde et al., 2014; Obarein and Amanambu, 2019; Giráldez et al., 2020), or might change in future through climate modelling projections (e.g. Kusunoki et al., 2011; Sarr, 2012; Saeed et al., 2018). Defining seasonal rainfall onset–termination dates depends on location, climate and the study purpose; hence defining attributes have been variable across disciplines (climatology, hydrology, agronomy) and regions. Rainfall-based variables are most commonly used to determine rainfall onset–termination dates; these include the number of wet days, rainfall amounts (mm) and wet–dry spells (days) (e.g. Hachigonta et al., 2008; Ngetich et al., 2014). However, in some instances, other variables such as temperature, wind and humidity have also been used to compute potential evapotranspiration and soil water balance, particularly to help determine suitable rainfall thresholds required for specific crop growth (Mugalavai et al., 2008; Moron and Robertson, 2014).
Establishing wet season length usually requires rainfall-based empirical methods. For instance, Boyard-Micheau et al. (2013) determine the rainfall onset date in Kenya and northern Tanzania based on the first wet day of N consecutive days, receiving a minimum of P mm of rain, without a dry spell lasting more than Nd number of days, and additionally specify a minimum Pmin value for subsequent days. Each of these parameter values is determined empirically to address a set of requirements, most typically associated with crop growth. So for example, understanding the rainfall requirements for maize to germinate and grow has helped establish an appropriate onset date, based on a threshold of 25 mm, but over a 10 d period followed by at least 20 mm over the subsequent 20 d (Tadross et al., 2005; Hachigonta et al., 2008). In this case, rainfall data were divided into pentads (5 d periods) so as to identify the pentad that best satisfied the criteria for maize growth (Tadross et al., 2005). The use of pentads is also common practice for identifying other characteristics of the wet season, such as wet season length (e.g. Hachigonta et al., 2008; Marengo et al., 2001; Byakatonda et al., 2018).
Alternative approaches to establish seasonal rainfall onset–termination dates include using the cumulative distribution of rainfall amounts (Nicholls, 1984; Amekudzi et al., 2015) or accumulated rainfall anomalies (Liebmann and Marengo, 2001; Camberlin et al., 2009; Liebmann et al., 2012; Dunning et al., 2016). Liebmann and Marengo (2001) delineate onset–termination dates by obtaining absolute minimum and maximum of annual accumulated anomalies, calculated by subtracting the long-term mean rainfall from the actual rainfall for each day of the year. This approach is less sensitive to those using specified thresholds and may thus be applied at local and regional scales. The method by Liebmann et al. (2012) has more recently been extended to accommodate regions that have two wet seasons per year, such as parts of west and east Africa (e.g. Dunning et al., 2016).
Also of importance is establishing rainfall characteristics (daily frequency, distribution, amount; wet and dry spells) during the wet season, as these may have an influence on crop production, biosystems, hydrology, etc. Wet–dry days are defined by either using a fixed value or using a parameter such as mean daily rainfall, for the area of interest. Given that the usual precision of rain gauges is 0.1 mm, at times this is taken to be the threshold value (e.g. Martin-Vide and Gomez, 1999). However, many prefer a 1 mm threshold to define a wet day given the assumption that an amount less than 1 mm is likely returned to the atmosphere through evapotranspiration (e.g. Kruger, 2006; Nastos and Zerefos, 2009; Froidurot and Diedhiou, 2017; Valdes-Abellan et al., 2017; Byakatonda et al., 2019). Most recently, Rivoire et al. (2019) argued that since evapotranspiration is a variable (depending on the season), a fixed threshold may not be suitable, particularly for the dry season. When a wet day threshold has been defined, wet–dry spells are identified as consecutive days of wet–dry days, and these may be used to further investigate rainfall characteristics.
Several previous studies have examined winter rainfall and attributes of the wet season over southernmost Africa (e.g. Reason et al., 2002; Reason and Rouault, 2005; Dieppois et al., 2016; du Plessis, 2017; Mahlalela et al., 2019). Identified associations between rainfall and climate modes such as the El Niño–Southern Oscillation (ENSO) and Southern Annular Mode (SAM) are now well established for the region (Tyson, 1981; Mason and Tyson, 1992; Reason and Rouault, 2002; Philippon et al., 2012). Variability in rainfall at interannual and decadal timescales is influenced by SAM in the winter rainfall region of South Africa (Reason and Rouault, 2005; Dieppois et al., 2016; Ndebele et al., 2020). Links between ENSO and rainfall are significant, with longer wet spells and higher rainfall associated with El Niño events (Philippon et al., 2012). The association of solar activity with rainfall and other climate variables has also been confirmed for the region (Dyer, 1975; Mason and Tyson, 1992; Ndebele et al., 2020). Using 20th century data, Mason and Tyson (1992) found that an increase in solar activity during the early part of the winter season (April to June) corresponded with higher precipitation over the winter rainfall region of South Africa. More recently, Ndebele et al. (2020) confirmed positive correlations between annual rainfall and solar activity at decadal timescales. Similar associations between rainfall and solar activity have been found for other regions globally (e.g. Laurenz et al., 2019; Nitka and Burnecki, 2019). When investigating solar activity and rainfall in Europe using data since 1900, Laurenz et al. (2019) observed correlations between rainfall and the 11-year solar cycle. After detecting significant correlations between solar activity and precipitation in the USA, Nitka and Burnecki (2019) found that precipitation forecasts improved when adding solar activity as a variable.
Despite previous scientific effort, to date, and to our knowledge, relatively few studies have investigated long-term (more than a century) wet season characteristics in Africa, despite its potential importance for ongoing and future agricultural planning at sub-regional scales. To this end, we use one of the world's longest single-station rainfall records (178 years), namely that of the South African Astronomical Observatory (SAAO) in Cape Town, South Africa, to statistically establish the nature and temporal changes of wet season characteristics through the period 1841–2018. The work expands on that recently describing the trends and variability of rainfall in Cape Town since 1841 (Ndebele et al., 2020). While the SAAO record is the primary focus of this paper given its long record and historic value, additional station records over the Cape Town metropolitan region are also analysed for imputation and comparative purposes. Specific objectives of the current paper include the quantification of wet season length, the occurrence of dry–wet spells and frequency of wet days and to establish the temporal variation in these attributes. Such rainfall characteristics for Cape Town, which previous studies have not yet examined, provide important long-term perspectives relevant to, in particular, agricultural production, hydrology and ecosystem functioning. In addition, given the considerable length of our dataset, we statistically test for any associations between these wet season rainfall characteristics and their potential drivers (i.e. El Niño–Southern Oscillation, Southern Annular Mode, and solar activity sunspots).
2.1 Site context
Cape Town is the second largest city in South Africa and has a coastal setting in the southwestern portion of the Western Cape province (Fig. 1). This region is characterized by a complex topography with mountain ranges exceeding 1000 m in elevation within a few kilometres of the coast but also includes the Cape Flats, a low-lying and flat relief bounded by the Atlantic Ocean on the southern and western sides and where Cape Town International Airport is located (Goodness and Anderson, 2013). The eastern side of the Cape Flats and False Bay also have mountain ranges which exceed 1500 m in some places. Cape Town has a Mediterranean climate with typically cool, wet austral winters (May–September) and dry, warm summers (Ndebele et al., 2020). According to Mahlalela et al. (2019), the southwestern and eastern coastal regions, and also some windward-facing mountain slopes, receive on average >500 mm of rainfall per year, yet parts of the SW Cape region, particularly northwards and inland of Cape Town, may receive as little as 200–400 mm per year. Rainfall quantity and distribution are thus highly variable and influenced by both topography and direction of rain-bearing weather systems. Rainfall over the southwestern Cape region is primarily associated with overpassing cold fronts connected to mid-latitude cyclones, but as much as 11 % may be owing to cut-off lows which occasionally bring exceptionally heavy rainfall (Abba Omar and Abiodun, 2020).
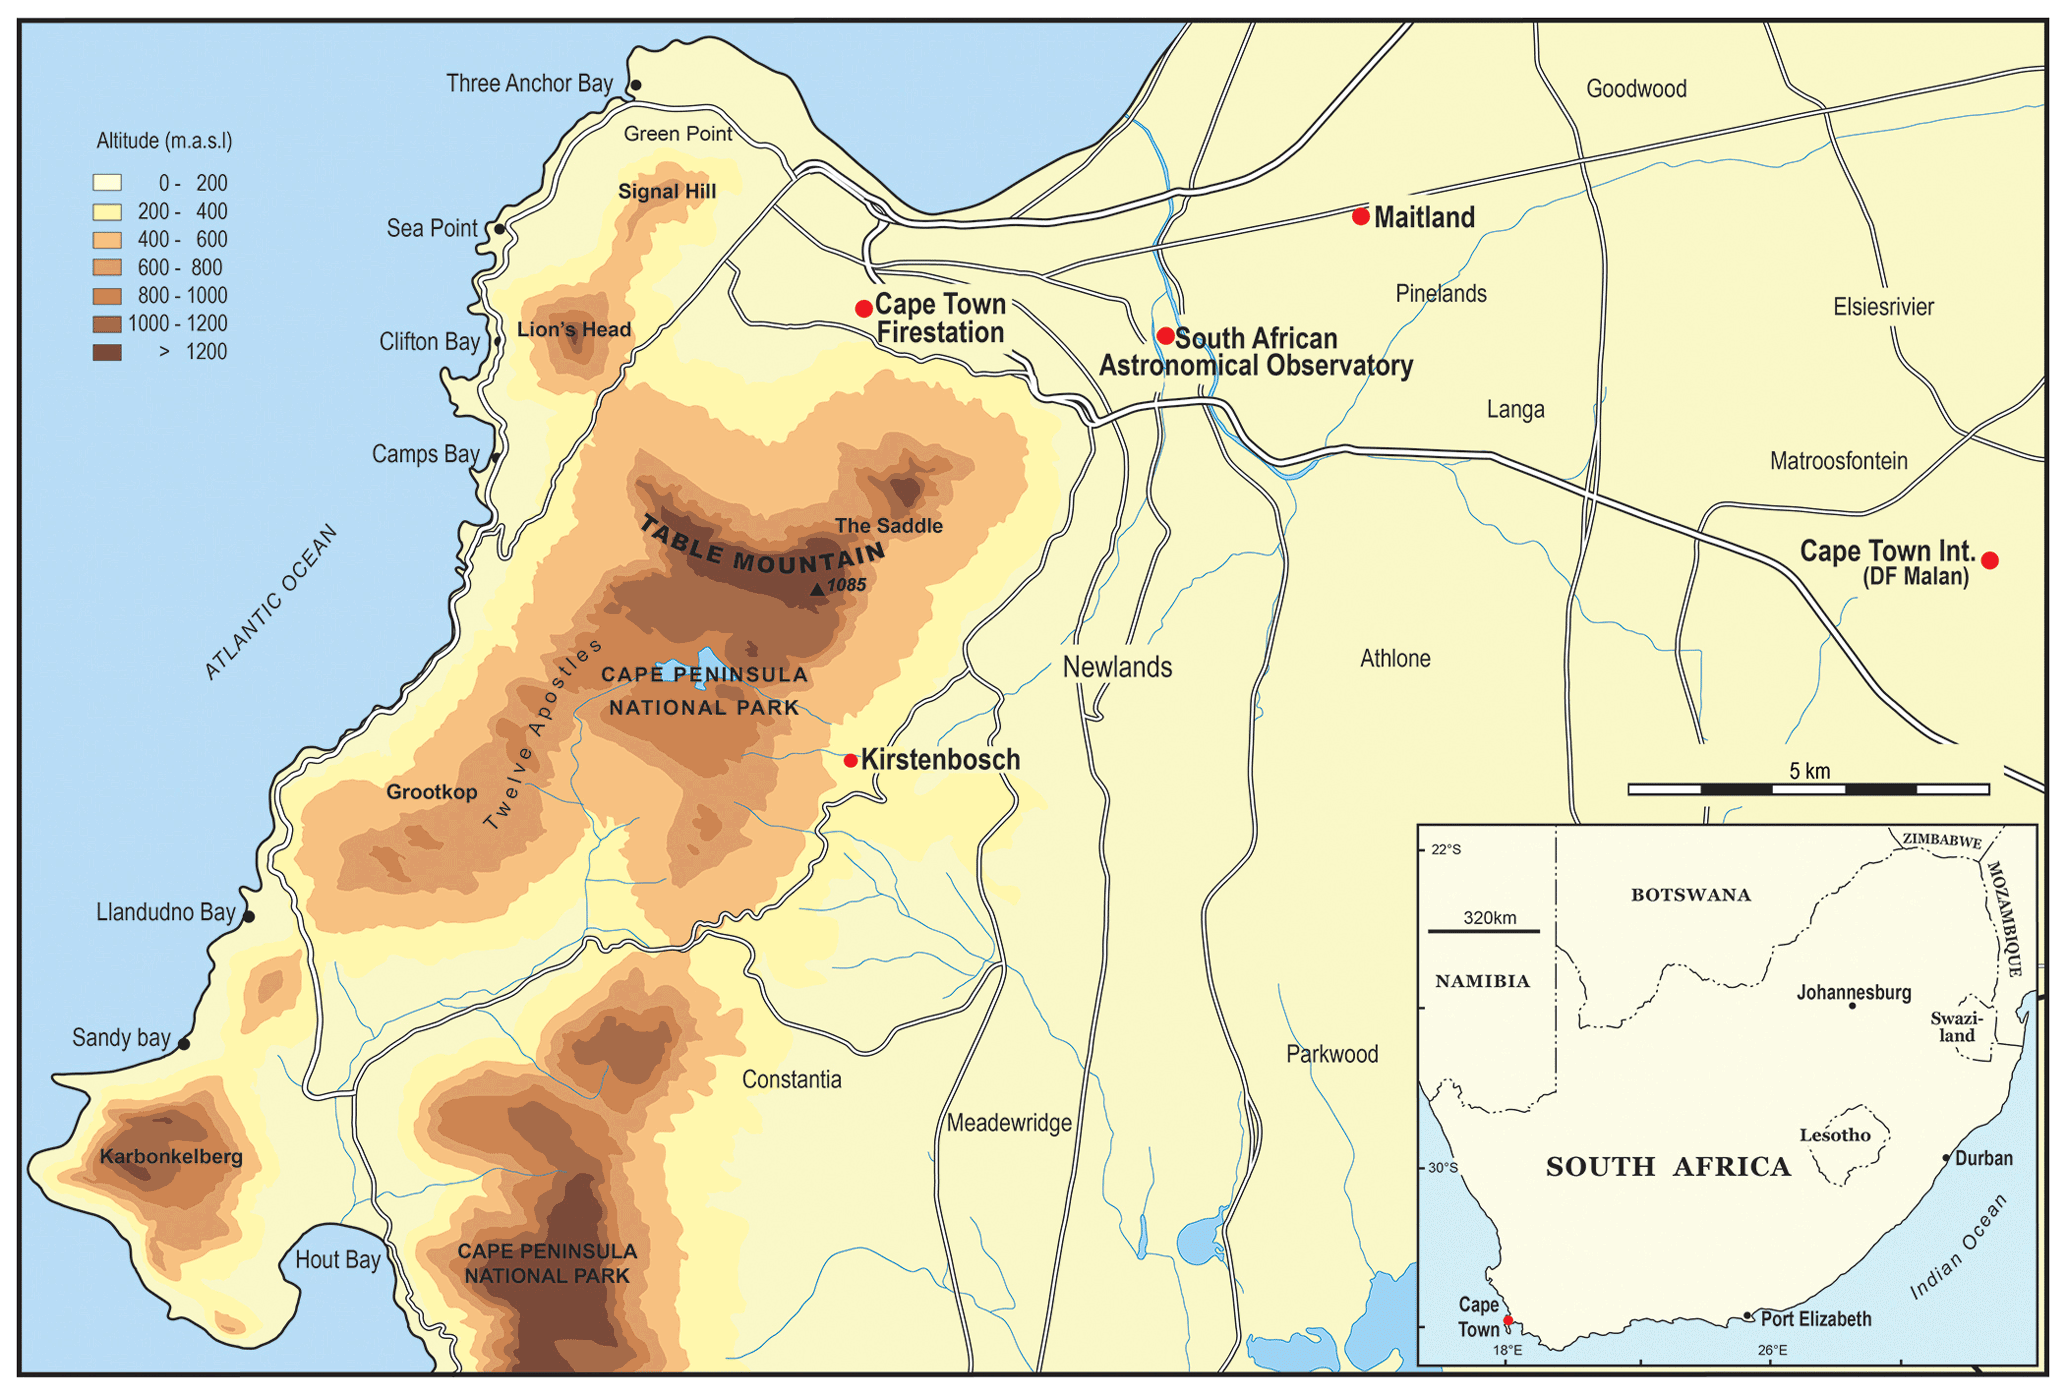
Figure 1Location of the SAAO and other stations in Cape Town, southwestern Cape of South Africa (Ndebele et al., 2020).
The Cape Town city centre is located between Table Mountain and Table Bay (Fig. 1). Rainfall stations selected for this study are all within 20 km of the city centre, and despite receiving variable rainfall amounts, they are influenced by a common rainfall seasonal regime and rain-bearing systems. Rainfall records from four weather stations across the Cape Town metropolitan region are investigated; these include Cape Town International Airport, Kirstenbosch, Maitland and the SAAO (Fig. 1). The SAAO, founded in 1820, is located ca. 5 km east of central Cape Town and ca. 2 km inland of Table Bay, on the eastern side of Table Mountain. Daily rainfall records began in January 1841 and continue to this day, making it the longest continuous single-station daily record in the Southern Hemisphere (Ndebele et al., 2020). Daily readings have been manually read from a rain gauge located in the gardens of the SAAO over the duration of this period. Given that our aim is to examine long-term (more than 1 century) rainfall changes, for which reliable data become largely unavailable with distance from central Cape Town, and because the nature of rainfall regimes changes over relatively small distances (few tens of kilometres) from this region, our focus of investigation is constrained to the Cape Peninsula only.
2.2 Data
As is often the case with early long-term instrumental weather registers, the SAAO record (1841–2018) has some data gaps, owing mainly to the absence of recordings over weekends and public holidays, and in some cases due to instrument failure or replacement. Although annual rainfall totals are available for all years, daily records are completely absent for the years 1878 and 1879. For the remainder of the record, missing daily rainfall values fall into two categories, namely days recorded as completely absent of data or as days (e.g. weekends and public holidays) absent of data but with an accumulated total rainfall value on a subsequent day. About 3.2 % of missing days have an accumulated value on a subsequent day, and only ca. 2 % of the record is completely missing. Changes in the rainfall recording practice and instruments used to record precipitation did not change much over the years and should thus not have any significant impact on our results. However, we note that missing but accumulated data have been more prevalent since the early 1960s. Methods of recording precipitation changed in the 2000s, from manually read rain gauges to digital gauges, which might account for slight (yet insignificant) differences in measured rainfall amounts in the most recent decades. For further comments on data quality and data cleaning, please refer to Ndebele et al. (2020). Imputation of missing values for the SAAO record was performed using data from neighbouring stations at Maitland (1906–2018), Kirstenbosch (1915–2018) and Cape Town International Airport (1950–2018) (Ndebele et al., 2020). The imputation involves a two-step approach enabling the estimation of wet days and rainfall amounts on those days. One method was applied to days with completely missing records, while a second method was applied to those with accumulated totals for each month separately as the frequency of wet days and daily rainfall amounts vary with each month (see Ndebele et al., 2020, for further details).
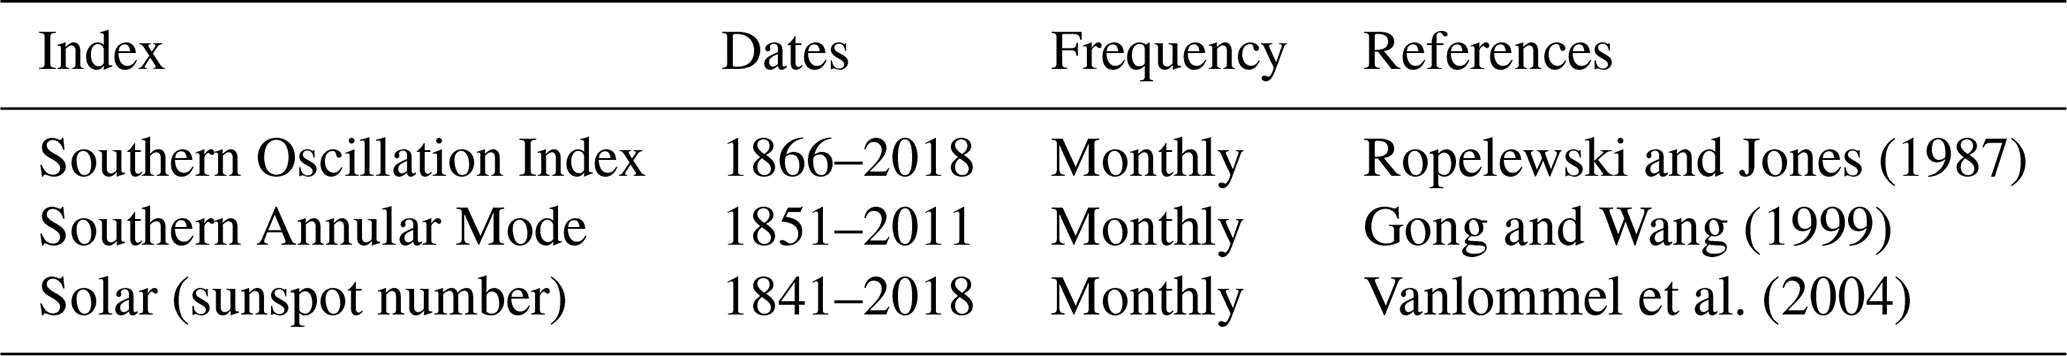
Data for the climate modes, including the Southern Oscillation Index (SOI; Ropelewski and Jones, 1987), Southern Annular Mode (SAM; Gong and Wang, 1999), and solar (sunspot number; Vanlommel et al., 2004), were used for examining associations with interannual variability in wet season characteristics. Data are available as either monthly or bimonthly indices for the periods 1866–2018 (SOI), 1851–2011 (SAM) and 1841–2018 (solar) (Table 1). Solar data are based on the sunspot number obtained from the Royal Observatory of Belgium in Brussels. The Twentieth Century Reanalysis version 2 (20CR.v2) was used to extend SAM back to 1851.
2.3 Defining rainfall variables and season length
Please refer to Table 2 for terms used to define rainfall variables and the wet season. In this paper, a “wet day” is defined as one having received ≥1 mm of rain (as per Camberlin et al., 2009; Singh and Ranade, 2010; Boyard-Micheau et al., 2013; Muthuwatta et al., 2017; Byakatonda et al., 2018). The number of years with complete daily data is represented by nd. The frequency of days with rainfall amounts >0 mm experienced on each calendar day (d ) over the complete years is given by . The frequency of wet days (≥1 mm) over the complete years is given by . These frequencies are used to estimate the probability of a wet day (>0 mm) and (>1 mm) calculated for each calendar day (Table 2). The average daily rainfall amount is calculated for each calendar day (), for each month () and for each year (). The long-term daily average is calculated using all days in the record and is represented by (Table 2).
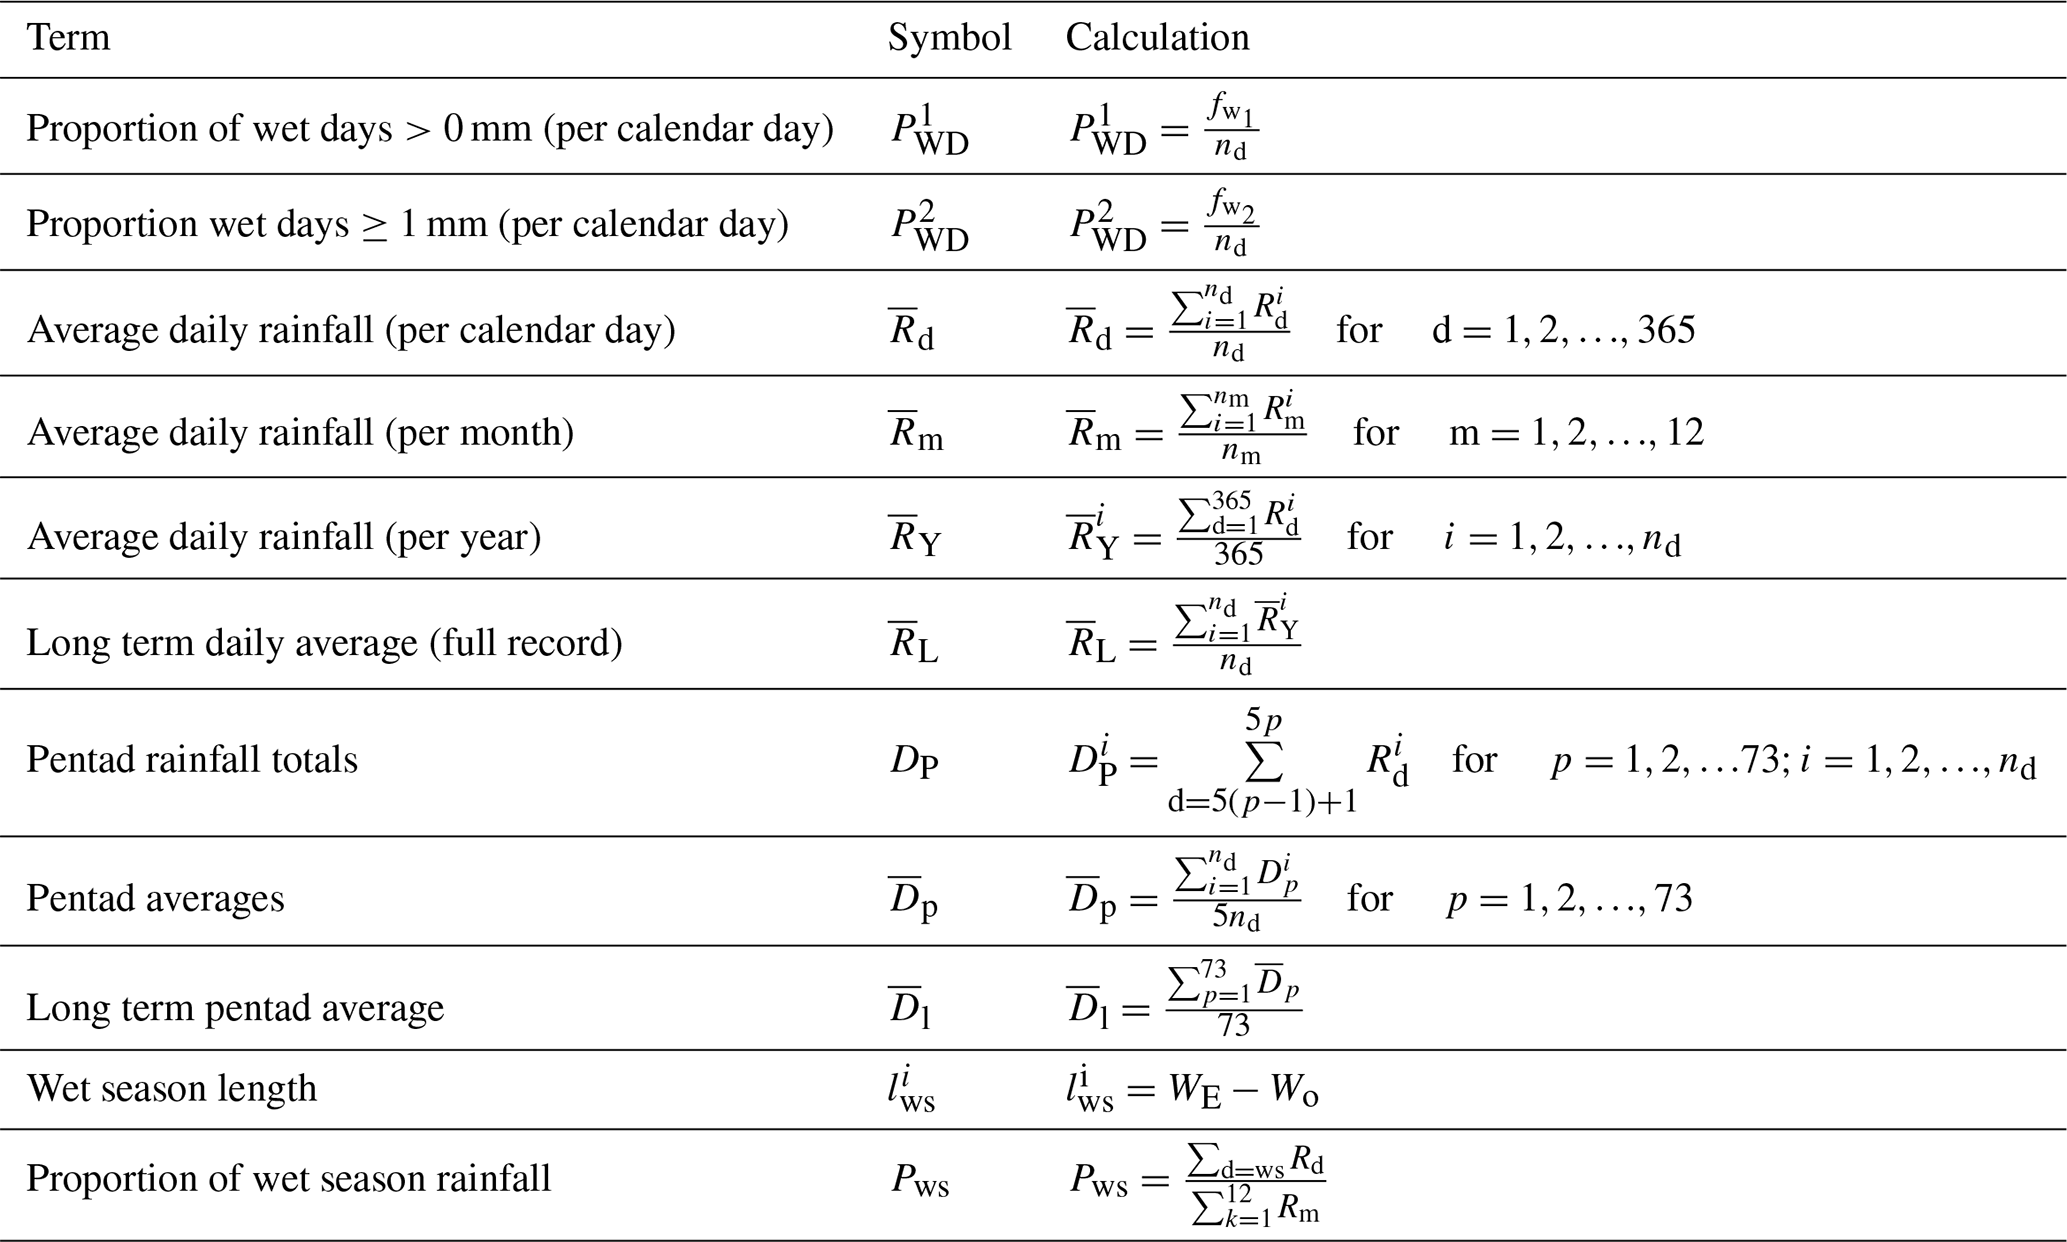
A wet (dry) spell is defined as a period of consecutive days with daily rainfall amounting to ≥1 mm (<1 mm) preceded and followed by a dry (wet) day during the wet season. The term “1 d spell” is used to refer to a wet (or dry) day preceded and followed by a dry (wet) day. On this basis, the following are established: (a) frequency of wet–dry spells, (b) amount of rainfall during wet spells, (c) duration and timing of spells, and (d) statistical distributions associated with the lengths of wet–dry spells.
Estimates of wet season onset–termination dates are obtained by applying a combination of methods including the sum of rainfall values over a 5 d period (pentads) (after Odekunle, 2004; Amekudzi et al., 2015) and by comparing with the long-term pentad average . Initially, data are divided into 73 non-overlapping pentads (5 d periods of consecutive days) over 365 d each year, starting on 1 January each year. In affected years, 29 February is not included and should not adversely impact results as this is a dry time of year. Average rainfall over a 5 d range () and long-term pentad average () are used to determine the lower and upper limits for wet season onset–termination dates.
For all the stations, days between pentad 19 (starting on Julian day 91) and pentad 61 (ending on Julian day 305), potentially represent the wet season (i.e. 1 April to 31 October). Specific rainfall onset dates (Wo) for a calendar year are defined as the first day that the 5 d running sum is above the long-term pentad average () occurring after Julian day 90. Rainfall termination dates (WE) are defined as the last day with a 5 d running sum above the long-term pentad average occurring before Julian day 306. The wet season (lws) length is then quantified on the basis of onset–termination dates. To confirm that the period between onset and termination dates actually encapsulates the majority of rainfall received in any given year, the accumulated rainfall during the defined wet season for that year is taken as a proportion of the annual rainfall for that year (Pws).
2.4 Statistical methods and tests
2.4.1 Mann–Kendall tests for trends
The Mann–Kendall test (Mann, 1945 and Kendall, 1948) is used to test the null hypothesis that there is no trend under the assumption that observations in a series are independent. Given a time series the following steps were undertaken:
where n is the number of data points in the time series ; and for j>i. The mean of S, E[S]=0 and the variance of S is given by
where q is the number of tied groups and tp is the number of data points in the pth group.
The test statistic is then calculated as follows:
The z statistic follows a standard normal distribution, and therefore if , the null is rejected and it is concluded that there is a trend present in the time series. Rainfall time series often exhibit serial correlation violating the assumptions of the test; thus adjustments have been made to the Mann–Kendall test statistic that allow for dependence in the observations. In this study, modifications include variance correction (Hamed and Rao, 1998), variance correction using lag-1 correlation (Yue and Wang, 2004), bias-corrected pre-whitening (Hamed, 2009) and a bootstrapped optional bias approach (Lacombe et al., 2012). The trend is considered to be significant if at least two of the tests have p values less than 5 % or 10 %. Details on these modifications are provided as the Supplement. A multi-temporal trend approach is used to trace the change in trend by considering test statistics, p values and Sen's slopes to measure trend over all possible sub-periods of lengths ranging from 30 to 100 years.
2.4.2 Bivariate wavelet analysis
Bivariate wavelet analysis may be used to test for joint periodicity of two time series. Assuming a continuous time series y(t), a wavelet function is defined as (Joshi et al., 2016)
where t is time, τ is the time step in which the window function is iterated and s is the wavelet scale (0, ∞). The chosen φ(ω) function must have a zero mean and be localized in both time and Fourier space. The cross-wavelet transform is given by the convolution of y(t), scaled and translated to give the function W(s,τ):
The cross-wavelet spectrum of two series y1(t) and y2(t) is defined as
where and are the continuous wavelet transforms of y1(t) and y2(t) respectively and ∗ denotes the complex conjugate. Two time series may also be analysed for wavelet coherence by the extraction of common periods of high power. This enables the identification of phase relationships between the two series. The wavelet coherence (R2) of two time series is defined as
where S is a smoothing operator and is analogous to a localized correlation coefficient in time–frequency space. The Morlet wavelet transform is recommended for cross-wavelet analysis (Grinsted et al., 2004). Relationships between the wet season variables (wet day frequencies, wet spells, dry spells, season onset and season length) and climate modes including SOI, SAM and the solar cycles (sunspots) were investigated using bivariate wavelet analysis. The time series were detrended to remove the effect of linear trend, and partial wavelet coherence (Ng and Chan, 2012) was calculated where there were correlations between the climate mode indices.
3.1 Overview of dry and wet season characteristics
Average rainfall during the wet season (April to October) ranges from 385 to 1085 mm yr−1 (Table 3) for the four stations, constituting on average 75 % of total annual rainfall. For the common period of 1950–2018, stations on average record 484 mm yr−1 at Maitland, 531 mm yr−1 at Cape Town International (CPT Int.), 608 mm yr−1 at the SAAO and 1422 mm yr−1 at Kirstenbosch. Such large spatial rainfall variability is a function of topographic influence. Although the SAAO wet season rainfall record is lower than the average across all stations (av =761 mm yr−1), it is closest to this average value. The number of wet season rain days averages 57.4 d for all stations over the period 1950–2018, while the SAAO records on average 55.6 rain days during this period and is thus relatively close to this average (Table 4). The dry summer months of November to March receive daily rainfall averaging below 0.7 mm d−1 at the SAAO, Maitland and CPT Int. and ca. 1.5 mm d−1 at Kirstenbosch. Consequently, there are many dry days (<1 mm) during the summer months with long dry spells at all stations. In contrast, the cooler seasons (April to October) receive on average ca. 2 mm d−1 at Maitland and CPT Int., 2.4 mm d−1 at the SAAO, and 5.6 mm d−1 at Kirstenbosch, usually peaking in June (Fig. 2).
Table 3Information on rainfall stations. The mean total annual rainfall for the rainfall series and mean seasonal rainfall (April–October) are presented for each station. R is the correlation between the observatory daily rainfall record and that for other stations over common recording periods.
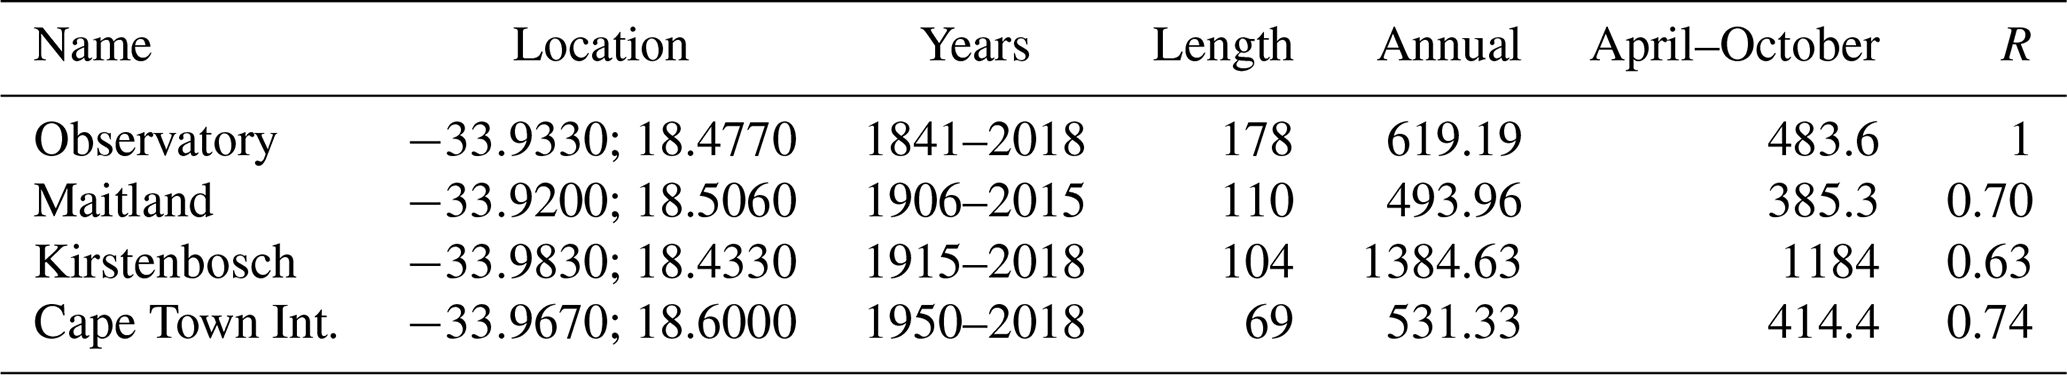
Table 4Wet day frequency (days) for various stations over the Cape Town metropolitan area. Significant (Sig) trends have Mann–Kendall (MK) test p values <0.10 (at 10 % significance level) and p values <0.05 (at 5 % significance level) for at least two of the modified MK tests.

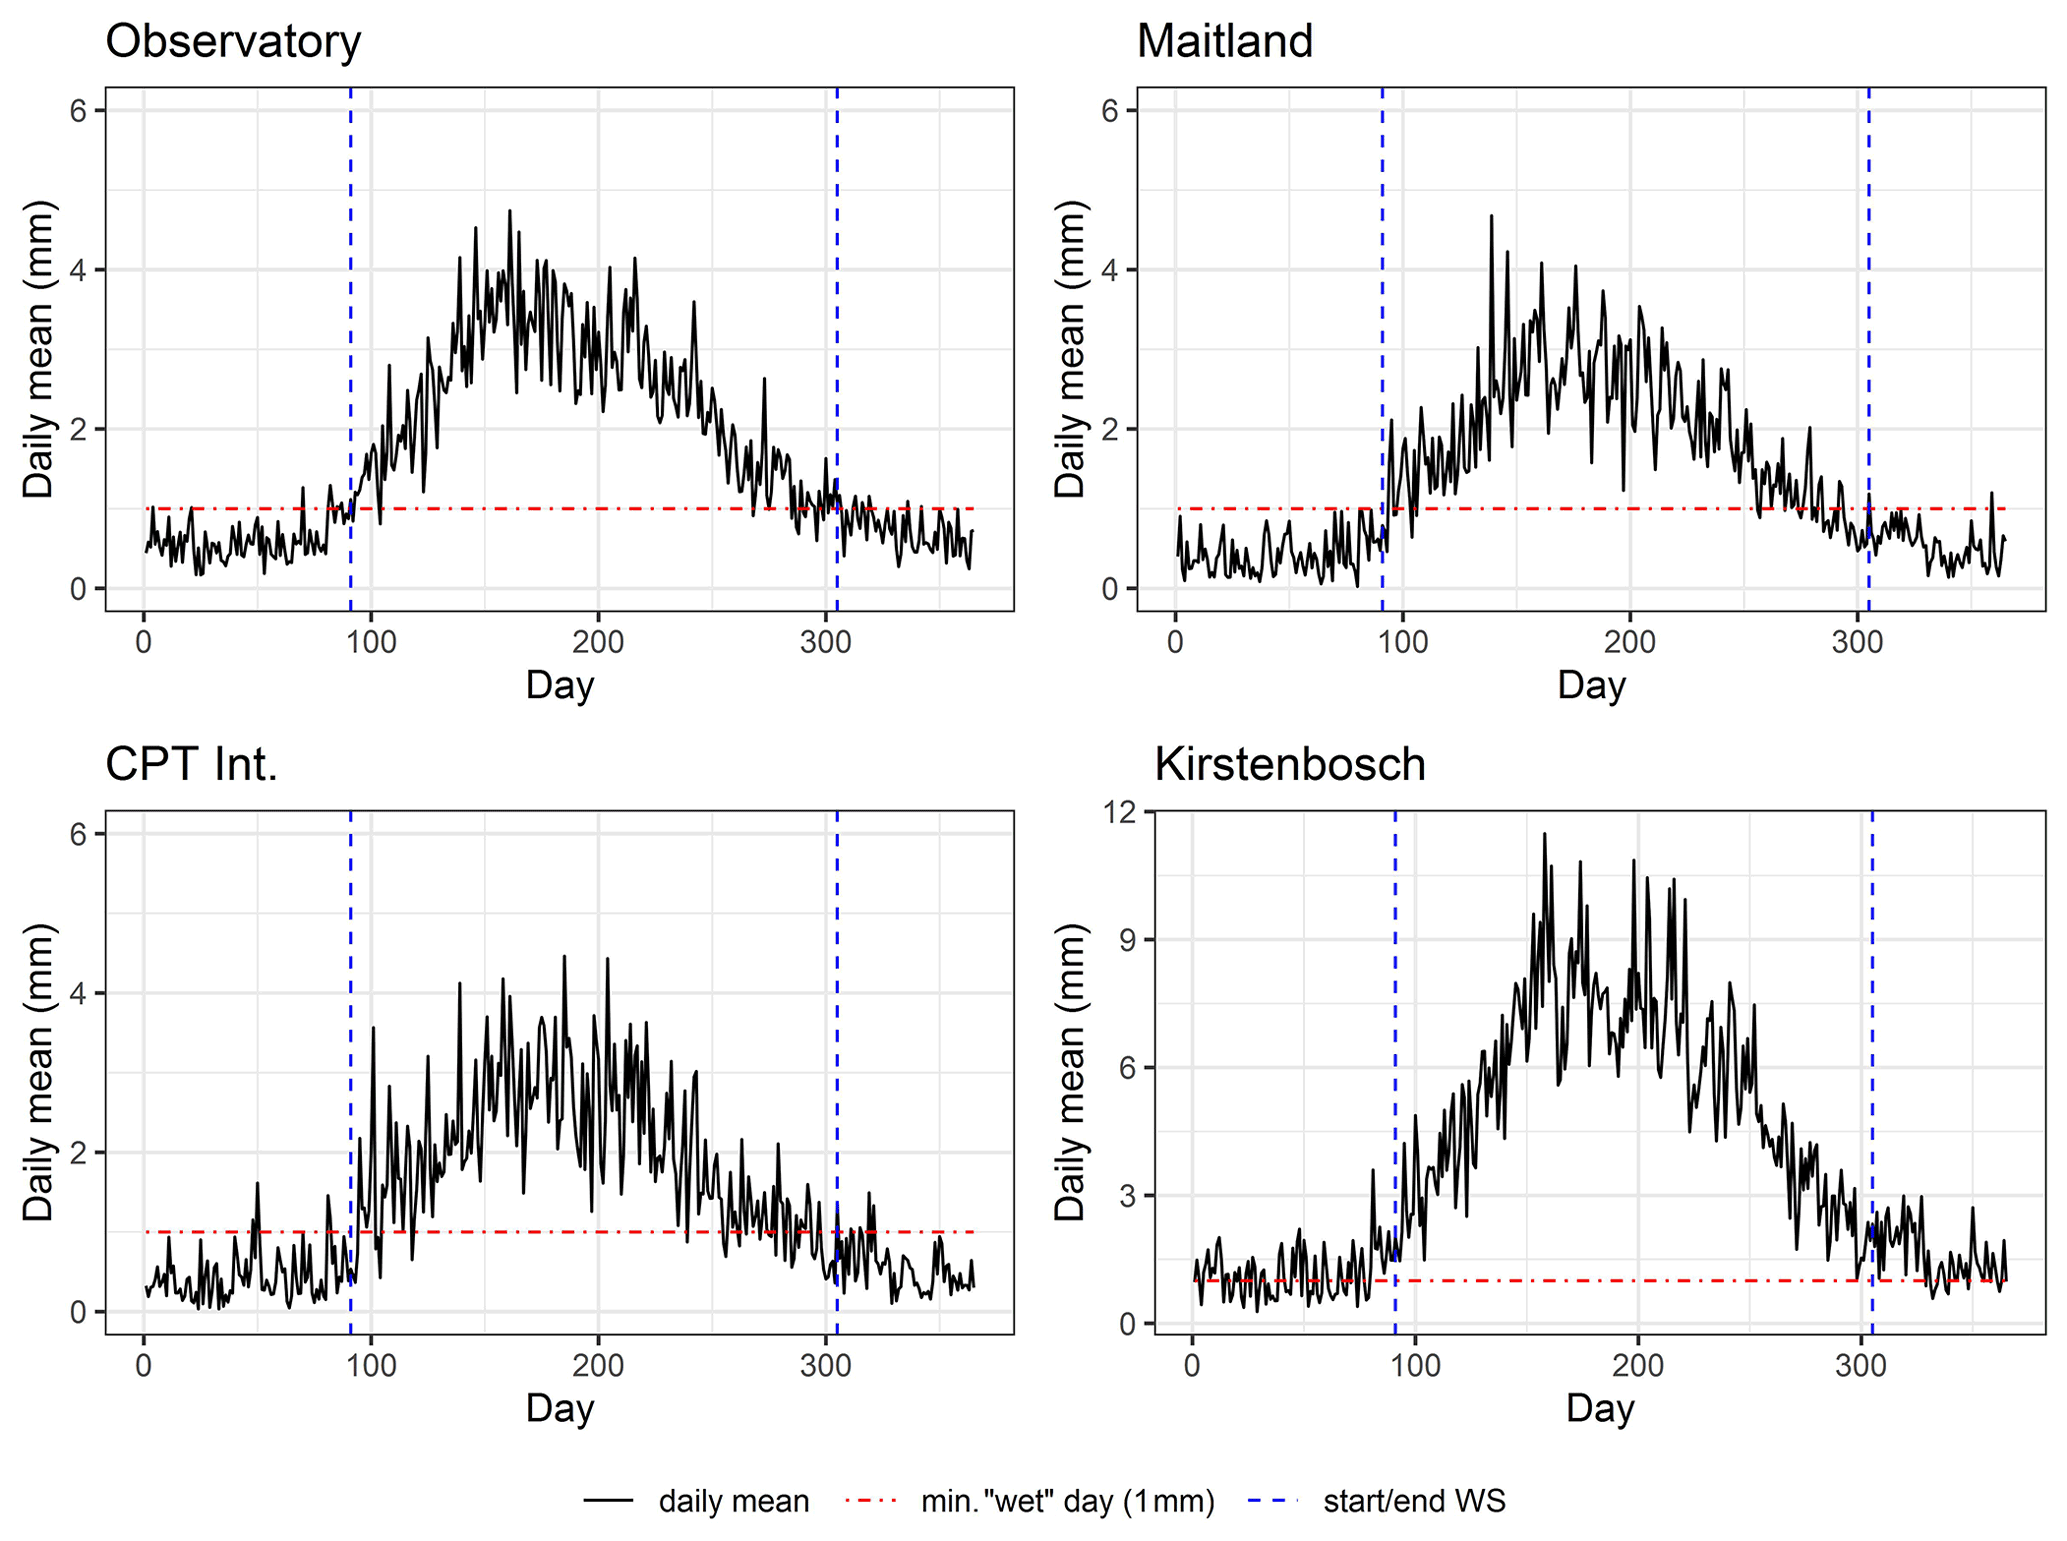
Figure 2Average daily mean for each Julian day calculated over the full record available at each station – SAAO (1841–2018), Maitland (1906–2018), Kirstenbosch (1915–2018) and Cape Town Int. (1950–2018). Day 91 (1 April) and day 305 (31 October) represented the start and end of the wet season (WS) respectively. The minimum for wet day (min. “wet” day) is 1 mm.
The number of wet days per annum (January to December), wet days for the wet season (April to October) and the proportion of wet days during the wet season, relative to the total annual number of wet days, are presented for available records in Fig. 3. Over the period 1841–2018, high frequencies of wet days are recorded for the late 19th century (SAAO) and during the 1940s and 1950s (all stations) (Table 4). In contrast, the period 1925–1940 records low frequencies of wet days (three stations). Mann–Kendall trend test results indicate a significant decline in the number of wet days during the wet season at the SAAO (by −0.2 d per decade over the period 1841–2018) and at Maitland (by −0.7 d per decade over the period 1906–2018) (Table 4). However, such declines are more pronounced in annual rain day records, which includes the dry season. The frequency of high-intensity rainfall (≥10 mm d−1) constitutes on average 5 % of days during a calendar year at the SAAO, Maitland and Cape Town Int. and 11.2 % of days at Kirstenbosch (see Fig. 3) for the lengths of the records available at each station. Below (above) average frequencies of high-intensity rainfall occurred in several years during the 1930s and 1970s (1950s).
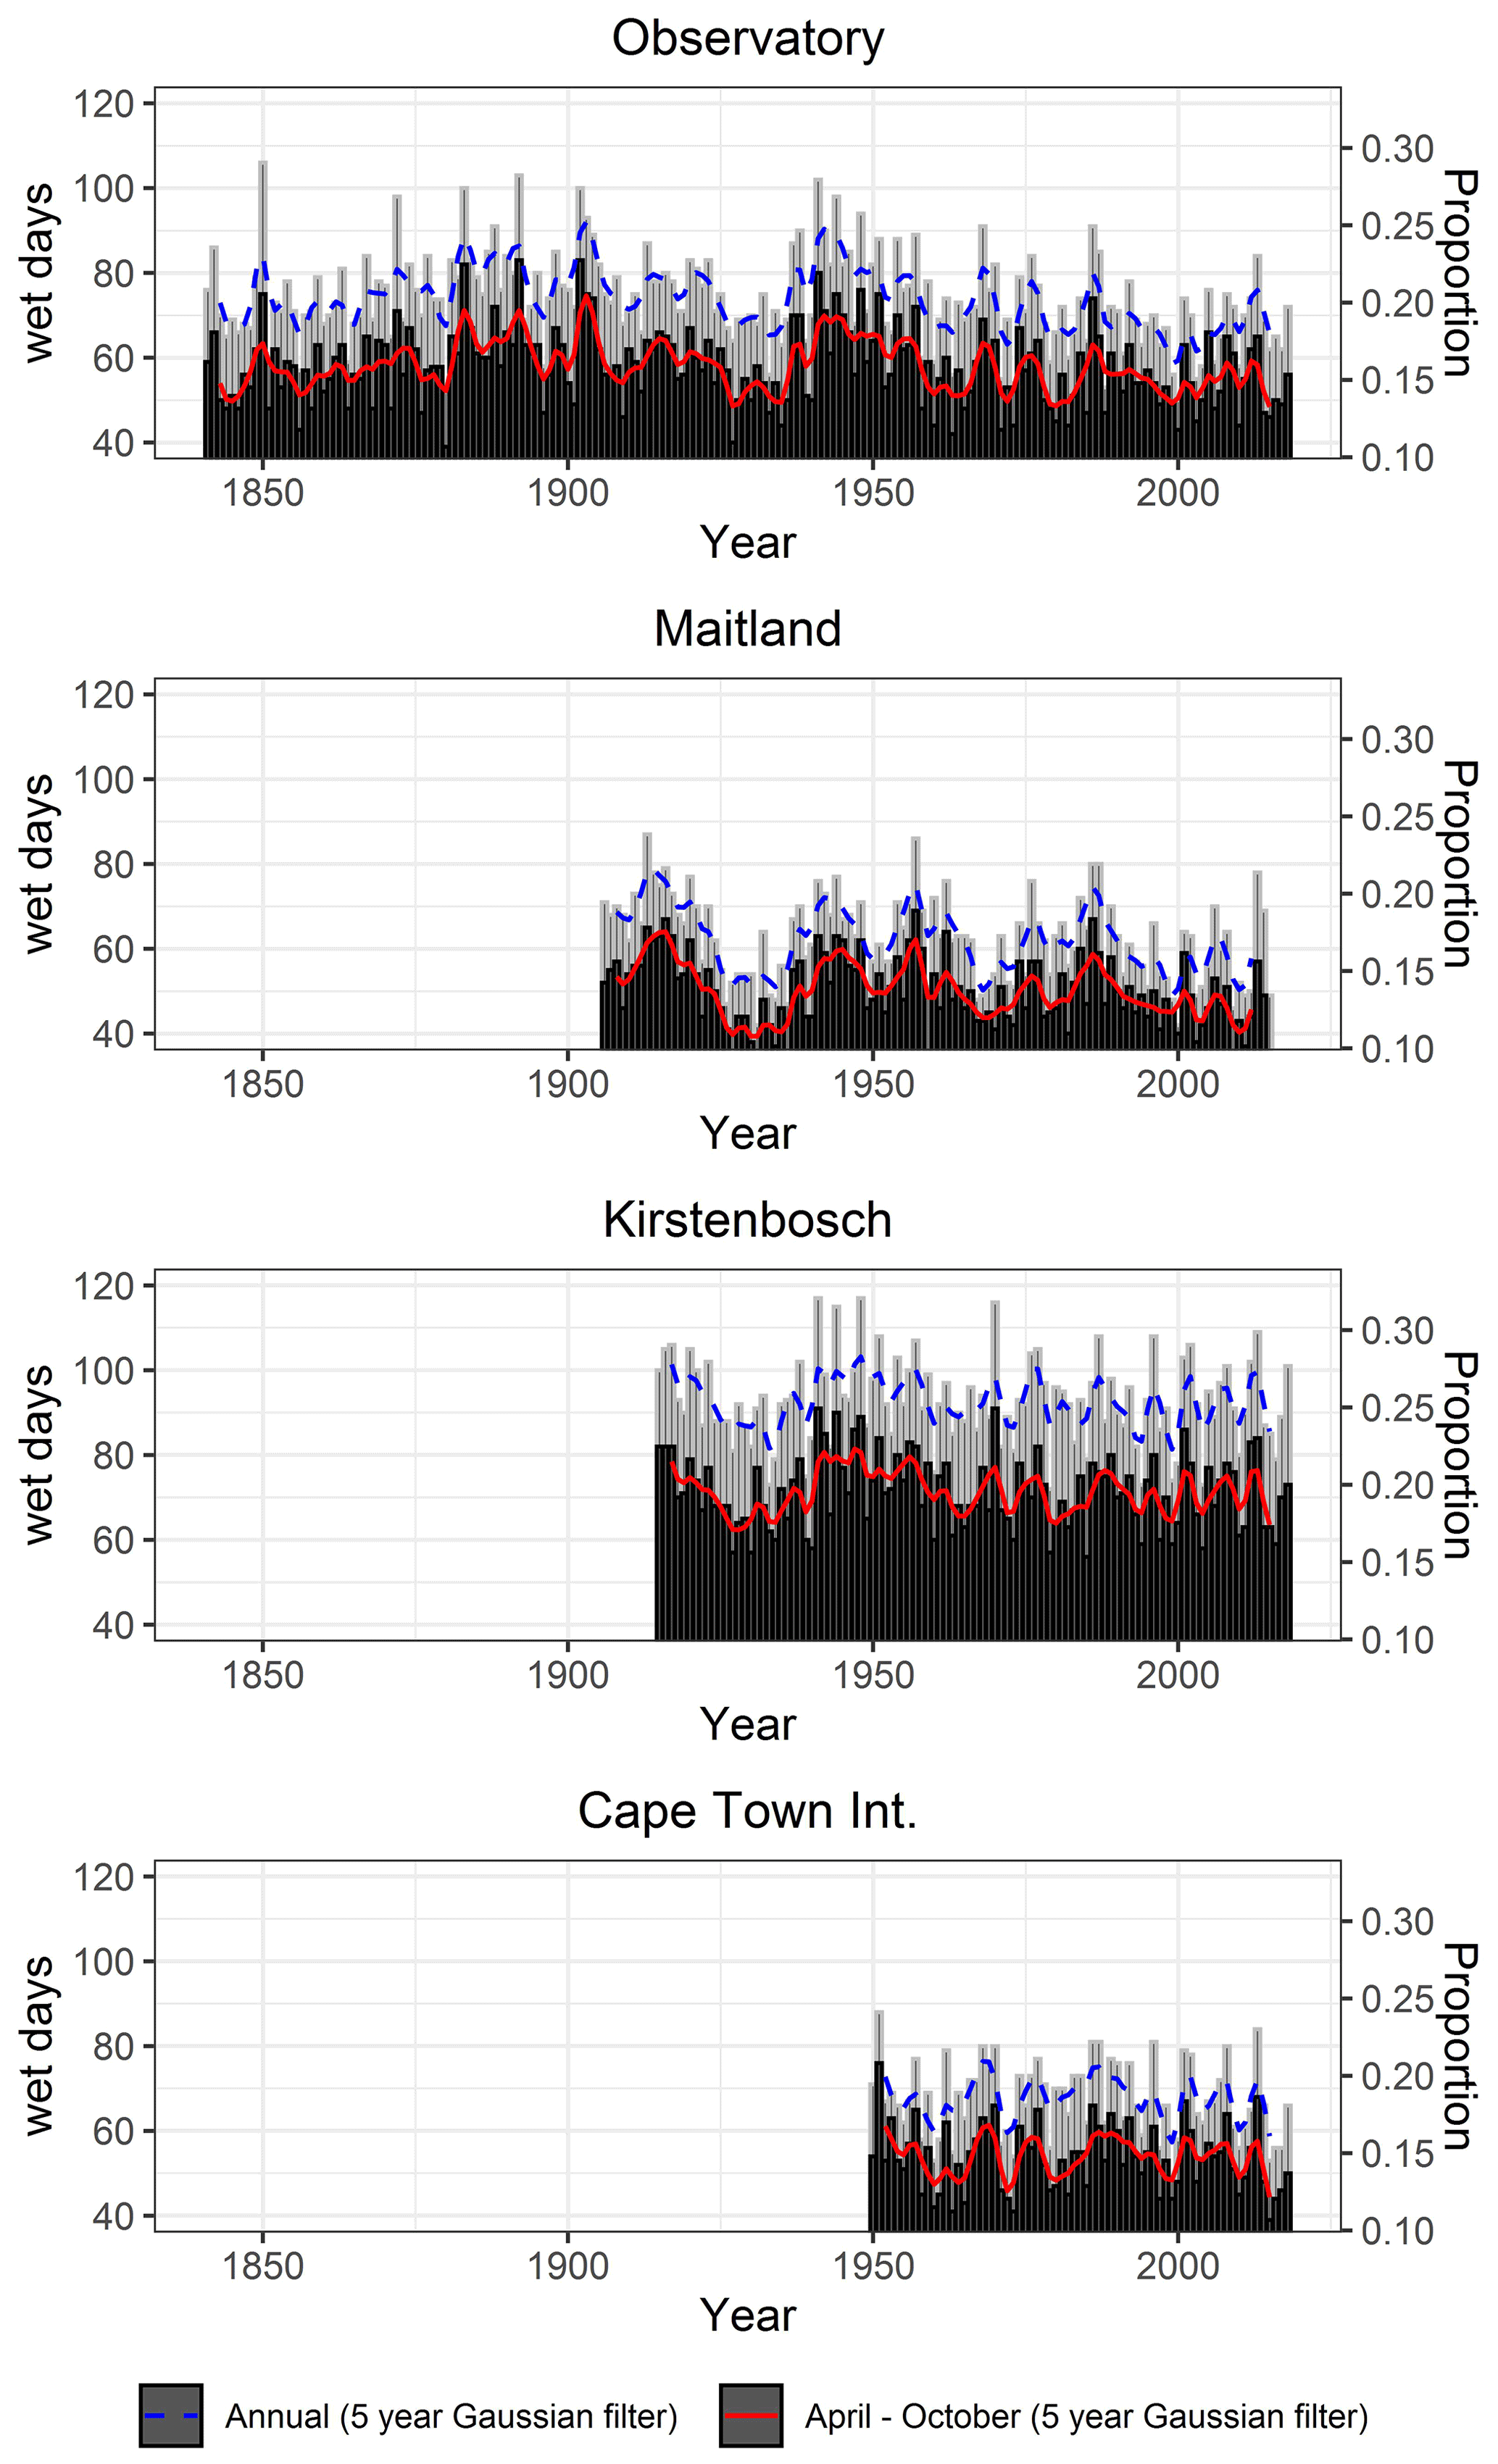
Figure 3The annual and wet season (April to October) frequency of wet days (≥1 mm) and the corresponding proportion relative to the total number of days (365) per year (right vertical axis).
A multi-temporal trend analysis was performed to identify changes in the linear trends for wet day frequency records at 30-, 50-, 70- and 90-year timescales. The test statistics and Sen slope at the end of the sub-period tested for trend were plotted for all possible overlapping sub-periods observed for each station record (Fig. 4). At the SAAO, significant positive 30-year trends and 50-year trends are observed for the 1890s and 1900s respectively, mainly owing to the 1880s and early 1890s having had a particularly high frequency of wet days compared to previous decades. In addition, several years between 1926 and 1936 recorded low frequencies compared to the period of high wet day frequencies in the 1940s and 1950s, resulting in significant positive 30-year trends in the latter periods. Outputs from other stations confirm these 30-year trends (Fig. 4). Negative trends are observed for sub-periods ending in the last 30 years over 50- and 70-year sub-periods, but these are only significant at the SAAO and Maitland.
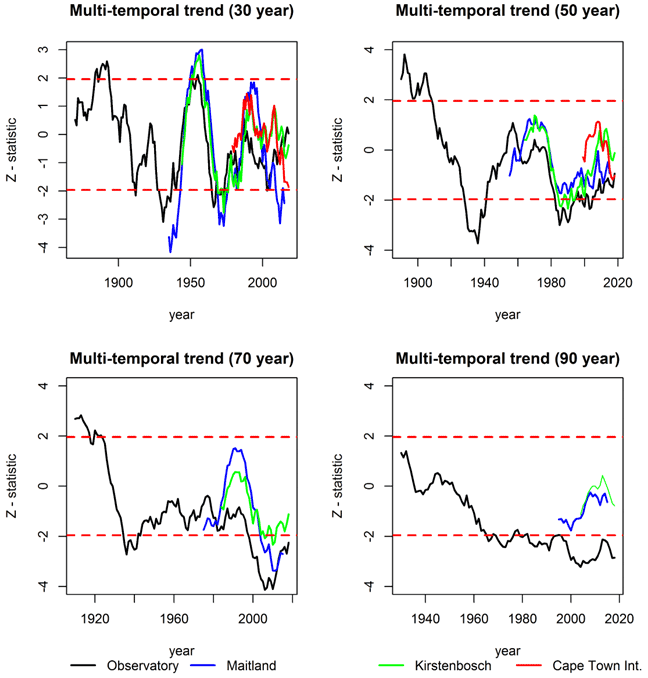
Figure 4The test statistic values for the multi-temporal trends calculated over overlapping 30-, 50-, 70- and 90-year sub-periods for the four stations. The end year for each sub-period is given as the horizontal axis and the z test statistic for the modified Mann–Kendall trend test applied is plotted against the last year included in the sub-period. The statistic and z=1.96 corresponds with the 5 % level of significance (red horizontal dashed lines). Test statistic values above (below) z=1.96 represent significant trends.
3.2 Wet and dry spells during the wet season
The average number of wet spells during the wet season ranges between 28 and 31 for all stations over the years 1950–2018 and average 1.8 d in duration, apart from Kirstenbosch, which records a longer average length of 2.3 d. There was a prolonged period of below average frequencies of wet spells and average spell lengths at the SAAO and Maitland stations in the 1920s and 1930s, as well as since 1975 for the SAAO (Fig. 5). Average dry spell lengths are between 4.4 and 5.6 d (Fig. 5), with maximum spell lengths of between 32 and 48 d. The early 20th century and 1940s had below average dry spell lengths, which correspond with periods of higher rainfall (Ndebele et al., 2020). Above average dry spell lengths between 1925 and 1938 at Maitland are consistent with low rainfall during that period.
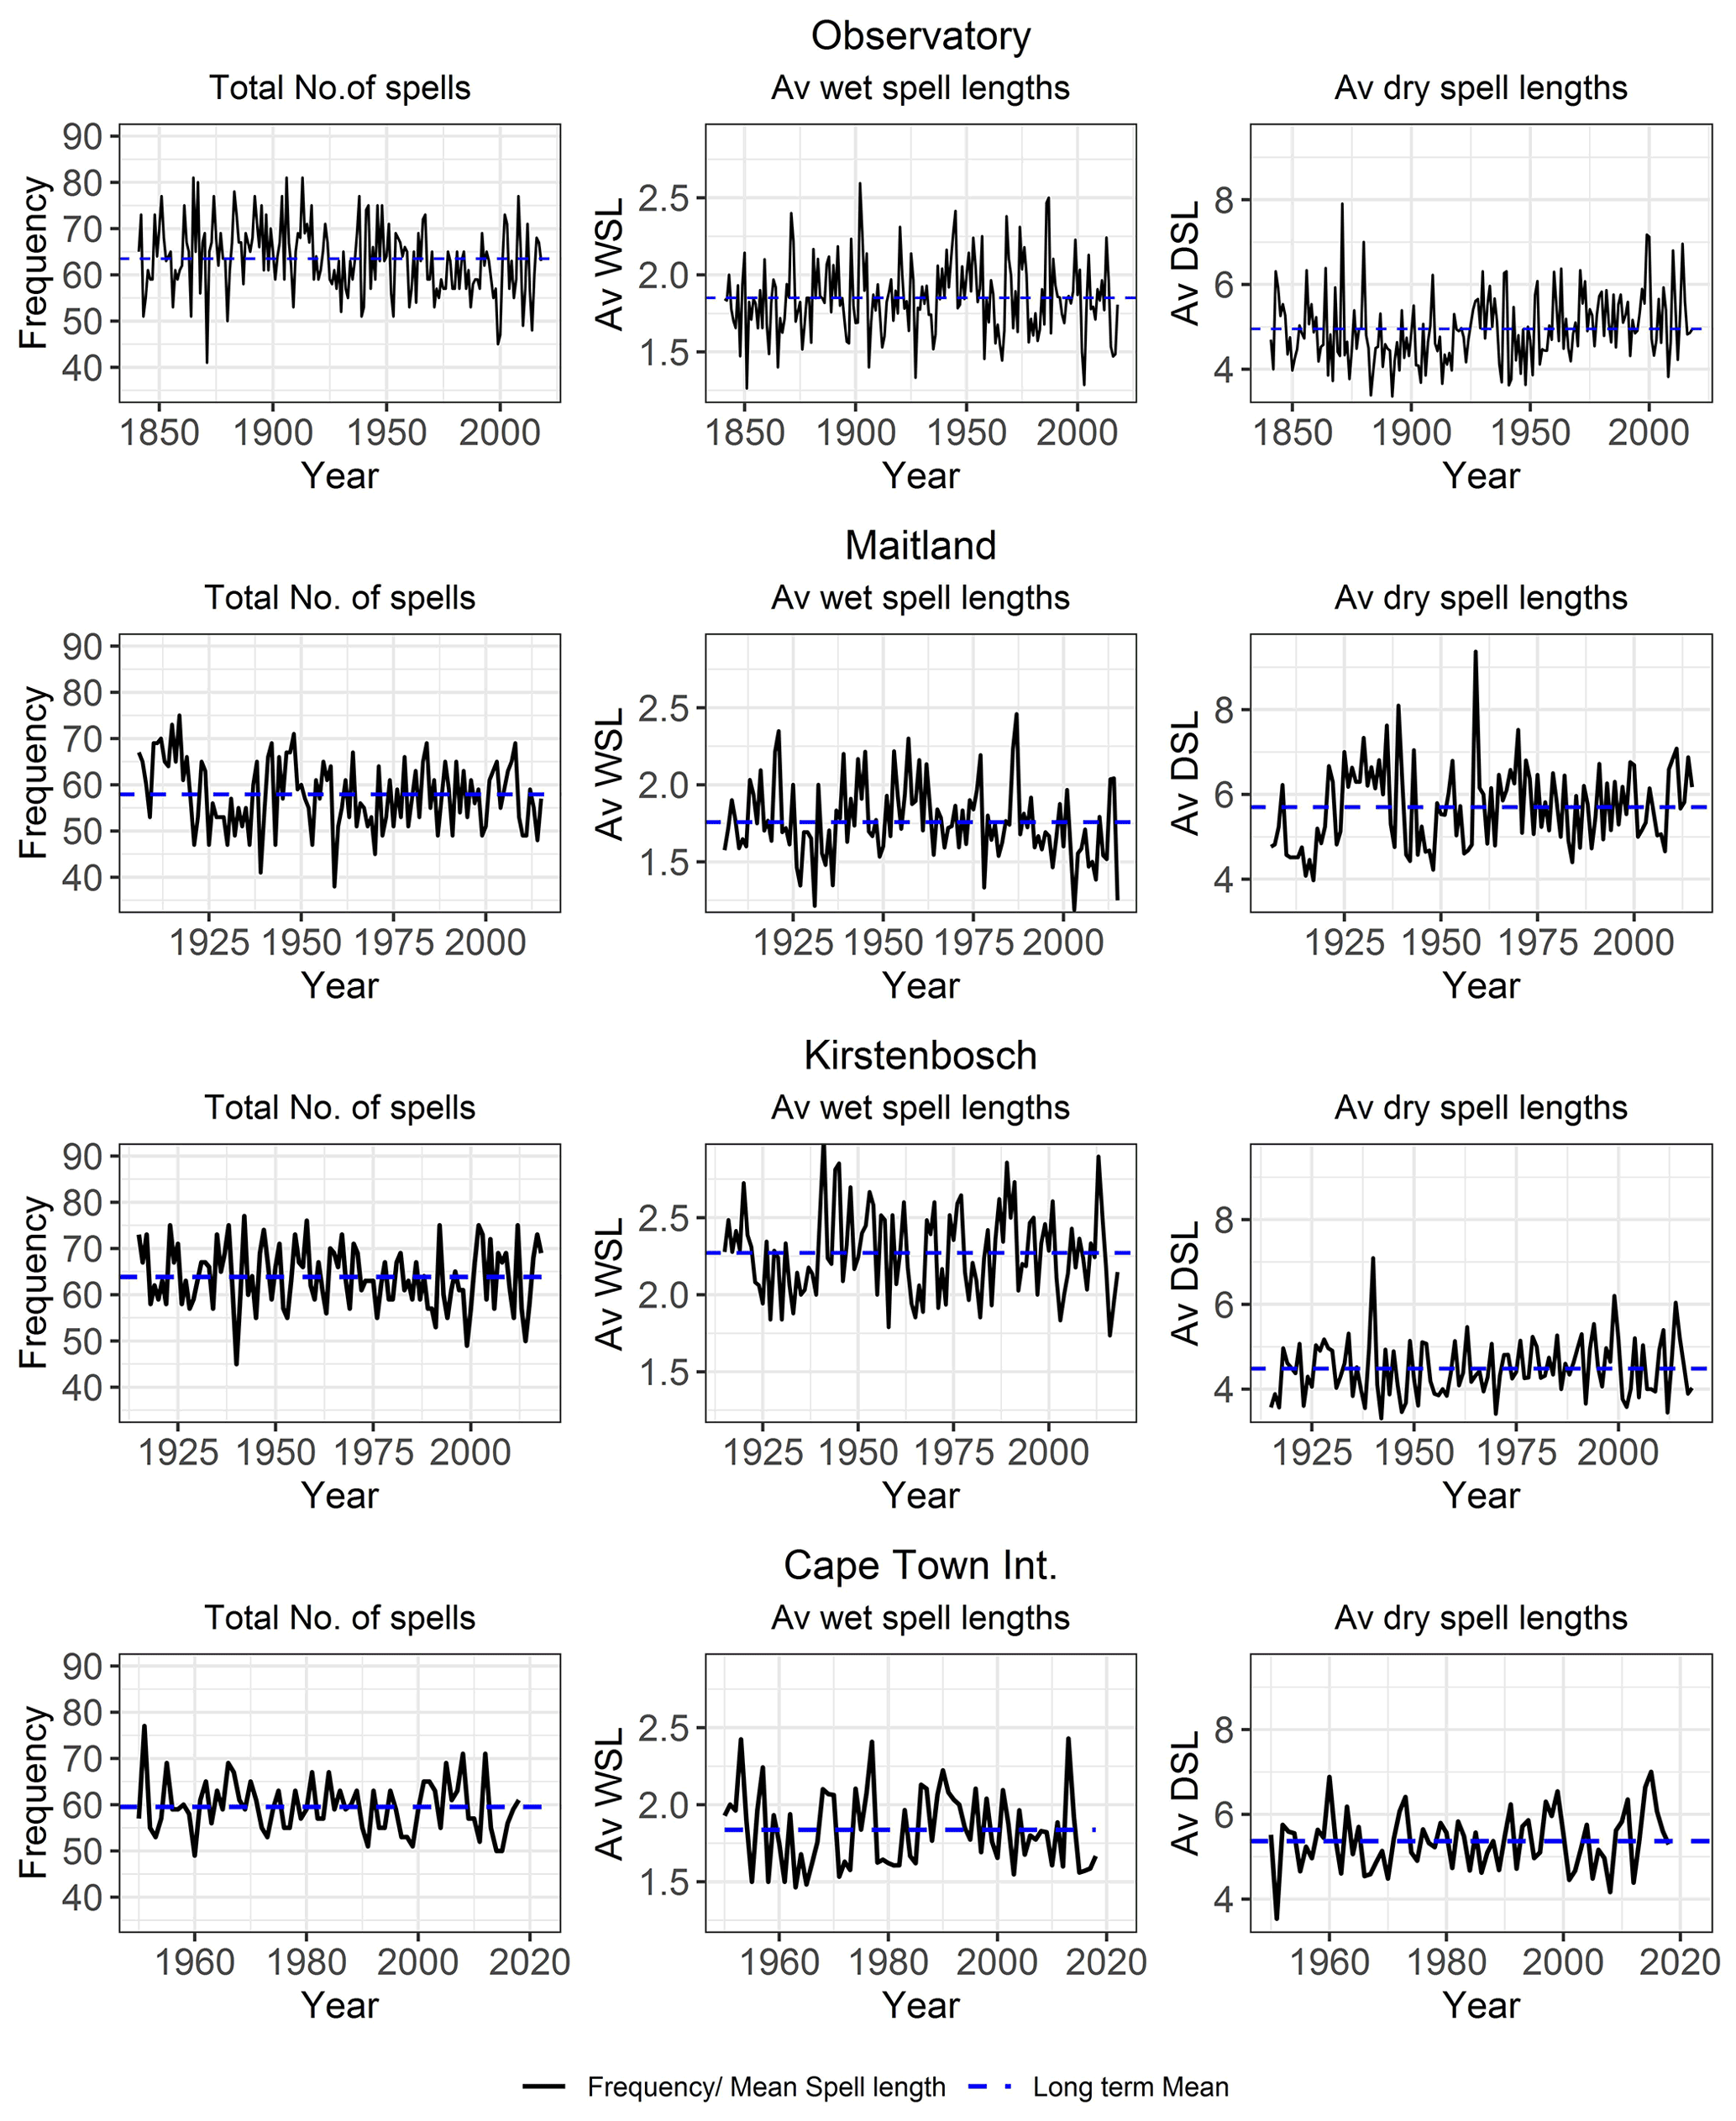
Figure 5Total number of wet and dry spells per wet season (frequency) and mean spell lengths (MSL) in days for wet and dry spells during the wet season.
A finer-scale assessment of wet–dry spell frequencies at the SAAO is presented in Fig. 6. Wet–dry spell lengths below (and above) the mean spell lengths (≈2 d (wet) and 5 d (dry)) are considered and examined over the full study period. The total number of wet spells significantly decreases over the full study period (1841–2018) and most strongly so during the period 1880–1940. Events lasting 1 d generally have the highest frequencies, averaging 16.5 spells (SD =4.17) over the full study period. The average number of such spells was higher during the period 1941–1957 (av. =17.2) and lower during the last ca. 60 years (1958–2018: av. =15.9), although this becomes higher again during the 21st century (2000–2018; av. =17.3). There is a significant decline (−1.4 spells per decade) in 1 d wet events during the wet season between 1958 and 1999. The 2 d wet spells averaged 8.7 spells (SD =2.8) per wet season between 1841 and 2018 but decreased substantially over the period 1880–1957 (−0.52 spells per decade). After having increased during the period 1958–1999 (0.87 spells per decade; av. =9 spells per wet season), 2 d wet spells decreased to average 8.5 spells per wet season since 2000. Longer wet spells (>2 d) averaged 6 spells per wet season between 1841 and 2018, but have progressively decreased in frequency since the 1960s (2000–2018: av. =4.65 spells per wet season).

Figure 6Wet–dry spell frequencies at the SAAO. The dashed blue line is the mean spell frequency, and the dashed red line is a 5-year Gaussian filter.
Dry spells lasting ≤5 d (short dry spells) average 21.7 spells per wet season (Fig. 6) and range between 9 spells (1872) and 36 spells (1892). A significant decline (−0.2 spells per decade) in short dry spells is detected for the full period 1841–2018 but is most pronounced during the period 1880–1941 (−1.0 spells per decade). Long dry spells (lasting ≥6 d) average 10 per wet season (Fig. 6), with the fewest recorded in 1880 and 1892 (5 spells each) and most in 1930 and 2003 (16 spells each). Long dry spells on average represent 32 % of all dry spells during the wet season for the period 1841–2018 but increase to on average 36 % since the new millennium, and hence a tendency toward longer dry spells. A significant negative trend (−0.3 spells per decade) is evident prior to 1900, which subsequently changes to a significant increase (0.1 spells per decade) after 1900. Years with the highest proportion of shorter dry spells (≤5 d) include 1883 and 1892 (>87 % of all dry spells), while the highest proportion of dry spells ≥6 d (40 % of all dry spells) occurred in 2010. The period 1880–1920 is notable for its high number of short dry spells (av. =24.3 spells yr−1) and below normal number of longer (≥6 d) dry spells (av. = 9 spells yr−1) (Fig. 6). In contrast, since ca. 1974, longer dry spells have for the most part become more frequent (av. since 1974 =10.7 spells yr−1).
3.3 Extreme wet and dry spells during the wet season (SAAO)
The geometric distribution and compound geometric distribution (see the Supplement) were used to model wet and dry spell lengths and to estimate the 95th and 99th percentiles for extreme wet and dry spells. The distribution parameters for the SAAO, Maitland and Cape Town Int. records are similar, and the 95th and 99th percentiles for wet spell lengths are 4 and 5 d respectively. Several years during the late 19th century (1883, 1890, 1892 and 1893) had high frequencies of long wet spells (≥4 d) at the SAAO, which coincidently also recorded high rainfall amounts (see Ndebele et al., 2020). The 1940s and early 1950s had the highest recorded number of such extreme wet spells, during which time 7 years experienced 6 or more wet spells of ≥4 d during the wet season at the SAAO. Long wet spells (≥4 d) are also noted during the 1940s and 1950s at Maitland and Cape Town International. The 95th percentile for wet spell lengths at Kirstenbosch is 6 d. The 1940s and 1950s stand out as a period with high frequencies of wet spells ≥6 d at Kirstenbosch.
The 95th and 99th percentiles for dry spell lengths are 14 and 20 d respectively at the SAAO. Long dry spells during the months of either April–May or August–September are associated with the onset–termination of wet seasons respectively and at times reflect a late (early) onset (termination) to the wet season respectively. Long dry spells (19–28 d in length) during the mid-wet season (i.e. June–July; Julian days 160–210) were a particular concern in 1929, 1934 and 1935 and coincided with the driest period (1926–1936) since records began in 1841 (see Ndebele et al., 2020). Also noteworthy is the occurrence of long (17 d) dry spells during June–July of recent years (2004, 2005 and 2014).
3.4 Pentad profiles
Decadal pentad profiles for the SAAO are provided so as to obtain a decadal cross-sectional view of the onset, termination and distribution of wet season rainfall. Average total values for each pentad over decadal periods (only 9 years for the most recent decade: 2010–2018) were calculated and plotted (Fig. 7). Pentads considered for the wet season are those between pentad 19 (1 April) and pentad 61 (ending 1 November), as these (and 95 % confidence intervals) exceed the long-term pentad average () (Fig. 7). Pentads with average values above that of the long-term pentad average are provided in Table 5 and represented in Figs. 8 and 9. The earliest pentads with mean values above the range between pentad 19 (1–5 April) and pentad 30 (26–30 May); these provide an indication of the average wet season onset during each decade. The latest pentads with mean values above range between pentad 51 (8–12 August) and pentad 61 (28 October to 1 November). Coincidently, the most recent decade had the latest average wet season onset date, while the first decade had the earliest average wet season termination date. Decades recording the highest number of dry pentads (<5 mm) include 1920–1929 (10 pentads) and 2010–2018 (13 pentads); these are also the driest decades with peak pentad averages below 20 mm. Decades with the most pentads above (32–33 pentads), early wet season onsets and late wet season termination dates, correspond with decades that had high rainfall at the end of the 19th century and the 1940s and 1950s. The most recent decade (2010–2018) had the least number of pentads above (22 pentads). During most decades, rainfall peaks between pentads 28 (1–5 May) and 38 (5–9 July). The peak pentad ranges from an average of 18 mm (1930–1939; 2010–2018) to 40 mm (1860–1869; 1960–1969). Pentad profiles for the other stations are provided in the Supplement. Similar observations are made for the period 2010–2018, which records a tendency toward an increased number of dry pentads, low peak pentad average rainfall and shortened wet seasons.
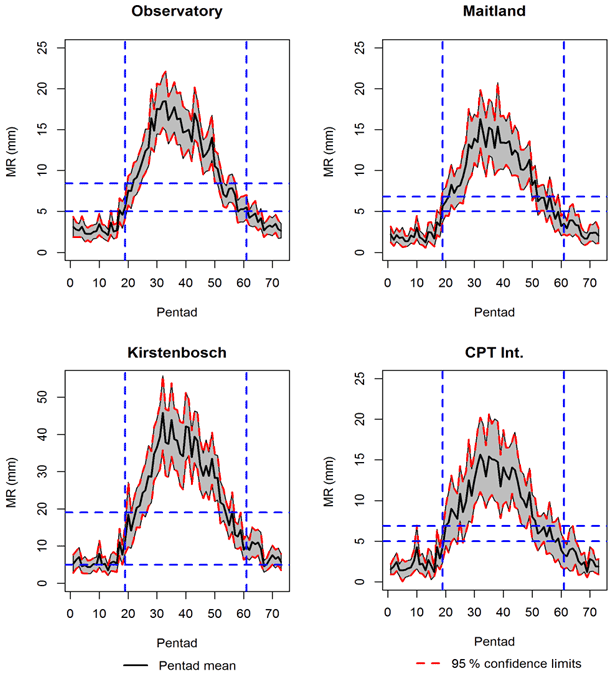
Figure 7Mean pentad rainfall (MR) and 95 % confidence intervals. Horizontal dashed blue lines indicate threshold for wet days (5 mm) and long-term mean of all pentads respectively. Vertical dashed blue lines show the start (pentad 19) and end (pentad 61) of the wet season.
Table 5Pentad profiles per decade at the SAAO. The pentad long-term mean =8.44 mm and dry pentads have <5 mm of rain. Pentad 19–24 (1–30 April), Pentad 25–30 (1–30 May), Pentad 51–55 (8 September–2 October) and Pentad 56–61 (3 October–1 November).
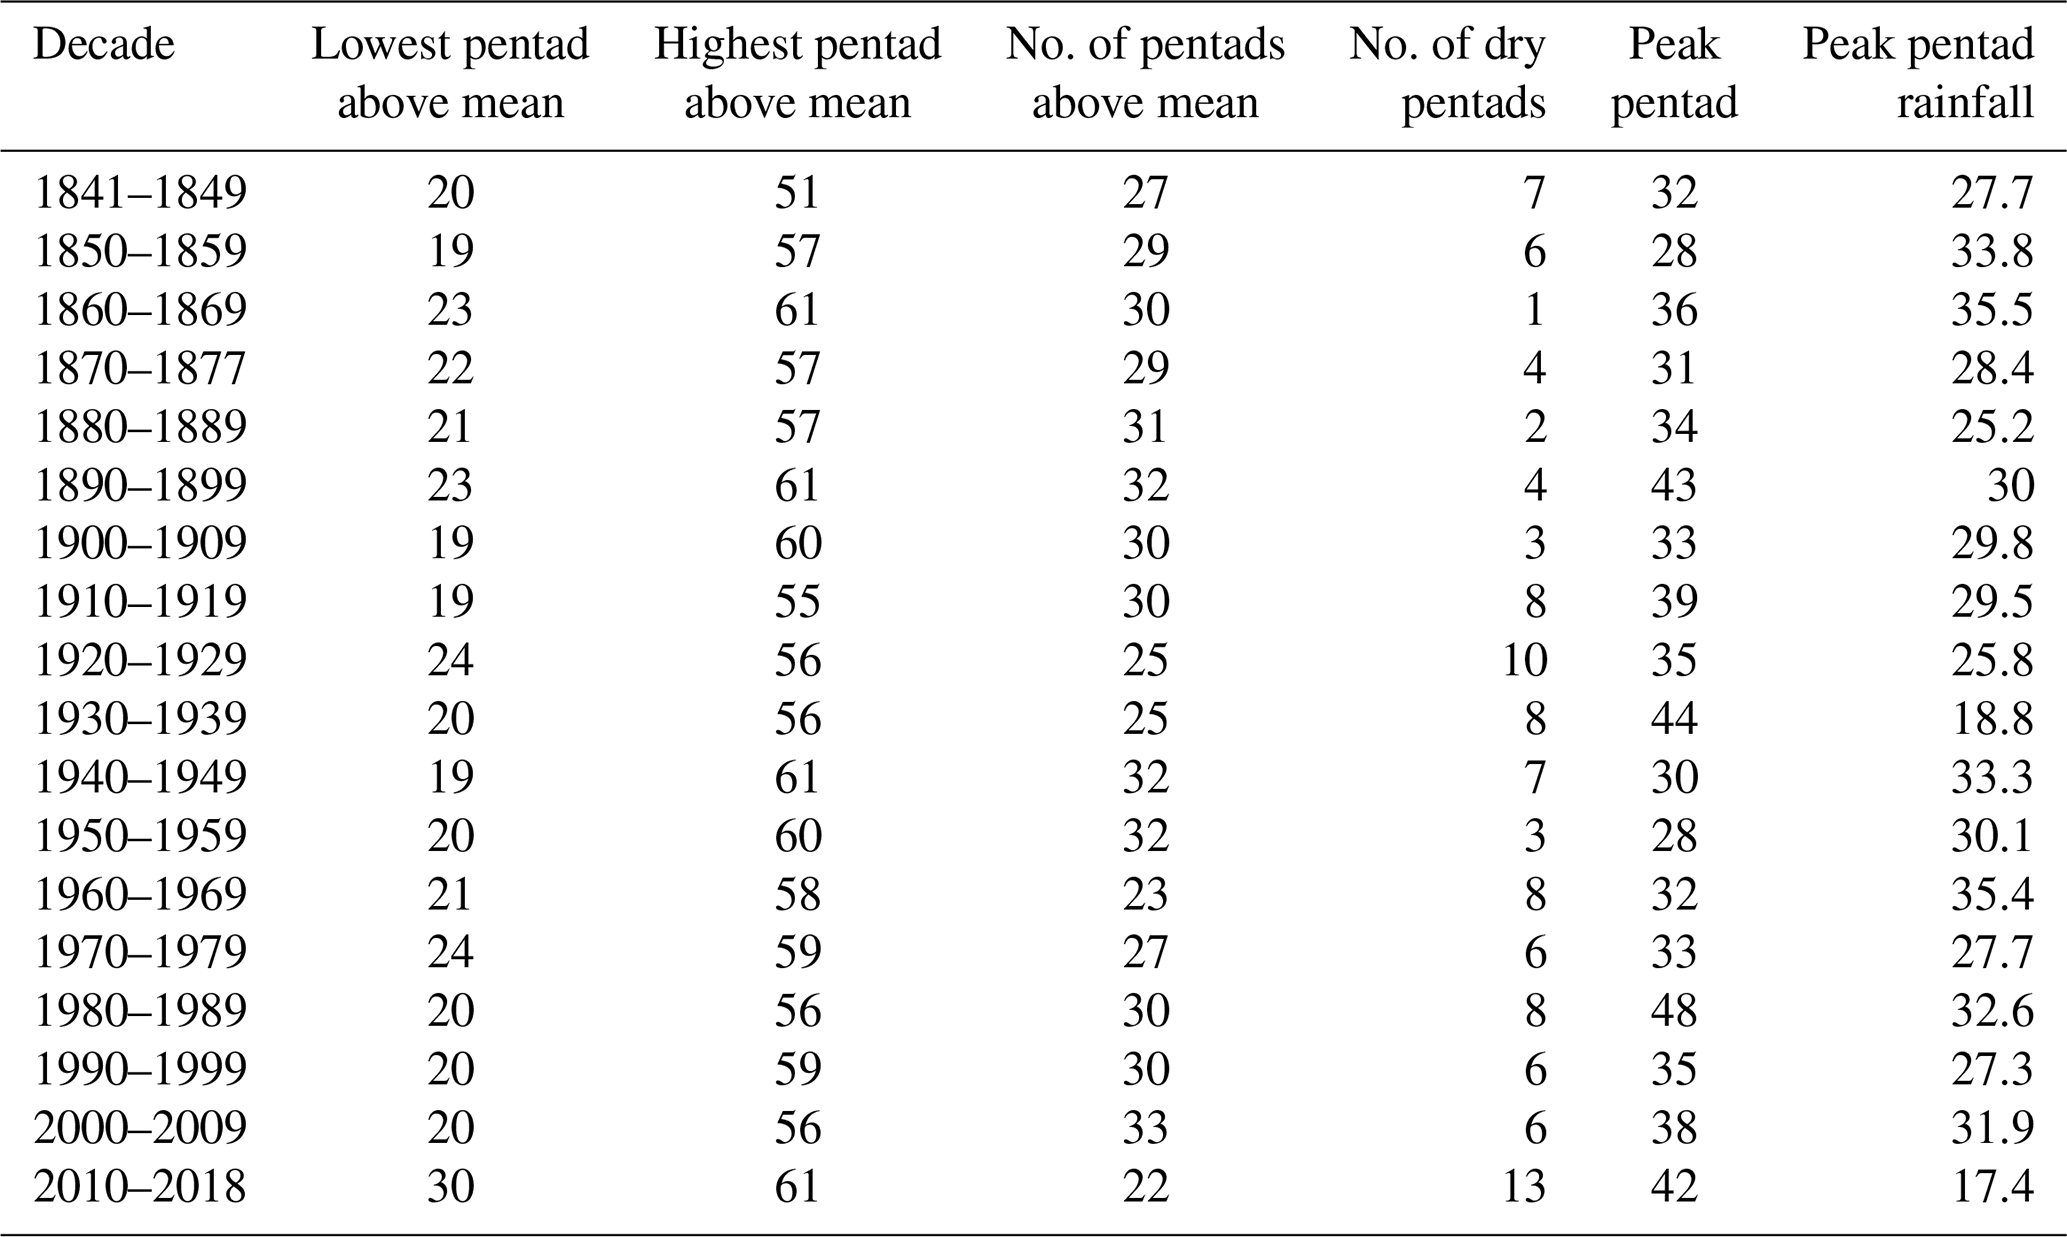
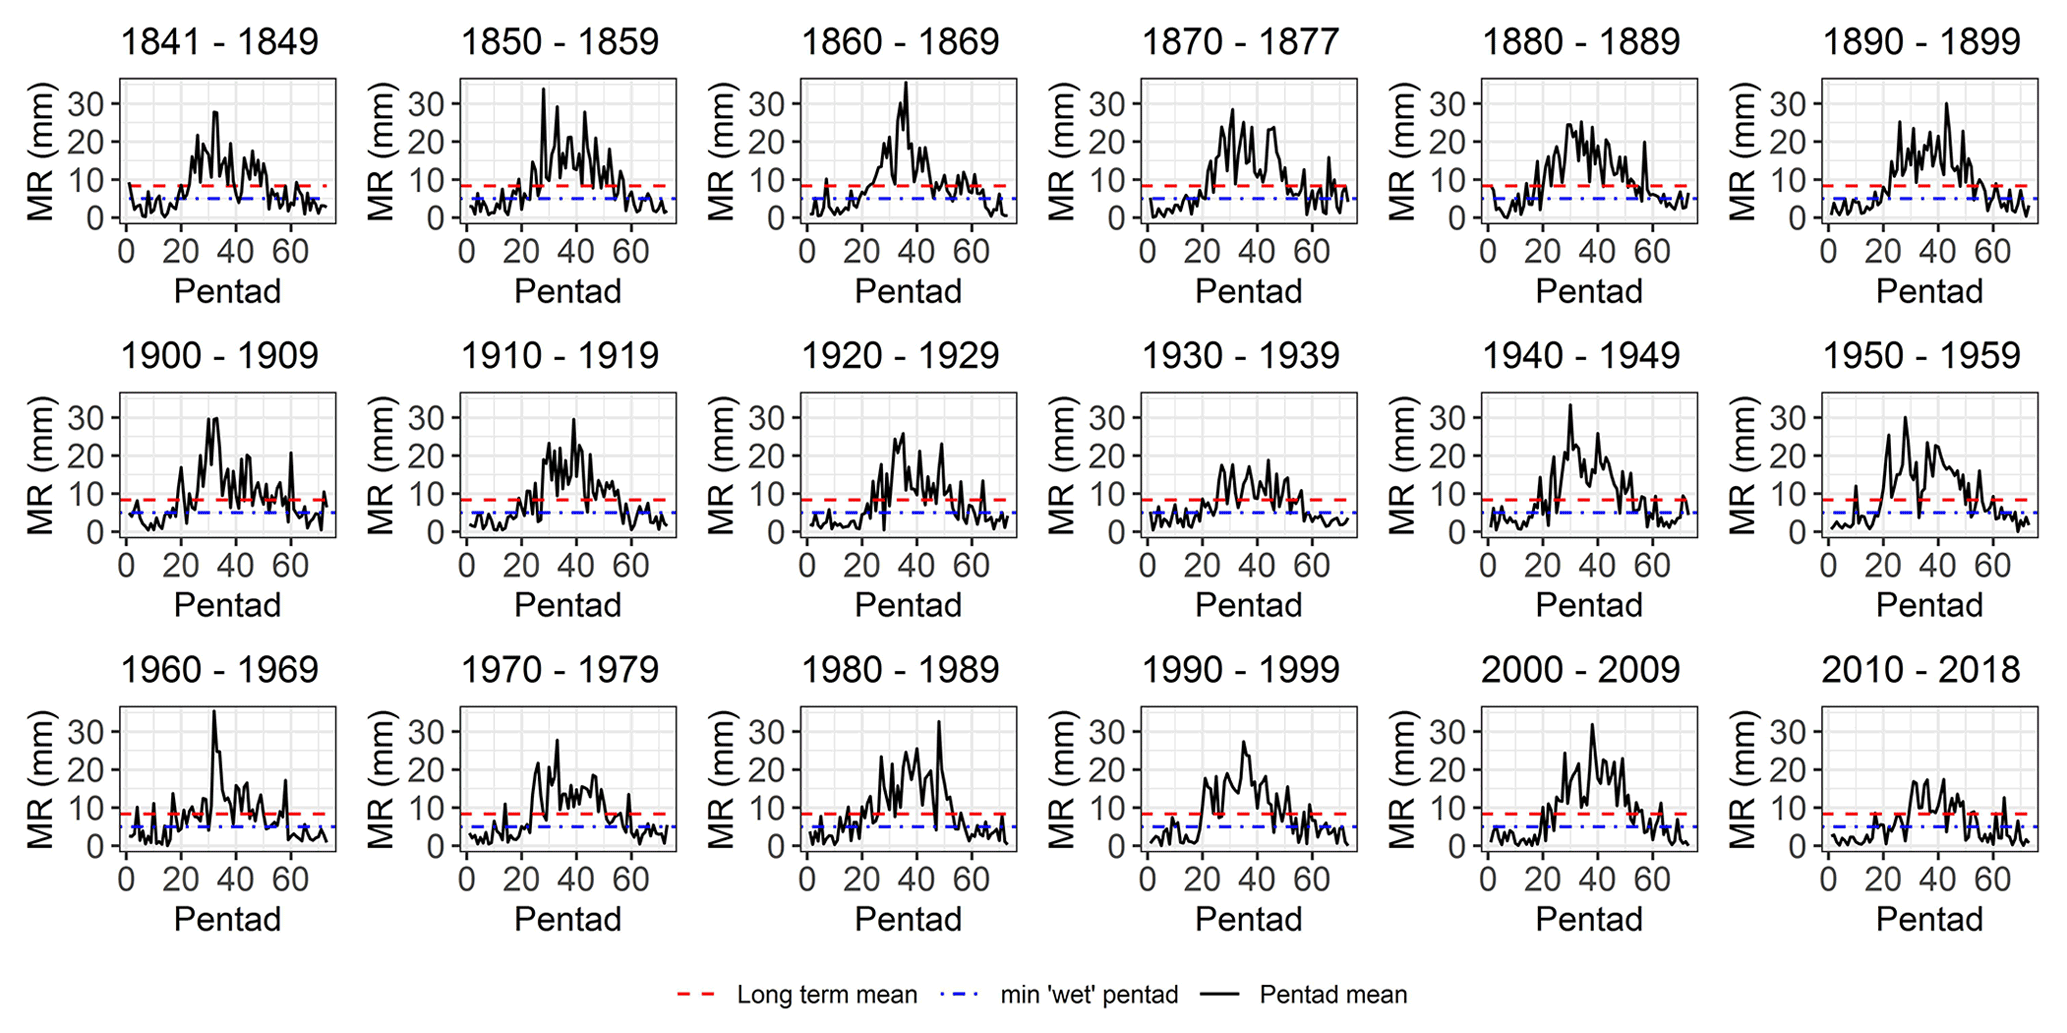
Figure 8Pentad rainfall profiles: mean rainfall (MR) pentad totals for each decade at the SAAO.
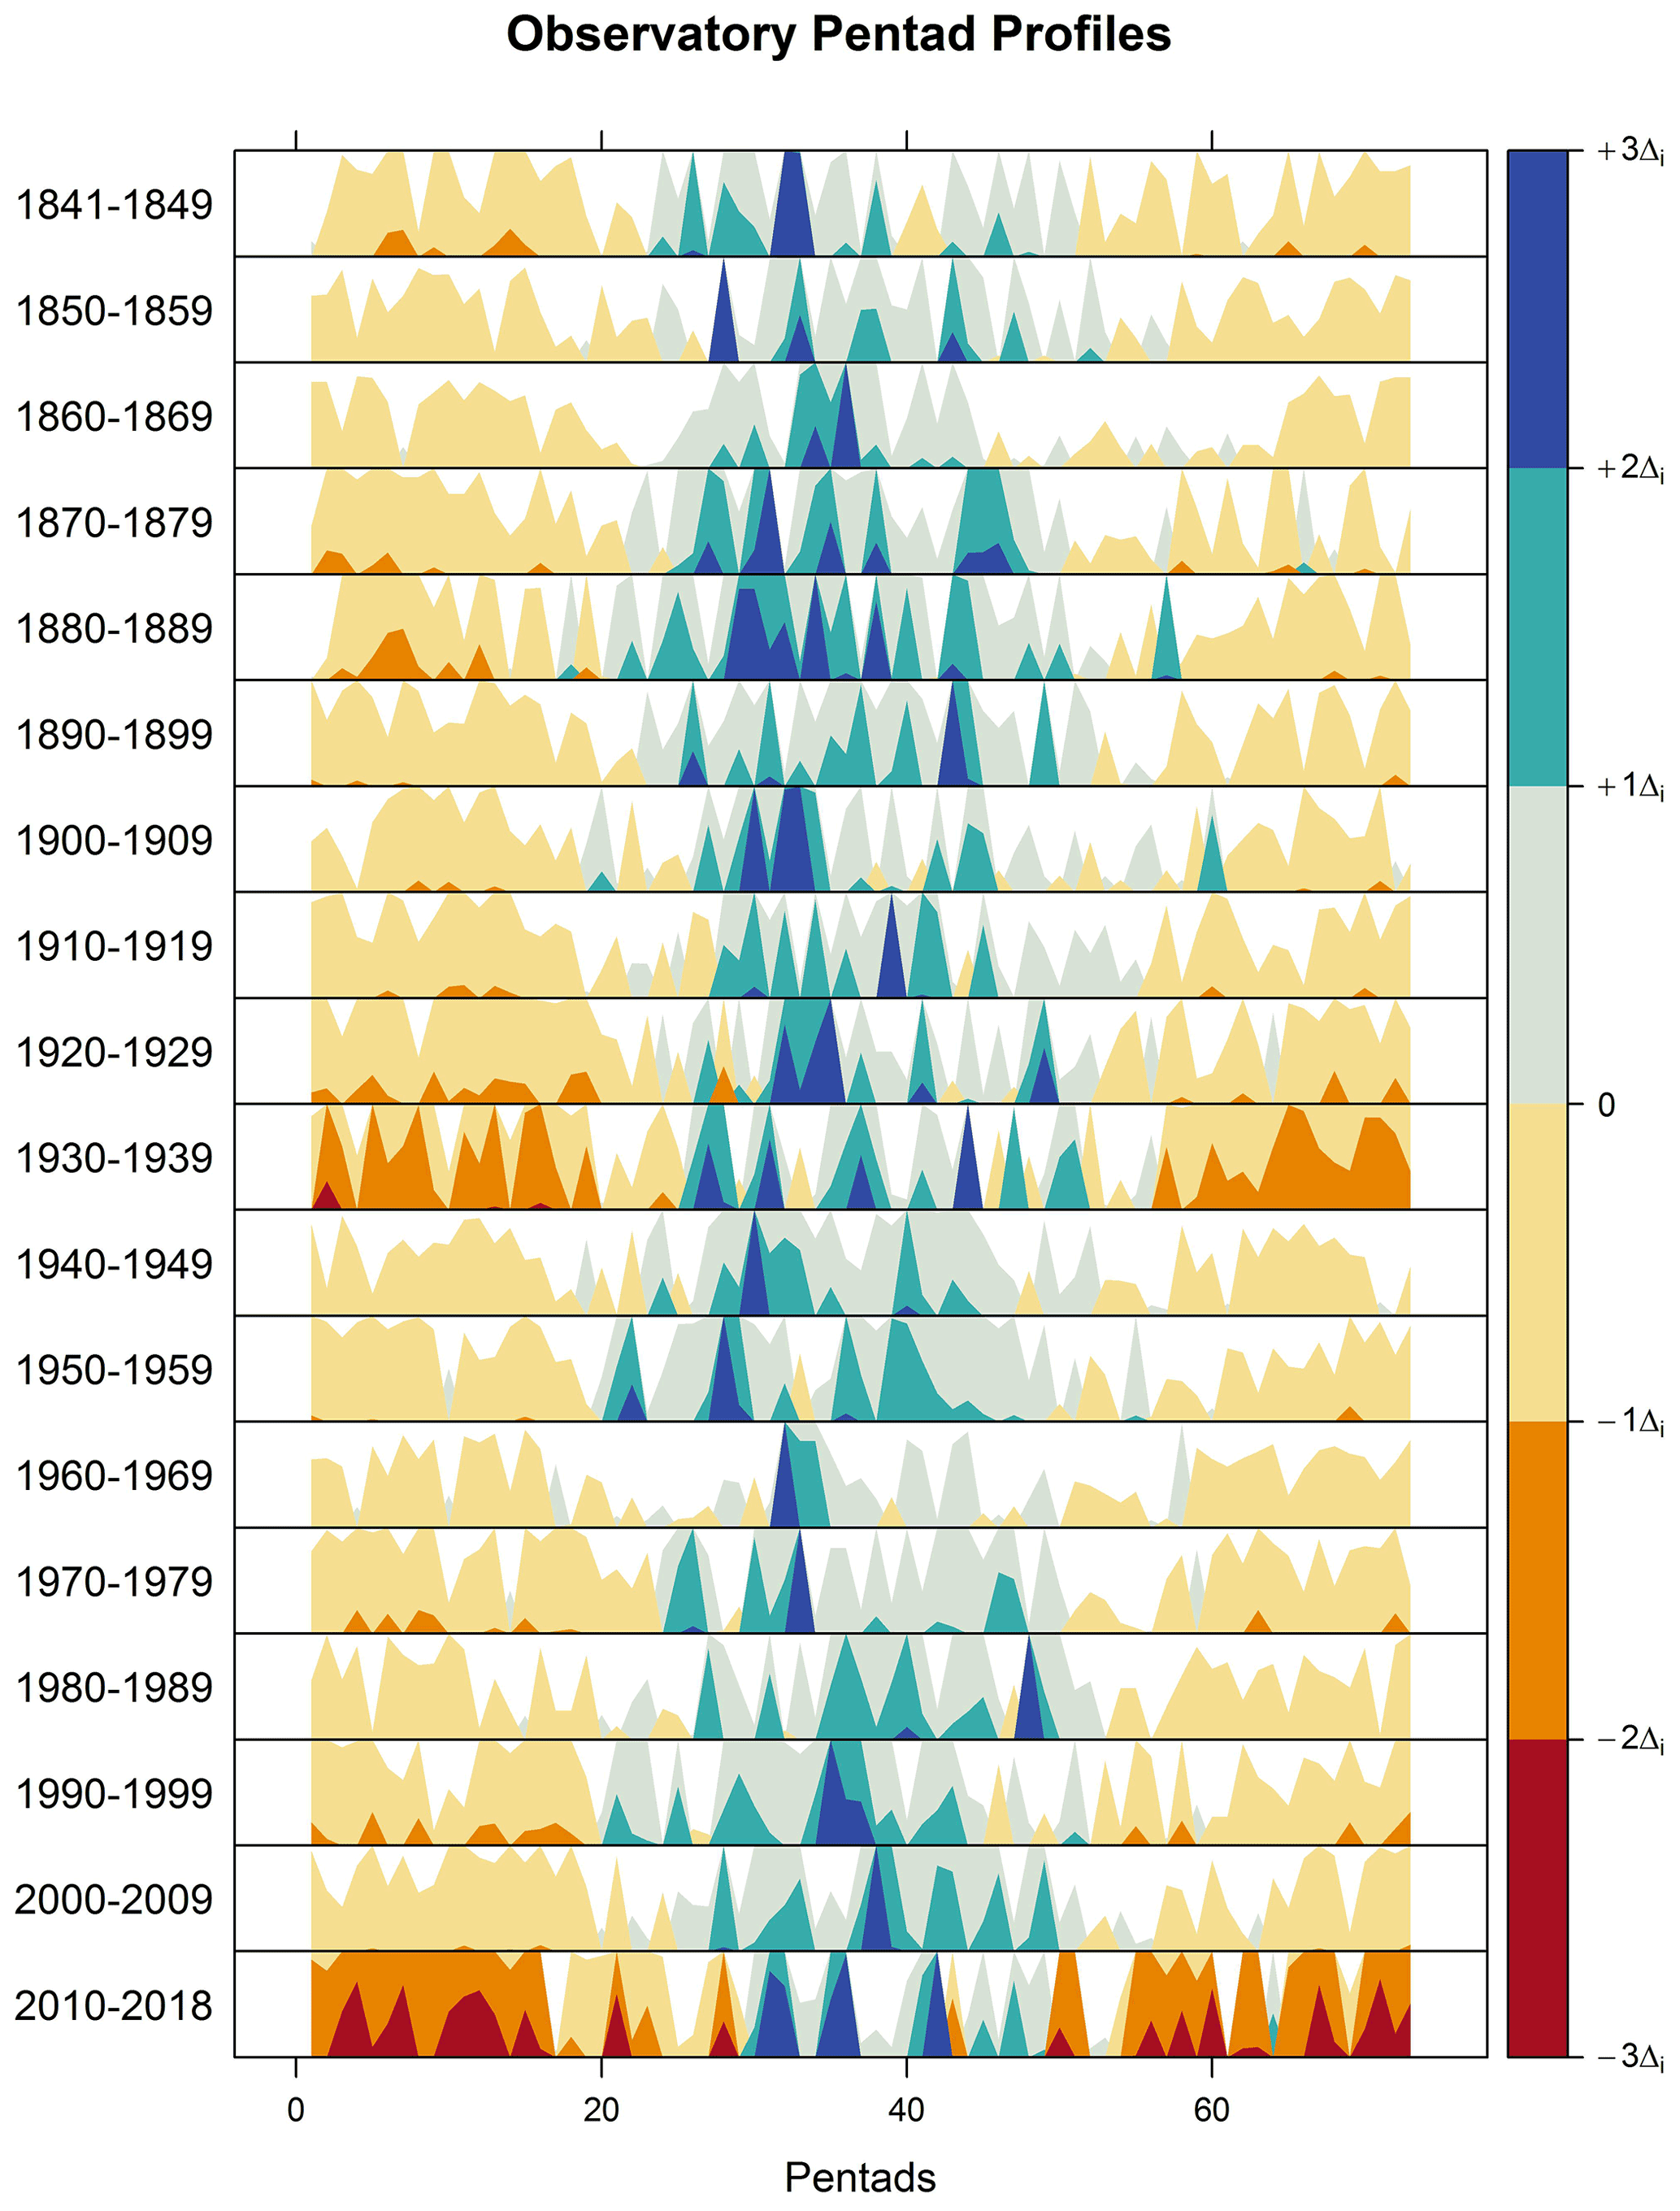
Figure 9The horizon plots are plotted for difference in the pentad mean relative to the overall long-term pentad mean for the series. Positive values (blue) represent pentad mean values above the overall long-term pentad mean, and negative values indicate pentad mean values below the overall long-term mean. Lighter shades are closer to the long-term mean, and darker shades are further away from the mean. The contrast between wet and dry seasons is observed and allows comparison between these seasons across decades. Pentad 19 is the approximate wet season onset, and pentad 57 approximate termination.
3.5 Rainfall onset–termination dates
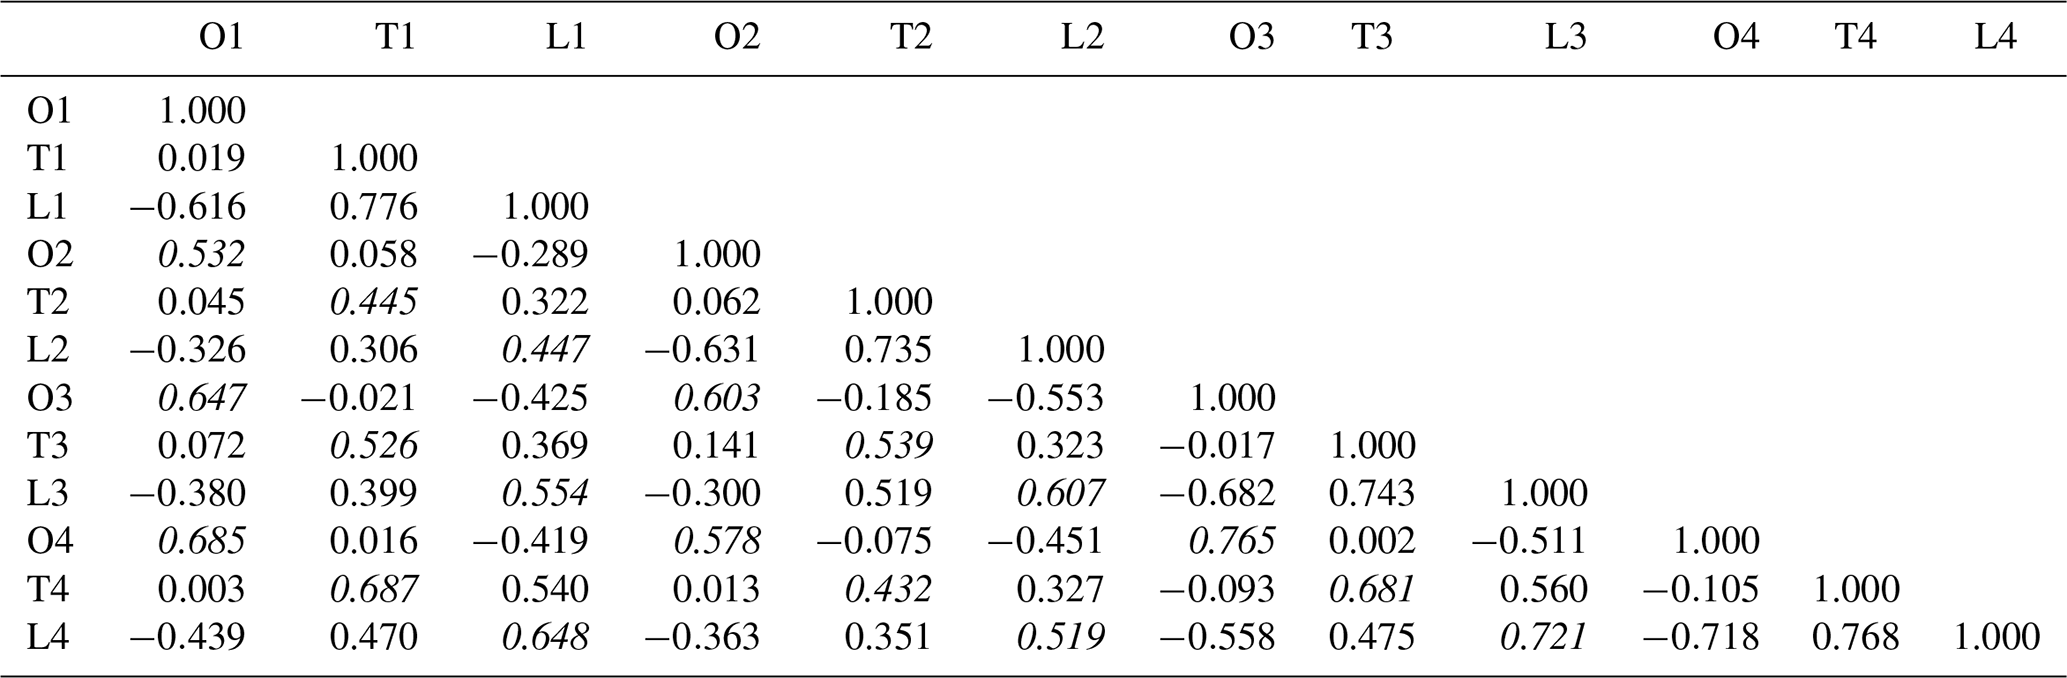
Rainfall onset–termination dates were calculated for each year across the four weather stations, as shown in Fig. 10. Onset days at the four stations are positively correlated (correlations range between 0.53 and 0.77; Table 6) and have similar averages for the common period 1950–2018, ranging between Julian days 103 (13 April at the SAAO) and 106 (16 April at Cape Town Int. and Kirstenbosch). The latest recorded onset date was at Maitland on Julian day 150 (30 May 1925). Early onsets were common in the 1950s and 1980s (averaging Julian day 100), while prominent late onsets occurred during the mid-1930s (av. = day 112) and early 1970s (av. = day 117). The average termination dates were Julian days 291–292 (18–19 October) across the four stations, resulting in an average wet season length of 185–188 d. The occurrence of early termination days (before 7 October) has become more prevalent during the most recent 40 years (av. = day 284) and constitute 80 % of termination dates before Julian day 280 during the last 100 years. Rain season lengths were notably shorter during the period 1970–1994 (av. =181 d) for all stations.
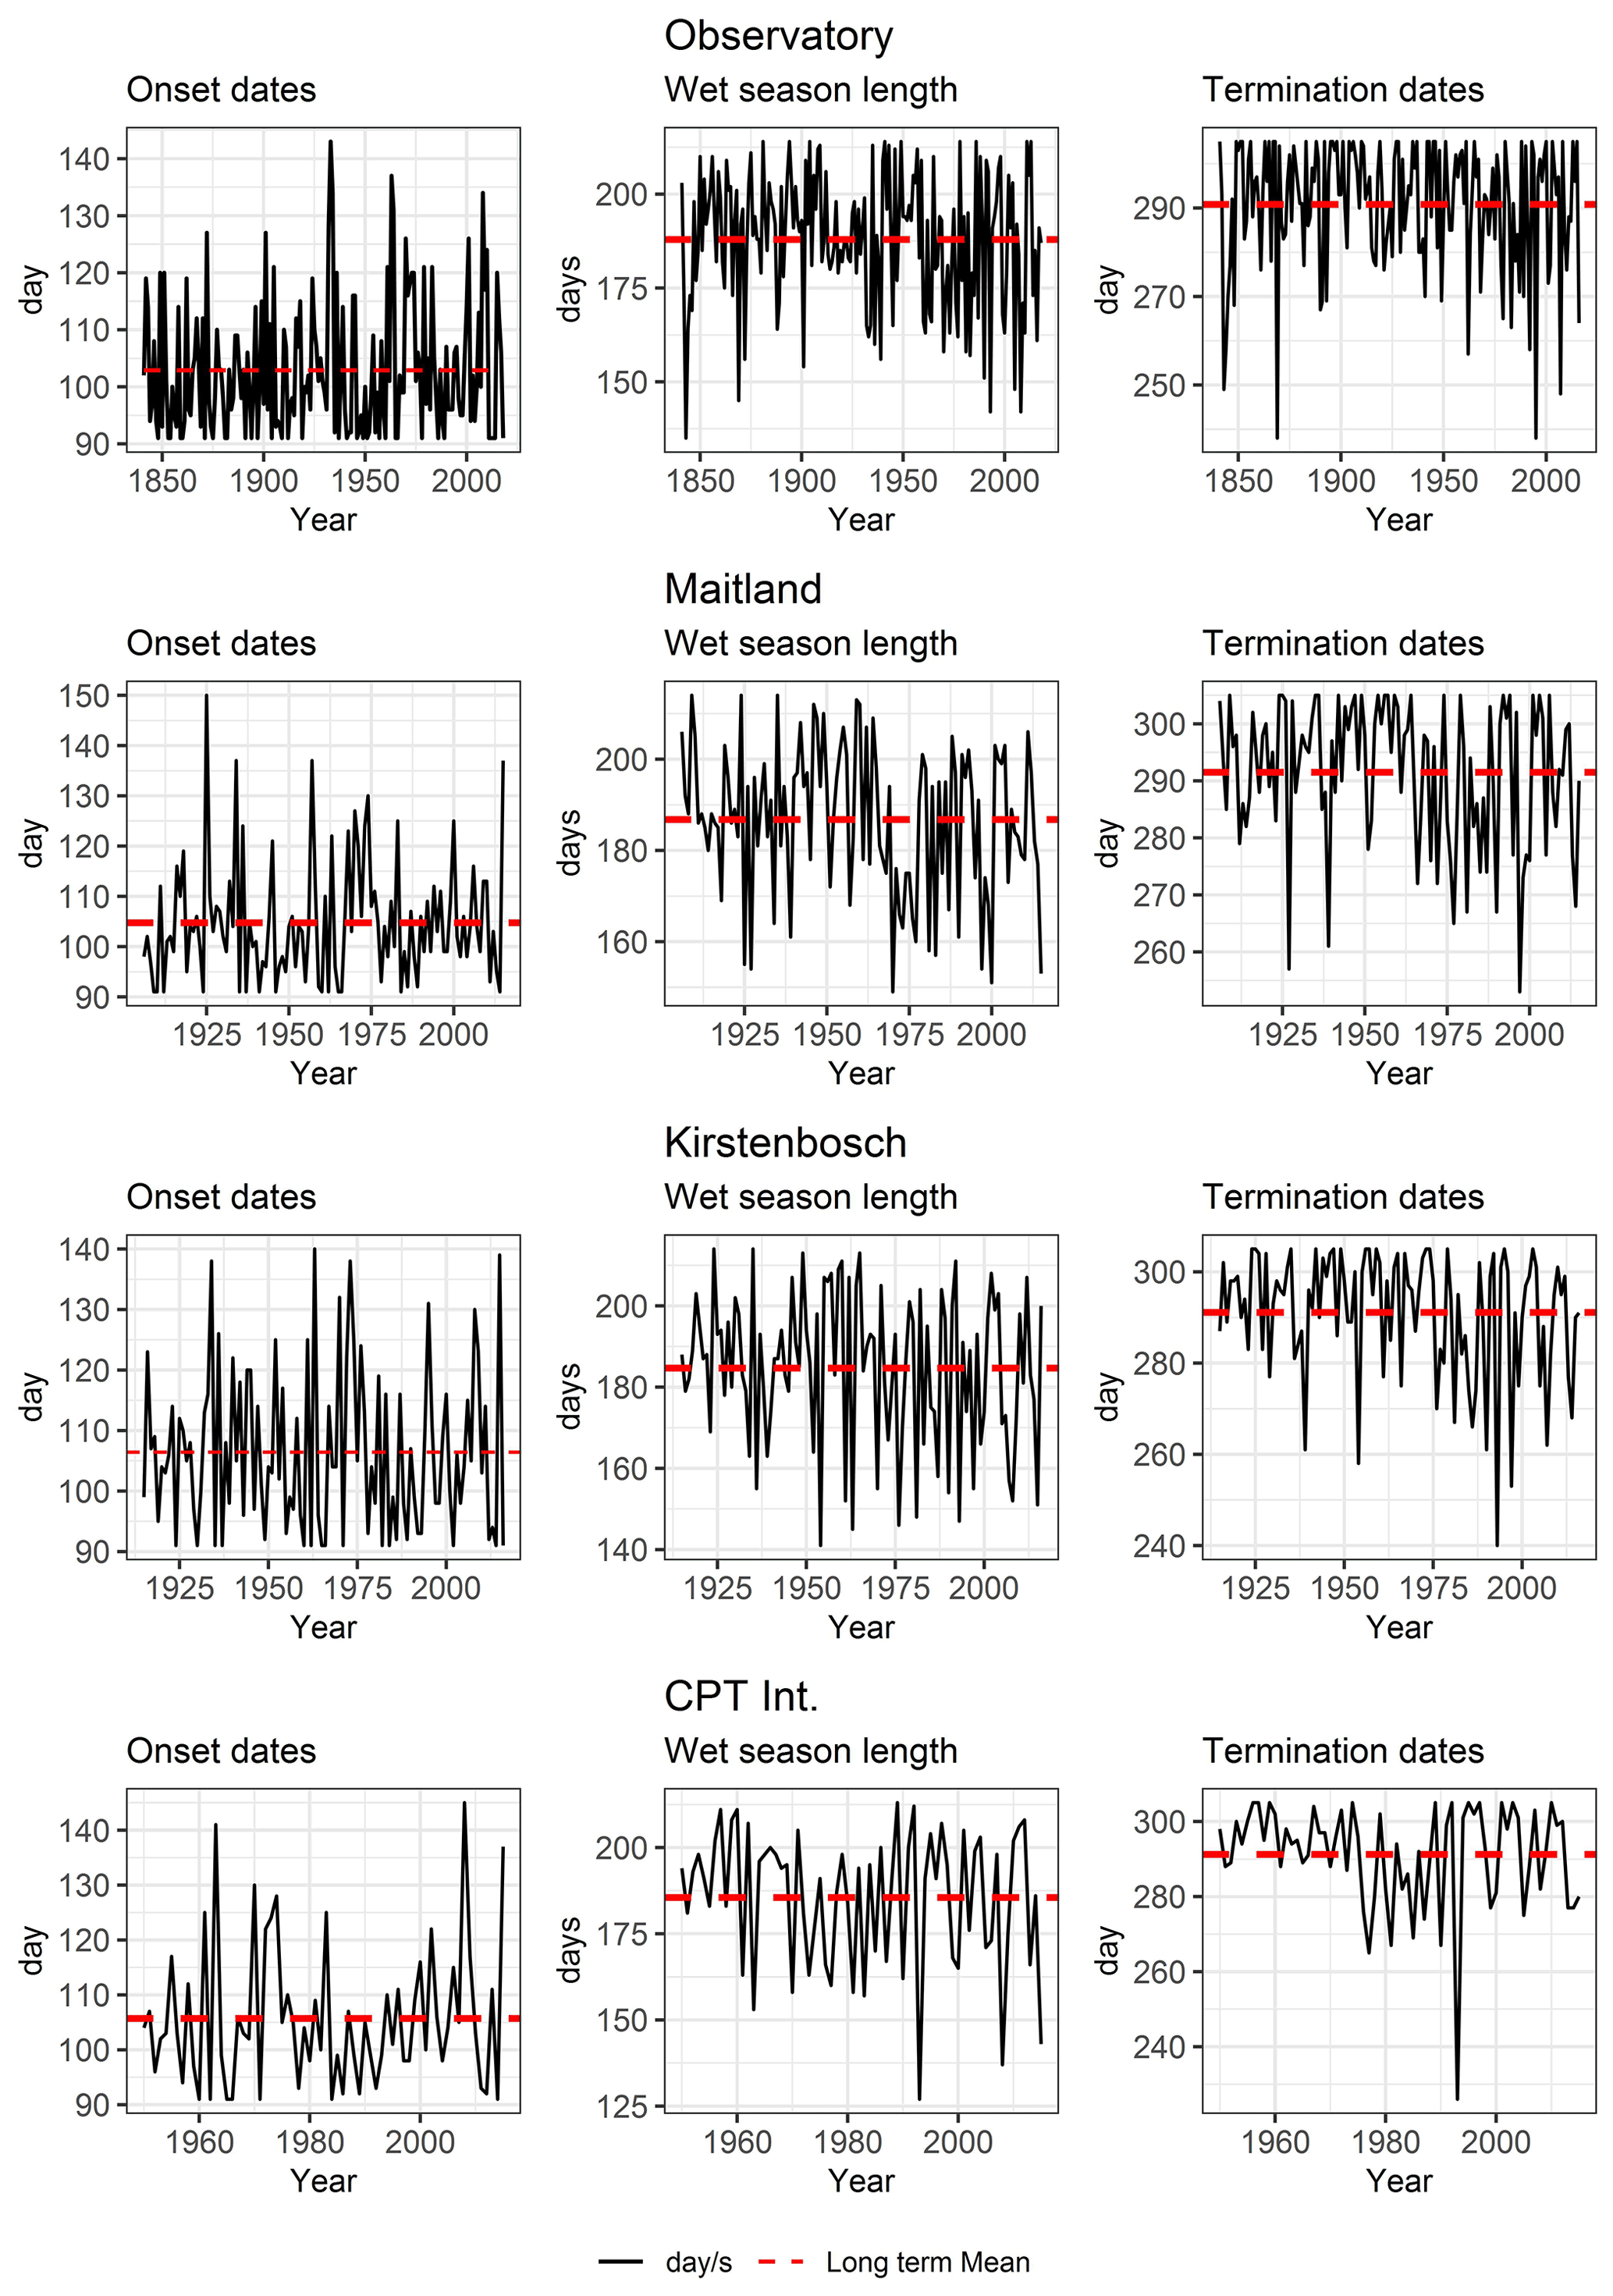
Table 6Wet season characteristic correlations for the four stations: 1950–2018. O is onset day, T is termination day, and L is wet season length. 1 – Observatory, 2 – Maitland, 3 – Kirstenbosch and 4 – Cape Town International. Correlations in italics are for similar characteristics between two stations.
For the SAAO, the average rain season onset and termination dates for the period 1841–2018 are Julian days 103 (13 April) and 291 (18 October) respectively. The latest onset date was 23 May 1933, while the earliest termination date was 26 August 1993. During more recent decades (1958–2018) the mean onset and termination dates have shifted to Julian days 105 (15 April) and 288 (14 October) respectively. Early rainfall onsets (before Julian day 100: 10 April) occurred during the late 1840s to early 1860s, 1940–1960, during the 1980s and 2011–2014. Late rainfall onsets (after Julian day 105; 15 April) occurred during the decade 1930–1939, the latter part of the 1960s to early 1970s, and many years post 1997. Wet seasons have typically ended early (on average before Julian day 290; 17 October) during the most recent decades, starting in 1970. There has been a recent decadal decline in wet season length (−1.4 d per decade) since ca. 1940, especially between 1941 and 1994 (−4.2 d per decade), such that wet seasons since 2000 have only averaged 182 d in length while the long-term (1841–2018) average is 188 d.
To test our method of identifying wet seasons, the proportions of annual rainfall accumulated between onset and termination dates were calculated and compared to the totals for January to December (PWS). The average proportion of annual rainfall at the SAAO during the identified wet seasons is 81 % (1841–2018) (for days ≥1 mm). Over the common period 1950–2018, the other three stations recorded a combined average proportion of 81 % of annual rainfall during wet seasons. The most recent 4 decades (starting 1978) have had the highest proportion (ca. 83 %) of annual rainfall concentrated in the wet season at the SAAO. In addition, 5 years since 1988 have recorded >90 % of annual precipitation during the wet season, which suggests strong inter-seasonal contrasts in rainfall distribution during recent decades.
3.6 Associations with climate modes
Continuous bivariate wavelet analysis was used to investigate the relationships between wet season rainfall variables and possible climate drivers including solar cycles (sunspots), the Southern Annular Mode (SAM) and El Niño–Southern Oscillation using the Southern Oscillation Index (SOI). Wet season variables included are wet day frequency, total number of wet spells, short wet spells (<3 d), long wet spells (>2 d), short dry spells (<6 d), long dry spells (>5 d), season onset day and season length. The averages for indices for months between March and October and subsets of these months were used for SAM, SOI and sunspots. Wavelet coherence between wet season variables and climate indices was analysed in pairs at multiple timescales; these are represented in plots indicating significant coherence at a 5 % significance level (Fig. 11). Partial wavelet coherence was considered for SOI and SAM since these indices are correlated.
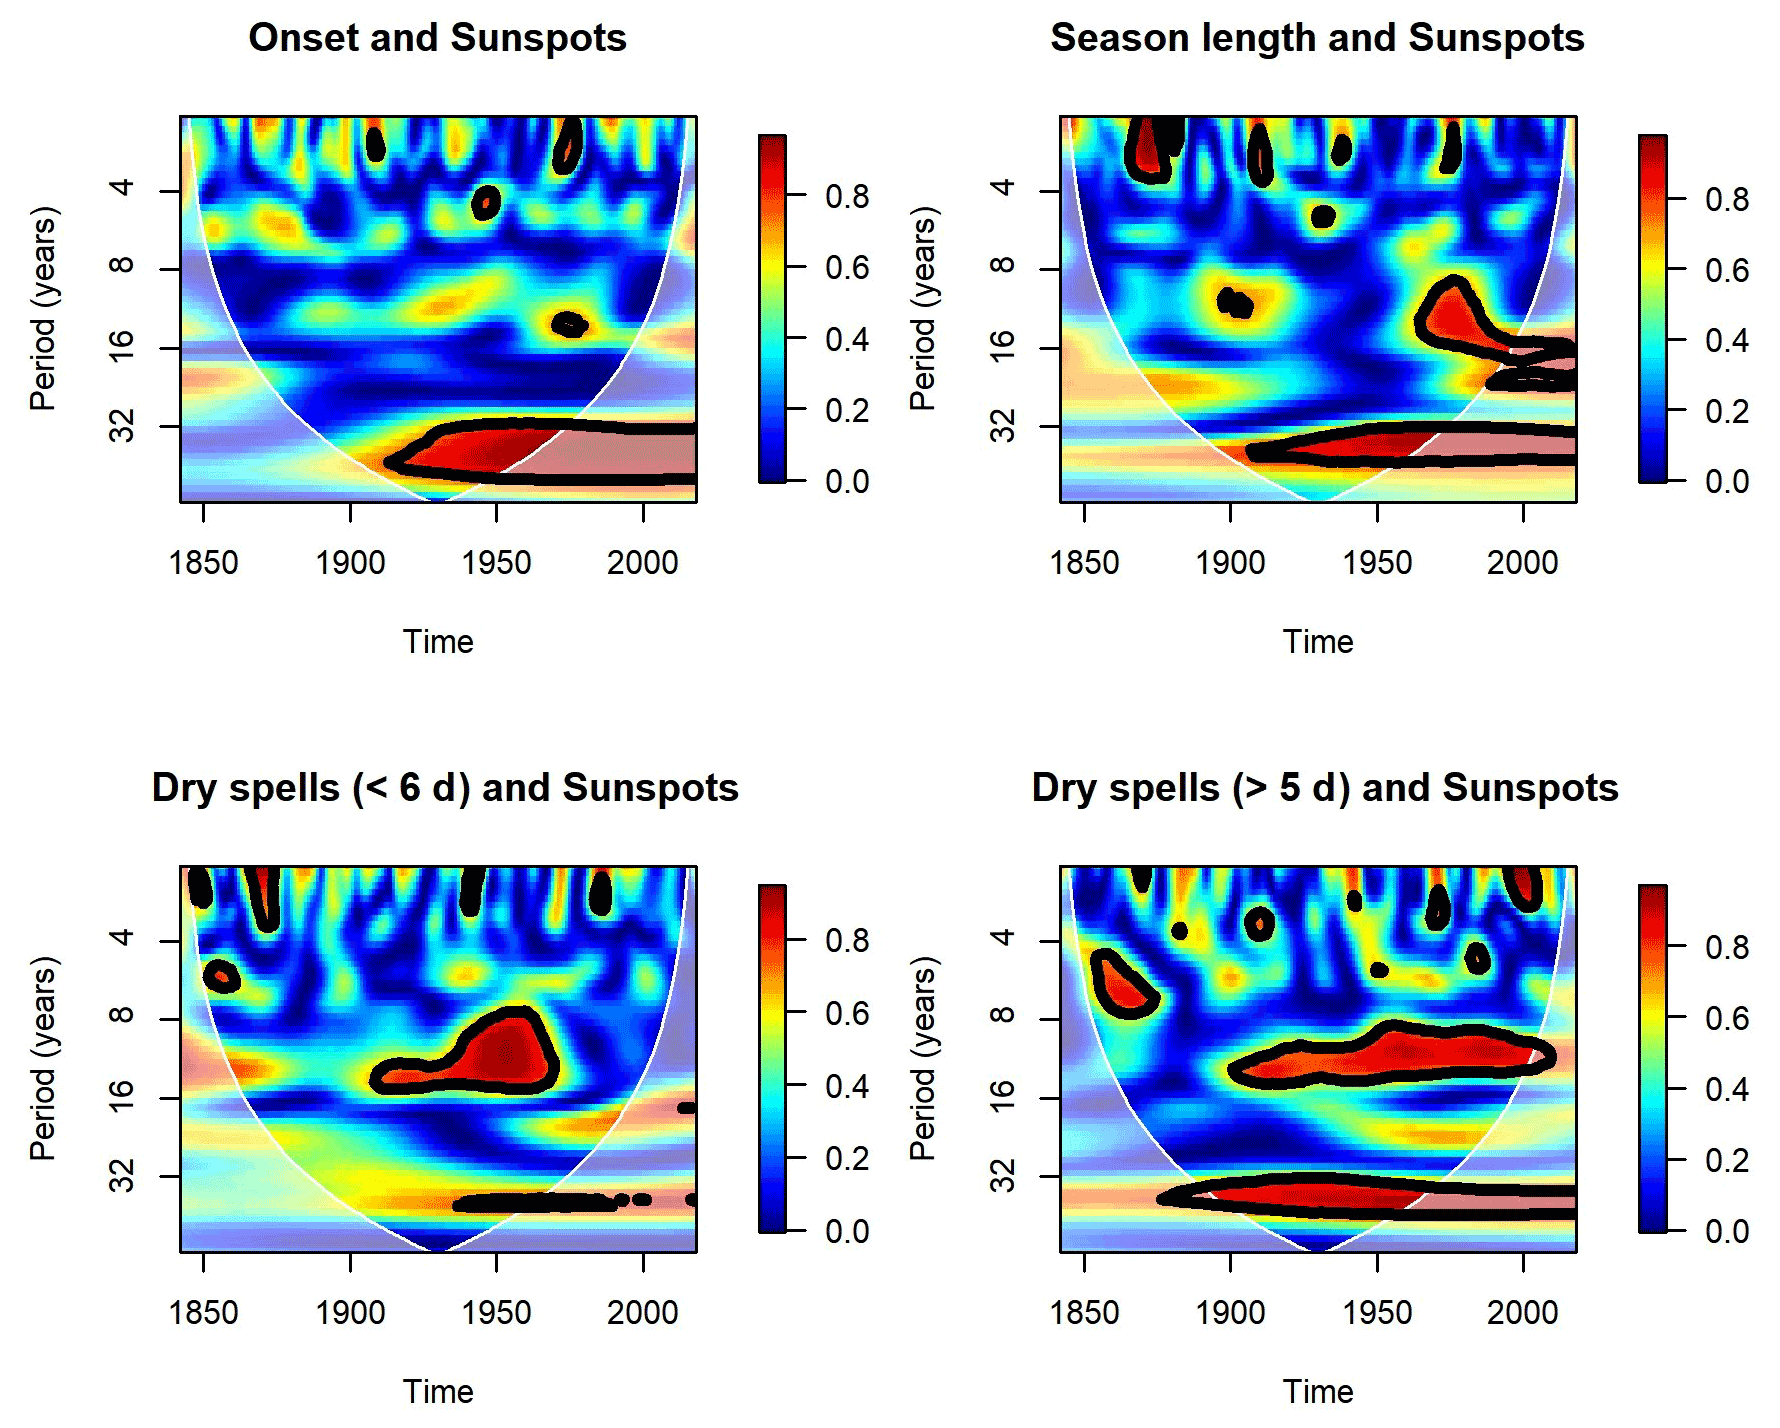
Figure 11Wavelet coherence plots: seasonal rainfall characteristics with solar sunspots. The scale for shaded colours in the plot represents wavelet coherence and is scaled from lowest (blue) to highest (red). Black contour lines show areas of significance (at 5 % level) of the wavelet coherence. The cone of influence is the blocked area (U shaped) with a white foreground.
Figure 11 shows wavelet coherence plots for variables that had significant coherence. Black contour lines in the plots show areas of significance (at 5 % level) of the wavelet coherence. The cone of influence is the blocked area (U shaped) with a white foreground indicating the region where coherence may be inaccurate due to edge effects and zero padding. Significant relationships are observed between the 9–14-year solar cycle and short (≤5 d) dry spells (1908–1964) and also long (≥6 d) dry spells (1905–1998). The longer 32–40-year solar cycle significantly correlates with wet season onset days and season length between 1920 and 1975. Although the relationship has persisted into the 2000s, it is not significant after 1975, as this time frame is in the cone of influence. Similarly, at timescales between 32 and 36 years, there is significant partial coherence between rainfall onset days and the SOI. Wet days, season length and short dry spells show evidence of significant partial coherence with the SAM over 6–12-year timescales from 1890–1912, 1930–1962 and 1918–1938 respectively. The supporting documents provide further details on the dominant timescales for each combination of variables.
Previous studies examining rainfall onset–termination dates, numbers of rain days, wet–dry spells and wet season lengths over various parts of southern Africa have done so using composite datasets but over relatively short periods of investigation (<60 years) (e.g. Tadross et al., 2005, 2009; Moeletsi et al., 2011; Philippon et al., 2012; MacKellar et al., 2014). Although our datasets cannot represent a wide geographic region given that it is based on only four station records, these offer a substantially longer-term (up to 178 years) perspective on wet season rainfall characteristics than do records spanning only a few decades. A long record such as we have presented here is particularly valuable as it can identify trends and interannual variability that may not be detected over shorter (<60 years) periods of investigation and, in addition, offers an opportunity to test associations between such rainfall characteristics and potential causative mechanisms such as ENSO, SAM and solar cycles.
While there is a general positive trend in wet day frequencies over Cape Town through the 19th century, as reflected in the SAAO data, trends during the 20th and early 21st centuries are broadly negative. Such trends are similar to those observed by Burls et al. (2019), who detected a significant decline in wet days since 1900 using data with more than 100 years from weather stations in the wider western Cape region (including SAAO). We identify two periods with significantly high wet day frequencies: 1881–1905 at the SAAO (av. =63.6 d) and during the 1940s (av. =66.8 d at three stations) and 1950s for all stations (av. =63.2 d). A decline in wet day frequencies is observed during the common period from 1950 to 2018 for all stations, although this is only significant at Maitland (−1.0 d per decade) and the SAAO (−1.0 d per decade) during the wet season. Declines are also evident over the 103-year period starting in 1915, for three stations (excluding CPT Int.). However, this is only significant for the SAAO during the wet season. The longer SAAO record indicates that for the period 1880–1940, there was a significant decline in wet day frequencies for both the wet season (−0.2 d per decade) and annual series (−0.5 d per decade). The average wet day frequencies during wet seasons of most recent decades (1958–2018, av. =54.9 d) are similar to that for the period 1841–1877 (av. =56.3 d) for the SAAO. However, the average frequency of wet days for the full year between these periods has changed more significantly from 74.5 and 69.1 d, accounting for an overall decrease over the period 1841–2018. The annual number of wet days during summer dry seasons has thus decreased more significantly than during wet seasons over Cape Town. Long-term trends presented here for Cape Town are also consistent with observations made for the more recent period (1960–2010) by MacKellar et al. (2014), who identified declining trends in rain days over large parts of South Africa, including the western Cape region. Studies have also projected declining rain days and an increase in dry spells for future decades (e.g. Abiodun et al., 2017).
Our methodology determined the onset and termination of wet seasons by establishing the first and last days on which the 5 d running sum of rainfall amounts exceeds the long-term 5 d average rainfall amounts between April and October each year. This method effectively delineates the wet season length as supported by the fact that, on average, it represents 81 % of rainfall (≥1 mm d−1) captured across all years using daily data from the SAAO. Justification for limiting the season onset and end dates to days between 1 April and 31 October is further demonstrated by establishing mean pentad values and their confidence intervals using available daily data for all four stations. These limits prevent the occurrence of false start and end dates and thus the consequent recording of potential long dry spells at the beginning and end of each wet season. These limits can also be adjusted to suit the local climatology by considering the confidence intervals of mean pentad values. Our method is thus not reliant on the growing season for specific crops, as used by Tadross et al. (2005) and Hachigonta et al. (2008). This method is reinforced by patterns observed in the pentad profiles across all decades for the period 1841–2018 at the SAAO. In addition, mid-season dry spells do not affect our definition of the wet season, unlike the method employed by Dunning et al. (2016).
Our study demonstrates that wet seasons in Cape Town were longest during the periods 1851–1865, 1890–1913 and 1940–1959 (av. >195 d) and shortest over the periods 1841–1849, 1930–1939, 1963–1990 and 1998–2010 (av. <181 d), with most recent trends indicating a shortening of the wet season by 1.4 d per decade since 1941. The identified recent shortening of the wet season is consistent with findings from other studies for the southwestern Cape region (e.g. Tadross et al., 2009; du Plessis, 2017; Sousa et al., 2018; Ndebele et al., 2020). But shortening wet seasons during recent decades have also been observed for several other sub-Saharan regions of Africa (e.g. Sarr, 2012; Oguntunde et al., 2014; Dunning et al., 2018; Seregina et al., 2019; Sibanda et al., 2020) and are thus a concern for both summer and winter rainfall regions of the continent. Later onset dates for Cape Town are prevalent during the periods 1924–1939, 1961–1980 and 1999–2010 and are projected to become even further delayed in years to come (Mahlalela et al., 2019). Recent decadal shortening of the Cape peninsular wet season is thus a consequence of both later onset (after Julian day 105; 15 April) and earlier termination (before Julian day 291; 19 October) dates. The pentad profiles provide a decadal overview that combines wet season onset and termination dates, the distribution of rainfall during the wet season and wet spell lengths. Our data show that some years over the period 2010–2018 had incidences of uncharacteristically high rainfall events during summer months, as also observed by de Kock et al. (2021). Although the most recent decade (2010–2018) experienced contracted rainfall seasons, the years 2015–2017 mark an outstanding drought, which was not particularly different to the situation over the period 1930–1939. To this end, it is important to place recent drought perspectives in context with both recent decades and longer-term historic events. The implication from the longer record is that past periods of shortened rain seasons with drought were followed again by wetter periods and that patterns in variability continue into the future given their associations with a variety of climate modes.
Several previous studies have considered the association between wet season characteristics and climate modes, such as ENSO and SAM (e.g. Reason et al., 2005; Tadross et al., 2009; Moeletsi et al., 2011; Raut et al., 2014; Mahlalela et al., 2019), but have been temporally constrained in their analyses. Given our 178-year rainfall record, we have now ascertained interannual and interdecadal variability sustained over longer time frames associated with such climate modes. Results demonstrate that quasi-decadal variability (7–10 years) in onset days and season lengths is associated with SAM, while variability in dry spell lengths (9–14 years) is connected to the solar cycle. Interdecadal variability (32–40 years) in wet season onsets and lengths significantly correlates with long solar cycles of 32–38 years during the 20th century, starting from 1920, as also with SAM. Should such associations still operate to a greater or lesser extent during the 21st century, then some of the recent late onset dates and shorter seasons might be attributed to the effects of SOI and SAM variability. Such associations suggest that these climate modes, in combination, have influenced seasonal characteristics of rainfall over Cape Town and adjacent regions during the recent past and are likely to continue to exercise an influence in the future (to a greater or lesser extent).
Discussions concerning recent, current and future (forthcoming years) wet season characteristics should take cognizance of the underlying interannual variability associated with climate modes, as discussed in this paper. This has implications for appropriate forecasting and planning of forthcoming wet seasons in the region, not least because of it being a water-stressed region and one that is agriculturally (fruit and grain agriculture) important. Agricultural planning and production are strongly influenced by and sensitive to such rainfall patterns given the semi-arid climate. For instance, late onsets of the wet season may affect the planting phase in crop production, with short wet seasons potentially resulting in low production yields. Critical phases in crop growth may also be negatively impacted by long dry spells during the wet season. To this end, an improved understanding of regional rainfall patterns associated with the combined role of influencing factors, as demonstrated in this paper, is thus of value for short- to medium-term precipitation forecasts and associated societal (e.g. agricultural) planning.
The software code is currently not available as it is part of PhD work that has not yet been published.
The data were received from the South African Weather Service (SAWS). The data we received cannot be provided to a third party but can be requested from SAWS at https://www.weathersa.co.za/ (last access: 5 October 2021; SAWS, 2022).
The supplement related to this article is available online at: https://doi.org/10.5194/cp-18-2463-2022-supplement.
NEN prepared the data, designed the methodology, carried out statistical analysis of the data including preparation of software codes using R statistical software, and produced figures and tables. NEN wrote the paper with contributions from SG and HH. SG supervised the research. HH also assisted with the methodology and statistical analysis.
The contact author has declared that none of the authors has any competing interests.
Publisher's note: Copernicus Publications remains neutral with regard to jurisdictional claims in published maps and institutional affiliations.
We thank the South African Weather Service for providing rainfall data.
This paper was edited by Keely Mills and reviewed by Linden Ashcroft and Neil Macdonald.
Abba Omar, S. and Abiodun, B. J.: Characteristics of cut-off lows during the 2015–2017 drought in the Western Cape, South Africa, Atmos. Res., 235, 104772, https://doi.org/10.1016/j.atmosres.2019.104772, 2020.
Abiodun, B. J., Adegoke, J., Abatan, A. A., Ibe C. A., Egbebiyi, T. S., Engelbrecht, F., and Pinto, I.: Potential impacts of climate change on extreme precipitation over four African coastal cities, Climatic Change, 143, 399–413, https://doi.org/10.1007/s10584-017-2001-5, 2017.
Amekudzi, L. K., Yamba, E. I., Preko, K., Asare, E. O., Aryee, J., Baidu, M., and Codjoe, S. N. A.: Variabilities in Rainfall Onset, Cessation and Length of Rainy Season for the Various Agro-Ecological Zones of Ghana, Climate, 3, 416–434, https://doi.org/10.3390/cli3020416, 2015.
Boyard-Micheau, J., Camberlin, P., Philippon, N., and Moron, V.: Regional-Scale Rainy Season Onset Detection: A New Approach Based on Multivariate Analysis, J. Climate, 26, 8916–8928, https://doi.org/10.1175/JCLI-D-12-00730.1, 2013.
Burls, N. J., Blamey, R. C., Cash, B. A., Swenson, E. T., Fahad, A. al, Bopape, M-J. M., Straus, D. M., and Reason, C. J. C.: The Cape Town “Day Zero” drought and Hadley cell expansion, npj Climate and Atmospheric Science, 2, 1–8, https://doi.org/10.1038/s41612-019-0084-6, 2019.
Byakatonda, J., Parida, B. P., Kenabatho, P. K., and Moalafhi, D. B.: Prediction of onset and cessation of austral summer rainfall and dry spell frequency analysis in semiarid Botswana, Theor. Appl. Climatol., 135, 101–117, https://doi.org/10.1007/s00704-017-2358-4, 2018.
Byakatonda, J., Parida, B. P., Kenabatho, P. K., and Moalafhi, D. B.: Prediction of onset and cessation of austral summer rainfall and dry spell frequency analysis in semiarid Botswana. Theor. Appl. Climatol., 135, 101–117, https://doi.org/10.1007/s00704-017-2358-4, 2019.
Camberlin, P., Moron, V., Okoola, R., Philippon, N., and Gitau, W.: Components of rainy seasons' variability in Equatorial East Africa: onset, cessation, rainfall frequency and intensity, Theor. Appl. Climatol., 98, 237–249, https://doi.org/10.1007/s00704-009-0113-1, 2009.
De Kock, W. M. D., Blamey, R. C., and Reason, C. J. C.: Large Summer Rainfall Events and Their Importance in Mitigating Droughts over the South Western Cape, South Africa, J. Hydrometeorol., 22, 587–599, https://doi.org/10.1175/JHM-D-20-0123.1, 2021.
Dieppois, B., Pohl B., Rouault, M., New, M., Lawler, D., and Keenlyside, N.: Interannual to interdecadal variability of winter and summer southern African rainfall, and their teleconnections, J. Geophys. Res.-Atmos., 121, 6215–6239, https://doi.org/10.1002/2015JD024576, 2016.
du Plessis, J. A.: An investigation into the evidence of seasonal rainfall pattern shifts in the Western Cape, South Africa, J. S. Afr. Inst. Civ. Eng., 59, 47–55, https://doi.org/10.17159/2309-8775/2017/v59n4a5, 2017.
Dunning, C. M., Black, E. C. L., and Allan, R. P.: The onset and cessation of seasonal rainfall over Africa, J. Geophys. Res.-Atmos., 121, 11405–11424, https://doi.org/10.1002/2016JD025428, 2016.
Dunning, C. M., Black, E., and Allan, R. P.: Later Wet Seasons with More Intense Rainfall over Africa under Future Climate Change, J. Climate, 31, 9719–9738, https://doi.org/10.1175/JCLI-D-18-0102.1, 2018.
Dyer, T. G. J.: Solar Activity and Rainfall Variation over Southern Africa, S. Afr. J. Sci., 71, 369–372, 1975.
Froidurot, S. and Diedhiou, A.: Characteristics of wet and dry spells in the West African monsoon system, Atmos. Sci. Lett., 18, 125–131, https://doi.org/10.1002/asl.734, 2017.
Giráldez, L., Silva, Y., Zubieta R., and Sulca J.: Change of the Rainfall Seasonality Over Central Peruvian Andes: Onset, End, Duration and Its Relationship With Large-Scale Atmospheric Circulation, Climate, 8, 23, https://doi.org/10.3390/cli8020023, 2020.
Gong, D. and Wang, S.: Definition of Antarctic Oscillation index, Geophys. Res. Lett., 26, 459–462. https://doi.org/10.1029/1999GL900003, 1999.
Goodness, J. and Anderson, P. M. L.: Local Assessment of Cape Town: Navigating the Management Complexities of Urbanization, Biodiversity, and Ecosystem Services in the Cape Floristic Region, in: Urbanization, Biodiversity and Ecosystem Services: Challenges and Opportunities, Springer, Dordrecht, 461–484, https://doi.org/10.1007/978-94-007-7088-1_24, 2013.
Grinsted, A., Moore, J. C., and Jevrejeva, S.: Application of the cross wavelet transform and wavelet coherence to geophysical time series, Nonlin. Processes Geophys., 11, 561–566, https://doi.org/10.5194/npg-11-561-2004, 2004.
Hachigonta, S., Reason, C. J. C., and Tadross, M.: An analysis of onset date and rainy season duration over Zambia, Theor. Appl. Clim., 91, 229–243, https://doi.org/10.1007/s00704-007-0306-4, 2008.
Hamed, K. H.: Enhancing the effectiveness of prewhitening in trend analysis of hydrologic data, J. Hydrol., 368, 143–155, https://doi.org/10.1016/j.jhydrol.2009.01.040, 2009.
Hamed, K. H. and Ramachandra Rao, A.: A modified Mann-Kendall trend test for autocorrelated data, J. Hydrol., 204, 182–196, https://doi.org/10.1016/S0022-1694(97)00125-X, 1998.
Joshi, N., Gupta, D., Suryavanshi, S., Adamowski, J., and Madramootoo, C. A.: Analysis of trends and dominant periodicities in drought variables in India: A wavelet transform based approach, Atmos. Res., 182, 200–220, https://doi.org/10.1016/j.atmosres.2016.07.030, 2016.
Kendall, M. G.: Rank correlation methods, Griffin, Oxford, England, ISBN: B0007J471M, 1948.
Knoben, W. J. M., Woods, R. A., and Freer, J. E.: Global bimodal precipitation seasonality: A systematic overview, Int. J. Climatol., 39, 558–567, https://doi.org/10.1002/joc.5786, 2019.
Kruger, A. C.: Observed trends in daily precipitation indices in South Africa: 1910–2004, Int. J. Climatol., 26, 2275–2285, https://doi.org/10.1002/joc.1368, 2006.
Kusunoki, S., Mizuta, R., and Matsueda, M.: Future changes in the East Asian rain band projected by global atmospheric models with 20-km and 60-km grid size, Clim. Dynam., 37, 2481–2493, https://doi.org/10.1007/s00382-011-1000-x, 2011.
Lacombe, G., McCartney, M., and Forkuor, G.: Drying climate in Ghana over the period 1960–2005: evidence from the resampling-based Mann-Kendall test at local and regional levels, Hydrolog. Sci. J., 57, 1594–1609, https://doi.org/10.1080/02626667.2012.728291, 2012.
Laurenz, L., Lüdecke, H.-J., and Lüning, S.: Influence of solar activity changes on European rainfall, J. Atmos. Sol.-Terr. Phys., 185, 29–42, https://doi.org/10.1016/j.jastp.2019.01.012, 2019.
Liebmann, B. and Marengo, J.: Interannual Variability of the Rainy Season and Rainfall in the Brazilian Amazon Basin, J. Climate, 14, 4308–4318, https://doi.org/10.1175/1520-0442(2001)014<4308:IVOTRS>2.0.CO;2, 2001.
Liebmann, B., Bladé, I., Kiladis, G. N., Carvalho, L. M. V., B. Senay, G., Allured, D., Leroux, S., and Funk, C.: Seasonality of African Precipitation from 1996 to 2009, J. Climate, 25, 4304–4322, https://doi.org/10.1175/JCLI-D-11-00157.1, 2012.
MacKellar, N., New, M., and Jack, C.: Observed and modelled trends in rainfall and temperature for South Africa: 1960–2010, S. Afri. J. Sci., 110, 1–13, 2014.
Mahlalela, P. T., Blamey, R. C., and Reason, C. J. C.: Mechanisms behind early winter rainfall variability in the southwestern Cape, South Africa, Clim. Dynam., 53, 21–39, https://doi.org/10.1007/s00382-018-4571-y, 2019.
Mann, H. B.: Nonparametric Tests Against Trend, Econometrica, 13, 245–259, https://doi.org/10.2307/1907187, 1945.
Marengo, J. A., Liebmann, B., Kousky, V. E., Filizola, N. P., and Wainer, I. C.: Onset and End of the Rainy Season in the Brazilian Amazon Basin, J. Climate, 14, 833–852, https://doi.org/10.1175/1520-0442(2001)014<0833:OAEOTR>2.0.CO;2, 2001.
Martin-Vide, J. and Gomez, L.: Regionalization of Peninsular Spain based on the length of dry spells, Int. J. Climatol., 19, 537–555, https://doi.org/10.1002/(SICI)1097-0088(199904)19:5<537::AID-JOC371>3.0.CO;2-X, 1999.
Mason, S. J. and Tyson, P. D.: The modulation of sea surface temperature and rainfall associations over southern Africa with solar activity and the quasi-biennial oscillation, J. Geophys. Res.-Atmos., 97, 5847–5856, https://doi.org/10.1029/91JD02189, 1992.
Moeletsi, M. E., Walker, S., and Landman, W. A.: ENSO and implications on rainfall characteristics with reference to maize production in the Free State Province of South Africa, Phys. Chem. Earth, 36, 715–726, https://doi.org/10.1016/j.pce.2011.07.043, 2011.
Moron, V. and Robertson, A. W.: Interannual variability of Indian summer monsoon rainfall onset date at local scale, Int. J. Climatol., 34, 1050–1061, https://doi.org/10.1002/joc.3745, 2014.
Mugalavai, E. M., Kipkorir, E. C., Raes, D., and Rao M. S.: Analysis of rainfall onset, cessation and length of growing season for western Kenya, Agr. Forest Meteorol., 148, 1123–1135, https://doi.org/10.1016/j.agrformet.2008.02.013, 2008.
Mupangwa, W., Walker, S., and Twomlow, S.: Start, end and dry spells of the growing season in semi-arid southern Zimbabwe, J. Arid Environ., 75, 1097–1104, https://doi.org/10.1016/j.jaridenv.2011.05.011, 2011.
Muthuwatta, L., Perera, H. P. T. W., Eriyagama, N., Surangika, K. B. N. U., and Premachandra, W. W.: Trend and variability of rainfall in two river basins in Sri Lanka: an analysis of meteorological data and farmers' perceptions, Water Int., 42, 981–999, https://doi.org/10.1080/02508060.2017.1406784, 2017.
Nastos, P. T. and Zerefos, C. S.: Spatial and temporal variability of consecutive dry and wet days in Greece, Atmos. Res., 94, 616–628, https://doi.org/10.1016/j.atmosres.2009.03.009, 2009.
Ndebele, N. E., Grab, S., and Turasie, A.: Characterizing rainfall in the south-western Cape, South Africa: 1841–2016, Int. J. Climatol., 40, 1992–2014, https://doi.org/10.1002/joc.6314, 2020.
Ng, E. K. W. and Chan, J. C. L.: Geophysical Applications of Partial Wavelet Coherence and Multiple Wavelet Coherence, J. Atmos. Ocean. Tech., 29, 1845–1853, https://doi.org/10.1175/JTECH-D-12-00056.1, 2012.
Ngetich, K. F., Mucheru-Muna, M., Mugwe, J. N., Shisanya, C. A., Diels, J., and Mugendi, D. N.: Length of growing season, rainfall temporal distribution, onset and cessation dates in the Kenyan highlands, Agr. Forest Meteorol., 188, 24–32, https://doi.org/10.1016/j.agrformet.2013.12.011, 2014.
Nicholls, N.: A system for predicting the onset of the north Australian wet-season, J. Climatol., 4, 425–435, https://doi.org/10.1002/joc.3370040407, 1984.
Nitka, W. and Burnecki, K.: Impact of solar activity on precipitation in the United States, Phys. A, 527, 121387, https://doi.org/10.1016/j.physa.2019.121387, 2019.
Obarein, O. A. and Amanambu, A. C.: Rainfall timing: variation, characteristics, coherence, and interrelationships in Nigeria, Theor. Appl. Climatol., 137, 2607–2621, https://doi.org/10.1007/s00704-018-2731-y, 2019.
Odekunle, T. O.: Rainfall and the length of the growing season in Nigeria, Int. J. Climatol., 24, 467–479, https://doi.org/10.1002/joc.1012, 2004.
Oguntunde, P. G., Lischeid, G., Abiodun, B. J., and Dietrich, O.: Analysis of spatial and temporal patterns in onset, cessation and length of growing season in Nigeria, Agr. Forest Meteorol., 194, 77–87, https://doi.org/10.1016/j.agrformet.2014.03.017, 2014.
Owusu, K. and Waylen, P. R.: The changing rainy season climatology of mid-Ghana, Theor. Appl. Climatol., 112, 419–430, https://doi.org/10.1007/s00704-012-0736-5, 2013.
Philippon, N., Rouault, M., Richard, Y., and Favre, A.: The influence of ENSO on winter rainfall in South Africa, Int. J. Climatol., 32, 2333–2347, https://doi.org/10.1002/joc.3403, 2012.
Raut, B. A., Jakob, C., and Reeder, M. J.: Rainfall Changes over Southwestern Australia and Their Relationship to the Southern Annular Mode and ENSO, J. Climate, 27, 5801–5814, https://doi.org/10.1175/JCLI-D-13-00773.1, 2014.
Reason, C. J. C. and Rouault, M.: ENSO-like decadal variability and South African rainfall, Geophys. Res. Lett., 29, 16-1–16-4, https://doi.org/10.1029/2002GL014663, 2002.
Reason C. J. C. and Rouault M.: Links between the Antarctic Oscillation and winter rainfall over western South Africa, Geophys. Res. Lett., 32, L07705, https://doi.org/10.1029/2005GL022419, 2005.
Reason, C. J. C., Rouault, M., Melice, J.-L., and Jagadheesha, D.: Interannual winter rainfall variability in SW South Africa and large scale ocean–atmosphere interactions, Meteorol. Atmos. Phys., 80, 19–29, https://doi.org/10.1007/s007030200011, 2002.
Reason, C. J. C., Hachigonta, S., and Phaladi, R. F.: Interannual variability in rainy season characteristics over the Limpopo region of southern Africa, Int. J. Climatol., 25, 1835–1853, https://doi.org/10.1002/joc.1228, 2005.
Rivoire, P., Tramblay, Y., Neppel, L., Hertig, E., and Vicente-Serrano, S. M.: Impact of the dry-day definition on Mediterranean extreme dry-spell analysis, Nat. Hazards Earth Syst. Sci., 19, 1629–1638, https://doi.org/10.5194/nhess-19-1629-2019, 2019.
Ropelewski, C. F. and Jones, P. D.: An Extension of the Tahiti–Darwin Southern Oscillation Index, Mon. Weather Rev., 115, 2161–2165, https://doi.org/10.1175/1520-0493(1987)115<2161:AEOTTS>2.0.CO;2, 1987.
Saeed, F., Bethke, I., Fischer, E., Legutke, S., Shiogama, H., Stone, D. A., and Schleussner, C.-F.: Robust changes in tropical rainy season length at 1.5 ∘C and 2 ∘C, Environ. Res. Lett., 13, 064024, https://doi.org/10.1088/1748-9326/aab797, 2018.
Sarr, B.: Present and future climate change in the semi-arid region of West Africa: a crucial input for practical adaptation in agriculture, Atmos. Sci. Lett., 13, 108–112, https://doi.org/10.1002/asl.368, 2012.
SAWS (South African Weather Service): https://www.weathersa.co.za/ (last access: 5 October 2021), 2022.
Seregina, L. S., Fink, A. H., van der Linden, R., Elagib, N. A., and Pinto, J. G.: A new and flexible rainy season definition: Validation for the Greater Horn of Africa and application to rainfall trends, Int. J. Climatol., 39, 989–1012, https://doi.org/10.1002/joc.5856, 2019.
Sibanda, S., Grab, S. W., and Ahmed, F.: Long-term rainfall characteristics in the Mzingwane catchment of south-western Zimbabwe, Theor. Appl. Climatol., 139, 935–948, https://doi.org/10.1007/s00704-019-03020-6, 2020.
Singh, N. and Ranade, A.: The Wet and Dry Spells across India during 1951–2007, J. Hydrometeorol., 11, 26–45, https://doi.org/10.1175/2009JHM1161.1, 2010.
Sousa, P. M., Blamey, R. C., Reason, C. J. C., Ramos, A. M., and Trigo, R. M.: The 'Day Zero' Cape Town drought and the poleward migration of moisture corridors, Environ. Res. Lett., 13, 124025, https://doi.org/10.1088/1748-9326/aaebc7, 2018.
Tadross, M., Suarez, P., Lotsch, A., Hachigonta, S. P., Mdoka, M. L., Unganai, L. S., Lucio F., Kamdonyo, D., and Muchinda, M.: Growing-season rainfall and scenarios of future change in southeast Africa: implications for cultivating maize, Clim. Res., 40, 147–161, https://doi.org/10.3354/cr00821, 2009.
Tadross, M. A., Hewitson, B. C., and Usman, M. T.: The Interannual Variability of the Onset of the Maize Growing Season over South Africa and Zimbabwe, J. Climate, 18, 3356–3372, https://doi.org/10.1175/JCLI3423.1, 2005.
Tyson, P. D.: Atmospheric circulation variations and the occurrence of extended wet and dry spells over Southern Africa, Int. J. Climatol., 1, 115–130, https://doi.org/10.1002/joc.3370010203, 1981.
Valdes-Abellan, J., Pardo, M. A., and Tenza-Abril, A. J.: Observed precipitation trend changes in the western Mediterranean region, Int. J. Climatol., 37, 1285–1296, https://doi.org/10.1002/joc.4984, 2017.
Vanlommel, P., Cugnon, P., van der Linden, R. A. M., Berghmans, D., and Clette, F.: The Sidc: World Data Center for the Sunspot Index, Sol. Phys., 224, 113–120, https://doi.org/10.1007/s11207-005-6504-2, 2004.
Yue, S. and Wang, C.: The Mann-Kendall Test Modified by Effective Sample Size to Detect Trend in Serially Correlated Hydrological Series, Water Resour. Manag., 18, 201–218, https://doi.org/10.1023/B:WARM.0000043140.61082.60, 2004.