the Creative Commons Attribution 4.0 License.
the Creative Commons Attribution 4.0 License.
 | 17 Oct 2022
Sub-millennial climate variability from high-resolution water isotopes in the EPICA Dome C ice core
Antoine Grisart
Mathieu Casado
Vasileios Gkinis
Bo Vinther
Philippe Naveau
Mathieu Vrac
Thomas Laepple
Bénédicte Minster
Frederic Prié
Barbara Stenni
Elise Fourré
Hans Christian Steen-Larsen
Jean Jouzel
Martin Werner
Valérie Masson-Delmotte
Maria Hoerhold
Trevor Popp
Amaelle Landais
The EPICA Dome C (EDC) ice core provides the longest continuous climatic record, covering the last 800 000 years (800 kyr). A unique opportunity to investigate decadal to millennial variability during past glacial and interglacial periods is provided by the high-resolution water isotopic record (δ18O and δD) available for the EDC ice core. We present here a continuous compilation of the EDC water isotopic record at a sample resolution of 11 cm, which consists of 27 000 δ18O measurements and 7920 δD measurements (covering, respectively, 94 % and 27 % of the whole EDC record), including published and new measurements (2900 for both δ18O and δD) for the last 800 kyr. Here, we demonstrate that repeated water isotope measurements of the same EDC samples from different depth intervals obtained using different analytical methods are comparable within analytical uncertainty. We thus combine all available EDC water isotope measurements to generate a high-resolution (11 cm) dataset for the past 800 kyr. A frequency decomposition of the most complete δ18O record and a simple assessment of the possible influence of diffusion on the measured profile shows that the variability at the multi-decadal to multi-centennial timescale is higher during glacial than during interglacial periods and higher during early interglacial isotopic maxima than during the Holocene. This analysis shows as well that during interglacial periods characterized by a temperature optimum at the beginning, the multi-centennial variability is strongest over this temperature optimum.
- Article
(3636 KB) - Full-text XML
-
Supplement
(1045 KB) - BibTeX
- EndNote


Water stable isotopes (oxygen, δ18O, and hydrogen, δD) in ice cores are valuable proxy records that can be used to reconstruct past temperatures in polar regions. The water isotopic composition from an ice core sample is classically measured with the delta notation (δ), which expresses the variations of the isotopic ratio of heavy to light isotopes in the water molecule (i.e. 18O 16O and D H for δ18O and δD). During air mass transportation, distillation of moisture from the low-latitude regions of evaporation to the polar regions leads to a preferential loss of heavy isotopes (HO and HD16O vs. HO) during successive precipitation events and hence to a decrease of δ18O and δD toward cold regions. Despite known limitations due to temporal changes in intermittency of precipitation (Casado et al., 2020), vapor origin and transport (Helsen et al., 2006) and sea ice extent (Noone, 2004), and changes in condensation vs. surface temperatures (Buizert et al., 2021) or deposition and post-deposition effects (Casado et al., 2018), the spatial relationship between surface temperature and surface snow δD and δ18O has long been used to establish an isotopic palaeothermometer to infer past temperature variations, at least qualitatively (Jouzel et al., 2013).
Today, the oldest continuous isotopic record from ice cores is that retrieved through the European Project for Ice Coring Antarctica (EPICA) Dome C ice core (EDC), which covers the last 800 000 years (800 kyr) (Jouzel et al., 2007). The first analyses of water isotopic composition (δD) over the EDC ice core were performed at ∼ 4 m resolution and unveiled the δD variations over eight glacial–interglacial cycles (EPICA community members, 2004). Several years later, measurements of δD in bag samples (continuous 55 cm pieces of the EDC ice core) evidenced millennial-scale variability over the glacial periods in Antarctica (Jouzel et al., 2007; Stenni et al., 2010). In order to explore potential changes in high-frequency variability between interglacial periods, Pol et al. (2010, 2011, 2014) used 11 cm resolution δD measurements over interglacial periods during Marine Isotopic Stages (MIS) 5, 11 and 19, i.e. the periods between 112 and 134 ka (i.e. kyr before present, where “present” is taken to be 1950 AD), between 392 and 427 ka, and between 747 and 800 ka, respectively. Landais et al. (2015) focused on 11 cm resolution δ18O over the last glacial period back to 60 ka.
Pol et al. (2014) used the high-resolution water isotopic signals over the MIS 5 and 11 interglacial periods to estimate the relative variations of decadal to centennial climate variability during these interglacial periods with respect to the Holocene (Pol et al., 2011, 2014). Over the last glacial period, the high-resolution δ18O record showed an enhanced amplitude of the multi-decadal to centennial variability during the warm phases of the Antarctic Isotopic Maxima, AIM (Landais et al., 2015). These AIM events are key climatic features of the last glacial period: they are counterparts to the abrupt temperature increases in the Northern Hemisphere that were first identified in the Greenland ice cores (Dansgaard, 1985; Blunier and Brook, 2001; EPICA community members, 2004).
High-resolution water isotopic measurements over the EDC ice core are hence key to documenting the temporal patterns of climatic variability over the past 800 kyr. Unfortunately, the analytical load required to obtain the full 800 kyr record at 11 cm resolution is enormous, and would represent 35 000 measurements. Even though several individual studies have been published, a complete synthesis of EDC high-resolution δD and δ18O records over the last 800 kyr is still missing. This is an important limitation on the documentation of past changes in sub-orbital climatic variability in Antarctica and a comparison of the climatic variability features between glacial and interglacial periods or between different interglacial (glacial) periods. As an example, the interglacial periods before the Mid-Brunhes Transition (MBT, 430 ka) are cooler than the five most recent interglacial periods, but there is limited evidence available to document climate variability during interglacial periods before and after the MBT at high resolution (Barth et al., 2018; Past Interglacials Working Group of PAGES, 2016). A first challenge is thus to provide homogeneous high-resolution isotopic records.
A second challenge when attempting to characterize the past high-frequency climate variability in Antarctica is non-temperature-related variability in the water isotopes from the depositional process (Fischer et al., 1985; Laepple et al., 2018) and alteration and smoothing effects of post-deposition processes. Indeed, post-deposition processes (Casado et al., 2018, 2020; Steen-Larsen et al., 2014) and firn and ice diffusion (Gkinis et al., 2011, 2021a) strongly limit the interpretation of water isotopic variability in terms of climatic variability. In the case of old ice, the impact of diffusion, which increases with depth and age, can reach the multi-centennial timescale and affect the climate variability recorded in δ18O and δD. Pol et al. (2010) showed that the 11 cm resolution δD record of MIS 19 (3147–3190 m deep in the EDC ice core) did not provide more information than the 55 cm resolution record due to the large impact of diffusion at this depth of the core. This effect is particularly important to quantify for the 1.5 Ma ice core to be drilled in East Antarctica. Indeed, documenting the evolution of diffusion length with depth is key to anticipating the kind of information on climate variability that can be retrieved from the deepest part of this future ice core.
Here we address the two aforementioned challenges (high-resolution records and the influence of diffusion) by presenting a compilation of new high-resolution measurements of δ18O and δD in the EDC ice core. The first section presents the analytical methods used to perform high-resolution measurements of δD and δ18O in the different sections of the EDC ice core in recent decades, as well as methods for spectral analyses and the calculation of isotopic diffusion along the EDC ice core. The second section describes how the different measurements performed over the past 20 years in different institutes with different analytical methods can be compiled together into a single record. The third section uses the high-resolution measurements to investigate changes in sub-orbital climatic variability across the last 800 kyr and how diffusion can affect some of the observed features.
2.1 The EPICA ice core
The Franco-Italian Concordia Station is located 3233 m above sea level on the continental plateau of Antarctica (75∘06′12′′ S 123∘21′30′′ E). The mean annual surface temperature is −54.5 ∘C and the snow accumulation rate is ca. 25 mm water equivalent per year (EPICA community members, 2004; Le Meur et al., 2018).
The EDC ice core was drilled at Concordia Station on Dome C, where the ice flow was small (EPICA community members, 2004). The EDC drilling project started in 1996 and was completed in 2004. In 1999, a second ice core (EDC2) was drilled from the surface because the drill for EDC1 was stuck at depth of 788 m. Bedrock was reached in 2004 at a depth of 3190 m. From here onwards, we refer to EDC1 and EDC2 as “the EDC ice core”. By the time this second ice core had been retrieved, the full 788 m of EDC1 had been analysed. Later, EDC2 measurements started 19 m higher than the bottom end of the EDC1 ice core in order to have an overlap to reconnect the two cores without duplicating all the measurements in the common depth range.
After drilling and core logging, the EDC ice core was cut into 55 cm long sections, and each section was further cut longitudinally on-site for several measurements (e.g. water isotopes, physical properties, 10Be, chemistry, and gas analysis). The archival piece (∼ one-quarter of the section) was stored in polystyrene boxes in the EPICA snow cave at Concordia Station at −50 ∘C. Two types of contiguous samples were dedicated to the analyses of water isotopes in the EDC ice core. First, a 55 cm long stick with a 1 cm2 cross section was melted and stored on-site in plastic bottles for the low-resolution measurements. The second was a 55 cm long stick with a 2 cm2 cross section that was cut into 11 cm long samples. Each sample was placed in a plastic sheath cut to obtain a plastic bag of the right dimensions, and then the bag was thermally sealed. The sample was stored at −20 ∘C for a few months prior to being melted and transferred into plastic bottles that were kept at −20 ∘C.
2.2 Measurement techniques and coherency of the dataset
Several analytical techniques have been used to measure δ18O and δD in the EDC1 and EDC2 ice cores (Tables 1 and 2). Initial analytical techniques included a uranium reduction method for δD (Vaughn et al., 1988) and a CO2–H2O equilibrium method for δ18O (Meyer et al., 2000), while the most recent method used to determine δ18O and δD on the EDC2 ice core is cavity ring-down spectroscopy (CRDS) (Kerstel and Gianfrani, 2008; Busch and Busch, 1999). When uranium reduction was replaced by CRDS measurements at the Laboratoire des Sciences du Climat et de l'Environnement (LSCE), an extensive series of comparisons were performed which showed that there was excellent agreement between the two methods within the uncertainty ranges of the instruments. The analytical precisions for the methods are comparable, with 2σ values ranging between 1 and 1.4 ‰ for δD and between 0.1 and 0.4 ‰ for δ18O (Table 2). Figure 1 displays the full high-resolution (11 cm) datasets for δ18O and δD of water over the EDC ice core.
Table 1Summary of available δD measurements of the EDC ice core and associated analytical methods. 2σ values come from the instrumental measurement uncertainty as provided in the original studies.

Table 2Summary of available δ18O measurements of the EDC ice core and associated analytical methods. 2σ values come from instrumental measurement uncertainty as provided in the original studies.
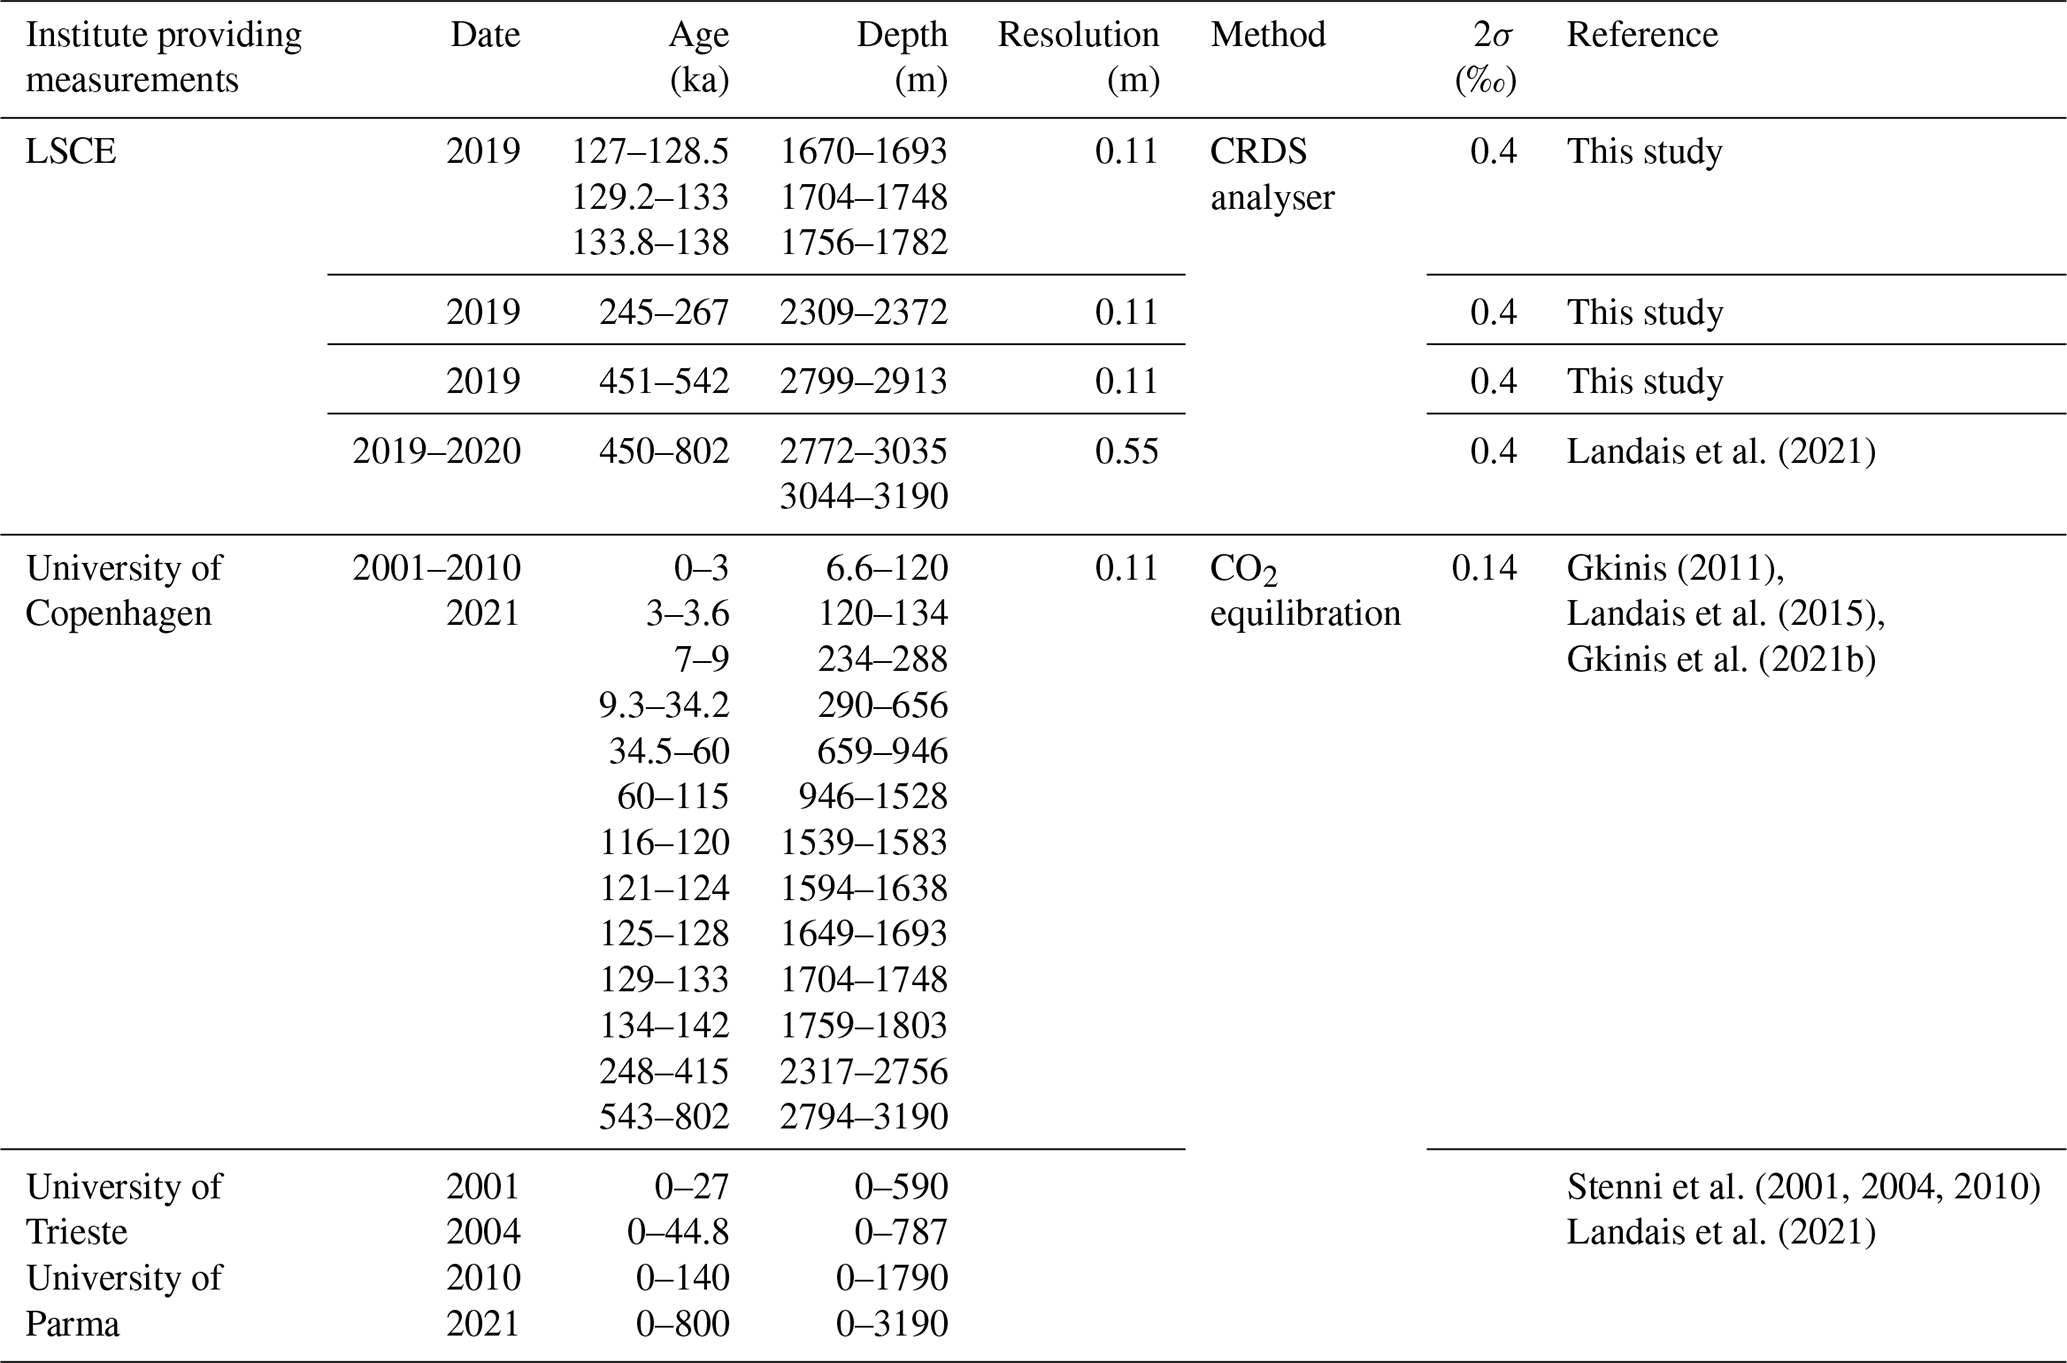
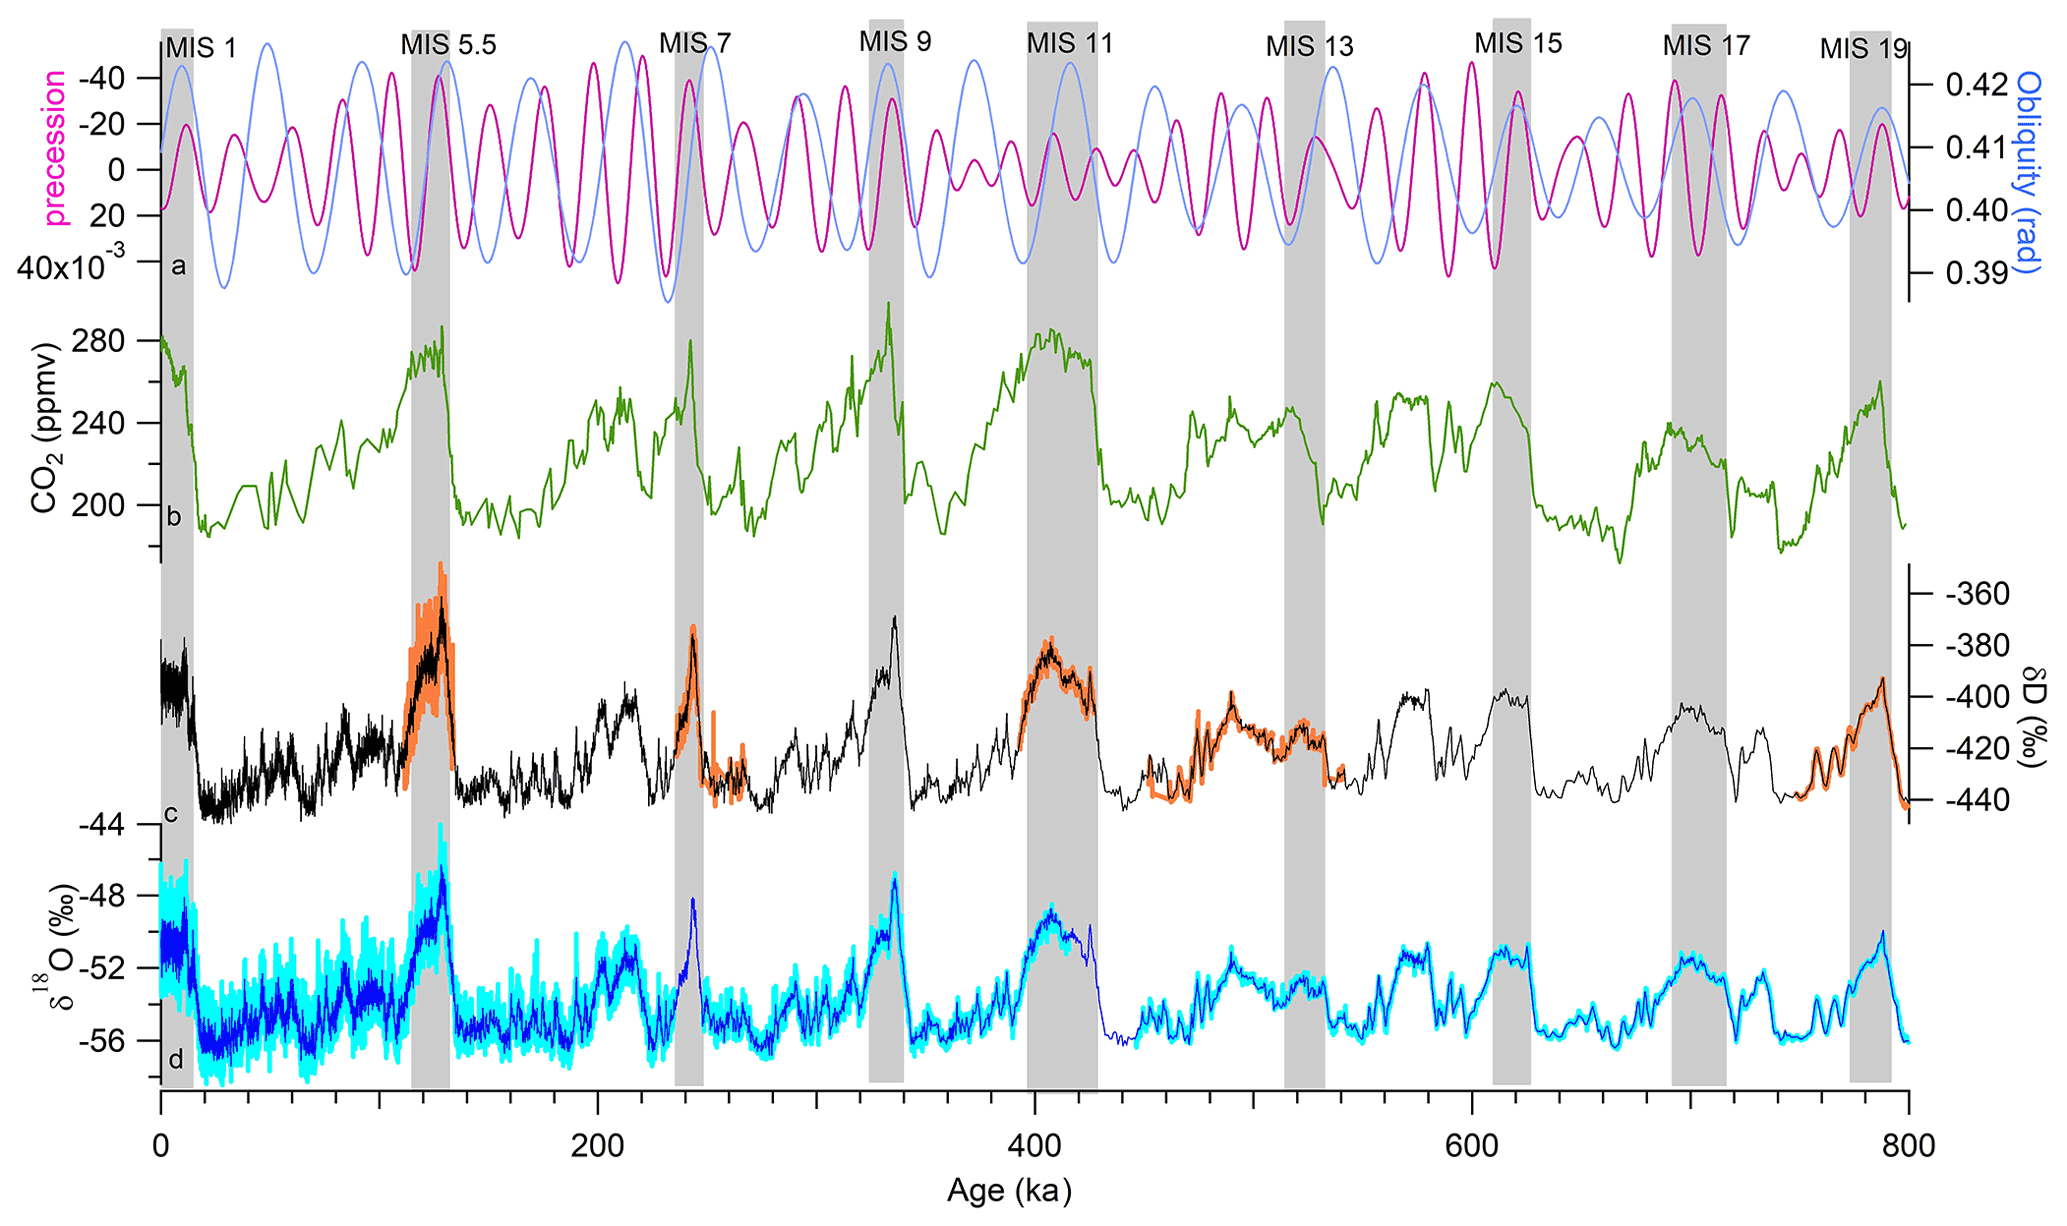
Figure 1EDC ice core and other palaeoclimate records as well as variations in Milankovitch cycles over the past 800 kyr. (a) Precession (pink) and obliquity (blue) from Laskar et al. (2004); (b) composite EDC and Vostok CO2 record over the last 800 kyr (Lüthi et al., 2008; Bereiter et al., 2015); (c) the EDC δD record at 11 cm (orange) and 55 cm (black) resolution; and (d) the EDC δ18O record at 11 cm (light blue) and 55 cm (dark blue) resolution. All ice core records are presented on the AICC2012 scale (Bazin et al., 2013; Veres et al., 2013). Grey rectangles indicate the positions of interglacial periods.
2.3 Multi-resolution analysis (MRA)
A discrete wavelet analysis was used to identify the contributions to the overall isotopic variability from signals of different periodicities (i.e. corresponding to decadal to multi-millennial signal variability). We produced a multi-resolution analysis (MRA) using R software with the waveslim wavelet package (Whitcher, 2020) containing the MRA function with a Daubechies orthonormal wavelet filter. MRA is a mathematical analysis tool which decomposes a signal at different resolution levels. An important feature of MRA is its ability to capture temporally localized changes at its nearest neighbour. A low (high) resolution level corresponds to a coarse (detailed/high-frequency) component of the original signal. Each MRA level can thus be used to interpret the temporal variability within a frequency range. Adding all MRA levels exactly reproduces the original undecomposed signal. As the wavelet analysis needed to be applied at time intervals with a uniform sample resolution, we divided the EDC isotopic record on the AICC2012 age scale (Bazin et al., 2013) into six intervals. These ranged from the youngest interval, between 0 and 56 ka (where the longest time span covered by 11 cm is 10 years), to the oldest interval (at the bottom of the core), between 651 and 800 ka (where the longest time span covered by 11 cm is 320 years) on the AICC2012 age scale (Bazin et al., 2013) (Table 3). Over each interval, we performed an interpolation with a uniform resolution corresponding to the longest time span covered by 11 cm of ice (i.e. interpolation at 10 years between 0 and 56 ka; at 20 years between 56 and 144 ka; see the details for all periods given in Table 3).
Table 3Time resolutions (in years) of the different MRA decompositions for specific intervals (0–56, 56–144, 144–305, 305–420, 420–651 and 651–800 ka). Letters a, b, c, d, e and f represent segments that have the same time resolution and can be combined.
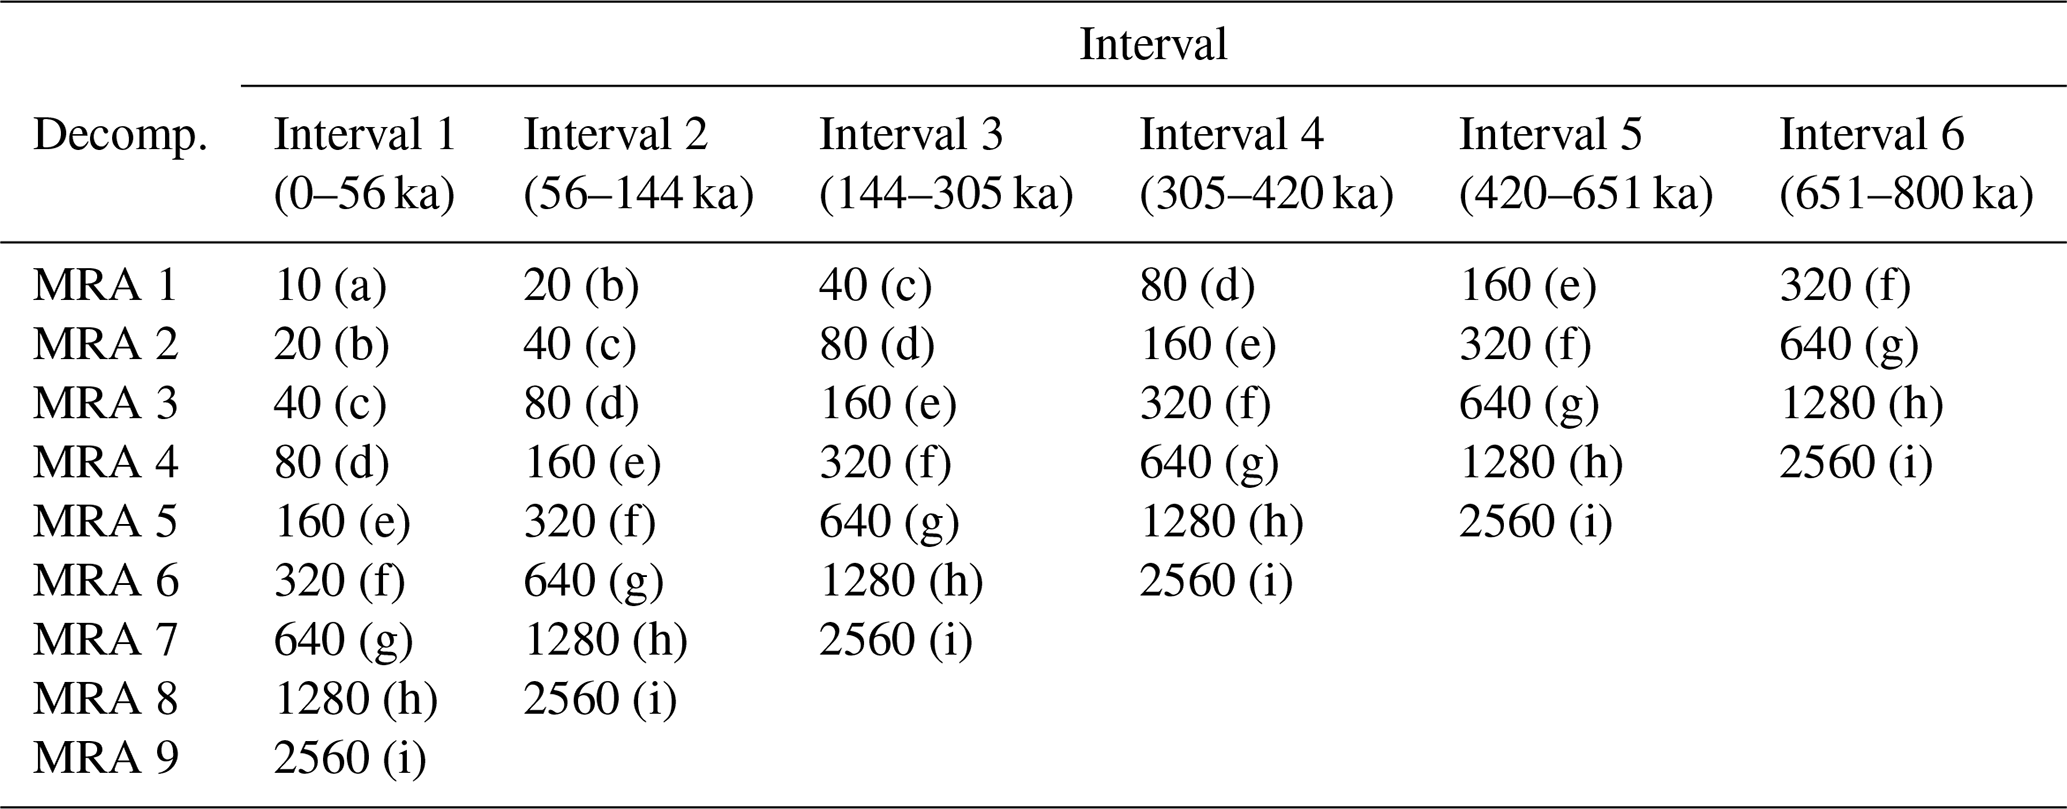
The resolution of the MRA was chosen to increase by a factor of 2 between neighbouring intervals i and i+1, i being a number between 1 and 5. As a consequence, the second MRA decomposition of the interval i has the same resolution as the first MRA of the interval i+1 (Table 3). We then concatenated the MRAs with the same temporal resolution, leading to nine successive composites (named a, b, c, d, e, f, g, h and i in Table 3). The longest (composites f, g, h and i) corresponded to the variability of the signal at 320 years resolution and covered the whole 800 ka, and the shortest (composite a) corresponded to the variability of the signal at 10 years resolution and covered only the last 56 kyr.
2.4 Effect of isotopic diffusion
The effect of isotopic diffusion with depth is convolved using a function G(z) of associated diffusion length σz (Gkinis, 2011; Laepple et al., 2018; Gkinis et al., 2021a):
where z is the depth along the ice core and σz is the diffusion length.
We quantify the amplitude decay of the signal between the initial amplitude A0 and the measured amplitude A at a certain depth as described in Johnsen et al. (2000) and Gkinis et al. (2021a) for a given period λ with the following equation:
For our purpose, the diffusion length along the EDC ice core is calculated by considering the firn diffusion (i.e. due to water vapour diffusion in the open porosity) and the ice diffusion (i.e. due to water molecule diffusion in the ice matrix).
We used two different estimates for the firn diffusion length, σfirn, along the EDC ice core. In a first approach, we assumed a constant σfirn all along the EDC ice core and took the value of 0.07 m estimated by Johnsen et al. (2000) for the EDC. In a second, refined approach, we considered a changing σfirn between interglacial and glacial periods, as described in Gkinis et al. (2021a). This causes σfirn to vary from 0.075 m in interglacial periods to 0.065 m in glacial periods. The ice thinning, S, also affects the visible effect of the firn diffusion length along the ice core, so the thinned firn diffusion length should be . In this study, for consistency, we used the thinning function for the EDC ice core corresponding to the AICC2012 chronology (Bazin et al., 2013).
The ice diffusion depends on the thinning and the temperature. The following formulation permits the calculation of the diffusion length associated with ice diffusion, σice, as a function of the age (and depth) of the ice (Gkinis et al., 2011):
where S is the thinning of the ice layers at the considered age τ. In order to estimate the ice diffusion coefficient D(t), we used the classical formulation of Ramseier (1967):
with D0 = 9.13 cm2 s−1 and Q = 59.820 kJ mol−1. At −50 ∘C, D is equal 8.866 × 10⁻¹⁴ cm2 s−1; at −10 ∘C, D is equal to 1.1993 × 10⁻¹¹ cm2 s−1. T represents the ice temperature from the borehole.
The total calculated diffusion length that was expected to be measured in the ice core was estimated using the diffusion length associated with the firn diffusion and the diffusion length associated with ice diffusion in a quadratic addition, so that
The increase of the diffusion length with increasing depth in the ice core is shown in Fig. S1 in the Supplement. It is mainly due to the increase in temperature. Indeed, the borehole temperature evolves almost linearly from −53.5 to −2.6 ∘C along the 3255 m ice core (Buizert et al., 2021). The variation of the calculated diffusion length around 3000 m is explained by the variability of the thinning function (Parrenin et al., 2007).
Different analytical instruments and techniques have been used to determine δ18O and δD in the EDC1 and EDC2 ice cores at different laboratories (Table 1). To determine the coherency of the different datasets, two different comparisons were performed; (1) a comparison of the isotopic values from the same samples measured by different analytical techniques; and (2) a comparison of the 55 cm sample resolution data with the 11 cm sample resolution data using a five-point average. We averaged the 11 cm resolution in a five-point window to compare it with the 55 cm resolution measurements in exactly the same window.
3.1 Comparison of isotopic data using different analytical techniques
The CRDS analysis in 2019–2020 measured previously analysed samples from 2004–2010 by uranium reduction for δD in MIS 5.5 (1670–1693 m) and by H2O–CO2 equilibration for δ18O (1670–1793 m) (Table 1). Figures 2 and 3 provide two examples of analyses performed for all overlapping intervals. Additional comparisons of isotopic data measured by different analytical techniques on the same samples are also presented in the Supplement (Figs. S5 and S6). The samples stayed refrozen between the different measurements and they were refrozen immediately after analysis. Tests were performed by storing low δ18O and δD internal standards for several years in the freezer. In some cases, but not systematically and not significantly compared to the analytical precision, small increases of δ18O and δD were obtained. In a comparison of the old and new records, we did not observe systematic increases of δ18O and δD for the samples analysed recently compared to the analyses performed 15 years ago, so unfortunately we cannot give a solid explanation for the small differences between the series of measurements.
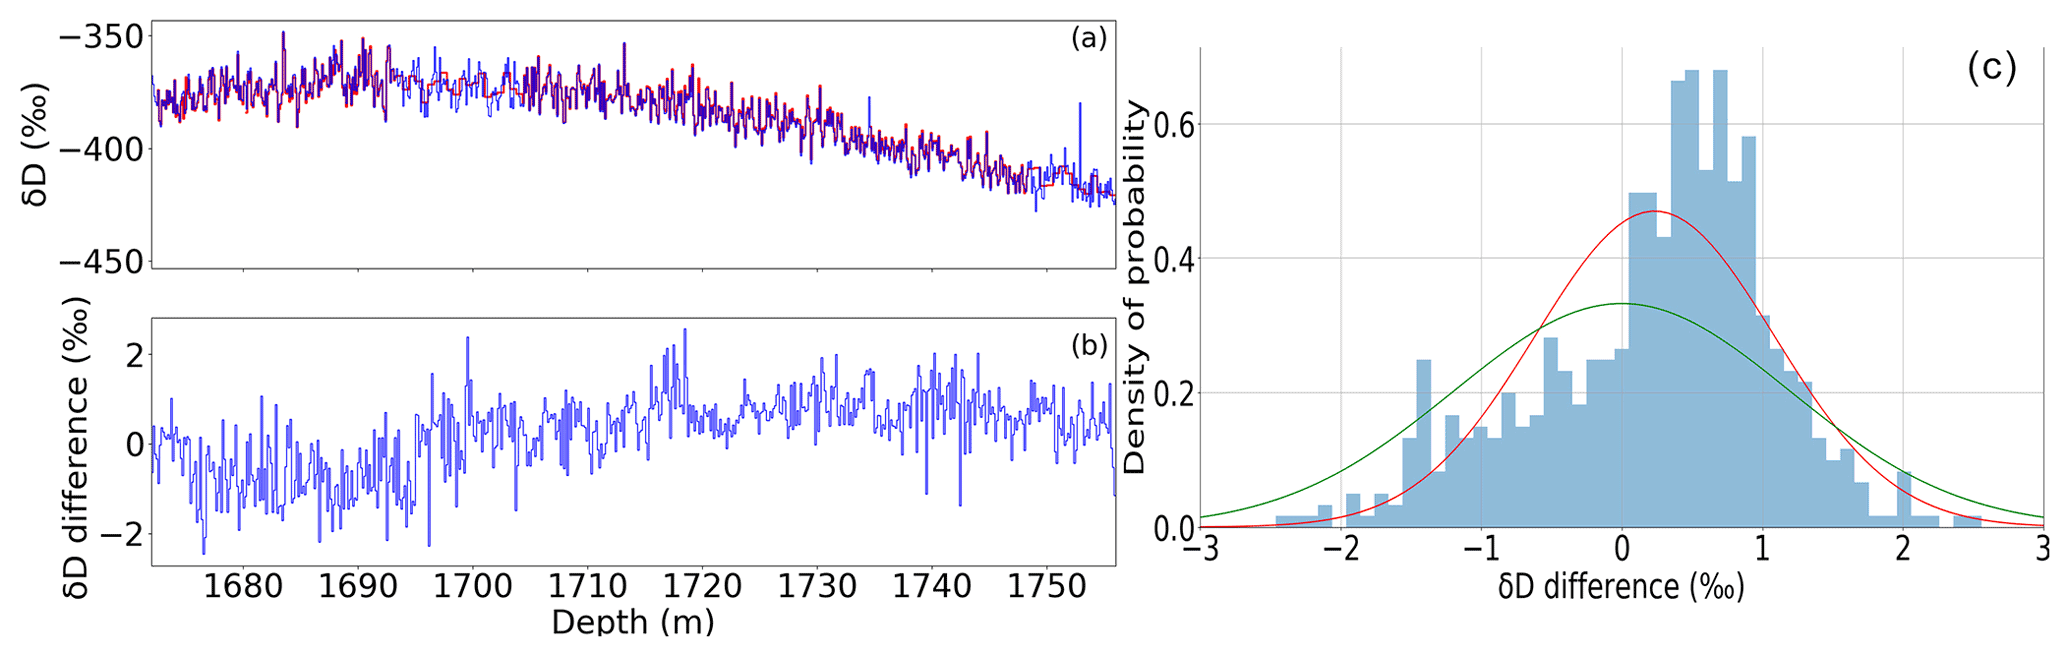
Figure 2(a) EDC δD measurements versus depth (m) over Termination 2: measurements completed in 2010 at LSCE (uranium reduction method; Pol et al., 2014) are shown in blue, and measurements completed in 2019 at LSCE (CRDS method) are shown in red. (b) Difference between the δD values measured in 2010 and 2019. (c) Probability density function for the difference between the first (uranium reduction) and the new (CRDS) δD measurements. A Gaussian curve (red) is fitted to the data. Another Gaussian curve (green) with the standard deviation equal to the classically displayed 1σ uncertainty of δD measurements with the CRDS method at LSCE (1σ = 0.7 ‰) is also displayed.
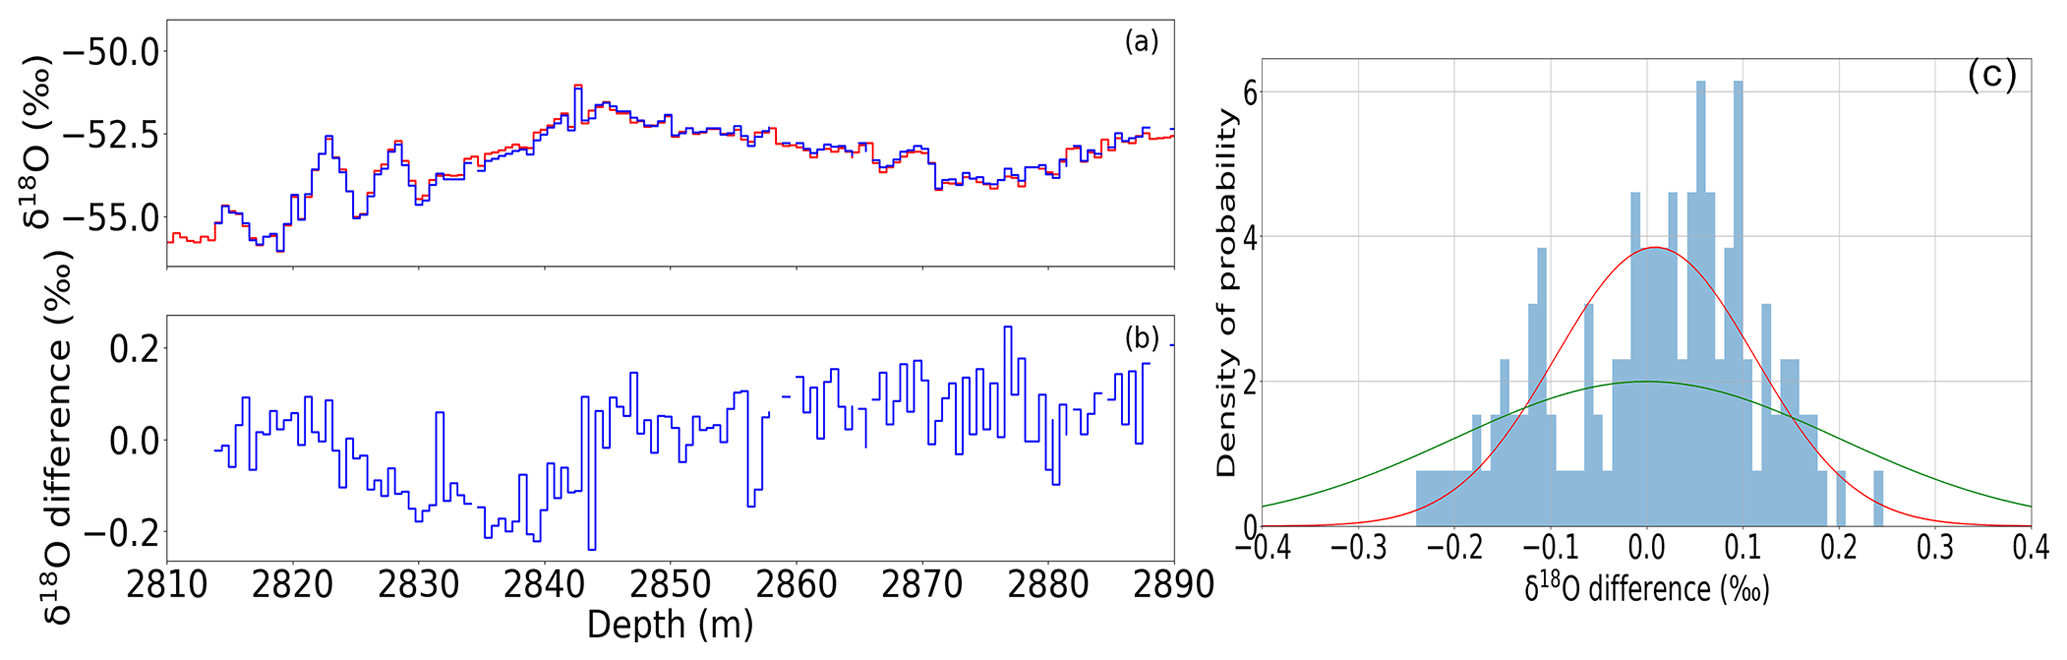
Figure 3(a) EDC δ18O measurements versus depth (m) over Termination 6: measurements completed in 2010 at the University of Triestre with the CO2 equilibration method are shown in blue, and measurements completed in 2019 at LSCE (CRDS method) are shown in red. (b) Difference between the δ18O values measured in 2010 and 2019. (c) Probability density function for the difference between the old (University of Triestre) and the new (LSCE) δ18O measurements. A Gaussian curve (red) is fitted to the data. Another Gaussian curve (green) with the standard deviation equal to the classically displayed 1σ uncertainty of δ18O measurements by CRDS at LSCE (1σ = 0.2 ‰) is also displayed.
3.2 δD comparison
The difference between analytical techniques (Fig. 2) seems to depend on the absolute value for δD (there is a negative difference for low δD values). This was confirmed by a statistical test of the correlation between the absolute value of δD and the δD difference between the two series of measurements, which led to a Pearson coefficient of 0.13 and a p-value of 0.003. Such an isotopically dependent feature may arise from a possible calibration effect, despite the fact that exchanges of internal laboratory water standards and regular intercalibrations between the laboratories measuring water isotopes of the EDC ice cores were performed.
Despite such a tendency for the δD differences between the two series, the absolute value of the difference remains small. We used a Welch t-test to show that the 2010 and 2019 time series have equal means at the 99.9 % confidence level (t = 3.5, N = 1000) with respect to the experimental uncertainties.
Finally, the distribution of the differences between the 2010 and the 2019 δD measurements is not Gaussian and is not centred around zero (Fig. 2c). Still, this distribution is narrow and is encompassed within a Gaussian distribution where 2σ = 1.4 ‰ is associated with the classical analytical uncertainty of the δD measurements. Note that the analytical uncertainty associated with this CRDS measurement series was evaluated from the analysis of the difference between the same samples (1000 samples, which represent 10 % of the whole series) measured twice, 1 to 3 months apart. We thus conclude that the δD difference between the uranium reduction vs. CRDS datasets is smaller than the uncertainty associated with CRDS measurements, and thus that we can combine the different datasets if we consider a 2σ uncertainty of 1.4 ‰ in the final δD data.
3.3 δ18O comparison
No significant statistical differences are observed between the δ18O measurements performed using the CO2 equilibrium and CRDS methods. The standard deviation of the difference series between 2010 and 2019 δ18O measurements (2σ = 0.2 ‰) is smaller than the classical analytical uncertainty of the δ18O measurements by CRDS (2σ = 0.4 ‰) (Fig. 3). A statistical test of the correlation between the absolute value of δ18O and the δ18O difference between the two series of measurements led to a Pearson coefficient of 0.0049 and a p-value of 0.9. In addition, we did a Welch t-test of the equality between two averages in δ18O to check whether the difference between the 2010 and 2019 δ18O data is significantly different within the experimental margin of error. Upon doing so, the result shows that the two series have equal means at the 70 % confidence level (t = 0.557, N = 1000).
Second, we compared the low-resolution (55 cm) and the high-resolution (11 cm) δ18O series after calculating the average δ18O of five 11 cm samples that overlap with the same sample depth as the 55 cm samples (Figs. S2 to S4). The difference between the two time series is 0.008 ± 0.001 ‰ (Fig. S4). A comparison between low- and high-resolution series for δD has already been performed by Pol et al. (2011, 2014). In the 2011 paper, the coherency between the 55 and 11 cm samples was studied by calculating the average signal over five 11 cm data. They observed that the signal from the 55 cm samples is similar to the average signal but has a lower statistical accuracy (1σ = 0.5 ‰) than the average signal (1σ = 0.23 ‰).
The two comparisons performed above suggest there is no statistically significant difference in δ18O and δD between the datasets compiled here (Fig. 1).
4.1 Recorded multi-decadal to multi-millenial isotopic variability over the last 800 kyr
The compiled high-resolution EDC water isotope record is presented in Fig. 1. We applied the MRA decomposition to each of the six selected intervals (see the “Methods” section) and we present the decadal to multi-millennial variability across the last 800 kyr (Fig. 4). We calculated the running standard deviation (1σ) in a 3 kyr window and we use this value as an estimate of the level of variability. For the first MRA composite at 10 years resolution (Fig. 4a), we observe stronger isotopic variability during the Holocene than during the Last Glacial Maximum (average 1σ of 0.46 ‰ and 0.24 ‰, respectively). The 20-year variability (Fig. 4b) inferred from the second composite shows a globally uniform pattern over the last 150 kyr. The 80-year variability (Fig. 4d) is smaller during the interglacial periods (1σ = 0.18 ‰) than during the glacial periods (1σ = 0.30 ‰) over the last 400 kyr. The 160-year to 640-year variability (Fig. 4e to g) also shows a small decrease of variability over interglacial periods and decreasing variability for the oldest ice core sections. For the lower-frequency variabilities (composite at resolutions of 1280 and 2560 years, Fig. 4h to i), the amplitude of the variability envelope increases during glacial inceptions and glacial periods, with a notable strong 2,560-year variability at the onset of MIS 9 (1σ = 1.13 ‰, compared to an average of 1σ = 0.20 ‰ over the whole series). The large centennial to multi-centennial water isotope variability in glacial periods is linked tothe successive Antarctic Isotopic Maxima (AIM) during glacial periods (EPICA community members, 2004; Jouzel et al., 2007). Finally, the decreasing amplitude of the signal variability toward older ages is probably the result of the diffusion of water isotopes in open-porosity firn and ice crystals. While we can disentangle the effects of diffusion and climate-driven isotopic variability for low-frequency signals and at greater depths, the respective influences of diffusion and climate are less obviously identified at shallower depths and for high frequencies.
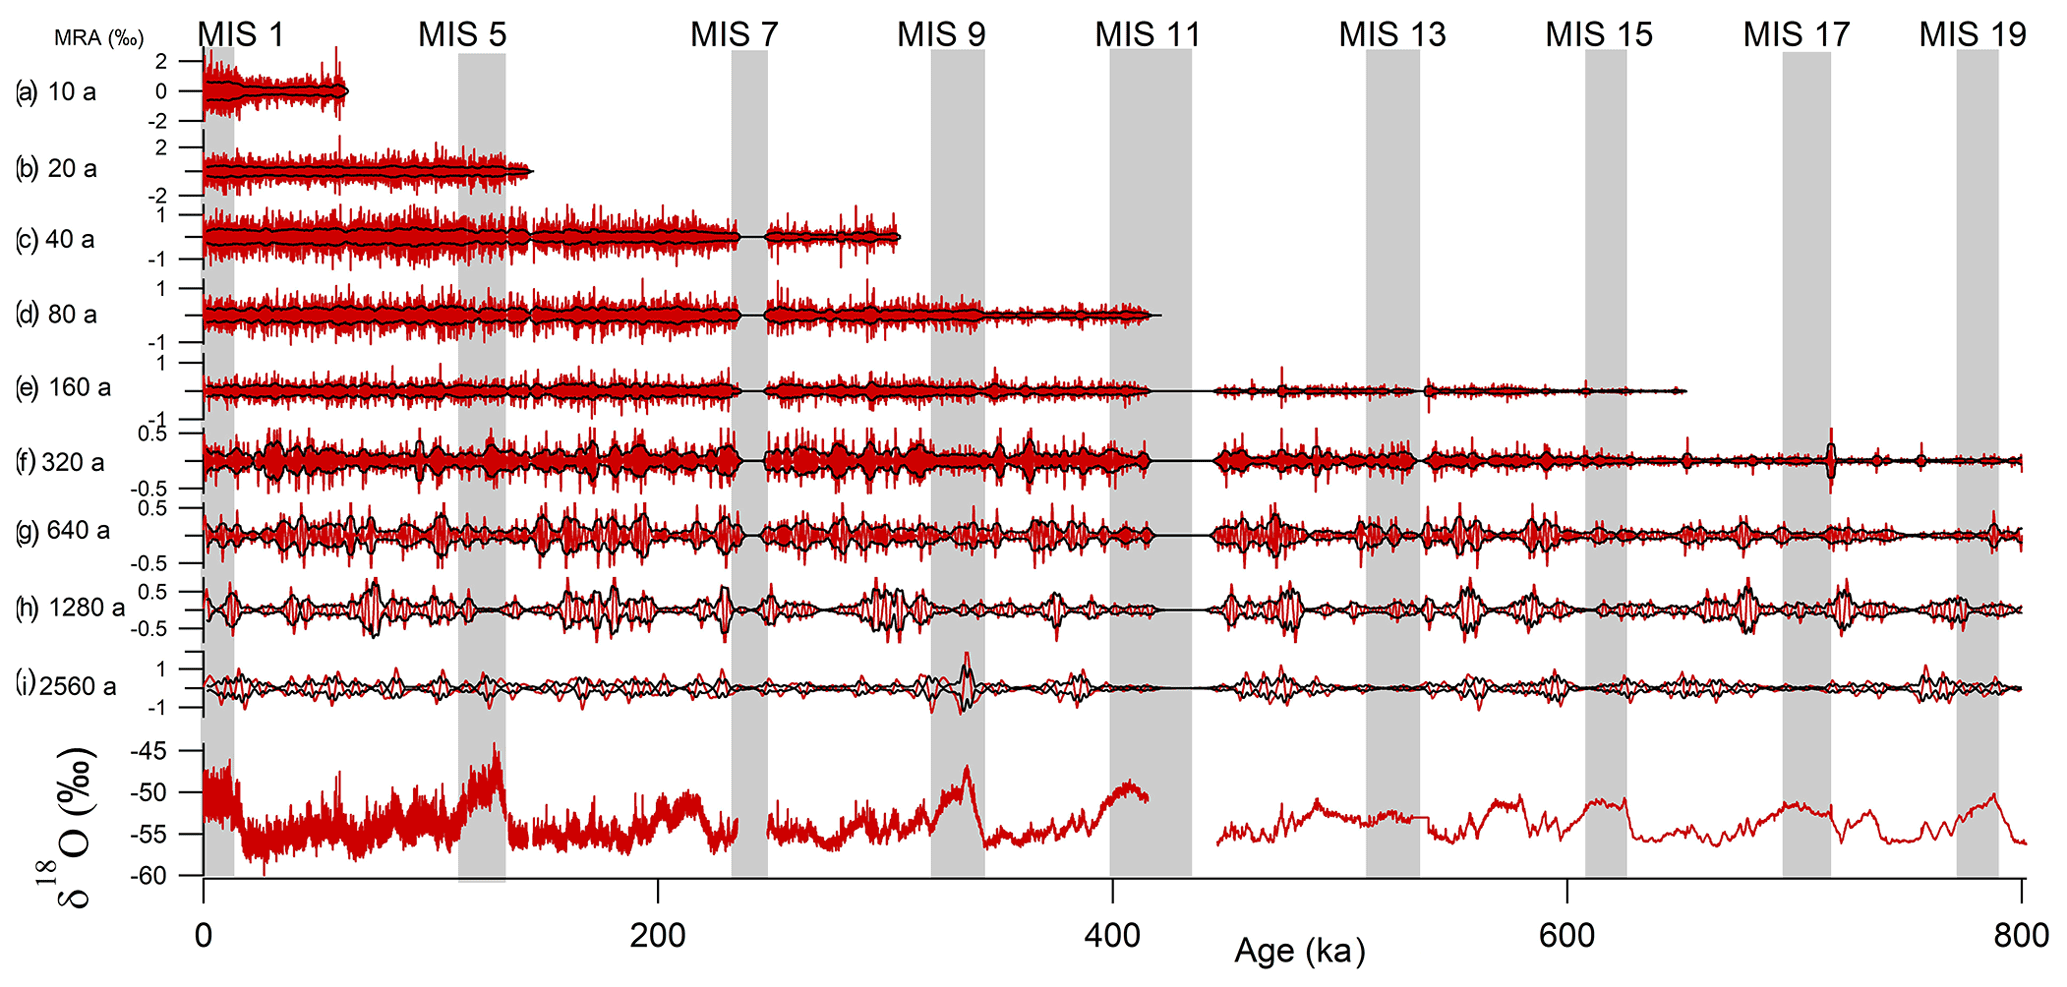
Figure 4Contributions to the original δ18O signal (red) of the MRA composites with resolutions of 10 (a), 20 (b), 40 (c), 80 (d), 160 (e), 320 (f), 640 (g), 1280 (h) and 2560 years (i). Marine Isotope Stage intervals are marked as grey bars. The black envelope presents the running standard deviation (1σ) in 3 kyr windows.
4.2 Effect of isotopic diffusion on the recorded signal variability
We evaluate the effects of diffusion on the isotopic signal recorded in the ice core by computing the decrease of Holocene variability from Eq. (2). The calculated signal amplitude is hence scaled for each MRA composite to the mean amplitude of the variability of the MRA composite signal between 2 and 8 ka for each resolution (Fig. 6).
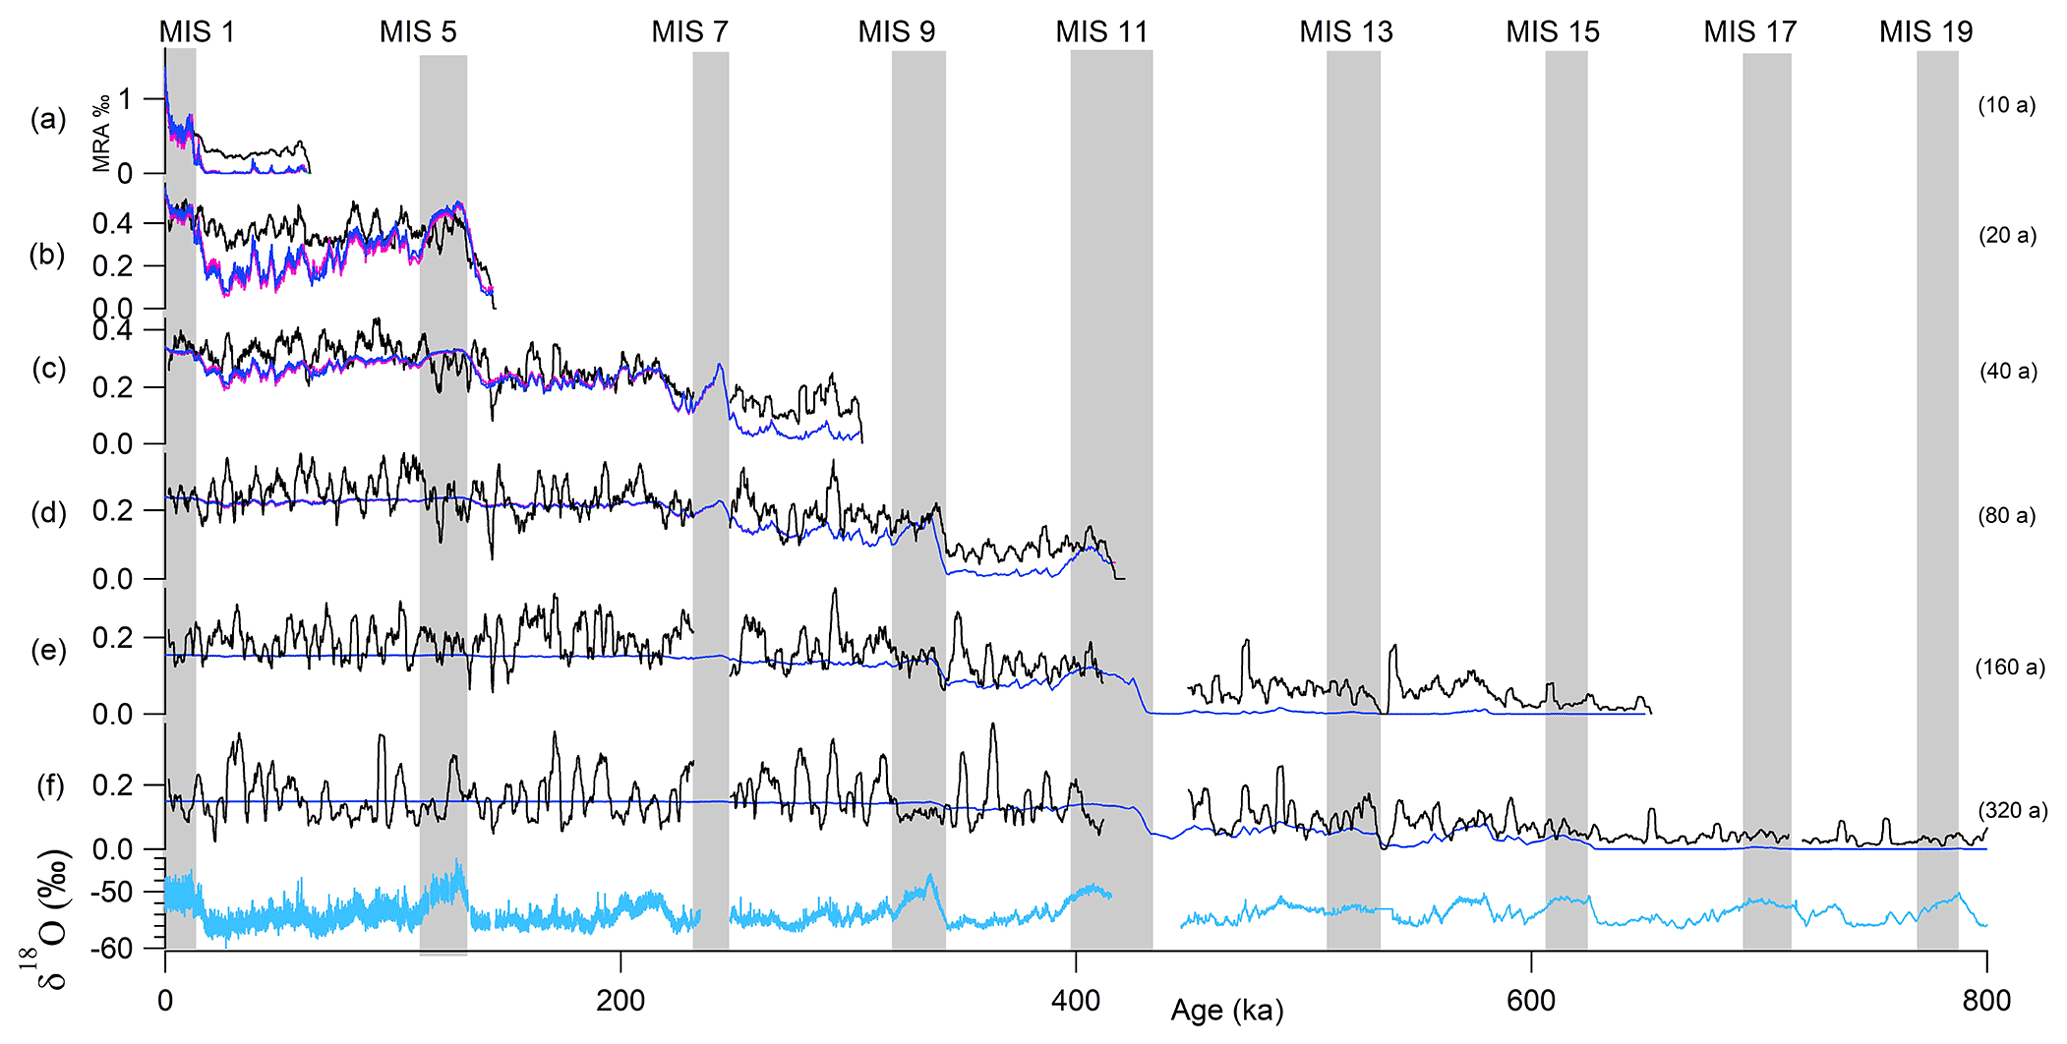
Figure 5High-resolution record (light blue) and comparison of its variability (3 kyr standard deviation, black) to the variability (3 kyr standard deviation) of the diffused Holocene signal for the different periods (10, 20, 40, 80, 160 and 320 years for a to f). The diffused Holocene signal was calculated using two σfirn estimates: a constant σfirn of 7 cm (dark blue) and a variable σfirn equal to 6.5 cm in glacial periods and 7.5 cm in interglacial periods (pink).
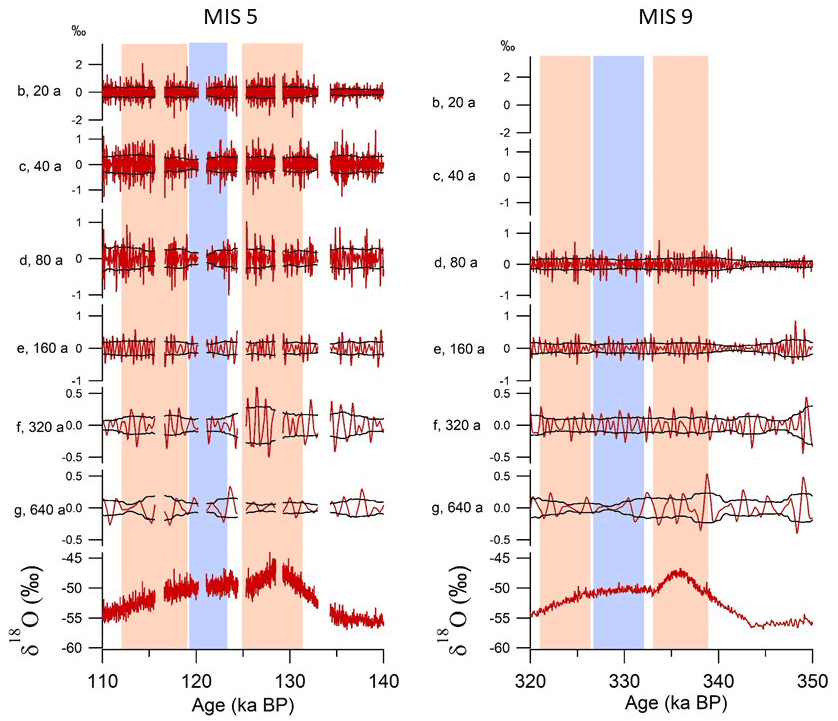
Figure 6Contributions to the original δ18O signal (red) of the MRA composites with resolutions of 20 (b), 40 (c), 80 (d), 160 (e), 320 (f) and 640 (g) years for MIS 5 (left panel) and MIS 9 (right panel). The black envelope presents the running standard deviation (1σ) in 3 kyr windows. The red rectangles indicate periods with enhanced variability and the blue rectangles indicate periods with reduced variability.
As explained in the section “Methods”, we used the ice diffusion coefficient from Ramseier (1967) with two different estimates for σfirn. The different estimates of σfirn did not have a significant effect on the calculated amplitude of the variability (Fig. 5).
Diffusion has the expected effect of decreasing the amplitude of the variability of the isotopic signal for older and deeper ice core sections (Fig. 4). In the 10-year series (Fig. 4a), diffusion dampens the amplitude of the recorded variability in the last glacial period by half compared to that in the Holocene. The calculated amplitude of the variability due to diffusion is actually much smaller than the recorded one, which suggests that either the 10-year isotopic variability during the last glacial period is larger than the 10-year variability during the Holocene or that measurement noise dominates the 10-year variability.
For the deepest sections of the ice core, i.e. sections older than 600 ka, the diffusion model overestimates the damping of centennial and multi-centennial variability compared to what is retrieved from the ice core isotopic composition. This discrepancy calls for future reassessment of the isotopic diffusivity in the deepest sections of the EDC ice core.
4.3 Climate variability at different time intervals over the last 800 kyr
Combining our high-resolution water isotopic records with frequency analysis and the impact of diffusion, we can suggest some patterns for the decadal to millennial climate variability over the last 800 kyr.
First, at the decadal scale, our findings show larger variability during the last glacial period compared to the Holocene. The analysis of Jones et al. (2017) using the water isotopic record in the WAIS Divide record in West Antarctica supports this higher variability at the decadal scale during the last glacial maximum. At the high accumulation site of WAIS, diffusion has a minimal effect on the variability with a 4- to 15-year periodicity, and the higher water isotopic variability observed during this period is interpreted as an increase in the strength of the teleconnections between the tropical Pacific and West Antarctica (Jones et al., 2018). Jones et al. (2018) invoke the expansion of the Northern Hemisphere ice sheets during the LGM, leading to a shift in the location of tropical convection, to explain these characteristics. The same pattern is observed for the 20-year periodicity (Fig. 5b), i.e. the variability of the water isotopic composition after diffusion is smaller than the measured one during the last glacial period, while there is a good agreement between the diffused and measured signal over MIS 5e. For the 40- and 320-year periodicity (Fig. 5c to f), the variability of the last glacial period is also higher than the diffused Holocene variability. This is also the case for MIS 6 for the 80-year periodicity (Fig. 5d) and for MIS 8 and 10 for the 160- and 320-year periodicity (Fig. 5e to f). For these periods and frequency ranges, the impact of diffusion on the variability is limited and the isotopic signal in the ice core is preserved. The multi-centennial variability increase during glacial periods can be related to the presence of AIM.
Our analysis shows that there is a clear enhanced isotopic variability during glacial periods at the multi-decadal to multi-centennial timescale in the EDC ice core, which could be attributed to climate variability (Fig. 4). This result is in agreement with the findings of Rehfeld et al. (2018), who used a worldwide data synthesis to show increased interannual to millennial climatic variability during the last glacial maximum with respect to the Holocene at all latitudes along with a factor of 2 increase in variance at the high latitudes of the Southern Hemisphere, a result in agreement with output of coupled model simulations (Rehfeld et al., 2018).
Second, while the effect of diffusion is important when we want to compare the variability in one interglacial period to that in another, it does not affect the evolution of the recorded variability during the course of an interglacial period.
A previous study focused on the warm phase of MIS 5 (115.5 to 132 ka), where wavelet analysis of the 11 cm resolution δD record showed three different isotopic phases with different levels of variability (Pol et al., 2014). The first phase, from 111 to 119 ka, has a low orbital forcing context, but the variability increases during the entry into glaciation, with centennial periodicities dominant. The second phase, from 119 to 123 ka, is a stable warm phase, warmer than the Holocene. The δD variability of the second phase is notably lower than those of the other phases, 3.7 ‰ compared to a 4.5 ‰ average. Finally, during the third phase, there is again a higher variability, with multi-centennial periodicities dominant between 123 and 133 ka.
When doing a similar analysis with our MRA decomposition, we find similar variability of the high-resolution signal (Fig. 6a), i.e. the maximum amplitude of the multi-decadal to multi-centennial variability of the signal is encountered over the optimum of MIS 5 (phase 3 in Pol et al., 2014; between 125 and 131 ka) and toward the end of this warm period (phase 1 of Pol et al., 2014). The minimum amplitude of the multi-decadal to multi-centennial variability of the signal is encountered between 119 and 123 ka (phase 2 in Pol et al., 2014), when the δ18O and δD signals are on a plateau.
Thus, during MIS 5, multi-decadal to multi-centennial variability of the water isotopic signal can be interpreted as climate variability at these multi-decadal to multi-centennial timescales. This can be compared to the variability over the interglacial period of MIS 9 (∼ between 325 and 338.5 ka), which is also characterized by a temperature optimum at its start. The amplitudes of the variability for the different MRA decompositions for the interglacial period of MIS 9 cannot be directly compared to those over MIS 5 because of the effects of diffusion and thinning (see Fig. 5). However, in Fig. 6b we observe the same pattern as for MIS5: higher amplitudes for the multi-decadal to multi-centennial variability are observed over the δ18O optimum (333–338 ka) and at the end of this warm period (321–326 ka), while the minimum amplitudes for the multi-decadal to multi-centennial variability are observed over the plateau of the interglacial period (326–332 ka). This result strengthens the conclusion of Pol et al. (2014) that the climate over the temperature optima of interglacial periods may also be more variable at the multi-decadal to multi-centennial timescale. A parallel can be drawn with the larger high-frequency water isotopic variability observed during the temperature optimum of the AIM of the last glacial period in the EDC ice core (Landais et al., 2015), since this temperature optimum at the beginning of the interglacial could also be the result of millennial-scale variability (Past Interglacials Working Group of PAGES, 2016).
Here, we compiled and presented a EDC ice core water isotopic record (δ18O and δD) using new and previously published 11 cm data spanning the last 800 kyr. This compilation and the comparison performed between different series of measurements showed that the differences between water isotopic data measured by different laboratories and techniques over the last 20 years for the same samples are not statistically significant and are within analytical uncertainty. As a result, all the available EDC water isotope data were combined to produce a continuous high-resolution dataset at mostly 11 cm sample resolution.
MRA decomposition of the water isotopic record at temporal resolutions varying between 10 and 2560 years shows that the variability during glacial periods at multi-decadal to multi-centennial timescales is higher than the variability during the Holocene and that the variability is enhanced over the early temperature optimum during MIS 5 and 9. These results are not influenced by diffusion in the open-porosity firn and in the ice matrix, but the interpretation of high-resolution δD and δ18O profiles needs to take this effect into account. Finally, our study calls for further analyses quantifying the diffusivity in EDC, which is essential for analyses of the Beyond EPICA – Oldest Ice core.
The data for this study can be found at https://doi.org/10.5281/zenodo.7086012 (Grisart et al., 2022).
The supplement related to this article is available online at: https://doi.org/10.5194/cp-18-2289-2022-supplement.
VG, BV, BM, FP, BS, JJ, AL and AG performed the measurements. PN and MV helped on the statistic approach. AG led the data analyses and the writing of the manuscript with the active contribution of all co-authors.
The contact author has declared that none of the authors has any competing interests.
Publisher's note: Copernicus Publications remains neutral with regard to jurisdictional claims in published maps and institutional affiliations.
This article is part of the special issue “Oldest Ice: finding and interpreting climate proxies in ice older than 700 000 years (TC/CP/ESSD inter-journal SI)”. It is not associated with a conference.
This work is a contribution to the European Project for Ice Coring in Antarctica (EPICA), a joint European Science Foundation and European Commission scientific program funded by the European Union and by national contributions from Belgium, Denmark, France, Germany, Italy, Netherlands, Norway, Sweden, Switzerland and the United Kingdom. The main logistic support was provided by Institut Polaire Français Paul-Emile Victor and Programma Nazionale di Ricerche in Antartide.
Antoine Grisart acknowledges the support from the European Research Council. We would like to thank Nancy Bertler, Andrew Moy and an anonymous referee for their careful evaluation and thoughtful comments.
This research has been supported by the European Research Council, H2020 European Research Council (ICORDA (grant no. 817493)).
This paper was edited by Nancy Bertler and reviewed by Andrew Moy and one anonymous referee.
Barth, A. M., Clark, P. U., Bill, N. S., He, F., and Pisias, N. G.: Climate evolution across the Mid-Brunhes Transition, Clim. Past, 14, 2071–2087, https://doi.org/10.5194/cp-14-2071-2018, 2018.
Bazin, L., Landais, A., Lemieux-Dudon, B., Toyé Mahamadou Kele, H., Veres, D., Parrenin, F., Martinerie, P., Ritz, C., Capron, E., Lipenkov, V., Loutre, M.-F., Raynaud, D., Vinther, B., Svensson, A., Rasmussen, S. O., Severi, M., Blunier, T., Leuenberger, M., Fischer, H., Masson-Delmotte, V., Chappellaz, J., and Wolff, E.: An optimized multi-proxy, multi-site Antarctic ice and gas orbital chronology (AICC2012): 120–800 ka, Clim. Past, 9, 1715–1731, https://doi.org/10.5194/cp-9-1715-2013, 2013.
Bereiter, B., Eggleston, S., Schmitt, J., Nehrbass-Ahles, C., Stocker, T. F., Fischer, H., Kipfstuhl, S., and Chappellaz, J.: Revision of the EPICA Dome C CO 2 record from 800 to 600 kyr before present: Analytical bias in the EDC CO2 record, Geophys. Res. Lett., 42, 542–549, https://doi.org/10.1002/2014GL061957, 2015.
Blunier, T. and Brook, E. J.: Timing of Millennial-Scale Climate Change in Antarctica and Greenland During the Last Glacial Period, Science, 291, 109–112, https://doi.org/10.1126/science.291.5501.109, 2001.
Buizert C., Fudge, T. J., Roberts, W. H. G., Steig, E. J., Sherriff-Tadano, S., Ritz, C., Lefebvre, E., Edwards, J., Kawamura, K., Oyabu, I., Motoyama, H., Kahle, E. C., Jones T. R., Abe-Ouchi, A., Obase, T., Martin, C., Corr, H., Severinghaus, J. P., Beaudette, R., Epifanio, J. A., Brook, E. J., Martin, K., Chappellaz, J., Aoki, S., Nakazawa, T., Sowers, T. A., Alley, R. B., Ahn, J., Sigl, M., Severi, M., Dunbar, N. W., Svensson, A., Fegyveresi, J. M., He, C., Liu, Z., Zhu, J., Otto-Bliesner, B. L., Lipenkov, V. Y., Kageyama, M., and Schwander, J.: Antarctic surface temperature and elevation during the Last Glacial Maximum, Science, 372, 1097–1101, https://doi.org/10.1126/science.abd2897, 2021.
Busch, K. W. and Busch, M. A. (Eds.): Cavity-Ringdown Spectroscopy: An Ultratrace-Absorption Measurement Technique, American Chemical Society, Washington, D.C., https://doi.org/10.1021/bk-1999-0720, 1999.
Casado, M., Landais, A., Picard, G., Münch, T., Laepple, T., Stenni, B., Dreossi, G., Ekaykin, A., Arnaud, L., Genthon, C., Touzeau, A., Masson-Delmotte, V., and Jouzel, J.: Archival processes of the water stable isotope signal in East Antarctic ice cores, The Cryosphere, 12, 1745–1766, https://doi.org/10.5194/tc-12-1745-2018, 2018.
Casado, M., Münch, T., and Laepple, T.: Climatic information archived in ice cores: impact of intermittency and diffusion on the recorded isotopic signal in Antarctica, Clim. Past, 16, 1581–1598, https://doi.org/10.5194/cp-16-1581-2020, 2020.
Dansgaard, W.: Greenland ice core studies, Paleogeogr. Paleocl., 50, 185–187, 1985.
EPICA community members: Eight glacial cycles from an Antarctic ice core, Nature, 429, 623–628, https://doi.org/10.1038/nature02599, 2004.
Fisher D. A., Reeh, N., and Clausen, H. B.: Stratigraphic noise in time series derived from ice cores, Ann. glaciol., 7, 76–83, https://doi.org/10.3189/S0260305500005942, 1985.
Gkinis, V.: High resolution water isotope data from ice cores, PhD thesis, University of Copenhaguen, Center for Ice and Climate, https://nbi.ku.dk/english/staff/?pure=en%2Fpublications%2Fhigh-resolution-water-isotope-data-from-ice-cores(2e89ccba-bbf3-4c39-bb0a-6553801fec26)%2Fexport.html (last access: 16 October 2022), 2011.
Gkinis, V., Popp, T. J., Blunier, T., Bigler, M., Schüpbach, S., Kettner, E., and Johnsen, S. J.: Water isotopic ratios from a continuously melted ice core sample, Atmos. Meas. Tech., 4, 2531–2542, https://doi.org/10.5194/amt-4-2531-2011, 2011.
Gkinis, V., Holme, C., Kahle, E. C., Stevens, M. C., Steig, E. J., and Vinther, B. M.: Numerical experiments on firn isotope diffusion with the Community Firn Model, J. Glaciol., 67, 450–472, https://doi.org/10.1017/jog.2021.1, 2021a.
Gkinis, V., Dahl-Jensen, D., Steffensen, J. P., Vinther, B. M., Landais, A., Jouzel, J., Masson-Delmotte, V., Cattani, O., Minster, B., Grisart, A., Hörhold, M., Stenni, B., and Selmo, E.: Oxygen-18 isotope ratios from the EPICA Dome C ice core at 11 cm resolution, PANGAEA [data set], https://doi.org/10.1594/PANGAEA.939445, 2021b.
Grisart, A., Casado, M., Gkinis, V., Vinther, B., Naveau, P., Vrac, M., Laepple, T., Minster, B., Prié, F., Stenni, B., Fourré, E., Steen Larsen, H.-C., Jouzel, J., Werner, M., Pol, K., Masson-Delmotte, V., Hoerhold, M., Popp, T., and Landais, A.: Water isotopic composition (Oxygen-18 and Deuterium) from the EPICA Dome C ice core at 11 cm resolution, Zenodo [data set], https://doi.org/10.5281/zenodo.7086012, 2022.
Helsen, M. M., van de Wal, R. S. W., van den Broeke, M. R., Masson-Delmotte, V., Meijer, H. A. J., Scheele, M. P., and Werner, M.: Modeling the isotopic composition of Antarctic snow using backward trajectories: Simulation of snow pit records, J. Geophys. Res., 111, D15109, https://doi.org/10.1029/2005JD006524, 2006.
Johnsen, S. J., Clausen, H. B., Cuffey, K. M., Hoffmann, G., Schwander, J., and Creyts, T.: Diffusion of stable isotopes in polar firn and ice: the isotope effect in firn diffusion, Physics of Ice Core Records, 121–140, https://doi.org/10.7916/D8KW5D4X, 2000.
Jones, T. R., Cuffey, K. M., White, J. W. C., Steig, E. J., Buizert, C., Markle, B. R., McConnell, J. R., and Sigl, M.: Water isotope diffusion in the WAIS Divide ice core during the Holocene and last glacial, J. Geophys. Res.-Earth Surf., 122, 290–309, https://doi.org/10.1002/2016JF003938, 2017.
Jones, T. R., Roberts, W. H. G., Steig, E. J., Cuffey, K. M., Markle, B. R., and White, J. W. C.: Southern Hemisphere climate variability forced by Northern Hemisphere ice-sheet topography, Nature, 554, 351–355, https://doi.org/10.1038/nature24669, 2018.
Jouzel, J., Masson, V., Cattani, O., Falourd, S., Stievenard, M., Stenni, B., Longinelli, A., Johnsen, S. J., Steffenssen, J. P., Petit, J. R., Schwander, J., Souchez, R., and Barkov, N. I.: A new 27 ky high resolution East Antarctic climate record, Geophys. Res. Lett., 28, 3199–3202, https://doi.org/10.1029/2000GL012243, 2001.
Jouzel, J., Masson-Delmotte, V., Cattani, O., Dreyfus, G., Falourd, S., Hoffmann, G., Minster, B., Nouet, J., Barnola, J. M., Chappellaz, J., Fischer, H., Gallet, J. C., Johnsen, S., Leuenberger, M., Loulergue, L., Luethi, D., Oerter, H., Parrenin, F., Raisbeck, G., Raynaud, D., Schilt, A., Schwander, J., Selmo, E., Souchez, R., Spahni, R., Stauffer, B., Steffensen, J. P., Stenni, B., Stocker, T. F., Tison, J. L., Werner, M., and Wolff, E. W.: Orbital and Millennial Antarctic Climate Variability over the Past 800 000 Years, Science, 317, 793–796, https://doi.org/10.1126/science.1141038, 2007.
Jouzel, J., Delaygue, G., Landais, A., Masson-Delmotte, V., Risi, C., and Vimeux, F.: Water isotopes as tools to document oceanic sources of precipitation: Water Isotopes and Precipitation Origin, Water Resour. Res., 49, 7469–7486, https://doi.org/10.1002/2013WR013508, 2013.
Kerstel, E. and Gianfrani, L.: Advances in laser-based isotope ratio measurements: selected applications, Appl. Phys. B, 92, 439–449, https://doi.org/10.1007/s00340-008-3128-x, 2008.
Laepple, T., Münch, T., Casado, M., Hoerhold, M., Landais, A., and Kipfstuhl, S.: On the similarity and apparent cycles of isotopic variations in East Antarctic snow pits, The Cryosphere, 12, 169–187, https://doi.org/10.5194/tc-12-169-2018, 2018.
Landais, A., Masson-Delmotte, V., Stenni, B., Selmo, E., Roche, D. M., Jouzel, J., Lambert, F., Guillevic, M., Bazin, L., Arzel, O., Vinther, B., Gkinis, V., and Popp, T.: A review of the bipolar see–saw from synchronized and high resolution ice core water stable isotope records from Greenland and East Antarctica, Quaternary Sci. Rev., 114, 18–32, https://doi.org/10.1016/j.quascirev.2015.01.031, 2015.
Landais, A., Stenni, B., Masson-Delmotte, V., Jouzel, J., Cauquoin, A., Fourré, E., Minster, B., Selmo, E., Extier, T., Werner, M., Vimeux, F., Uemura, R., Crotti, I., and Grisart, A.: Interglacial Antarctic–Southern Ocean climate decoupling due to moisture source area shifts, Nat. Geosci., 14, 918–923, https://doi.org/10.1038/s41561-021-00856-4, 2021.
Laskar, J., Robutel, P., Joutel, F., Gastineau, M., Correia, A. C. M., and Levrard, B.: A long-term numerical solution for the insolation quantities of the Earth, Astron. Astrophys., 428, 261–285, https://doi.org/10.1051/0004-6361:20041335, 2004.
Le Meur, E., Magand, O., Arnaud, L., Fily, M., Frezzotti, M., Cavitte, M., Mulvaney, R., and Urbini, S.: Spatial and temporal distributions of surface mass balance between Concordia and Vostok stations, Antarctica, from combined radar and ice core data: first results and detailed error analysis, The Cryosphere, 12, 1831–1850, https://doi.org/10.5194/tc-12-1831-2018, 2018.
Lüthi, D., Le Floch, M., Bereiter, B., Blunier, T., Barnola, J.-M., Siegenthaler, U., Raynaud, D., Jouzel, J., Fischer, H., Kawamura, K., and Stocker, T. F.: High-resolution carbon dioxide concentration record 650 000–800 000 years before present, Nature, 453, 379–382, https://doi.org/10.1038/nature06949, 2008.
Meyer, H., Schönicke, L., Wand, U., Hubberten, H. W., and Friedrichsen, H.: Isotope Studies of Hydrogen and Oxygen in Ground Ice – Experiences with the Equilibration Technique, Isotopes Environ. Health Stud., 36, 133–149, https://doi.org/10.1080/10256010008032939, 2000.
Noone, D.: Sea ice control of water isotope transport to Antarctica and implications for ice core interpretation, J. Geophys. Res., 109, D07105, https://doi.org/10.1029/2003JD004228, 2004.
Parrenin, F., Barnola, J.-M., Beer, J., Blunier, T., Castellano, E., Chappellaz, J., Dreyfus, G., Fischer, H., Fujita, S., Jouzel, J., Kawamura, K., Lemieux-Dudon, B., Loulergue, L., Masson-Delmotte, V., Narcisi, B., Petit, J.-R., Raisbeck, G., Raynaud, D., Ruth, U., Schwander, J., Severi, M., Spahni, R., Steffensen, J. P., Svensson, A., Udisti, R., Waelbroeck, C., and Wolff, E.: The EDC3 chronology for the EPICA Dome C ice core, Clim. Past, 3, 485–497, https://doi.org/10.5194/cp-3-485-2007, 2007.
Past Interglacials Working Group of PAGES: Interglacials of the last 800 000 years, Rev. Geophys., 54, 162–219, https://doi.org/10.1002/2015RG000482, 2016.
Pol, K., Masson-Delmotte, V., Johnsen, S., Bigler, M., Cattani, O., Durand, G., Falourd, S., Jouzel, J., Minster, B., and Parrenin, F.: New MIS 19 EPICA Dome C high resolution deuterium data: Hints for a problematic preservation of climate variability at sub-millennial scale in the “oldest ice”, Earth Planet. Sci. Lett., 298, 95–103, https://doi.org/10.1016/j.epsl.2010.07.030, 2010.
Pol, K., Debret, M., Masson-Delmotte, V., Capron, E., Cattani, O., Dreyfus, G., Falourd, S., Johnsen, S., Jouzel, J., Landais, A., Minster, B., and Stenni, B.: Links between MIS 11 millennial to sub-millennial climate variability and long term trends as revealed by new high resolution EPICA Dome C deuterium data – A comparison with the Holocene, Clim. Past, 7, 437–450, https://doi.org/10.5194/cp-7-437-2011, 2011.
Pol, K., Masson-Delmotte, V., Cattani, O., Debret, M., Falourd, S., Jouzel, J., Landais, A., Minster, B., Mudelsee, M., Schulz, M., and Stenni, B.: Climate variability features of the last interglacial in the East Antarctic EPICA Dome C ice core, Geophys. Res. Lett., 41, 4004–4012, https://doi.org/10.1002/2014GL059561, 2014.
Ramseier, R. O.: Self-diffusion of tritium in natural and synthetic ice monocrystals, J. Appl. Phys., 38, 2553, https://doi.org/10.1063/1.1709948, 1967.
Rehfeld, K., Münch, T., Ho, S. L., and Laepple, T.: Global patterns of declining temperature variability from the Last Glacial Maximum to the Holocene, Nature, 554, 356–359, https://doi.org/10.1038/nature25454, 2018.
Steen-Larsen, H. C., Sveinbjörnsdottir, A. E., Jonsson, Th., Ritter, F., Bonne, J.-L., Masson-Delmotte, V., Sodemann, H., Blunier, T., Dahl-Jensen, D., and Vinther, B. M.: Moisture sources and synoptic to seasonal variability of North Atlantic water vapor isotopic composition, J. Geophys. Res.-Atmos., 120, 5757–5774, https://doi.org/10.1002/2015JD023234, 2015.
Stenni, B., Masson-Delmotte, V., Johnsen, S., Jouzel, J., Longinelli, A., Monnin, E., Rothlisberger, R., and Selmo, E.: An oceanic cold reversal during the last deglaciation, Science, 293, 2074–2077, https://doi.org/10.1126/science.1059702, 2001.
Stenni, B., Jouzel, J., Masson-Delmotte, V., Röthlisberger, R., Castellano, E., Cattani, O., Falourd, S., Johnsen, S. J., Longinelli, A., and Sachs, J. P.: A late-glacial high-resolution site and source temperature record derived from the EPICA Dome C isotope records (East Antarctica), Earth Planet. Sci. Lett., 217, 183–195, https://doi.org/10.1016/S0012-821X(03)00574-0, 2004.
Stenni, B., Masson-Delmotte, V., Selmo, E., Oerter, H., Meyer, H., Röthlisberger, R., Jouzel, J., Cattani, O., Falourd, S., Fischer, H., Hoffmann, G., Iacumin, P., Johnsen, S. J., Minster, B., and Udisti, R.: The deuterium excess records of EPICA Dome C and Dronning Maud Land ice cores (East Antarctica), Quaternary Sci. Rev., 29, 146–159, https://doi.org/10.1016/j.quascirev.2009.10.009, 2010.
Vaughn, B. H., White, J. W. C., Delmotte, M., Trolier, M., Cattani, O., and Stievenard, M.: An automated system for hydrogen isotope analysis of water, Chem. Geol., 152, 309–319, https://doi.org/10.1016/S0009-2541(98)00117-X, 1998.
Veres, D., Bazin, L., Landais, A., Toyé Mahamadou Kele, H., Lemieux-Dudon, B., Parrenin, F., Martinerie, P., Blayo, E., Blunier, T., Capron, E., Chappellaz, J., Rasmussen, S. O., Severi, M., Svensson, A., Vinther, B., and Wolff, E. W.: The Antarctic ice core chronology (AICC2012): an optimized multi-parameter and multi-site dating approach for the last 120 thousand years, Clim. Past, 9, 1733–1748, https://doi.org/10.5194/cp-9-1733-2013, 2013.
Whitcher, B.: Package Waveslim, Basic wavelet routines for one-, two-, and three dimensional signal processing, version 1.8.2, CRAN, https://cran.r-project.org/web/packages/waveslim/waveslim.pdf (last access: 11 April 2022), 2020.