the Creative Commons Attribution 4.0 License.
the Creative Commons Attribution 4.0 License.
 | 10 Oct 2022
Canadian forest fires, Icelandic volcanoes and increased local dust observed in six shallow Greenland firn cores
Patrick Zens
Samuel Black
Kasper Holst Lund
Anders Svensson
Paul Vallelonga
Greenland ice cores provide information about past climate. Few impurity records covering the past 2 decades exist from Greenland. Here we present results from six firn cores obtained during a 426 km long northern Greenland traverse made in 2015 between the NEEM and the EGRIP deep-drilling stations situated on the western side and eastern side of the Greenland ice sheet, respectively. The cores (9 to 14 m long) are analyzed for chemical impurities and cover time spans of 18 to 53 years (±3 years) depending on local snow accumulation that decreases from west to east.
The high temporal resolution allows for annual layers and seasons to be resolved. Insoluble dust, ammonium, and calcium concentrations in the six firn cores overlap, and the seasonal cycles are also similar in timing and magnitude across sites, while peroxide (H2O2) and conductivity both have spatial variations, H2O2 driven by the accumulation pattern, and conductivity likely influenced by sea salt.
Overall, we determine a rather constant dust flux over the period, but in the data from recent years (1998–2015) we identify an increase in large dust particles that we ascribe to an activation of local Greenland sources. We observe an expected increase in acidity and conductivity in the mid-1970s as a result of anthropogenic emissions, followed by a decrease due to mitigation. Several volcanic horizons identified in the conductivity and acidity records can be associated with eruptions in Iceland and in the Barents Sea region. From a composite ammonium record we obtain a robust forest fire proxy associated primarily with Canadian forest fires (R=0.49).
- Article
(2327 KB) - Full-text XML
-
Supplement
(3418 KB) - BibTeX
- EndNote


The accumulation and preservation of past snowfall as glacier ice stores an abundance of information regarding past environmental conditions that can be retrieved through physical and chemical analyses of polar ice cores.
For Greenland, water isotopes and deuterium excess can provide information on average temperatures and ice volumes (Johnsen et al., 1989; Dansgaard, 1964), dust layers provide constraints on large-scale atmospheric circulation patterns and desertification (Fischer et al., 2007; Ruth et al., 2002; Simonsen et al., 2019), sea salt (e.g., Na+) further constrains atmospheric transport while simultaneously informing on oceanic conditions (Schüpbach et al., 2018; Fischer et al., 2007; Rhodes et al., 2018), and ammonium concentration maxima provide evidence of forest fire activity and global vegetation coverage (e.g., Legrand et al., 1992, 2016). Often these proxies exhibit annual cycles in the composition and concentration due to natural cycles in their atmospheric concentration but also as a result of temperature, accumulation and wind fluctuations at the deposition site. These annual cycles can be used to identify corresponding annual layers in the ice, which are important for dating the high-resolution climatic signals (Rasmussen et al., 2013; Svensson et al., 2008). As an example, the production of peroxide (H2O2) mainly takes place during months of intense insolation as it is produced by a photochemically derived self-reaction of hydroperoxyl radicals (HO2) (Frey et al., 2006; Sigg and Neftel, 1988). Therefore, H2O2 records show maximum concentrations in the summer and minimum concentrations during the winter months, when photochemical processes are absent at polar latitudes (Sigg and Neftel, 1988; Frey et al., 2006). However, H2O2 maintain a constant exchange with the atmosphere, leading to post-depositional relocation within the upper snow and firn. Hence, if snow accumulation rates are not high enough (0.13 m w.e. yr−1), this exchange causes smoothing and loss of seasonal H2O2 signal to occur (Neftel, 1996).
The development of high-resolution continuous-flow analysis (CFA) techniques (Kaufmann et al., 2008; Bigler et al., 2011; Dallmayr et al., 2016; Kjær et al., 2021a) has allowed the collection of continuous long-term paleoclimate records back through time on a sub-annual scale (Schüpbach et al., 2018; Simonsen et al., 2019) and is now a standard in ice core analyses. Despite its intrinsic dispersion of signal and small sample loss around core breaks, CFA represent a highly efficient and rapid analysis technique relative to the measurement of discrete samples and is favored for the effective sample decontamination and high sampling resolution (Breton et al., 2012; Erhardt et al., 2022).
We evaluate the impurity concentrations as determined by means of CFA in six shallow northern Greenland firn cores across northern Greenland sites. The cores are dated individually to allow for comparisons of temporal and spatial trends in both mean concentrations and seasonal cycles. Further we investigate extreme events, such as the deposition from forest fires and volcanic eruptions, and their representation between the six sites. The sites chosen cover the lower accumulation area in central northern Greenland, both east and west of the divide, which are locations with only limited prior analysis of this kind (Du et al., 2019a; Vallelonga et al., 2014; Fischer et al., 1998; Gfeller et al., 2014; Schüpbach et al., 2018; Kjær et al., 2021a).
Six shallow firn cores were collected during the NEEM to EastGRIP (N2E) traverse in May to June 2015 (Karlsson et al., 2020). The N2E traverse went from the NEEM (The North Greenland Eemian Ice Drilling) deep ice core drill site (77.5∘ N, 51.0∘ W, 2481 m a.s.l.) to the EastGRIP (The East Greenland Ice-core Project) deep ice core drill site (75.64∘ N, 36.0∘ W, 2712 m a.s.l.). Cores were drilled from the surface to a depth between 9.08 and 14.02 m. The position and time period covered by the firn cores labeled T2015-A1 to T2015-A6 can be found in Table 1 and Fig. 1 (Kjær et al., 2021b).
Table 1Name, latitude, longitude, altitude, core depths, bottom age and mean accumulation (Kjær et al., 2021b) of the shallow firn cores presented in this study. The firn cores are labeled T2015-A1 to T2015-A6. All cores were drilled in 2015 and measured by means of CFA in Copenhagen in 2017.
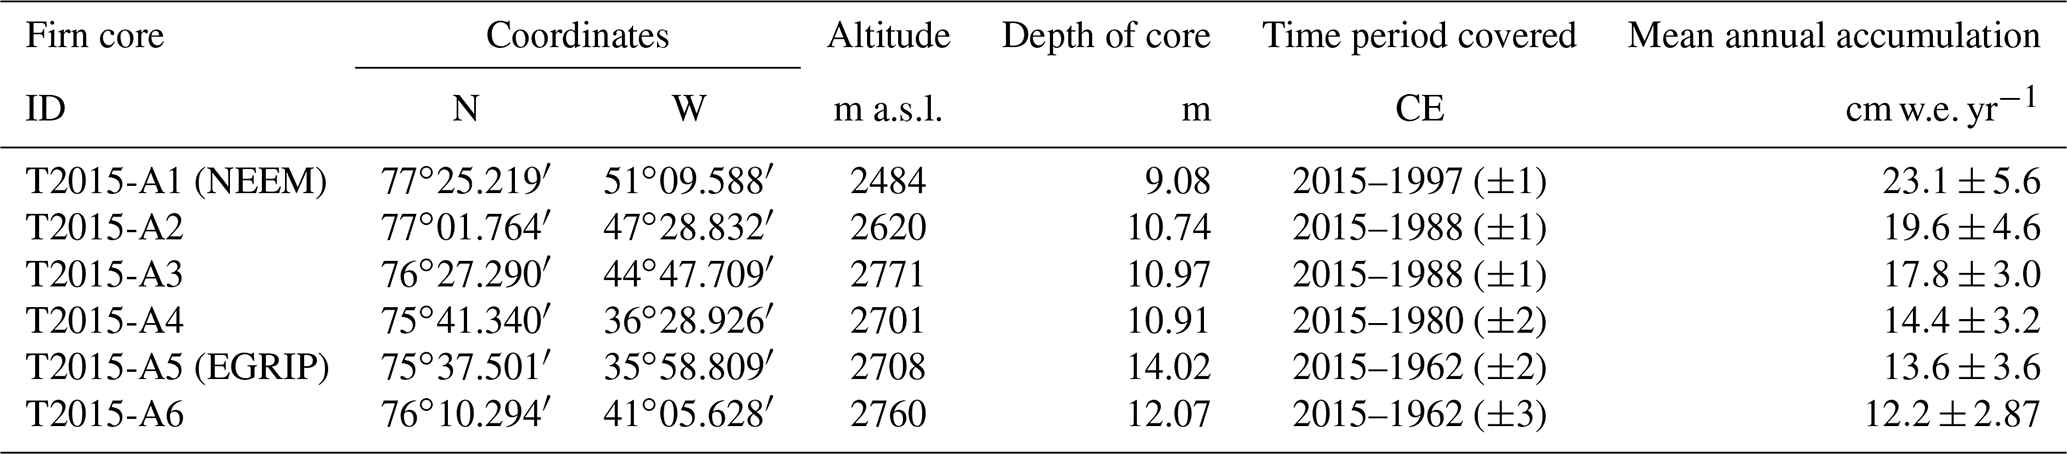
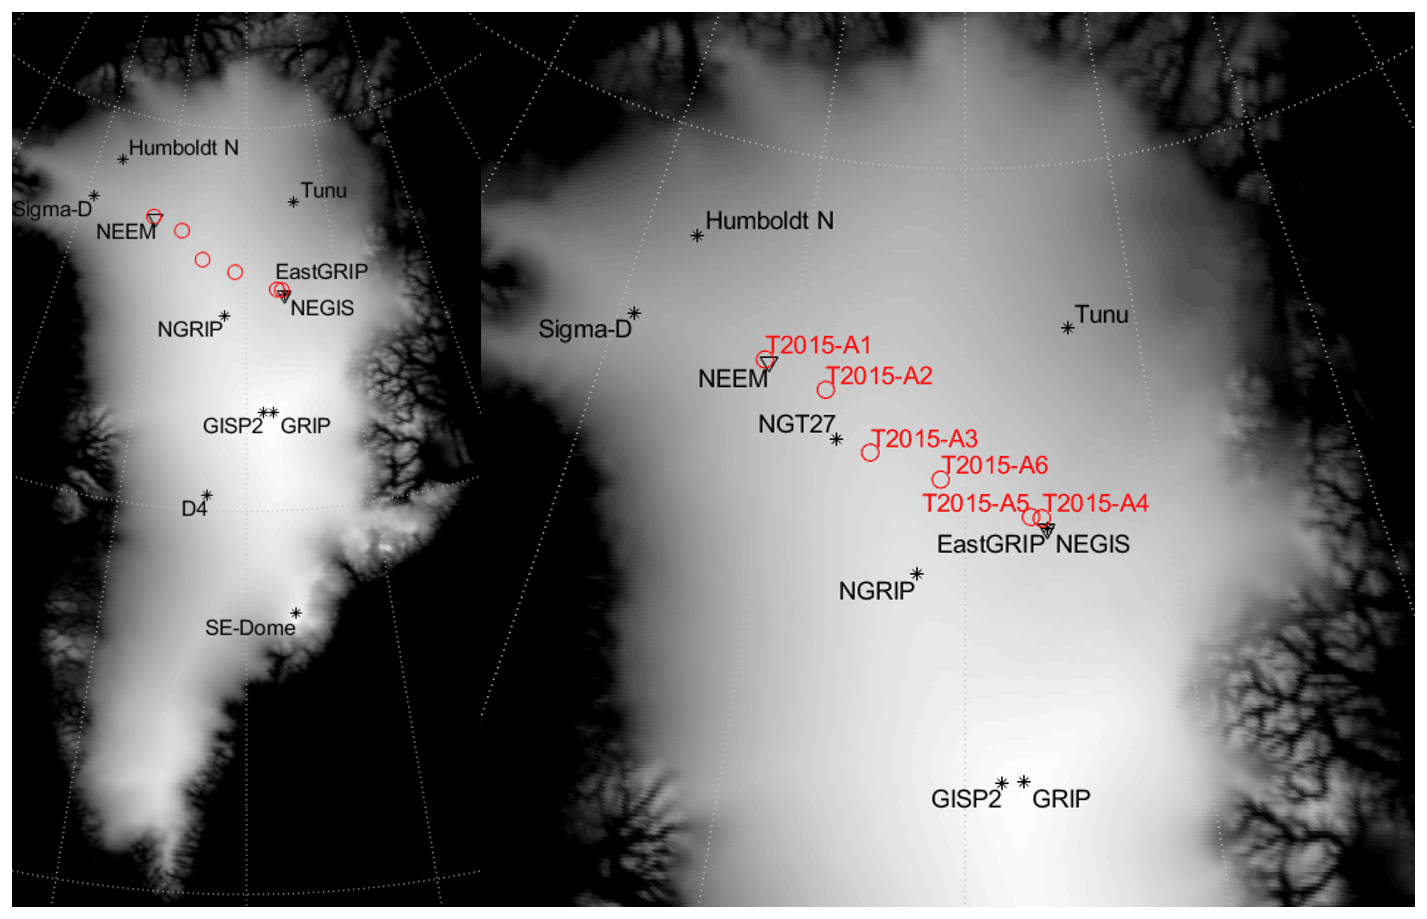
Figure 1The six drill sites for the shallow firn cores investigated in this study (red circles) and the sites of other ice and firn cores mentioned in this study (black stars) on a background of Greenland surface elevation (SeaRISE dataset, Bamber, 2001).
The firn cores were drilled using the American IDDO (U.S. Ice Drilling and Design Operations) hand auger (76 mm diameter). In the field the cores were split into 55 cm long segments and packed into plastic bags. They were transported in cooler boxes on sledges to the EastGRIP site, from where they were first flown to Kangerlussuaq, Greenland, and then shipped further to Copenhagen, Denmark, for analysis. In Copenhagen they were stored at −20 ∘C until further cutting into sections of 3.4×3.4 cm just prior to the CFA measurements (Bigler et al., 2011).
2.1 Continuous flow analysis (CFA)
In 2017, 2 years after retrieval, the CFA system at the Niels Bohr Institute in Copenhagen (Bigler et al., 2011) was used to analyze the six firn cores for their chemical impurity content. The system was slightly adapted from the published Copenhagen CFA system (Bigler et al., 2011), which determines conductivity (σ), insoluble dust, ammonium (NH) and calcium (Ca2+) by adding analysis of hydrogen peroxide (H2O2) and acidity (H Kjær et al., 2016). The flow chart and additional information for the particular CFA setup and instrumentation are presented in the Supplement (Fig. S1, Tables S1 to S3).
The determined signals were converted into units of concentration using a linear regression produced by a set of two (H2O2 and H) or three (NH and Ca2+) known standards (Table S3). Calibrations were performed every four hours. In general, the baseline was established by running ultra-pure water (Milli-Q) water through the system for every 4.4 m of firn analyzed (eight pieces that are each 55 cm in length). However, for the top 1.65 m where the core was fragile as a result of low density, the baseline was established in between each of the top three 55 cm sections to ensure baseline stability and avoid compression from overlying cores increasing the uncertainty on the depth registration.
Driven by capillary forces, the meltwater percolates from the CFA melt head into the firn core above dispersing the signal. This was mitigated by adding a metal (97 % Cu, 2,5 % Zn) coin to the melt head to limit contact between any excess meltwater on the melt head and the firn core. In addition, such excess water that could be sucked up into the firn was limited by carefully adjusting the melt head temperature relative to pump speeds carrying the water away. With these modifications, the level of water percolating into the firn from the melt head was limited to <1 cm. Melt rate was kept at ∼4 cm min−1, which resulted in the final depth resolution of the ions measured being <2 cm (H, NH, H2O2, Ca2+), while for the conductivity and dust with shorter step change response times (the time it takes to go from a level of 5 % to 95 % of a concentration) a depth resolution of 8 mm was achieved. We note that the accumulation at the sites varies between 12 and 23 cm w.e. yr−1, and thus annual signals are resolved with the achieved resolution.
2.2 Core chronology
The calibrated data retrieved from the CFA are shown for the individual cores on a depth scale in Figs. S2 to S7. We rely on the strong seasonal pattern of H2O2 (Figs. S2 to S7, top) to constrain the age of the six shallow cores (Table 1), where we assign the summer maxima of H2O2 to the solar solstice (June). At the low-accumulation sites where H2O2 seasonality was not well resolved, i.e., T2015-A4, T2015-A5 and T2015-A6, the seasonality in Ca2+ (Figs. S2 to S7, second topmost) was used to further constrain the firn core chronologies. Despite the fact that other proxies analyzed also show a strong annual cycle (see Fig. 2 and Fig. 4), we maintain an age scale based on just H2O2 (or Ca2+). This is because one of the aims of the study is to investigate the seasonal cycle between sites. In addition, we note that acid horizons are commonly used to match ages between cores. However, we have chosen not to do so, as another aim is to investigate which of the extreme acid layers in recent time can be used to constrain ages between sites. The total age of each core and the uncertainty defined as ±0.5 years for each uncertain year can be found in Table 1. We then use the age–depth relationship from the H2O2 peaks to interpolate the depth series into a time series using a constant accumulation assumption. Accumulation from the Greenland Climate (GC) network at NEEM suggests a fairly equal summer to winter ratio (Gfeller et al., 2014), and thus we stick with a simple constant accumulation scenario (Gfeller et al., 2014; Kjær et al., 2013). We could have used reanalysis accumulation data to constrain the monthly accumulation, but even high-resolution weather reanalysis performs poorly on the central ice sheet (Kjær et al., 2021b).
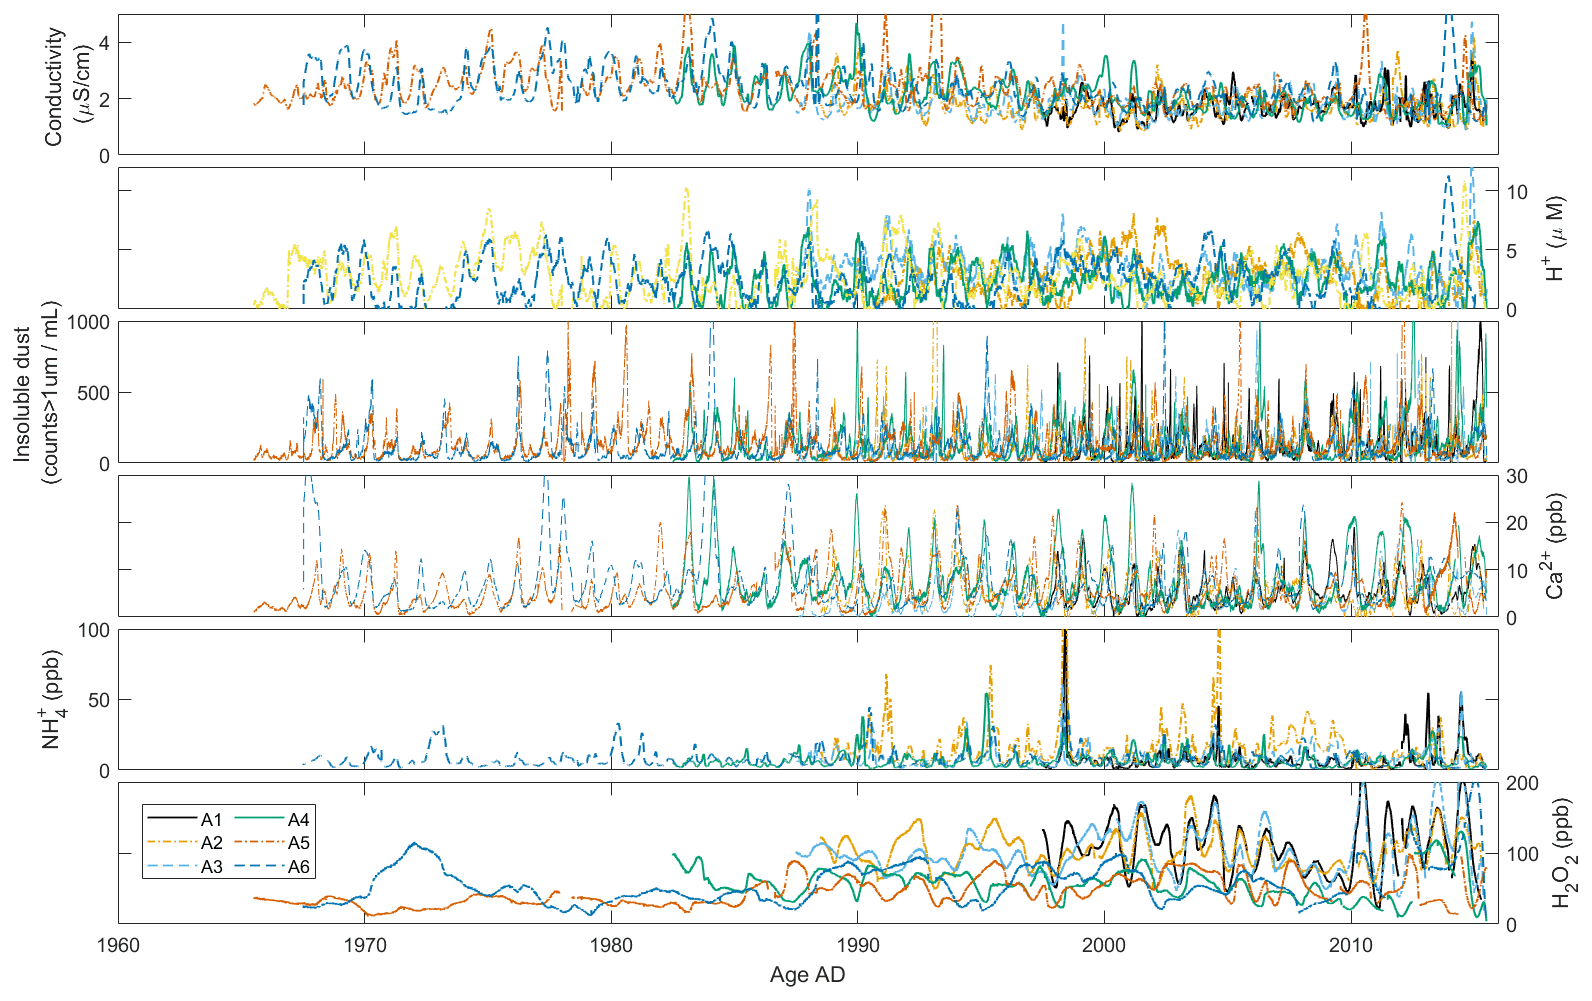
Figure 2Proxies measured by means of CFA in the six shallow firn cores: T2015-A1 (black), T2015-A2 (dashed yellow), T2015-A3 (light blue), T2015-A4 (green), T2015-A5 (dashed orange) and T2015-A6 (dashed dark blue). From top to bottom, the following variables are shown: conductivity, acidity, insoluble dust, Ca2+, NH and H2O2 concentrations. Note that the acidity for T2015-A1 and the NH for T2015-A5 were not of sufficient quality and are consequently not shown.
To investigate the seasonality in the proxies we first removed the 5-year running average and adopt the term excess for the remainder. The years were split further into 12 months of equal accumulation using the formal month definition (Gfeller et al., 2014; Kjær et al., 2016). We highlight that we have not used the extremes in acidity or NH to constrain the dating between the six firn cores, and thus each core is dated on its own individual timescale using solely annual layer counting of H2O2, and in the case of T2015-A6, T2015-A5 and T2015-A4, Ca2+ is also used. The firn cores span 18 to 53 years depending on local snow accumulation, which decreases from west to east. The uncertainty of the age scale is estimated to be ±3 years at the base of the oldest core, but it is lower for the remainder of the cores.
In Fig. 2 the full-resolution chemical data from the CFA campaign are presented for all six firn cores combined on an age scale, while in Figs. S2 to S7 they are presented individually on a depth scale. Table S4 represents the median and 15th and 85th percentiles of the individual records, while Fig. 3 shows also shows the 2.5 % and 97.5 % range. Pearson correlations between the sites are presented for the individual proxies in Sect. S3 in the Supplement for both annual mean records and monthly mean records.
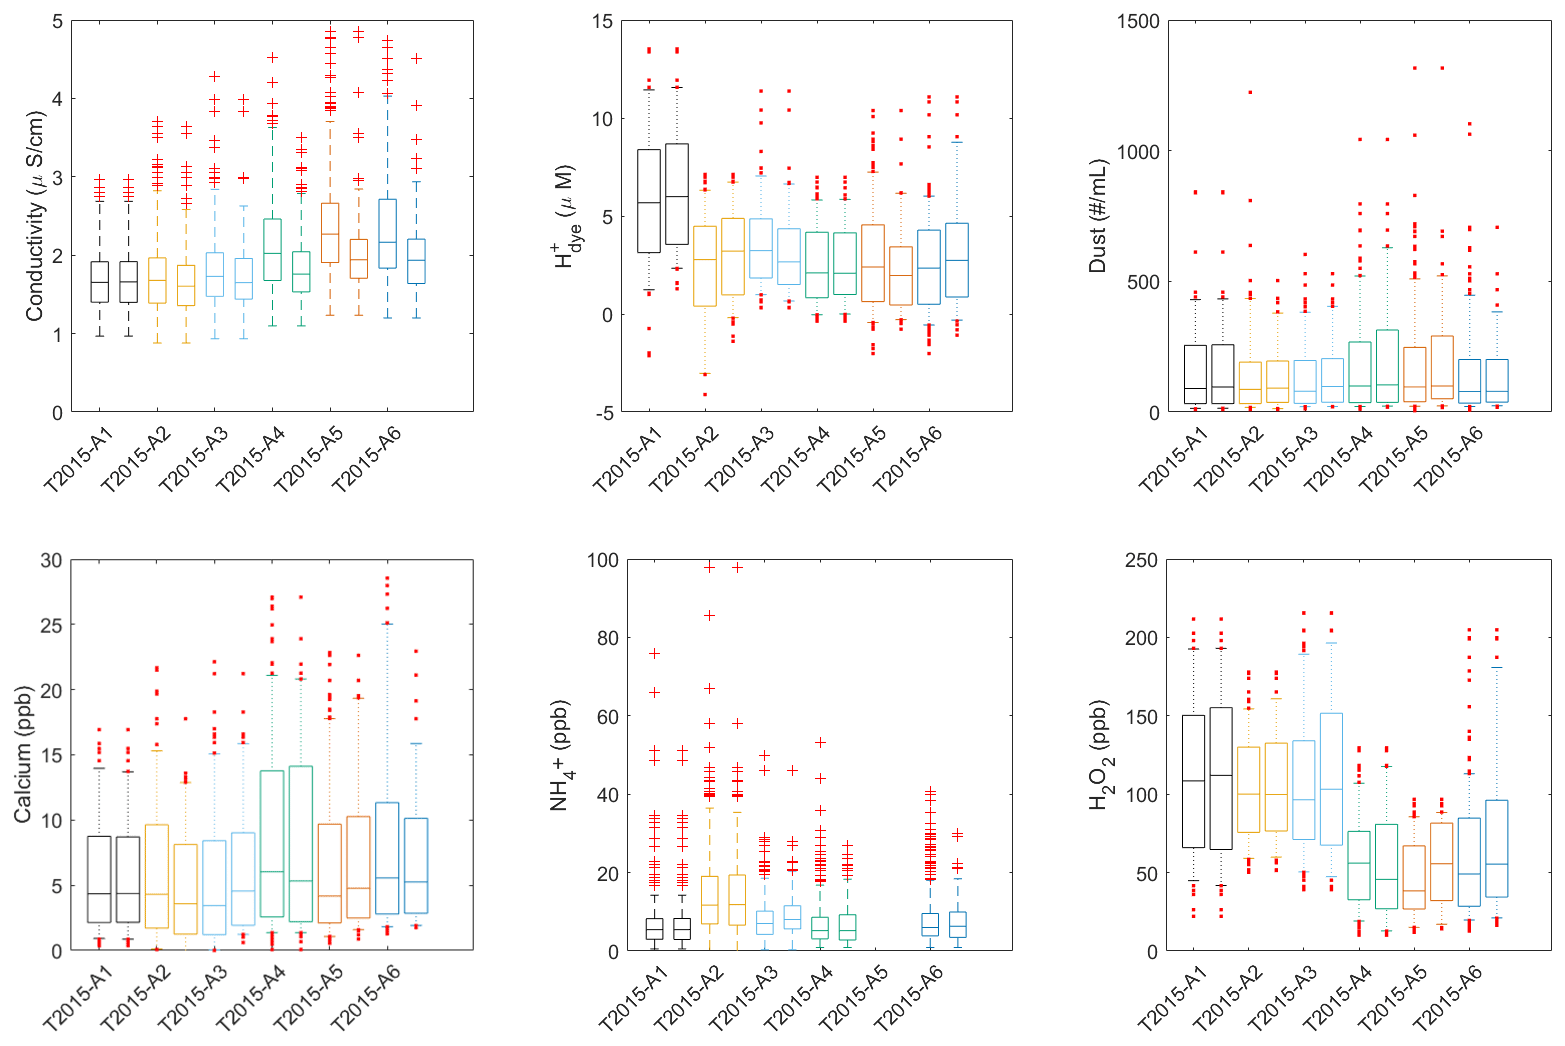
Figure 3Statistical representation of the monthly mean datasets. The central mark indicates the median, and the bottom and top edges of the box indicate the 25th and 75th percentiles, respectively. The whiskers extend to the 2.5th and 97.5th percentiles. Red dots shows data exceeding the 2.5th and 97.5th percentiles. From left to right, T2015-A1 (black), T2015-A2 (yellow), T2015-A3 (light blue), T2015-A4 (green), T2015-A5 (orange) and T2015-A6 (dark blue) are shown. Two sets are shown for each core to make comparable estimates between sites: on the left for the full temporal record available and on the right for the period 2000 CE and onwards.
We start by comparing the individual sites to previous analysis of this kind. At the EastGRIP site (T2015-A4 and T2015-A5) our medians (Fig. 3, Table S4) are comparable with previous measurements (Vallelonga et al., 2014; Kjær et al., 2016; Du et al., 2019b).
At the NEEM site (T2015-A1) the NH median (Fig. 3, Table S4) is concurrent with other shallow cores (1982–2011) as it has concentrations of 5.5±5.7 to 8.1±8.5 ppb NH and 4.7±4.7 to 6.9±5.2 ppb Ca2+ (Gfeller et al., 2014) and is also directly comparable to that of NEEM for the past 2000 years (Zennaro et al., 2014), suggesting no significant recent increases in the NH proxies. The Ca2+ is comparable with a lower median than that found in the early Holocene for the NEEM deep ice core ∼7 ppb, Schüpbach et al., 2018). The interannual variations in the individual records are large for all proxies (whiskers in Fig. 3).
Spatial concentration gradients (comparing 15 %–85 %) in insoluble dust, Ca, NH, H+ and conductivity are not easy to distinguish because of the interannual variability and the site-specific noise. This is despite the fact that the firn cores are spanning a distance of 426 km and that accumulation is double or more in the northwestern area (T2015-A1, T2015-A2, T2015-A3, Table 1) compared to the central northern and northeastern areas (T2015-A4, T2015-A5, T2015-A6) (Kjær et al., 2021b). Gfeller et al. (2014) investigated several shallow cores at the NEEM site and reported that annual deposited aerosol concentrations in shallow firn cores can vary strongly over distances of a few meters. The study pointed out that one drill site could be representative for >60 % of the variability within a squared area of 100 m2. We add that in central northern Greenland, for distances >100 km apart, significant median concentration changes between sites are not resolved beyond seasonal noise for insoluble dust, Ca2+ or NH. This suggests that the dust and NH are mainly wet deposited in central northern Greenland, producing similar concentrations across all sites and indicates a single source area for each species over far enough distances that individual weather events are not influencing the signal.
In contrast, we notice a clear dependence on accumulation in H2O2 (Fig. 3, Tables S4 and 1), with concentrations in the northwest (median 96–108 ppb) that are twice those in central and northeastern Greenland (median 38–56 ppb), owing to the photolysis reactivation loss at the lower accumulation sites (Sigg and Neftel, 1988; Frey et al., 2006).
The conductivity also has spatial gradients, and the median decreases from close to 2 µS cm−1 (Fig. 3, Table S4) in the low-accumulation sites of the northeast (T2015-A4 and T2015-A5) to 1.60–1.66 µS cm−1 at the higher-accumulation sites west of the Greenland ice divide (T2015-A1, T2015-A2, T2015-A3). We suggest that this is an effect of the total dry deposited ions (e.g., sea salt) being more diluted in the west, but we speculate that it could also originate from an anthropogenic (North American) inputs reaching the western central ice sheet first and only later becoming more dispersed in the east. Unfortunately, the noise in the acidity records from the six firn cores is too large to help resolve if anthropogenic changes are the source, and sodium was not analyzed for these cores.
Looking at the correlation between sites in the individual proxies (Sect. S3), we observe in general higher correlation values between the western cores (T2015-A1, T2015-A2 and T2015-A3), than the eastern or central cores, probably owing to the better-constrained dating at the high-accumulation sites and shorter records.
The monthly peroxide (H2O2) records correlate well for the high-accumulation western sites (Rmonth<0.56) as expected given that the dating is based on this proxy. Contrarily, the eastern low-accumulation sites correlate less well as a result of the loss of signal. This is also the case in the correlation of the annual H2O2 records, a relationship perhaps driven by similar overall accumulation patterns as speculated by, e.g., Frey et al. (2006).
The Ca2+ used to constrain the dating for the low accumulation site also show significant positive correlations. However, T2015-A6 and T2015-A5 are less well correlated to each other and to T2015-A1 and T2015-A2, respectively, suggesting that the top part of T2015-A5 and T2015-A6 are perhaps offset in the precise assignment of summer months. The annual correlation for Ca2+ and insoluble dust is not significant, while insoluble dust monthly correlations are about half those found for Ca2+. We interpret these lower correlations as either (1) individual dust depositions being more dispersed than similar Ca2+, (2) insoluble dust having an additional source on top of the shared source with Ca2+ or (3) the CFA analysis smoothing the Ca2+ to ensure better monthly correlations than those found for the better-resolved insoluble dust (where individual deposition events can be recognized from each other).
The conductivity records are well correlated at either side of the ice divide in both the annual and monthly records: for the western cores this value is Rmonth>0.3, while in the east (including T2015-A6) it is Rmonth>0.26. This supports the idea that the seasonal variation in conductivity could be driven by two different sources, with one in the west and another in the east. H+ from ice cores is speculated to be the main controller of the conductivity in Greenland ice cores. Unfortunately, the quality of the H is not sufficient to investigate if this is the case here. However, we speculate that a separate North American H+ source mainly influences western cores, while a European source mainly influences the eastern cores. We also note that sea salt was not analyzed in this study but that it can dominate the conductivity signal in ice cores from coastal sites. Hence, we further speculate that the high monthly correlations in the conductivity records amongst eastern and western sources could be caused by sea salt from different open-water sources, namely Baffin Bay and the Greenland Sea, respectively.
The ammonium records are generally well correlated between sites both for the annual (Rannual 0.29–0.68) and monthly resolved records (Rmonth 0.29–0.61), again more so at the western high accumulation sites (Rmonth>0.38, Rannual>0.42) suggesting a common source reaching all of northern Greenland.
Finally, we note that high-resolution records (as in this study) contain variations related to not only the climatology but also the analytical setup (e.g., smoothing for the different CFA systems) and/or site-specific noise, thereby limiting the record's capability to resolve spatial gradients between the firn records. Site-specific noise is related to the local precipitation patterns, which can be disturbed by wind, causing the formation of dunes, sastrugis or crust layers. These features mix up already deposited snow, particularly if precipitation is especially event based. Melt layers at sites experiencing higher temperatures and ablation can also redistribute the deposited ions in the snow pack (Laepple et al., 2016; Gfeller et al., 2014).
We remove the 5-year running average and investigate the seasonality by formal month in the excess (Fig. 4). Thus, the average seasonal cycle of excess concentration after removing the 5-year mean also contains extreme events such as forest fires and volcanic horizons, which is discussed in more detail in Sect. 5. As H2O2 was used as the main cycle to date these cores, we refrain from discussing its climatology. Still, we note that for all sites except T2015-A6 the average seasonal cycle of H2O2 (Fig. 4, top left) is sinusoidal with the confidence intervals distributed almost equally above and below, where the maximum H2O2 concentration is defined as summer solstice (June) and the minimum is observed in the formal months December and January. However, for the low-accumulation site (T2015-A6) it is evident that dating using just H2O2 was challenging and that the use of Ca2+ has shifted the seasonal maximum value to 2 months later (to ∼ August) and made the H2O2 seasonal cycle look less sinusoidal than seen at the other sites. This uncertainty in the dating is likely reflected in the average seasonality for other proxies in the T2015-A6 traverse core, and consequently care should especially be taken when interpreting T2015-A5 and T2015-A6.
4.1 Summer biosphere activity in ammonium (NH)
NH has a distinct maximum in the late spring and early summer months (April–June, Fig. 4, top, middle) associated with high biological activity, while minimum concentrations occur in a wider part of the year from late autumn and early winter (October–December). The variability is high between the individual years (Figs. 2 and 3), and the annual maximum is wide and not particularly sinusoidal, as evidenced in the seasonal cycle of the 15 %–85 % quartiles (Fig. 4, top, second). This is a result of an additional source in summer and early autumn, namely the Canadian forest fires, and the uneven seasonal shape is more clearly evidenced in the cores closest to the Canadian forest fire source area (T2015-A1, Fig. 4, black and T2015-A2, Fig. 4, yellow).
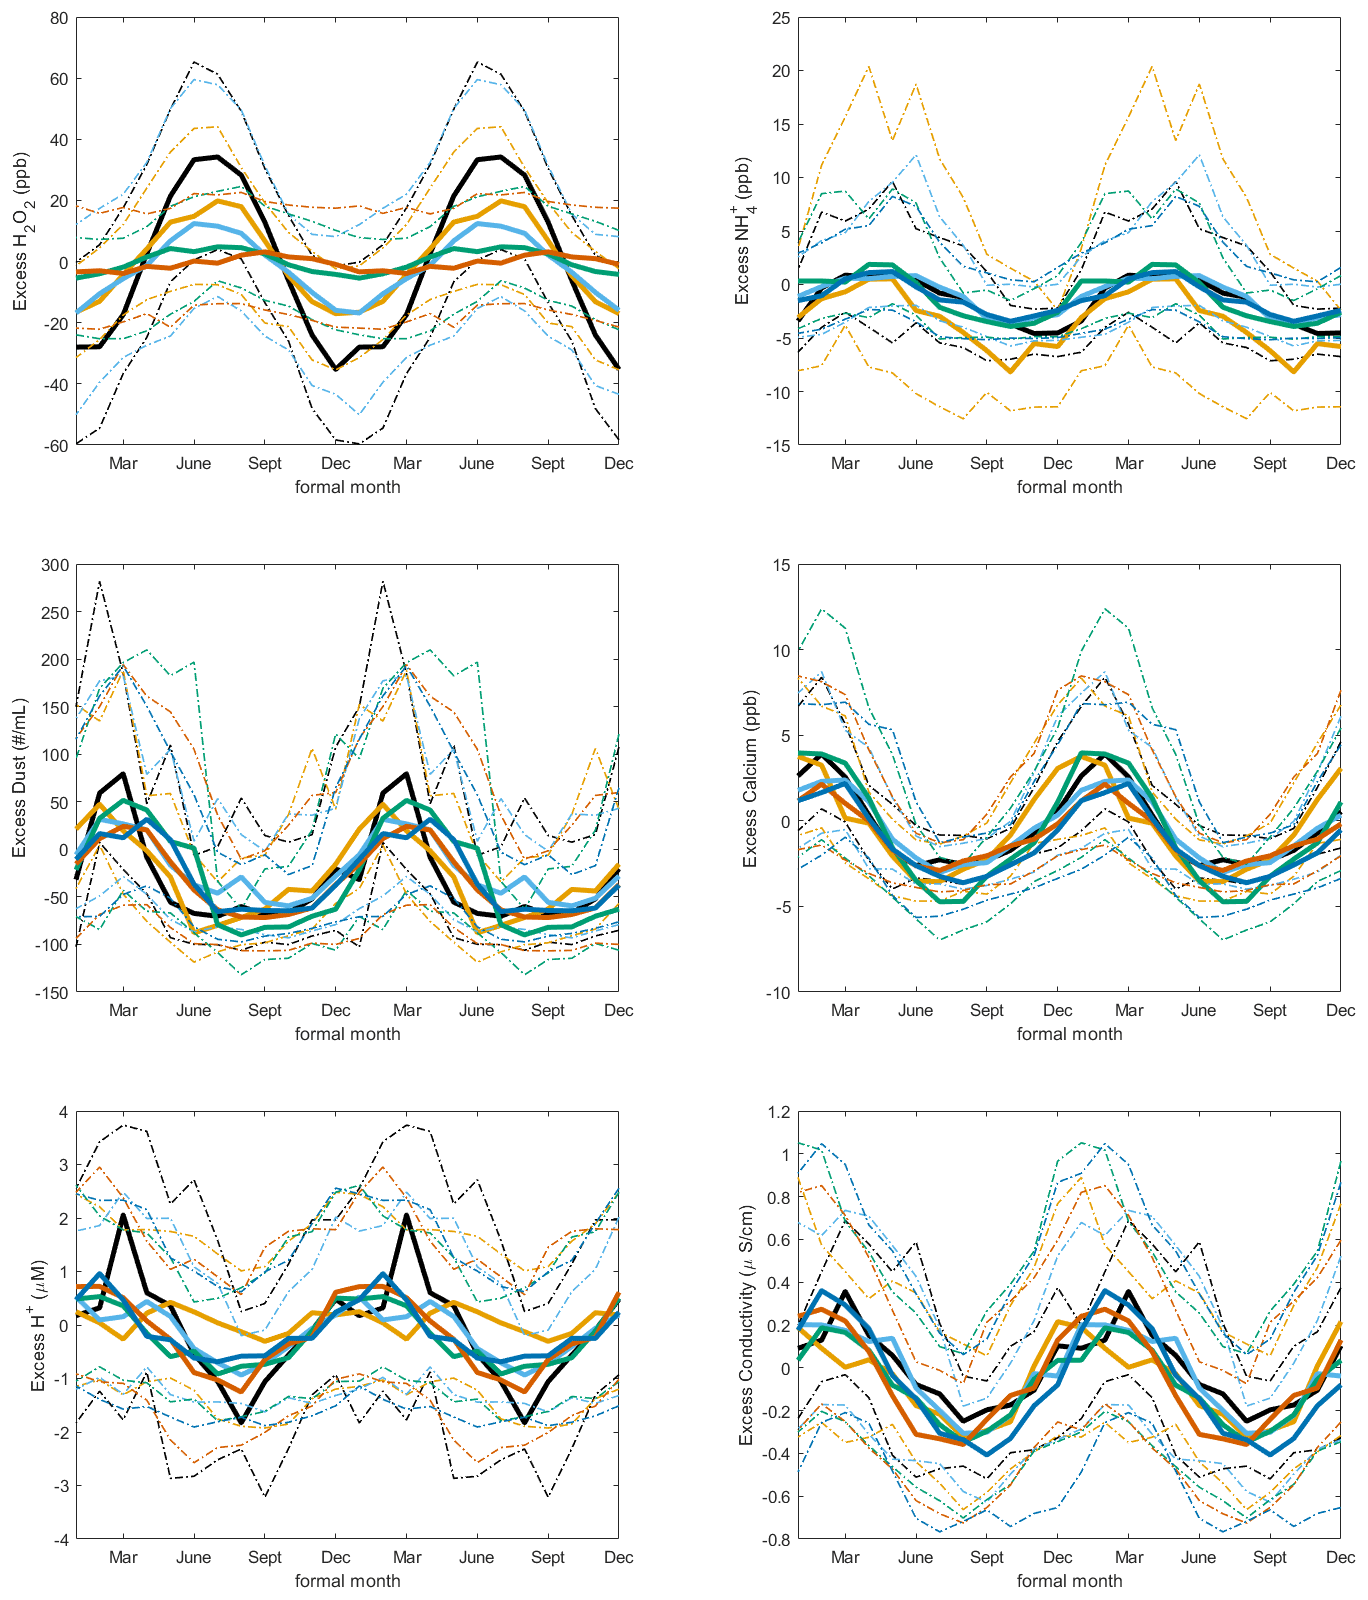
Figure 4The following variables are shown (from top left to bottom right): H2O2, NH, insoluble dust, Ca2+, H+ and conductivity monthly medians (thick lines) (based on the formal month definition) of the excess concentrations as defined after removing the 5-year temporal trend. Thinner dashed lines indicate the 15 % to 85 % quartiles of monthly averaged records. The colors reflect the six firn cores: T2015-A2 (yellow), T2015-A3 (light blue), T2015-A4 (green), T2015-A5 (orange) and T2015-A6 (darker blue). Note that for T2015-A5 ammonium is not analyzed.
Gfeller et al. (2014) found median NH to be largest in the formal months June and July and that concentration maxima had shifted from the preindustrial era when it was as late as July and August for the NEEM site. We attribute the discrepancy to the uncertainty associated with the formal month definition and in differences in dating strategy, as we also note that the average H2O2 seasonal cycle observed by Gfeller et al. (2014) is shifted by 2 months compared to our assignment of annual maximum H2O2 in summer solstice.
4.2 Winter storms carry dust inland
Insoluble dust particles and Ca2+ (as its soluble compound; Fig. 4, middle panels) coming from, e.g., CaCO3, or CaSO4, are common paleo-climatological proxies for global aridity and wind strength. The average Ca2+ seasonal cycles (Fig. 4, middle right) in the traverse cores show a late winter–early spring maxima (Ca2+ January–March, insoluble dust February–May), as also observed by others (Kang et al., 2015; Kuramoto et al., 2011; Amino et al., 2020). Minimum concentrations are found in the summer months July and August. The Ca2+ seasonal cycle is smooth compared to that of the insoluble dust, where we also see high insoluble dust loads in the adjacent months of the annual maximum, as evidenced by the monthly 85 % quantile (Fig. 4, middle left). In the cores T2015-A4, T2015-A5 (EastGRIP site) and T2015-A6 (central divide) it looks like insoluble dust is deposited twice a year (early spring and late autumn–early winter). While this may be due to a local source, as was speculated in other areas of Greenland (Amino et al., 2020; Bullard and Mockford, 2018; Nagatsuka et al., 2021), it could also be ascribed to the fact that deposition events are rare in central northern Greenland (McIlhattan et al., 2020), and thus the dust maxima could be found in other formal months.
4.3 Spring Arctic haze in acidity and conductivity
Maximum concentrations of acidity (Fig. 4, bottom left) are recorded in early spring (March); however, these show a wide distribution in the adjacent months (January–May). This is in line with previous findings, where the seasonal maxima of acidity is found in spring and attributed the modern Arctic haze phenomenon, with anthropogenic pollutants such as SO2 building up in the atmosphere during stable and dry winter conditions before being deposited in spring, when precipitation rates grow (Gfeller et al., 2014; Kuramoto et al., 2011; Quinn et al., 2007). As the conductivity is mainly driven by the H+ in Greenland (Kjær et al., 2016), its annual maxima concentration is in close proximity (Fig. 4, bottom right); however, these are shifted 1 month towards an earlier deposition likely due to the influence of sea salt. Similar observations of seasonality have been made at the NEEM site (January–April) and Humboldt North site (December–March) (Gfeller et al., 2014; Pasteris et al., 2012).
In the following, we investigate temporal trends observed in the six records. We find a clear signal of the 1970s acid contamination in the conductivity (Fig. 2) and increases in the intermediate and large insoluble dust fluxes (Fig. 5), suggesting an activated transport of local Greenland dust to the northern Greenland ice sheet, with this phenomenon being more pronounced at lower-altitude sites closer to the coast.
5.1 Anthropogenic increase in the 1970s and 1980s observed in the conductivity
The 1970s increase in conductivity associated with anthropogenic sulfur and NOx emissions has previously been observed in firn records from Greenland (Fischer et al., 1998; Kjær et al., 2016; Pasteris et al., 2012). For our oldest records, T2015-A5 and T2015-A6, a decrease in the conductivity between the early part of the record (1960s–1990s) and the younger part confirms the effect of mitigation measures (Figs. 2 and S8 top). The conductivity in polar ice cores is found to be mostly controlled by H+ (Kjær et al., 2016). We would thus expect similar trends of anthropogenic contamination in the acidity record. Unfortunately, the interannual variability in the acidity record is large, making it difficult to assess the temporal trend (Figs. 2, S8, bottom and S4). This is mainly a result of the measurement technique being subject to flow sensitivity (Kjær et al., 2016), but it is also influenced by individual concentration maxima associated with volcanic events (discussed in Sect. 6.1).
5.2 Local dust activation
Recent publications have suggested that with warming and current mass loss in Greenland, local sources of dust are activated. For the Holocene, large-sized particles of local dust are observed at the coastal East Greenland ice core site ReCAP (Simonsen et al., 2019) and at the SE-Dome core (southeastern Greenland); an increase in the locally sourced dust flux in the period 2000–2010 compared to 1960–2010 was evident as an increase in the larger particles (>5 µm) in the autumn (Amino et al., 2020). In the west (Kangerlussuaq), local dust activation in the period 2000–2010 has been discerned (Bullard and Mockford, 2018) and in the northwest ice core Sigma-D (for the period 1915–1949 and 2005–2013) the mineral composition suggested a West Greenland source possibly related to warmer recent temperatures in Greenland activating the local dust source areas, while the remainder of the past 100 years suggested a Canadian dust source area (Nagatsuka et al., 2021).
When comparing the period between 2000 and 2015 to that of the full firn cores, we do not discern any significant increase in the total number of insoluble particles at any of the six northern sites studied or in the Ca2+ concentrations (Fig. 3, Table S4).
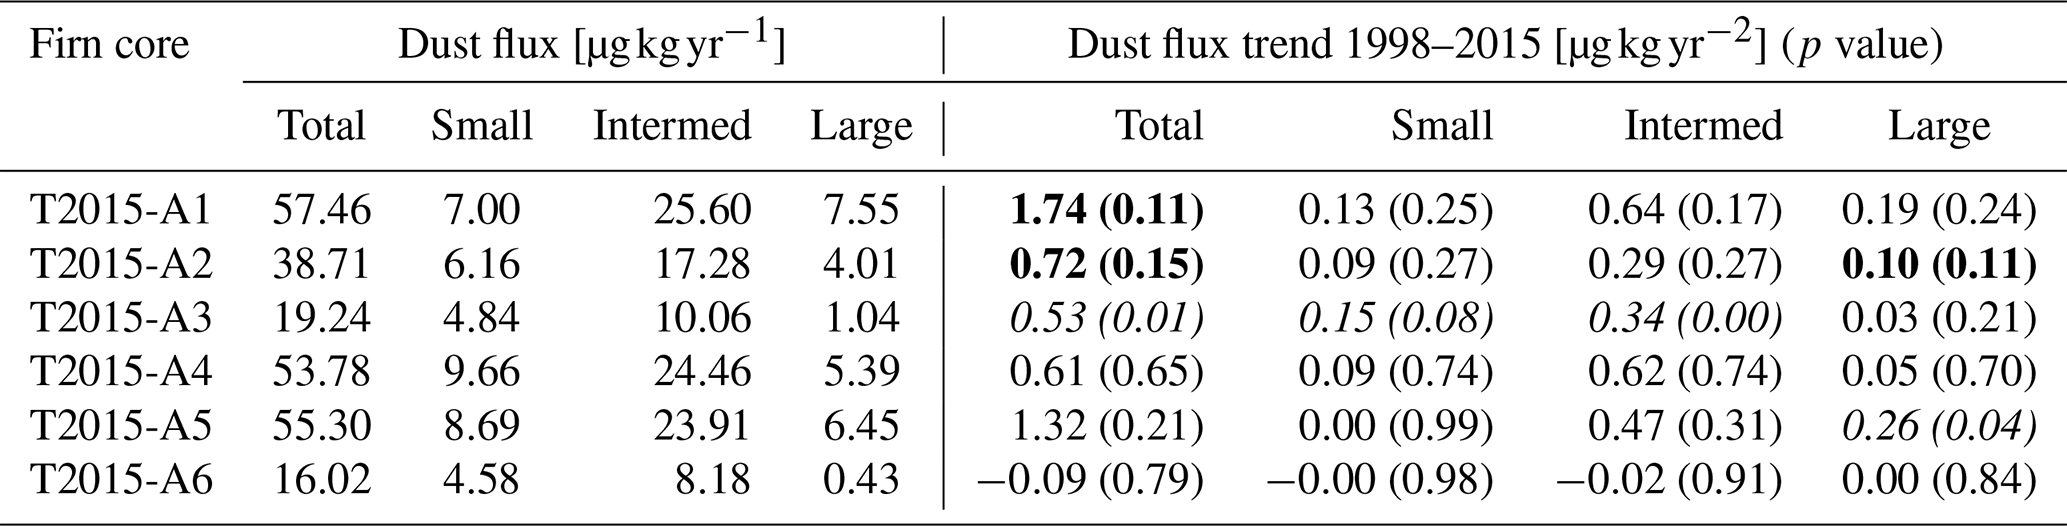
The annual insoluble dust flux (Table 2 and Fig. 5) was determined assuming that all spheres are perfectly round, using a mean density of 2400 kg m−3 for the dust and annual accumulation for the six sites (Kjær et al., 2021b). We note that uncertainty associated with the flux calculation is related to the accumulation and uncertainties within the timescale, as well as the assumption of spherical dust, and therefore the following discussion must not be overinterpreted. We report a total dust flux between 0.016 and 0.057 mg kg−1 yr−1 (Table 2), with the smaller fluxes being found at the central higher-altitude sites (T2015-A3 and T2015-A6) as anticipated. We further split the data into three bins: small (1.25 to 2.9 µm radii), intermediate (2.9 to 8.13 µm) and large (8.13 to 10.5 µm), as was also done in Simonsen et al. (2019). The largest particles (>10.5 µm) are omitted from further analysis as they are subject to poor statistics and the smallest sizes (<1.25 µm) are omitted as they are noisy. We find that by parting the dust data in this way we have 12 %–29 % of the total dust in the small range, 44 %–52 % in the intermediate range and just 3 %–13 % in the large range of the total insoluble dust flux observed in the cores over the period 1998–2015. For the central cores, T2015-A3 and T2015-A6, the large particle fluxes are just 3 % to 6 % of the total, suggesting that the large particles do not make it to the high central ice cap to the extent that they do the lower-altitude sites.
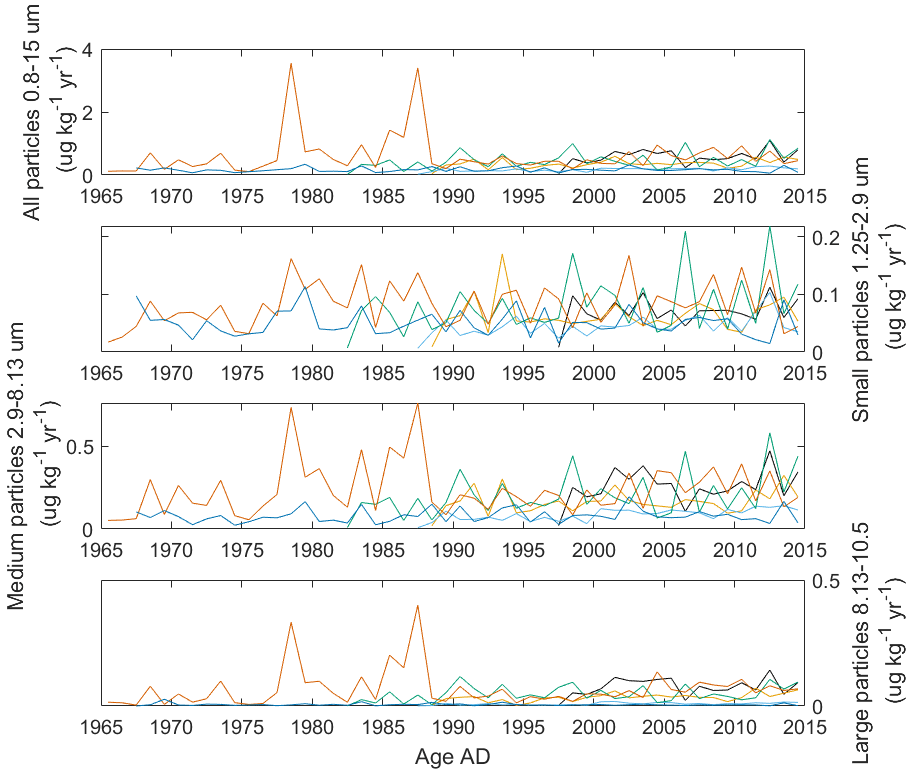
Figure 5Insoluble dust particle fluxes determined from the Abakus instrument using assumptions of perfect spherical particles and a weight of 2400 kg m−3. The following datasets are shown (from top to bottom): total particles (0.8–15 µm), small particles (1.25–2.9 µm), medium particles (2.9–8.13 µm) and large particles (8.13–10.5 µm). The colors reflect the firn cores T2015-A2 (yellow), T2015-A3 (light blue), T2015-A4 (green), T2015-A5 (orange) and T2015-A6 (dark blue).
In the following, we investigate the trend in the dust flux over the period 1998–2015 (Table 2 – right-hand side, Figs. 5, S9). First of all, we note that the record is noisy and that the p values (Table 2) in what we discuss next are high (significant p<0.2). In all cores (except the central core T2015-A6), we observe an increase in the total insoluble dust flux (µg kg−1 w.e.) of 1.1 % to 3.0 % a year (Table S7) since 1998, which is significant (p<0.2) for the cores T2015-A1, T2015-A2 and T2015-A3. Excluding T2015-A6 and T2015-A5, we note that the small particle fluxes increase between 0.9 % and 3.0 % annually, significant only for T2015-A3 (p<0.2). Intermediate dust sizes increase every year by between 1.7 % and 3.4 %, significant only for T2015-A3, and the large bins increase by 0.98 % to 3.96 % annually for T2015-A2 and T2015-A5. This suggests that the increasing trend (in percent) is larger at the intermediate and large particle sizes, which we interpret to reflect an increased activation of local dust in northern Greenland over the period 1998–2015. While we once again emphasize that these results are significantly influenced by accumulation and therefore the dating of the cores, we interpret these changes as an activation of local sources in Greenland or northern Canada, supporting the results found by others.
Table 2Dust fluxes and trends in dust fluxes for the period 1998–2015 for each of the six shallow firn cores. Small (1.25–2.9 µm), intermediate (2.9–8.13 µm) and large (8.13–10.5 µm) refers to the dust sizes as analyzed by the Abakus instrument. The p values are given in parentheses. When these are significant at 2 and p<0.1, they are given in bold and italic, respectively.
In the following we investigate the extreme events (>0.975 quantile) observed in conductivity, acidity and NH after removing a 5-year running median.
6.1 Spatial distribution of recent volcanic events: excess acidity and conductivity
Local acid or conductivity concentration maxima exceeding the background in ice cores are often interpreted as volcanic eruptions and used for constraining ice core ages (Sigl et al., 2016b; Svensson et al., 2008; Vallelonga et al., 2014; Kjær et al., 2016). In addition, such acid markers can be used to determine volcanic climate forcing from volcanic eruptions used in climate modeling (Gao et al., 2008; Robock and Free, 1995). In Fig. 6, extremes in the acidity and conductivity determined by concentrations exceeding 97.5 % quantiles from the 5-year running average based on monthly means of each individual record are shown and interpreted as volcanic horizons. Vertical bars in green, yellow and turquoise show which eruptions were identified in conductivity, acidity or both proxies, respectively, for each of the six firn cores, thus providing an overview of the spatial distribution of specific acid plumes in northern Greenland.
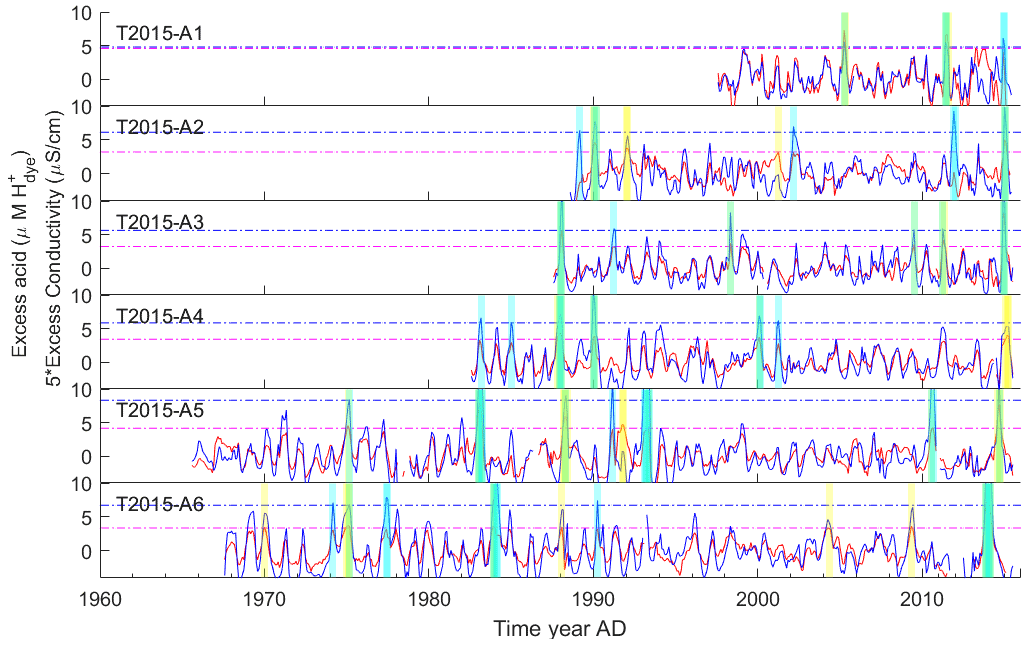
Figure 6Excess acidity (red) and excess conductivity (blue) as compared to a 5-year running average. Note that the conductivity is scaled with a factor of 5. Dashed horizontal lines indicate the 97.5 % quantile for conductivity (light blue), acidity (yellow) or both (green). Vertical bars indicate times exceeding 2 standard deviations for conductivity and acid compared to a 5-year running average in yellow and cyan, respectively; green indicates when these are observed in both. T2015-A1 through T2015-A6 are shown (from top to bottom).
Already from a first look it is evident that not all plumes distribute across the entirety of northern Greenland, corresponding to previous findings that a single core cannot be used if aiming to create a record of volcanism from ice cores (Robock and Free, 1995; Gao et al., 2008). Further, using the conductivity alone can be deceiving if the aim is to determine volcanic horizons. We also emphasize our dating was restricted to use mainly H2O2 and Ca2+, and thus we have not made any volcanic matching between the records as part of the dating. We also note that other markers are more specific to volcanic eruptions than the ones used in this study, e.g., non-sea-salt sulfate or sulfur isotopes (Severi et al., 2012; Sigl et al., 2016a; Mayewski et al., 1990; Lin et al., 2022; Crick et al., 2021).
The eruptions that are observed in more than one of our traverse cores are presented in Table 3. Below we discuss the sources for the individual acidity and conductivity reference horizons in detail.
Bárðarbunga–Holuhraun 2014–2015 (VEI 0), Iceland. From late August 2014 until February 2015 the Bárðarbunga fissure, also known as the Holuhraun eruption, (volcanic eruption index – VEI 0) took place in Iceland. The SO2 emissions are estimated to have been 10.7±3.0 Mt (Gíslason et al., 2015). We observe elevated acidity in all of our firn cores of between 4.3 to 12.1 µM H+, but we note that T2015-A6 is offset compared to the other records due to uncertainty in the depth registration of the top. T2015-A3, T2015-A5 and T2015-A6 show the highest acidity concentrations from the Holuhraun eruption, while T2015-A1, T2015-A2 and T2015-A4 are less pronounced. At the EastGRIP site, previous results from snow pits also evidence the eruption (Du et al., 2019a). The fact that this eruption is found at all six sites, as well as various other northern Greenland sites (Kjær et al., 2021a), suggests that this eruption horizon is deposited in the wider central northern Greenland. This is despite SO2 and SO4 plume trajectories from the eruption, e.g., those modeled by Boichu et al. (2019), not reaching Greenland.
Table 3A list of volcanic eruptions covered in this study, presented as a suggestion of the volcanic sources of the years where excess acidity or excess conductivity as compared to a 5-year running average exceed the 97.5 % quantile in each of the six shallow cores. In addition, other shallow cores with similar excess acid, conductivity or sulfate are shown. Dashes indicate where data are not available. Years in parentheses indicate that (while there is an increase compared to background levels) the data do not exceed the 97.5 % quantile.
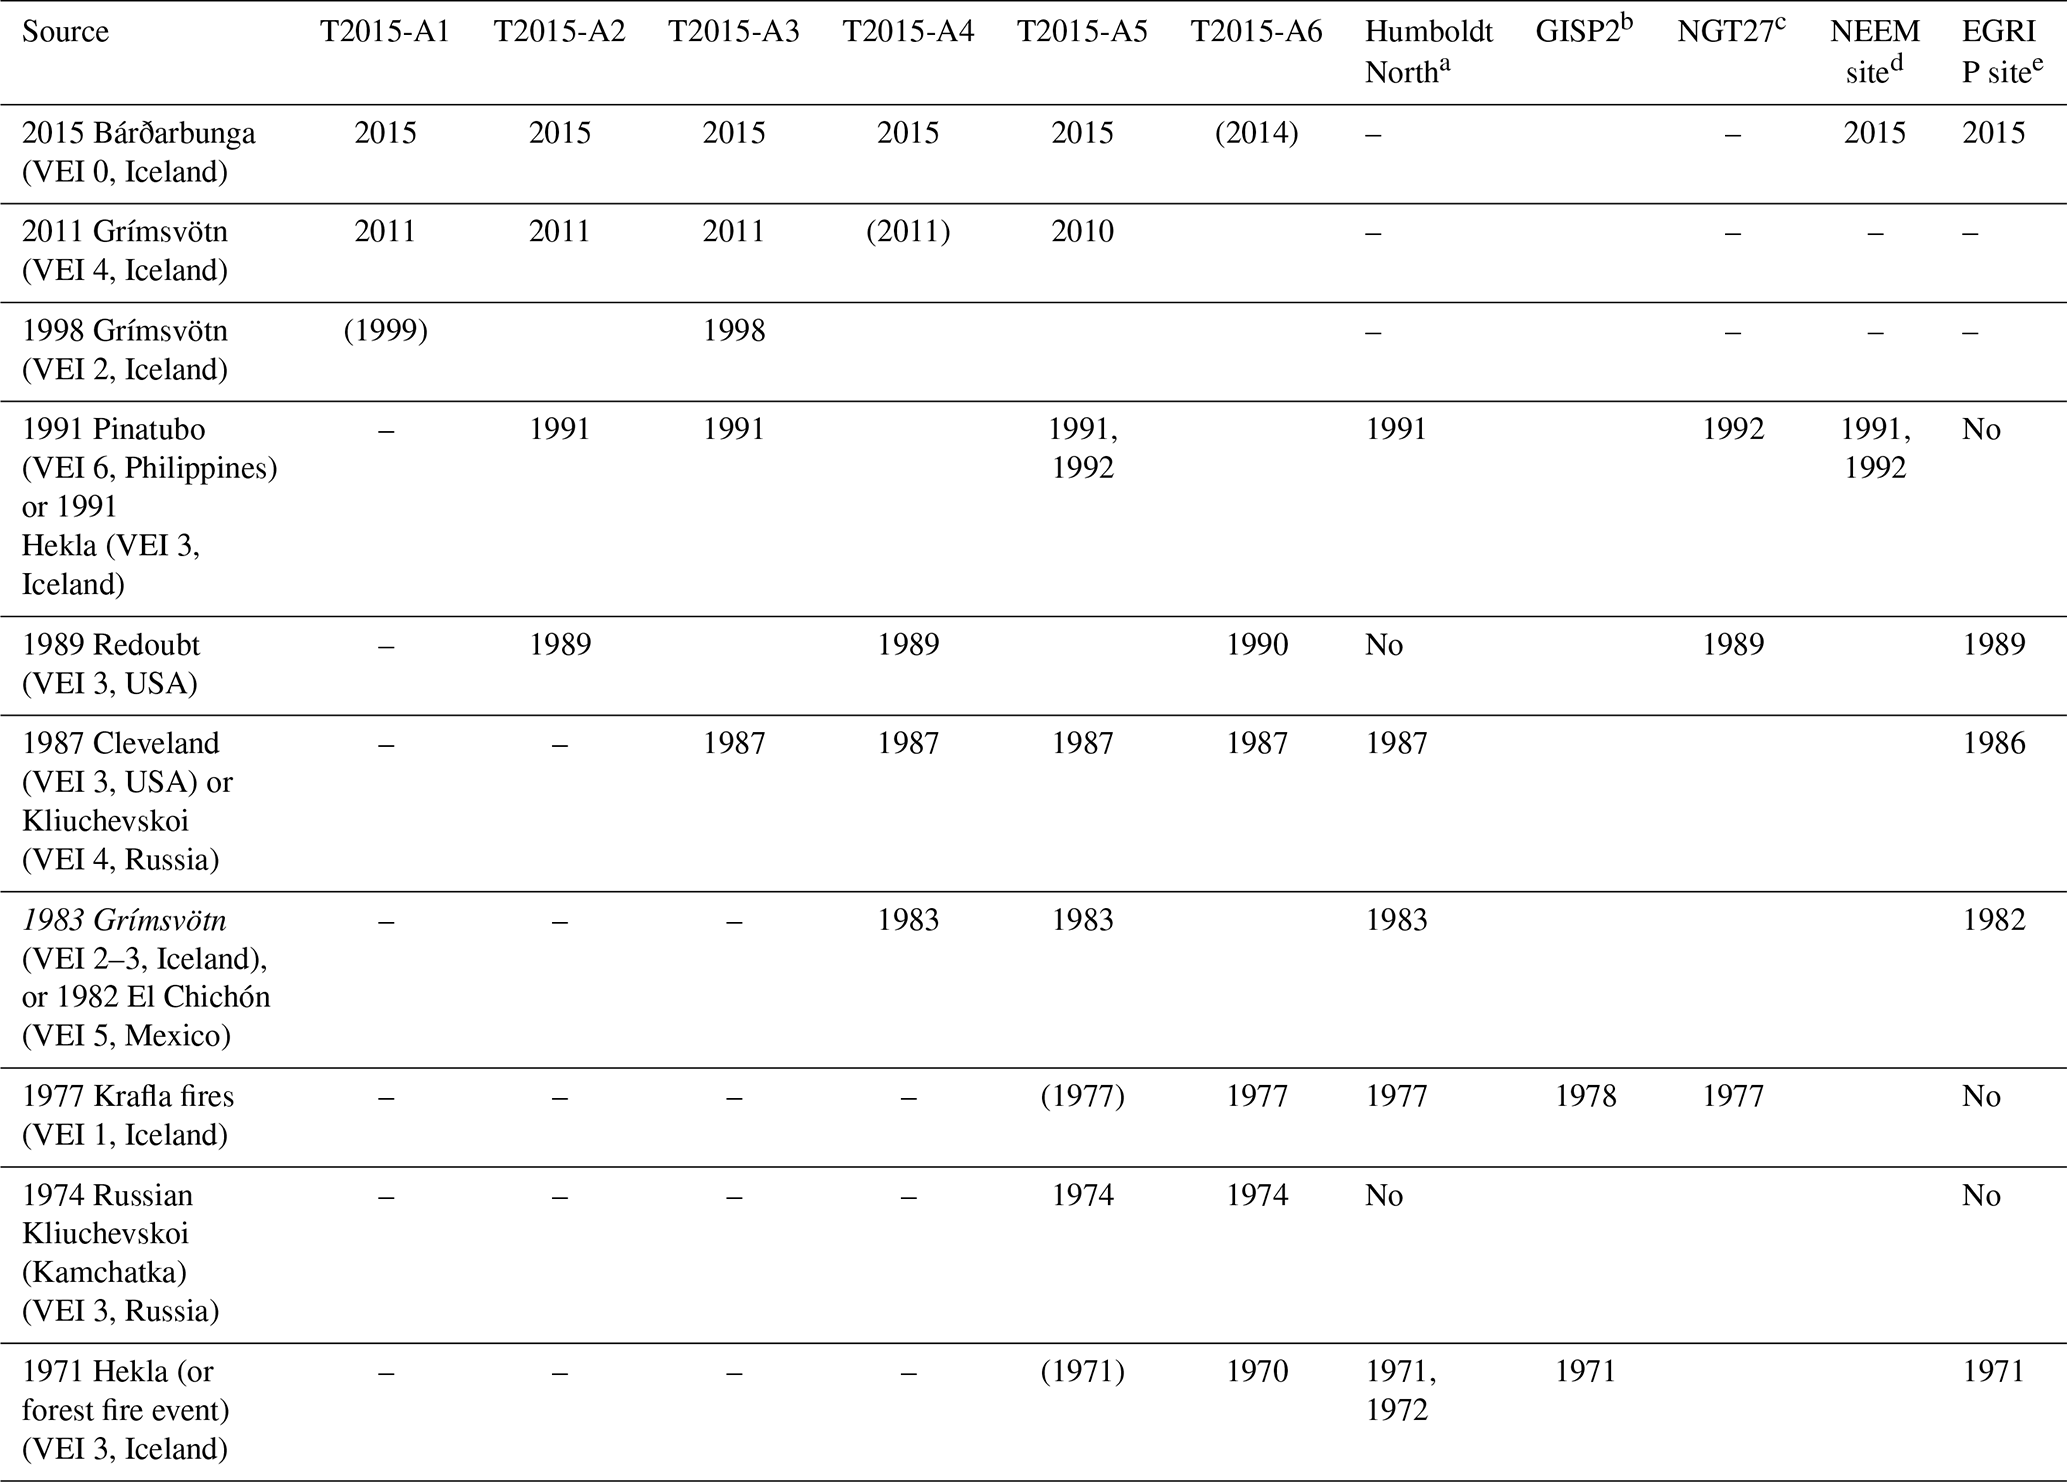
a Pasteris et al. (2012). b Zielinski et al. (1994). c Fischer et al. (1998). d Sigl et al. (2016a), Kjær et al. (2021a). e Du et al. (2019b), Kjær et al. (2016).
Grimsvötn 2011 (VEI 4), Iceland. Another concentration maximum (6.7–8.6 µM) observed through most of the firn cores, except T2015-A6 central Greenland core, is the Grimsvötn 2011 (VEI 4) eruption in Iceland. The eruption took place from 21 to 28 May 2011 (Hreinsdóttir et al., 2014) and had a major societal impact (900 flights were canceled in Europe), despite the fact that the plume of particles stayed mostly local and turned northward. Modeling suggests that the particles traveled mostly eastward, reaching as far as Finland, while the sulfuric acid moved at a higher level northward toward Greenland, where it turned westward crossing over Greenland. The traverse records provide evidence that acid from the Grimsvötn eruption was deposited even further north than was found in the modeled plumes (Moxnes et al., 2014; Kerminen et al., 2011; Petersen et al., 2012).
Eyjafjallajökull 2010 (VEI 4), Iceland. The famous Eyjafjallajökull eruption (VEI 4) between 14 April and 23 May 2010 was not strong enough to enhance the acidity above background variability, except for in T2015-A5. This is expected, as the plume from this eruption had a southeastward track down over Europe (Schumann et al., 2011; Thomas and Prata, 2011), and only after a major turnaround towards the north did the acid reach northwestern Greenland.
Grimsvötn 1998 (VEI 2), Iceland. The 1998 Grimsvötn event extended for 10 d in December with a plume reaching up to 10 km altitude. An increase in background is observed in the firn T2015-A3 in late 1998 and early 1999, suggesting that the plume from the eruption made it to the central northern Greenland.
Pinatubo 1991 (VEI 6), Philippines. The June 1991 Pinatubo event has previously been reported at both the Greenland NEEM site and the Antarctic WAIS site (Sigl et al., 2016b) but is only found in the T2015-A2, T2015-A3 and T2015-A5 cores, which means that its use as a synchronization event between hemispheres might be limited as it does not show in all of our Greenland cores. We also note that Pinatubo was not significantly found in the NEGIS record (Vallelonga et al., 2014; Kjær et al., 2016) close to our T2015-A5 and T2015-A4 records. Further, we recall that a small eruption from the Icelandic Hekla volcano took place in 1991 (0.02 km3 tephra; Thordarson and Larsen, 2007) and suggest it as an alternative source of what is observed in Greenland cores in 1991.
Redoubt 1989 (VEI 3), Alaska, United States. The 1989 Redoubt eruption (VEI 3) in southern central Alaska consisted of more than 20 individual eruption events that began on 14 December 1989 and lasted until late 1990 (Casadevall, 1994; Scott and McGimsey, 1994). During the eruption sulfur dioxide emission rates were between 800 and 6600 t d1, with the highest emissions in March, and tephra plumes are documented to altitudes of 7–10 km (Brantley, 1990; Scott and McGimsey, 1994). We note an imprint in T2015-A2, T2015-A4 and T2015-A6 of what could be the Redoubt eruption, with concentrations of 8.7–10.3 µM H+.
Cleveland 1987 (VEI 3), Alaska, United States. This Aleutian Island eruption took place in late 1987 and lasted for about 2 months, and a signature is distributed through all our records in 1987. However, we note that Cleveland is an active volcano with at least 22 eruptions over the past 230 years and that other VEI 3 eruptions from Cleveland happened in 1994, 2001, 2006, with multiple smaller eruptions in between. We note that in T2015-A2 an event exceeding the 97.5 % quantile is also observed in early 2002. We wonder about the lack of signal in the other firn cores from these large eruptions from Cleveland and speculate that the source in 1987 may not be Cleveland. Other sources of large volcanic eruptions in the period 1986–1987 include Mount Augustine 1986, Alaska (VEI 4), United States, which also erupted in 2005–2006 (VEI 3) and the Russian eruptions of Chikurachki (Kuril Islands) and Kliuchevskoi (Kamchatka) (both in 1986 and both VEI 4).
Grimsvötn 1983 (VEI 2–3), Iceland. In May 1983 a plume of 10 kt SO2 rose up to 8 km from the Grimsvötn volcano, and in all cores covering that period we note a significant excess acidity for that year, again suggesting a central Greenland route. However, this eruption only lasted 2 d. Another explanation for an excess 1983 concentration in Greenland ice occasionally invoked is the spring 1982 VEI 5 El Chichón eruption (Mexico; Palais et al., 1992).
When looking further back in our records, we note that one has to be careful when assigning excess acidity to volcanic events as the period of the 1970s and 1980s is highly influenced by anthropogenic sulfates. Hence, even after removing the mean background signal, spring Arctic haze events can be very high in sulfates and resemble volcanic strata. Regardless, we note the acidity and conductivity maxima that are found between the T2015-A5 and T2015-A6 sites reaching furthest back in time and compare with the nearby NEGIS (Kjær et al., 2016; Vallelonga et al., 2014) and Humboldt North records (Pasteris et al., 2012).
Krafla fires 1975–84 (VEI 1), Iceland. The so-called Krafla fires, which consist of nine individual eruptions, took place in Iceland between 1975 and 1984 (Thordarson and Larsen, 2007). We do not clearly observe the Krafla fires in the records of T2015-A5. However, T2015-A6 shows an excess in late 1977, and we note that four rifting events occurred in October 1976 as part of the Krafla fires, with the last one being in September 1977, which included an explosive event through a geothermal borehole producing 26 m3 of tephra (Thordarson and Larsen, 2007). Similar rifting occurred in the 1980s, but this is not mirrored in our Greenland records. We also note that Kjær et al. (2016) remark upon an increase in the conductivity for the NEGIS core in 1977, as was similarly observed at the Humboldt North site (Pasteris et al., 2012), suggesting that the plume took a route over central northeastern Greenland. The last eruption of the Krafla fires was in September 1984, and it may have contributed to the peak assigned to Grimsvötn above.
Kliuchevskoi (Kamchatka) 1974 (VEI 3), Russia. We observe excess acidity in 1974 for both T2015-A5 and T2015-A6 sites that is also confirmed at the Humboldt North site (Pasteris et al., 2012). We suggest it could be the VEI 3 from the Russian Kliuchevskoi (Kamchatka).
Hekla 1970 (VEI 3), Iceland. The 1970s layer in T2015-A6 we regard as potentially coming from the Hekla 1970 eruption (0.07 tephra per cubic kilometer, 0.03 tephra dense rock equivalent (DRE) per cubic kilometer; Thordarson and Larsen, 2007). A similar event is reflected in T2015-A5, but the event is not large enough to exceed the 97.5 % quantile boundary. However, an increase in conductivity and acidity is noticed in the 1970s in both the NEGIS core close to T2015-A5 and the Humboldt North core (Pasteris et al., 2012; Kjær et al., 2016; Vallelonga et al., 2014).
In conclusion, we detect several recent horizons that can be attributed mainly to Icelandic volcanoes, but we note that many years have a corresponding large (> VEI 3) eruption in the regions of the Bering Sea (Russian and Canadian Arctic), and hence the direct assigning of specific volcanoes is not straightforward when based solely on the excess acidity or conductivity. Some of the significant acidity and conductivity horizons observed across the six traverse cores are also seen in Humboldt North and NEGIS ice cores (Kjær et al., 2016; Pasteris et al., 2012; Vallelonga et al., 2014). We note that the modeled plumes for recent eruptions often do not reach the sites in which we find the acidity deposited and suggest that dispersion models of long-distance transport could be improved.
6.2 Canadian burned land area observed in extreme NH events
The number and extent of fires through time of both natural and anthropogenic origin have varied, and several fire index records exist. Extremes of NH in ice cores have been used as a proxy for North American forest fires (Legrand et al., 1992; Zennaro et al., 2014; Fuhrer et al., 1996), while the background NH is related to biogenic emissions from soil and vegetation and therefore temperature on a longer timescale. Other commonly used fire proxies in ice cores include formate, which is found to correlate well with excess NH (Legrand et al., 1995; Savarino and Legrand, 1998), levoglucosan, which is specific to biomass burning events, black carbon, which is also subject to other anthropogenic sources (Zennaro et al., 2014; Segato et al., 2021), dehydroabietic acid (Parvin et al., 2019) and vanillic acid (Grieman et al., 2018a; Kawamura et al., 2012; Grieman et al., 2018b). The amount of fires as determined in ice cores has been found to vary over time, with an increase in the mid-1600s (Zennaro et al., 2014), and it is speculated that current climate change and anthropogenic activity could enhance fires.
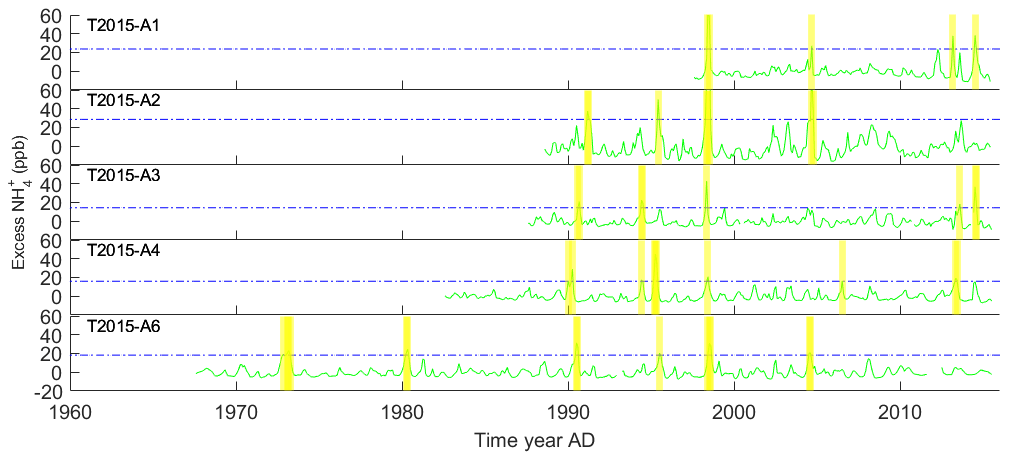
Figure 7Excess NH (green) as compared to a 5-year running average. Vertical bars (yellow) indicate times exceeding the 97.5 % quantile (horizontal blue dashed). T2015-A1 through T2015-A6 are shown from top to bottom; note that T2015-A5 was not analyzed for NH.
Here we assess excess NH (exceeding 97.5 %) as a proxy for forest fires in the five traverse cores and compare them with fire records from other recent ice cores (Parvin et al., 2019; Zennaro et al., 2014; Gfeller et al., 2014; Legrand et al., 2016; Pokhrel et al., 2020). We use NH excess as a proxy for forest fires; however, bear in mind that NH extremes were found to only replicate 8 out of 14 levoglucosan peaks at the NEEM site (Zennaro et al., 2014). Furthermore, for the NEEM site, Gfeller et al. (2014) observed that, as a result of wind reworking, a single core that is close to five other cores only captures 70 % to 80 % of the interannual variability of the reconstructed NH atmospheric aerosol load.
We start out by noting that the excess NH values (after removing the 5-year running average, Fig. 7) from the individual traverse records correlate well (Pearson correlation R>0.4, p>0.01, Table S5) with each other in the central and western areas. West of the ice divide (T2015-A1, T2015-A2 and T2015-A3), annual correlations are as high as R=0.82 (between T2015-A1 and T2015-A3), while correlations between the western core T2015-A4 and the T2015-A6 central core are lower. We continue to make a combined fire proxy record for the five cores by normalizing the annual excess value for each of the records and taking the mean of the cores covering the years in question. We observe that the combined fire proxy record (Fig. 8) correlates with the Canadian National Forestry Database records of forest burned area (Parisien et al., 2012; Canadian Forest Service, 2013) by R=0.49 () from 1987 onwards and by R=0.48 (p=0.009) for the period 1959–2015. This suggests that the combined traverse record of excess NH is a fair proxy of burned area in Canada (Fig. 8). Omitting T2015-A4, the only eastern core, we find that the central and western areas correlate with the Canadian forest fire record by 0.45 (p=0.001, 1987 onwards), suggesting that even adding only the eastern records improves the fire proxy.
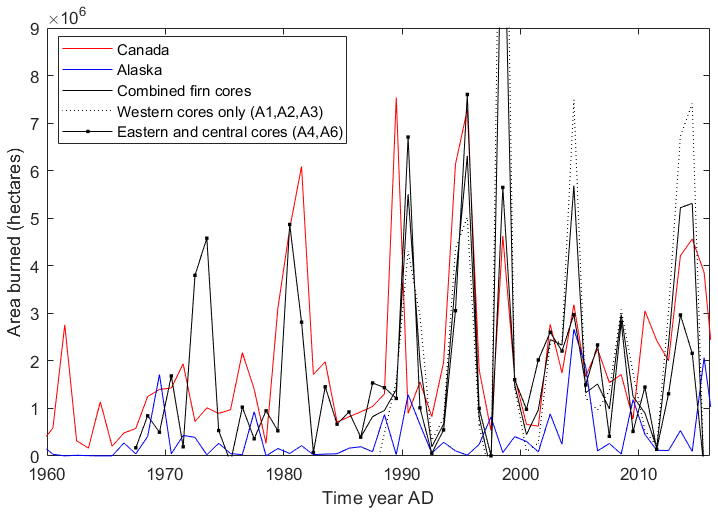
Figure 8Forest fire composite (solid black line showing all records, dashed black line showing only western cores, and dots showing only eastern cores) compared to Canadian (in red; Parisien et al., 2012; Canadian Forest Service, 2013) and Alaskan (in blue) forest fire indexes (AICC, 2021; Legrand et al., 2016).
Below we discuss the individual years of high NH concentrations in comparison with other ice core records starting from the oldest extreme NH layers and speculate on sources based on the Alaskan (AICC, 2021) and Canadian fire indexes (Canadian Forest Service, 2013). In Table 4, the years that contain extreme NH are presented in the six firn cores investigated here, as well as other fire tracers from other ice cores, together with the suggested source (>97.5 % of each full record).
Russia 1972. Russian fires resulting from droughts in 1972 are likely the source for the extreme NH in 1973 (T2015-A6). Such an extreme was also observed in the Kamchatka ice core (1972) and NEEM ice cores (1973), but not in southern D4 or central Summit cores (Zennaro et al., 2014; Kawamura et al., 2012; Legrand et al., 2016).
Canada 1980 (> 4.5 Mha) and 1981 (> 6 Mha). The 1980–1981 events have previously been observed in the NH record around NEEM (S1 and the main core) and in the Tunu vanillic acid record in northern Greenland (Grieman et al., 2018b; Gfeller et al., 2014). The signal is also seen in our core T2015-A6 close to the ice divide, showing that the signal of the Canadian fires in 1980 (>4.5 Mha) and 1981 (>6 Mha) is widespread in northern Greenland but not in the wider Greenland area as it is unnoticed in the D4 and central Summit cores (Legrand et al., 2016).
Three events in Canada in the 1990s (> 4.5 Mha). The pattern of three extreme NH events between 1989 and 2000 is observed in all records covering the period (T2015-A2, T2015-A3, T2015-A4, T2015-A5, T2015-A6). The same pattern was found in the SE-Dome core (dehydroabietic acid and low levoglucosan) and at the NEEM site provided that the dating uncertainty of ±1 year is taken into account (Gfeller et al., 2014). In addition, the extreme in 1994 was also detected at Summit station with an increase in NH and formate (Legrand et al., 2016), meaning that the 1994 signal covered all of Greenland (Parvin et al., 2019), while the 1990 NH layer did not. In the Canadian burned area record, the 1989 (>7.5 Mha), 1994 and 1995 (both >6 Mha), and 1998 (4.5 Mha) events are significant, making Canadian fires the likely source areas for the events observed widely in Greenland in the 1990s.
Table 4Forest fires. The years where high excess ammonium has been observed exceeding the 97.5 % quantile in the six firn cores is noted, together with observations from additional firn and snow cores and suggested sources. Dashes indicate that data are not available for the year in question, while “no” indicates that a fire is not seen in that year in a record.
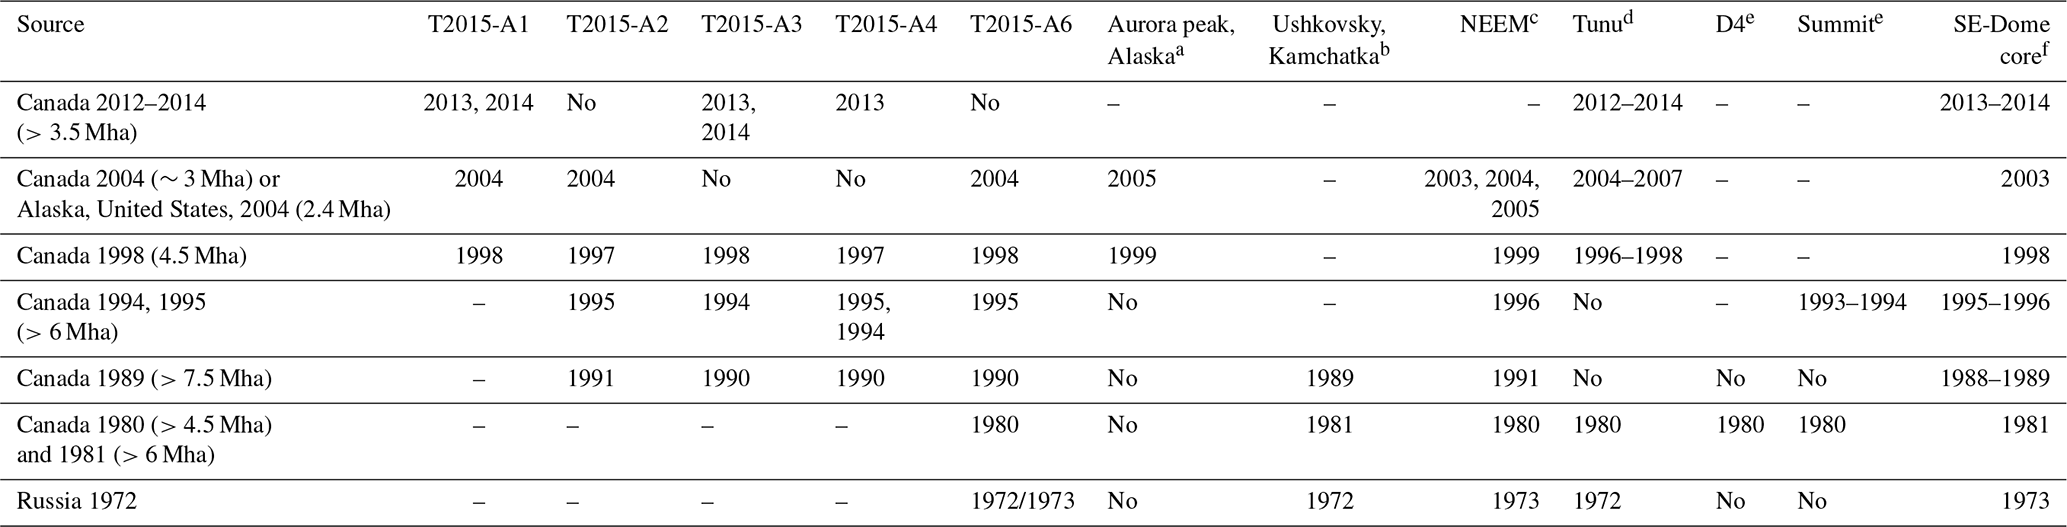
a Levoglucosan (Pokhrel et al., 2020). b Kawamura et al. (2012). c NH, levoglucosan and black carbon (Gfeller et al., 2014; Zennaro et al., 2014). d Levoglucosan or vanillic acid (Grieman et al., 2018b). e NH (Legrand et al., 2016).
f Levoglucosan and dehydroabietic acid (Parvin et al., 2019).
Canada 2004 (∼ 3 Mha). The 2004 event is less significant in the Canadian burned area record (∼3 Mha), but we note that the Alaskan Taylor Complex (2.4 Mha) fire, which is the largest in Alaskan records since 1940, might also add to the signal observed in central northern Greenland (T2015-A1, T2015-A2 and T2015-A6). In 2005, elevated levoglucosan was also found in an Alaskan ice core (Pokhrel et al., 2020), and NH has previously been found in firn cores from NEEM (Gfeller et al., 2014). In the SE-dome ice core, the dehydroabietic acid concentration is elevated above background, suggesting that the 2004 and 2005 fire deposition is widely spread over Greenland, despite it not being present in all the firn cores.
Canada 2012, 2013 and 2014 (∼ 4 Mha). In 2013, 2014 and 2015, the Canadian record of burned area was about ∼4 Mha annually. Thus, Canadian forest fires are a candidate for the three elevated NH events at T2015-A1 (NEEM site), as also observed in 2013 and 2014 at the T2015-A3 and T2015-A4 sites. Elevated concentrations of fire tracers (levoglucosan and dehydroabietic acid) are also identified at the SE-Dome ice core in southeastern Greenland in the same years, suggesting the signal is dispersed across Greenland (Parvin et al., 2019).
In conclusion, we determine several extremes (>97.5 %) in the record of NH of our six traverse cores after detrending using a 5-year average (Fig. 7, Table 4). However, not all NH extremes are observed in each record. The extreme NH concentrations that exist through the six firn records are also found in other ice core records from Greenland (NEEM, SE-dome or Summit sites), suggesting that they are fires that are substantial enough to impact a large part of the Northern Hemisphere and could be used to constrain ages in Greenland shallow cores. Furthermore, we determine a good correlation between our records and Canadian fire records (R=0.44, , Fig. 8), suggesting that longer records of NH from northern Greenland, such as those from the NEEM and EastGRIP sites, can be used as a proxy for Canadian forest fires in recent times.
Limited sources are available relating to the chemical impurities deposited to the northern part of the Greenland ice sheet in recent times (e.g., Gfeller et al., 2014; Hawley et al., 2014; Vallelonga et al., 2014; Kjær et al., 2021a). We add six additional chemical proxy profiles to the large northern Greenland interior at a resolution that resolves seasonal signals with the added benefit that they are all retrieved and analyzed by the same setup. The cores T2015-A2, T2015-A3 and T2015-A6 offer a first view of the total amounts and seasonal cycles of impurities deposited to their specific central northern Greenland locations. The core T2015-A1 adds and updates the array of cores previously drilled at the NEEM site, while T2015-A4 and T2015-A5 update the NEGIS core previously drilled close by at the East Greenland Ice Stream.
We determine spatial gradients in conductivity and H2O2 concentration related to accumulation, while for dust (insoluble and Ca2+) and NH we do not observe significant changes in concentration between sites.
We discern similar seasonal cycles as those previously reported by others in northern Greenland, but we find that our formal month definition defined mainly by H2O2 summer peaks shifts the peak deposition by up to 2 months compared to what has been found by others that define summer using a mixture of proxies. We attribute this in part to the accumulation being unevenly distributed throughout the year. We highlight the importance of using similar methods for constraining and dividing the year into months when aiming to investigate changes in seasonality between different ice core sites.
We remark upon temporal trends in the acidity and conductivity profiles related to the anthropogenic contamination of the atmosphere in the 1970s. In the dust fluxes we observe an increase over time, especially for the large (8.15–10 µm) and intermediate particles (2.19–8.15 µm), which could be associated with the downward trend in accumulation for the period 2000–2010 (Kjær et al., 2021b) or interpreted as a sign of increased local dust in the period, as found previously by Nagatsuka et al. (2021) in the northwest, Amino et al. (2020) at a southern coastal site, and by Bullard and Mockford (2018) at the western coast of Greenland. However, we note that the dust flux data and conclusions on trends remain impacted by uncertainties associated with the timescale. Despite this, our inland ice core records add to the growing evidence of a recent increase in local dust transportation in Greenland.
By stacking the normalized NH excess records from northern Greenland, we find a good correlation with Canadian forest fires (0.49), suggesting they can be used as a proxy for Canadian forest fires specifically (more so than the individual records of NH). We also observe several recent volcanic eruptions shown in the cores as layers in the detrended acidity and conductivity exceeding 97.5 %. We suggest Icelandic sources for most examples, but we note that volcanic activity in the Barents Sea region could be a source for some variations. Some of the assigned volcanic horizons and forest fire ammonium signals have deposition signals that cover the northern Greenland interior and can be used to temporally constrain future firn and ice records and may also be useful for radar tracking of recent accumulation.
Despite each of the six firn records being analyzed by similar means, the spatial variation for some proxies (Ca2+, insoluble dust and NH) is overwhelmed by the annual signal and additional noise from surface topography and deposition or the analytical noise in the CFA system, and as a result the correlation between sites is generally not high. It is clear that more extensive investigations are essential to reduce spatial uncertainty, cancel out site-specific variations and improve the representativeness of isolated locations. The two records taken close to each other at the East Greenland Ice Stream (T2015-A4 and T2015-A5) highlight that comparing younger records with older records from similar sites to interpret temporal changes should be done with care, as even cores close to each other can look quite different in chemical composition for overlapping time periods. This study further highlights that the use of additional cores from each site is needed to better constrain depositional and analytical noise.
The datasets from the six firn cores (T2015-A1 to T2015-A6) will be made available at https://www.pangaea.de/ (last access: 12 September 2022) upon publication.
The supplement related to this article is available online at: https://doi.org/10.5194/cp-18-2211-2022-supplement.
HAK and PV collected the samples during the 2015 field season. HAK, PZ, PV, KHL, AS and SB analyzed the firn cores by means of CFA. HAK and PZ did the annual layer counting and further interpreted the chemistry data. All authors contributed to the writing of the paper.
The contact author has declared that none of the authors has any competing interests.
Publisher's note: Copernicus Publications remains neutral with regard to jurisdictional claims in published maps and institutional affiliations.
The research leading to these results has received funding from the European Research Council under the European Community's Seventh Framework Programme (FP7/2007-2013) ERC grant agreement 610055 as part of the ice2ice project. This project has received funding from the European Union's Horizon 2020 research and innovation programme under grant agreement no. 820970 as part of the TiPES project.
We acknowledge the EGRIP and NEEM ice core drilling projects. EGRIP is directed and organized by the Centre for Ice and Climate at the Niels Bohr Institute, University of Copenhagen. It is supported by funding agencies and institutions in Denmark (A. P. Møller Foundation, University of Copenhagen), United States (US National Science Foundation, Office of Polar Programs), Germany (Alfred Wegener Institute, Helmholtz Centre for Polar and Marine Research), Japan (National Institute of Polar Research and Arctic Challenge for Sustainability), Norway (University of Bergen and Trond Mohn Foundation), Switzerland (Swiss National Science Foundation), France (French Polar Institute Paul-Emile Victor, Institute for Geosciences and Environmental research), Canada (University of Manitoba) and China (Chinese Academy of Sciences and Beijing Normal University). NEEM is directed and organized by the Center of Ice and Climate at the Niels Bohr Institute and US NSF, Office of Polar Programs. It is supported by funding agencies and institutions in Belgium (FNRS-CFB and FWO), Canada (NRCan/GSC), China (CAS), Denmark (FIST), France (IPEV, CNRS/INSU, CEA and ANR), Germany (AWI), Iceland (RannIs), Japan (NIPR), Korea (KOPRI), The Netherlands (NWO/ALW), Sweden (VR), Switzerland (SNF), United Kingdom (NERC) and United States (US NSF, Office of Polar Programs).
Finally, we would like to acknowledge the reviewers for their great suggestions that improved the final version of the paper.
This research has been supported by the European Research Council's FP7 Ideas (ice2ice, grant no. 610055) and the H2020 programme (TiPES, grant no. 820970).
This paper was edited by Elizabeth Thomas and reviewed by two anonymous referees.
AICC (Alaska Interagency Coordination Center): Predictive Services – Intelligence/Reports, AICC [data set], https://fire.ak.blm.gov/predsvcs/intel.php, last access: 23 June 2021.
Amino, T., Iizuka, Y., Matoba, S., Shimada, R., Oshima, N., Suzuki, T., Ando, T., Aoki, T., and Fujita, K.: Increasing dust emission from ice free terrain in southeastern Greenland since 2000, Polar Sci., 27, 100599, https://doi.org/10.1016/j.polar.2020.100599, 2020.
Bamber, J.: Greenland 5 km DEM, Ice Thickness, and Bedrock Elevation Grids, Version 1, NASA National Snow and Ice Data Center [data set], Boulder, Colorado USA, https://doi.org/10.5067/01A10Z9BM7KP, 2001.
Bigler, M., Svensson, A., Kettner, E., Vallelonga, P., Nielsen, M. E., and Steffensen, J. P.: Optimization of High-Resolution Continuous Flow Analysis for Transient Climate Signals in Ice Cores, Environ. Sci. Technol., 45, 4483–4489, https://doi.org/10.1021/es200118j, 2011.
Boichu, M., Favez, O., Riffault, V., Petit, J.-E., Zhang, Y., Brogniez, C., Sciare, J., Chiapello, I., Clarisse, L., Zhang, S., Pujol-Söhne, N., Tison, E., Delbarre, H., and Goloub, P.: Large-scale particulate air pollution and chemical fingerprint of volcanic sulfate aerosols from the 2014–2015 Holuhraun flood lava eruption of Bárðarbunga volcano (Iceland), Atmos. Chem. Phys., 19, 14253–14287, https://doi.org/10.5194/acp-19-14253-2019, 2019.
Brantley, S. R.: The eruption of Redoubt Volcano, Alaska, December 14, 1989–August 31, 1990, U.S. G.P.O. ; Books and Open- File Reports Section, U.S. Geological Survey, https://doi.org/10.3133/cir1061, 1990.
Breton, D. J., Koffman, B. G., Kurbatov, A. V., Kreutz, K. J., and Hamilton, G. S.: Quantifying Signal Dispersion in a Hybrid Ice Core Melting System, Environ. Sci. Technol., 46, 11922–11928, https://doi.org/10.1021/es302041k, 2012.
Bullard, J. E. and Mockford, T.: Seasonal and decadal variability of dust observations in the Kangerlussuaq area, west Greenland, Arct. Antarct. Alp. Res., 50, S100011, https://doi.org/10.1080/15230430.2017.1415854, 2018.
Canadian Forest Service: Canadian National Fire Database (CNFDB) – Agency Fire Data, Natural Resources Canada, Canadian Forest Service, Northern Forestry Centre [data set], Edmonton, Alberta, https://cwfis.cfs.nrcan.gc.ca/ha/nfdb (last access: 22 June 2022), 2013.
Casadevall, T. J.: The 1989–1990 eruption of Redoubt Volcano, Alaska: impacts on aircraft operations, J. Volcanol. Geoth. Res., 62, 301–316, https://doi.org/10.1016/0377-0273(94)90038-8, 1994.
Crick, L., Burke, A., Hutchison, W., Kohno, M., Moore, K. A., Savarino, J., Doyle, E. A., Mahony, S., Kipfstuhl, S., Rae, J. W. B., Steele, R. C. J., Sparks, R. S. J., and Wolff, E. W.: New insights into the ∼74 ka Toba eruption from sulfur isotopes of polar ice cores, Clim. Past, 17, 2119–2137, https://doi.org/10.5194/cp-17-2119-2021, 2021.
Dallmayr, R., Goto-Azuma, K., Kjær, H. A., Azuma, N., Takata, M., Schüpbach, S., and Hirabayashi, M.: A High-Resolution Continuous Flow Analysis System for Polar Ice Cores, Bulletin of Glaciological Research, 34, 11–20, https://doi.org/10.5331/bgr.16R03, 2016.
Dansgaard, W.: Stable isotopes in precipitation, Tellus, 16, 436–468, https://doi.org/10.3402/tellusa.v16i4.8993, 1964.
Du, Z., Xiao, C., Zhang, Q., Li, C., Wang, F., Liu, K., and Ma, X.: Climatic and environmental signals recorded in the EGRIP snowpit, Greenland, Environ. Earth Sci., 78, 170, https://doi.org/10.1007/s12665-019-8177-4, 2019a.
Du, Z., Xiao, C., Zhang, Q., Handley, M. J., Mayewski, P. A., and Li, C.: Relationship between the 2014–2015 Holuhraun eruption and the iron record in the East GRIP snow pit, Arct. Antarct. Alp. Res., 51, 290–298, https://doi.org/10.1080/15230430.2019.1634441, 2019b.
Erhardt, T., Bigler, M., Federer, U., Gfeller, G., Leuenberger, D., Stowasser, O., Röthlisberger, R., Schüpbach, S., Ruth, U., Twarloh, B., Wegner, A., Goto-Azuma, K., Kuramoto, T., Kjær, H. A., Vallelonga, P. T., Siggaard-Andersen, M.-L., Hansson, M. E., Benton, A. K., Fleet, L. G., Mulvaney, R., Thomas, E. R., Abram, N., Stocker, T. F., and Fischer, H.: High-resolution aerosol concentration data from the Greenland NorthGRIP and NEEM deep ice cores, Earth Syst. Sci. Data, 14, 1215–1231, https://doi.org/10.5194/essd-14-1215-2022, 2022.
Fischer, H., Wagenbach, D., and Kipfstuhl, J.: Sulfate and nitrate firn concentrations on the Greenland ice sheet: 2. Temporal anthropogenic deposition changes, J. Geophys. Res.-Atmos., 103, 21935–21942, https://doi.org/10.1029/98JD01886, 1998.
Fischer, H., Siggaard-Andersen, M.-L., Ruth, U., Röthlisberger, R., and Wolff, E.: Glacial/interglacial changes in mineral dust and sea-salt records in polar ice cores: Sources, transport, and deposition, Rev. Geophys., 45, RG1002, https://doi.org/10.1029/2005RG000192, 2007.
Frey, M. M., Bales, R. C., and McConnell, J. R.: Climate sensitivity of the century-scale hydrogen peroxide (H2O2) record preserved in 23 ice cores from West Antarctica, J. Geophys. Res., 111, D21301, https://doi.org/10.1029/2005JD006816, 2006.
Fuhrer, K., Neftel, A., Anklin, M., Staffelbach, T., and Legrand, M.: High-resolution ammonium ice core record covering a complete glacial-interglacial cycle, J. Geophys. Res., 101, 4147–4164, https://doi.org/10.1029/95JD02903, 1996.
Gao, C., Robock, A., and Ammann, C.: Volcanic forcing of climate over the past 1500 years: An improved ice core-based index for climate models, J. Geophys. Res., 113, D23111, https://doi.org/10.1029/2008JD010239, 2008.
Gfeller, G., Fischer, H., Bigler, M., Schüpbach, S., Leuenberger, D., and Mini, O.: Representativeness and seasonality of major ion records derived from NEEM firn cores, The Cryosphere, 8, 1855–1870, https://doi.org/10.5194/tc-8-1855-2014, 2014.
Gíslason, S. R., Stefánsdóttir, G., Pfeffer, M. A., Barsotti, S., Jóhannsson, Th., Galeczka, I., Bali, E., Sigmarsson, O., Stefánsson, A., Keller, N. S., Sigurdsson, Á., Bergsson, B., Galle, B., Jacobo, V. C., Arellano, S., Aiuppa, A., Jónasdóttir, E. B., Eiríksdóttir, E. S., Jakobsson, S., Guðfinnsson, G. H., Halldórsson, S. A., Gunnarsson, H., Haddadi, B., Jónsdóttir, I., Thordarson, Th., Riishuus, M., Högnadóttir, Th., Dürig, T., Pedersen, G. B. M., Höskuldsson, Á., and Gudmundsson, M. T.: Environmental pressure from the 2014–15 eruption of Bárðarbunga volcano, Iceland, Geochemical Perspectives Letters, 1, 84–93, https://doi.org/10.7185/geochemlet.1509, 2015.
Grieman, M. M., Aydin, M., Isaksson, E., Schwikowski, M., and Saltzman, E. S.: Aromatic acids in an Arctic ice core from Svalbard: a proxy record of biomass burning, Clim. Past, 14, 637–651, https://doi.org/10.5194/cp-14-637-2018, 2018a.
Grieman, M. M., Aydin, M., McConnell, J. R., and Saltzman, E. S.: Burning-derived vanillic acid in an Arctic ice core from Tunu, northeastern Greenland, Clim. Past, 14, 1625–1637, https://doi.org/10.5194/cp-14-1625-2018, 2018b.
Hawley, R. L., Courville, Z. R., Kehrl, L. M., Lutz, E. R., Osterberg, E. C., Overly, T. B., and Wong, G. J.: Recent accumulation variability in northwest Greenland from ground-penetrating radar and shallow cores along the Greenland Inland Traverse, J. Glaciol., 60, 375–382, https://doi.org/10.3189/2014JoG13J141, 2014.
Hreinsdóttir, S., Sigmundsson, F., Roberts, M. J., Björnsson, H., Grapenthin, R., Arason, P., Árnadóttir, T., Hólmjárn, J., Geirsson, H., Bennett, R. A., Gudmundsson, M. T., Oddsson, B., Ófeigsson, B. G., Villemin, T., Jónsson, T., Sturkell, E., Höskuldsson, Á., Larsen, G., Thordarson, T., and Óladóttir, B. A.: Volcanic plume height correlated with magma-pressure change at Grímsvötn Volcano, Iceland, Nat. Geosci., 7, 214–218, https://doi.org/10.1038/ngeo2044, 2014.
Johnsen, S. J., Dansgaard, W., and White, J. W. C.: The origin of Arctic precipitation under present and glacial conditions, Tellus B, 41, 452–468, https://doi.org/10.3402/tellusb.v41i4.15100, 1989.
Kang, J.-H., Hwang, H., Hong, S. B., Hur, S. D., Choi, S.-D., Lee, J., and Hong, S.: Mineral dust and major ion concentrations in snowpit samples from the NEEM site, Greenland, Atmos. Environ., 120, 137–143, https://doi.org/10.1016/j.atmosenv.2015.08.062, 2015.
Karlsson, N. B., Razik, S., Hörhold, M., Winter, A., Steinhage, D., Binder, T., and Eisen, O.: Surface accumulation in Northern Central Greenland during the last 300 years, Ann. Glaciol., 61, 214–224, https://doi.org/10.1017/aog.2020.30, 2020.
Kaufmann, P. R., Federer, U., Hutterli, M. A., Bigler, M., Schüpbach, S., Ruth, U., Schmitt, J., and Stocker, T. F.: An Improved Continuous Flow Analysis System for High-Resolution Field Measurements on Ice Cores, Environ. Sci. Technol., 42, 8044–8050, https://doi.org/10.1021/es8007722, 2008.
Kawamura, K., Izawa, Y., Mochida, M., and Shiraiwa, T.: Ice core records of biomass burning tracers (levoglucosan and dehydroabietic, vanillic and p-hydroxybenzoic acids) and total organic carbon for past 300 years in the Kamchatka Peninsula, Northeast Asia, Geochim. Cosmochim. Ac., 99, 317–329, https://doi.org/10.1016/j.gca.2012.08.006, 2012.
Kerminen, V.-M., Niemi, J. V., Timonen, H., Aurela, M., Frey, A., Carbone, S., Saarikoski, S., Teinilä, K., Hakkarainen, J., Tamminen, J., Vira, J., Prank, M., Sofiev, M., and Hillamo, R.: Characterization of a volcanic ash episode in southern Finland caused by the Grimsvötn eruption in Iceland in May 2011, Atmos. Chem. Phys., 11, 12227–12239, https://doi.org/10.5194/acp-11-12227-2011, 2011.
Kjær, H. A., Vallelonga, P., Svensson, A., Kristensen, M. E. L., Tibuleac, C., and Bigler, M.: Continuous Flow Analysis Method for Determination of Dissolved Reactive Phosphorus in Ice Cores, Environ. Sci. Technol., 47, 12325–12332, https://doi.org/10.1021/es402274z, 2013.
Kjær, H. A., Vallelonga, P., Svensson, A., Elleskov L. Kristensen, M., Tibuleac, C., Winstrup, M., and Kipfstuhl, S.: An Optical Dye Method for Continuous Determination of Acidity in Ice Cores, Environ. Sci. Technol., 50, 10485–10493, https://doi.org/10.1021/acs.est.6b00026, 2016.
Kjær, H. A., Lolk Hauge, L., Simonsen, M., Yoldi, Z., Koldtoft, I., Hörhold, M., Freitag, J., Kipfstuhl, S., Svensson, A., and Vallelonga, P.: A portable lightweight in situ analysis (LISA) box for ice and snow analysis, The Cryosphere, 15, 3719–3730, https://doi.org/10.5194/tc-15-3719-2021, 2021a.
Kjær, H. A., Zens, P., Edwards, R., Olesen, M., Mottram, R., Lewis, G., Terkelsen Holme, C., Black, S., Holst Lund, K., Schmidt, M., Dahl-Jensen, D., Vinther, B., Svensson, A., Karlsson, N., Box, J. E., Kipfstuhl, S., and Vallelonga, P.: Recent North Greenland temperature warming and accumulation, The Cryosphere Discuss. [preprint], https://doi.org/10.5194/tc-2020-337, 2021b.
Kuramoto, T., Goto-Azuma, K., Hirabayashi, M., Miyake, T., Motoyama, H., Dahl-Jensen, D., and Steffensen, J. P.: Seasonal variations of snow chemistry at NEEM, Greenland, Ann. Glaciol., 52, 193–200, https://doi.org/10.3189/172756411797252365, 2011.
Laepple, T., Hörhold, M., Münch, T., Freitag, J., Wegner, A., and Kipfstuhl, S.: Layering of surface snow and firn at Kohnen Station, Antarctica: Noise or seasonal signal?, J. Geophys. Res.-Earth, 121, 1849–1860, https://doi.org/10.1002/2016JF003919, 2016.
Legrand, M., Angelis, M. D., Staffelbach, T., Neftel, A., and Stauffer, B.: Large perturbations of ammonium and organic acids content in the summit-Greenland Ice Core. Fingerprint from forest fires?, Geophys. Res. Lett., 19, 473–475, https://doi.org/10.1029/91GL03121, 1992.
Legrand, M., de Angelis, M., Cachier, H., and Gaudichet, A.: Boreal Biomass Burning Over the Last 80 Years Recorded in a Summit-Greenland Ice Core, in: Ice Core Studies of Global Biogeochemical Cycles, edited by: Delmas, R. J., Springer, Berlin, Heidelberg, 347–360, https://doi.org/10.1007/978-3-642-51172-1_18, 1995.
Legrand, M., McConnell, J., Fischer, H., Wolff, E. W., Preunkert, S., Arienzo, M., Chellman, N., Leuenberger, D., Maselli, O., Place, P., Sigl, M., Schüpbach, S., and Flannigan, M.: Boreal fire records in Northern Hemisphere ice cores: a review, Clim. Past, 12, 2033–2059, https://doi.org/10.5194/cp-12-2033-2016, 2016.
Lin, J., Svensson, A., Hvidberg, C. S., Lohmann, J., Kristiansen, S., Dahl-Jensen, D., Steffensen, J. P., Rasmussen, S. O., Cook, E., Kjær, H. A., Vinther, B. M., Fischer, H., Stocker, T., Sigl, M., Bigler, M., Severi, M., Traversi, R., and Mulvaney, R.: Magnitude, frequency and climate forcing of global volcanism during the last glacial period as seen in Greenland and Antarctic ice cores (60–9 ka), Clim. Past, 18, 485–506, https://doi.org/10.5194/cp-18-485-2022, 2022.
Simonsen, M. F., Baccolo, G., Blunier, T., Borunda, A., Delmonte, B., Frei, R., Goldstein, S., Grinsted, A., Kjær, H. A., Sowers, T., Svensson, A., Vinther, B., Vladimirova, D., Winckler, G., Winstrup, M., and Vallelonga, P.: Ice core dust particle sizes reveal past ice sheet extent in East Greenland, Nat. Commun., 10, 4494, https://doi.org/10.1038/s41467-019-12546-2, 2019.
Mayewski, P. A., Lyons, W. B., Spencer, M. J., Twickler, M. S., Buck, C. F., and Whitlow, S.: An ice-core record of atmospheric response to anthropogenic sulphate and nitrate, Nature, 346, 554–556, https://doi.org/10.1038/346554a0, 1990.
McIlhattan, E. A., Pettersen, C., Wood, N. B., and L'Ecuyer, T. S.: Satellite observations of snowfall regimes over the Greenland Ice Sheet, The Cryosphere, 14, 4379–4404, https://doi.org/10.5194/tc-14-4379-2020, 2020.
Moxnes, E. D., Kristiansen, N. I., Stohl, A., Clarisse, L., Durant, A., Weber, K., and Vogel, A.: Separation of ash and sulfur dioxide during the 2011 Grímsvötn eruption, J. Geophys. Res.-Atmos., 119, 7477–7501, https://doi.org/10.1002/2013JD021129, 2014.
Nagatsuka, N., Goto-Azuma, K., Tsushima, A., Fujita, K., Matoba, S., Onuma, Y., Dallmayr, R., Kadota, M., Hirabayashi, M., Ogata, J., Ogawa-Tsukagawa, Y., Kitamura, K., Minowa, M., Komuro, Y., Motoyama, H., and Aoki, T.: Variations in mineralogy of dust in an ice core obtained from northwestern Greenland over the past 100 years, Clim. Past, 17, 1341–1362, https://doi.org/10.5194/cp-17-1341-2021, 2021.
Neftel, A.: The Record of Gases and Reactive Species in Ice Cores, and Problems of Interpretation, in: Chemical Exchange Between the Atmosphere and Polar Snow, edited by: Wolff, E. W. and Bales, R. C., Springer Berlin Heidelberg, Berlin, Heidelberg, 45–69, https://doi.org/10.1007/978-3-642-61171-1_3, 1996.
Palais, J. M., Germani, M. S., and Zielinski, G. A.: Inter-hemispheric Transport of Volcanic Ash from a 1259 A.D. Volcanic Eruption to the Greenland and Antarctic Ice Sheets, Geophys. Res. Lett., 19, 801–804, https://doi.org/10.1029/92GL00240, 1992.
Parisien, M.-A., Snetsinger, S., Greenberg, J. A., Nelson, C. R., Schoennagel, T., Dobrowski, S. Z., Moritz, M. A., Parisien, M.-A., Snetsinger, S., Greenberg, J. A., Nelson, C. R., Schoennagel, T., Dobrowski, S. Z., and Moritz, M. A.: Spatial variability in wildfire probability across the western United States, Int. J. Wildland Fire, 21, 313–327, https://doi.org/10.1071/WF11044, 2012.
Parvin, F., Seki, O., Fujita, K., Iizuka, Y., Matoba, S., Ando, T., and Sawada, K.: Assessment for paleoclimatic utility of biomass burning tracers in SE-Dome ice core, Greenland, Atmos. Environ., 196, 86–94, https://doi.org/10.1016/j.atmosenv.2018.10.012, 2019.
Pasteris, D. R., McConnell, J. R., and Edwards, R.: High-Resolution, Continuous Method for Measurement of Acidity in Ice Cores, Environ. Sci. Technol., 46, 1659–1666, https://doi.org/10.1021/es202668n, 2012.
Petersen, G. N., Bjornsson, H., Arason, P., and von Löwis, S.: Two weather radar time series of the altitude of the volcanic plume during the May 2011 eruption of Grímsvötn, Iceland, Earth Syst. Sci. Data, 4, 121–127, https://doi.org/10.5194/essd-4-121-2012, 2012.
Pokhrel, A., Kawamura, K., Kunwar, B., Ono, K., Tsushima, A., Seki, O., Matoba, S., and Shiraiwa, T.: Ice core records of levoglucosan and dehydroabietic and vanillic acids from Aurora Peak in Alaska since the 1660s: a proxy signal of biomass-burning activities in the North Pacific Rim, Atmos. Chem. Phys., 20, 597–612, https://doi.org/10.5194/acp-20-597-2020, 2020.
Quinn, P. K., Shaw, G., Andrews, E., Dutton, E. G., Ruoho-Airola, T., and Gong, S. L.: Arctic haze: current trends and knowledge gaps, Tellus B, 59, 99–114, https://doi.org/10.1111/j.1600-0889.2006.00236.x, 2007.
Rasmussen, S. O., Abbott, P. M., Blunier, T., Bourne, A. J., Brook, E., Buchardt, S. L., Buizert, C., Chappellaz, J., Clausen, H. B., Cook, E., Dahl-Jensen, D., Davies, S. M., Guillevic, M., Kipfstuhl, S., Laepple, T., Seierstad, I. K., Severinghaus, J. P., Steffensen, J. P., Stowasser, C., Svensson, A., Vallelonga, P., Vinther, B. M., Wilhelms, F., and Winstrup, M.: A first chronology for the North Greenland Eemian Ice Drilling (NEEM) ice core, Clim. Past, 9, 2713–2730, https://doi.org/10.5194/cp-9-2713-2013, 2013.
Rhodes, R. H., Yang, X., and Wolff, E. W.: Sea Ice Versus Storms: What Controls Sea Salt in Arctic Ice Cores?, Geophys. Res. Lett., 45, 5572–5580, https://doi.org/10.1029/2018GL077403, 2018.
Robock, A. and Free, M. P.: Ice cores as an index of global volcanism from 1850 to the present, J. Geophys. Res.-Atmos., 100, 11549–11567, https://doi.org/10.1029/95JD00825, 1995.
Ruth, U., Wagenbach, D., Bigler, M., Steffensen, J. P., Röthlisberger, R., and Miller, H.: High-resolution microparticle profiles at NorthGRIP, Greenland: case studies of the calcium–dust relationship, Ann. Glaciol., 35, 237–242, https://doi.org/10.3189/172756402781817347, 2002.
Savarino, J. and Legrand, M.: High northern latitude forest fires and vegetation emissions over the last millennium inferred from the chemistry of a central Greenland ice core, J. Geophys. Res.-Atmos., 103, 8267–8279, https://doi.org/10.1029/97JD03748, 1998.
Schumann, U., Weinzierl, B., Reitebuch, O., Schlager, H., Minikin, A., Forster, C., Baumann, R., Sailer, T., Graf, K., Mannstein, H., Voigt, C., Rahm, S., Simmet, R., Scheibe, M., Lichtenstern, M., Stock, P., Rüba, H., Schäuble, D., Tafferner, A., Rautenhaus, M., Gerz, T., Ziereis, H., Krautstrunk, M., Mallaun, C., Gayet, J.-F., Lieke, K., Kandler, K., Ebert, M., Weinbruch, S., Stohl, A., Gasteiger, J., Groß, S., Freudenthaler, V., Wiegner, M., Ansmann, A., Tesche, M., Olafsson, H., and Sturm, K.: Airborne observations of the Eyjafjalla volcano ash cloud over Europe during air space closure in April and May 2010, Atmos. Chem. Phys., 11, 2245–2279, https://doi.org/10.5194/acp-11-2245-2011, 2011.
Schüpbach, S., Fischer, H., Bigler, M., Erhardt, T., Gfeller, G., Leuenberger, D., Mini, O., Mulvaney, R., Abram, N. J., Fleet, L., Frey, M. M., Thomas, E., Svensson, A., Dahl-Jensen, D., Kettner, E., Kjaer, H., Seierstad, I., Steffensen, J. P., Rasmussen, S. O., Vallelonga, P., Winstrup, M., Wegner, A., Twarloh, B., Wolff, K., Schmidt, K., Goto-Azuma, K., Kuramoto, T., Hirabayashi, M., Uetake, J., Zheng, J., Bourgeois, J., Fisher, D., Zhiheng, D., Xiao, C., Legrand, M., Spolaor, A., Gabrieli, J., Barbante, C., Kang, J.-H., Hur, S. D., Hong, S. B., Hwang, H. J., Hong, S., Hansson, M., Iizuka, Y., Oyabu, I., Muscheler, R., Adolphi, F., Maselli, O., McConnell, J., and Wolff, E. W.: Greenland records of aerosol source and atmospheric lifetime changes from the Eemian to the Holocene, Nat. Commun., 9, 1476, https://doi.org/10.1038/s41467-018-03924-3, 2018.
Scott, W. E. and McGimsey, R. G.: Character, mass, distribution, and origin of tephra-fall deposits of the 1989–1990 eruption of redoubt volcano, south-central Alaska, J. Volcanol. Geoth. Res., 62, 251–272, https://doi.org/10.1016/0377-0273(94)90036-1, 1994.
Segato, D., Villoslada Hidalgo, M. D. C., Edwards, R., Barbaro, E., Vallelonga, P., Kjær, H. A., Simonsen, M., Vinther, B., Maffezzoli, N., Zangrando, R., Turetta, C., Battistel, D., Vésteinsson, O., Barbante, C., and Spolaor, A.: Five thousand years of fire history in the high North Atlantic region: natural variability and ancient human forcing, Clim. Past, 17, 1533–1545, https://doi.org/10.5194/cp-17-1533-2021, 2021.
Severi, M., Udisti, R., Becagli, S., Stenni, B., and Traversi, R.: Volcanic synchronisation of the EPICA-DC and TALDICE ice cores for the last 42 kyr BP, Clim. Past, 8, 509–517, https://doi.org/10.5194/cp-8-509-2012, 2012.
Sigg, A. and Neftel, A.: Seasonal Variations in Hydrogen Peroxide in Polar Ice Cores, Ann. Glaciol., 10, 157–162, https://doi.org/10.3189/S0260305500004353, 1988.
Sigl, M., McConnell, J. R., Layman, L., Maselli, O., McGwire, K., Pasteris, D., Dahl-Jensen, D., Steffensen, J. P., Vinther, B., Edwards, R., Mulvaney, R., and Kipfstuhl, S.: A new bipolar ice core record of volcanism from WAIS Divide and NEEM and implications for climate forcing of the last 2000 years, J. Geophys. Res.-Atmos., 118, 1151–1169, https://doi.org/10.1029/2012JD018603, 2016a.
Sigl, M., Fudge, T. J., Winstrup, M., Cole-Dai, J., Ferris, D., McConnell, J. R., Taylor, K. C., Welten, K. C., Woodruff, T. E., Adolphi, F., Bisiaux, M., Brook, E. J., Buizert, C., Caffee, M. W., Dunbar, N. W., Edwards, R., Geng, L., Iverson, N., Koffman, B., Layman, L., Maselli, O. J., McGwire, K., Muscheler, R., Nishiizumi, K., Pasteris, D. R., Rhodes, R. H., and Sowers, T. A.: The WAIS Divide deep ice core WD2014 chronology – Part 2: Annual-layer counting (0–31 ka BP), Clim. Past, 12, 769–786, https://doi.org/10.5194/cp-12-769-2016, 2016b.
Simonsen, M. F., Baccolo, G., Blunier, T., Borunda, A., Delmonte, B., Frei, R., Goldstein, S., Grinsted, A., Kjær, H. A., Sowers, T., Svensson, A., Vinther, B., Vladimirova, D., Winckler, G., Winstrup, M., and Vallelonga, P.: East Greenland ice core dust record reveals timing of Greenland ice sheet advance and retreat, Nat. Commun., 10, 4494, https://doi.org/10.1038/s41467-019-12546-2, 2019.
Svensson, A., Andersen, K. K., Bigler, M., Clausen, H. B., Dahl-Jensen, D., Davies, S. M., Johnsen, S. J., Muscheler, R., Parrenin, F., Rasmussen, S. O., Röthlisberger, R., Seierstad, I., Steffensen, J. P., and Vinther, B. M.: A 60 000 year Greenland stratigraphic ice core chronology, Clim. Past, 4, 47–57, https://doi.org/10.5194/cp-4-47-2008, 2008.
Thomas, H. E. and Prata, A. J.: Sulphur dioxide as a volcanic ash proxy during the April–May 2010 eruption of Eyjafjallajökull Volcano, Iceland, Atmos. Chem. Phys., 11, 6871–6880, https://doi.org/10.5194/acp-11-6871-2011, 2011.
Thordarson, T. and Larsen, G.: Volcanism in Iceland in historical time: Volcano types, eruption styles and eruptive history, J. Geodyn., 43, 118–152, https://doi.org/10.1016/j.jog.2006.09.005, 2007.
Vallelonga, P., Christianson, K., Alley, R. B., Anandakrishnan, S., Christian, J. E. M., Dahl-Jensen, D., Gkinis, V., Holme, C., Jacobel, R. W., Karlsson, N. B., Keisling, B. A., Kipfstuhl, S., Kjær, H. A., Kristensen, M. E. L., Muto, A., Peters, L. E., Popp, T., Riverman, K. L., Svensson, A. M., Tibuleac, C., Vinther, B. M., Weng, Y., and Winstrup, M.: Initial results from geophysical surveys and shallow coring of the Northeast Greenland Ice Stream (NEGIS), The Cryosphere, 8, 1275–1287, https://doi.org/10.5194/tc-8-1275-2014, 2014.
Zennaro, P., Kehrwald, N., McConnell, J. R., Schüpbach, S., Maselli, O. J., Marlon, J., Vallelonga, P., Leuenberger, D., Zangrando, R., Spolaor, A., Borrotti, M., Barbaro, E., Gambaro, A., and Barbante, C.: Fire in ice: two millennia of boreal forest fire history from the Greenland NEEM ice core, Clim. Past, 10, 1905–1924, https://doi.org/10.5194/cp-10-1905-2014, 2014.
Zielinski, G. A., Mayewski, P. A., Meeker, L. D., Whitlow, S., Twickler, M. S., Morrison, M., Meese, D. A., Gow, A. J., and Alley, R. B.: Record of Volcanism Since 7000 B.C. from the GISP2 Greenland Ice Core and Implications for the Volcano-Climate System, Science, 264, 948–952, 1994.