the Creative Commons Attribution 4.0 License.
the Creative Commons Attribution 4.0 License.
 | 24 Jan 2022
Reconstructing Antarctic winter sea-ice extent during Marine Isotope Stage 5e
Claire S. Allen
Louise C. Sime
Xavier Crosta
Claus-Dieter Hillenbrand
Environmental conditions during Marine Isotope Stage (MIS) 5e (130–116 ka) represent an important “process analogue” for understanding the climatic responses to present and future anthropogenic warming. The response of Antarctic sea ice to global warming is particularly uncertain due to the short length of the observational record. Reconstructing Antarctic winter sea-ice extent during MIS 5e therefore provides insights into the temporal and spatial patterns of sea-ice change under a warmer-than-present climate. This study presents new MIS 5e records from nine marine sediment cores located south of the Antarctic Polar Front between 55 and 70∘ S. Winter sea-ice extent and sea-surface temperatures are reconstructed using marine diatom assemblages and a modern analogue technique transfer function, and changes in these environmental variables between the three Southern Ocean sectors are investigated. The Atlantic and East Indian sector records show much more variable MIS 5e winter sea-ice extent and sea-surface temperatures than the Pacific sector records. High variability in the Atlantic sector winter sea-ice extent is attributed to high glacial meltwater flux in the Weddell Sea, indicated by increased abundances of the diatom species Eucampia antarctica and Fragilariopsis cylindrus. The high variability in the East Indian sector winter sea-ice extent is conversely believed to result from large latitudinal migrations of the flow bands of the Antarctic Circumpolar Current, inferred from latitudinal shifts in the sea-surface temperature isotherms. Overall, these findings suggest that Pacific sector winter sea ice displays a low sensitivity to warmer climates. The different variability and sensitivity of Antarctic winter sea-ice extent in the three Southern Ocean sectors during MIS 5e may have significant implications for the Southern Hemisphere climatic system under future warming.
- Article
(3243 KB) - Full-text XML
-
Supplement
(1241 KB) - BibTeX
- EndNote


Antarctic sea ice is a critical part of the Southern Ocean (SO) and global climate system (Maksym, 2019). The vast extent of Antarctic sea ice and its huge seasonal variability (from ∼ 4 × 10⁶ km2 in summer to ∼ 18 × 106 km2 in winter in the present day) have a strong albedo–radiation feedback (Hall, 2004). Brine rejection during sea-ice formation contributes to the production of dense shelf and bottom water masses, which, in turn, influence the strength of global overturning ocean circulation (Abernathey et al., 2016; Rintoul, 2018). Sea-ice cover also regulates heat and gas exchange between the SO and the atmosphere as well as phytoplankton productivity by acting as a physical barrier (Rysgaard et al., 2011) and a barrier to sunlight; when melting, it causes stratification of the upper part of the water column (Goosse and Zunz, 2014).
Modern Antarctic sea-ice extent has shown a rapid decline since 2014 after 4 decades of gradual expansion (Parkinson, 2019). Within this overall trend there is substantial spatial heterogeneity in regional sea-ice trends, with decreases in the Bellingshausen and Amundsen seas concurrent with increases in the Weddell Sea and Ross Sea sectors (Hobbs et al., 2016; King, 2014; Parkinson, 2019). Alongside the inter-annual Antarctic sea-ice trends (Parkinson, 2019), there are also trends in seasonal variability, with the Amundsen Sea showing a substantial decrease in summer and autumn sea-ice concentrations but a slight increase in winter and spring sea-ice concentrations (Hobbs et al., 2016). Model simulations are unable to replicate the modern sea-ice changes without reduced regional warming trends (Rosenblum and Eisenman, 2017). Difficulties in reproducing modern sea-ice trends indicate the complexities of the climate dynamics that influence sea-ice extent in the SO today at different timescales (Ferreira et al., 2015; Hobbs et al., 2016; King, 2014; Purich et al., 2016; Stammerjohn et al., 2008).
Rising greenhouse gas concentrations are driving current global warming, with polar regions warming twice as fast (0.5 ∘C per decade) as the global average (IPCC, 2019) and Antarctic winter sea-ice extent (WSIE) predicted to shrink by 24 %–34 % by 2100 CE (Meredith et al., 2019). However, the very short length of observational records in high latitudes together with the complexity of the climate system, as mentioned above, limit our understanding of the underlying processes and ability to accurately predict future changes. Past warm periods can help document the amplitude of sea-ice extent reduction and, therefore, help guide our understanding of the impacts of future climate change in polar regions.
Interglacial Marine Isotope Stage (MIS) 5e (130–116 ka; Lisiecki and Raymo, 2005) is the latest period when global mean annual atmospheric temperatures were warmer than present (∼ 1 ∘C; Fischer et al., 2018) and global sea levels were higher than present (∼ 6–9 m; Kopp et al., 2009). Summer sea-surface temperatures (SSSTs) in the SO peaked at an average of 1.6 ± 1.4 ∘C warmer than present at and north of the modern Antarctic Polar Front during this period (Capron et al., 2014; Shukla et al., 2021). MIS 5e warming is primarily orbitally forced, unlike current and future anthropogenic warming, which is driven by rising greenhouse gas concentrations. Whilst MIS 5e cannot be considered a direct analogue for greenhouse-gas-induced global warming, it still represents an important “process analogue” for understanding climate mechanisms and responses that are active under warmer-than-present climate conditions (Stone et al., 2016).
Diatoms preserved in SO marine sediments have been used for over 40 years to reconstruct past changes in Antarctic sea-ice extent and sea-surface temperatures (SSTs) (Armand and Leventer, 2010; Burckle et al., 1982; Thomas et al., 2019) due to the close relationship between their biogeographic distribution patterns and surface water environmental conditions (Armand et al., 2005; Crosta et al., 2005; Esper et al., 2010; Gersonde and Zielinski, 2000; Romero et al., 2005; Zielinski and Gersonde, 1997). Several previous studies have used model simulations, alongside limited data constraints from marine sediment cores, to reconstruct SO WSIE and SSTs during MIS 5e (Capron et al., 2017; Holloway et al., 2017, 2018). However, there are currently no marine core records located far enough south to constrain the predicted WSIE during MIS 5e (Chadwick et al., 2020; Holloway et al., 2017). Due to chronological uncertainties in SO proxy records (Govin et al., 2015), previous studies have assumed the minimum WSIE occurred synchronously around Antarctica and was coincident with peak atmospheric temperatures in Antarctic ice cores at 128 ka (Holloway et al., 2017).
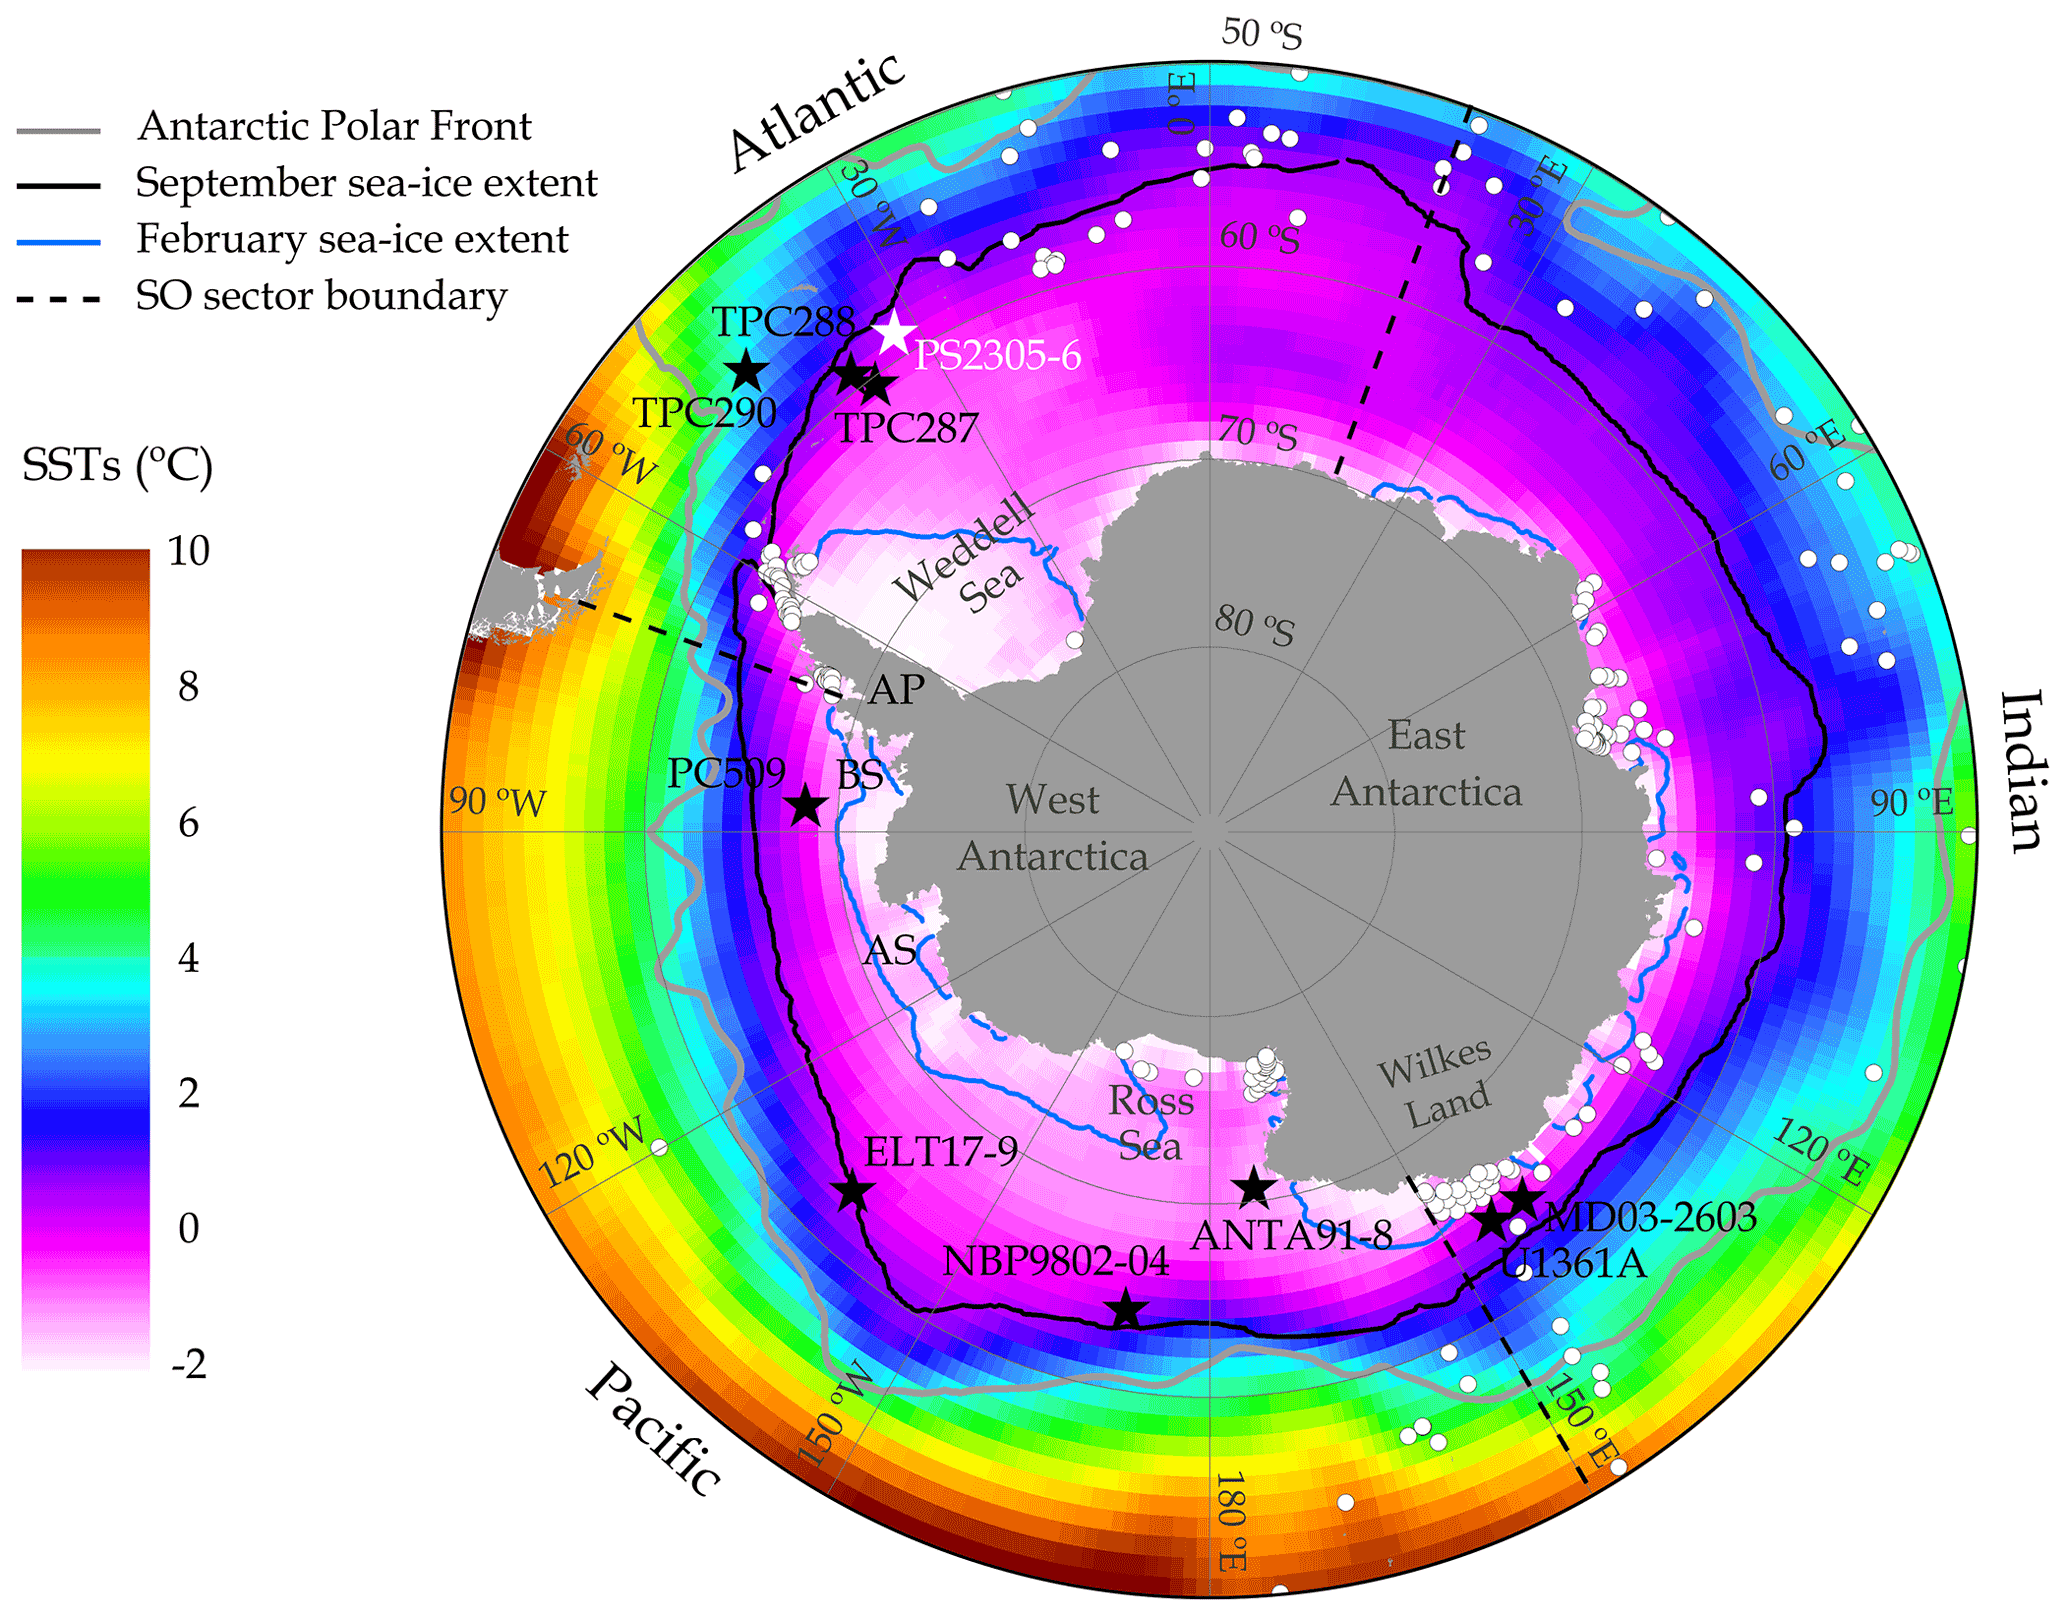
Figure 1Map of core locations (black stars – this study, white star – Bianchi and Gersonde, 2002) with the modern (1981–2010) mean annual SSTs (COBE-SST2 dataset provided by the NOAA PSL, Boulder, Colorado, USA, https://psl.noaa.gov/, last access: 29 April 2020) and modern (1981–2010) median September and February sea-ice extents (data from Fetterer et al., 2017). White dots mark the locations of surface sediment samples (located south of 50∘ S) used as a modern reference dataset for the modern analogue technique transfer function. The black solid line is the September sea-ice extent (15 % cover), and the blue solid line is the February sea-ice extent (15 % cover). The grey solid line is the position of the modern Antarctic Polar Front (Trathan et al., 2000). The black dashed lines mark the boundaries between the three SO sectors (Atlantic, Indian and Pacific). AP – Antarctic Peninsula, BS – Bellingshausen Sea, AS – Amundsen Sea.
This study presents new reconstructions of SO winter sea ice (WSI) during MIS 5e from the diatom assemblages preserved in nine marine sediment cores located south of 55∘ S and south of the modern Antarctic Polar Front (Fig. 1). Qualitative reconstructions are based on the occurrence of sea-ice-related diatoms (Gersonde and Zielinski, 2000). Quantitative estimates are produced through a diatom-based modern analogue technique transfer function based on numerous core-top sediment samples (Fig. 1) and originally detailed in Crosta et al. (1998). Quantitative and qualitative reconstructions of WSIE in the three SO sectors (the Atlantic sector at 70∘ W–20∘ E, the Indian sector at 20–150∘ E and the Pacific sector at 150∘ E–70∘ W) are compared to answer the following questions.
-
Did the minimum WSIE occur synchronously throughout the SO during MIS 5e?
-
Was the WSIE minimum concurrent with the peak Antarctic air temperatures at 128 ka?
-
Were the patterns in MIS 5e sea-ice change consistent between SO sectors?
2.1 Core sites
The nine sediment cores used in this study are shown in Fig. 1 alongside modern SSTs and sea-ice extents. Details for each core are listed in Table 1. These cores were chosen as they contain > 20 cm thick intervals of diatom-rich sediments deposited during MIS 5e (including Termination II) and are located further south than almost all previously published MIS 5e sea-ice records (Chadwick et al., 2020). Due to the locations of core sites MD03-2603 and U1361A, our SST and sea-ice reconstructions for the Indian Ocean sector of the SO may reflect conditions only representative for the eastern Indian sector.
Table 1Details of the location and recovery information for the nine marine sediment cores analysed in this study. Cores are ordered by sector (Atlantic – East Indian – Pacific) and then latitude.
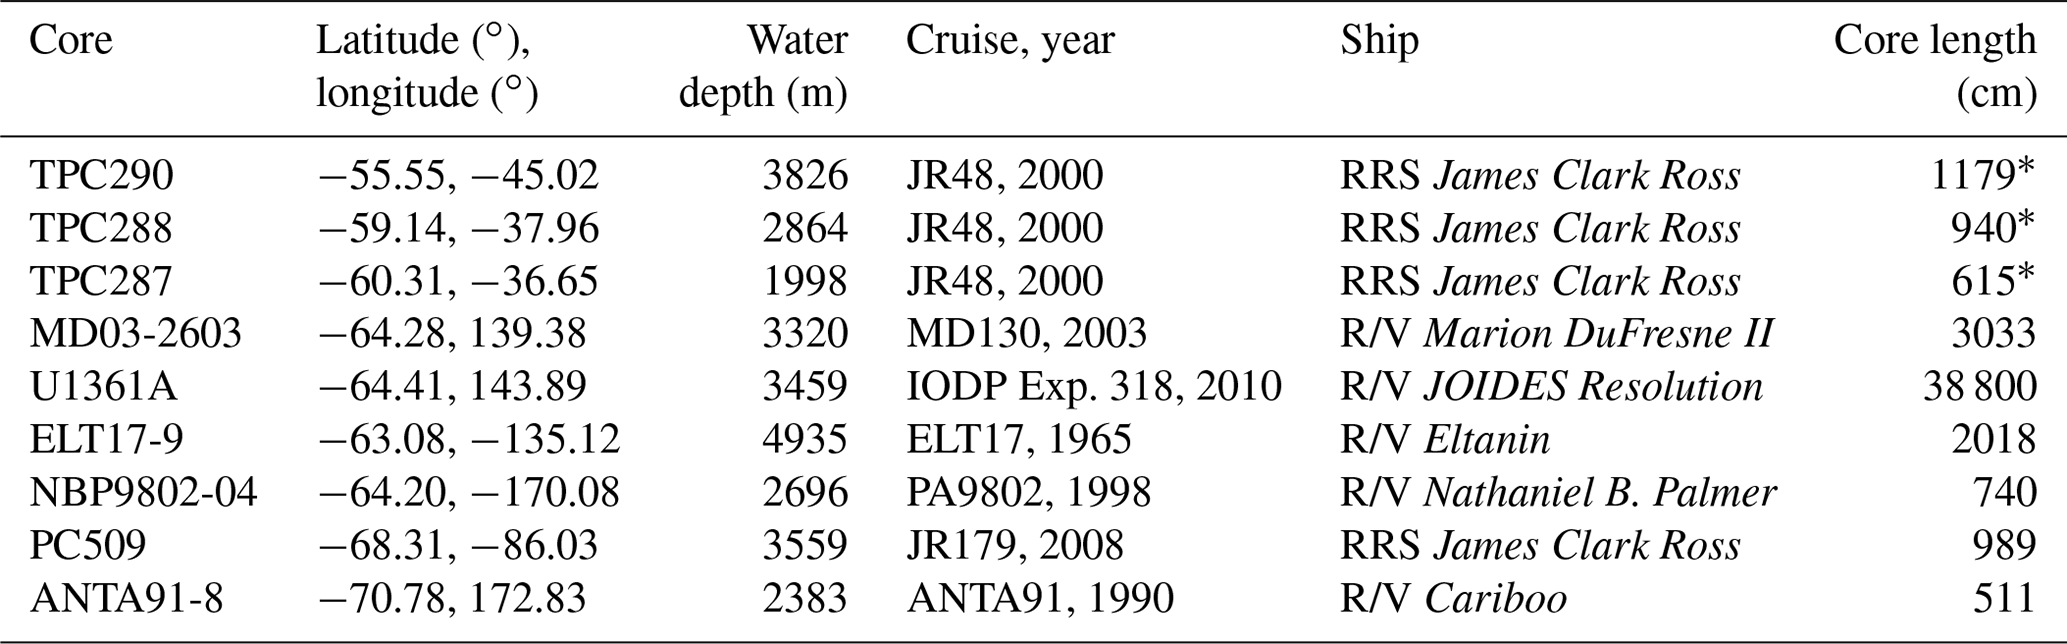
∗ For each of the three TPC cores (TPC290, TPC288 and TPC287), the trigger core (TC) and piston core (PC) were spliced together to produce a composite record.
2.2 Diatom counts
For the diatom assemblage data, microscope slides were produced using a method adapted from Scherer (1994). Samples of 7–28 mg were exposed to 10 % hydrochloric acid to remove any carbonate, 30 % hydrogen peroxide to break down organic material and a 4 % sodium hexametaphosphate solution to promote disaggregation, then placed in a warm water bath for a minimum of 12 h. The material was homogenized, transferred into a ∼ 10 cm high water column and allowed to settle randomly onto coverslips over a minimum of 4 h. The water was drained away and coverslips were mounted on microscope slides with Norland Optical Adhesive (NOA 61). Slides were examined using a light microscope (Olympus BH-2 at ×1000 magnification), and a minimum of 300 diatom valves were counted in each sample.
The combined relative abundance of Fragilariopsis curta and F. cylindrus (FCC) is used as a qualitative indicator of WSI presence (Gersonde and Zielinski, 2000), with abundances > 3 % associated with locations south of the mean WSI edge, abundances 1 %–3 % found between the mean and maximum WSI edge, and abundances < 1 % indicative of conditions north of the maximum WSI edge (Gersonde et al., 2005; Gersonde and Zielinski, 2000). The relative abundance of the diatom species Azpeitia tabularis is used as a comparison with reconstructed SSSTs. Azpeitia tabularis is a warm-water species restricted to the region north of the maximum WSIE (Zielinski and Gersonde, 1997), with abundances < 5 % in surface sediments south of the modern Antarctic Polar Front (Esper et al., 2010; Romero et al., 2005). Increasing abundances of this species in high-latitude SO sediments therefore indicate warmer SSTs and ice-free conditions.
2.3 Modern analogue technique (MAT)
September sea-ice concentrations (SICs) and SSSTs (January to March) are estimated by applying a MAT transfer function to the MIS 5e diatom assemblages. The MAT compares the relative abundances of 33 diatom species in each MIS 5e sample to the abundances of the same species in a modern reference dataset composed of 257 surface sediment samples (modern analogues) from the SO. Modern conditions for each surface sediment sample are interpolated on a 1∘ × 1∘ grid, with SSSTs from the World Ocean Atlas 2013 (Locarnini et al., 2013) and September SIC from the numerical atlas of Schweitzer (1995). The MAT was implemented using the “bioindic” R package (Guiot and de Vernal, 2011), with chord distance used to select the five most similar modern analogues to each MIS 5e assemblage. A cut-off threshold, above which any analogues are deemed too dissimilar to the MIS 5e sample, is fixed as the first quartile of random distances determined by a Monte Carlo simulation of the reference dataset (Simpson, 2007). The MAT257-33-5 (based on 257 reference samples, 33 taxa and up to five analogues) utilized in this study is an evolution of the MAT195-33-5 detailed in Crosta et al. (1998), with the addition of a further 62 surface sediment samples (Fig. 1). The incremental evolutions of this transfer function over the last 20 years have yielded robust SST and sea-ice reconstructions when compared alongside other proxies within the same cores (Civel-Mazens et al., 2021; Crosta et al., 2004; Ghadi et al., 2020; Nair et al., 2019; Shemesh et al., 2002).
Quantitative estimates of September SIC and SSSTs are produced for each MIS 5e sample from a distance-weighted average of the climate values associated with the selected analogues. The reconstructed SSSTs have a root mean square error of prediction (RMSEP) of 1.09 ∘C and an R2 of 0.96, and the reconstructed September SICs have an RMSEP of 9 % and an R2 of 0.93. The reconstructed September SIC and SSST for each MIS 5e sample only use analogues below the dissimilarity threshold and could therefore be reconstructed from fewer than five analogues in some samples. It is also possible to get no-analogue conditions, in which none of the reference surface sediment samples are similar enough to an MIS 5e sample, and it is therefore not possible to reconstruct September SIC and SSST for this MIS 5e sample.
2.4 Diatom preservation
For both the MAT and the FCC proxy, it is important that the diatom assemblage is well preserved, as high dissolution causes preferential loss of the more lightly silicified diatom species, generally sea-ice-related species, and would therefore bias reconstructions towards warmer SSTs and lower sea-ice conditions. The samples used in this study were investigated for signs of dissolution following the procedure detailed in Warnock et al. (2015), whereby the areolae in F. kerguelensis valves were checked to ensure there was little, or no, expansion and conjoining, as would occur under a high degree of dissolution. Diatom assemblages in the analysed samples were also checked for a mixture of both heavily and weakly silicified diatoms across the whole size range, which was suggested by Zielinski (1993) as an indicator of good preservation. Poor preservation of diatoms in sediments located beneath heavy winter sea ice (SIC > 75 %) has likely limited most previous attempts to reconstruct MIS 5e conditions from core sites located south of the modern mean WSIE, and thus the preservation of samples analysed in this study was carefully considered to avoid introducing a warm (low sea ice) bias into our reconstructions.
3.1 Published chronologies
Eight of the sediment cores presented in this study have previously published age models, as summarized in Table 2. Cores TPC290, TPC288, TPC287 and NBP9802-04 are published on the EDC3 chronology, cores MD03-2603, U1361A and PC509 are published on the LR04 chronology, and core ELT17-9 is published on the SPECMAP chronology. These published chronologies are further constrained by checking the abundance of the diatom species Rouxia leventerae in all MIS 5e samples. All diatom assemblages analysed in this study have R. leventerae abundances < 1 %, which suggests that the considered sediments are younger than the ∼ 135 ka last occurrence datum identified by Zielinski et al. (2002). To allow for consistent comparison of timings between cores, all cores are translated across onto the AICC2012 chronology (Bazin et al., 2013; Veres et al., 2013) using the alignment strategy of Govin et al. (2012) and the conversion tables of Lisiecki and Raymo (2005) and Parrenin et al. (2013b).
Table 2Summary of the location and chronologies for the nine sediment cores analysed in this study. Cores are ordered by sector (Atlantic – East Indian – Pacific) and then latitude. LOD: last occurrence datum, LCO: last common occurrence.
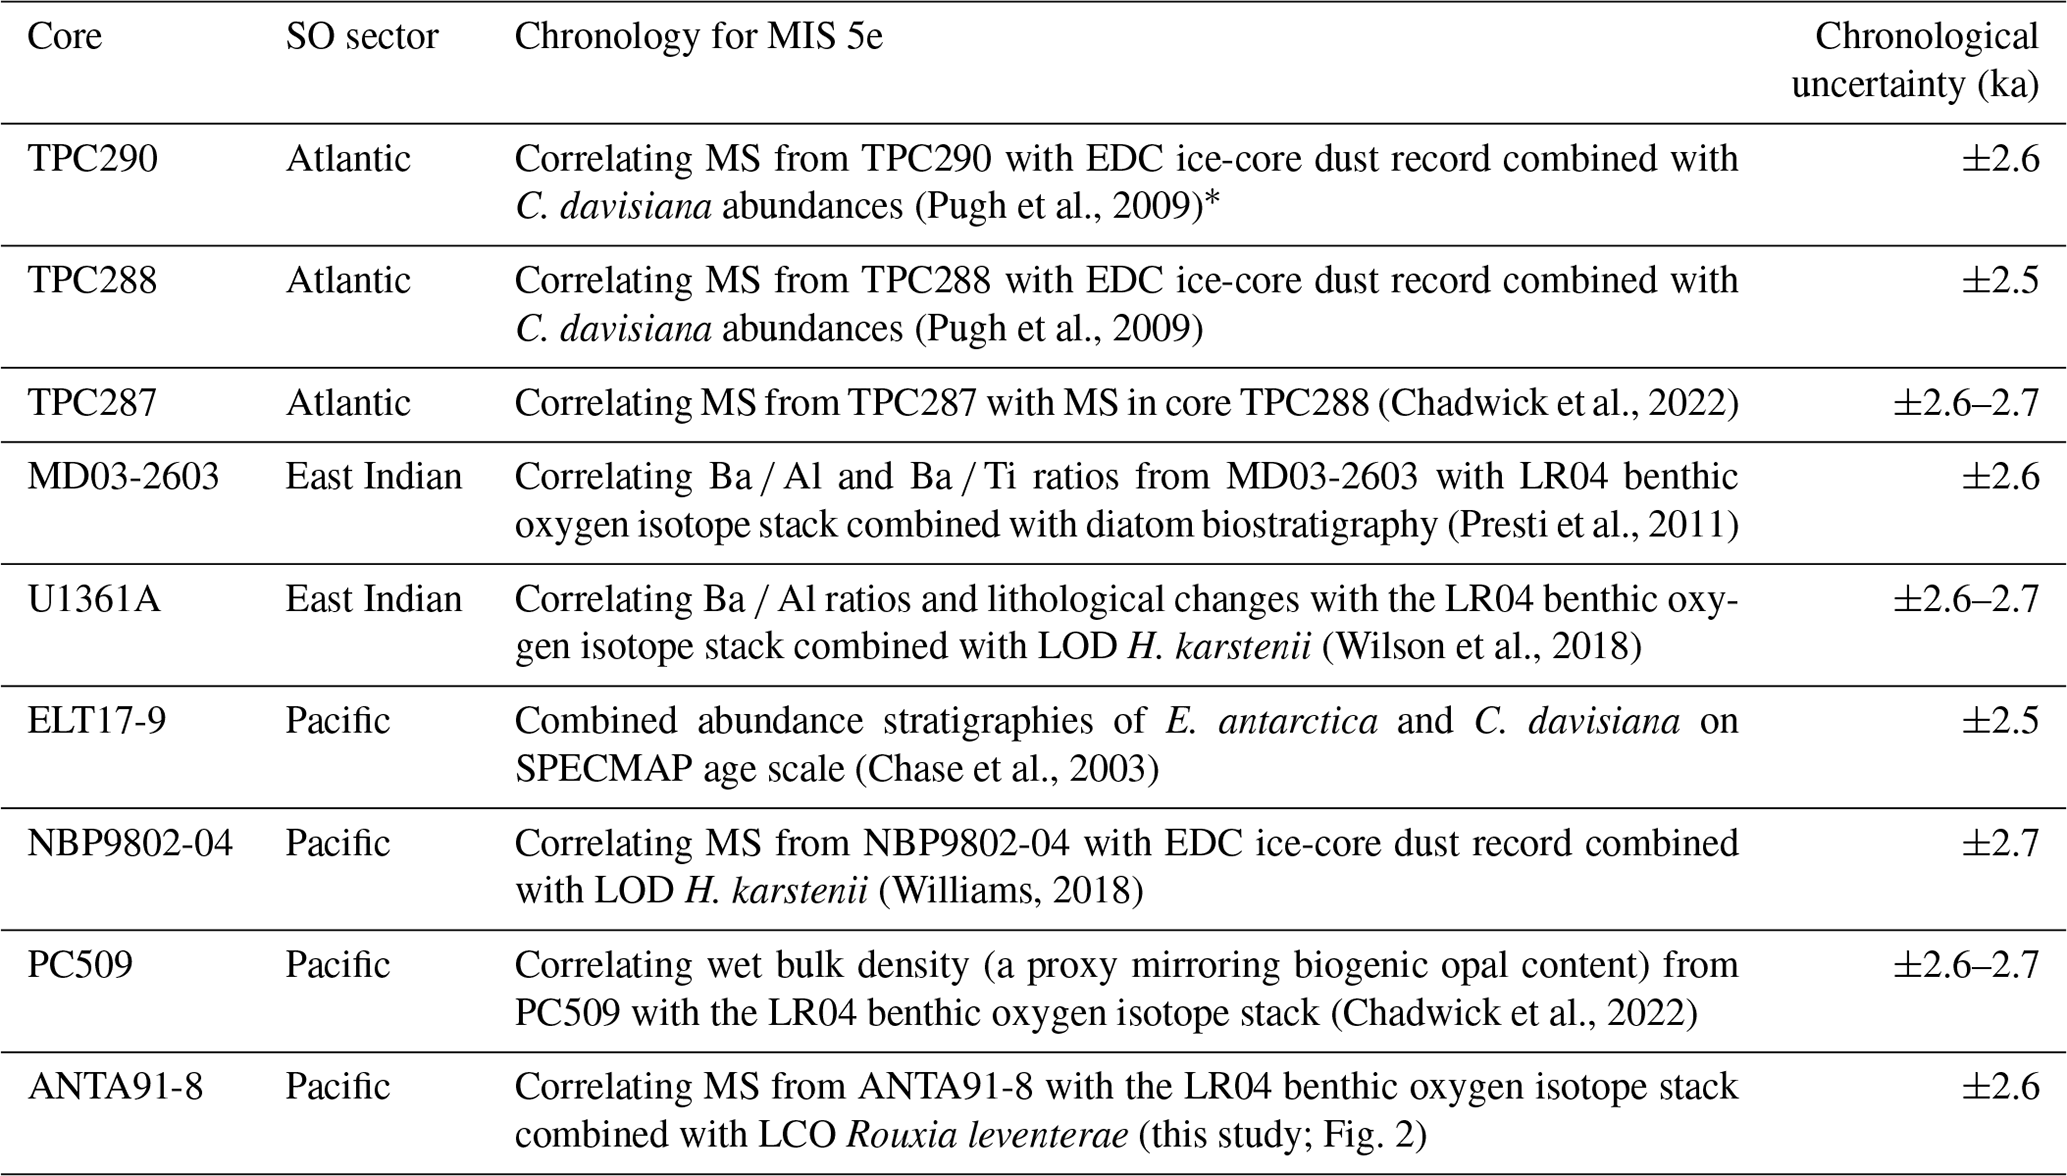
∗ For core TPC290 the chronology has been slightly adjusted from the published record of Pugh et al. (2009) by shifting the Termination II tie point to better align the magnetic susceptibility (MS) record with the dust record of the EPICA Dome C (EDC) ice core in East Antarctica (Chadwick et al., 2022).
Chronological uncertainties for the MIS 5e ages of samples in this study (Table 2) vary between 2.5 and 2.7 ka. The AICC2012 chronology has an uncertainty of ±1.5 ka during MIS 5e, with an additional uncertainty of ±1 ka arising from the translation between chronologies (Capron et al., 2014). Each core sample comprises a 0.5 cm thick slice of sediment, and therefore additional age uncertainty due to integrating over the corresponding time interval in each core needs to be taken into account (see Table 2).
3.2 ANTA91-8 chronology
The chronology for core ANTA91-8 was constructed by aligning the magnetic susceptibility (MS) to the LR04 benthic foraminifera δ18O stack (Lisiecki and Raymo, 2005) using the AnalySeries software (Paillard et al., 1996). Increased supply of terrigenous glacigenic detritus from the Antarctic continent to its margin and increased dust input from Patagonia and Australia to the pelagic SO during glacial periods resulted in higher MS values during glacial periods than interglacial periods (Bareille et al., 1994; Pugh et al., 2009; Walter et al., 2000). Tie points were selected in the MS record at the boundaries of MISs and sub-stages (Fig. 2 and Table 3). Ages for the MIS 5 sub-stage boundaries are from Govin et al. (2009), and the ages are translated from the LR04 chronology onto the AICC2012 chronology.
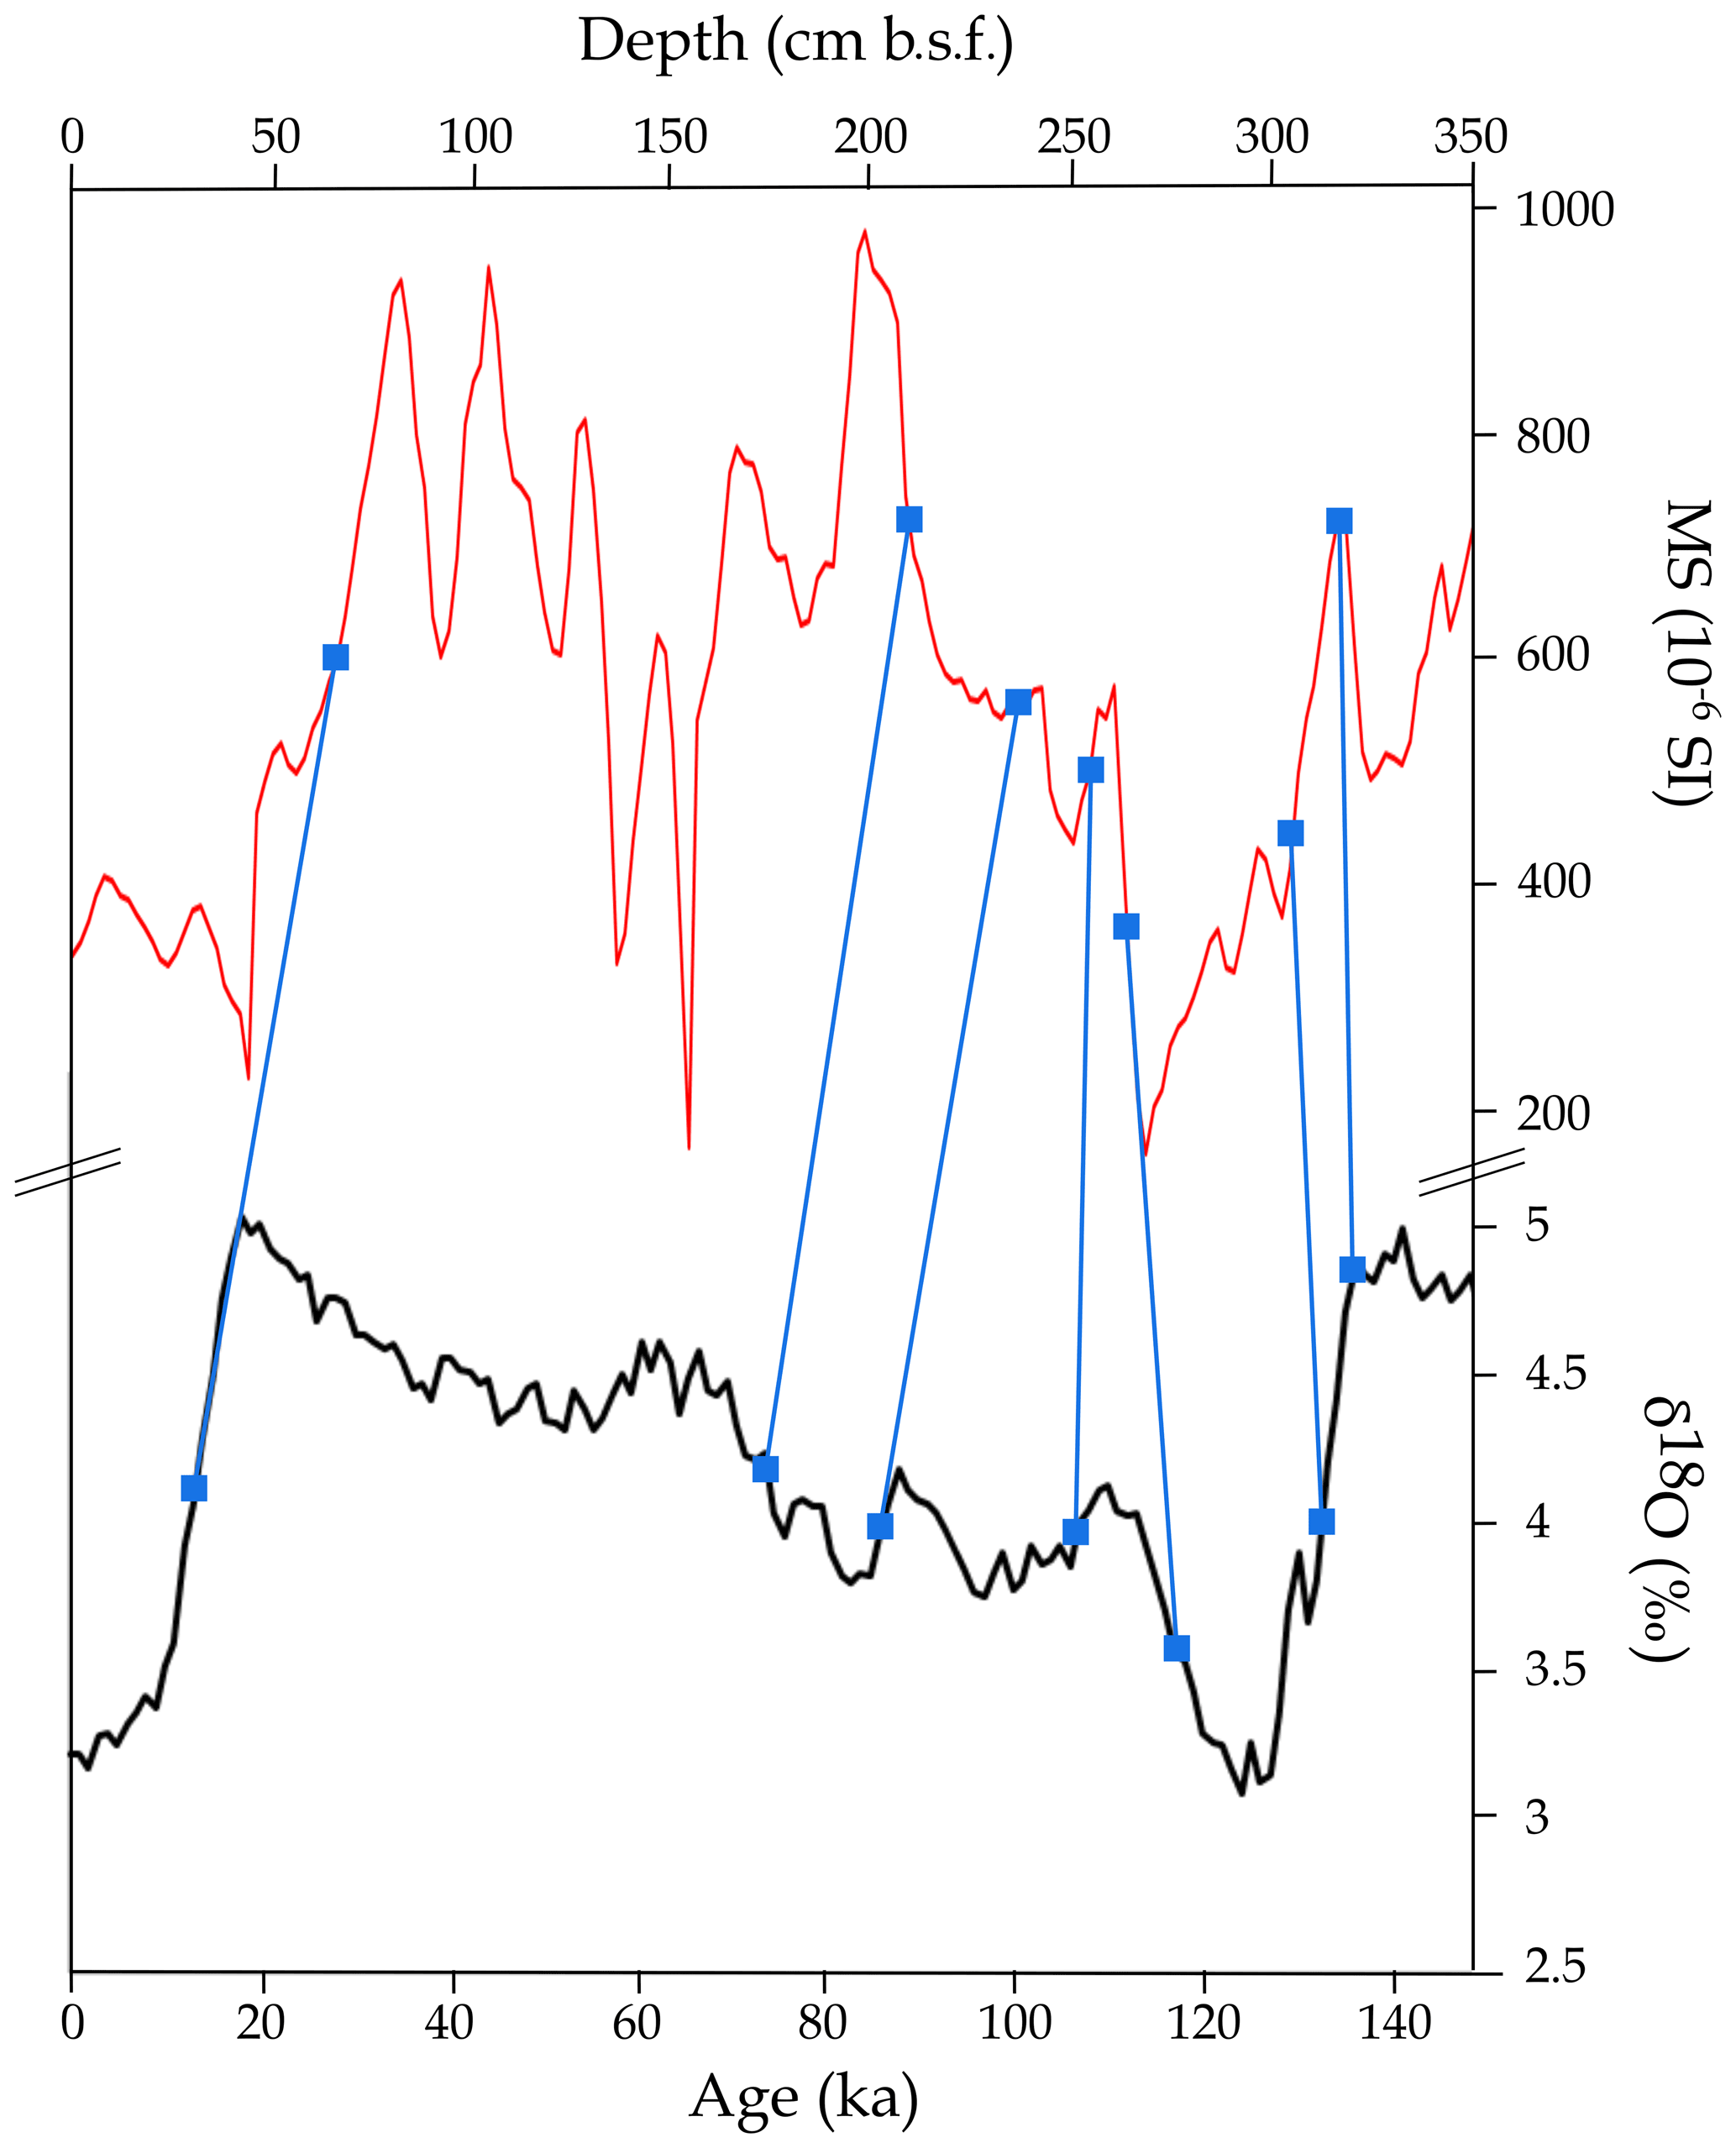
Figure 2Alignment between the MS from core ANTA91-8 (red) and the LR04 benthic δ18O stack (black) using the AnalySeries software (Paillard et al., 1996). Blue squares and connecting lines mark the tie points between records.
Table 3Tie points for ANTA91-8 chronology. The MS record for ANTA91-8 is aligned to the LR04 benthic stack using the AnalySeries software (Paillard et al., 1996).

The chronology for core ANTA91-8 presented in this study differs from chronologies previously published by Ceccaroni et al. (1998) and Brambati et al. (2002), who – on the basis of 230thorium measurements, subsequently adjusted by matching maxima in palaeo-productivity proxies to peak interglacials – placed MIS 5e ∼ 50 cm higher than in our age model (Fig. S1 in the Supplement). Our new chronology assigns the MS minimum from 2.65–3.05 m below the seafloor (m b.s.f.), which comprises a peak in organic carbon content (Ceccaroni et al., 1998), to MIS 5e. In contrast, both the Ceccaroni et al. (1998) and Brambati et al. (2002) age models placed this MS minimum within MIS 6 (Fig. S1), resulting in inexplicably high accumulation rates of productivity proxies during this glacial period (Ceccaroni et al., 1998). Our new chronology is corroborated by R. leventerae, which occurs in abundances < 1 % in ANTA91-8 samples between 2.72 and 3.14 m b.s.f. (Chadwick and Allen, 2021a). If the sediments in this depth interval were deposited during MIS 6, as suggested by the Ceccaroni et al. (1998) and Brambati et al. (2002) age models, then the R. leventerae abundances in the corresponding samples should be > 1 % (Zielinski et al., 2002).
The September SIC values, reconstructed using the MAT, and the FCC relative abundances are presented for the 132–120 ka interval in all nine sediment cores (Fig. 3). This interval is chosen to capture the sea-ice signature from both the end of glacial Termination II and during “peak” MIS 5e. SSST data, also reconstructed using MAT, are presented over the same time interval alongside the relative abundance of A. tabularis.

Figure 3Down-core September SICs, determined using the MAT, and FCC relative abundances for the 132–120 ka interval in nine marine sediment cores. The blue shading indicates the FCC relative abundance, with the colour saturation varying between SO sectors. The solid black lines indicate the September SICs with the gaps in the TPC290 record caused by two samples being too dissimilar from all modern reference samples so that the latter cannot be considered analogues. Dashed lines mark the mean WSIE thresholds of 3 % FCC abundance (blue lines) and 15 % September SIC (black lines). Within each SO sector cores are arranged from north to south.
4.1 Sea ice
The three Atlantic sector cores (TPC290, TPC288 and TPC287) display a N–S increasing trend in mean FCC relative abundances (2.1 ± 0.7 %, 3.1 ± 2.2 % and 4.7 ± 3.6 %) and September SICs (19 ± 17 %, 25 ± 18 % and 33 ± 20 %). All three cores have low FCC relative abundances (1.2 ± 0.5 %) and September SICs (8.8 ± 4.6 %) during the 131–130 ka interval, with cores TPC288 and TPC287 both reaching their minimum September SIC and FCC values at this time (Fig. 3). Following this interval of low September SIC and FCC values, all three cores show an increase to their maximum September SICs (58 ± 5 %) and FCC relative abundances (9 ± 5 %) at 127–126 ka (Fig. 3). After 126 ± 2.6 ka core TPC290 displays a gradual decline in both FCC relative abundance and September SIC to minimum values at 121–120 ka (Fig. 3). In contrast, core TPC287 maintains high September SICs (51 ± 3 %, multiple samples) throughout the 126–120 ka period as well as high (6.2 ± 1.8 %, multiple samples) FCC relative abundances, although they are lower than the 126 ± 2.6 ka peak of ∼ 15 % (single sample) (Fig. 3). Core TPC288 maintains, relative to the ∼ 130 ± 2.5 ka minimum and ∼ 126 ± 2.5 ka maximum, intermediate FCC (2.9 ± 0.6 %, multiple samples) and September SIC (22 ± 15 %, multiple samples) values throughout the 126–120 ka interval, but the September SICs are much more variable than in TPC287 (Fig. 3).
All three Atlantic sector cores (TPC290, TPC288 and TPC287) have a strong match between the FCC and September SIC variations (p = 0.05, p < 0.01 and p < 0.01, respectively), with the notable exception of the TPC287 sample at ∼ 129 ± 2.6 ka, which has a very high September SIC (86 %) but a relatively low FCC relative abundance (3.4 %). For this sample, only a single modern analogue could be identified, indicating that the fossil diatom assemblage is different from almost everything in the modern reference database. The single selected analogue is not chosen by the transfer function for any of the other MIS 5e samples from core TPC287, indicating that it is unlikely to be a truly representative modern analogue for the MIS 5e condition at this core site. The location of this single selected analogue, which is further south than any of the analogues chosen for the other MIS 5e samples from core TPC287, suggests that the fossil assemblage has been biased towards colder, heavier sea-ice conditions, probably due to dissolution or transport of the preserved assemblage. Thus, the reconstructed September SIC for this sample is disregarded from the analysis. There are two MIS 5e samples in TPC290 (at 124.7 ± 2.6 and 122.8 ± 2.6 ka) for which none of the reference surface sediment samples were below the dissimilarity threshold (see Sect. 2.3 for details), and thus no MAT estimate of September SIC (or SSST) is given for those samples.
To check for other potentially anomalous palaeo-reconstructions, the number of times each modern reference sample was selected as an analogue was considered (Fig. S2). Fossil samples were separated into three MIS 5e–Termination II time intervals (following the approach of Chadwick et al., 2022), and modern reference samples that are only selected as analogues for a small number (< 5) of fossil samples were identified (Fig. S2). None of these less-selected reference samples are the primary or sole analogue for an MIS 5e fossil sample and are therefore unlikely to result in an unrepresentative September SIC (or SSST) reconstruction.
The two East Indian sector cores (MD03-2603 and U1361A) have similar average MIS 5e FCC relative abundances (3.2 ± 1 % and 3.9 ± 1.5 %) to each other, but the average September SIC (19 ± 15 % and 27 ± 25 %) is nearly 10 % higher in U1361A. However, the MIS 5e variability in September SIC within each core is greater than this difference between the two cores. Core MD03-2603 has three September SIC maxima of > 40 % (single samples) during MIS 5e at 124.1 ± 2.6, 127.3 ± 2.6 and 128.8 ± 2.6 ka, as well as three minima of < 5 % (single samples) at 121.5 ± 2.6, 123.3 ± 2.6 and 129.5 ± 2.6 ka (Fig. 3). Contrastingly, the nearby core from Hole U1361A (Fig. 1) has a maximum in MIS 5e September SIC (76.4 %, single sample) at 128.4 ± 2.7 ka and a minimum (0 %, single sample) at 123.7 ± 2.7 ka (Fig. 3). Together these two records suggest that the greatest MIS 5e September SICs in the East Indian sector occurred during the 129–127 ka interval and the minimum was at 123.5–121 ka (Fig. 3).
Unlike the Atlantic and East Indian sectors, the four cores from the Pacific sector (ELT17-9, NBP9802-04, PC509 and ANTA91-8) have low variability in their FCC relative abundances (1.4 ± 0.6 %, 2.3 ± 1 %, 5.8 ± 0.9 % and 11 ± 1.9 %) and September SICs (13 ± 4 %, 8.4 ± 5.7 %, 34 ± 2 % and 48 ± 11 %) throughout MIS 5e, with no pronounced maxima or minima (Fig. 3). The northernmost Pacific sector core ELT17-9 has the lowest average MIS 5e FCC relative abundance (1.4 ± 0.6 %), but the more southerly core NBP9802-04 has the lowest average MIS 5e September SIC (8.4 ± 5.7 %). The two most southerly Pacific sector cores (PC509 and ANTA91-8) have the highest average MIS 5e September SICs and FCC relative abundances of all the cores analysed for this study.
4.2 Sea-surface temperatures
For the Atlantic sector cores the average MIS 5e SSSTs (3.2 ± 1.9, 2.7 ± 1.6 and 2.2 ± 1.5 ∘C) show an inverse trend to September SICs with higher values in more northerly cores. Both TPC288 and TPC287 have their highest MIS 5e SSSTs during the 131–129 ka interval (5 and 4.3 ∘C, respectively; multiple samples), followed by an SSST minimum at ∼ 126 ± 2.6 ka (0.1 and 0.6 ∘C, respectively; single samples) (Fig. 4). In contrast, the warmest MIS 5e SSSTs for TPC290 occur in the youngest part of the record, with an average of 6 ∘C in the 122–120 ka period (Fig. 4). The relative abundance of A. tabularis in core TPC290 shows a good consistency (p = 0.01, R2=0.34) with the SSST pattern during MIS 5e, with the highest relative abundances (1.3 ± 0.8 %, multiple samples) observed after 126 ± 2.6 ka (Fig. 4). The southernmost core TPC287 from the Atlantic sector shows a very poor match between MIS 5e SSSTs and A. tabularis relative abundances (p = 0.3, R2=0.09). This lack of correlation is likely due to the scarcity of A. tabularis at this site throughout MIS 5e, as can be seen in modern surface sediments (Chadwick, 2020), and thus a single valve can create a relative abundance peak that may be largely unrelated to the SSST trends.
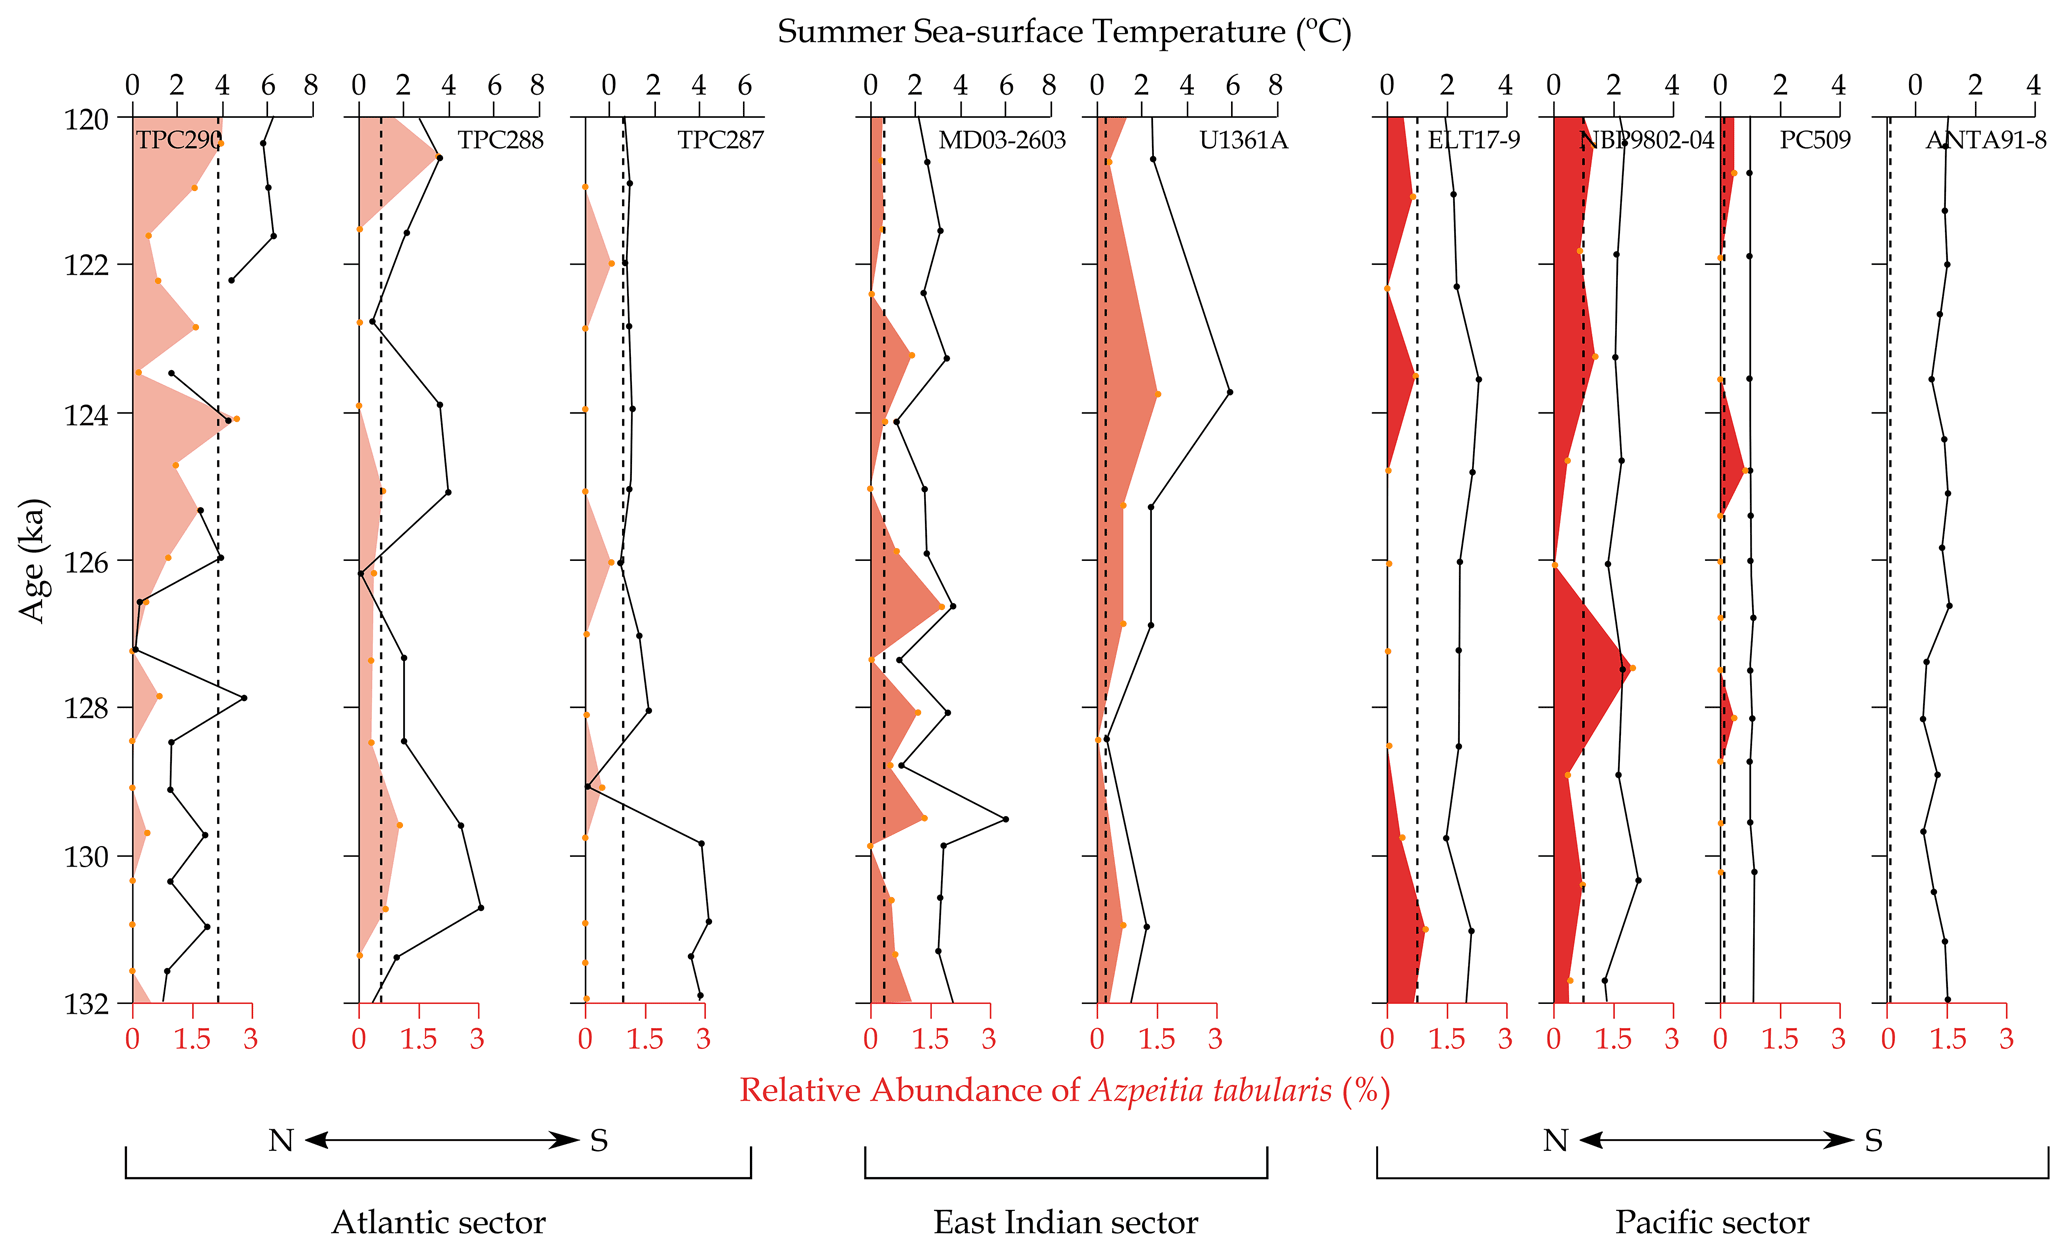
Figure 4Down-core summer (January to March) SSTs, determined using the MAT, and the relative abundance of Azpeitia tabularis for the 132–120 ka interval in nine marine sediment cores. The red shading indicates the relative abundance of A. tabularis, with the colour saturation varying between SO sectors. The solid black lines indicate the SSSTs with the gaps in the TPC290 record caused by two samples being too dissimilar from all modern reference samples so that the latter cannot be considered analogues. Black dashed lines mark the modern (January–March, 1980–2019) SSSTs at each core site (Hersbach et al., 2019). Within each SO sector cores are arranged from north to south.
The East Indian sector cores have similar average SSSTs (2.8 ± 1.1 and 2.4 ± 1.7 ∘C). However, unlike for the September SICs (Fig. 3), the MIS 5e SSST minima and maxima in cores MD03-2603 and U1361A occur at different times (Fig. 4). SSSTs in core U1361A fall to a minimum of 0.7 ∘C (single sample) at ∼ 128 ± 2.7 ka before rising to a maximum of 5.9 ∘C (single sample) at ∼ 124 ± 2.7 ka. In contrast, SSSTs in core MD03-2603 reach an early peak of 5.9 ∘C (single sample) at ∼ 129.5 ± 2.6 ka and have minima of ∼ 1 ∘C (single samples) at 124.1 ± 2.6, 127.3 ± 2.6 and 128.8 ± 2.6 ka (Fig. 4). Both MD03-2603 and U1361A show a strong coherence between the MIS 5e SSSTs and the A. tabularis abundance (p = 0.01, R2=0.4 and p < 0.01, R2=0.92, respectively).
In the Pacific sector cores, SSSTs are largely consistent throughout MIS 5e, with averages of 2.5 ± 0.3 %, 2.2 ± 0.3 %, 1.03 ± 0.03 % and 0.8 ± 0.3 % (Fig. 4). Although there is very little variation in MIS 5e SSSTs in all four records, both core NBP9802-04 and core PC509 reveal maximum SSSTs (2.8 and 1.1 ∘C, respectively; single samples) at ∼ 130 ± 2.7 ka (Fig. 4). None of the Pacific sector cores show a strong match between MIS 5e SSSTs and the relative abundance of A. tabularis. For the more southerly core PC509 this poor correlation (p = 0.65, R2=0.02) is likely caused by the same scarcity of A. tabularis as for core TPC287 in the Atlantic sector.
Both the September SICs and FCC relative abundances indicate substantial differences in the pattern of MIS 5e WSIE change between the three SO sectors, most notably between the Atlantic and Pacific sectors. In all three Atlantic sector records, the FCC relative abundances and September SICs indicate year-round open marine conditions and thus a poleward contraction of the mean WSIE (FCC < 3 %, Gersonde and Zielinski, 2000; September SIC < 15 %, Zwally et al., 2002) during the 131–130 ka interval. This minimum is succeeded by a re-expansion of sea ice to a maximum extent in the 127–126 ka interval when all three core sites were covered by WSI. An early minimum in MIS 5e WSIE succeeded by a maximum ∼ 4 kyr later is a consistent, but offset, pattern compared to the FCC relative abundance in nearby core PS2305-6 (Fig. 1; 58.72∘ S, 33.04∘ W) (Bianchi and Gersonde, 2002; Chadwick et al., 2020).
We cannot rule out the possibility that the apparent retreat in Atlantic sector sea ice to a minimum during Termination II followed by a sea-ice expansion coincident with peak Antarctic air temperatures is an artefact caused by chronological uncertainties, with the WSIE minimum actually occurring alongside the peak Antarctic air temperatures at ∼ 128 ± 1.5 ka (Holloway et al., 2017; Parrenin et al., 2013a). However, a genuine early (i.e. before 130 ka) retreat in Atlantic sector sea ice would also be consistent with most of the Termination II and MIS 5e records from this sector analysed by Bianchi and Gersonde (2002). Model experiments by Menviel et al. (2010) have demonstrated that during early MIS 5e the release of vast quantities of glacial meltwater into the surface waters of the Antarctic zone (i.e. the region south of the Antarctic Polar Front) caused by Antarctic ice-sheet deglaciation, especially the potential partial or total loss of the West Antarctic Ice Sheet (WAIS), would have led to SST reduction and equatorward sea-ice expansion. Importantly, this meltwater injection into the SO, which is supported by the observation of meltwater “spikes” characterizing planktic foraminifera δ18O data in cores from the Weddell Sea continental margin during glacial–interglacial transitions (Grobe et al., 1990), would also have resulted in a warming of subsurface waters that, in turn, would have triggered further ocean-forced melting of the ice-sheet grounding zones, especially of the predominantly marine-based WAIS, thus kick-starting a positive feedback loop (Bronselaer et al., 2018; Menviel et al., 2010). Because of their location within “Iceberg Alley”, a main pathway of Antarctic icebergs travelling with the clockwise Weddell Gyre from the southern Weddell Sea Embayment into the Scotia Sea (Weber et al., 2014), core TPC290 and especially cores TPC287 and TPC288 can be expected to be particularly sensitive for recording such meltwater supply.
In fact, the MIS 5e WSIE maximum in the Atlantic sector records coincides, within chronological uncertainty, with higher global sea level (Kopp et al., 2013) and evidence for increased meltwater flux in the Weddell Sea (Chadwick et al., 2022), which both indicate substantial mass loss from the Antarctic ice sheets, consistent with findings of major ice loss in the Weddell Sea sector during MIS 5e (Turney et al., 2020). Higher glacial meltwater fluxes associated with increased ice-sheet loss could therefore be a major driver of the WSIE expansion in the Atlantic sector records as less saline surface waters freeze more easily (Bintanja et al., 2013; Merino et al., 2018). The peak in FCC abundance in core TPC287 at 126 ± 2.6 ka is primarily a peak in the abundance of F. cylindrus (Chadwick and Allen, 2021f). Fragilariopsis cylindrus generally dominates water column diatom assemblages in both ice-covered (Burckle et al., 1987) and marginal sea-ice zones (Kang and Fryxell, 1992, 1993; Kang et al., 1993). The occurrence of high modern F. cylindrus abundances in marginal sea-ice zones indicates that this species is not purely associated with sea ice, from which it might have been seeded when retreating, but is also strongly affiliated with sea-ice melt and strong surface stratification (Cremer et al., 2003; Kang and Fryxell, 1993; von Quillfeldt, 2004). The peak in F. cylindrus abundances at 126 ± 2.6 ka in core TPC287, separate from any notable increase in F. curta abundance, therefore supports an increased glacial meltwater signal at this time.
The discrepancy between September SICs and FCC relative abundances at ∼ 127 ± 2.6 ka in core TPC290 (Fig. 3) is likely due to increased Chaetoceros resting spore (rs.) abundance at this time (Chadwick and Allen, 2021h). This Chaetoceros rs. abundance increase is also observed in the nearby core PS2305-6 (Bianchi and Gersonde, 2002) and is inferred to be caused by higher meltwater and iceberg flux at this time (Bianchi and Gersonde, 2002; Crosta et al., 1997). For core TPC290, there is a scarcity of modern analogues from the Scotia Sea region (Fig. 1), and thus the high Chaetoceros rs. abundances in MIS 5e samples are associated with modern analogues from sites along the Antarctic Peninsula, where SICs are greater than in the Scotia Sea.
Atlantic sector SSSTs reach their maxima during Termination II before a substantial drop coincident with the peak Antarctic air temperatures in ice cores (Parrenin et al., 2013a). As with the down-core September SIC profiles, this offset may result from chronological uncertainties, with the highest SSSTs actually occurring alongside peak Antarctic air temperatures at ∼ 128 ± 1.5 ka. However, air temperature and SST reconstructions from the Antarctic Peninsula and Scotia Sea have shown that during Termination I temperatures peaked at higher values than during the Holocene (Mulvaney et al., 2012; Xiao et al., 2016); thus, our records could indicate an equivalent early warming during Termination II for this region. Also, if the high air temperatures at ∼ 128 ± 1.5 ka caused substantial Antarctic ice-sheet loss, then the cold SSSTs in our ice-sheet proximal records at this time could, as discussed above, actually reflect major input of cold and fresh meltwater not recorded in cores further north.
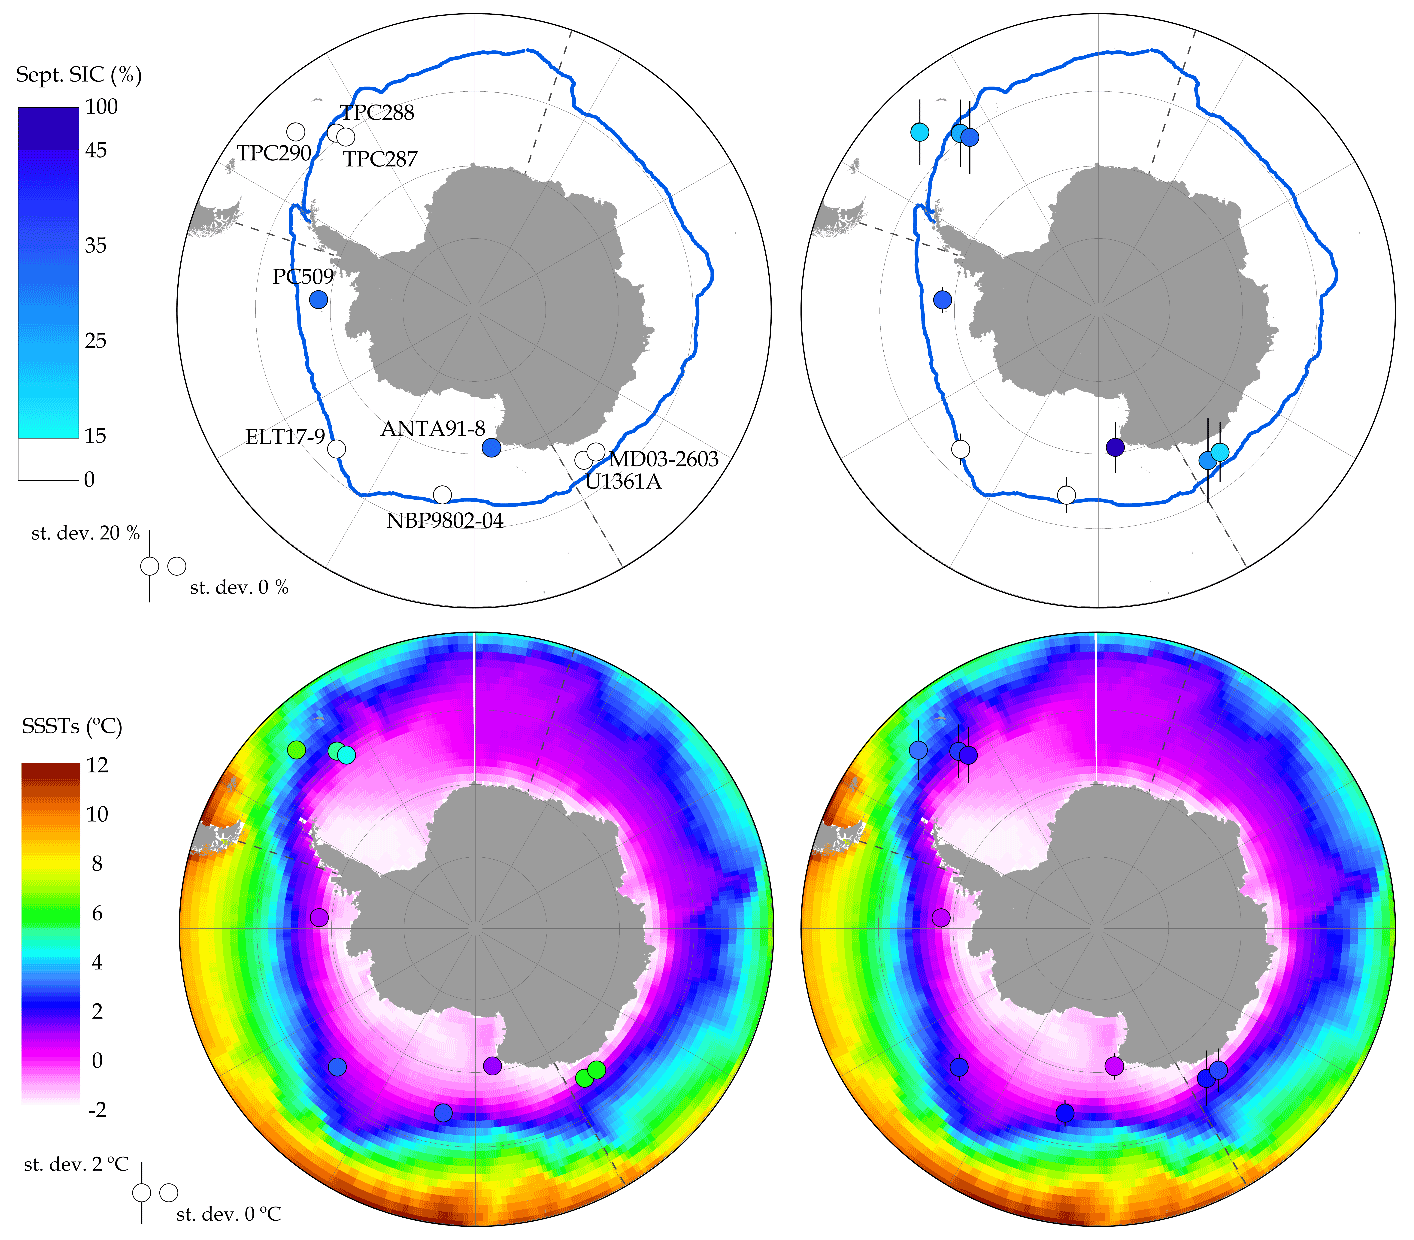
Figure 5Maps of MIS 5e SSSTs and September SICs for the nine core sites compared with the modern conditions. On all maps the SO sector boundaries are marked with dashed lines. Top left: minimum MIS 5e September SIC for each core site (coloured circles) compared to the modern (1981–2010) 15 % September sea-ice extent (blue line) (Fetterer et al., 2017). Top right: average MIS 5e September SICs (coloured circles) and standard deviations (vertical bars) at each core site compared to the modern (1981–2010) 15 % September sea-ice extent (blue line) (Fetterer et al., 2017). Bottom left: maximum MIS 5e SSSTs for each core site (coloured circles) compared to modern (January–March, 1980–2019) SSSTs (Hersbach et al., 2019). Bottom right: average MIS 5e SSSTs (coloured circles) and standard deviations (vertical bars) for each core site compared to modern (January–March, 1980–2019) SSSTs (Hersbach et al., 2019). Core data are given in Table S1.
In the East Indian sector, core MD03-2603 has an average MIS 5e September SIC (25 ± 18 %) and FCC relative abundance (3.2 ± 1 %) indicative of a location just south of the mean WSIE (Figs. 3 and 5) but with multiple maxima and minima contributing to the high variability. MIS 5e September SICs and FCC relative abundances in the nearby core U1361A indicate that it was located within the seasonal sea-ice zone from 132–126 ka before the mean WSIE retreated to the south of this location (Figs. 3 and S3). The different patterns in MIS 5e September SIC and SSSTs between cores MD03-2603 and U1361A are likely due to the different age resolution of the samples, with two of the September SIC maxima in MD03-2603 occurring in the 129–127 ka interval coincident with the U1361A September SIC maximum and, likewise, two of the September SIC minima in MD03-2603 occurring in the 124–121 ka period concurrent with the minimum September SIC in core U1361A (Fig. 3). The different age resolution of samples in MD03-2603 and U1361A is primarily due to the lower sedimentation rate (Table 2) at site U1361A, and thus a sample from this core spans more time than in core MD03-2603.
None of the Pacific sector cores show pronounced minima or maxima in their MIS 5e FCC and September SIC records (Fig. 3), indicating a less variable WSIE in this sector compared to the Atlantic and Indian sectors (Fig. 3). The Pacific sector cores PC509 and ANTA91-8 are also the only cores in this study which are covered by WSI for the entirety of MIS 5e (Figs. 3 and 5). The position of these cores south of the mean WSIE throughout MIS 5e is significant as they are the first published marine records from within the seasonal sea-ice zone able to constrain the poleward limit of the MIS 5e minimum WSIE (Chadwick et al., 2020). Cores ELT17-9 and NBP9802-04 are the only records in this study with average MIS 5e September SICs < 15 % (Fig. 5), indicating they were located north of the mean WSIE for the majority of the 132–120 ka period, with core ELT17-9 having been located closer to the MIS 5e mean WSIE. The FCC relative abundances for cores ELT17-9 and NBP9802-04 also indicate that both sites were predominantly positioned north of the mean WSIE during MIS 5e (Fig. 3) but suggest that core NBP9802-04 was located closer to the MIS 5e mean WSIE.
The reconstructed MIS 5e September SICs for site ELT17-9 are higher than for site NBP9802-04 (Fig. 3), which is likely related to the higher abundance of Chaetoceros rs. in core ELT17-9 when compared to core NBP9802-04 (Chadwick and Allen, 2021b, d). The Chaetoceros rs. group is associated with both WSI (Armand et al., 2005) and meltwater stratification (Crosta et al., 1997), and high abundances of Chaetoceros rs. in Ross Sea sediments deposited during past interglacial periods have been linked to increased upwelling and subsequent meltwater stratification within the Ross Sea Gyre (Kim et al., 2020). The high Chaetoceros rs. abundance in core ELT17-9 during MIS 5e could therefore indicate a north-eastward shift of the Ross Sea Gyre from its modern-day position (Dotto et al., 2018) and an accompanying displacement of meltwater circulation (Merino et al., 2016) and the WSI edge in the Pacific sector. It is also possible that the reduced Pacific sector WSIE during MIS 5e is associated with earlier seasonal sea-ice retreat during the austral spring and a longer open-ocean season, promoting a stronger spring bloom signal, of which the Chaetoceros group is a major component (Leventer, 1991).
The average MIS 5e SSSTs in the nine cores are ∼ 1–2 ∘C warmer than the modern SSSTs (Fig. 5), consistent with the SST anomalies presented in Chadwick et al. (2020) and Capron et al. (2014). However, the SSST records in the Atlantic and East Indian sectors have large variability with maximum SSSTs that are 2–4 ∘C higher than the MIS 5e average SSSTs (Fig. 5). Maximum MIS 5e SSSTs in the Atlantic and East Indian sectors were therefore ∼ 3–5 ∘C warmer than modern SSSTs (Fig. 5), which is a much larger SSST anomaly than in the Antarctic zone records presented in Chadwick et al. (2020) and marks a ∼ 5∘ latitude poleward shift in SSST isotherms relative to the present. Unlike the Atlantic and East Indian sectors, the Pacific sector core records indicate low variability in MIS 5e SSSTs with peak values 0–2 ∘C warmer than present (Fig. 5), marking a poleward shift in SSST isotherms of < 3∘ latitude.
Within their chronological uncertainties (Table 2), cores TPC288, TPC287, MD03-2603, ELT17-9, NBP9802-04 and PC509 all reach minimum MIS 5e September SICs synchronously (Table S1) and coincident with the peak in Antarctic air temperatures and minimum in EPICA Dome C (EDC) sea-salt sodium flux (Nass) at ∼ 128 ± 1.5 ka (Holloway et al., 2017; Wolff et al., 2006). The two East Indian sector core records reach a minimum MIS 5e WSIE (and maximum SSST in core U1361A) ∼ 4.5 ka after the Nass minimum in Antarctic ice cores, which is outside the combined chronological uncertainties of the sediment cores (Table 2) and AICC2012 ice-core chronology (Bazin et al., 2013). Although the duration of the SSST maximum, and accompanying WSIE minimum, in core MD03-2603 is short, it occurs within chronological error of the maximum air temperatures in Antarctic ice cores (Figs. 3 and 4).
Satellite era trends in Antarctic winter SIC (Hobbs et al., 2016) are largely consistent with the patterns observed during MIS 5e. Northern Weddell Sea winter SIC has declined by 5 %–10 % per decade in the satellite era (Hobbs et al., 2016) indicating a sensitivity to warming consistent with the early retreat of MIS 5e sea ice in this region. Similarly, winter SICs in the Pacific sector have remained stable, or even slightly increased, during the satellite era (Hobbs et al., 2016), which is in agreement with the stability of the Pacific sector WSIE throughout MIS 5e. In recent decades, Bellingshausen Sea summer sea ice has decreased, whilst WSIE has stayed stable (Hobbs et al., 2016; Parkinson, 2019). The MIS 5e September SICs and SSSTs (as a proxy for summer sea ice) imply that the MIS 5e WSIE in the Bellingshausen Sea is similar to the modern but the summer sea-ice extent was reduced. The northern part of the Ross Sea is a region in which the modern and MIS 5e trends differ, with recent winter SIC increases of 10 %–15 % per decade contrasting with the MIS 5e WSIE reduction observed at site NBP9802-04.
During MIS 5e the three SO sectors display heterogeneous responses in WSIE and SSSTs, which may guide our predictions of the impact of future warming on the Antarctic region. The prominent early (131–130 ka) minimum in WSIE and coinciding maximum in SSSTs for the two southerly Atlantic sector cores (TPC288 and TPC287, Fig. 3) are associated with a mean WSI edge located at least 3–5∘ south of its modern position. This substantial reduction in WSIE and seasonal sea-ice cover would have reduced brine rejection and likely decreased the rates of deepwater and bottom-water formation in the Weddell Sea, causing a warming of the abyssal waters (Bouttes et al., 2010; Marzocchi and Jansen, 2019). Deepwater warming would have promoted the basal melting and retreat of Weddell Sea ice shelves and marine-terminating ice streams and caused substantial Antarctic ice-sheet mass loss (Hellmer et al., 2012; Rignot et al., 2019; Wahlin et al., 2021). We hypothesize that substantial mass loss from the Weddell Sea sector of the WAIS (Turney et al., 2020) drove the Atlantic sector WSI resurgence at ∼ 126 ± 2.6 ka, as suggested by the model experiments of Menviel et al. (2010), and contributed to the global sea-level rise at this time (Kopp et al., 2013; Sime et al., 2019).
Variations in the WSIE and SSST records between the East Indian sector cores MD03-2603 and U1361A are due to the differences in sampling resolution, with the MD03-2603 record indicating multiple relatively short-duration WSIE and SSST oscillations during MIS 5e. The U1361A record seems to present an averaged signal of these oscillations with a greater frequency of warm periods with reduced WSIE after 125 ± 2.7 ka. Along the modern Wilkes Land margin the Antarctic Circumpolar Current (ACC) flows much closer to the continent than in other regions (Tamsitt et al., 2017), and the MIS 5e record in core MD03-2603 could therefore suggest multiple intervals when the ACC was displaced to the south of its modern position. A more southerly ACC in this region would have caused a poleward shift in precipitation fields and resulted in drier conditions across southern Australia (Liu and Curry, 2010; Saunders et al., 2012), a trend that can already be observed under a modern warming climate (CSIRO, 2018). A southerly shift of the ACC would also increase the advection of warmer Circumpolar Deep Water onto the Antarctic continental shelf (Fogwill et al., 2014), promoting periods of high basal melting and ice-sheet retreat in Wilkes Land during MIS 5e, as supported by Wilson et al. (2018).
In contrast to the Atlantic and East Indian sectors, the Pacific sector records indicate a more stable WSIE throughout MIS 5e. The MIS 5e September SIC records of cores ELT17-9 and NBP9802-04 indicate a poleward shift in the mean WSI edge by at least 2∘ latitude relative to the modern. The PC509 record indicates a southerly shift in the mean WSI edge by < 2∘ latitude. This highlights a seemingly greater resilience of sea ice in the Bellingshausen Sea, with the WSI edge remaining north of 68∘ S throughout MIS 5e, possibly in response to major glacial meltwater release from the Bellingshausen Sea drainage basin of the WAIS. In the modern Pacific sector the WSIE is strongly constrained by the southern extent of the ACC and the configuration of the Ross Sea Gyre (Benz et al., 2016; Nghiem et al., 2016). An uneven poleward constriction of the ACC across the Pacific sector during MIS 5e could therefore help explain the differing WSI retreat in this sector, with greater poleward migration of the ACC and reduction in the Ross Sea Gyre northward extent in the western Pacific sector than in the eastern Pacific sector. However, unlike in the East Indian sector, there is no evidence for millennial-scale migration of the ACC across the Pacific sector. The stable and persistent WSIE in the Pacific sector during MIS 5e may have resulted from major WAIS deglaciation (Menviel et al., 2010) but then protected further melting of ice shelves in the Ross, Amundsen and Bellingshausen seas, which buttressed ice grounded further upstream (Massom et al., 2018). This buttressing may have acted as a stabilizing factor preventing total loss of the WAIS during MIS 5e, with the majority of its deep subglacial basins terminating in the Ross, Amundsen and Bellingshausen seas (Gardner et al., 2018).
The sensitivity of Weddell Sea WSI to warmer climates could have substantial implications for the SO biosphere given the high rates of primary productivity in this region today (Vernet et al., 2019). Whilst a future reduction in WSIE and increase in glacial meltwater flux would be expected to promote primary productivity in the western part of the Weddell Sea (de Jong et al., 2012), the higher SSTs would not favour key trophic intermediaries, e.g. Antarctic krill (Euphausia superba) (Atkinson et al., 2017; Siegel and Watkins, 2016), and would therefore negatively affect megafauna at higher trophic levels (Hill et al., 2013). The impacts of warming and reduced WSIE on the SO food web are seen along the Antarctic Peninsula in the present day, with a recent shift in phytoplankton community structure from diatoms to smaller cryophytes, which are less efficiently grazed by Antarctic krill (Mendes et al., 2018; Moline et al., 2004). Future WSI edge retreat, at levels equivalent to MIS 5e, would also negatively impact modern sea-ice obligate species, such as emperor and Adélie penguins (Cimino et al., 2013; Jenouvrier et al., 2005).
Similarly to the modern SO (Parkinson, 2019), WSIE trends during MIS 5e show both spatial and temporal heterogeneity. The Atlantic and East Indian sectors display more variable WSIE and SSTs during MIS 5e than the Pacific sector. High Atlantic sector environmental variability during MIS 5e is attributed to high glacial meltwater release from the Weddell Sea drainage sector of the WAIS, whereas the high variability in the East Indian sector is attributed to large latitudinal migrations of the ACC flow bands occurring on a millennial timescale. In contrast, the stability of the Pacific sector WSIE may be due to the local bathymetric pinning of the ACC limiting the possible poleward displacement of the ACC during MIS 5e.
The greater MIS 5e WSIE reduction in the Atlantic sector compared to the Pacific sector is consistent with recent model simulations (Holloway et al., 2017). Most of the core records in this study reach their minimum WSIE at the same time, i.e. within chronological uncertainties, as the 128 ± 1.5 ka minimum in Antarctic ice-core Nass flux (Wolff et al., 2006), with only cores TPC290 and U1361A indicating a later WSIE minimum (Figs. 3 and S3). The apparent high sensitivity of Weddell Sea WSIE, and apparent resilience of Bellingshausen Sea WSIE, to warmer-than-present climates is unexpected from the recent observational trends (Hobbs et al., 2016; Parkinson, 2019) but may be related to regionally variable influx of glacial meltwater and its advection around the Antarctic continent. Our study highlights the importance of reconstructing palaeoenvironmental conditions around Antarctica during past warm periods, such as MIS 5e, for understanding how the Antarctic and SO regions respond to warmer climates on longer than decadal timescales.
Full diatom count data for all samples are available from the NERC EDS UK Polar Data Centre (https://doi.org/10.5285/BDA782A6-E89A-41A6-8791-F28001BC5D11, Chadwick and Allen, 2021a; https://doi.org/10.5285/05DB2C67-99F0-4556-86BF-58B0E84F4CD7, Chadwick and Allen, 2021b; https://doi.org/10.5285/410F4E27-3214-466F-9DE3-E19848D8C5C2, Chadwick and Allen, 2021c; https://doi.org/10.5285/6106DABC-51AF-41C5-866C-CE8C9E401FD9, Chadwick and Allen, 2021d; https://doi.org/10.5285/324137D3-CFC5-4CF6-A360-1A293A3E9ED6, Chadwick and Allen, 2021e; https://doi.org/10.5285/F8F7BBF7-BD86-45E5-BF22-F7FC327C94BF, Chadwick and Allen, 2021f; https://doi.org/10.5285/A1A6A674-823E-46F9-B345-6635A0E04220, Chadwick and Allen, 2021g; https://doi.org/10.5285/D7C00BEA-659A-426E-942F-821F6517C449, Chadwick and Allen, 2021h; https://doi.org/10.5285/FE815073-28EE-462D-BEE3-09E0DA2F3866, Chadwick and Allen, 2021i). September SIC and SSST data for all samples, produced using the MAT transfer function, are available from PANGAEA (https://doi.org/10.1594/PANGAEA.936573, Chadwick et al., 2021).
Sediment sample material for core NBP9802-04 (http://igsn.org/DSR0003YW, last access: 18 January 2022; Anderson et al., 1998) is available from the Lamont–Doherty Core Repository at Columbia University (corelab@ldeo.columbia.edu).
The supplement related to this article is available online at: https://doi.org/10.5194/cp-18-129-2022-supplement.
MC was responsible for data curation, investigation, visualization, and writing – original draft preparation. CSA was responsible for conceptualization, project administration, resources, supervision, and writing – review and editing. LCS was responsible for conceptualization, supervision, and writing – review and editing. XC was responsible for formal analysis, methodology, resources, and writing – review and editing. CDH provided resources and was responsible for writing – review and editing.
The contact author has declared that neither they nor their co-authors have any competing interests.
Publisher's note: Copernicus Publications remains neutral with regard to jurisdictional claims in published maps and institutional affiliations.
This article is part of the special issue “Reconstructing Southern Ocean sea-ice dynamics on glacial-to-historical timescales”. It is not associated with a conference.
The British Ocean Sediment Core Research Facility (BOSCORF) is thanked for supplying sediment samples for core TPC287 and multi-sensor core logging of core PC509. We thank the Lamont–Doherty Core Repository of the Lamont–Doherty Earth Observatory for providing sediment sample material for core NBP9802-04 (IGSN – DSR0003YW). The International Ocean Discovery Program (IODP) is thanked for providing the sample material for core U1361A. We also thank the Oregon State University Marine and Geology Repository for providing sediment samples for core ELT17-9, the Sorting Centre of MNA-Trieste (Italy) for providing sediment samples for core ANTA91-8, and Simon J. Crowhurst from the Department of Earth Sciences, University of Cambridge (UK), for X-ray fluorescence scanning of core PC509. This research contributes to the British Antarctic Survey's “Polar Science for Planet Earth” programme.
This research has been supported by the Natural Environment Research Council (grant no. NE/L002531/1).
This paper was edited by Juliane Müller and reviewed by Oliver Esper and one anonymous referee.
Abernathey, R. P., Cerovecki, I., Holland, P. R., Newsom, E., Mazloff, M., and Talley, L. D.: Water-mass transformation by sea ice in the upper branch of the Southern Ocean overturning, Nat. Geosci., 9, 596–601, 2016.
Anderson, R., Kalk, P., Froelich, F., Flleisher, M., Bouchard, G., and Schwartz, R.: PA9802-04-01, Lamont-Doherty Core Repository at Columbia University (LDCR) [sample], available at: http://igsn.org/DSR0003YW (last access: 18 January 2022), 1998.
Armand, L. and Leventer, A.: Palaeo sea ice distribution and reconstruction derived from the geological records, in: Sea Ice, 2nd edn., edited by: Thomas, D. N. and Dieckmann, G. S., Wiley-Blackwell, https://doi.org/10.1002/9781444317145.ch13, 2010.
Armand, L. K., Crosta, X., Romero, O., and Pichon, J.-J.: The biogeography of major diatom taxa in Southern Ocean sediments: 1. Sea ice related species, Palaeogeogr. Palaeocl., 223, 93–126, 2005.
Atkinson, A., Hill, S. L., Pakhomov, E. A., Siegel, V., Anadon, R., Chiba, S., Daly, K. L., Downie, R., Fielding, S., Fretwell, P., Gerrish, L., Hosie, G. W., Jessopp, M. J., Kawaguchi, S., Krafft, B. A., Loeb, V., Nishikawa, J., Peat, H. J., Reiss, C. S., Ross, R. M., Quetin, L. B., Schmidt, K., Steinberg, D. K., Subramaniam, R. C., Tarling, G. A., and Ward, P.: KRILLBASE: a circumpolar database of Antarctic krill and salp numerical densities, 1926–2016, Earth Syst. Sci. Data, 9, 193–210, https://doi.org/10.5194/essd-9-193-2017, 2017.
Bareille, G., Grousset, F. E., Labracherie, M., Labeyrie, L. D., and Petit, J.-R.: Origin of detrital fluxes in the southeast Indian Ocean during the last climatic cycles, Paleoceanography, 9, 799–819, 1994.
Bazin, L., Landais, A., Lemieux-Dudon, B., Toyé Mahamadou Kele, H., Veres, D., Parrenin, F., Martinerie, P., Ritz, C., Capron, E., Lipenkov, V., Loutre, M.-F., Raynaud, D., Vinther, B., Svensson, A., Rasmussen, S. O., Severi, M., Blunier, T., Leuenberger, M., Fischer, H., Masson-Delmotte, V., Chappellaz, J., and Wolff, E.: An optimized multi-proxy, multi-site Antarctic ice and gas orbital chronology (AICC2012): 120–800 ka, Clim. Past, 9, 1715–1731, https://doi.org/10.5194/cp-9-1715-2013, 2013.
Benz, V., Esper, O., Gersonde, R., Lamy, F., and Tiedemann, R.: Last Glacial Maximum sea surface temperature and sea-ice extent in the Pacific sector of the Southern Ocean, Quaternary Sci. Rev., 146, 216–237, 2016.
Bianchi, C. and Gersonde, R.: The Southern Ocean surface between Marine Isotope Stages 6 and 5d: Shape and timing of climate changes, Palaeogeogr. Palaeocl., 187, 151–177, 2002.
Bintanja, R., van Oldenborgh, G. J., Drijfhout, S. S., Wouters, B., and Katsman, C. A.: Important role for ocean warming and increased ice-shelf melt in Antarctic sea-ice expansion, Nat. Geosci., 6, 376–379, 2013.
Bouttes, N., Paillard, D., and Roche, D. M.: Impact of brine-induced stratification on the glacial carbon cycle, Clim. Past, 6, 575–589, https://doi.org/10.5194/cp-6-575-2010, 2010.
Brambati, A., Melis, R., Quaia, T., and Salvi, G.: Late Quaternary climatic changes in the Ross Sea area, Antarctica, in: Antarctica at the close of a Millenium, edited by: Gamble, J. A., Skinner, D. N. B., and Henrys, S., 35, Proceedings Volume 8th International Symposium on Antarctic Earth Sciences, July 1999, Royal Society of New Zealand Bulletin, Wellington, New Zealand, ISBN 1877264067, 2002.
Bronselaer, B., Winton, M., Griffies, S. M., Hurlin, W. J., Rodgers, K. B., Sergienko, O. V., Stouffer, R. J., and Russell, J. L.: Change in future climate due to Antarctic meltwater, Nature, 564, 53–58, 2018.
Burckle, L. H., Robinson, D., and Cooke, D.: Reappraisal of sea-ice distribution in Atlantic and Pacific sectors of the Southern Ocean at 18 000 yr BP, Nature, 299, 435–437, 1982.
Burckle, L. H., Jacobs, S. S., and McLaughlin, R. B.: Late austral spring diatom distribution between New Zealand and the Ross Ice Shelf, Antarctica: hydrography and sediment correlations, Micropaleontology, 33, 74–81, 1987.
Capron, E., Govin, A., Stone, E. J., Masson-Delmotte, V., Mulitza, S., Otto-Bliesner, B., Rasmussen, T. L., Sime, L. C., Waelbroeck, C., and Wolff, E. W.: Temporal and spatial structure of multi-millennial temperature changes at high latitudes during the Last Interglacial, Quaternary Sci. Rev., 103, 116–133, 2014.
Capron, E., Govin, A., Feng, R., Otto-Bliesner, B. L., and Wolff, E. W.: Critical evaluation of climate syntheses to benchmark CMIP6/PMIP4 127 ka Last Interglacial simulations in the high-latitude regions, Quaternary Sci. Rev., 168, 137–150, 2017.
Ceccaroni, L., Frank, M., Frignani, M., Langone, L., Ravaioli, M., and Mangini, A.: Late Quaternary fluctuations of biogenic component fluxes on the continental slope of the Ross Sea, Antarctica, J. Marine Syst., 17, 515–525, 1998.
Chadwick, M.: Southern Ocean surface sediment diatom abundances, in: Mendeley Data, Mendeley Data [data set], https://doi.org/10.17632/2tnxcww6c8.1, 2020.
Chadwick, M. and Allen, C. S.: Marine Isotope Stage 5e diatom assemblages in marine sediment core ANTA91-8 (−70.78 degN, 172.83 degE, Cruise ANTA91) – VERSION 2, NERC EDS UK Polar Data Centre [data set], https://doi.org/10.5285/BDA782A6-E89A-41A6-8791-F28001BC5D11, 2021a.
Chadwick, M. and Allen, C. S.: Marine Isotope Stage 5e diatom assemblages in marine sediment core ELT17-9 (−63.08 degN, −135.12 degE, Cruise ELT17), UK Polar Data Centre, Natural Environment Research Council, UK Research & Innovation [data set], https://doi.org/10.5285/05DB2C67-99F0-4556-86BF-58B0E84F4CD7, 2021b.
Chadwick, M. and Allen, C. S.: Marine Isotope Stage 5e diatom assemblages in marine sediment core MD03-2603 (−64.28 degN, 139.38 degE, Cruise MD130), UK Polar Data Centre, Natural Environment Research Council, UK Research & Innovation [data set], https://doi.org/10.5285/410F4E27-3214-466F-9DE3-E19848D8C5C2, 2021c.
Chadwick, M. and Allen, C. S.: Marine Isotope Stage 5e diatom assemblages in marine sediment core NBP9802-04 (−64.20 degN, −170.08 degE, Cruise PA9802), UK Polar Data Centre, Natural Environment Research Council, UK Research & Innovation [data set], https://doi.org/10.5285/6106DABC-51AF-41C5-866C-CE8C9E401FD9, 2021d.
Chadwick, M. and Allen, C. S.: Marine Isotope Stage 5e diatom assemblages in marine sediment core PC509 (−68.31 degN, −86.03 degE, Cruise JR179), UK Polar Data Centre, Natural Environment Research Council, UK Research & Innovation [data set], https://doi.org/10.5285/324137D3-CFC5-4CF6-A360-1A293A3E9ED6, 2021e.
Chadwick, M. and Allen, C. S.: Marine Isotope Stage 5e diatom assemblages in marine sediment core TPC287 (−60.31 degN, −36.65 degE, Cruise JR48), UK Polar Data Centre, Natural Environment Research Council, UK Research & Innovation [data set], https://doi.org/10.5285/F8F7BBF7-BD86-45E5-BF22-F7FC327C94BF, 2021f.
Chadwick, M. and Allen, C. S.: Marine Isotope Stage 5e diatom assemblages in marine sediment core TPC288 (−59.14 degN, −37.96 degE, Cruise JR48), UK Polar Data Centre, Natural Environment Research Council, UK Research & Innovation [data set], https://doi.org/10.5285/A1A6A674-823E-46F9-B345-6635A0E04220, 2021g.
Chadwick, M. and Allen, C. S.: Marine Isotope Stage 5e diatom assemblages in marine sediment core TPC290 (−55.55 degN, −45.02 degE, Cruise JR48), UK Polar Data Centre, Natural Environment Research Council, UK Research & Innovation [data set], https://doi.org/10.5285/D7C00BEA-659A-426E-942F-821F6517C449, 2021h.
Chadwick, M. and Allen, C. S.: Marine Isotope Stage 5e diatom assemblages in marine sediment core U1361A (−64.41 degN, 143.89 degE, IODP Exp. 318), UK Polar Data Centre, Natural Environment Research Council, UK Research & Innovation [data set], https://doi.org/10.5285/FE815073-28EE-462D-BEE3-09E0DA2F3866, 2021i.
Chadwick, M., Allen, C. S., Sime, L. C., and Hillenbrand, C. D.: Analysing the timing of peak warming and minimum winter sea-ice extent in the Southern Ocean during MIS 5e, Quaternary Sci. Rev., 229, 106134, https://doi.org/10.1016/j.quascirev.2019.106134, 2020.
Chadwick, M., Allen, C. S., and Crosta, X.: MIS 5e Southern Ocean September sea-ice concentrations and summer sea-surface temperatures reconstructed from marine sediment cores using a MAT diatom transfer function, PANGAEA [data set], https://doi.org/10.1594/PANGAEA.936573, 2021.
Chadwick, M., Allen, C. S., Sime, L. C., Crosta, X., and Hillenbrand, C.-D.: How does the Southern Ocean palaeoenvironment during Marine Isotope Stage 5e compare to the modern?, Mar. Micropaleontol., 170, 102066, https://doi.org/10.1016/j.marmicro.2021.102066, 2022.
Chase, Z., Anderson, R. F., Fleisher, M. Q., and Kubik, P. W.: Accumulation of biogenic and lithogenic material in the Pacific sector of the Southern Ocean during the past 40 000 years, Deep-Sea Res. Pt. II, 50, 799–832, 2003.
Cimino, M. A., Fraser, W. R., Irwin, A. J., and Oliver, M. J.: Satellite data identify decadal trends in the quality of Pygoscelis penguin chick-rearing habitat, Glob. Change Biol., 19, 136–148, 2013.
Civel-Mazens, M., Crosta, X., Cortese, G., Michel, E., Mazaud, A., Ther, O., Ikehara, M., and Itaki, T.: Antarctic Polar Front migrations in the Kerguelen Plateau region, Southern Ocean, over the past 360 kyrs, Global Planet. Change, 202, 103526, https://doi.org/10.1016/j.gloplacha.2021.103526, 2021.
Cremer, H., Roberts, D., McMinn, A., Gore, D., and Melles, M.: The Holocene Diatom Flora of Marine Bays in the Windmill Islands, East Antarctica, Bot. Mar., 46, 82–106, 2003.
Crosta, X., Pichon, J.-J., and Labracherie, M.: Distribution of Chaetoceros resting spores in modern peri-Antarctic sediments, Mar. Micropaleontol., 29, 283–299, 1997.
Crosta, X., Pichon, J. J., and Burckle, L. H.: Application of modern analog technique to marine Antarctic diatoms: Reconstruction of maximum sea-ice extent at the Last Glacial Maximum, Paleoceanography, 13, 284–297, 1998.
Crosta, X., Sturm, A., Armand, L., and Pichon, J.-J.: Late Quaternary sea ice history in the Indian sector of the Southern Ocean as recorded by diatom assemblages, Mar. Micropaleontol., 50, 209–223, 2004.
Crosta, X., Romero, O., Armand, L. K., and Pichon, J.-J.: The biogeography of major diatom taxa in Southern Ocean sediments: 2. Open ocean related species, Palaeogeogr. Palaeocl., 223, 66–92, 2005.
CSIRO: State of the Climate, Bureau of Meteorology, Australia, 1–24 pp., ISBN 978-1-925315-97-4, 2018.
de Jong, J., Schoemann, V., Lannuzel, D., Croot, P., de Baar, H., and Tison, J.-L.: Natural iron fertilization of the Atlantic sector of the Southern Ocean by continental shelf sources of the Antarctic Peninsula, J. Geophys. Res.-Biogeo., 117, G01029, https://doi.org/10.1029/2011JG001679, 2012.
Dotto, T. S., Naveira Garabato, A., Bacon, S., Tsamados, M., Holland, P. R., Hooley, J., Frajka-Williams, E., Ridout, A., and Meredith, M. P.: Variability of the Ross Gyre, Southern Ocean: Drivers and Responses Revealed by Satellite Altimetry, Geophys. Res. Lett., 45, 6195–6204, 2018.
Esper, O., Gersonde, R., and Kadagies, N.: Diatom distribution in southeastern Pacific surface sediments and their relationship to modern environmental variables, Palaeogeogr. Palaeocl., 287, 1–27, 2010.
Ferreira, D., Marshall, J., Bitz, C. M., Solomon, S., and Plumb, A.: Antarctic Ocean and Sea Ice Response to Ozone Depletion: A Two-Time-Scale Problem, J. Climate, 28, 1206–1226, 2015.
Fetterer, F., Knowles, K., Meier, W. N., Savoie, M., and Windnagel, A. K.: Sea Ice Index, Version 3. NSIDC: National Snow and Ice Data Center [data set], Boulder, Colorado, USA, https://doi.org/10.7265/N5K072F8, 2017.
Fischer, H., Meissner, K. J., Mix, A. C., Abram, N. J., Austermann, J., Brovkin, V., Capron, E., Colombaroli, D., Daniau, A.-L., Dyez, K. A., Felis, T., Finkelstein, S. A., Jaccard, S. L., McClymont, E. L., Rovere, A., Sutter, J., Wolff, E. W., Affolter, S., Bakker, P., Ballesteros-Cánovas, J. A., Barbante, C., Caley, T., Carlson, A. E., Churakova, O., Cortese, G., Cumming, B. F., Davis, B. A. S., de Vernal, A., Emile-Geay, J., Fritz, S. C., Gierz, P., Gottschalk, J., Holloway, M. D., Joos, F., Kucera, M., Loutre, M.-F., Lunt, D. J., Marcisz, K., Marlon, J. R., Martinez, P., Masson-Delmotte, V., Nehrbass-Ahles, C., Otto-Bliesner, B. L., Raible, C. C., Risebrobakken, B., Sánchez Goñi, M. F., Arrigo, J. S., Sarnthein, M., Sjolte, J., Stocker, T. F., Velasquez Alvárez, P. A., Tinner, W., Valdes, P. J., Vogel, H., Wanner, H., Yan, Q., Yu, Z., Ziegler, M., and Zhou, L.: Palaeoclimate constraints on the impact of 2 ∘C anthropogenic warming and beyond, Nat. Geosci., 11, 474–485, 2018.
Fogwill, C. J., Turney, C. S. M., Meissner, K. J., Golledge, N. R., Spence, P., Roberts, J. L., England, M. H., Jones, R. T., and Carter, L.: Testing the sensitivity of the East Antarctic Ice Sheet to Southern Ocean dynamics: past changes and future implications, J. Quaternary Sci., 29, 91–98, 2014.
Gardner, A. S., Moholdt, G., Scambos, T., Fahnstock, M., Ligtenberg, S., van den Broeke, M., and Nilsson, J.: Increased West Antarctic and unchanged East Antarctic ice discharge over the last 7 years, The Cryosphere, 12, 521–547, https://doi.org/10.5194/tc-12-521-2018, 2018.
Gersonde, R. and Zielinski, U.: The reconstruction of late Quaternary Antarctic sea-ice distribution – the use of diatoms as a proxy for sea-ice, Palaeogeogr. Palaeocl., 162, 263–286, 2000.
Gersonde, R., Crosta, X., Abelmann, A., and Armand, L.: Sea-surface temperature and sea ice distribution of the Southern Ocean at the EPILOG Last Glacial Maximum – a circum-Antarctic view based on siliceous microfossil records, Quaternary Sci. Rev., 24, 869–896, 2005.
Ghadi, P., Nair, A., Crosta, X., Mohan, R., Manoj, M. C., and Meloth, T.: Antarctic sea-ice and palaeoproductivity variation over the last 156 000 years in the Indian sector of Southern Ocean, Mar. Micropaleontol., 160, 101894, https://doi.org/10.1016/j.marmicro.2020.101894, 2020.
Goosse, H. and Zunz, V.: Decadal trends in the Antarctic sea ice extent ultimately controlled by ice–ocean feedback, The Cryosphere, 8, 453–470, https://doi.org/10.5194/tc-8-453-2014, 2014.
Govin, A., Michel, E., Labeyrie, L., Waelbroeck, C., Dewilde, F., and Jansen, E.: Evidence for northward expansion of Antarctic Bottom Water mass in the Southern Ocean during the last glacial inception, Paleoceanography, 24, PA1202, https://doi.org/10.1029/2008PA001603, 2009.
Govin, A., Braconnot, P., Capron, E., Cortijo, E., Duplessy, J.-C., Jansen, E., Labeyrie, L., Landais, A., Marti, O., Michel, E., Mosquet, E., Risebrobakken, B., Swingedouw, D., and Waelbroeck, C.: Persistent influence of ice sheet melting on high northern latitude climate during the early Last Interglacial, Clim. Past, 8, 483–507, https://doi.org/10.5194/cp-8-483-2012, 2012.
Govin, A., Capron, E., Tzedakis, P. C., Verheyden, S., Ghaleb, B., Hillaire-Marcel, C., St-Onge, G., Stoner, J. S., Bassinot, F., Bazin, L., Blunier, T., Combourieu-Nebout, N., El Ouahabi, A., Genty, D., Gersonde, R., Jimenez-Amat, P., Landais, A., Martrat, B., Masson-Delmotte, V., Parrenin, F., Seidenkrantz, M. S., Veres, D., Waelbroeck, C., and Zahn, R.: Sequence of events from the onset to the demise of the Last Interglacial: Evaluating strengths and limitations of chronologies used in climatic archives, Quaternary Sci. Rev., 129, 1–36, 2015.
Grobe, H., Mackensen, A., Hubberten, H.-W., Spiess, V., and Futterer, D. K.: Stable isotope record and Late Quaternary sedimentation rates at the Antarctic continental margin, in: Geological History of the Polar Oceans: Arctic versus Antarctic, edited by: Bleil, U. and Thiede, H., NATO ASI Series C, 308, Kluwer Academic Publishers, Dordrecht, the Netherlands, https://doi.org/10.1007/978-94-009-2029-3_31, 1990.
Guiot, J. and de Vernal, A.: Is spatial autocorrelation introducing biases in the apparent accuracy of paleoclimatic reconstructions?, Quaternary Sci. Rev., 30, 1965–1972, 2011.
Hall, A.: The Role of Surface Albedo Feedback in Climate, J. Climate, 17, 1550–1568, 2004.
Hellmer, H. H., Kauker, F., Timmermann, R., Determann, J., and Rae, J.: Twenty-first-century warming of a large Antarctic ice-shelf cavity by a redirected coastal current, Nature, 485, 225–228, 2012.
Hersbach, H., Bell, B., Berrisford, P., Biavati, G., Horanyi, A., Munoz Sabater, J., Nicolas, J., Peubey, C., Radu, R., Rozum, I., Schepers, D., Simmons, A., Soci, C., Dee, D., and Thepaut, J.-N.: ERA5 monthly averaged data on single levels from 1980 to 2019, Copernicus Climate Change Service (C3S) Climate Data Store (CDS) [data set], https://doi.org/10.24381/cds.f17050d7, 2019.
Hill, S. L., Phillips, T., and Atkinson, A.: Potential Climate Change Effects on the Habitat of Antarctic Krill in the Weddell Quadrant of the Southern Ocean, PLoS One, 8, e72246, https://doi.org/10.1371/journal.pone.0072246, 2013.
Hobbs, W. R., Massom, R., Stammerjohn, S., Reid, P., Williams, G., and Meier, W.: A review of recent changes in Southern Ocean sea ice, their drivers and forcings, Global Planet. Change, 143, 228–250, 2016.
Holloway, M. D., Sime, L. C., Allen, C. S., Hillenbrand, C.-D., Bunch, P., Wolff, E., and Valdes, P. J.: The spatial structure of the 128 ka Antarctic sea ice minimum, Geophys. Res. Lett., 44, 11129–11139, 2017.
Holloway, M. D., Sime, L. C., Singarayer, J. S., Tindall, J. C., and Valdes, P. J.: Simulating the 128-ka Antarctic Climate Response to Northern Hemisphere Ice Sheet Melting Using the Isotope-Enabled HadCM3, Geophys. Res. Lett., 45, 11921–11929, 2018.
IPCC: Summary for Policymakers, in: IPCC Special Report on the Ocean and Cryosphere in a Changing Climate, edited by: Portner, H. O., Roberts, D. C., Masson-Delmotte, V., Zhai, P., Tignor, M., Poloczanska, E., Mintenbeck, K., Alegria, A., Nicolai, M., Okem, A., Petzold, J., Rama, B., and Weyers, N. M., in press, 2019.
Jenouvrier, S., Barbraud, C., and Weimerskirch, H.: Long-term contrasted responses to climate of two Antarctic seabird species, Ecology, 86, 2889–2903, 2005.
Kang, S.-H. and Fryxell, G. A.: Fragilariopsis cylindrus (Grunow) Krieger: The most abundant diatom in water column assemblages of Antarctic marginal ice-edge zones, Polar Biol., 12, 609–627, 1992.
Kang, S.-H. and Fryxell, G. A.: Phytoplankton in the Weddell Sea, Antarctica: composition, abundance and distribution in water-column assemblages of the marginal ice-edge zone during austral autumn, Mar. Biol., 116, 335–348, 1993.
Kang, S.-H., Fryxell, G. A., and Roelke, D. L.: Fragilariopsis cylindrus compared with other species of the diatom family Bacillariaceae in Antarctic marginal ice-edge zones, Nova Hedwigia, 106, 335–352, 1993.
Kim, S., Lee, J. I., McKay, R. M., Yoo, K.-C., Bak, Y.-S., Lee, M. K., Roh, Y. H., Yoon, H. I., Moon, H. S., and Hyun, C.-U.: Late pleistocene paleoceanographic changes in the Ross Sea – Glacial-interglacial variations in paleoproductivity, nutrient utilization, and deep-water formation, Quaternary Sci. Rev., 239, 106356, https://doi.org/10.1016/j.quascirev.2020.106356, 2020.
King, J.: A resolution of the Antarctic paradox, Nature, 505, 491–492, 2014.
Kopp, R. E., Simons, F. J., Mitrovica, J. X., Maloof, A. C., and Oppenheimer, M.: Probabilistic assessment of sea level during the last interglacial stage, Nature, 462, 863–867, 2009.
Kopp, R. E., Simons, F. J., Mitrovica, J. X., Maloof, A. C., and Oppenheimer, M.: A probabilistic assessment of sea level variations within the last interglacial stage, Geophys. J. Int., 193, 711–716, 2013.
Leventer, A.: Sediment trap diatom assemblages from the northern Antarctic Peninsula region, Deep-Sea Res., 38, 1127–1143, 1991.
Lisiecki, L. E. and Raymo, M. E.: A Pliocene-Pleistocene stack of 57 globally distributed benthic δ18O records, Paleoceanography, 20, PA1003, https://doi.org/10.1029/2004PA001071, 2005.
Liu, J. and Curry, J. A.: Accelerated warming of the Southern Ocean and its impacts on the hydrological cycle and sea ice, Proc. Natl. Acad. Sci. USA, 107, 14987–14992, 2010.
Locarnini, R. A., Mishonov, A. V., Antonov, J. I., Boyer, T. P., Garcia, H. E., Baranova, O. K., Zweng, M. M., Paver, C. R., Reagan, J. R., Johnson, D. R., Hamilton, M., and Seidov, D.: World Ocean atlas 2013, volume 1: Temperature, https://doi.org/10.7289/V55X26VD, 2013.
Maksym, T.: Arctic and Antarctic Sea Ice Change: Contrasts, Commonalities, and Causes, Annu. Rev. Mar. Sci., 11, 187–213, 2019.
Marzocchi, A. and Jansen, M. F.: Global cooling linked to increased glacial carbon storage via changes in Antarctic sea ice, Nat. Geosci., 12, 1001–1005, 2019.
Massom, R. A., Scambos, T. A., Bennetts, L. G., Reid, P., Squire, V. A., and Stammerjohn, S. E.: Antarctic ice shelf disintegration triggered by sea ice loss and ocean swell, Nature, 558, 383–389, 2018.
Mendes, C. R. B., Tavano, V. M., Dotto, T. S., Kerr, R., de Souza, M. S., Garcia, C. A. E., and Secchi, E. R.: New insights on the dominance of cryptophytes in Antarctic coastal waters: A case study in Gerlache Strait, Deep-Sea Res. Pt. II, 149, 161–170, 2018.
Menviel, L., Timmermann, A., Timm, O. E., and Mouchet, A.: Climate and biogeochemical response to a rapid melting of the West Antarctic Ice Sheet during interglacials and implications for future climate, Paleoceanography, 25, PA4231, https://doi.org/10.1029/2009PA001892, 2010.
Meredith, M., Sommerkorn, M., Cassotta, S., Derksen, C., Ekaykin, A., Hollowed, A., Kofinas, G., Mackintosh, A., Melbourne-Thomas, J., Muelbert, M. M. C., Ottersen, G., Pritchard, H., and Schuur, E. A. G.: Polar Regions, in: IPCC Special Report on the Ocean and Cryosphere in a Changing Climate, edited by: Portner, H. O., Roberts, D. C., Masson-Delmotte, V., Zhai, P., Tignor, M., Poloczanska, E., Mintenbeck, K., Alegria, A., Nicolai, M., Okem, A., Petzold, J., Rama, B., and Weyers, N. M., in press, 2019.
Merino, N., Le Sommer, J., Durand, G., Jourdain, N. C., Madec, G., Mathiot, P., and Tournadre, J.: Antarctic icebergs melt over the Southern Ocean: Climatology and impact on sea ice, Ocean Model., 104, 99–110, 2016.
Merino, N., Jourdain, N. C., Le Sommer, J., Goosse, H., Mathiot, P., and Durand, G.: Impact of increasing antarctic glacial freshwater release on regional sea-ice cover in the Southern Ocean, Ocean Model., 121, 76–89, 2018.
Moline, M. A., Claustre, H., Frazer, T. K., Schofield, O., and Vernet, M.: Alteration of the food web along the Antarctic Peninsula in response to a regional warming trend, Glob. Change Biol., 10, 1973–1980, 2004.
Mulvaney, R., Abram, N. J., Hindmarsh, R. C., Arrowsmith, C., Fleet, L., Triest, J., Sime, L. C., Alemany, O., and Foord, S.: Recent Antarctic Peninsula warming relative to Holocene climate and ice-shelf history, Nature, 489, 141–144, 2012.
Nair, A., Mohan, R., Crosta, X., Manoj, M. C., Thamban, M., and Marieu, V.: Southern Ocean sea ice and frontal changes during the Late Quaternary and their linkages to Asian summer monsoon, Quaternary Sci. Rev., 213, 93–104, 2019.
Nghiem, S. V., Rigor, I. G., Clemente-Colón, P., Neumann, G., and Li, P. P.: Geophysical constraints on the Antarctic sea ice cover, Remote Sens. Environ., 181, 281–292, 2016.
Paillard, D., Labeyrie, L., and Yiou, P.: Macintosh program performs time-series analysis, Eos, 77, 379–379, https://doi.org/10.1029/96EO00259, 1996.
Parkinson, C. L.: A 40-y record reveals gradual Antarctic sea ice increases followed by decreases at rates far exceeding the rates seen in the Arctic, Proc. Natl. Acad. Sci. USA, 116, 14414–14423, 2019.
Parrenin, F., Masson-Delmotte, V., Kohler, P., Raynaud, D., Paillard, D., Schwander, J., Barbante, C., Landais, A., Wegner, A., and Jouzel, J.: Antarctic Temperature Stack (ATS) from five different ice cores (EDC, Vostok, Dome Fuji, TALDICE, and EDML), PANGAEA [data set], https://doi.org/10.1594/PANGAEA.810188, 2013a.
Parrenin, F., Masson-Delmotte, V., Kohler, P., Raynaud, D., Paillard, D., Schwander, J., Barbante, C., Landais, A., Wegner, A., and Jouzel, J.: Synchronisation of the LR04 stack with EDC isotopic variations on the EDC3 age scale, PANGAEA [data set], https://doi.org/10.1594/PANGAEA.810271, 2013b.
Presti, M., Barbara, L., Denis, D., Schmidt, S., De Santis, L., and Crosta, X.: Sediment delivery and depositional patterns off Adélie Land (East Antarctica) in relation to late Quaternary climatic cycles, Mar. Geol., 284, 96–113, 2011.
Pugh, R. S., McCave, I. N., Hillenbrand, C. D., and Kuhn, G.: Circum-Antarctic age modelling of Quaternary marine cores under the Antarctic Circumpolar Current: Ice-core dust–magnetic correlation, Earth Planet. Sc. Lett., 284, 113–123, 2009.
Purich, A., England, M. H., Cai, W., Chikamoto, Y., Timmermann, A., Fyfe, J. C., Frankcombe, L., Meehl, G. A., and Arblaster, J. M.: Tropical Pacific SST Drivers of Recent Antarctic Sea Ice Trends, J. Climate, 29, 8931–8948, 2016.
Rignot, E., Mouginot, J., Scheuchl, B., van den Broeke, M., van Wessem, M. J., and Morlighem, M.: Four decades of Antarctic Ice Sheet mass balance from 1979-2017, Proc. Natl. Acad. Sci. USA, 116, 1095–1103, 2019.
Rintoul, S. R.: The global influence of localized dynamics in the Southern Ocean, Nature, 558, 209–218, 2018.
Romero, O. E., Armand, L. K., Crosta, X., and Pichon, J. J.: The biogeography of major diatom taxa in Southern Ocean surface sediments: 3. Tropical/Subtropical species, Palaeogeogr. Palaeocl., 223, 49–65, 2005.
Rosenblum, E. and Eisenman, I.: Sea Ice Trends in Climate Models Only Accurate in Runs with Biased Global Warming, J. Climate, 30, 6265–6278, 2017.
Rysgaard, S., Bendtsen, J., Delille, B., Dieckmann, G. S., Glud, R. N., Kennedy, H., Mortensen, J., Papadimitriou, S., Thomas, D. N., and Tison, J.-L.: Sea ice contribution to the air–sea CO2 exchange in the Arctic and Southern Oceans, Tellus B, 63, 823–830, 2011.
Saunders, K. M., Kamenik, C., Hodgson, D. A., Hunziker, S., Siffert, L., Fischer, D., Fujak, M., Gibson, J. A. E., and Grosjean, M.: Late Holocene changes in precipitation in northwest Tasmania and their potential links to shifts in the Southern Hemisphere westerly winds, Global Planet. Change, 92–93, 82–91, 2012.
Scherer, R. P.: A new method for the determination of absolute abundance of diatoms and other silt-sized sedimentary particles, J. Paleolimnol., 12, 171–179, 1994.
Schweitzer, P. N.: Monthly average polar sea-ice concentration 1978 through 1991, in: U.S. Geological Survey Digital Data Series DDS-27, U.S. Geological Survey, Reston, Virginia, https://doi.org/10.3133/ds27, 1995.
Shemesh, A., Hodell, D., Crosta, X., Kanfoush, S., Charles, C., and Guilderson, T.: Sequence of events during the last deglaciation in Southern Ocean sediments and Antarctic ice cores, Paleoceanography, 17, 8-1–8-7, 2002.
Shukla, S. K., Crosta, X., and Ikehara, M.: Sea Surface Temperatures in the Indian Sub-Antarctic Southern Ocean for the Last Four Interglacial Periods, Geophys. Res. Lett., 48, e2020GL090994, https://doi.org/10.1029/2020GL090994, 2021.
Siegel, V. and Watkins, J. L.: Distribution, Biomass and Demography of Antarctic Krill, Euphausia superba, in: Biology and Ecology of Antarctic krill, edited by: Siegel, V., Advances in Polar Ecology, Springer, https://doi.org/10.1007/978-3-319-29279-3_2, 2016.
Sime, L. C., Carlson, A. E., and Holloway, M. D.: On recovering Last Interglacial changes in the Antarctic ice sheet, Past Global Changes Magazine, 27, 14–15, 2019.
Simpson, G.: Analogue Methods in Palaeoecology: Using the analogue Package, J. Stat. Softw., 22, 1–29, https://doi.org/10.18637/jss.v022.i02, 2007.
Stammerjohn, S. E., Martinson, D. G., Smith, R. C., Yuan, X., and Rind, D.: Trends in Antarctic annual sea ice retreat and advance and their relation to El Niño–Southern Oscillation and Southern Annular Mode variability, J. Geophys. Res., 113, C03S90, https://doi.org/10.1029/2007JC004269, 2008.
Stone, E. J., Capron, E., Lunt, D. J., Payne, A. J., Singarayer, J. S., Valdes, P. J., and Wolff, E. W.: Impact of meltwater on high-latitude early Last Interglacial climate, Clim. Past, 12, 1919–1932, https://doi.org/10.5194/cp-12-1919-2016, 2016.
Tamsitt, V., Drake, H. F., Morrison, A. K., Talley, L. D., Dufour, C. O., Gray, A. R., Griffies, S. M., Mazloff, M. R., Sarmiento, J. L., Wang, J., and Weijer, W.: Spiraling pathways of global deep waters to the surface of the Southern Ocean, Nat. Commun., 8, 172, https://doi.org/10.1038/s41467-017-00197-0, 2017.
Thomas, E. R., Allen, C. S., Etourneau, J., King, A. C. F., Severi, M., Winton, V. H. L., Mueller, J., Crosta, X., and Peck, V. L.: Antarctic Sea Ice Proxies from Marine and Ice Core Archives Suitable for Reconstructing Sea Ice over the Past 2000 Years, Geosciences, 9, 506, https://doi.org/10.3390/geosciences9120506, 2019.
Trathan, P. N., Brandon, M. A., Murphy, E. J., and Thorpe, S. E.: Transport and structure within the Antarctic Circumpolar Current to the north of South Georgia, Geophys. Res. Lett., 27, 1727–1730, 2000.
Turney, C. S. M., Fogwill, C. J., Golledge, N. R., McKay, N. P., van Sebille, E., Jones, R. T., Etheridge, D., Rubino, M., Thornton, D. P., Davies, S. M., Ramsey, C. B., Thomas, Z. A., Bird, M. I., Munksgaard, N. C., Kohno, M., Woodward, J., Winter, K., Weyrich, L. S., Rootes, C. M., Millman, H., Albert, P. G., Rivera, A., van Ommen, T., Curran, M., Moy, A., Rahmstorf, S., Kawamura, K., Hillenbrand, C. D., Weber, M. E., Manning, C. J., Young, J., and Cooper, A.: Early Last Interglacial ocean warming drove substantial ice mass loss from Antarctica, Proc. Natl. Acad. Sci. USA, 117, 3996–4006, 2020.
Veres, D., Bazin, L., Landais, A., Toyé Mahamadou Kele, H., Lemieux-Dudon, B., Parrenin, F., Martinerie, P., Blayo, E., Blunier, T., Capron, E., Chappellaz, J., Rasmussen, S. O., Severi, M., Svensson, A., Vinther, B., and Wolff, E. W.: The Antarctic ice core chronology (AICC2012): an optimized multi-parameter and multi-site dating approach for the last 120 thousand years, Clim. Past, 9, 1733–1748, https://doi.org/10.5194/cp-9-1733-2013, 2013.
Vernet, M., Geibert, W., Hoppema, M., Brown, P. J., Haas, C., Hellmer, H. H., Jokat, W., Jullion, L., Mazloff, M., Bakker, D. C. E., Brearley, J. A., Croot, P., Hattermann, T., Hauck, J., Hillenbrand, C. D., Hoppe, C. J. M., Huhn, O., Koch, B. P., Lechtenfeld, O. J., Meredith, M. P., Naveira Garabato, A. C., Nöthig, E. M., Peeken, I., Rutgers van der Loeff, M. M., Schmidtko, S., Schröder, M., Strass, V. H., Torres-Valdés, S., and Verdy, A.: The Weddell Gyre, Southern Ocean: Present Knowledge and Future Challenges, Rev. Geophys., 57, 623–708, 2019.
von Quillfeldt, C.: The diatom Fragilariopsis cylindrus and its potential as an indicator species for cold water rather than for sea ice, Vie et Milieu/Life & Environment, 54, 137–143, 2004.
Wahlin, A. K., Graham, A. G. C., Hogan, K. A., Queste, B. Y., Boehme, L., Larter, R. D., Pettit, E. C., Wellner, J., and Heywood, K. J.: Pathways and modification of warm water flowing beneath Thwaites Ice Shelf, West Antarctica, Sci. Adv., 7, eabd7254, https://doi.org/10.1126/sciadv.abd7254, 2021.
Walter, H. J., Hegner, E., Diekmann, B., Kuhn, G., and Rutgers van der Loeff, M. M.: Provenance and transport of terrigenous sediment in the South Atlantic Ocean and their relations to glacial and interglacial cycles: Nd and Sr isotopic evidence, Geochim. Cosmochim. Ac., 64, 3813–3827, 2000.
Warnock, J. P., Scherer, R. P., and Konfirst, M. A.: A record of Pleistocene diatom preservation from the Amundsen Sea, West Antarctica with possible implications on silica leakage, Mar. Micropaleontol., 117, 40–46, 2015.
Weber, M. E., Clark, P. U., Kuhn, G., Timmermann, A., Sprenk, D., Gladstone, R., Zhang, X., Lohmann, G., Menviel, L., Chikamoto, M. O., Friedrich, T., and Ohlwein, C.: Millennial-scale variability in Antarctic ice-sheet discharge during the last deglaciation, Nature, 510, 134–138, 2014.
Williams, T. J.: Investigating the circulation of Southern Ocean deep water masses over the last 1.5 million years by geochemical fingerprinting of marine sediments, PhD, Department of Earth Sciences, University of Cambridge, 213 pp., https://doi.org/10.17863/CAM.21086, 2018.
Wilson, D. J., Bertram, R. A., Needham, E. F., van de Flierdt, T., Welsh, K. J., McKay, R. M., Mazumder, A., Riesselman, C. R., Jimenez-Espejo, F. J., and Escutia, C.: Ice loss from the East Antarctic Ice Sheet during late Pleistocene interglacials, Nature, 561, 383–386, 2018.
Wolff, E. W., Fischer, H., Fundel, F., Ruth, U., Twarloh, B., Littot, G. C., Mulvaney, R., Rothlisberger, R., de Angelis, M., Boutron, C. F., Hansson, M., Jonsell, U., Hutterli, M. A., Lambert, F., Kaufmann, P., Stauffer, B., Stocker, T. F., Steffensen, J. P., Bigler, M., Siggaard-Andersen, M. L., Udisti, R., Becagli, S., Castellano, E., Severi, M., Wagenbach, D., Barbante, C., Gabrielli, P., and Gaspari, V.: Southern Ocean sea-ice extent, productivity and iron flux over the past eight glacial cycles, Nature, 440, 491–496, 2006.
Xiao, W., Esper, O., and Gersonde, R.: Last Glacial – Holocene climate variability in the Atlantic sector of the Southern Ocean, Quaternary Sci. Rev., 135, 115–137, 2016.
Zielinski, U.: Quantitative estimation of palaeoenvironmental parameters of the Antarctic Surface Water in the Late Quaternary using transfer functions with diatoms, Alfred Wegener Institute for Polar and Marine Research, Bremerhaven, https://doi.org/10013/epic.10127.d001, 1993.
Zielinski, U. and Gersonde, R.: Diatom distribution in Southern Ocean surface sediments (Atlantic sector): Implications for paleoenvironmental reconstructions, Palaeogeogr. Palaeocl., 129, 213–250, 1997.
Zielinski, U., Bianchi, C., Gersonde, R., and Kunz-Pirrung, M.: Last occurrence datums of the diatoms Rouxia leventerae and Rouxia constricta: indicators for marine isotope stages 6 and 8 in Southern Ocean sediments, Mar. Micropaleontol., 46, 127–137, 2002.
Zwally, H. J., Comiso, J. C., Parkinson, C. L., Cavalieri, D. J., and Gloersen, P.: Variability of Antarctic sea ice 1979–1998, J. Geophys. Res., 107, 3041, https://doi.org/10.1029/2000JC000733, 2002.