the Creative Commons Attribution 4.0 License.
the Creative Commons Attribution 4.0 License.
 | 17 May 2022
Quantifying and reducing researcher subjectivity in the generation of climate indices from documentary sources
George C. D. Adamson
David J. Nash
Stefan W. Grab
The generation of index-based series of meteorological phenomena, derived from narrative descriptions of weather and climate in historical documentary sources, is a common method to reconstruct past climatic variability and effectively extend the instrumental record. This study is the first to explicitly examine the degree of inter-rater variability in producing such series, a potential source of bias in index-based analyses. Two teams of raters were asked to produce a five-category annual rainfall index series for the same dataset, consisting of transcribed narrative descriptions of meteorological variability for 11 “rain years” in nineteenth-century Lesotho, originally collected by Nash and Grab (2010). One group of raters (n = 71) was comprised of students studying for postgraduate qualifications in climatology or a related discipline; the second group (n = 6) consisted of professional meteorologists and historical climatologists working in southern Africa. Inter-rater reliability was high for both groups at r = 0.99 for the student raters and r = 0.94 for the professional raters, although ratings provided by the student group disproportionately averaged to the central value (0: normal/seasonal rains) where variability was high. Back calculation of intraclass correlation using the Spearman–Brown prediction formula showed that a target reliability of 0.9 (considered “excellent” in other published studies) could be obtained with as few as eight student raters and four professional raters. This number reduced to two when examining a subset of the professional group (n = 4) who had previously published historical climatology papers on southern Africa. We therefore conclude that variability between researchers should be considered minimal where index-based climate reconstructions are generated by trained historical climatologists working in groups of two or more.
- Article
(2433 KB) - Full-text XML
- BibTeX
- EndNote


The generation of ordinal-scale indices from documentary sources is one of the most widely used approaches in historical climatology to transform raw weather descriptions into semi-quantitative data (Brázdil et al., 2010; Pfister et al., 2018). The index approach has been applied globally (apart from Antarctica) to reconstruct a variety of meteorological phenomena (Nash et al., 2021). Temperature is the most commonly analysed parameter, particularly for the Northern Hemisphere, with multi-centennial index-based series available for various parts of Europe (e.g. Pfister, 1984; Alexandre, 1987; Pfister, 1992; Brázdil and Kotyza, 1995; Ogilvie and Farmer, 1997; Dobrovolný et al., 2009; Glaser and Riemann, 2009; Camuffo et al., 2010), China (e.g. Wang et al., 2001) and the Americas (e.g. Baron et al., 1984; Baron, 1995). Precipitation is the second-most widely analysed variable, with notable regional series produced for parts of Europe (e.g. Van Engelen et al., 2001; Pfister et al., 2006; Rodrigo and Barriendos, 2008; Dobrovolný et al., 2015; Fernández-Fernández et al., 2015; Bauch et al., 2020), China (e.g. Ge et al., 2018), Africa (e.g. Nicholson et al., 2012; Norrgård, 2015; Nash et al., 2016; Nicholson et al., 2018), and Australia (Fenby and Gergis, 2013; Gergis and Ashcroft, 2013). Index-based series have also been generated for floods (e.g. Pfister, 1999; Glaser and Stangl, 2004; Prieto and Rojas, 2015; Salvisberg, 2017; Kiss, 2019), droughts (e.g. Brázdil et al., 2018; Erfurt and Glaser, 2019), snowfalls (e.g. Ge et al., 2003), storminess (e.g. Wang, 1980; Dominguez-Castro et al., 2019), dust fall (e.g. Fei et al., 2005), and sea-ice cover (Ogilvie and Jónsson, 2001). The reconstruction of climate indices is a useful tool for examining climate variability during the pre-instrumental period and is particularly valuable for regions, including many in the Global South, where lengthy meteorological records are lacking.
There is no consistent global approach to climate index generation (Nash et al., 2021), the closest being the method developed by Christian Pfister in the 1980s for the creation of Swiss temperature and precipitation series (Pfister, 1984), a method widely adopted across Europe and, in the case of rainfall reconstructions, across Africa (e.g. Vogel, 1989; Nash and Endfield, 2002), Australia (Fenby and Gergis, 2013), and India (Adamson and Nash, 2014). Pfister indices, as named by Mauelshagen (2010), are normally generated at a monthly level through the analysis of contemporary reports of climate and related conditions and, where available, biophysical proxies in historical records. Each month is placed into one of seven classes ranging from −3 (very cold/dry) to +3 (very warm/wet), which can then be added together to produce seasonal or annual series. The method for generating Pfister indices is mainly tailored to reconstructing temperature variability for regions with rich documentary evidence and long series of instrumental data (Pfister and Wanner, 2021). Central to the method – and, indeed, almost all index-based analyses of meteorological variables – is the identification of regionally relevant proxy data (e.g. plant-phenological observations, the duration of snow cover, and the freezing of water bodies) that can be used to allocate a specific month to a specific index category. So, for example, a relatively cold March in Switzerland would be one where historical observers described prolonged snow cover and frequent snowfalls, whereas a warm March would be characterized by no snowfall and the early flowering of sweet cherry trees (Pfister, 1992; Pfister et al., 2018). This approach has been adapted for regions with less rich documentary evidence or a seasonal skew to the available climate descriptions through a reduction in the number of index categories (e.g. to five or three classes) and/or the temporal resolution of the reconstruction (to seasonal or annual). The reconstruction of Pfister indices for precipitation is more challenging, since (i) rainfall often varies over smaller spatial scales than temperature, (ii) proxy data such as drought or flood magnitudes are less easy to calibrate, and (iii) the long instrumental series required for calibration are less common than those for temperature. The study by Dobrovolný et al. (2015) of precipitation variability over the last 500 years in central Europe, for example, only identified an acceptable level of reconstruction skill for seasonal precipitation indices in JJA and for annual precipitation values.
Index-based analyses contain two stages where potential biases can be introduced. First, where plant-phenological indicators are not available in historical sources, the classification of past meteorological conditions becomes entirely reliant on narrative descriptions of weather and related phenomena. Contemporary weather descriptions can be regarded as accurate representations of other places, on the basis that the writers were recording eye-witness accounts and had first-hand experiences (Duncan, 1997). However, all narrative accounts necessarily reflect the positionality and personal motivation of the observer as well as his/her intended audience (Brázdil et al., 2010). The spatiality of representation of “fact” also needs to be considered – individual observers may view weather and related environmental conditions for a specific place and time very differently, while an author's perception of his/her environment may change with increased familiarity and experience (Nash and Endfield, 2008). There can, as a result, be very different descriptions of the same weather “event” recorded by different observers or the same observer but at different times (Duncan and Gregory, 1999). A further factor of particular concern when weather descriptions are made by “non-local” authors relates to the nationality and background of correspondents. Unusual or extreme events are judged by individuals against a “normal” range of climate variations, itself a function of the lived experience of the individual and the extent of climate variability communicated through oral histories or historical knowledge (see Hassan, 2000). Finally, the “data filter of human recollection” may come into play (Bryson and Padoch, 1980, p. 585). Subjective references such as “this has been the wettest summer in memory” can only be considered in relation to the perceived normal and might record short-term, but probably not long-term, change. Many of these issues can be overcome by a source-critical approach to historical records and careful triangulation between observers, but not all (Brázdil et al., 2005).
The second area of potential bias in index-based analyses comes at the classification stage of index development – this is the primary focus of our study. Here, the accuracy of any index series depends upon the ability of the analyst to interpret and evaluate collections of raw weather descriptions and then categorize them into appropriate classes. As Nash et al. (2021) note, transforming information from historical documents to numbers on a scale requires considerable expertise to minimize subjectivity. Consequently, this should ideally be undertaken by researchers with a good scientific knowledge of the regional climate and an understanding of the language of the time period during which the sources were written. Nash et al. (2016) argue that, if resources allow, index series should ideally be developed by combining the independent classifications of more than one analyst, with qualitative confidence ratings given for each month, season, or year of the series, as appropriate (Kelso and Vogel, 2007). However, to date, the degree of subjectivity produced by a single analyst versus a group has never been explicitly tested.
This study aims to explore and quantify the degree of error between researchers assigning indices to the same historical documentary dataset and provide recommendations to reduce future bias in index-based series derived from documentary sources. The paper utilizes a documentary dataset produced for Lesotho by Nash and Grab (2010), derived primarily from missionary and colonial government descriptions of climate and climate-dependent phenomena during the late nineteenth century. Transcribed descriptive data relating to 11 “rain years” (see Sect. 2) were given to two teams of researchers (hereafter referred to as “raters”): 71 postgraduate students (“the student rater group”) and six professional meteorologists or historical climatologists (“the professional rater group”). Each rater was asked to generate rainfall indices for each rain year on a five-point classification scale. The paper calculates intraclass correlations (ICCs) for each group to determine (i) the degree of inter-rater reliability within the whole group and (ii) the number of raters required to achieve a target reliability. The paper discusses differences in ratings and interclass correlations between the professional and student rater groups and provides suggestions for minimizing researcher subjectivity in future index-derived reconstructions.
This study uses a dataset obtained from documentary-based narrative descriptions of rainfall variability collected for Lesotho (Nash and Grab, 2010). Lesotho is a mountainous country, landlocked within South Africa and situated within the Drakensberg range. Average annual rainfall varies from 735 mm a−1 in the lowlands to 1600 mm a−1 in the Drakensberg (Fig. 1). Approximately 80 % of rainfall occurs during the peak austral summer rainy season (December to February), associated with the convergence of easterly and westerly air masses bringing rainfall from the Indian and Atlantic oceans (Tyson, 1986; Sene et al., 1998). The winter months are dominated by high pressure over the central interior, with minimum rainfall from May to August. As the peak rainy season straddles more than 1 calendar year, Nash and Grab (2010) grouped the narrative descriptions according to rain year (encompassing the period July to June), rather than calendar year, to generate their rainfall reconstruction. Nash and Grab (2010) analysed materials from 76 rain years (1824–1900); of these 11 are used for our current analysis. The documentary materials analysed for the original study included letters, reports, and journals held in the archives of missionary societies in London, Oxford, and Maseru, newspapers held at archives in Morija, and government records held in various collections (Fig. 2). Passages that alluded to weather and/or climate conditions, either directly or indirectly (for example state of river flow and crops), were recorded verbatim, with French- and Sesotho-language materials translated into English. See Nash and Grab (2010) for full details of sources and data collection methods.
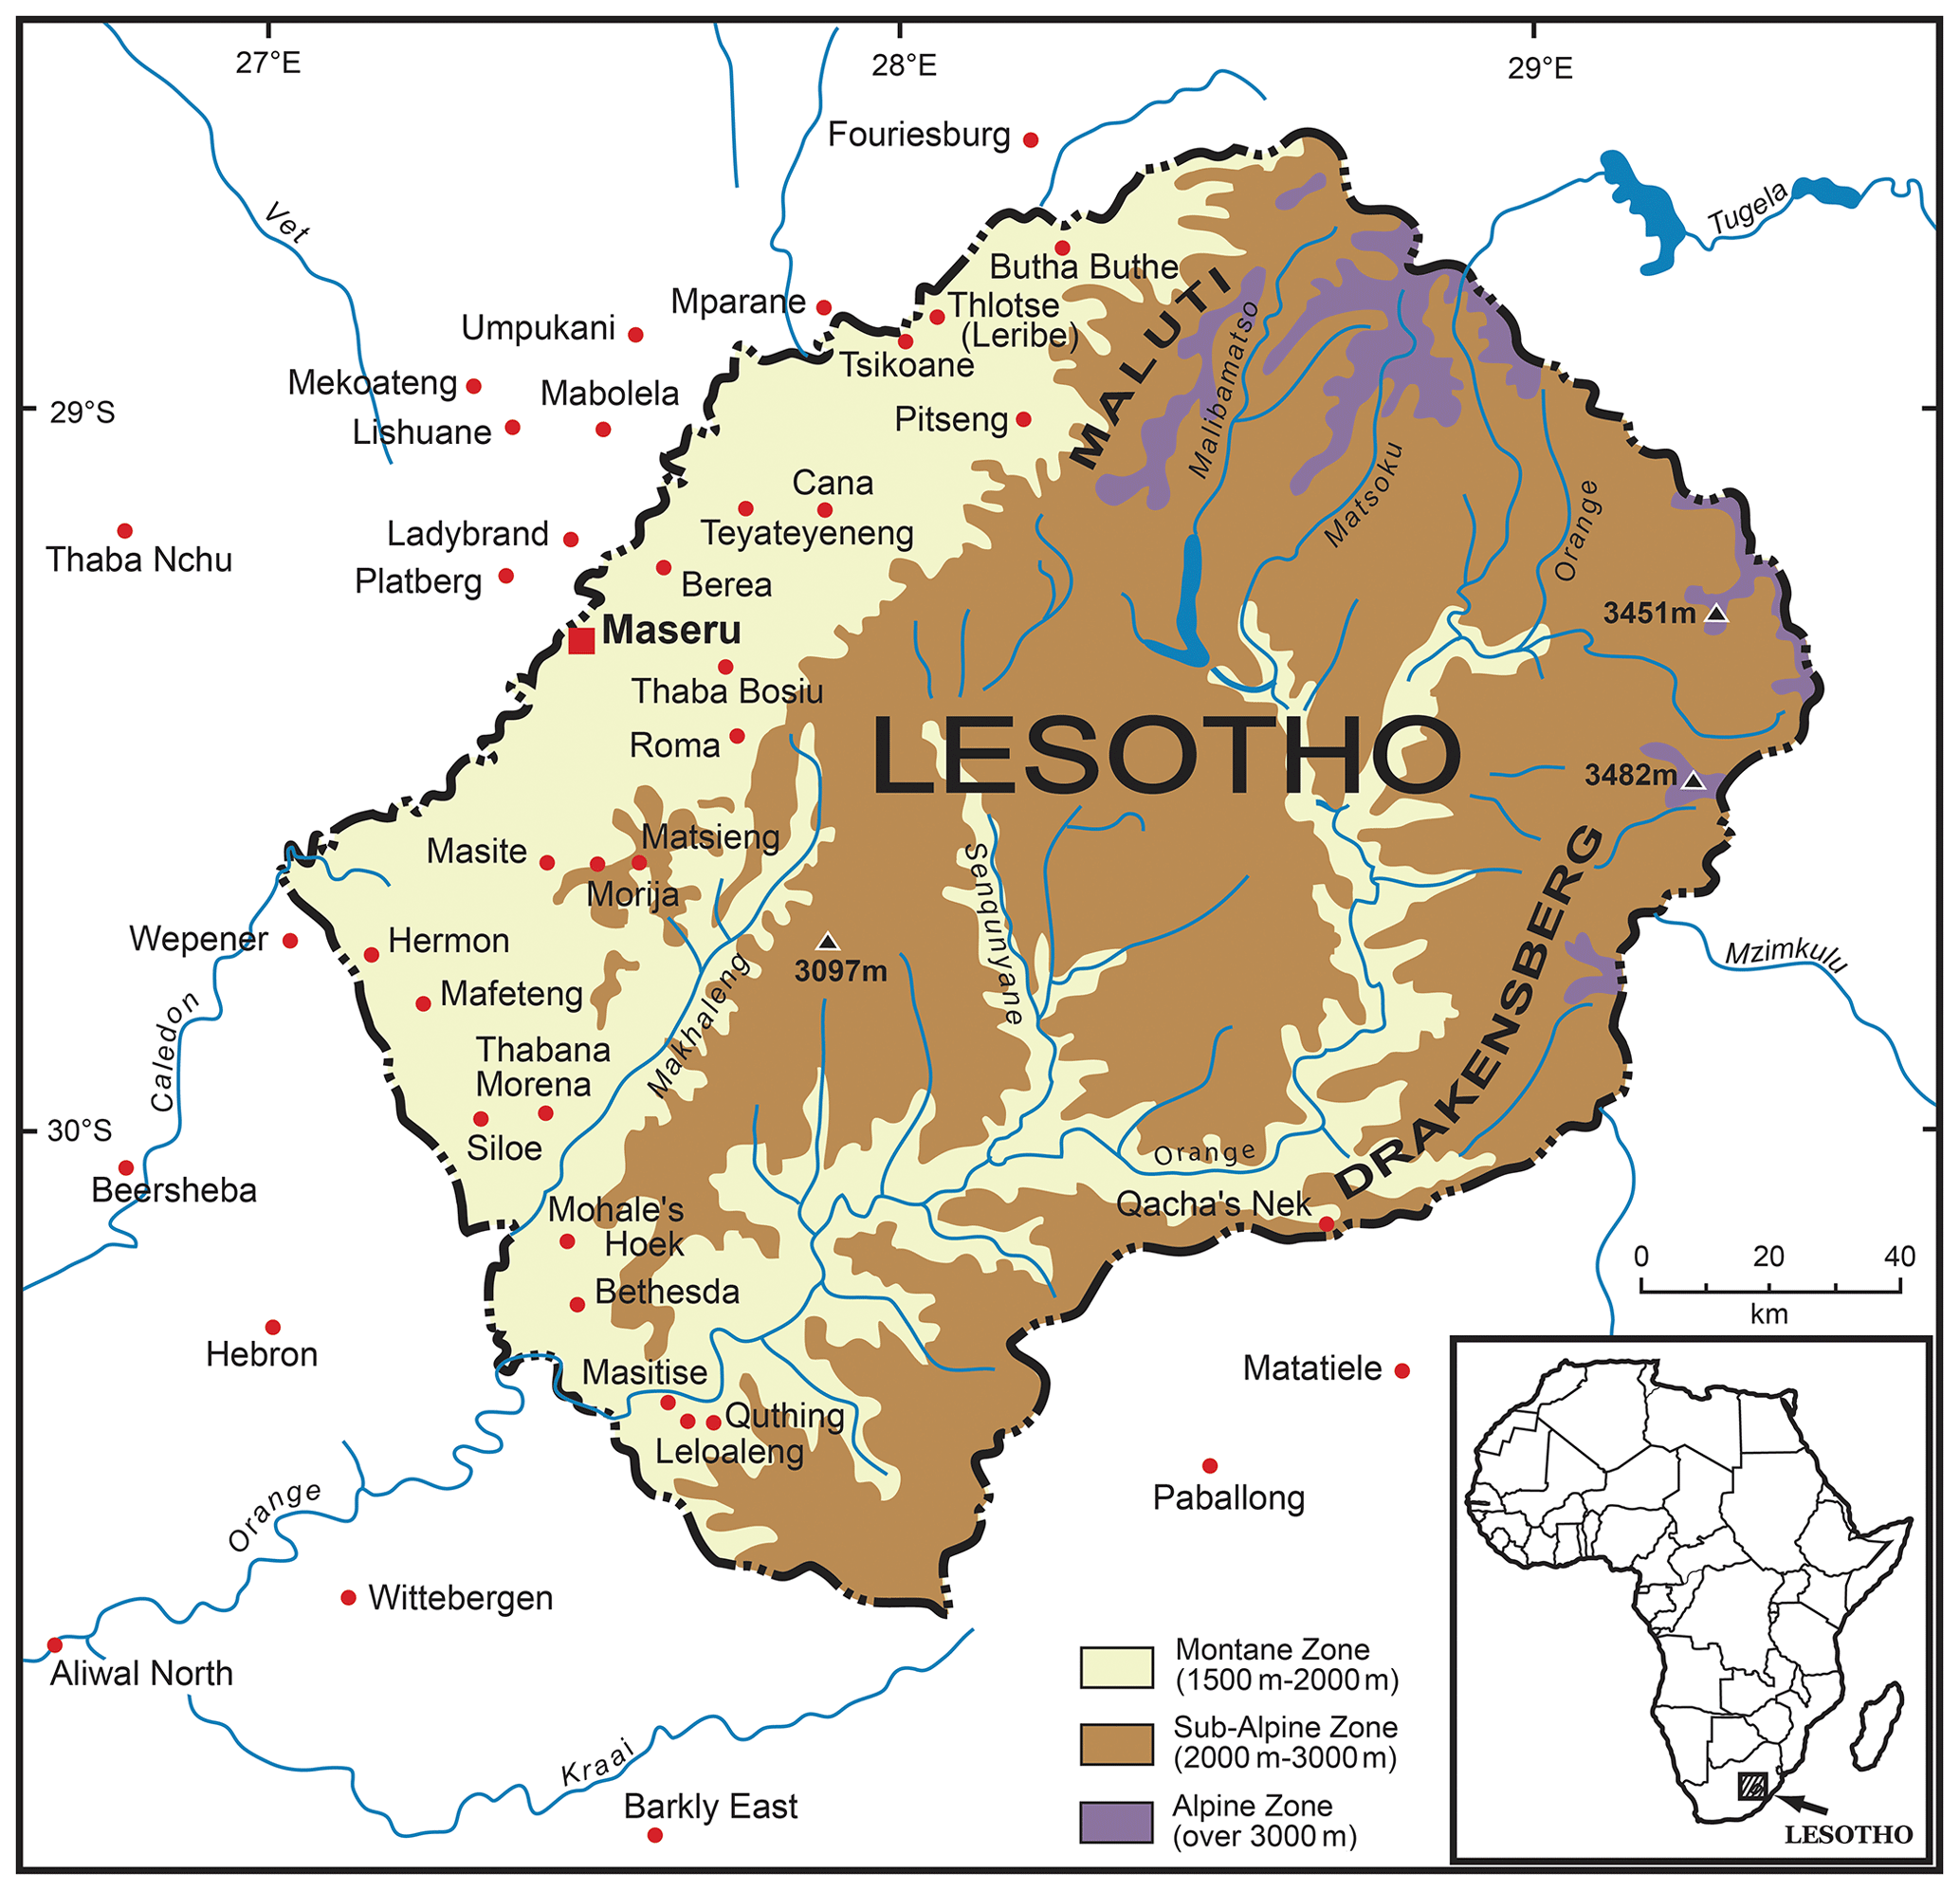
Figure 1Map of locations within and adjacent to present-day Lesotho from which documentary evidence of rainfall variability was obtained by Nash and Grab (2010).
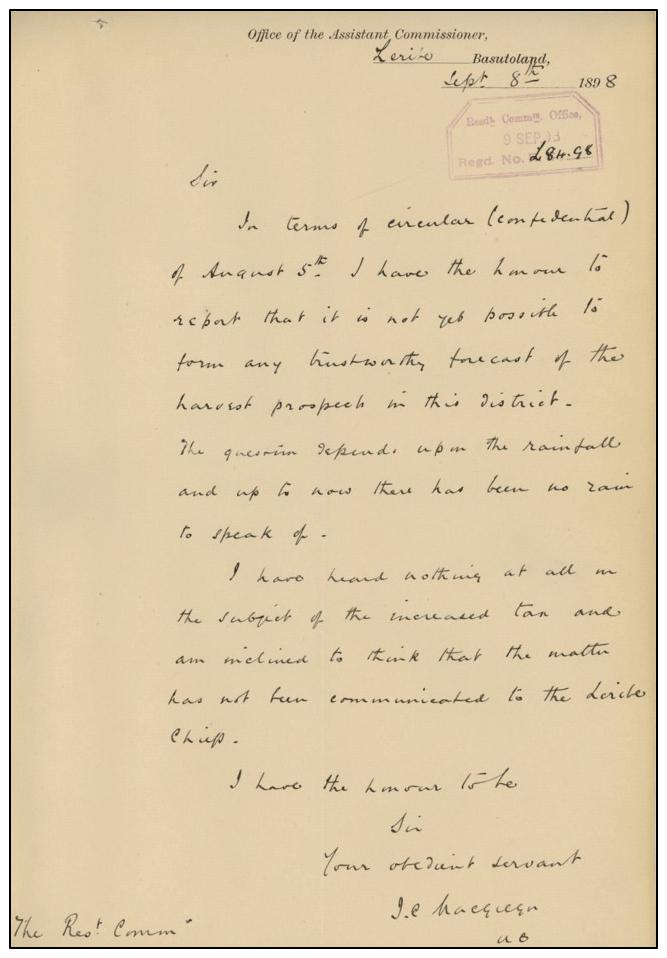
Figure 2Example letter written by Assistant Commissioner for Qacha's Nek District, J. L. McGregor (Leribe, Lesotho), dated 8 September 1898 (Source: Lesotho National Archives, Incoming Letters – Qacha's Nek District S7/1/6/6).
Raters were given verbatim English-language transcriptions (or translations) of all references to climate variability and climate-related phenomena recorded for the rain years 1889–1890 to 1899–1900 inclusive, as per Nash and Grab (2010). Raters were also provided with the following contextual materials:
-
an introduction to the exercise, including a map showing the location of Lesotho within southern Africa.
-
pp. 618 to 623 of Nash and Grab (2010), comprising an introduction to the study, a map of Lesotho with locations from which evidence was obtained, an explanation of the regional climatology, details of documentary sources (including how they were collected and where from), and an explanation of the methodology used.
-
the section “Methods of Analysis” from pp. 625–626 of Nash and Endfield (2002), which includes further detail on the reconstruction methodology.
Following the methodology detailed in Nash and Endfield (2002) and Nash and Grab (2010), raters were asked to categorize each rain year into one of five ordinal classes based on their assessment of the documentary materials: very wet/floods (+2), relatively wet (+1), normal (seasonal rains) (0), relatively dry (−1), and very dry/drought (−2). Raters were also asked to provide a brief explanation of why they assigned each rain year to a particular category and a summary of rainfall conditions. This approach to index development represents a variation on “Pfister indices” (see Pfister et al., 2018; Nash et al., 2021), using five categories rather than seven and generating a series for an entire season rather than monthly. It was first developed by Vogel (1989) as a method for reconstructing rainfall in the Eastern and Southern Cape regions of South Africa, and has been widely used for the derivation of rainfall indices in southern Africa and monsoon regions of India.
Raters were divided into two groups: 71 postgraduate students and 6 professional scientists. The student rater group consisted of postgraduate students based in London, studying for a master's or doctoral qualification in a climate or environmental discipline. All raters had first degrees in related disciplines and some experience of conducting scientific research. Of the student raters, 56 were studying for master's qualifications at King's College London and were registered either on the modules “Global Environmental Change: Past and Present” or “Climate: Science and History”; these students undertook the rainfall classification individually. The other 15 raters were first-year postgraduate research students registered on the London NERC Doctoral Training Partnership. Students in this group undertook the activity in groups of two, although each pair is counted as an individual rater for the purposes of this study (that is, 15 raters but 30 students in total). The professional group consisted of four published historical climatologists who had derived similar rainfall series in other parts of southern Africa (Kelso and Vogel, 2007; Neukom et al., 2014; Hannaford and Nash, 2016; Nash et al., 2016; Grab and Zumthurm, 2018; Nash et al., 2018) and two senior meteorologists at the South African and Lesotho meteorological services, both of whom were former climatology MSc students at the University of the Witwatersrand. Students were given a 2 h window to complete the reconstruction. The professional group were not time-limited, but only two raters reported spending more than 2 h on the analysis, with a median time of 1.5 h.
3.1 Student rater group
3.1.1 Summary statistics
Summary statistics for the student rater group are provided in Table 1. The three statistics of central tendency (mean, median, and mode) give very similar results, with only 1896–1897 showing differences and only by one category (median 0, mode −1, mean 0). We consider the mode to be the most robust statistic for this exercise, due to the tendency for both median and mean to reduce ranks to the centre (that is, 0: normal rainfall) where there is large variation between raters. The mean is likely to be unsuitable given the ordinal nature of the data but is included here for comparison. Of the 11 rain years, the closest agreement between raters was for 1890–1891, for which only 10 of the 71 raters assigned a category other than +2, and these raters all assigned a rating of +1. In this case, most raters justified their rating on the basis of considerable reporting on widespread flooding and “abnormal” rainfall. The rain year 1894–1895 also showed close levels of agreement, with 63 raters assigning a category of 0. Here, raters ordinarily justified their decision based on reports of a plentiful harvest and a general lack of specific references to rainfall.
Table 1Summary statistics of index values applied to the 11 rain years by the 71 postgraduate student raters. Index values in Nash and Grab (2010) are provided for comparison. Mean and median values are rounded to the nearest integer.
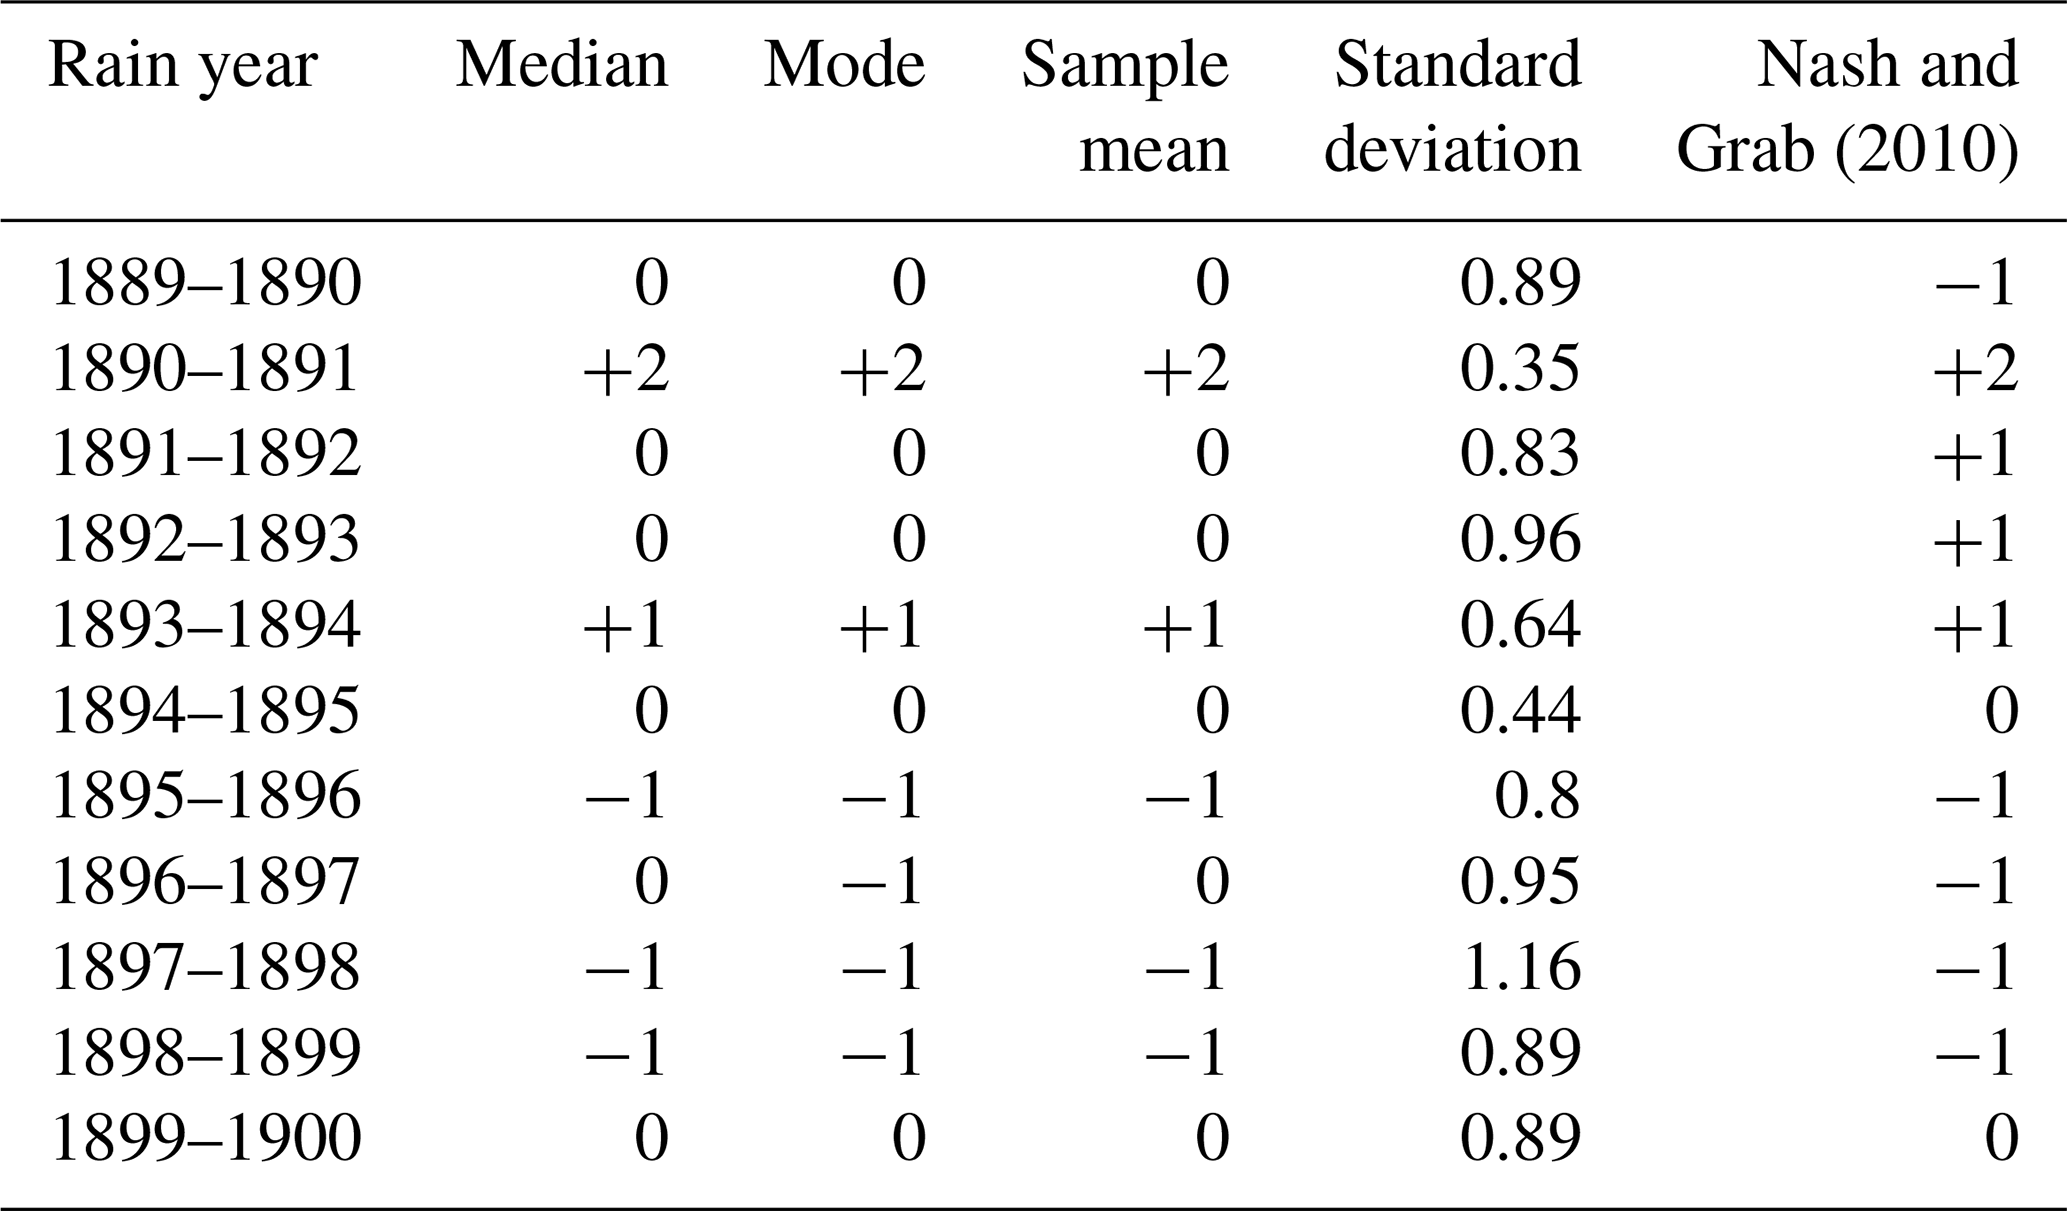
Rain years showing the greatest degree of rater variability were 1897–1898 (SD = 1.16), 1892–1893 (0.96), 1896–1897 (0.95), 1899–1900 (0.89), 1889–1890 (0.89), and 1891–1892 (0.83). In each of these cases, raters selected the full range of rankings, from −2 to +2. In nearly all these years, the documentary materials mentioned either spatial variability (with drought in some places and heavy rain in others) or temporal variability (with late but heavy rains). The exception was 1891–1892, for which raters were primarily confused by references to a plague of locusts, which was interpreted either as reflecting drought (evidenced by poor crops) or as evidence for heavy rainfall (producing vegetation/good crops suitable for locusts). Notably, all these years, with the exception of 1897–1898, produced medians that reduced to the centre. This was not the case with Nash and Grab (2010), who had rated these years either as +1 or −1.
3.1.2 Inter-rater reliability
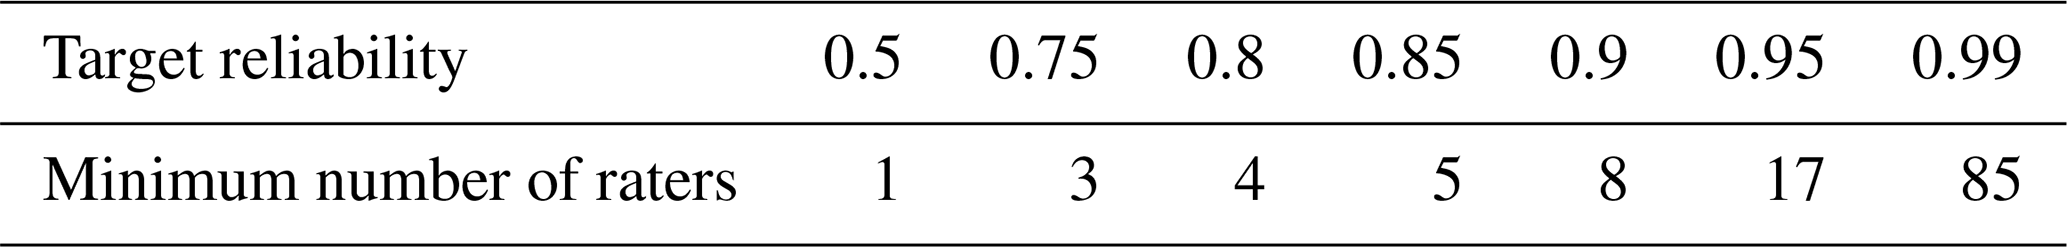
Inter-rater reliability was calculated using the two-way random intraclass correlation (ICC) coefficient (Landers, 2015) using the IBM SPSS software. ICC provides for a measure of the degree of random variation in scoring and the proportion of ratings that represent an underlying construct. Following Portney and Watkins (2007), ICC values of 0.5–0.74 are taken to represent moderate reliability, values between 0.75 and 0.89 to represent good reliability, and values ≥ 0.9 to represent excellent reliability.
The overall ICC for all student raters (n = 71) was 0.99, considered to represent excellent inter-rater reliability. This implies a high degree of internal consistency between raters. However, it is important to note that this only measures reliability between raters and does not give an indication of the relationship between the recorded index value and the “real” rainfall or rainfall as recorded by a rain gauge or some other accurate measuring device.
Table 2Number of raters within the larger sample of student raters required to achieve a target ICC value. Calculated from the ICC for the entire sample of student raters (n = 71) using the Spearman–Brown prediction formula. Number of raters is rounded up to the nearest integer.
As n = 71 is a very high number of raters, the Spearman–Brown prediction formula was used to determine the minimum number of raters within the sample required to produce a target level of reliability. To calculate n reliability the formula is as follows, where n = number of raters, is predicted reliability, and is the reliability for k (71) raters:
Results are presented in Table 2. “Moderate” reliability (ρ ≥ 0.5) can be achieved by selecting one rater at random from the sample of 71; the calculated inter-rater reliability for one rater within the sample was 0.54. “Good” inter-rater reliability (ρ ≥ 0.75) is achieved with three or more raters and “excellent” reliability with eight or more. This suggests that very large numbers of raters are not required to provide high levels of internal consistency in the generation of climate indices. Variation between raters can be minimized by selecting eight raters or more, even where the raters are non-specialists.
3.2 Professional rater group
3.2.1 Summary statistics
Whilst the inter-rater reliability for the student rater group was very high, it was notable that 6 of the 11 rain years produced values of zero, compared to 2 years in Nash and Grab (2010). This may represent a tendency for average rankings to reduce to the centre due to variability between raters. It is well-documented within the historical climatology literature that the generation of climate index values requires careful interpretation by trained researchers (see, for example, Ingram et al., 1981; Glaser, 1996; Nash et al., 2018; Pfister et al., 2018). Although the student sample described in Sect. 3.1 included individuals that were all conducting higher studies or research in climate science or a related discipline, they were not specialists in historical climatology. Non-specialist raters may misinterpret documentary materials; for example, failing to take into account the familiarity of the original writer with the area or potential biases that may encourage them to over- or under-report rainfall intensity. These are particular issues with this dataset, where writers were primarily European missionaries who, at least at first, may have described conditions based on their past Euro-centric climate experiences. Additionally, whilst the students were provided with an introduction to the climate of Lesotho through Nash and Grab (2010), most were otherwise unfamiliar with the region.
Table 3Summary statistics of index values applied to the 11 rain years by the six professional raters. Nash and Grab (2010) and the median and mode of the student raters (from Table 1) are provided for comparison.

The exercise was therefore repeated with six professional scientists, four of whom were historical climatologists who had published research with a focus on southern Africa and two of whom were senior forecasters in meteorological services in South Africa and Lesotho. Summary statistics for these researchers are presented in Table 3. Despite the small sample size, 7 of the 11 years have standard deviations lower than the student rater group, indicative of greater agreement amongst the professional raters. Ratings are more similar to those given by Nash and Grab (2010), with only 1891–1892 producing a different rating (0, versus +1 by Nash and Grab, 2010, although one of the six researchers also gave the year a +1 rating).
Median and mode values differ between the professional group and student group for several years. For 1889–1890, the professional group produced a value of −1 instead of 0, for 1892–1893 +1 instead of 0, and for 1896–1897 −1 instead of 0 (although the mode of the student raters for this year was also −1). Each of these years showed relatively high standard deviations in the results from the student raters and each had provided median values of 0, suggesting that the student raters produced a wide spread of results that had reduced to zero. For each of these years the professional group provided values equal to the Nash and Grab (2010) series.
3.2.2 Inter-rater reliability
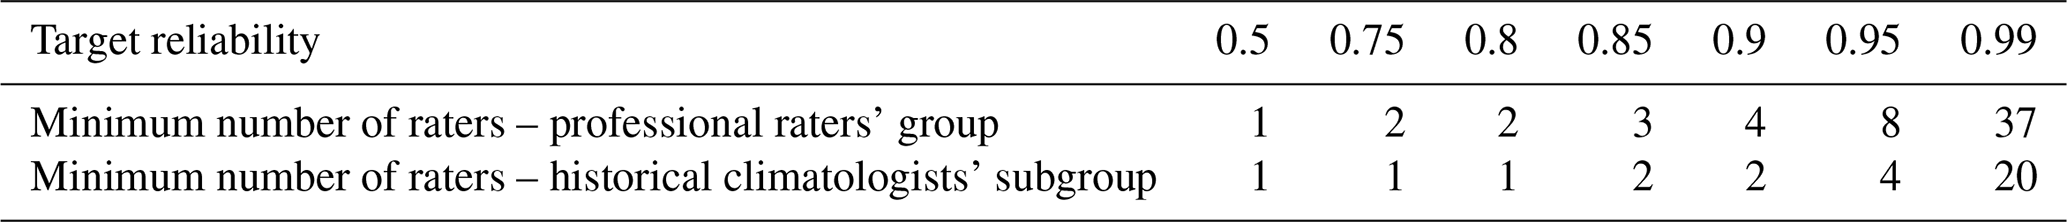
The overall ICC for the professional raters (n = 6) was 0.94. When assessing the professional historical climatologists (n = 4) as a single group, this rose to 0.95. This suggests that training in historical climatology methods as well as detailed knowledge of the climatology of the region in question may be particularly important. The calculated reliability for a single rater was 0.73 for the professional group and 0.83 for the historical climatologist subgroup. The minimum number of raters required to achieve a target level of reliability for the whole group of professional raters and for the subsample of historical climatologists is provided in Table 4. The results suggest that a target ICC of 0.9 – considered excellent inter-rater reliability by Portney and Watkins (2007) – can be achieved for a group of four raters who are highly trained in the climatology of the region. If these raters are also trained as historical climatologists, high reliability can be achieved from an average of two researchers generating separate reconstructions. In practice, this is already common in historical climatology, where researchers often work in teams of two or more.
Table 4Number of raters within the sample of professional raters required to achieve a target value ICC value. Values are provided for all professional raters (n = 6) and for the subsample of trained historical climatologists (n = 4).
We have shown that the issue of researcher subjectivity in the generation of climate index series from documentary sources can be minimized by repeating the process of index generation with a small team of researchers and taking a measure of central tendency. We would advise using the mode, as this is least likely to reduce to the centre (i.e. produce values of 0) in years where there is considerable disagreement between researchers. However, the index values generated for this project using the median had only minor differences to those produced from the mode, and mean values will be suitable when only two researchers have generated indices. Our results suggest that high levels of inter-rater reliability can be achieved with teams of two researchers or more if the researchers are trained in historical climatology methods and have detailed knowledge of the climate of the region. The results are consistent with the findings of Ge et al. (2008) on documentary-derived temperature series in China. These authors found that temperature series tended to correlate and cluster most closely where they related to regions with a close geographical proximity, suggesting that regional climatic differences are more important than differences in interpretation in explaining a discrepancy between series.
In general, years that produced the greatest variability of results within the student rater group were those where the rainfall characteristics at the start and end of the season differed. For example, the historical climatologists assigned a rating of −1 (relatively dry) to 1889–1890, drawing particular significance to overall reports of drought and the lateness of rain. Student raters gave mixed ratings, with some raters giving more weight to reports of drought and others to reports of heavy rains towards the end of the season. Conversely in 1892–1893, the historical climatologist group put considerable weight on the reported intensity of late rains to assign a category of +1. During this year many of the student groups gave negative (−2/−1) or average (0) ratings, due to reports of poor crops and famine during the early part of the season. Historical climatologists assigned a classification of −1 to 1896–1897, in part because of reports of drought in the early part of the following rain year, whereas the student groups showed little evidence that they had considered cross-season indicators of rainfall variability. Each of these years produced a rating of 0 from the student group, suggesting a high degree of variability and a reduction to the central value. Conversely, the professional group produced values of +1/−1, as did Nash and Grab (2010).
One area that seems to have caused particular variation within the student group was the interpretation of diary entries written by Sir Godfrey Lagden, the colonial Resident Commissioner for Basotholand, between 1884 and 1900. The majority of these entries consisted of one-line accounts of daily weather conditions or the impacts of weather events on daily activities. The historical climatologists largely did not mention the diaries, but they seemingly had much influence on many student raters; some student raters noted, for example, the frequency of storms or applied a high weighting to Lagden's specific terminology to describe rainfall (e.g. “slight rain” or “little rain”). This confirms the importance of training in the interpretation and analysis of historical sources for the derivation of indices, also demonstrated by the substantially higher inter-rater reliability within the historical climatologist group compared to the student group. Greater variability within the student group was also likely affected by the unfamiliarity of many with the climate of the region, beyond the background information from Nash and Grab (2010). Data from the professional group, however, suggests that training in historical climatology is important as is knowledge of local climatology or meteorology. All members of this group were trained climatologists and/or meteorologists (three were resident in the area), of which one had received specific training as a historical climatologist and had published in this subdiscipline. By far the strongest agreement was between the four historical climatologists, with ICC increasing when viewing these four raters as a stand-alone group.
Overall, this study demonstrates that inter-rater reliability is highest when index series are generated by researchers trained in historical climatology and with a working knowledge of the climate of the region. The calculated reliability of a single rater within the historical climatologist group (n = 4) was 0.83, rising to 0.90 for two raters and 0.94 for three raters. This should provide additional confidence in previous index series produced in small teams, as is common in historical climatology. In future, echoing Nash et al. (2016), we suggest that researchers working on climate index development in small teams should produce individual reconstructions, with the final published index values generated by a measure of central tendency. For complete transparency, it would also help if each individual reconstruction is presented in the published results.
It should be noted that the results presented here give no indication of the reliability of the index values in relation to real rainfall or rainfall measured by accurate rain gauges. Indices derived from documentary data are reliant on the materials available, which may be incomplete, fragmentary, often not relating directly to climate, and subject to the biases of the observer. Statistical methods have been developed to calibrate these records, generally using a crossover instrumental record (see Brázdil et al., 2010; Dobrovolný, 2018, for a summary). Calibration is, however, highly sensitive to variability within the reconstruction process itself, which our results suggest can be reduced substantially by using two or more raters. We note that such instrumental rainfall series are available for Lesotho (Maseru) and the region south of Lesotho (Aliwal North) for the time period in question. However, the series are incomplete and do not covary so would not permit such a process for these records.
Care should also be taken in interpreting our results beyond this particular dataset without replication of the study. Repeating the exercise with other sets of documentary records would be helpful, particularly those from mid- and high-latitude countries that do not have a single rain season. Climate index series in these regions are commonly generated by month rather than season, with indices summed or averaged to give an annual value (see Pfister et al., 2018), providing both more scope for error and more likelihood that variability will be reduced in the averaging of multiple index values for a year. It would therefore be beneficial to repeat the exercise following the standard method for generating Pfister indices, which also commonly ranks against a seven-point scale rather than a five-point scale.
This study set out to explore and quantify the degree of error between individuals generating ordinal-scale climate indices from a historical documentary dataset. Ultimately, our findings reinforce the conclusions of Nash et al. (2021) that climate indices should be derived by those with training in historical climatology methods as well as a detailed knowledge of both the climate of the area in question and the nature of the documentary sources. However, we have demonstrated that generating such indices using groups of two or more researchers will substantially reduce the issue of researcher subjectivity. Our results also suggest that researchers who are experienced historical climatologists are likely to produce similar indices from the same dataset, which has never been explicitly demonstrated previously.
Our results have implications for the utilization of citizen science approaches to generate climate indices from documentary data. Subjectivity can be reduced by taking a measure of central tendency (ideally the mode) from small groups of citizen scientists. Our results suggest that good inter-rater reliability can be achieved with three raters and excellent reliability with eight raters, although it should be reiterated that our raters had at least a strong first degree in an environmental discipline. However, researchers seeking to utilize citizen science should be cogent of the tendency for ratings to reduce to the central value (in this case 0: normal) in years where there is a high degree of variability between raters, particularly where rainfall is not consistent throughout a season. Overall, the results reiterate the importance of training in historical climatology and suggest that confidence should be given to previous reconstructions produced by small teams of historical climatologists.
The full dataset of transcribed nineteenth-century documentary references to weather and climate collected for Lesotho by Nash and Grab (2010) is available on request.
The experiments were conducted and organized by GCDA, using a dataset collected by DJN and SWG. All authors compiled the paper.
The contact author has declared that neither they nor their co-authors have any competing interests.
Publisher’s note: Copernicus Publications remains neutral with regard to jurisdictional claims in published maps and institutional affiliations.
This article is part of the special issue “International methods and comparisons in climate reconstruction and impacts from archives of societies”. It is not associated with a conference.
The authors would like to thank all of the students who participated in the study, consisting of postgraduate students at King's College London on the MSc Global Environmental Change, London NERC DTP, and on the module Climate: Science and History. We would also like to thank the following professional scientists for their generous participation: Matthew Hannaford, Clare Kelso, Kathleen Pribyl, Puseletso Mofokeng, Retsipile Neko, and Tizian Zumthurm. We acknowledge Richard N. Landers for his generous support and guidance in relation to the ICC analysis. Preliminary results were presented at the second workshop of the PAGES (Past Global Changes) working group CRIAS (Climate Reconstruction and Impacts from the Archives of Society) in Leipzig, October 2019.
This research has been supported by the British Academy (Small Grant SG-40838).
This paper was edited by Heli Huhtamaa and reviewed by Christian Pfister and one anonymous referee.
Adamson, G. C. D. and Nash, D. J.: Documentary reconstruction of monsoon rainfall variability over western India, 1781–1860, Clim. Dynam., 42, 749–769, https://doi.org/10.1007/s00382-013-1825-6, 2014.
Alexandre, P.: Le climat en Europe au moyen âge: contribution à l'histoire des variations climatiques de 1000 à 1425, d'après les narratives de l'Europe Occidentale, Recherches d'histoire et de sciences sociales 24, Éditions de l'École des hautes études en sciences sociales, Paris, https://doi.org/10.1163/182539188x00438, 1987.
Baron, W. R.: Historical climate records from the northeastern United States, 1640 to 1900, in: Climate Since A.D. 1500, edited by: Bradley, R. S. and Jones, P. D., Routledge, London, 74–91, ISBN 9781138178144, 1995.
Baron, W. R., Gordon, G. A., Borns, H. W., and Smith, D. C.: Frost-free record reconstruction for eastern Massachusetts, 1733–1980, J. Clim. Appl. Meteorol., 23, 317–319, https://doi.org/10.1175/1520-0450(1984)023<0317:FFRRFE>2.0.CO;2, 1984.
Bauch, M., Labbé, T., Engel, A., and Seifert, P.: A prequel to the Dantean Anomaly: the precipitation seesaw and droughts of 1302 to 1307 in Europe, Clim. Past, 16, 2343–2358, https://doi.org/10.5194/cp-16-2343-2020, 2020.
Brázdil, R. and Kotyza, O.: History of Weather and Climate in the Czech Lands I. Period 1000–1500, Zürcher Geographische Schriften 62, Zürich, https://doi.org/10.1002/j.1477-8696.1997.tb06247.x, 1995.
Brázdil, R., Pfister, C., Wanner, H., von Storch, H., and Luterbacher, J.: Historical climatology in Europe – the state of the art, Climatic Change, 70, 363–430, https://doi.org/10.1007/s10584-005-5924-1, 2005.
Brázdil, R., Dobrovolný, P., Luterbacher, J., Moberg, A., Pfister, C., Wheeler, D., and Zorita, E.: European climate of the past 500 years: new challenges for historical climatology, Climatic Change, 101, 7–40, https://doi.org/10.1007/s10584-009-9783-Z, 2010.
Brázdil, R., Kiss, A., Luterbacher, J., Nash, D. J., and Řezníčková, L.: Documentary data and the study of past droughts: a global state of the art, Clim. Past, 14, 1915–1960, https://doi.org/10.5194/cp-14-1915-2018, 2018.
Bryson, R. and Padoch, C.: On the climates of history, J. Interdiscipl. Hist., 10, 583–597, https://doi.org/10.2307/203060, 1980.
Camuffo, D., Bertolin, C., Barriendos, M., Dominguez-Castro, F., Cocheo, C., Enzi, S., Sghedoni, M., della Valle, A., Garnier, E., Alcoforado, M. J., Xoplaki, E., Luterbacher, J., Diodato, N., Maugeri, M., Nunes, M. F., and Rodriguez, R.: 500-year temperature reconstruction in the Mediterranean Basin by means of documentary data and instrumental observations, Climatic Change, 101, 169–199, https://doi.org/10.1007/s10584-010-9815-8, 2010.
Dobrovolný, P.: Analysis and interpretation: Calibration-verification, in: The Palgrave Handbook of Climate History, edited by: White, S., Pfister, C., and Mauelshagen, F., Palgrave Macmillan, London, 107–113, https://doi.org/10.1057/978-1-137-43020-5_10, 2018.
Dobrovolný, P., Brázdil, R., Valášek, H., Kotyza, O., Macková, J., and Halíčková, M.: A standard paleoclimatological approach to temperature reconstruction in historical climatology: an example from the Czech Republic, AD 1718–2007, Int. J. Climatol., 29, 1478–1492, https://doi.org/10.1002/joc.1789, 2009.
Dobrovolný, P., Brázdil, R., Trnka, M., Kotyza, O., and Valašek, H.: Precipitation reconstruction for the Czech Lands, AD 1501–2010, Int. J. Climatol., 35, 1–14, https://doi.org/10.1002/joc.3957, 2015.
Dominguez-Castro, F., Gallego, M. C., Vaquero, J. M., Herrera, R. G., Pena-Gallardo, M., El Kenawy, A., and Vicente-Serrano, S. M.: Twelve years of daily weather descriptions in North America in the eighteenth century (Mexico City, 1775–86), B. Am. Meteorol. Soc., 100, 1531–1547, https://doi.org/10.1175/BAMS-D-18-0236.1, 2019.
Duncan, J.: Sites of representation – place, time and the discourse of the other, in: Place, culture and representation, edited by: Duncan, J. and Ley, D., Routledge, London, 39–56, ISBN 9780203714034, 1997.
Duncan, J. and Gregory, D. (Eds.): Writes of Passage: Reading Travel Writing, Routledge, London, ISBN 9780415160148, 1999.
Erfurt, M. and Glaser, R.: Changing impacts and societal responses to drought in southwestern Germany since 1800, Reg. Environ. Change, 19, 2311–2323, https://doi.org/10.1007/s10113-019-01522-7, 2019.
Fei, J., Zhou, J., Zhang, Q. Y., and Chen, H. Z.: Dust weather records in Beijing during 1860–1898 AD based on the Diary of Tonghe Weng, Atmos. Environ., 39, 3943–3946, https://doi.org/10.1016/j.atmosenv.2005.03.022, 2005.
Fenby, C. D. and Gergis, J.: Rainfall variations in south-eastern Australia part 1: consolidating evidence from pre-instrumental documentary sources, 1788–1860, Int. J. Climatol., 33, 2956–2972, https://doi.org/10.1002/joc.3640, 2013.
Fernández-Fernández, M. I., Gallego, M. C., Domínguez-Castro, F., Trigo, R. M., and Vaquero, J. M.: The climate in Zafra from 1750 to 1840: precipitation, Climatic Change, 129, 267–280, https://doi.org/10.1007/s10584-014-1315-9, 2015.
Ge, Q., Zheng, J., Tian, Y., Wu, W., Fang, X., and Wang, W.-C.: Coherence of climatic reconstruction from historical documents in China by different studies, Int. J. Climatol., 28, 1007–1024, https://doi.org/10.1002/joc.1552, 2008.
Ge, Q. S., Zheng, J. Y., Fang, X. Q., Man, Z. M., Zhang, X. Q., Zhang, P. Y., and Wang, W. C.: Winter half-year temperature reconstruction for the middle and lower reaches of the Yellow River and Yangtze River, China, during the past 2000 years, Holocene, 13, 933–940, https://doi.org/10.1191/0959683603hl680rr, 2003.
Ge, Q.-S., Hao, Z.-X., Zheng, J.-Y., and Liu, Y.: China: 2000 years of climate reconstruction from historical documents, in: The Palgrave Handbook of Climate History, edited by: White, S., Pfister, C., and Mauelshagen, F., Palgrave Macmillan, London, 189–201, https://doi.org/10.1057/978-1-137-43020-5_17, 2018.
Gergis, J. and Ashcroft, L.: Rainfall variations in south-eastern Australia, Part 2: a comparison of documentary, early instrumental and palaeoclimate records, 1788–2008, Int. J. Climatol., 33, 2973–2987, https://doi.org/10.1002/joc.3639, 2013.
Glaser, R.: Data and methods of climatological evaluation in historical climatology, Hist. Soc. Res., 21, 56–88, https://doi.org/10.12759/hsr.21.1996.4.56-88, 1996.
Glaser, R. and Riemann, D.: A thousand-year record of temperature variations for Germany and Central Europe based on documentary data, J. Quaternary Sci., 24, 437–449, https://doi.org/10.1002/jqs.1302, 2009.
Glaser, R. and Stangl, H.: Climate and floods in Central Europe since AD 1000: Data, methods, results and consequences, Surv. Geophys., 25, 485–510, https://doi.org/10.1007/s10712-004-6201-y, 2004.
Grab, S. W. and Zumthurm, T.: The land and its climate knows no transition, no middle ground, everywhere too much or too little: a documentary-based climate chronology for central Namibia, 1845–1900 (Suppl. 1), Int. J. Climatol., 38, e643–e659, https://doi.org/10.1002/joc.5397, 2018.
Hannaford, M. J. and Nash, D. J.: Climate, history, society over the last millennium in southeast Africa, WIRES Clim. Change, 7, 370–392, https://doi.org/10.1002/wcc.389, 2016.
Hassan, F.: Environmental perception and human responses in history and prehistory, in: The Way the Wind Blows: Climate, History and Human Action, edited by: McIntosh, R. J., Tainter, J. A., and McIntosh, S. K., Columbia University press, New York, 121–140, ISBN 9780231112093, 2000.
Ingram, M. J., Farmer, G., and Wigley, T. M. L.: The use of documentary sources for the study of past climates, in: Climate and History: Studies in Past Climates and their Impact on Man, edited by: Wigley, T. M. L., Ingram, M. J., and Farmer, G., Cambridge University Press, Cambridge, 180–213, ISBN 9780521312202, 1981.
Kelso, C. and Vogel, C. H.: The climate of Namaqualand in the nineteenth century, Climatic Change, 83, 257–380, https://doi.org/10.1007/s10584-007-9264-1, 2007.
Kiss, A.: Floods and Long-Term Water-Level Changes in Medieval Hungary, Springer, Cham, https://doi.org/10.1007/978-3-319-38864-9 2019.
Landers, R. N.: Computing intraclass correlations (ICC) as estimates of interrater reliability in SPSS, Winnower, 2, e143518.81744, https://doi.org/10.15200/winn.143518.81744, 2015.
Mauelshagen, F.: Klimageschichte der Neuzeit 1500–1900 (Geschichte kompakt), Wissenschaftliche Buchgesellschaft, Darmstadt, ISBN 9783534210244, 2010.
Nash, D. J. and Endfield, G. H.: A 19th century climate chronology for the Kalahari region of central southern Africa derived from missionary correspondence, Int. J. Climatol., 22, 821–841, https://doi.org/10.1002/joc.753, 2002.
Nash, D. J. and Endfield, G. H.: “Splendid rains have fallen”: links between El Nino and rainfall variability in the Kalahari, 1840–1900, Climatic Change, 86, 257–290, https://doi.org/10.1007/s10584-007-9274-z, 2008.
Nash, D. J. and Grab, S. W.: “A sky of brass and burning winds”: documentary evidence of rainfall variability in the Kingdom of Lesotho, Southern Africa, 1824–1900, Climatic Change, 101, 617–653, https://doi.org/10.1007/s10584-009-9707-y, 2010.
Nash, D. J., Pribyl, K., Klein, J., Neukom, R., Endfield, G. H., Adamson, G. C. D., and Kniveton, D. R.: Seasonal rainfall variability in southeast Africa during the nineteenth century reconstructed from documentary sources, Climatic Change, 134, 605–619, https://doi.org/10.1007/s10584-015-1550-8, 2016.
Nash, D. J., Pribyl, K., Endfield, G. H., Klein, J., and Adamson, G. C. D.: Rainfall variability over Malawi during the late 19th century (Suppl. 1), Int. J. Climatol., 38, e629–e642, https://doi.org/10.1002/joc.5396, 2018.
Nash, D. J., Adamson, G. C. D., Ashcroft, L., Bauch, M., Camenisch, C., Degroot, D., Gergis, J., Jusopović, A., Labbé, T., Lin, K.-H. E., Nicholson, S. D., Pei, Q., del Rosario Prieto, M., Rack, U., Rojas, F., and White, S.: Climate indices in historical climate reconstructions: a global state of the art, Clim. Past, 17, 1273–1314, https://doi.org/10.5194/cp-17-1273-2021, 2021.
Neukom, R., Nash, D. J., Endfield, G. H., Grab, S. W., Grove, C. A., Kelso, C., Vogel, C. H., and Zinke, J.: Multi-proxy summer and winter precipitation reconstruction for southern Africa over the last 200 years, Clim. Dynam., 42, 2713–2716, https://doi.org/10.1007/s00382-013-1886-6, 2014.
Nicholson, S. E., Klotter, D., and Dezfuli, A. K.: Spatial reconstruction of semi-quantitative precipitation fields over Africa during the nineteenth century from documentary evidence and gauge data, Quaternary Res., 78, 13–23, https://doi.org/10.1016/j.yqres.2012.03.012, 2012.
Nicholson, S. E., Funk, C., and Fink, A.: Rainfall over the African continent from the 19th through the 21st century, Global Planet. Change, 165, 114–127, https://doi.org/10.1016/j.gloplacha.2017.12.014, 2018.
Norrgård, S.: Practising historical climatology in West Africa: a climatic periodisation 1750–1800, Climatic Change, 129, 131–143, https://doi.org/10.1007/s10584-014-1307-9, 2015.
Ogilvie, A. E. J. and Farmer, G.: Documenting the Medieval climate, in: Climates of the British Isles. Present, Past and Future, edited by: Hulme, M. and Barrow, E., Routledge, London, 112–133, ISBN 9780415130172, 1997.
Ogilvie, A. E. J. and Jónsson, T.: “Little Ice Age” research: A perspective from Iceland, Climatic Change, 48, 9–52, https://doi.org/10.1023/A:1005625729889, 2001.
Pfister, C.: Klimageschichte der Schweiz 1525–1860. Das Klima der Schweiz und seine Bedeutung in der Geschichte von Bevölkerung und Landwirtschaft, Paul Haupt, Bern, ISBN 9783258039565, 1984.
Pfister, C.: Monthly temperature and precipitation patterns in Central Europe from 1525 to the present. A methodology for quantifying man-made evidence on weather and climate, in: Climate Since A.D. 1500, edited by: Bradley, R. S. and Jones, P. D., Routledge, London, 118–142, ISBN 9780415120302, 1992.
Pfister, C.: Wetternachhersage. 500 Jahre Klimavariationen und Naturkatastrophen (1496–1995), Paul Haupt, Bern, Stuttgart, Wien, ISBN 9783258056968, 1999.
Pfister, C. and Wanner, H.: Climate and Society in Europe: The Last Thousand Years, Haupt, Bern, Switzerland, ISBN 9783258082349, 2021.
Pfister, C., Weingartner, R., and Luterbacher, J.: Hydrological winter droughts over the last 450 years in the Upper Rhine basin: a methodological approach, Hydrolog. Sci. J., 51, 966–985, https://doi.org/10.1623/hysj.51.5.966, 2006.
Pfister, C., Camenisch, C., and Dobrovolný, P.: Analysis and Interpretation: Temperature and Precipitation Indices, in: The Palgrave Handbook of Climate History, edited by: White, S., Pfister, C., and Mauelshagen, F., Palgrave-Macmillan, London, 115–129, https://doi.org/10.1057/978-1-137-43020-5_11, 2018.
Portney, L. G. and Watkins, M. P.: Foundations of Clinical Research: Applications to Practice, 3rd edn., Pearson, ISBN 9780131716407, 2007.
Prieto, M. R. and Rojas, F.: Determination of droughts and high floods of the Bermejo River (Argentina) based on documentary evidence (17th to 20th century), J. Hydrol., 529, 676–683, https://doi.org/10.1016/j.jhydrol.2015.06.035, 2015.
Rodrigo, F. S. and Barriendos, M.: Reconstruction of seasonal and annual rainfall variability in the Iberian peninsula (16th–20th centuries) from documentary data, Global Planet. Change, 63, 243–257, https://doi.org/10.1016/j.gloplacha.2007.09.004, 2008.
Salvisberg, M.: Der Hochwasserschutz an der Gürbe. Eine Herausforderung für Generationen (1855–2010), Wirtschafts-, Sozial- und Umweltgeschichte 7, Schwabe, Basel, https://doi.org/10.24894/978-3-7965-3684-7, 2017.
Sene, K. J., Jones, D. A., Meigh, J. R., and Farquharson, F. A. K.: Rainfall and flow variations in the Lesotho Highlands, Int. J. Climatol., 18, 329–345, https://doi.org/10.1002/(SICI)1097-0088(19980315)18:3<329::AID-JOC251>3.0.CO;2-5, 1998.
Tyson, P. D.: Climatic Change and Variability in Southern Africa, Oxford University Press, Cape Town, ISBN 9780195704952, 1986.
Van Engelen, A. F. V., Buisman, J., and Ijnsen, F.: A millennium of weather, winds and water in the Low Countries, in: History and Climate. Memories of the Future, edited by: Jones, P. D., Ogilvie, A. E. J., Davies, T. D., and Briffa, K. R., Kluwer Academic/Plenum Publishers, New York, 101–123, ISBN 9780306465895, 2001.
Vogel, C. H.: A documentary-derived climatic chronology for South Africa, 1820–1900, Climatic Change, 14, 291–307, https://doi.org/10.1007/BF00134967, 1989.
Wang, P. K.: On the relationship between winter thunder and the climatic change in China in the past 2200 years, Climatic Change, 3, 37–46, https://doi.org/10.1007/BF02423167, 1980.
Wang, S., Gong, D., and Zhu, J.: Twentieth-century climatic warming in China in the context of the Holocene, Holocene, 11, 313–321, https://doi.org/10.1191/095968301673172698, 2001.