the Creative Commons Attribution 4.0 License.
the Creative Commons Attribution 4.0 License.
 | 12 Jan 2021
Impact of mid-glacial ice sheets on deep ocean circulation and global climate
Sam Sherriff-Tadano
Ayako Abe-Ouchi
Akira Oka
This study explores the effect of southward expansion of Northern Hemisphere (American) mid-glacial ice sheets on the global climate and the Atlantic Meridional Overturning Circulation (AMOC) as well as the processes by which the ice sheets modify the AMOC. For this purpose, simulations of Marine Isotope Stage (MIS) 3 (36 ka) and 5a (80 ka) are performed with an atmosphere–ocean general circulation model. In the MIS3 and MIS5a simulations, the global average temperature decreases by 5.0 and 2.2 ∘C, respectively, compared with the preindustrial climate simulation. The AMOC weakens by 3 % in MIS3, whereas it strengthens by 16 % in MIS5a, both of which are consistent with an estimate based on 231Pa ∕ 230Th. Sensitivity experiments extracting the effect of the southward expansion of glacial ice sheets from MIS5a to MIS3 show a global cooling of 1.1 ∘C, contributing to about 40 % of the total surface cooling from MIS5a to MIS3. These experiments also demonstrate that the ice sheet expansion leads to a surface cooling of 2 ∘C over the Southern Ocean as a result of colder North Atlantic Deep Water. We find that the southward expansion of the mid-glacial ice sheet exerts a small impact on the AMOC. Partially coupled experiments reveal that the global surface cooling by the glacial ice sheet tends to reduce the AMOC by increasing the sea ice at both poles and, hence, compensates for the strengthening effect of the enhanced surface wind over the North Atlantic. Our results show that the total effect of glacial ice sheets on the AMOC is determined by two competing effects: surface wind and surface cooling. The relative strength of surface wind and surface cooling effects depends on the ice sheet configuration, and the strength of the surface cooling can be comparable to that of surface wind when changes in the extent of ice sheet are prominent.
- Article
(12397 KB) - Full-text XML
-
Supplement
(464 KB) - BibTeX
- EndNote


During the last glacial period, ice sheets evolved drastically over the northern continent (Lisiecki and Raymo, 2005; Clark et al., 2009; Grant et al., 2012; Spratt and Lisiecki, 2016, Fig. 1). After the initiation of the Northern Hemisphere glacial ice sheets at the end of the last interglacial, the ice sheets expanded over northern North America and northern Europe during the early glacial period, Marine Isotope Stage 5d-a (MIS5d-a, 123–71 ka; Lisiecki and Raymo, 2005), and further expanded during MIS4 (71–57 ka; Lisiecki and Raymo, 2005) associated with weakening of summer insolation. The glacial ice sheets then shrank during the mid-glacial period (MIS3, 57–29 ka; Lisiecki and Raymo, 2005), when the summer insolation and the concentration of CO2 were relatively large compared with MIS4 (Abe-Ouchi et al., 2007; Grant et al., 2012; Spratt and Lisiecki, 2016; Pico et al., 2017, Fig. 1). Subsequently, the ice sheets further expanded during MIS2 (29–14 ka; Lisiecki and Raymo, 2005), when the summer insolation and the concentration of CO2 were low, and reached their maximum volume at the Last Glacial Maximum (LGM; Peltier, 2004; Clark et al., 2009; Tarasov et al., 2012; Ishiwa et al., 2016). Because of these drastic differences in the ice sheet and climate compared with modern times, the last glacial period is considered important with respect to improving the understanding of the effect of ice sheets on climate.
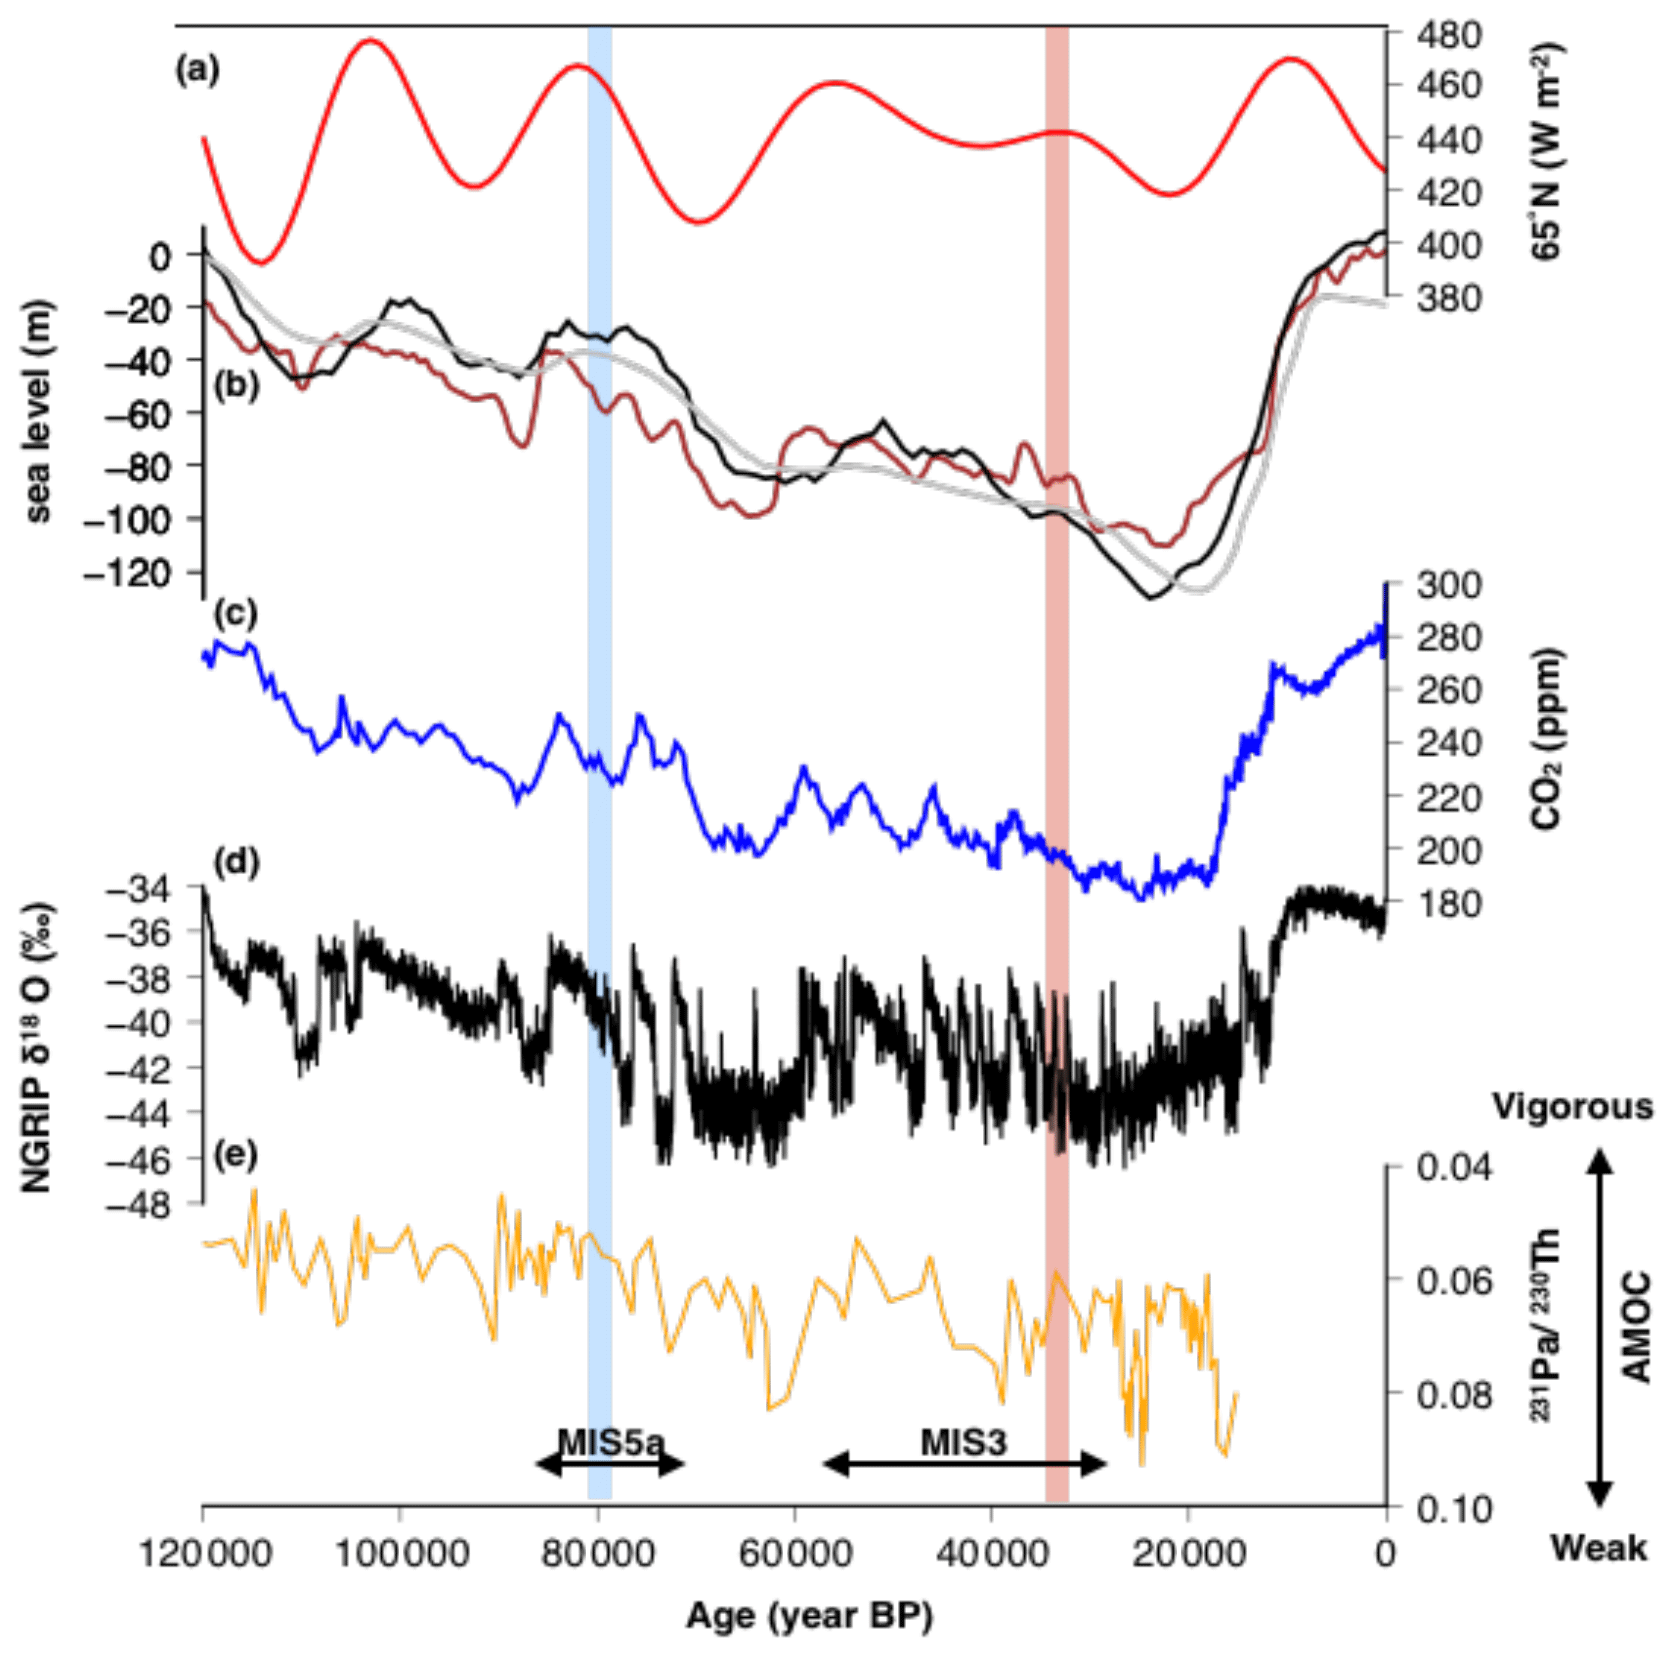
Figure 1Time series of climate records of the last glacial period: panel (a) shows the 65∘ N July insolation (W m−2); in panel (b), black represents sea level data from Spratt and Lisiecki (2016), brown represents sea level data from Grant et al. (2012), and gray represents the simulated time evolution of the sea level equivalent ice sheet volume from Abe-Ouchi et al. (2013); panel (c) shows CO2 (Bereiter et al., 2015); panel (d) shows the Greenland ice core δ18O from the North Greenland Ice Core Project (NGRIP) core (Rasumussen et al., 2013). Panel (e) shows the Bermuda Rise 231Pa ∕ 230Th (Bohm et al., 2015), which is a proxy for the strength of the AMOC. Red and blue shading correspond to the MIS3 and MIS5a target periods in our climate model simulations, respectively.
Previous studies have investigated the impact of glacial ice sheets on the climate under LGM background conditions, which is set as the target period in the Paleoclimate Modelling Intercomparison Project (PMIP; Braconnot et al., 2007, 2012; Abe-Ouchi et al., 2015; Kageyama et al., 2017). Based on reconstructions, the climate of the LGM is known to be the coldest and most stable period of the last glacial (Kindler et al., 2014; Kawamura et al., 2017). Furthermore, the Atlantic Meridional Overturning Circulation (AMOC) is considered to have been shallower and perhaps weaker compared with the preindustrial era (McManus et al., 2004; Bohm et al., 2015; Muglia et al., 2018; Menviel et al., 2020; Oppo et al., 2018). Modeling studies show that the expansion of the Northern American glacial ice sheet cause a large cooling, a strengthening of atmospheric circulation, and a southward shift of the rain belt over the North Atlantic (Cook and Held, 1988; Kageyama and Valdes, 2000; Abe-Ouchi et al., 2007; Laine et al., 2009; Pausata et al., 2011; Hofer et al., 2012; Löfverström et al., 2014; Merz et al., 2015). These studies have also shown that the response of the atmospheric circulation is largely affected by the height of the ice sheet (Gong et al., 2015; Merz et al., 2015), whereas the strength of the surface cooling is mainly controlled by the extent of the ice sheet (Abe-Ouchi et al., 2007).
Several studies using an atmosphere–ocean coupled general circulation model (AOGCM) have also shown that the glacial ice sheets exert a large impact on the AMOC. Many of these studies show a strengthening of the AMOC in response to the expansion of the northern glacial ice sheet (Eisenman et al., 2009; Brady et al., 2013; Zhang et al., 2014a; Gong et al., 2015; Klockmann et al., 2016; Brown and Galbraith, 2016; Kawamura et al., 2017), whereas one study shows a reduction of the AMOC (Kim, 2004). From sensitivity experiments, it is clearly shown that the higher Northern American glacial ice sheets enhance the surface wind as well as the wind-driven oceanic transport of salt into the deep-water formation region over the North Atlantic, which increases the surface salinity and causes a strengthening of the AMOC (Oka et al., 2012; Muglia and Schmittner, 2015; Sherriff-Tadano et al., 2018). Other studies also suggest the importance of changes in surface cooling (Smith and Gregory, 2012), which can cause either a strengthening of the AMOC by enhancing deep-water formation over the North Atlantic (Schmittner et al., 2002; Oka et al., 2012; Smith and Gregory, 2012) or a weakening of the AMOC by increasing the amount of sea ice over the northern North Atlantic and Southern Ocean (Kawamura et al., 2017). Nevertheless, due to the complicated coupling between the atmosphere and ocean in climate systems, the role of surface cooling by the glacial ice sheets on the AMOC still remains elusive.
While the effects of glacial ice sheets on the LGM climate have gained a large amount of attention, the effect of the pre-LGM glacial ice sheet on the global climate and AMOC has been less explored. Reconstructions of the ice sheets prior to the LGM still have large uncertainties, although recent studies suggest notable differences in ice sheets between the early glacial (MIS5a) and mid-glacial (MIS3). Between these two periods, the volume of ice sheets is slightly larger in MIS3 than in MIS5a (Lisiecki and Raymo, 2005; Grant et al., 2012; Abe-Ouchi et al., 2013; Spratt and Lisiecki, 2016; Pico et al., 2017; Willeit and Ganopolski, 2018). In addition, studies using ice sheet modeling have suggested a larger extent of the North American ice sheet in MIS3 compared with MIS5a, despite small differences in the maximum height of the ice sheet (Fig. 2; Abe-Ouchi et al., 2007, 2013; Niu et al., 2019). This is different from what is revealed with explorations using the LGM ice sheet, whose changes are large in both height and extent. Hence, by comparing the early-glacial and mid-glacial ice sheets, one may obtain different responses in the AMOC and global climate and may quantify the effect of changes in the ice sheet extent and the surface cooling.
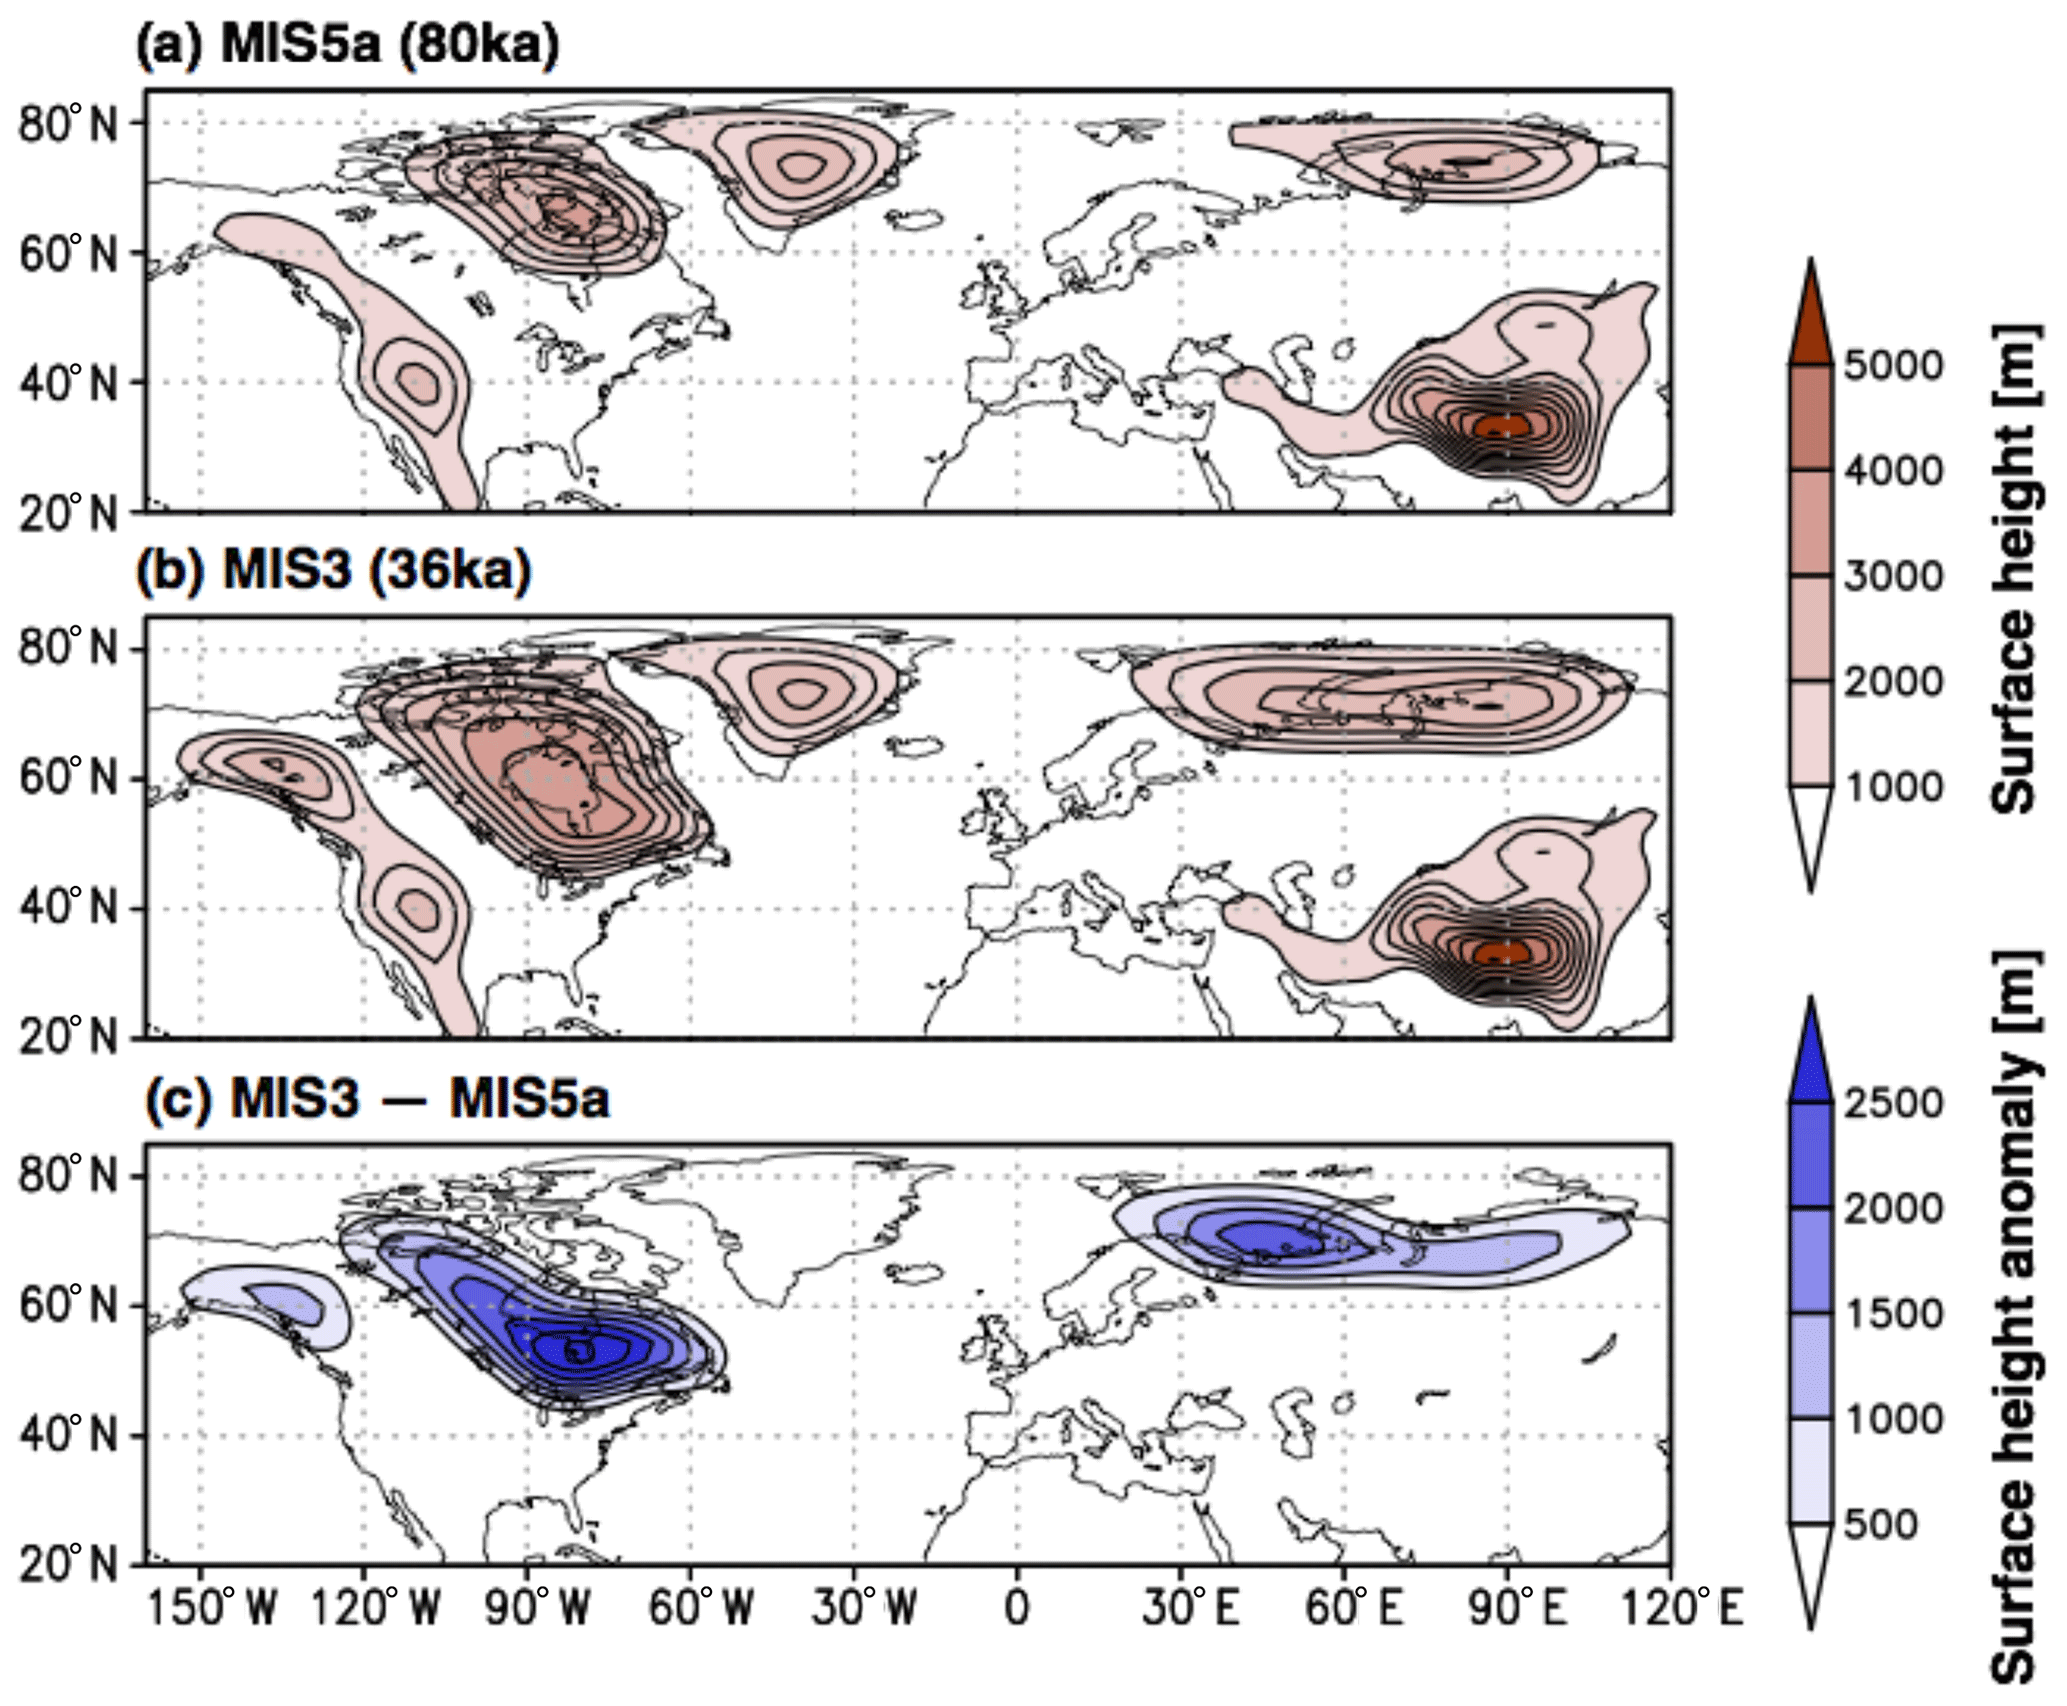
Figure 2Topography of (a) MIS5a (80 ka) and (b) MIS3 (36 ka). Results from an ice sheet model are presented (Abe-Ouchi et al., 2013). These ice sheet configurations are used for climate model simulations.
Furthermore, recent reconstructions show some discrepancies between the MIS3 and MIS5a climates. For example, it is shown that the AMOC is slightly weaker in MIS3 compared with that of MIS5a (Fig. 3; Bohm et al., 2015). Ice core data also show that the duration of the millennial timescale climate variability is shorter in MIS3 than in MIS5 (Capron et al., 2010; Buizert and Schmittner, 2015; Lohmann and Ditlevsen, 2019). Hence, by exploring the impact of the mid-glacial ice sheets on the global climate and AMOC, one can also assess the potential role of differences in ice sheets between MIS3 and MIS5a in causing the differences in the climate and AMOC between MIS3 and MIS5a.
In this study, we investigate the impact of the expansion of the mid-glacial ice sheets on the global climate and the AMOC. Specifically, we explore how the differences in the ice sheets between MIS3 and MIS5a have an impact on global climate and AMOC. For this purpose, we perform climate simulations of MIS3 and MIS5a with a comprehensive climate model. Furthermore, we explore the processes by which the changes in the ice sheet modify the AMOC. Particularly, we focus on the role of changes in surface cooling by the glacial ice sheets on the AMOC, which is also considered important in driving the AMOC changes (Loving and Vallis, 2005; Arzel et al., 2010; Oka et al., 2012; Sun et al., 2016; Jansen, 2017) but still remains elusive in previous LGM studies. For this purpose, partially coupled experiments are conducted (Mikolajewicz and Voss, 2000; Schmittner et al., 2002; Gregory et al., 2005; Sherriff-Tadano and Abe-Ouchi, 2020). In this experiment, the atmospheric forcing that drives the oceanic component is switched (one by one) to a different forcing. For example, Gregory et al. (2005) apply this method to interpret the cause of the weakening of the AMOC in the CO2 doubling simulations in the CMIP3 models. They find that the changes in surface heating play a large role in causing the weakening of the AMOC by reducing the heat exchange between the atmosphere and the ocean. Hence, the use of partially coupled experiments enables us to extract the effect of changes in surface cooling due to the mid-glacial ice sheets on the AMOC.
This study is organized as follows. In Sect. 2, we describe the model and the experimental design. In Sects. 3 and 4, we show the results of MIS3 and MIS5a simulations and then investigate the role of mid-glacial ice sheets on the global climate and the AMOC. The effect of surface cooling by the mid-glacial ice sheet is also explored by means of partially coupled experiments. Sections 5 and 6 discuss and summarize the results, respectively.
2.1 Model
We perform numerical experiments with the Model for Interdisciplinary Research on Climate 4m (MIROC4m; Hasumi and Emori, 2004; Chan et al., 2011) AOGCM. This model consists of an atmospheric general circulation model (AGCM) and an oceanic general circulation model (OGCM). The AGCM solves the primitive equations on a sphere using a spectral method. The horizontal resolution of the atmospheric model is ∼ 2.8∘, and there are 20 vertical layers. The AGCM is coupled to a land surface model. The OGCM solves the primitive equation on a sphere, where the Boussinesq and hydrostatic approximations are adopted. The horizontal resolution is ∼ 1.4∘ (longitude) by 0.56–1.4∘ (latitude), and the latitudinal resolution is finer near the Equator. There are 43 vertical layers. It is coupled to a dynamic–thermodynamic sea ice model. Note that the coefficient of the isopycnal layer thickness diffusion in the OGCM is slightly increased to 700 m2 s−1 from 300 m2 s−1 in the original model version that was submitted to PMIP2 (these two model versions are referred to as Model B and Model A, respectively, in Sherriff-Tadano and Abe-Ouchi, 2020). The model version used in this study reproduces the modern AMOC (Fig. 6d), the deep-water formation over the Nordic seas (Fig. S1 in the Supplement), and the sea ice extent over the North Atlantic (Fig. 4) reasonably well, as in the previous version (Otto-Bliesner et al., 2007; Weber et al., 2007; Kawamura et al., 2017). While the current model version overestimates sea ice extent and lacks deep-water formation over the Labrador Sea (Figs. S1, 4), the performance of the modern Southern Ocean sea ice extent has improved compared with the previous version (Fig. 4). This model version has been used extensively for paleoclimate (Obase and Abe-Ouchi, 2019) and future climate studies (Yamamoto et al., 2015). It has a climate sensitivity of 4.1 K and reproduces the AMOC of the LGM reasonably well (Sherriff-Tadano and Abe-Ouchi, 2020).
2.2 Model simulations
Three experiments are conducted with the MIROC4m AOGCM (Table 1). The first experiment is named MIS5a, which aims at a period of approximately 80 ka (Fig. 1, blue shading). In this experiment, we apply a CO2 level of 240 ppm, insolation of 80 ka, and an ice sheet boundary configuration of 80 ka taken from an ice sheet model (see the next paragraph for detailed information). The second and third experiments are performed under MIS3 boundary conditions with a CO2 of 200 ppm and an insolation of 35 ka (Fig. 1, red shading). In these two experiments, the configurations of the ice sheets differ (Fig. 2). In the second experiment, we apply an ice sheet of 36 ka (Fig. 2b). In the third experiment, we apply an ice sheet of 80 ka (Fig. 2a). These experiments are named MIS3 and MIS3-5aice, respectively (Table 1). Note that the Antarctic ice sheet is fixed to the modern configuration. The global sea level is unchanged, and the land sea mask outside the northern glacial ice sheet region is same as the modern configuration (e.g., the Bering Strait remains open, which itself may impact on the AMOC; Hu et al., 2015). For methane and other greenhouse gases, the concentration of the LGM is used (Dallenbach et al., 2000). By comparing MIS3 and MIS3-5aice, one can assess the impact of mid-glacial ice sheets on the global climate and AMOC. The difference between MIS3-5aice and MIS5a shows the effect of changes in CO2 and insolation.
Table 1Forcing and boundary conditions of climate simulations. Results of global mean temperature (GMT) and Atlantic Meridional Overturning Circulation (AMOC) are also shown. For reference, the results of the preindustrial climate simulation is shown.
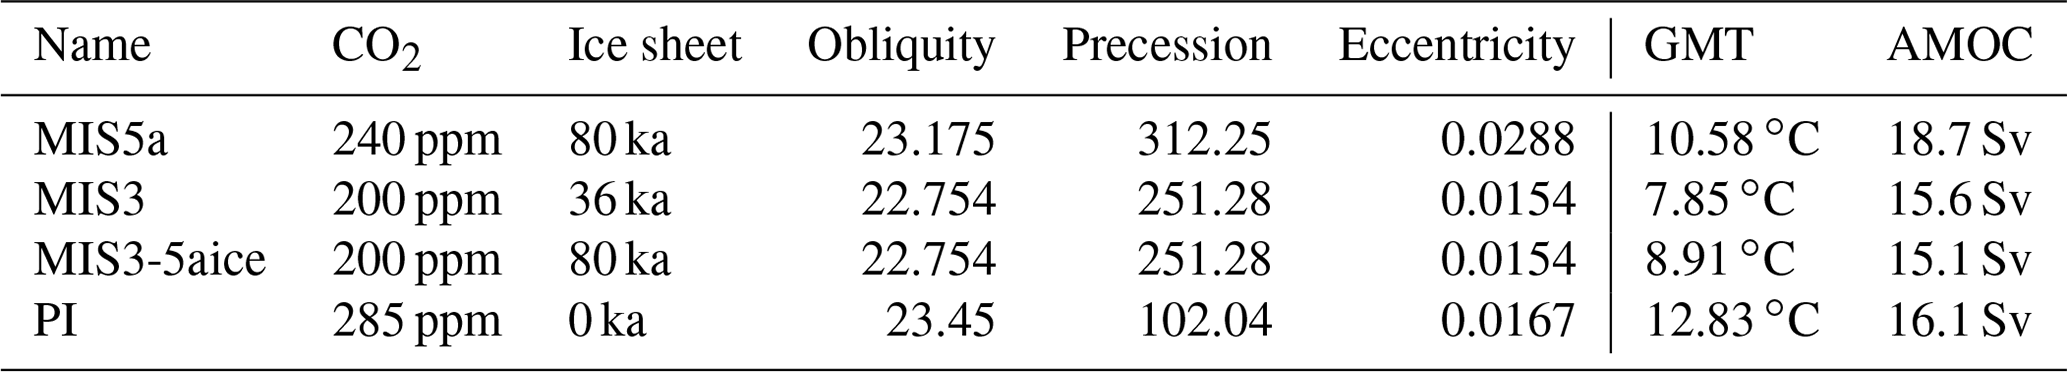
For the ice sheet forcing, we use the output from the Ice sheet model for Integrated Earth system Studies (IcIES; Saito and Abe-Ouchi, 2005) driven with the climatic parameterization derived from MIROC (IcIES-MIROC; Abe-Ouchi et al., 2007, 2013). This model reproduces the evolution of the Northern Hemisphere ice sheet over the past 400 000 years (Abe-Ouchi et al., 2013), and it is used as a boundary condition for the simulations of the Penultimate Glacial Termination (Menviel et al., 2019). The model also reproduces the general pattern of the evolution of the global ice sheet volume (or equivalent sea level change) over the last glacial period reasonably well (Fig. 1; Abe-Ouchi et al., 2013) – that is, larger ice sheets during MIS3 compared with MIS5a (Grant et al., 2012; Spratt and Lisiecki, 2016; Pico et al., 2017). These volumes are the 40 m sea level equivalent for MIS5a (approximately 33 % of the LGM) and the 96 m sea level equivalent for MIS3 (approximately 80 % of the LGM; Abe-Ouchi et al., 2013). The volume of the MIS3 ice sheet slightly exceeds the estimated range of sea level reconstructions: approximately 40 to 90 m sea level equivalent during the mid-glacial (Grant et al., 2012; Spratt and Lisiecki, 2016; Pico et al., 2017). This is further discussed in Sect. 5.
The three simulations are initiated from the previous LGM experiment of Kawamura et al. (2017), which has a weak and shallow AMOC. MIS5a is integrated for 2000 years, and MIS3 and MIS3-5aice are integrated for 3000 years. After the integration, the AMOC settles into a vigorous mode (interstadial mode) in all experiments. Decreasing trends of deep ocean temperature of the last 100 years are 0.002 ∘C in MIS5a, 0.011 ∘C in MIS3, and 0.007 ∘C in MIS3-5aice. Hence, these simulations have settled to quasi-equilibrium states (Zhang et al., 2013).
2.3 Partially coupled experiments
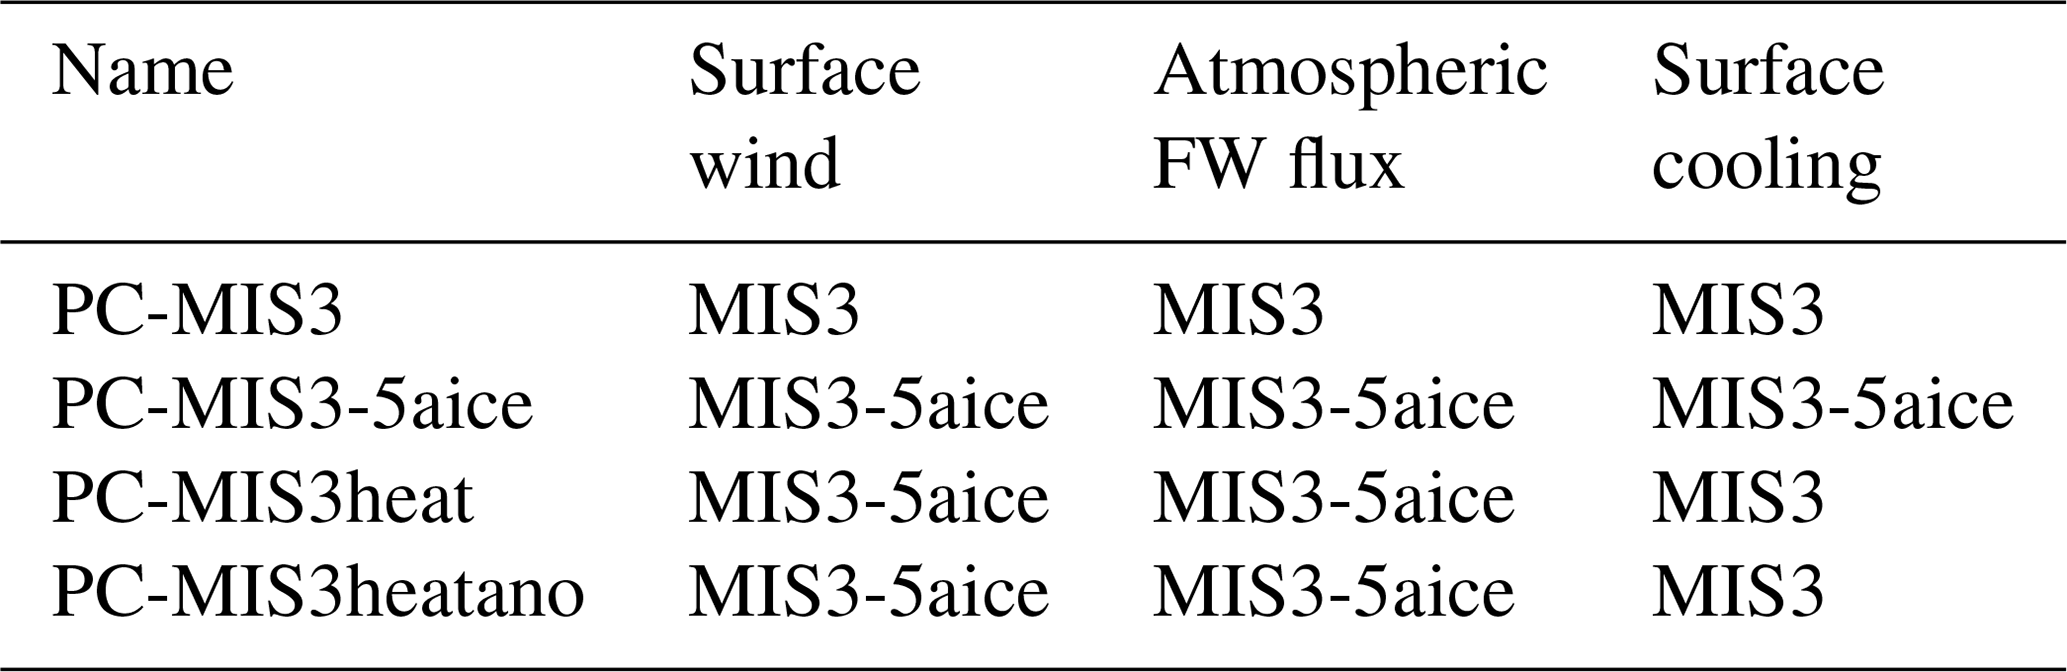
To assess the processes by which the mid-glacial ice sheets modify the AMOC, partially coupled experiments are conducted (Table 2). In these experiments, the atmospheric forcing – wind stress and atmospheric freshwater flux (precipitation, evaporation, and river runoff) – that drives the ocean is replaced with a monthly climatology. Following previous studies (Schmittner et al., 2002; Gregory et al., 2005), the heat flux is unchanged in these experiments. This is because the heat flux is strongly coupled to the sea surface temperature and fixing the surface heat condition has an unrealistic impact on the AMOC (Marozke, 2012). Four partially coupled experiments are conducted based on the MIS3 and MIS3-5aice experiments (Table 2). These experiments are initiated from the last year (year 3000) of MIS3 or MIS3-5aice. The first experiment (PC-MIS3) is intended as a validation of the method. In this experiment, the atmospheric forcing is replaced with the monthly climatology of the last 100 years of the same MIS3 experiment. Hence, the climatological atmospheric forcing is identical to that of the original experiment. The second experiment (PC-MIS3-5aice) is also conducted in a similar manner under MIS3-5aice, using the monthly climatology of MIS3-5aice. The third experiment is conducted under MIS3 conditions (PC-MIS3heat), where the wind forcing and atmospheric freshwater forcing are replaced with the monthly climatology of MIS3-5aice. Hence, the oceanic component of the model is forced by wind and atmospheric freshwater fluxes of MIS3-5aice and the surface heat flux of MIS3 (Table 2). By comparing the results between PC-MIS3heat and PC-MIS3-5aice, one can evaluate the effect of surface cooling on the oceanic circulation (Gregory et al., 2005). Note that the effect of surface cooling includes changes in freshwater flux from the sea ice in addition to changes in an atmosphere–ocean heat exchange. In the fourth experiment (PC-MIS3heatano), the effect of surface cooling is evaluated in a slightly different way. In this experiment, we apply the anomalies of monthly climatology of surface wind and atmospheric freshwater flux between MIS3 and MIS3-5aice to MIS3. Hence, this experiment is also forced by winds and atmospheric freshwater fluxes of MIS3-5aice and the surface heat flux of MIS3 (Table 2). By comparing the MIS3-5aice experiment with PC-MIS3heatano, we can estimate the effect of surface cooling on the oceanic circulation. The advantage of this experiment is that it retains high-frequency variabilities in the atmospheric forcing, which are removed in other partially coupled experiments. In addition, this experiment retains the effect of atmospheric feedback after a modification to the AMOC, which affects the stability of the AMOC (Sherriff-Tadano and Abe-Ouchi, 2020; see also Sect. 5). Note that the final results are independent of the choice of the atmospheric forcing applied.
Table 2Partially coupled experiments. In PC-MIS3heatano, climate anomalies in surface wind and atmospheric freshwater (FW) flux between MIS3-5aice and MIS3 are added to MIS3.
The simulated global cooling for MIS3 and MIS5a compared with the preindustrial climate (PI) are 5.0 and 2.2 ∘C, respectively (Fig. 3). The magnitudes of these global surface coolings are smaller than that obtained from the LGM simulation (5.2 ∘C) with the same model (Sherriff-Tadano and Abe-Ouchi, 2020). The strong MIS3 cooling similar to that of LGM is possibly related to the low obliquity applied in MIS3, which increases the amount of sea ice in both hemispheres and causes a global cooling through feedbacks within the atmosphere–ocean coupled system (Galbraith and de Lavergne, 2019). Nevertheless, the simulated MIS3 cooling falls within the range of simulations obtained from previous modeling studies: Guo et al. (2019) simulate the MIS3 climate with the boundary conditions of 38 ka and show a global cooling of 2.9 ∘C; Merkel et al. (2010) show a cooling of 3.4 ∘C under 35 ka boundary conditions; Zhang et al. (2014b) show a cooling of 3.5 ∘C under 38 ka boundary conditions; and Brandefelt et al. (2011) show a global cooling of 5.5 ∘C under 44 ka boundary conditions.
The spatial maps of the surface cooling show a well-known polar amplification pattern (Fig. 3). In MIS3 and MIS5a, the largest cooling takes place over North America and northern Europe as the ice sheets expand southward. In these regions, the surface air temperature drops by more than 10 ∘C and is associated with the high albedo and elevation of the ice sheets. The surface cooling is also large over the Southern Ocean, where the local surface cooling exceeds 10 and 3 ∘C for MIS3 and MIS5a, respectively. The surface cooling is relatively mild over the tropics compared with the polar regions, and the areal average cooling over 30∘ S and 30∘ N is 3.5 and 1.7 ∘C for MIS3 and MIS5a, respectively.
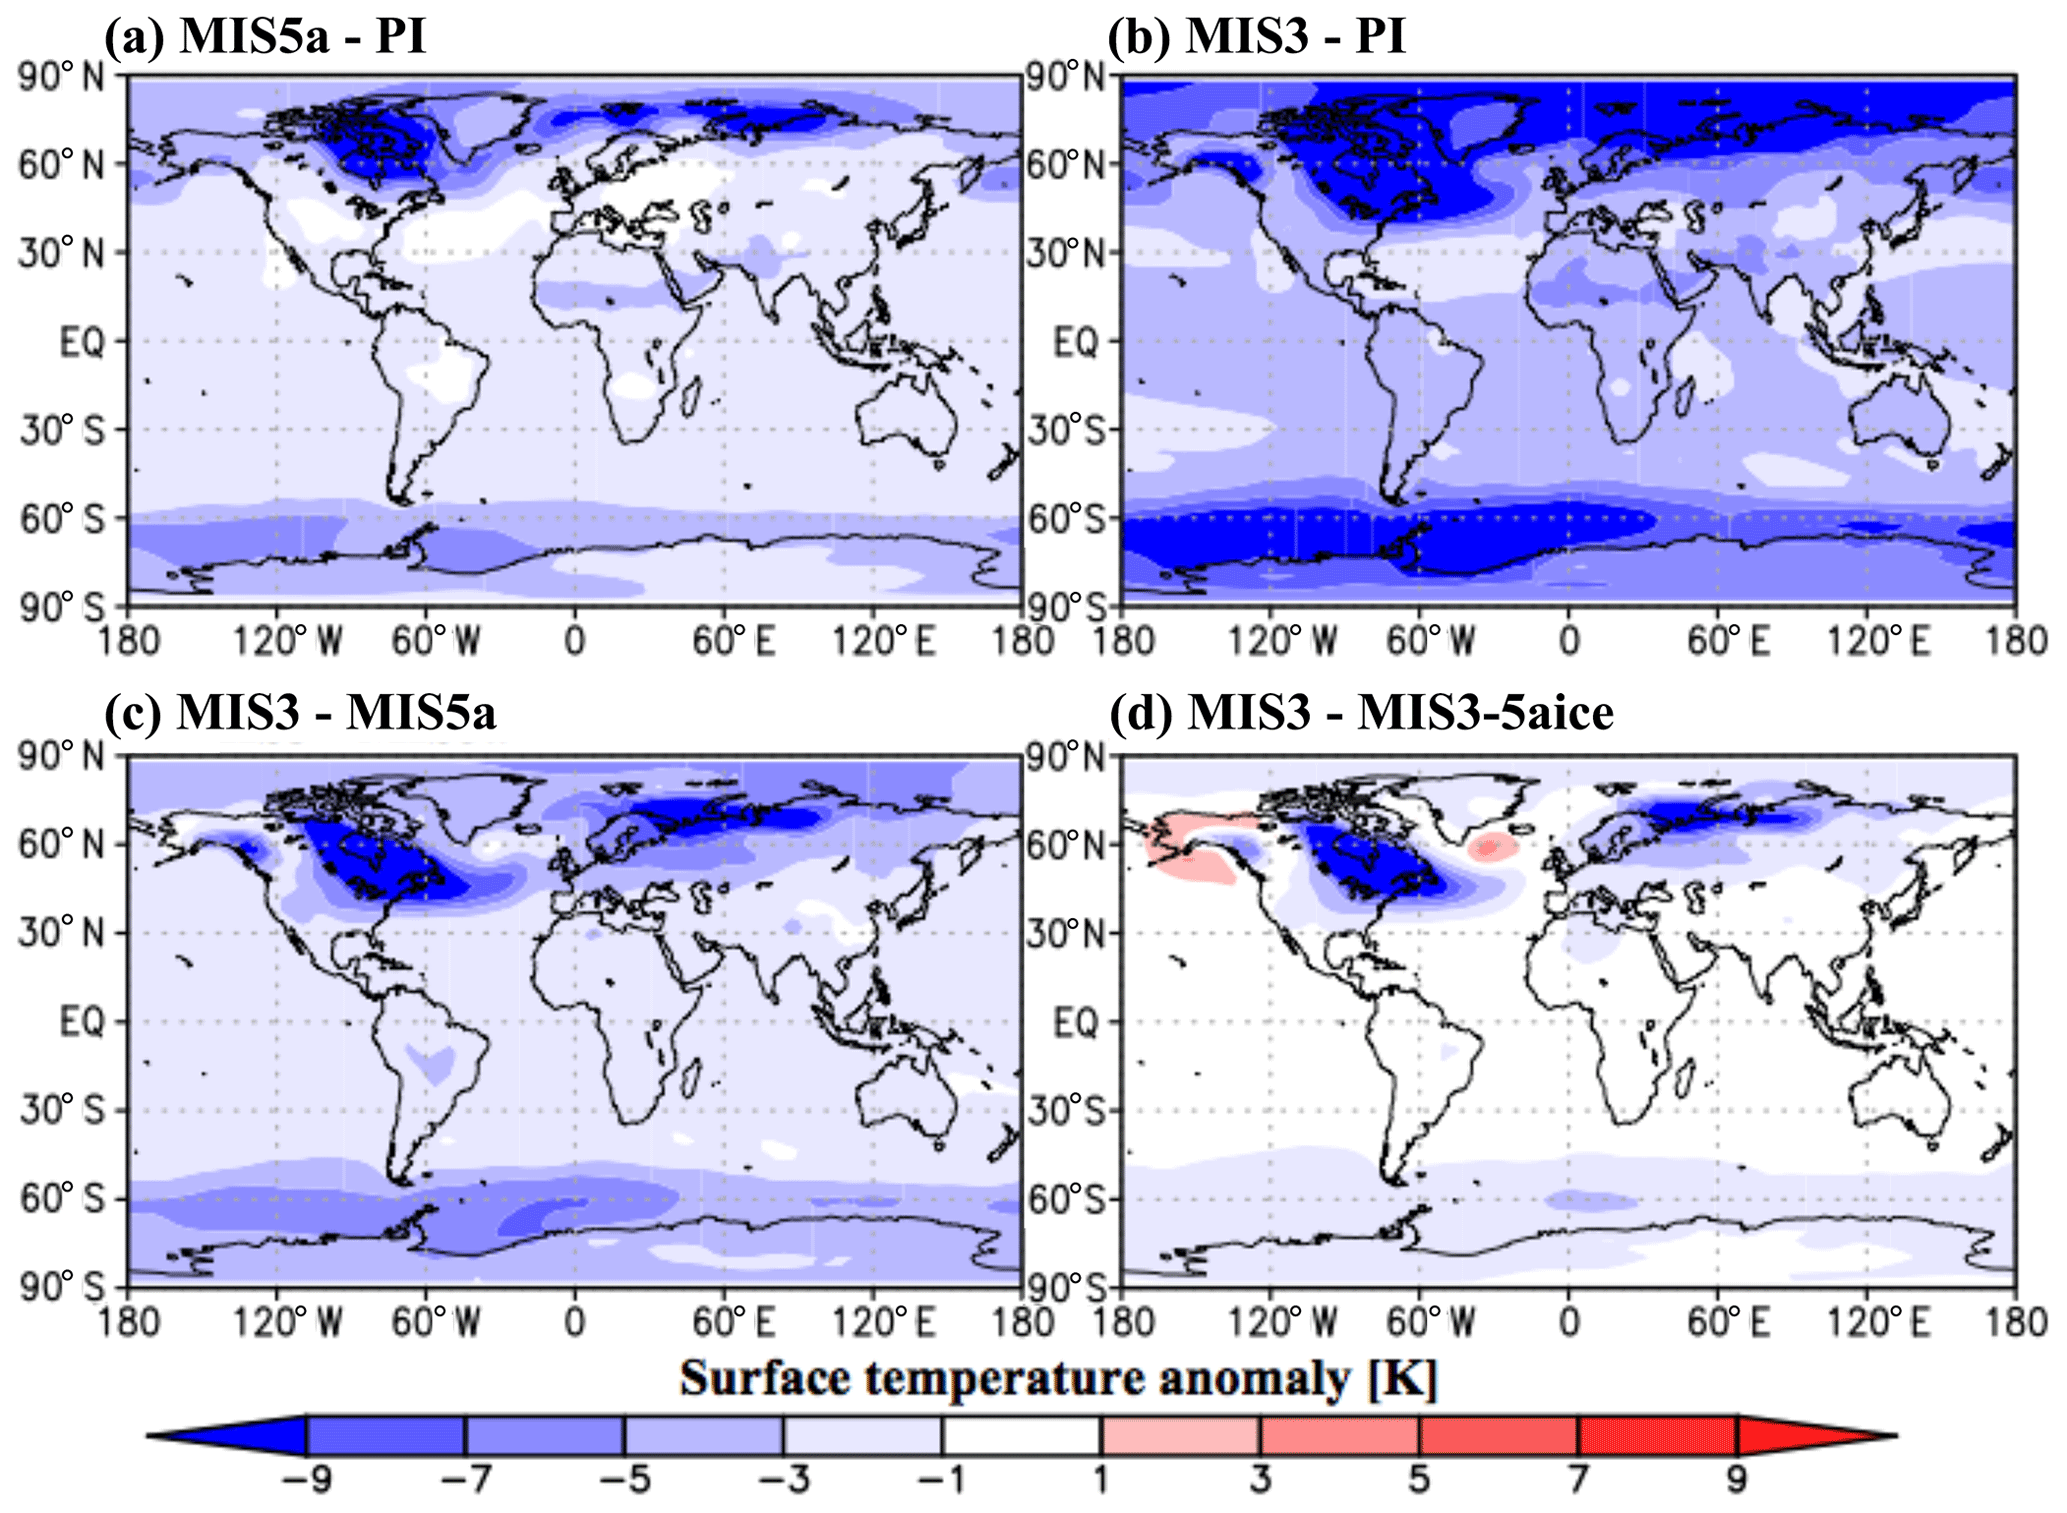
Figure 3Surface air temperature anomalies calculated from the AOGCM. The 100-year climatology is used to calculate the anomalies. Panel (a) shows MIS5a minus PI, and panel (b) shows MIS3 minus PI. In panel (c), the differences between MIS3 and MIS5a are shown. In panel (d), the effect of ice sheet expansion from MIS5a to MIS3 is shown (MIS3 minus MIS3-5aice).
The amplified cooling over the polar regions is associated with the expansion of sea ice (Fig. 4). Over the North Atlantic, the Labrador Sea is covered by sea ice in all experiments. Sea ice also expands southward over the Norwegian Sea, although the southern part of the Norwegian Sea still remains ice-free (Dokken et al., 2013; Sadazki et al., 2019). These expansions in sea ice are consistent with a large surface cooling simulated in the northern North Atlantic. Over the Southern Ocean, sea ice expands northwards in both experiments compared with the PI. In MIS3, sea ice largely expands northward in the Pacific sector of the Southern Ocean and contributes to the large surface cooling observed in that region. In association with the increase in the amount of sea ice, the deep ocean salinity increases and deep ocean temperature decreases in MIS3 compared with PI (Fig. 5b, e). A similar feature is also observed in MIS5a, although with a smaller magnitude (Fig. 5a, d). Note that the decrease in ocean temperature is also attributed to the cooling of the North Atlantic Deep Water (NADW; Fig. 5b).
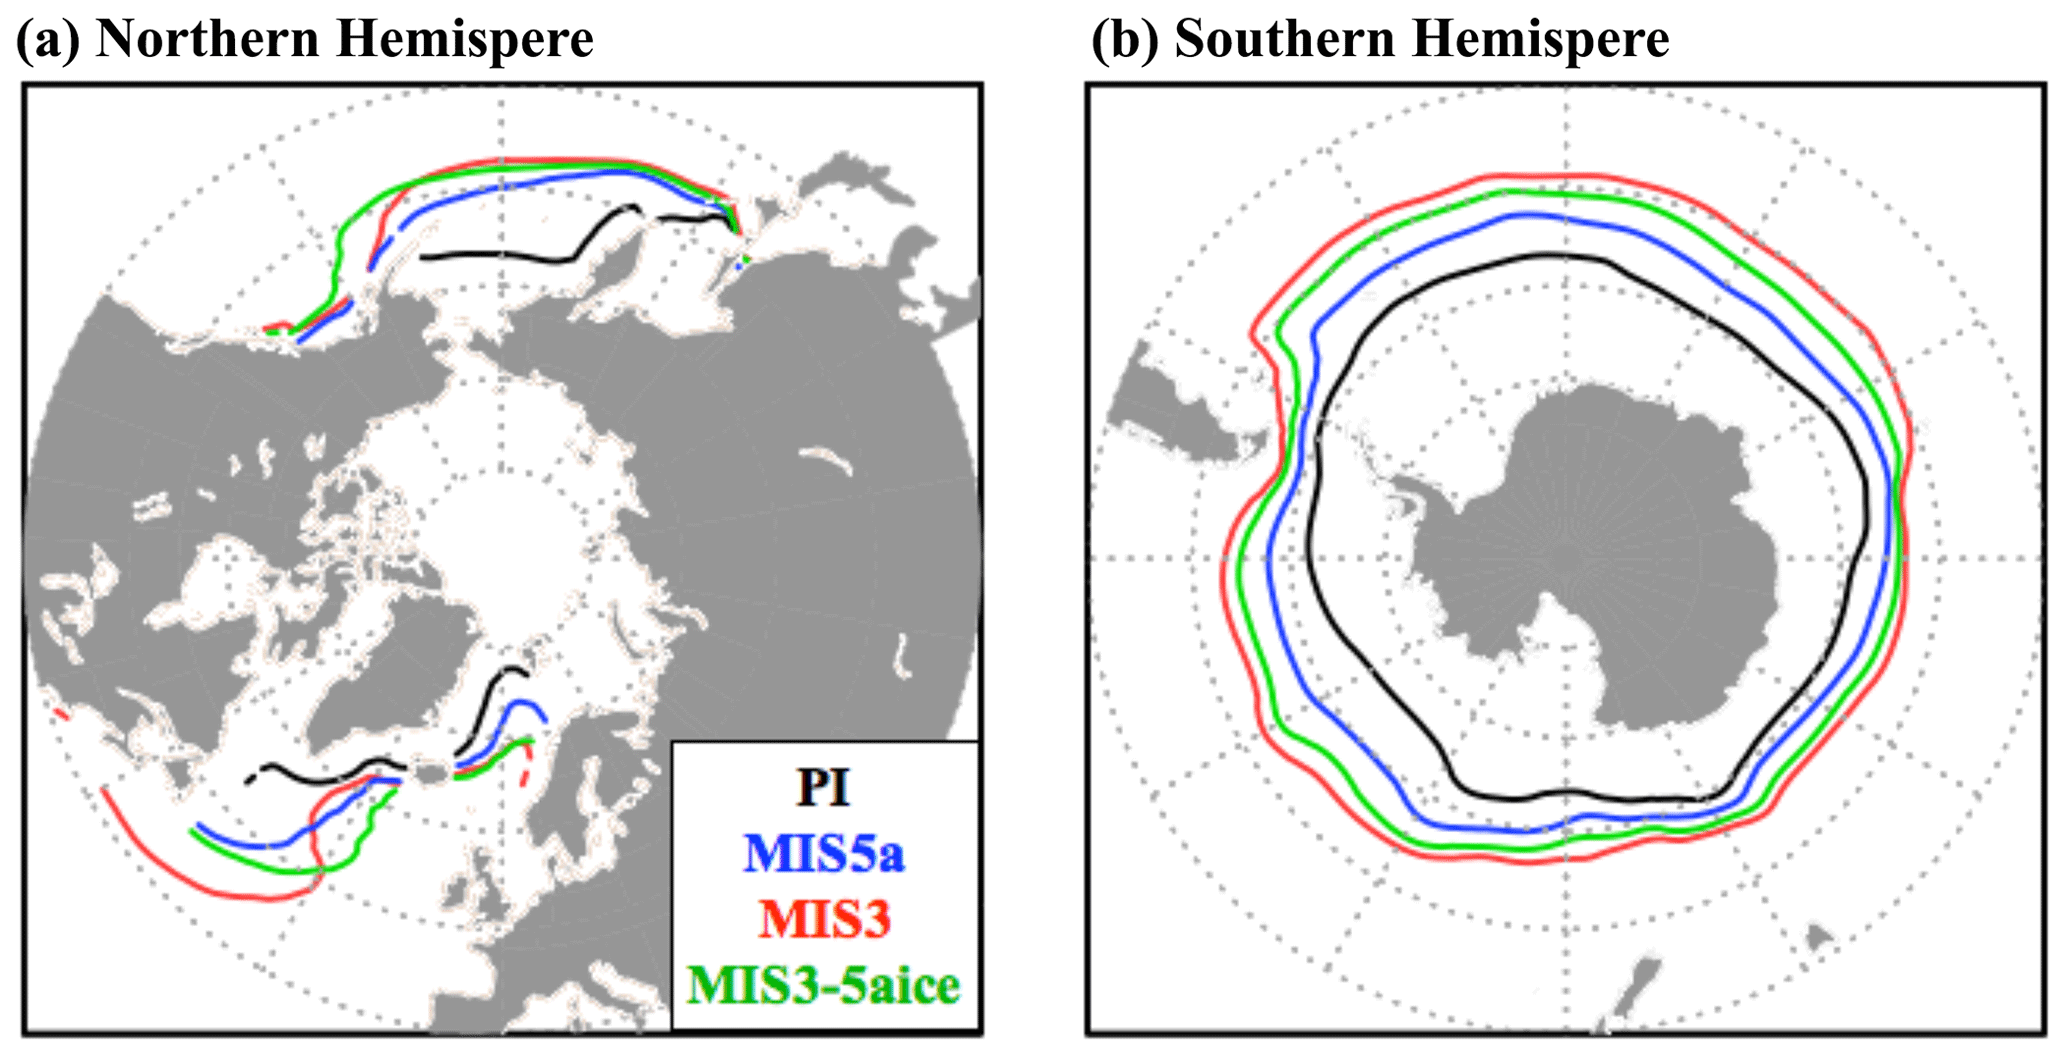
Figure 4Annual mean sea ice coverage simulated from the AOGCM. The coverage is defined by a 15 % sea ice concentration. A 100-year average is used. Panel (a) shows the Northern Hemisphere, and panel (b) shows Southern Hemisphere. Black represents PI, blue represents MIS5a, red represents MIS3, and green represents MIS3-5aice.
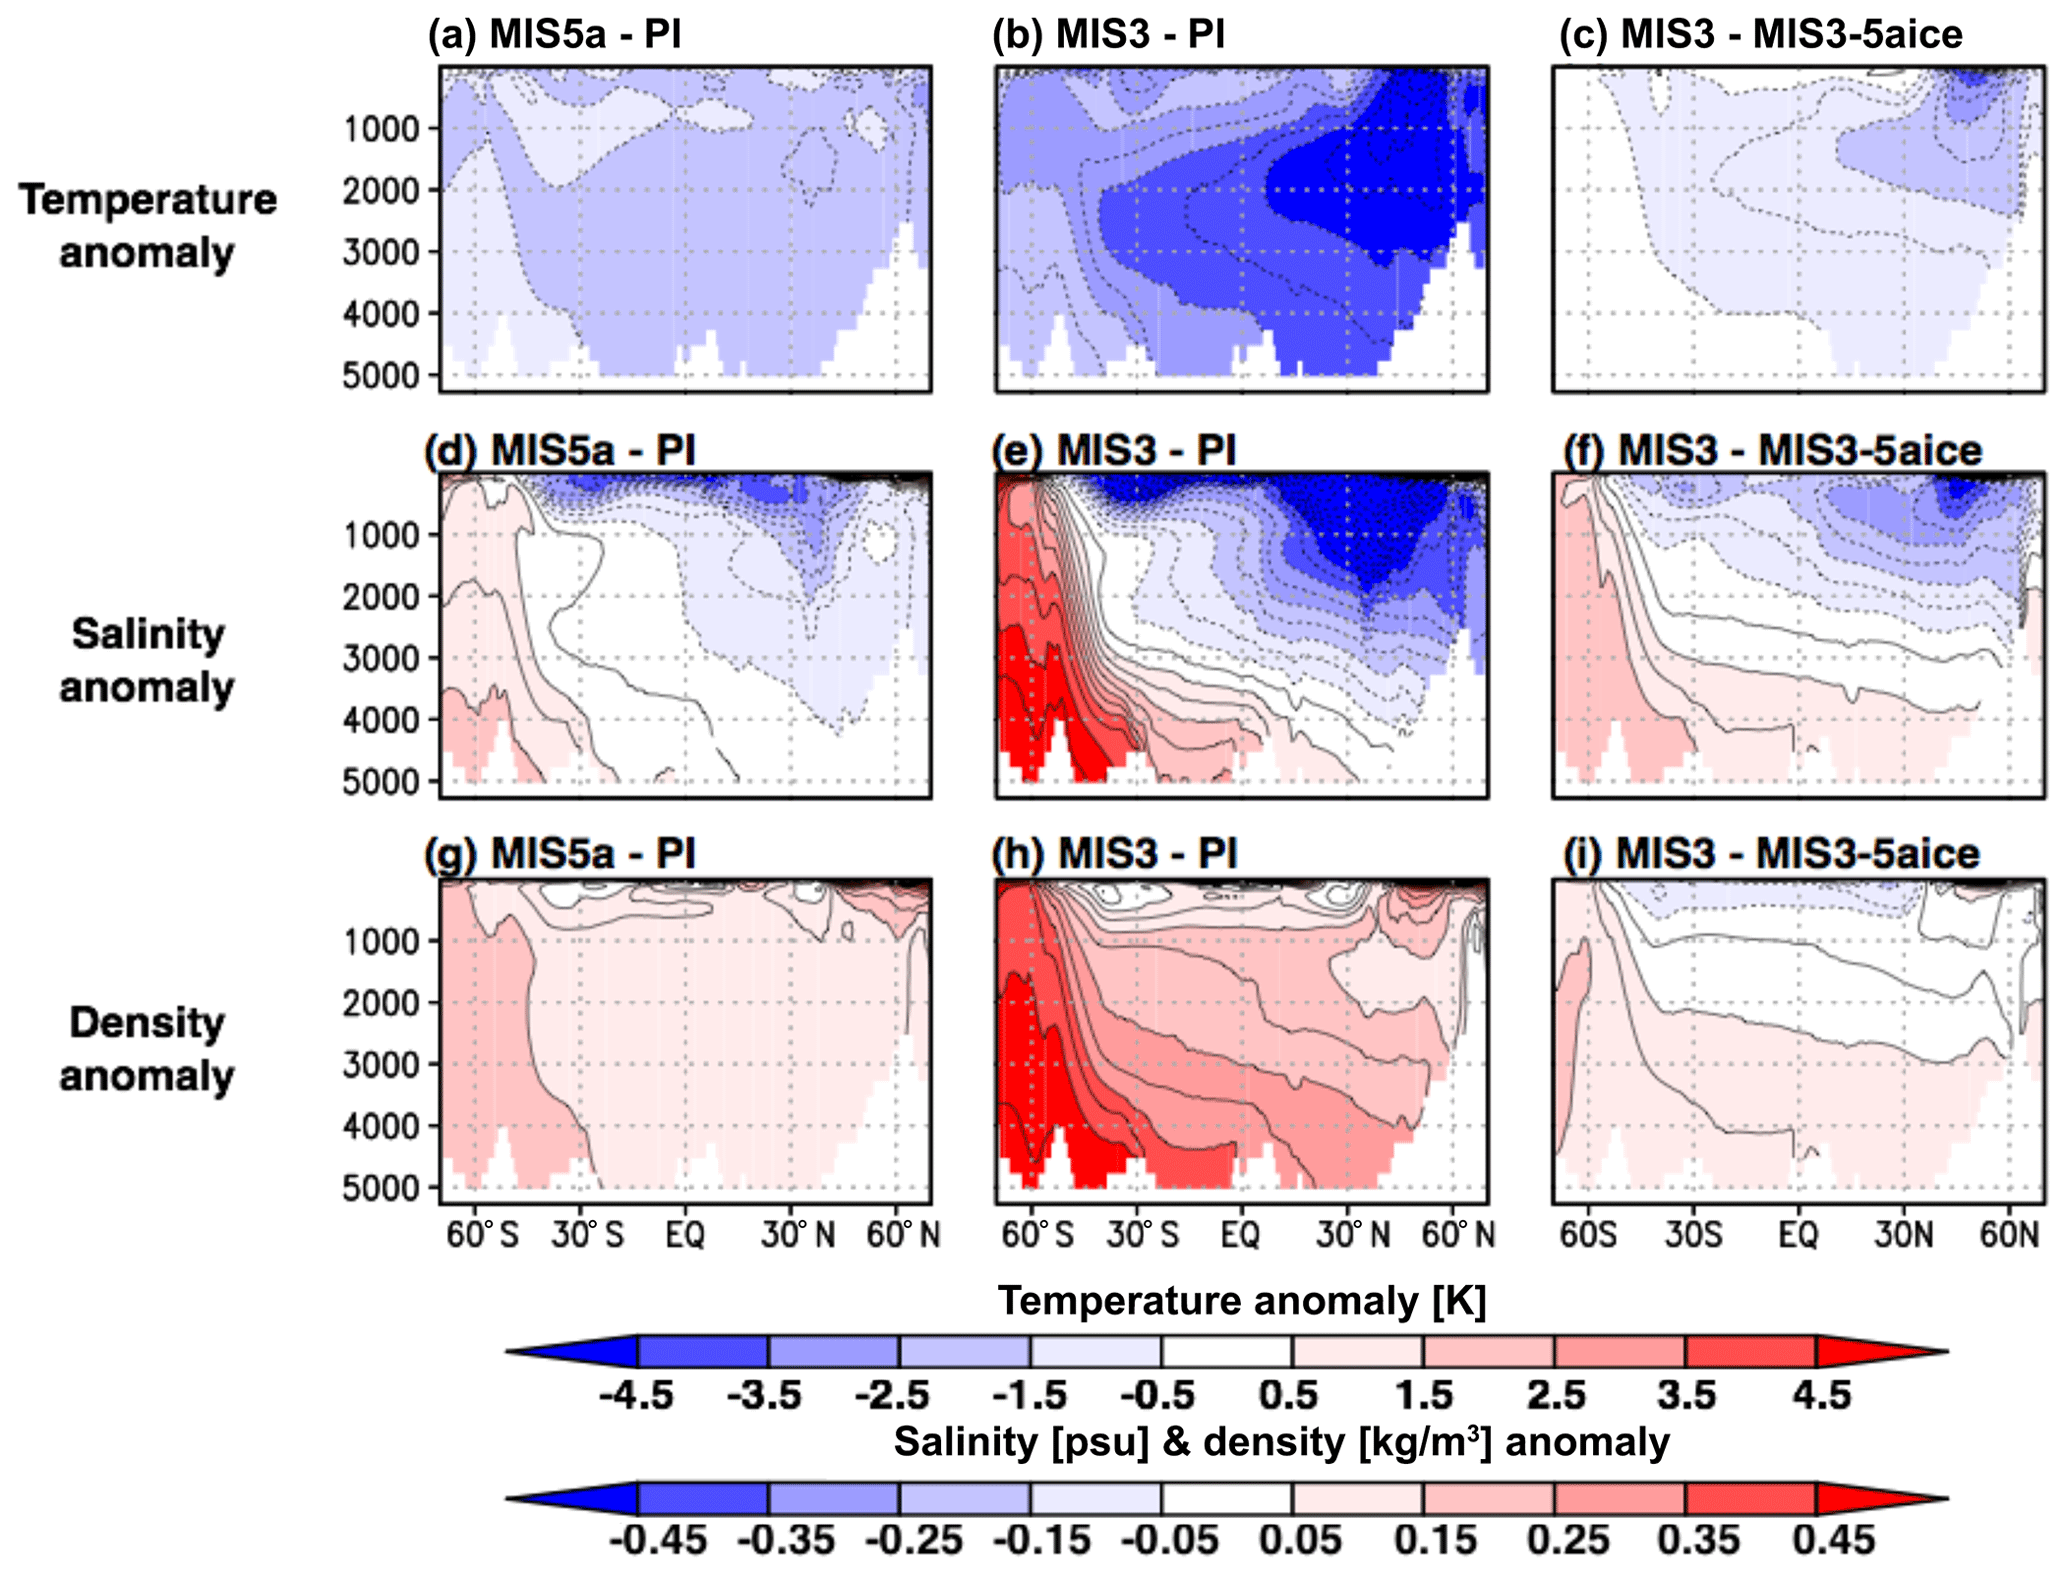
Figure 5Anomalies of zonally averaged oceanic properties over the Atlantic simulated from the AOGCM. Panels (a)–(c) show temperature anomalies, panels (d)–(f) show salinity anomalies, and panels (g)–(i) show density anomalies. Panels (a), (d), and (g) show MIS5a minus PI, panels (b), (e), and (h) show MIS3 minus PI, and panels (c), (f), and (i) show MIS3 minus MIS3-5aice. The climatology of the last 100 years is used to create these figures.
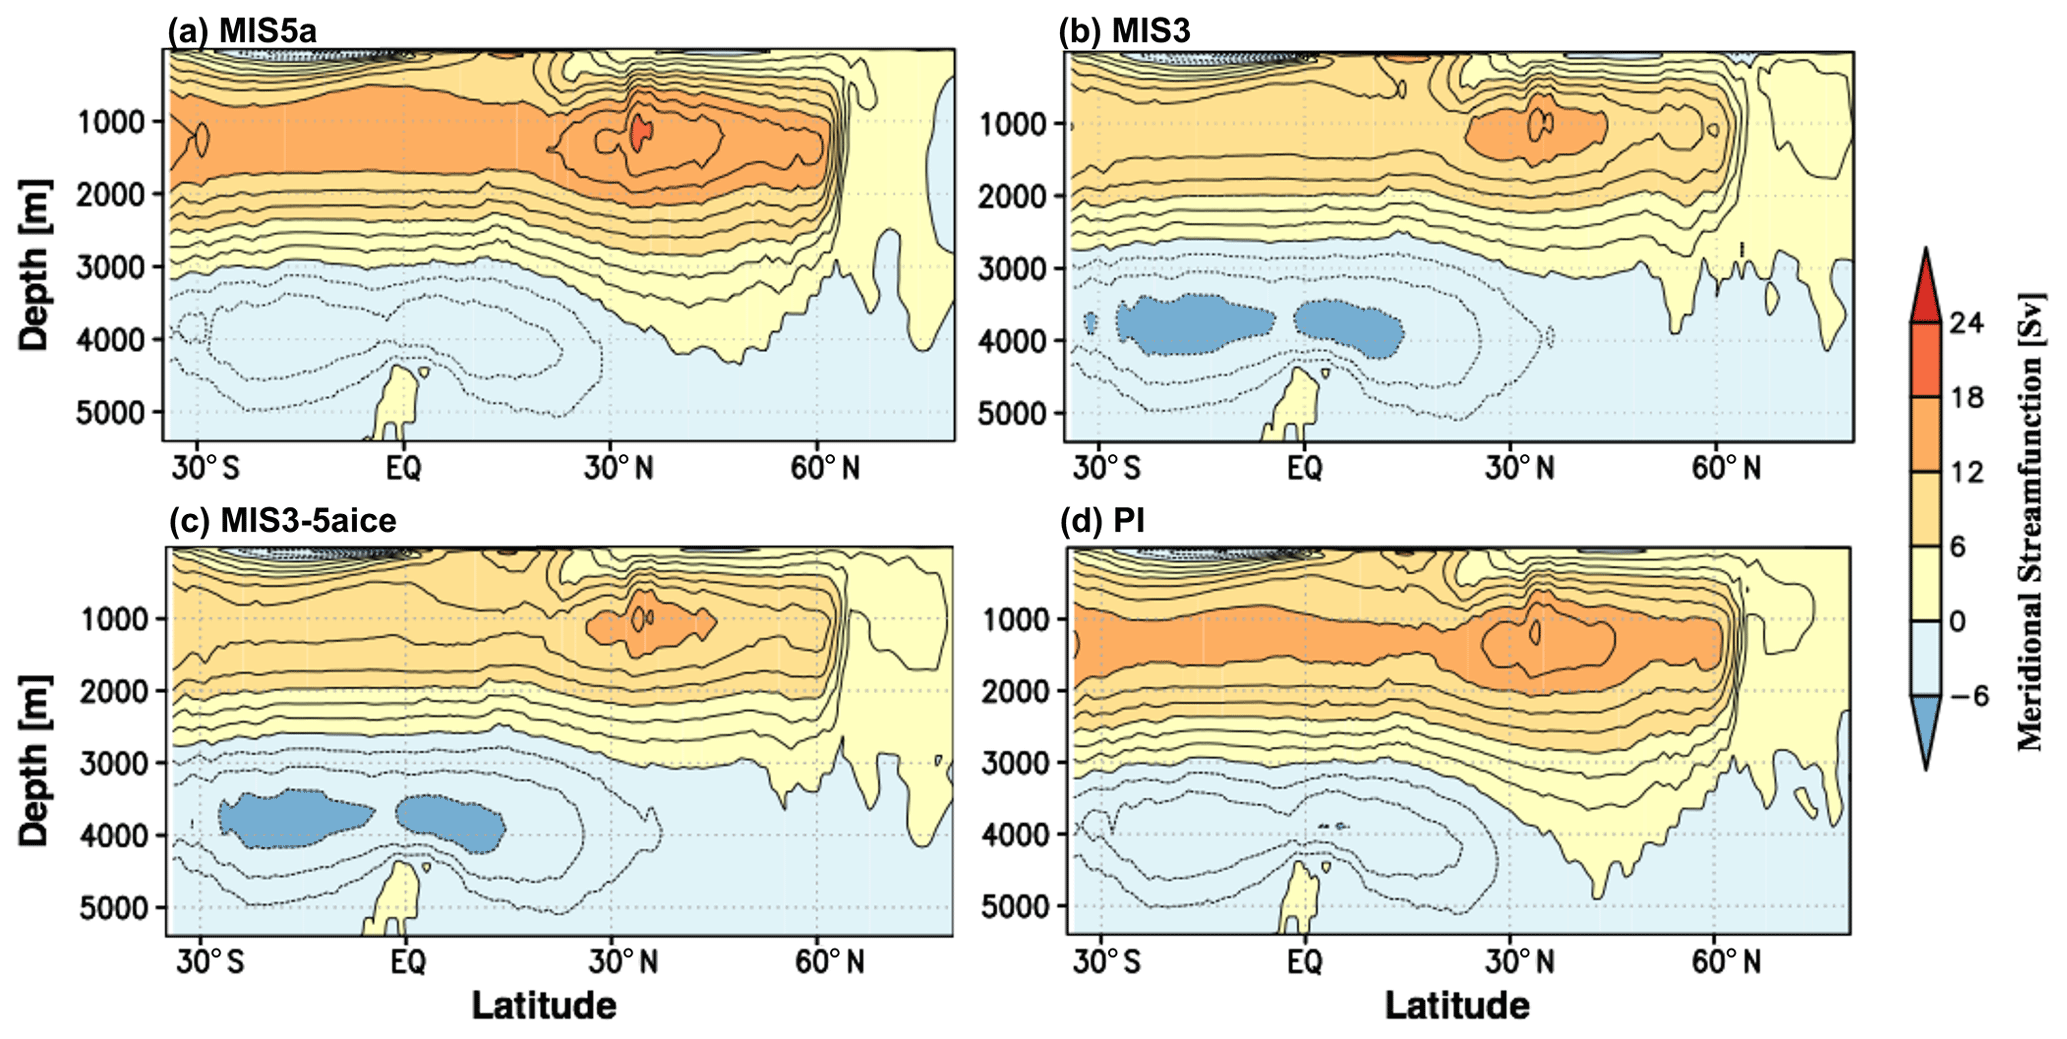
Figure 6Meridional streamfunction (Sv = 106 m3 s−1) over the Atlantic simulated from the AOGCM. Panel (a) shows MIS5a, panel (b) shows MIS3, panel (c) shows MIS3-5aice, and panel (d) shows PI. The climatology of the last 100 years is used to create these figures.
Both the MIS3 and MIS5a experiments simulate an interstadial mode of the AMOC (Fig. 6a, b). This is in line with an ice-free condition over the Norwegian Sea and Irminger Sea, where deep water forms due to intense surface cooling (Dokken et al., 2013; Sadazki et al., 2019). Nevertheless, the strength of the AMOC responds differently to MIS3 and MIS5a boundary forcing (ice sheet, CO2, and insolation). In MIS3, the maximum strength of the AMOC decreases by 3 % (−0.5 Sv; Table 1) and the AMOC shoals compared with the PI (Fig. 6b, d). In contrast, the AMOC strengthens in MIS5a by 16 % (+2.6 Sv) and shows small changes in depth compared with the PI (16.1 Sv; Fig. 6a, d, Table 1). These simulated characteristic of MIS3 and MIS5a are consistent with a reconstruction showing a slightly stronger AMOC in MIS5a and a slightly weaker AMOC in MIS3 (Bohm et al., 2015, Fig. 1). Therefore, the simulations of MIS3 and MIS5a capture the large-scale features of climate and deep ocean circulation reasonably well.
4.1 Global climate and deep ocean circulation
The results of MIS3-5aice are used to extract the effect of the southward expansion of mid-glacial ice sheets from MIS5a to MIS3 on the global climate as well as the AMOC. The simulated global cooling in MIS3-5aice is 3.9 ∘C. This gives a global surface cooling of 1.1 ∘C by the expansion of mid-glacial ice sheets (difference between MIS3 and MIS3-5aice) and a global cooling of 1.7 ∘C by the lowering of CO2 and changes in insolation (difference between MIS3-5aice and MIS5a). The southward expansion of the northern glacial ice sheets induces a large surface cooling over the North America, northern Europe, and the northern North Atlantic (Fig. 3d). The latter is induced by a vigorous advection of cold air from the North American ice sheet, which expands near the Labrador Sea (Fig. 8b). A slight warming is observed in the Irminger Sea, which is associated with a slight shift in the deep-water formation region and sea ice. A surface warming is also observed around Alaska (Fig. 3d). This is associated with the strengthening of the southerly wind over the eastern North Pacific, which is related to the high surface pressure anomaly over North America induced by the expansion of the glacial ice sheet (Yanase and Abe-Ouchi, 2010).
Interestingly, the expansion of the mid-glacial ice sheet exerts an impact on the Southern Ocean by causing a surface cooling of 2 ∘C (Fig. 3d). This surface cooling is solely induced by the northern mid-glacial ice sheets, because the configuration of the Antarctic ice sheet is fixed to that of the PI. Similar results are reported in Ganopolski and Roche (2009) and Roberts and Valdes (2017). These studies show that a stronger northward oceanic heat transport is responsible for causing the decrease in the surface air temperature over the Southern Hemisphere. Consistent with them, the northward oceanic heat transport is larger in MIS3 than in MIS3-5aice in our simulations (Fig. 7). This is associated with a cooling of the NADW (Fig. 5c), which is induced by the stronger surface cooling by the glacial ice sheets. As a result, colder deep water outcrops in the Southern Hemisphere and cools the Southern Ocean. Furthermore, associated with the stronger surface cooling over the Southern Ocean, the amount of sea ice increases in this region (Fig. 4), which increases the deep ocean salinity via brine rejection (Fig. 5f), and enhances the bottom ocean stratification (Fig. 5i).
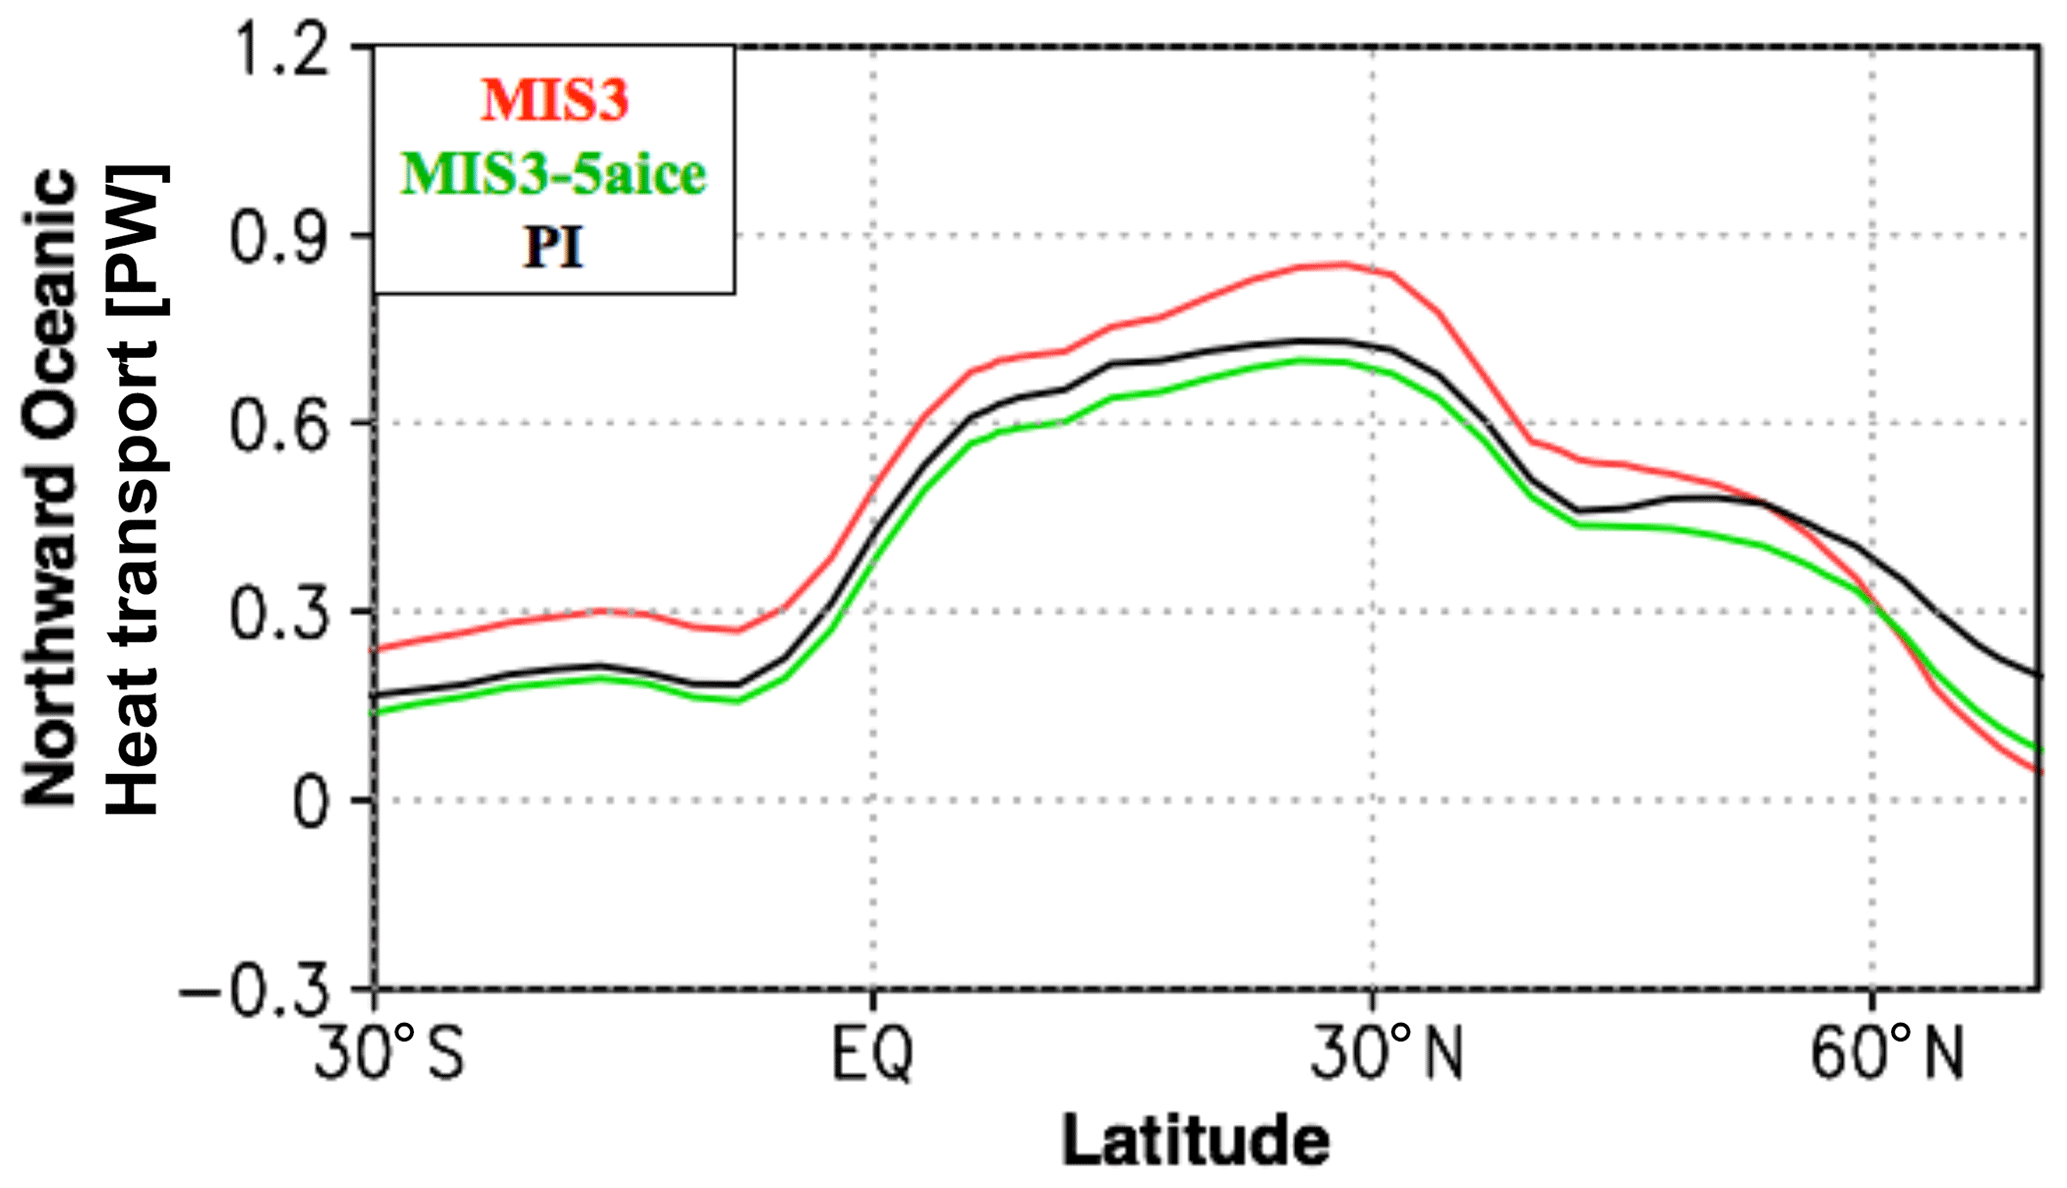
Figure 7Northward oceanic heat transport over the Atlantic Basin simulated from the AOGCM. Red represents MIS3, green represents MIS3-5aice, and black represents PI. The climatology of the last 100 years is used to create these figures.
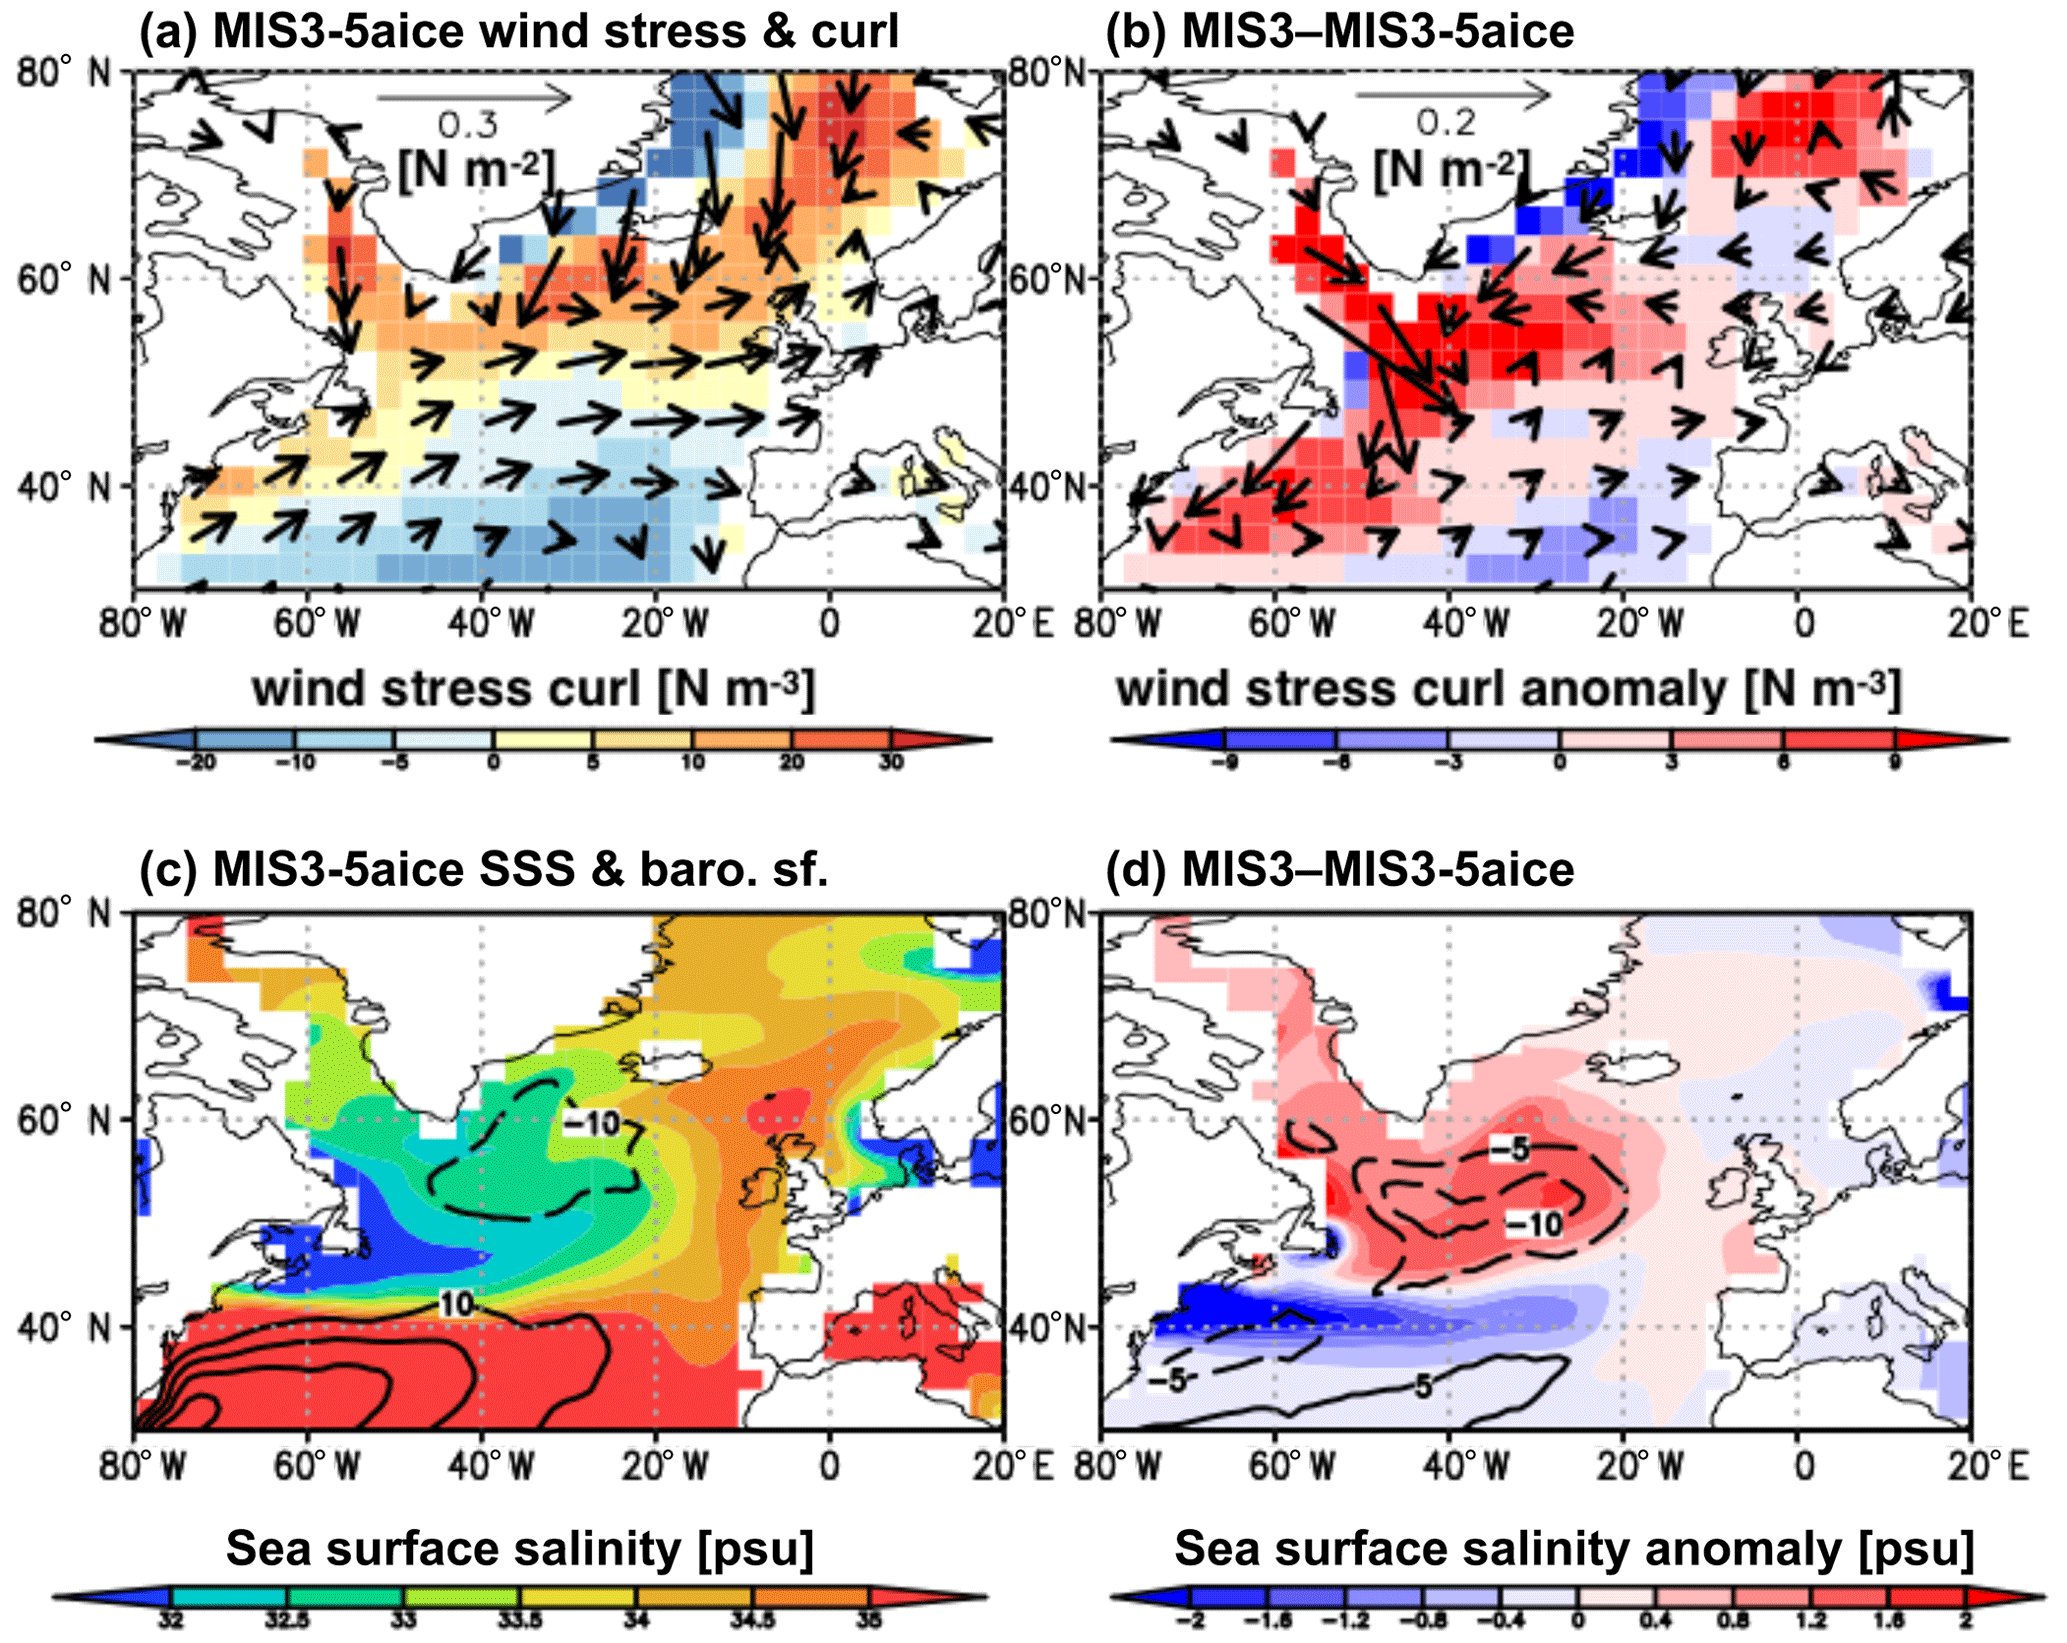
Figure 8Changes in surface wind stress and wind-driven ocean circulation associated with expansion of the northern glacial ice sheet from MIS5a to MIS3. Panels (a) and (b) show the surface wind stress (arrow, N m−2) and wind stress curl (color, N m−3), and panels (c) and (d) show the barotropic streamfunction (contour, Sv) and sea surface salinity (color, psu). Panels (a) and (c) show MIS3-5aice, and panels (b) and (d) show MIS3 minus MIS3-5aice (ice sheet effect). The climatology of the last 100 years is used to create these figures.
Unlike the oceanic heat transport, the expansion of mid-glacial ice sheets exerts a very small impact on the AMOC. The maximum strength of the AMOC increases by only 0.5 Sv between MIS3 and MIS3-5aice. These results show that the changes in the AMOC from MIS5a to MIS3 are mostly explained by the modifications to the CO2 levels and insolation. The small response in the AMOC to ice sheet forcing differs from the strengthening and deepening of the AMOC that has been shown by previous studies (Eisenman et al., 2009; Brady et al., 2013; Zhang et al., 2014a; Gong et al., 2015; Brown and Galbraith, 2016; Klockmann et al., 2016, 2018; Kawamura et al., 2017). Analysis of the surface wind stress curl shows an enhancement in response to the mid-glacial ice sheet expansion (Fig. 8a, b). This strengthening of surface wind stress curl is mostly explained by the strong northwesterly wind stress anomaly over the Labrador Sea, which is induced by the southward expansion of ice sheets in this region (Fig. 8b). As a result of the increased wind stress curl, the wind-driven ocean circulation and the northward transport of salt increases (Fig. 8c, d), which tend to intensify the AMOC, as shown by previous studies (Montoya and Levermann, 2008; Oka et al., 2012; Muglia and Schmittner, 2015; Sherriff-Tadano et al., 2018). Nevertheless, the AMOC retains a similar strength in our simulations. This result suggests that other processes are playing a role in compensating for the strengthening effect of the surface wind.
4.2 Roles of surface cooling by mid-glacial ice sheets on the AMOC
In addition to surface wind, changes in atmospheric freshwater flux and surface cooling modify the AMOC (Eisenman et al., 2009; Smith and Gregory, 2012). The atmospheric freshwater flux can affect the AMOC by modifying the surface salinity field (Eisenman et al., 2009). Figure 9 shows the difference in atmospheric freshwater fluxes between MIS3 and MIS3-5aice. It is found that the expansion of the mid-glacial ice sheet reduces the input of atmospheric freshwater flux over the northern North Atlantic, which is associated with a southward displacement of the westerlies (Hofer et al., 2012) as well as a decrease in specific humidity due to the intense cooling (Laine et al., 2009). This tends to enhance the AMOC by increasing the surface salinity in the deep-water formation region (Eisenman et al., 2009), which is qualitatively the inverse of what we observe now. The stronger surface cooling (Fig. 3d) can cause either a strengthening of the AMOC by enhancing deep-water formation in the North Atlantic (Oka et al., 2012; Smith and Gregory, 2012) or a weakening of the AMOC by increasing the amount of sea ice over the northern North Atlantic and Southern Ocean (Oka et al., 2012; Kawamura et al., 2017). Considering the increase in sea ice over both poles (Fig. 4) and the increase in the bottom ocean stratification (Fig. 5i), changes in surface cooling seem to play a role in reducing the AMOC, which is the opposite of the effects of surface wind.
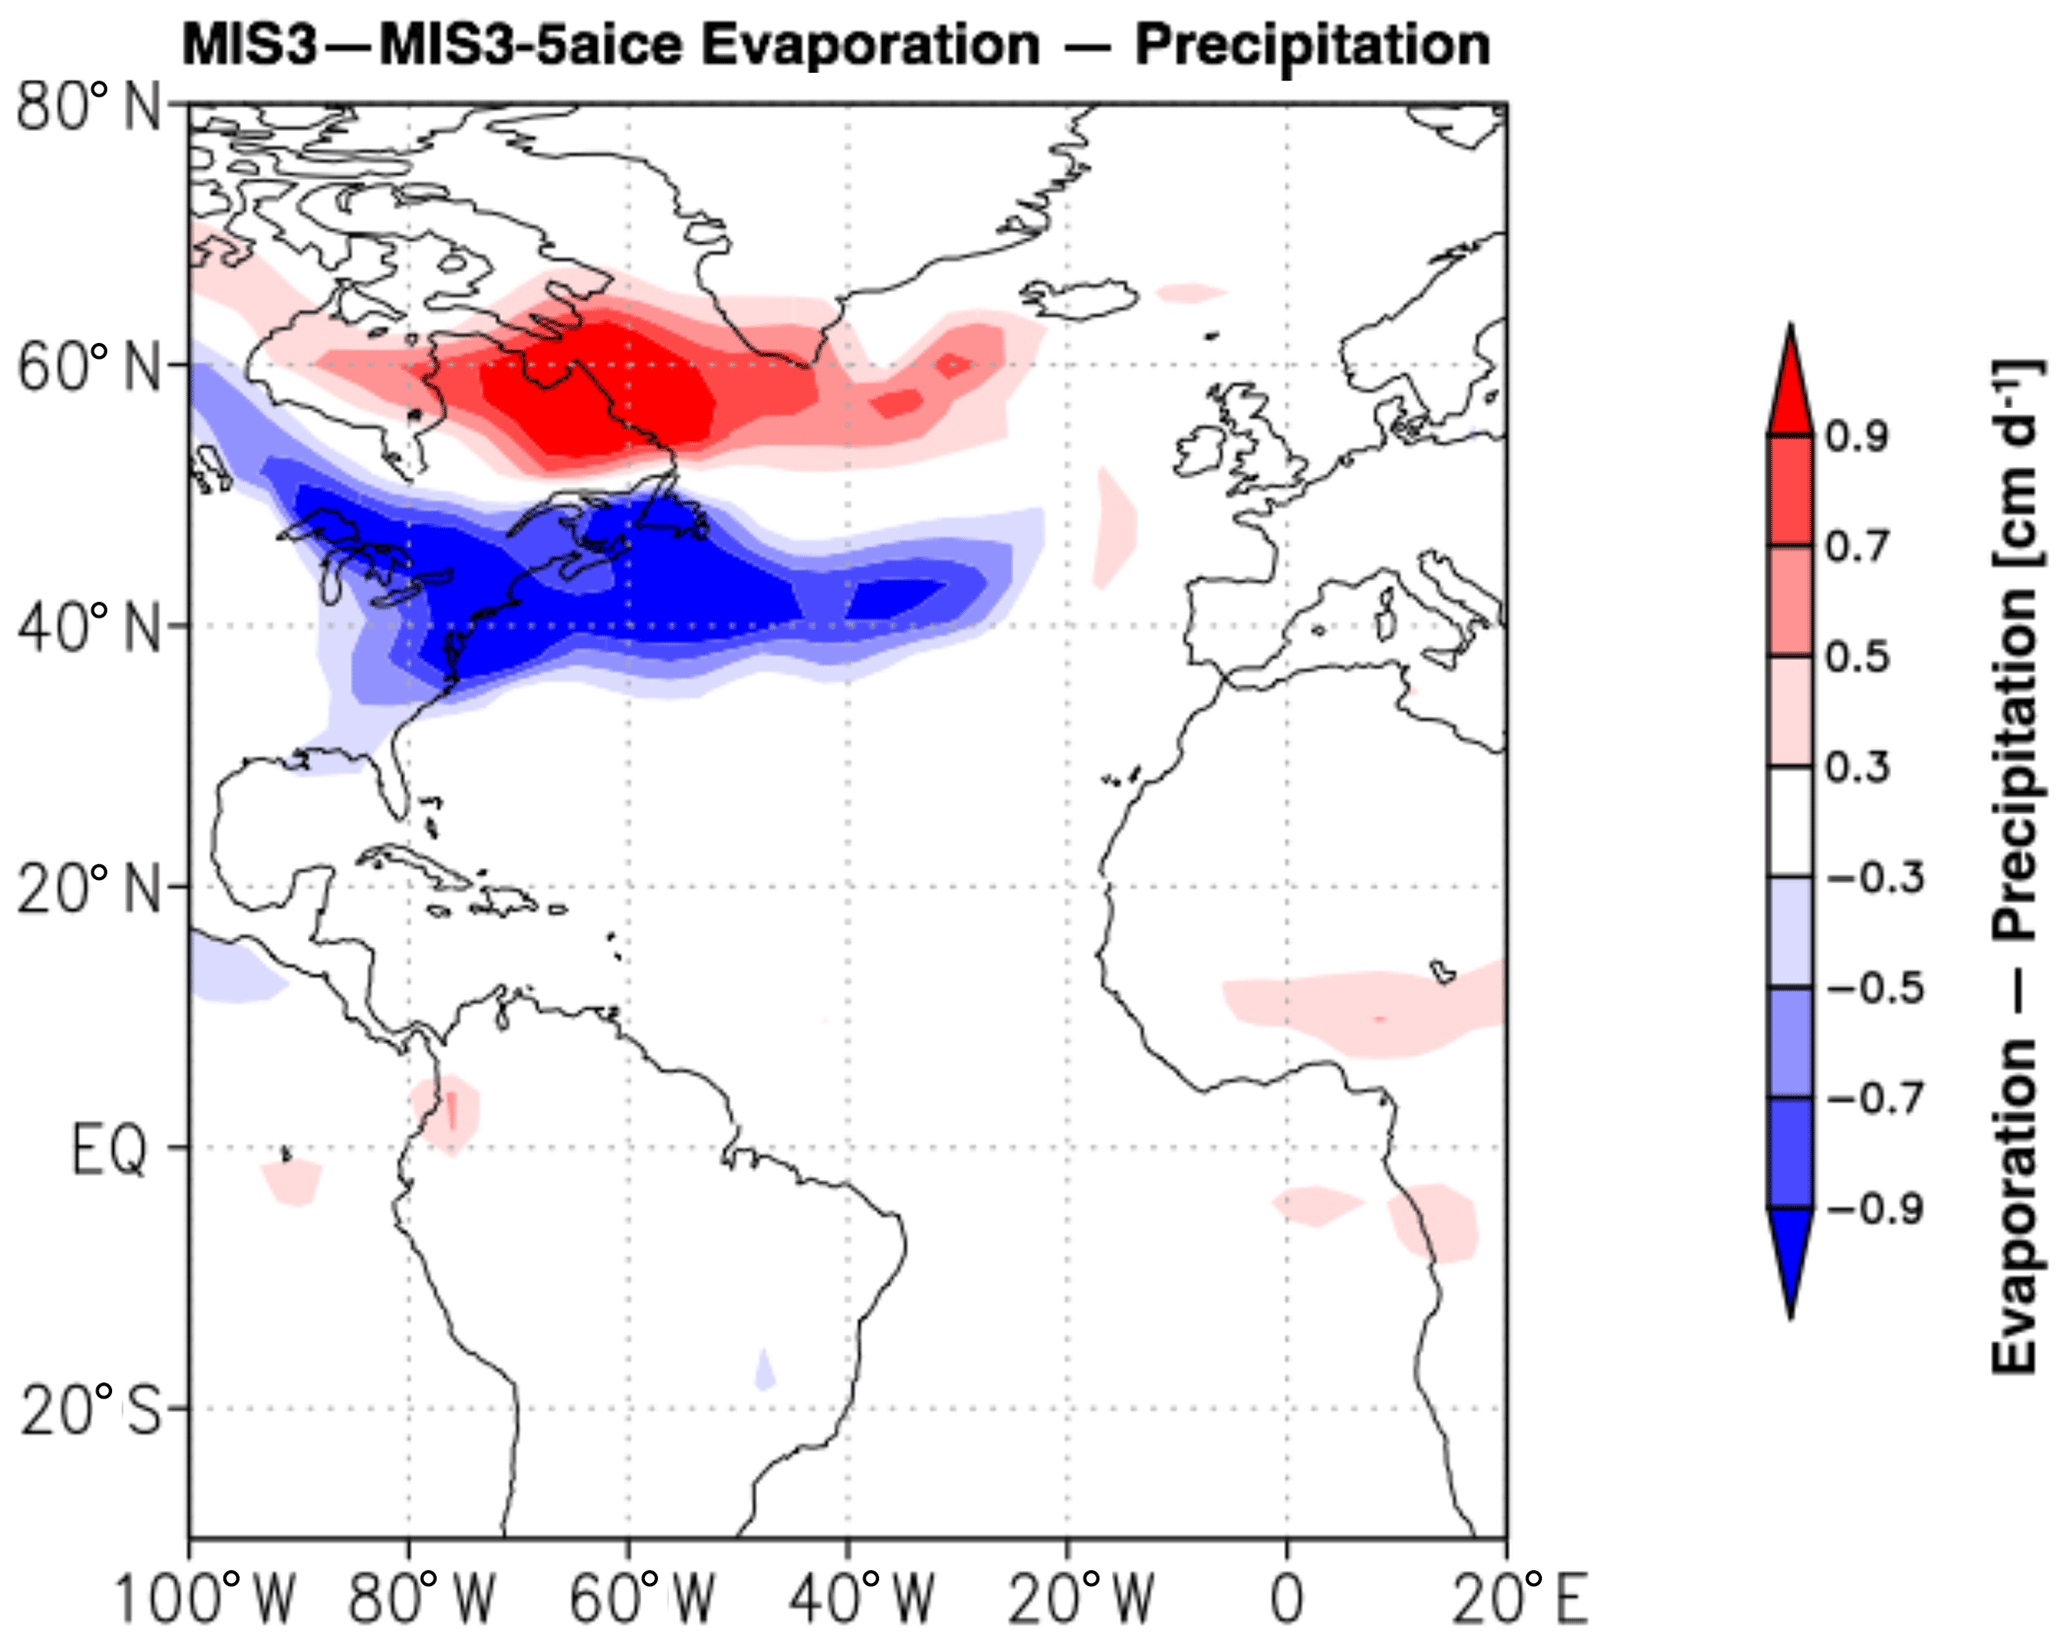
Figure 9Anomalies of atmospheric freshwater flux (E−P, cm d−1) out of the ocean between MIS3 and MIS3-5aice. Red represents freshwater flux out of the ocean, and blue represents freshwater flux into the ocean. The climatology of the last 100 years is used to create these figures.
To clarify the effect of surface cooling by the mid-glacial ice sheets on the AMOC, partially coupled (PC) experiments are conducted (Table 2, Fig. 10). In the first two experiments (PC-MIS3 and PC-MIS3-5aice), the surface wind stress and atmospheric freshwater flux are replaced with the climatological forcing of MIS3 and MIS3-5aice, respectively. In both experiments, the AMOC becomes stronger than in the corresponding original experiments, although it remains in a similar state as that simulated in MIS3 and MIS3-5aice. Therefore, the PC experiments reproduce the general pattern of the original experiments. The slight strengthening of the AMOC is associated with an initiation of deep-water formation over the Irminger Sea, which is related to the removal of daily variations in the surface wind (see further discussion in the Supplement, Fig. S3).
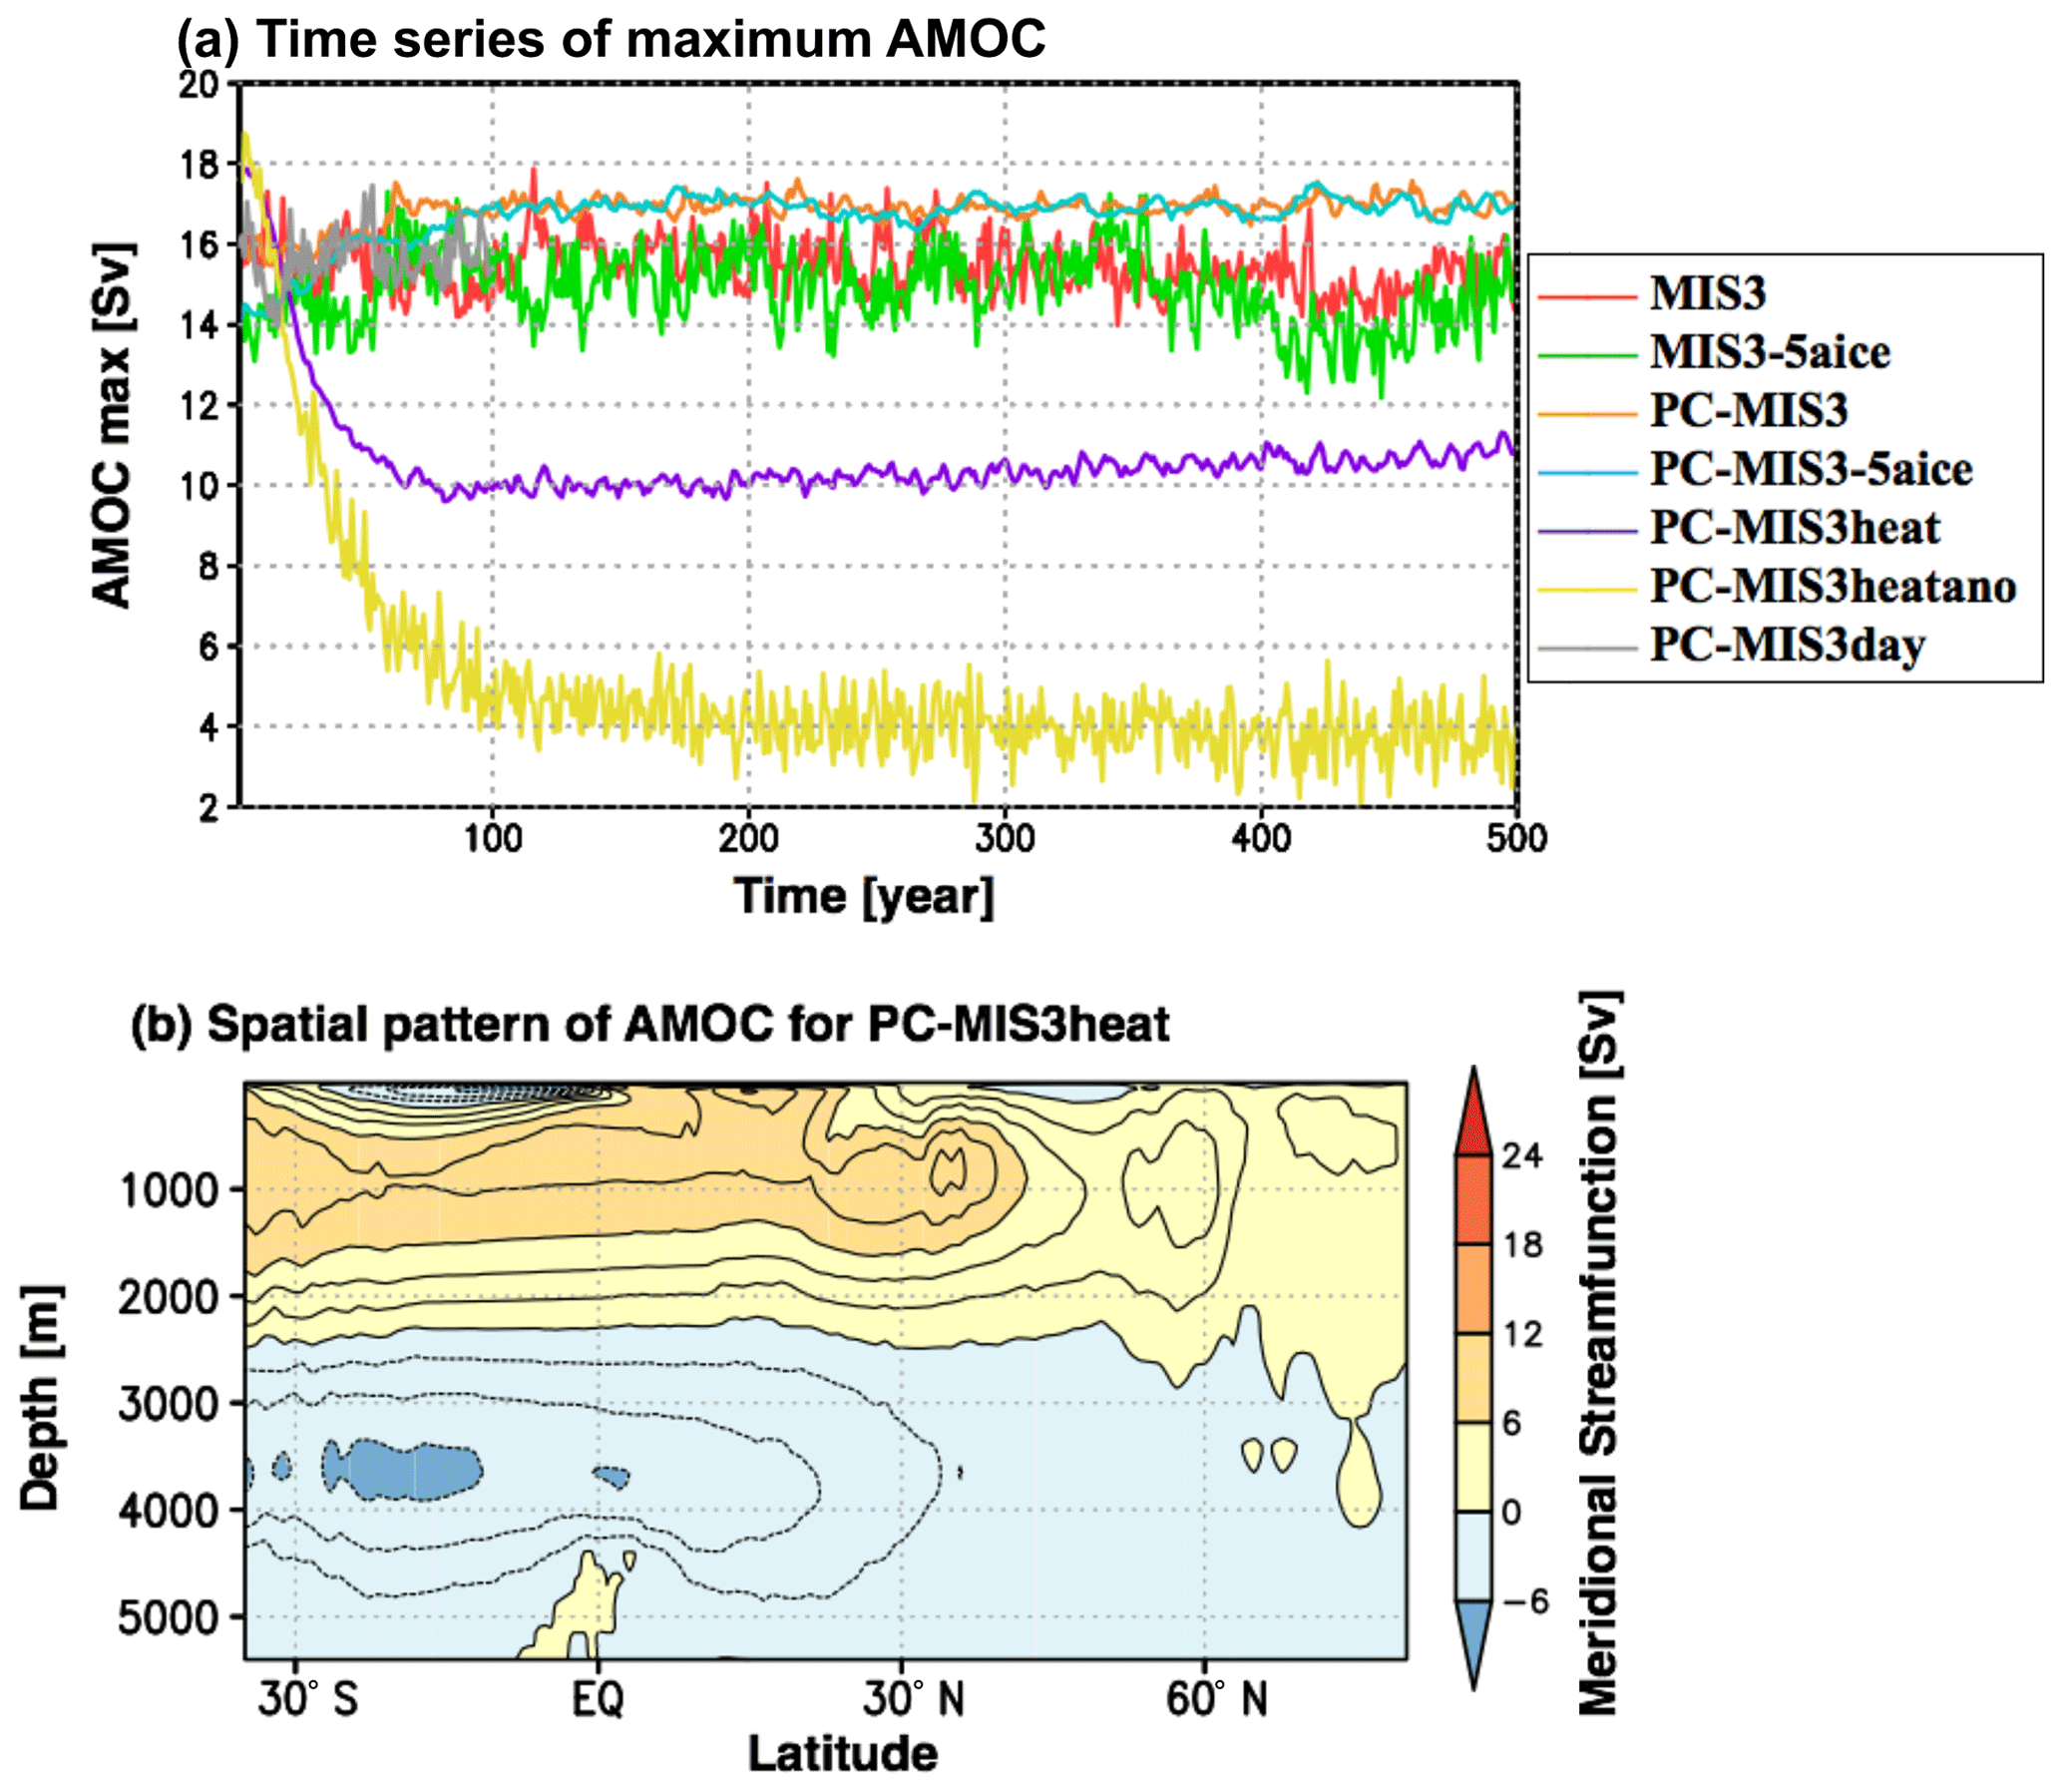
Figure 10Results of the partially coupled experiment conducted with the AOGCM. (a) Time series of the maximum strength of the AMOC. (b) Spatial pattern of the Atlantic meridional streamfunction calculated from PC-MIS3heat. The climatology of the last 100 years is used to create this figure.
In the third experiment (PC-MIS3heat), in which the monthly climatology of surface wind stress and atmospheric freshwater flux of MIS3 are replaced with those of MIS3-5aice (Table 2), the AMOC changes drastically. The maximum strength of the AMOC decreases to 11 Sv (Fig. 10), and sea ice covers the deep-water formation region in boreal winter (Figs. 11, S1e). Similar weakening is also observed in PC-MIS3heatano (Fig. 10). Because the surface wind and atmospheric freshwater flux are identical to those of MIS3-5aice, this result shows that the intense surface cooling by the MIS3 ice sheets reduces the AMOC. These simulations show that the weakening effect of the surface cooling compensates for the strengthening effect of the surface wind and, hence, induces a small change in the AMOC between MIS3 and MIS3-5aice.
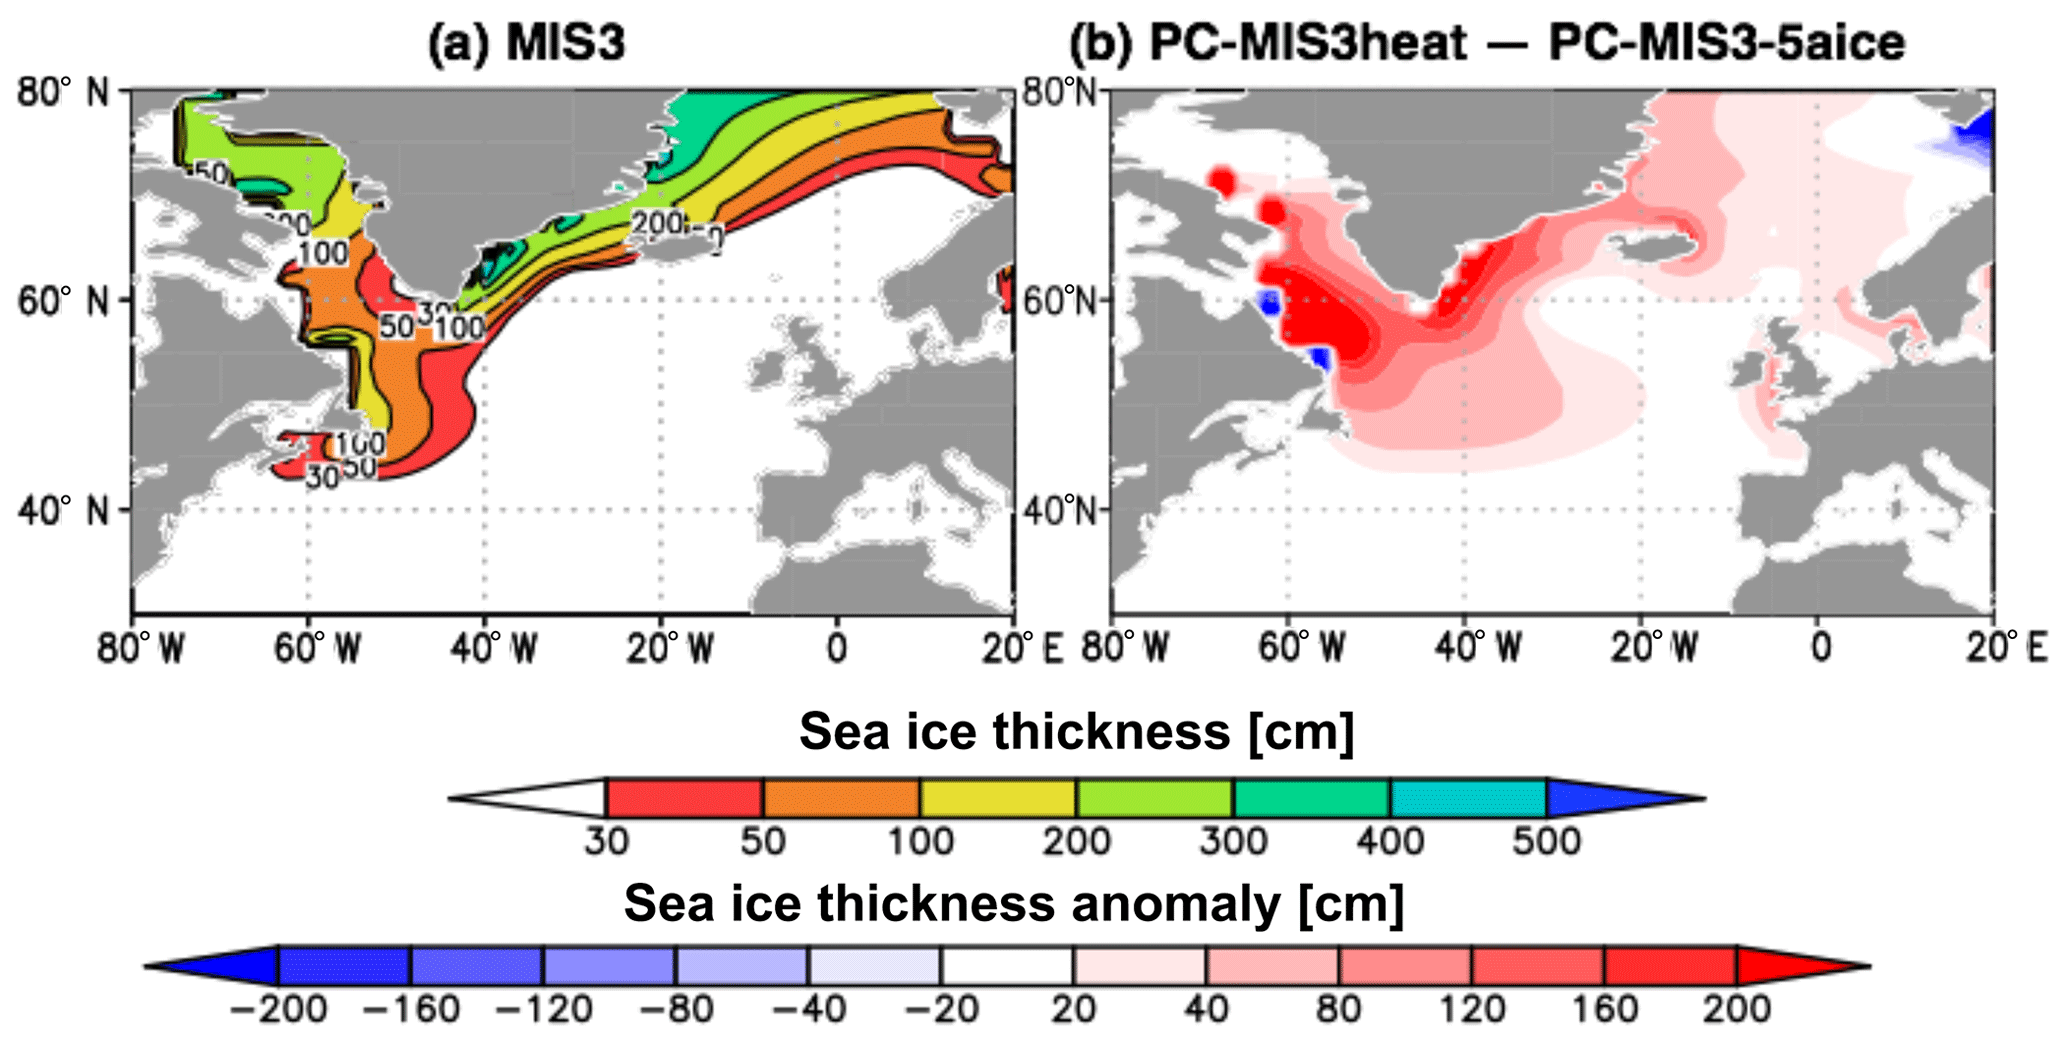
Figure 11Annual mean sea ice thickness (cm, color) over the North Atlantic simulated from the AOGCM and partially coupled experiments. Panel (a) shows MIS3, and panel (b) shows the effect of surface cooling by the mid-glacial ice sheet (PC-MIS3heat minus PC-MIS3-5aice). The results of the last 100 years are used.
How does the intense surface cooling reduce the AMOC? Two processes play a role (Fig. 12). The first process is associated with the intense surface cooling over the northern North Atlantic. Due to this surface cooling, the sea ice increases over the northern North Atlantic (Fig. 11b). The increase in sea ice tends to weaken the oceanic convection and the AMOC by insulating the atmosphere–ocean heat flux (Oka et al., 2012) and by increasing the meltwater flux over the deep-water formation region (Born et al., 2010). In addition, colder water occupies the subsurface ocean in MIS3 compared with MIS3-5aice. As a result, the oceanic column is more stable with respect to temperature (Fig. S2). When the mid-glacial ice sheet generates strong winds, the large surface salinity tends to overcome the thermally stratified oceanic condition and, therefore, maintains the deep-water formation (Fig. S2). However, when only strong surface cooling is applied, the deep-water formation is interrupted and the AMOC weakens. The second process involves the Southern Ocean cooling (Fig. 3d). Due to the intense surface cooling in the northern North Atlantic, the temperature of the NADW decreases, which is transported to the south and outcrops at the sea surface. This cooling anomaly is further amplified by the atmosphere and sea ice feedback. As a result, the formation of sea ice near the Antarctic coastal regions increases and enhances the formation of the Antarctic Bottom Water (AABW). This causes an increase in the density of AABW as well as bottom ocean stratification and reduces the AMOC (Fig. 5i; Weber et al., 2007; Buizert and Schmittner, 2015; Sun et al., 2016; Klockmann et al., 2016, 2018). Due to these processes, the AMOC weakens in response to the intense surface cooling by the mid-glacial ice sheet.

Figure 12Simple schematic of the processes by which changes in the glacial ice sheet affect the AMOC. A stronger surface wind induced by the glacial ice sheets enhances wind-driven transport of salt into the deep-water formation region and causes a strengthening of the AMOC. In contrast, a stronger surface cooling by the glacial ice sheets causes a weakening of the AMOC due to increasing sea ice in the North Atlantic, which insulates the atmosphere–ocean heat exchange (Oka et al., 2012). A stronger surface cooling by the northern glacial ice sheets also causes a cooling and an increase in sea ice over the Southern Ocean by increasing the oceanic heat transport. This change in the Southern Ocean then weakens the AMOC by increasing the density of the AABW and bottom ocean stratification (Weber et al., 2007; Klockmann et al., 2018). Possible internal feedbacks within the atmosphere–sea-ice–ocean system are discussed in Sect. 5.
The results above demonstrate a substantial impact of the mid-glacial ice sheets on the global climate. They contribute to a global cooling of 1.1 ∘C from MIS5a to MIS3, which is about 40 % of the total surface cooling from MIS5a to MIS3. As shown by previous studies, the expansion of northern glacial ice sheets causes an intense cooling over northern North America and Europe. Interestingly, the expansion of the mid-glacial ice sheet also causes a surface cooling of 2 ∘C over the Southern Ocean. It has been thought that the changes in the Northern Hemisphere ice sheet have a small impact on the climate over the Southern Hemisphere. For example, using an AGCM coupled with a slab ocean model, Manabe and Broccoli (1985) show that the glacial ice sheets have a small impact on the climate over the Southern Hemisphere. The present study shows that the Northern Hemisphere glacial ice sheets can modify the climate over the Southern Hemisphere and deep ocean via oceanic heat transport, whose effect is not included in their study. Hence, these results show the importance of the ocean dynamics and long integrations in assessing the effect of glacial ice sheet on the global climate. Similar results have also been reported for other AOGCMs that use ice sheet reconstructions of the LGM (Galbraith and de Lavergne, 2019) and deglaciation (Roberts and Valdes, 2017). This study further confirms that this effect is applicable in the mid-glacial period as well.
The changes in ice sheet from MIS5a to MIS3 exert a small impact on the AMOC, unlike the results of previous studies using LGM ice sheets. Partially coupled experiments show that the intense surface cooling by the glacial ice sheets compensates for the strengthening effect of the surface wind by increasing the amount of sea ice over the North Atlantic and the Southern Ocean (Fig. 4). As a result, the induced changes in the AMOC are small. Hence, it is found that the total impact of the expansion of the glacial ice sheet is determined by the balance between the wind effect and the surface cooling effect (Fig. 12). Considering the fact that most climate models show a strengthening of the AMOC in response to the glacial ice sheet expansion, the effect of surface wind seems to dominate in most models. The reason behind this still remains elusive, although we speculate that two processes play a role. The first process is associated with the change in wind-driven ocean transport of heat over the subpolar region. For example, the strengthening of the surface wind can increase the strength of the northward oceanic heat transport at high latitude by enhancing the wind-driven ocean circulation. This causes an increase in the surface air temperature and a decrease in sea ice at high latitudes and can reduce the effect of a stronger surface cooling by the glacial ice sheets. The second process is associated with a strong northerly wind east of the North American ice sheet (Fig. 8b). Due to this strong northerly wind anomaly, a large amount of sea ice is transported to the south in MIS3 compared with MIS3-5aice (Fig. S4). Thus, the sea ice is transported inefficiently to the deep-water formation region in MIS3. As a result, the cooling effect of the glacial ice sheet may be reduced and, thus, the wind effect becomes stronger. In contrast, Kim (2004) show a weakening of the AMOC in response to the expansion of the glacial ice sheet. In these simulations, the effect of surface cooling may be stronger than the wind effect. Hence, further analysis of these model outputs would contribute to a better understanding on the relative importance of wind effect and cooling effect on the AMOC.
Why is the strength of the cooling effect comparable to the wind effect in this study? In the present study, the main difference in the ice sheet between MIS3 and MIS5a appears in the extent of the ice sheet, while the differences in the height is relatively small (Fig. 1). According to previous studies, it has been shown that the strength of the wind is largely sensitive to the height of the ice sheet (Gong et al., 2015; Sherriff-Tadano et al., 2018), whereas the surface cooling is sensitive to the extent of the ice sheet (Abe-Ouchi et al., 2007). Hence, the changes in surface wind may be small compared with those obtained from other studies using the LGM ice sheet, whereas the change in surface cooling is large in this study. As a result, the AMOC changes only modestly. These results show that the relative strength of the surface wind and surface cooling can depend on the ice sheet configurations, which may cause different responses in the AMOC (Ullman et al., 2014). Furthermore, this result implies that the history of the shape of the ice sheets (changes in the extent and height) is an important factor when interpreting climate change during the glacial period.
The effect of surface cooling on the AMOC seen here is qualitatively different from some previous studies. For example, Schmittner et al. (2002) show that a stronger surface cooling over the North Atlantic enhances the AMOC in their glacial simulation by conducting partially coupled experiments with an Earth system model of intermediate complexity. In addition, Smith and Gregory (2012) suggest that the glacial ice sheets enhance the AMOC through strengthening the atmosphere–ocean heat exchange over the deep-water formation region based on their AOGCM experiments. The discrepancy among models may be attributed to two aspects. The first aspect is associated with the magnitude of surface cooling over the Southern Ocean. For example, if glacial ice sheets cause a very small cooling over the Southern Ocean in other models, this will reduce the weakening effect of the AMOC through the Southern Ocean (Fig. 12). As a result, the overall weakening effect by the glacial-ice-sheet-induced cooling on the AMOC should be reduced. The second aspect is related to the thermal threshold of the AMOC. As shown in Oka et al. (2012), the effect of enhanced surface cooling on the AMOC can depend on the distance from the thermal threshold; when the system is far from the threshold in the parameter space, the surface cooling strengthens the AMOC by enhancing deep-water formation. In contrast, when the system is close to the thermal threshold, a stronger surface cooling can cause a drastic weakening of the AMOC by covering the deep-water formation region with sea ice. Based on this result, in the present study, the AMOC may be close to the thermal threshold; hence, stronger surface cooling triggers a drastic weakening of the AMOC, whereas the AMOC may be far from the thermal threshold in other studies. Thus, we do not exclude the possibility that the stronger surface cooling can intensify the AMOC when the system is far from the threshold. The important point shown in this study is that a stronger surface cooling by glacial ice sheets can affect the thermal threshold of the AMOC and weaken it.
The time series of the maximum AMOC shows an increasing trend in PC-MIS3heat (Fig. 10). This trend may be associated with two factors: oceanic feedback and the lack of atmospheric feedback in response to a drastic weakening of the AMOC. With respect to the oceanic feedback, the weakening of the AMOC causes a warming over the Southern Ocean due to the reduction in the northward heat transport and, hence, reduces the deep ocean stratification and the density of AABW. These processes may contribute to restrengthening the AMOC (Weber et al., 2007; Buizert and Schmittner, 2015; Jansen, 2017; Klockmann et al., 2018). With respect to the lack of atmospheric feedback, previous studies have shown that the expansion of sea ice due to a reduction of the AMOC causes a weakening of the surface wind over the North Atlantic by increasing the static stability of the lower troposphere (Byrkjedal et al., 2006; Sherriff-Tadano and Abe-Ouchi, 2020). They further show that this weakening of the surface wind plays a role in maintaining a weak AMOC by reducing the wind-driven transport of salt to the deep-water formation region (Zhang et al., 2014a; Sherriff-Tadano and Abe-Ouchi, 2020). In the partially coupled experiments described above (PC-MIS3heat), the sea ice covers the large area of northern high latitude (Fig. S1e), and should activate this positive feedback, which will stabilize the weak AMOC. However, these atmospheric feedbacks are removed in PC-MIS3heat and, hence, may contribute to the destabilization of the weak AMOC. In fact, in PC-MIS3heatano, in which anomalies of the atmospheric forcing are applied and the atmospheric feedback in response to the AMOC weakening is consequently retained, the increasing trend of the AMOC after the weakening is very small (Fig. 10). Therefore, both atmospheric and oceanic feedbacks may play a role in causing the increasing AMOC trend in PC-MIS3heat.
We should note that the volume of the ice sheets used in this study (40 m sea level equivalent for MIS5a (80 ka) and 96 m sea level equivalent for MIS3 (36 ka)) are overestimated compared with reconstructions. For example, sea level reconstruction suggests an ice sheet volume of approximately 40 to 90 m sea level equivalent during MIS3 (Grant et al., 2012; Spratt and Lisiecki, 2016; Pico et al., 2017), which is smaller than that used in this study. Furthermore, recent studies even show a much smaller ice sheet during a portion of MIS3 (Pico et al., 2017; Batchelor et al., 2019). Nevertheless, these reconstructions still show that the ice sheets are slightly larger in MIS3 compared with those in MIS5a (Pico et al., 2017). Hence, while the quantitative effect of the mid-glacial ice sheet might be overestimated in the present study, the qualitative impact of the expansion of MIS3 ice sheet relative to MIS5a is unlikely to change.
The present study has implications for the understanding of climate variability during the glacial period. Ice core studies have shown that the stability and duration of the interstadial climate are strongly related to surface cooling over the North Atlantic (Schulz, 2002; Lohmann and Ditlevsen, 2019) and Southern Ocean (Buizert and Schmittner, 2015). For example, Schulz (2002) shows that the enhanced surface cooling by the expansion of the glacial ice sheet may explain the shortening of the duration of the interstadial during the mid-glacial period. However, modeling studies have shown a strengthening of the AMOC in response to the ice sheet expansion, which stabilizes a vigorous AMOC and the interstadial climate. In contrast, this study suggests the possibility that an expansion of glacial ice sheet can in fact cause the weakening of the AMOC and, hence, destabilization of the vigorous AMOC, which contributes to shorter interstadial duration. This is the case when the effect of surface cooling dominates the effect of surface wind. In this case, both the stronger surface cooling over the North Atlantic and the Southern Ocean can play a role, which is consistent with ice core studies (Buizert and Schmittner, 2015; Lohmann and Ditlevsen, 2019). This result suggests that the changes in the relative strength of surface wind and surface cooling can affect the AMOC and climate drastically and may be important in interpreting the millennial timescale climate variability of the glacial periods.
In this study, the role of mid-glacial ice sheets on the global climate and the AMOC is explored. For this purpose, simulations of MIS3 and MIS5a are conducted with the MIROC4m comprehensive climate model. The ice sheet configurations are taken from an ice sheet model, which reproduces the ice sheet evolution over the past 400 000 years (Abe-Ouchi et al., 2013). Furthermore, to assess the processes by which the mid-glacial ice sheets affect the AMOC, partially coupled experiments are conducted with MIROC4m. The main results of the present study can be summarized as follows.
In the MIS3 and MIS5a simulations, the global average temperature decreases by 5.0 and 2.2 ∘C, respectively, compared with the PI climate simulation. Comparison of the MIS3, MIS3-5aice, and MIS5a results show that the expansion of mid-glacial ice sheets contributes to a global cooling of 1.1 ∘C, which is about 40 % of the total surface cooling from MIS5a to MIS3 of about 2.8 ∘C. The southward expansion of northern mid-glacial ice sheets not only causes a drastic cooling over the northern North Atlantic but also causes a 2 ∘C of surface cooling over the Southern Ocean. The cooling over the Southern Ocean is associated with the cooling of the NADW.
The AMOC is enhanced by 16 % in MIS5a, whereas it weakens by 3 % in MIS3 compared with the preindustrial climate simulation. The weaker AMOC in MIS3 compared with MIS5a is consistent with a previous proxy study (Bohm et al., 2015). A sensitivity experiment that modifies the glacial ice sheets showed that the southward ice sheet expansion from MIS5a to MIS3 exerts a very small impact on the AMOC (0.5 Sv), despite the strengthening of surface wind and wind-driven ocean circulation over the North Atlantic, which tends to intensify the AMOC (Oka et al., 2012; Klockmann et al., 2016; Sherriff-Tadano et al., 2018). Partially coupled experiments reveal that the stronger surface cooling by the glacial ice sheet weakens the AMOC and counteracts the strengthening effect of surface wind. The surface cooling increases the sea ice over the northern North Atlantic, which insulates the atmosphere–ocean heat exchange and weakens oceanic convection. Also, the northern surface cooling causes a cooling over the Southern Ocean, which strengthens and increases the density of the AABW, increases the stratification of the bottom ocean, and weakens the AMOC.
It is found that the total impact of glacial ice sheets on the AMOC is determined by the relative strength of two factors: surface wind and surface cooling (Fig. 12). In most models, the effect of surface wind is stronger; hence, the AMOC strengthens in response to the ice sheet expansion. In the present study, the main difference in the ice sheets appears in their extent, rather than their height. As a result, the strength of the cooling effect becomes comparable to that of the wind effect, and it causes small changes in the AMOC. Our result suggests that the relative strength of the wind effect and cooling effect depends on the shape of the ice sheet reconstructions.
The results of the present study also offer a global dataset of climate during MIS3 and MIS5a, which complements previous studies (e.g., Van Meerbeeck et al., 2009; Gong et al., 2013; Menviel et al., 2014; Guo et al., 2019), although it is still lacking compared with the LGM. Recently, the number of mid-glacial period reconstructions has been increasing (Jensen et al., 2018); hence, more detailed comparisons with these reconstructions need to be conducted in future. Furthermore, the present results provide a reference climate state for investigating the millennial timescale climate variability that occurred during the mid- and early-glacial period (Henry et al., 2016; Mitsui and Crucifix, 2017; Guo et al., 2019). In a forthcoming study, we will perform freshwater hosing experiments with these simulations and investigate how the changes in boundary conditions affect climate variability and the recovery time of the AMOC. This can contribute to a better understanding of millennial timescale climate variability, which is still not fully understood and remains one of the largest questions in the study of paleoclimate.
The MIROC code associated with this study is available to those who conduct collaborative research with the model users under license from the copyright holders. The code for the partially coupled experiments is available from the corresponding author (Sam Sherriff-Tadano) upon reasonable request. The simulation data are available from https://ccsr.aori.u-tokyo.ac.jp/~tadano/ (Sherriff-Tadano, 2021).
The supplement related to this article is available online at: https://doi.org/10.5194/cp-17-95-2021-supplement.
All authors conceived the study. SST performed the climate model simulation and analyzed the results with assistance from AAO and AO. SST performed the partially coupled experiments with assistance from AO. The paper was written by SST with contributions from all co-authors.
The authors declare that they have no conflict of interest.
We thank Masahide Kimoto, Hiroyasu Hasumi, Masahiro Watanabe, Ryuji Tada, and Takashi Obase for constructive discussions. The model simulations were performed on Earth Simulator 3 at JAMSTEC. This paper benefited greatly from the comments of Chuncheng Guo and one anonymous reviewer. We would like to thank both and reviewers and the editor, Laurie Menviel.
This research has been supported by the JSPS KAKENHI (grant nos. 15J12515, 17H06104, 17H06323 and 20K14552).
This paper was edited by Laurie Menviel and reviewed by Chuncheng Guo and one anonymous referee.
Abe-Ouchi, A., Segawa, T., and Saito, F.: Climatic Conditions for modelling the Northern Hemisphere ice sheets throughout the ice age cycle, Clim. Past, 3, 423–438, https://doi.org/10.5194/cp-3-423-2007, 2007.
Abe-Ouchi, A., Saito, F., Kawamura, K., Raymo, M. E., Okuno, J., Takahashi, K., and Blatter, H.: Insolation-driven 100,000-year glacial cycles and hysteresis of ice-sheet volume, Nature, 500, 190–194, https://doi.org/10.1038/nature12374, 2013.
Abe-Ouchi, A., Saito, F., Kageyama, M., Braconnot, P., Harrison, S. P., Lambeck, K., Otto-Bliesner, B. L., Peltier, W. R., Tarasov, L., Peterschmitt, J.-Y., and Takahashi, K.: Ice-sheet configuration in the CMIP5/PMIP3 Last Glacial Maximum experiments, Geosci. Model Dev., 8, 3621–3637, https://doi.org/10.5194/gmd-8-3621-2015, 2015.
Arzel, O., de Verdiere, A. C., and England, M. H.: The Role of Oceanic Heat Transport and Wind Stress Forcing in Abrupt Millennial-Scale Climate Transitions, J. Climate, 23, 2233–2256, https://doi.org/10.1175/2009jcli3227.1, 2010.
Batchelor, C. L., Margold, M., Krapp, M., Murton, D., Dalton, A. S., Gibbard, P. L., Stokes, C. R., Murton, J. B., and Manica, A.: The configuration of Northern Hemisphere ice sheets through the Quaternary, Nat. Commun., 10, 3713, https://doi.org/10.1038/s41467-019-11601-2, 2019.
Bereiter, B., Eggleston, S., Schmitt, J., Nehrbass-Ahles, C., Stocker, T. F., Fischer, H., Kipfstuhl, S., and Chappellaz, J.: Revision of the EPICA Dome C CO2 record from 800 to 600 kyr before present, Geophys. Res. Lett., 42, 542–549, https://doi.org/10.1002/2014gl061957, 2015.
Bohm, E., Lippold, J., Gutjahr, M., Frank, M., Blaser, P., Antz, B., Fohlmeister, J., Frank, N., Andersen, M. B., and Deininger, M.: Strong and deep Atlantic meridional overturning circulation during the last glacial cycle, Nature, 517, 25517093, https://doi.org/10.1038/nature14059, 2015.
Born, A., Nisancioglu, K. H., and Braconnot, P.: Sea ice induced changes in ocean circulation during the Eemian, Clim. Dynam., 35, 1361–1371, https://doi.org/10.1007/s00382-009-0709-2, 2010.
Braconnot, P., Otto-Bliesner, B., Harrison, S., Joussaume, S., Peterchmitt, J.-Y., Abe-Ouchi, A., Crucifix, M., Driesschaert, E., Fichefet, Th., Hewitt, C. D., Kageyama, M., Kitoh, A., Laîné, A., Loutre, M.-F., Marti, O., Merkel, U., Ramstein, G., Valdes, P., Weber, S. L., Yu, Y., and Zhao, Y.: Results of PMIP2 coupled simulations of the Mid-Holocene and Last Glacial Maximum – Part 1: experiments and large-scale features, Clim. Past, 3, 261–277, https://doi.org/10.5194/cp-3-261-2007, 2007.
Braconnot, P., Harrison, S. P., Kageyama, M., Bartlein, P. J., Masson-Delmotte, V., Abe-Ouchi, A., Otto-Bliesner, B., and Zhao, Y.: Evaluation of climate models using palaeoclimatic data, Nat. Clim. Change, 2, 417–424, https://doi.org/10.1038/nclimate1456, 2012.
Brady, E. C., Otto-Bliesner, B. L., Kay, J. E., and Rosenbloom, N.: Sensitivity to Glacial Forcing in the CCSM4, J. Climate, 26, 1901–1925, https://doi.org/10.1175/jcli-d-11-00416.1, 2013.
Brandefelt, J., Kjellström, E., Näslund, J.-O., Strandberg, G., Voelker, A. H. L., and Wohlfarth, B.: A coupled climate model simulation of Marine Isotope Stage 3 stadial climate, Clim. Past, 7, 649–670, https://doi.org/10.5194/cp-7-649-2011, 2011.
Brown, N. and Galbraith, E. D.: Hosed vs. unhosed: interruptions of the Atlantic Meridional Overturning Circulation in a global coupled model, with and without freshwater forcing, Clim. Past, 12, 1663–1679, https://doi.org/10.5194/cp-12-1663-2016, 2016.
Buizert, C. and Schmittner, A.: Southern Ocean control of glacial AMOC stability and Dansgaard-Oeschger interstadial duration, Paleoceanography, 30, 1595–1612, https://doi.org/10.1002/2015pa002795, 2015.
Byrkjedal, O., Kvamsto, N., Meland, M., and Jansen, E.: Sensitivity of last glacial maximum climate to sea ice conditions in the Nordic Seas, Clim. Dynam., 26, 473–487, https://doi.org/10.1007/s00382-005-0096-2, 2006.
Capron, E., Landais, A., Chappellaz, J., Schilt, A., Buiron, D., Dahl-Jensen, D., Johnsen, S. J., Jouzel, J., Lemieux-Dudon, B., Loulergue, L., Leuenberger, M., Masson-Delmotte, V., Meyer, H., Oerter, H., and Stenni, B.: Millennial and sub-millennial scale climatic variations recorded in polar ice cores over the last glacial period, Clim. Past, 6, 345–365, https://doi.org/10.5194/cp-6-345-2010, 2010.
Chan, W.-L., Abe-Ouchi, A., and Ohgaito, R.: Simulating the mid-Pliocene climate with the MIROC general circulation model: experimental design and initial results, Geosci. Model Dev., 4, 1035–1049, https://doi.org/10.5194/gmd-4-1035-2011, 2011.
Clark, P. U., Dyke, A. S., Shakun, J. D., Carlson, A. E., Clark, J., Wohlfarth, B., Mitrovica, J. X., Hostetler, S. W., and McCabe, A. M.: The Last Glacial Maximum, Science, 325, 710–714, 2009.
Cook, K. H. and Held, I. M.: Stationary Waves of the Ice Age Climate, J. Climate, 1, 807–819, https://doi.org/10.1175/1520-0442(1988)001<0807:swotia>2.0.co;2, 1988.
Dallenbach, A., Blunier, T., Fluckiger, J., Stauffer, B., Chappellaz, J., and Raynaud, D.: Changes in the atmospheric CH4 gradient between Greenland and Antarctica during the Last Glacial and the transition to the Holocene, Geophys. Res. Lett., 27, 1005–1008, https://doi.org/10.1029/1999gl010873, 2000.
Dokken, T. M., Nisancioglu, K. H., Li, C., Battisti, D. S., and Kissel, C.: Dansgaard-Oeschger cycles: Interactions between ocean and sea ice intrinsic to the Nordic seas, Paleoceanography, 28, 491–502, https://doi.org/10.1002/palo.20042, 2013.
Eisenman, I., Bitz, C. M., and Tziperman, E.: Rain driven by receding ice sheets as a cause of past climate change, Paleoceanography, 24, 12, PA4209, https://doi.org/10.1029/2009pa001778, 2009.
Galbraith, E. and de Lavergne, C.: Response of a comprehensive climate model to a broad range of external forcings: relevance for deep ocean ventilation and the development of late Cenozoic ice ages, Clim. Dynam., 52, 653–679, https://doi.org/10.1007/s00382-018-4157-8, 2019.
Ganopolski, A. and Roche, D. M.: On the nature of lead-lag relationships during glacial-interglacial climate transitions, Quaternary Sci. Rev., 28, 3361–3378, https://doi.org/10.1016/j.quascirev.2009.09.019, 2009.
Gong, X., Knorr, G., Lohmann, G., and Zhang, X.: Dependence of abrupt Atlantic meridional ocean circulation changes on climate background states, Geophys. Res. Lett., 40, 3698–3704, https://doi.org/10.1002/grl.50701, 2013.
Gong, X., Zhang, X. D., Lohmann, G., Wei, W., Zhang, X., and Pfeiffer, M.: Higher Laurentide and Greenland ice sheets strengthen the North Atlantic ocean circulation, Clim. Dynam., 45, 139–150, https://doi.org/10.1007/s00382-015-2502-8, 2015.
Grant, K. M., Rohling, E. J., Bar-Matthews, M., Ayalon, A., Medina-Elizalde, M., Ramsey, C. B., Satow, C., and Roberts, A. P.: Rapid coupling between ice volume and polar temperature over the past 150,000 years, Nature, 491, 744–747, https://doi.org/10.1038/nature11593, 2012.
Gregory, J. M., Dixon, K. W., Stouffer, R. J., Weaver, A. J., Driesschaert, E., Eby, M., Fichefet, T., Hasumi, H., Hu, A., Jungclaus, J. H., Kamenkovich, I. V., Levermann, A., Montoya, M., Murakami, S., Nawrath, S., Oka, A., Sokolov, A. P., and Thorpe, R. B.: A model intercomparison of changes in the Atlantic thermohaline circulation in response to increasing atmospheric CO2 concentration, Geophys. Res. Lett., 32, L12703, https://doi.org/10.1029/2005gl023209, 2005.
Guo, C., Nisancioglu, K. H., Bentsen, M., Bethke, I., and Zhang, Z.: Equilibrium simulations of Marine Isotope Stage 3 climate, Clim. Past, 15, 1133–1151, https://doi.org/10.5194/cp-15-1133-2019, 2019.
Hasumi, H. and Emori, S.: K-1 coupled model (MIROC) description, K-1 Technical Report 1, Center For Climate System Research, University of Tokyo, Tokyo, Japan, 34 pp., 2004.
Henry, L. G., McManus, J. F., Curry, W. B., Roberts, N. L., Piotrowski, A. M., and Keigwin, L. D.: North Atlantic ocean circulation and abrupt climate change during the last glaciation, Science, 353, 470–474, https://doi.org/10.1126/science.aaf5529, 2016.
Hofer, D., Raible, C. C., Dehnert, A., and Kuhlemann, J.: The impact of different glacial boundary conditions on atmospheric dynamics and precipitation in the North Atlantic region, Clim. Past, 8, 935–949, https://doi.org/10.5194/cp-8-935-2012, 2012.
Hu, A. X., Meehl, G. A., Han, W. Q., Otto-Bliestner, B., Abe-Ouchi, A., and Rosenbloom, N.: Effects of the Bering Strait closure on AMOC and global climate under different background climates, Prog. Oceanogr., 132, 174–196, https://doi.org/10.1016/j.pocean.2014.02.004, 2015.
Ishiwa, T., Yokoyama, Y., Miyairi, Y., Obrochta, S., Sasaki, T., Kitamura, A., Suzuki, A., Ikehara, M., Ikehara, K., Kimoto, K., Bourget, J., and Matsuzaki, H.: Reappraisal of sea-level lowstand during the Last Glacial Maximum observed in the Bonaparte Gulf sediments, northwestern Australia, Quatern. Int., 397, 373–379, https://doi.org/10.1016/j.quaint.2015.03.032, 2016.
Jansen, M. F.: Glacial ocean circulation and stratification explained by reduced atmospheric temperature, P. Natl. Acad. Sci. USA, 114, 45–50, https://doi.org/10.1073/pnas.1610438113, 2017.
Jensen, M. F., Nummelin, A., Nielsen, S. B., Sadatzki, H., Sessford, E., Risebrobakken, B., Andersson, C., Voelker, A., Roberts, W. H. G., Pedro, J., and Born, A.: A spatiotemporal reconstruction of sea-surface temperatures in the North Atlantic during Dansgaard–Oeschger events 5–8, Clim. Past, 14, 901–922, https://doi.org/10.5194/cp-14-901-2018, 2018.
Kageyama, M. and Valdes, P. J.: Impact of the North American ice-sheet orography on the Last Glacial Maximum eddies and snowfall, Geophys. Res. Lett., 27, 1515–1518, https://doi.org/10.1029/1999gl011274, 2000.
Kageyama, M., Albani, S., Braconnot, P., Harrison, S. P., Hopcroft, P. O., Ivanovic, R. F., Lambert, F., Marti, O., Peltier, W. R., Peterschmitt, J.-Y., Roche, D. M., Tarasov, L., Zhang, X., Brady, E. C., Haywood, A. M., LeGrande, A. N., Lunt, D. J., Mahowald, N. M., Mikolajewicz, U., Nisancioglu, K. H., Otto-Bliesner, B. L., Renssen, H., Tomas, R. A., Zhang, Q., Abe-Ouchi, A., Bartlein, P. J., Cao, J., Li, Q., Lohmann, G., Ohgaito, R., Shi, X., Volodin, E., Yoshida, K., Zhang, X., and Zheng, W.: The PMIP4 contribution to CMIP6 – Part 4: Scientific objectives and experimental design of the PMIP4-CMIP6 Last Glacial Maximum experiments and PMIP4 sensitivity experiments, Geosci. Model Dev., 10, 4035–4055, https://doi.org/10.5194/gmd-10-4035-2017, 2017.
Kawamura, K., Abe-Ouchi, A., Motoyama, H., Ageta, Y., Aoki, S., Azuma, N., Fujii, Y., Fujita, K., Fujita, S., Fukui, K., Furukawa, T., Furusaki, A., Goto-Azuma, K., Greve, R., Hirabayashi, M., Hondoh, T., Hori, A., Horikawa, S., Horiuchi, K., Igarashi, M., Iizuka, Y., Kameda, T., Kanda, H., Kohno, M., Kuramoto, T., Matsushi, Y., Miyahara, M., Miyake, T., Miyamoto, A., Nagashima, Y., Nakayama, Y., Nakazawa, T., Nakazawa, F., Nishio, F., Obinata, I., Ohgaito, R., Oka, A., Okuno, J., Okuyama, J., Oyabu, I., Parrenin, F., Pattyn, F., Saito, F., Saito, T., Saito, T., Sakurai, T., Sasa, K., Seddik, H., Shibata, Y., Shinbori, K., Suzuki, K., Suzuki, T., Takahashi, A., Takahashi, K., Takahashi, S., Takata, M., Tanaka, Y., Uemura, R., Watanabe, G., Watanabe, O., Yamasaki, T., Yokoyama, K., Yoshimori, M., and Yoshimoto, T.: State dependence of climatic instability over the past 720,000 years from Antarctic ice cores and climate modeling, Science Advances, 3, e1600446, https://doi.org/10.1126/sciadv.1600446, 2017.
Kim, S. J.: The effect of atmospheric CO2 and ice sheet topography on LGM climate, Clim. Dynam., 22, 639–651, https://doi.org/10.1007/s00382-004-0412-2, 2004.
Kindler, P., Guillevic, M., Baumgartner, M., Schwander, J., Landais, A., and Leuenberger, M.: Temperature reconstruction from 10 to 120 kyr b2k from the NGRIP ice core, Clim. Past, 10, 887–902, https://doi.org/10.5194/cp-10-887-2014, 2014.
Klockmann, M., Mikolajewicz, U., and Marotzke, J.: The effect of greenhouse gas concentrations and ice sheets on the glacial AMOC in a coupled climate model, Clim. Past, 12, 1829–1846, https://doi.org/10.5194/cp-12-1829-2016, 2016.
Klockmann, M., Mikolajewicz, U., and Marotzke, J.: Two AMOC states in response to decreasing greenhouse gas concentrations in the coupled climate model MPI-ESM, J. Climate, 31, 7969–7984, https://doi.org/10.1175/JCLI-D-17-0859.1, 2018.
Laine, A., Kageyama, M., Salas-Melia, D., Voldoire, A., Riviere, G., Ramstein, G., Planton, S., Tyteca, S., and Peterschmitt, J. Y.: Northern hemisphere storm tracks during the last glacial maximum in the PMIP2 ocean-atmosphere coupled models: energetic study, seasonal cycle, precipitation, Clim. Dynam., 32, 593–614, https://doi.org/10.1007/s00382-008-0391-9, 2009.
Lisiecki, L. E. and Raymo, M. E.: A Pliocene-Pleistocene stack of 57 globally distributed benthic δ18O records, Paleoceanography, 20, PA1003, https://doi.org/10.1029/2004pa001071, 2005.
Löfverström, M., Caballero, R., Nilsson, J., and Kleman, J.: Evolution of the large-scale atmospheric circulation in response to changing ice sheets over the last glacial cycle, Clim. Past, 10, 1453–1471, https://doi.org/10.5194/cp-10-1453-2014, 2014.
Lohmann, J. and Ditlevsen, P. D.: Objective extraction and analysis of statistical features of Dansgaard–Oeschger events, Clim. Past, 15, 1771–1792, https://doi.org/10.5194/cp-15-1771-2019, 2019.
Loving, J. L. and Vallis, G. K.: Mechanisms for climate variability during glacial and interglacial periods, Paleoceanography, 20, PA4024, https://doi.org/10.1029/2004pa001113, 2005.
Manabe, S. and Broccoli, A. J.: The influence of continental ice sheets on the climate of an ice-age, J. Geophys. Res.-Atmos., 90, 2167–2190, https://doi.org/10.1029/JD090iD01p02167, 1985.
Marotzke, J.: CLIMATE SCIENCE A grip on ice-age ocean circulation, Nature, 485, 180–181, https://doi.org/10.1038/485180a, 2012.
McManus, J. F., Francois, R., Gherardi, J. M., Keigwin, L. D., and Brown-Leger, S.: Collapse and rapid resumption of Atlantic meridional circulation linked to deglacial climate changes, Nature, 428, 834–837, https://doi.org/10.1038/nature02494, 2004.
Menviel, L., Timmermann, A., Friedrich, T., and England, M. H.: Hindcasting the continuum of Dansgaard–Oeschger variability: mechanisms, patterns and timing, Clim. Past, 10, 63–77, https://doi.org/10.5194/cp-10-63-2014, 2014.
Menviel, L., Capron, E., Govin, A., Dutton, A., Tarasov, L., Abe-Ouchi, A., Drysdale, R. N., Gibbard, P. L., Gregoire, L., He, F., Ivanovic, R. F., Kageyama, M., Kawamura, K., Landais, A., Otto-Bliesner, B. L., Oyabu, I., Tzedakis, P. C., Wolff, E., and Zhang, X.: The penultimate deglaciation: protocol for Paleoclimate Modelling Intercomparison Project (PMIP) phase 4 transient numerical simulations between 140 and 127 ka, version 1.0, Geosci. Model Dev., 12, 3649–3685, https://doi.org/10.5194/gmd-12-3649-2019, 2019.
Menviel, L. C., Spence, P., Skinner, L. C., Tachikawa, K., Friedrich, T., Missiaen, L., and Yu, J.: Enhanced Mid-depth Southward Transport in the Northeast Atlantic at the Last Glacial Maximum Despite a Weaker AMOC, Paleoceanography and Paleoclimatology, 35, e2019PA003793, https://doi.org/10.1029/2019PA003793, 2020.
Merkel, U., Prange, M., and Schulz, M.: ENSO variability and teleconnections during glacial climates, Quaternary Sci. Rev., 29, 86–100, https://doi.org/10.1016/j.quascirev.2009.11.006, 2010.
Merz, N., Raible, C. C., and Woollings, T.: North Atlantic Eddy-Driven Jet in Interglacial and Glacial Winter Climates, J. Climate, 28, 3977–3997, https://doi.org/10.1175/jcli-d-14-00525.1, 2015.
Mikolajewicz, U. and Voss, R.: The role of the individual air-sea flux components in CO2-induced changes of the ocean's circulation and climate, Clim. Dynam., 16, 627–642, https://doi.org/10.1007/s003820000066, 2000.
Mitsui, T. and Crucifix, M.: Influence of external forcings on abrupt millennial-scale climate changes: a statistical modelling study, Clim. Dynam., 48, 2729–2749, https://doi.org/10.1007/s00382-016-3235-z, 2017.
Montoya, M. and Levermann, A.: Surface wind-stress threshold for glacial Atlantic overturning, Geophys. Res. Lett., 35, L03608, 10.1029/2007gl032560, 2008.
Muglia, J. and Schmittner, A.: Glacial Atlantic overturning increased by wind stress in climate models, Geophys. Res. Lett., 42, 9862–9869, https://doi.org/10.1002/2015gl064583, 2015.
Muglia, J., Skinner, L. C., and Schmittner, A.: Weak overturning circulation and high Southern Ocean nutrient utilization maximized glacial ocean carbon, Earth Planet. Sci. Lett., 496, 47–56, https://doi.org/10.1016/j.epsl.2018.05.038, 2018.
Niu, L., Lohmann, G., Hinck, S., Gowan, E. J., and Krebs-Kanzow, U.: The sensitivity of Northern Hemisphere ice sheets to atmospheric forcing during the last glacial cycle using PMIP3 models, J. Glaciol., 65, 645–661, https://doi.org/10.1017/jog.2019.42, 2019.
Obase, T. and Abe-Ouchi, A.: Abrupt Bolling-Allerod Warming Simulated under Gradual Forcing of the Last Deglaciation, Geophys. Res. Lett., 46, 11397–11405, https://doi.org/10.1029/2019gl084675, 2019.
Oka, A., Hasumi, H., and Abe-Ouchi, A.: The thermal threshold of the Atlantic meridional overturning circulation and its control by wind stress forcing during glacial climate, Geophys. Res. Lett., 39, L09709, https://doi.org/10.1029/2012GL051421, 2012.
Oppo, D. W., Gebbie, G., Huang, K. F., Curry, W. B., Marchitto, T. M., and Pietro, K. R.: Data Constraints on Glacial Atlantic Water Mass Geometry and Properties, Paleoceanography and Paleoclimatology, 33, 1013–1034, https://doi.org/10.1029/2018pa003408, 2018.
Otto-Bliesner, B. L., Hewitt, C. D., Marchitto, T. M., Brady, E., Abe-Ouchi, A., Crucifix, M., Murakami, S., and Weber, S. L.: Last Glacial Maximum ocean thermohaline circulation: PMIP2 model intercomparisons and data constraints, Geophys. Res. Lett., 34, L12706, https://doi.org/10.1029/2007gl029475, 2007.
Pausata, F. S. R., Li, C., Wettstein, J. J., Kageyama, M., and Nisancioglu, K. H.: The key role of topography in altering North Atlantic atmospheric circulation during the last glacial period, Clim. Past, 7, 1089–1101, https://doi.org/10.5194/cp-7-1089-2011, 2011.
Peltier, W. R.: Global glacial isostasy and the surface of the ice-age earth: The ice-5G (VM2) model and grace, Annu. Rev. Earth Pl. Sc., 32, 111–149, https://doi.org/10.1146/annurev.earth.32.082503.144359, 2004.
Pico, T., Creveling, J. R., and Mitrovica, J. X.: Sea-level records from the US mid-Atlantic constrain Laurentide Ice Sheet extent during Marine Isotope Stage 3, Nat. Commun., 8, 15612, https://doi.org/10.1038/ncomms15612, 2017.
Rasmussen, S. O., Abbott, P. M., Blunier, T., Bourne, A. J., Brook, E., Buchardt, S. L., Buizert, C., Chappellaz, J., Clausen, H. B., Cook, E., Dahl-Jensen, D., Davies, S. M., Guillevic, M., Kipfstuhl, S., Laepple, T., Seierstad, I. K., Severinghaus, J. P., Steffensen, J. P., Stowasser, C., Svensson, A., Vallelonga, P., Vinther, B. M., Wilhelms, F., and Winstrup, M.: A first chronology for the North Greenland Eemian Ice Drilling (NEEM) ice core, Clim. Past, 9, 2713–2730, https://doi.org/10.5194/cp-9-2713-2013, 2013.
Roberts, W. H. G. and Valdes, P. J.: Green Mountains and White Plains: The Effect of Northern Hemisphere Ice Sheets on the Global Energy Budget, J. Climate, 30, 3887–3905, https://doi.org/10.1175/jcli-d-15-0846.1, 2017.
Sadatzki, H., Dokken, T. M., Berben, S. M. P., Muschitiello, F., Stein, R., Fahl, K., Menviel, L., Timmermann, A., and Jansen, E.: Sea ice variability in the southern Norwegian Sea during glacial Dansgaard-Oeschger climate cycles, Science Advances, 5, eaau6174, https://doi.org/10.1126/sciadv.aau6174, 2019.
Saito, F. and Abe-Ouchi, A.: Sensitivity of Greenland ice sheet simulation to the numerical procedure employed for ice-sheet dynamics, Ann. Glaciol., 42, 331–336, https://doi.org/10.3189/172756405781813069, 2005.
Schmittner, A., Meissner, K. J., Eby, M., and Weaver, A. J.: Forcing of the deep ocean circulation in simulations of the Last Glacial Maximum, Paleoceanography, 17, 1015, https://doi.org/10.1029/2001pa000633, 2002.
Schulz, M.: The tempo of climate change during Dansgaard-Oeschger interstadials and its potential to affect the manifestation of the 1470-year climate cycle, Geophys. Res. Lett., 29, 1002, https://doi.org/10.1029/2001gl013277, 2002.
Sherriff-Tadano, S.: Data repository, available at: https://ccsr.aori.u-tokyo.ac.jp/~tadano/, last access: 8 January 2021.
Sherriff-Tadano, S. and Abe-Ouchi, A.: Roles of sea ice-surface wind feedback in maintaining the glacial Atlantic meridional overturning circulation and climate, J. Climate, 33, 3001–3018, https://doi.org/10.1175/JCLI-D-19-0431.1, 2020.
Sherriff-Tadano, S., Abe-Ouchi, A., Yoshimori, M., Oka, A., and Chan, W.-L.: Influence of glacial ice sheets on the Atlantic meridional overturning circulation through surface wind change, Clim. Dynam., 50, 2881–2903, https://doi.org/10.1007/s00382-017-3780-0, 2018.
Smith, R. S. and Gregory, J.: The last glacial cycle: transient simulations with an AOGCM, Clim. Dynam., 38, 1545–1559, https://doi.org/10.1007/s00382-011-1283-y, 2012.
Spratt, R. M. and Lisiecki, L. E.: A Late Pleistocene sea level stack, Clim. Past, 12, 1079–1092, https://doi.org/10.5194/cp-12-1079-2016, 2016.
Sun, S., Eisenman, I., and Stewart, A. L.: The influence of Southern Ocean surface buoyancy forcing on glacial-interglacial changes in the global deep ocean stratification, Geophys. Res. Lett., 43, 8124–8132, https://doi.org/10.1002/2016gl070058, 2016.
Tarasov, L., Dyke, A. S., Neal, R. M., and Peltier, W. R.: A data-calibrated distribution of deglacial chronologies for the North American ice complex from glaciological modeling, Earth Planet. Sci. Lett., 315, 30–40, https://doi.org/10.1016/j.epsl.2011.09.010, 2012.
Ullman, D. J., LeGrande, A. N., Carlson, A. E., Anslow, F. S., and Licciardi, J. M.: Assessing the impact of Laurentide Ice Sheet topography on glacial climate, Clim. Past, 10, 487–507, https://doi.org/10.5194/cp-10-487-2014, 2014.
Van Meerbeeck, C. J., Renssen, H., and Roche, D. M.: How did Marine Isotope Stage 3 and Last Glacial Maximum climates differ? – Perspectives from equilibrium simulations, Clim. Past, 5, 33–51, https://doi.org/10.5194/cp-5-33-2009, 2009.
Weber, S. L., Drijfhout, S. S., Abe-Ouchi, A., Crucifix, M., Eby, M., Ganopolski, A., Murakami, S., Otto-Bliesner, B., and Peltier, W. R.: The modern and glacial overturning circulation in the Atlantic ocean in PMIP coupled model simulations, Clim. Past, 3, 51–64, https://doi.org/10.5194/cp-3-51-2007, 2007.
Willeit, M. and Ganopolski, A.: The importance of snow albedo for ice sheet evolution over the last glacial cycle, Clim. Past, 14, 697–707, https://doi.org/10.5194/cp-14-697-2018, 2018.
Yamamoto, A., Abe-Ouchi, A., Shigemitsu, M., Oka, A., Takahashi, K., Ohgaito, R., and Yamanaka, Y.: Global deep ocean oxygenation by enhanced ventilation in the Southern Ocean under long-term global warming, Global Biogeochem. Cy., 29, 1801–1815, https://doi.org/10.1002/2015gb005181, 2015.
Yanase, W. and Abe-Ouchi, A.: A Numerical Study on the Atmospheric Circulation over the Midlatitude North Pacific during the Last Glacial Maximum, J. Climate, 23, 135–151, https://doi.org/10.1175/2009jcli3148.1, 2010.
Zhang, X., Lohmann, G., Knorr, G., and Xu, X.: Different ocean states and transient characteristics in Last Glacial Maximum simulations and implications for deglaciation, Clim. Past, 9, 2319–2333, https://doi.org/10.5194/cp-9-2319-2013, 2013.
Zhang, X., Lohmann, G., Knorr, G., and Purcell, C.: Abrupt glacial climate shifts controlled by ice sheet changes, Nature, 512, 290–294, 2014a.
Zhang, X., Prange, M., Merkel, U., and Schulz, M.: Instability of the Atlantic overturning circulation during Marine Isotope Stage 3, Geophys. Res. Lett., 41, 4285–4293, https://doi.org/10.1002/2014GL060321, 2014b.