the Creative Commons Attribution 4.0 License.
the Creative Commons Attribution 4.0 License.
 | 19 Nov 2021
A 406-year non-growing-season precipitation reconstruction in the southeastern Tibetan Plateau
Maierdang Keyimu
Bojie Fu
Guohua Liu
Fanjiang Zeng
Weiliang Chen
Zexin Fan
Keyan Fang
Xiuchen Wu
Xiaochun Wang
Trees record climatic conditions during their growth, and tree rings serve as proxy to reveal the features of the historical climate of a region. In this study, we collected tree-ring cores of hemlock forest (Tsuga forrestii) from the northwestern Yunnan area of the southeastern Tibetan Plateau (SETP) and created a residual tree-ring width (TRW) chronology. An analysis of the relationship between tree growth and climate revealed that precipitation during the non-growing season (NGS) (from November of the previous year to February of the current year) was the most important constraining factor on the radial tree growth of hemlock forests in this region. In addition, the influence of NGS precipitation on radial tree growth was relatively uniform over time (1956–2005). Accordingly, we reconstructed the NGS precipitation over the period spanning from 1600–2005. The reconstruction accounted for 28.5 % of the actual variance during the common period of 1956–2005. Based on the reconstruction, NGS was extremely dry during the years 1656, 1694, 1703, 1736, 1897, 1907, 1943, 1982 and 1999. In contrast, the NGS was extremely wet during the years 1627, 1638, 1654, 1832, 1834–1835 and 1992. Similar variations of the NGS precipitation reconstruction series and Palmer Drought Severity Index (PDSI) reconstructions of early growing season from surrounding regions indicated the reliability of the present reconstruction. A comparison of the reconstruction with Climate Research Unit (CRU) gridded data revealed that our reconstruction was representative of the NGS precipitation variability of a large region in the SETP. Our study provides the first historical NGS precipitation reconstruction in the SETP which enriches the understanding of the long-term climate variability of this region. The NGS precipitation showed slightly increasing trend during the last decade which might accelerate regional hemlock forest growth.
- Article
(5115 KB) - Full-text XML
-
Supplement
(67 KB) - BibTeX
- EndNote


Unraveling the past climate often relies on proxy records. As a widely used proxy material, tree rings provide an opportunity to obtain long-term climate data (Fritts, 1976; Esper et al., 2002; D'Arrigo et al., 2005; Li et al., 2011; Büntgen et al., 2011, 2016; Cai et al., 2014; Yang et al., 2014; Schneider et al., 2015; Anchukaitis et al., 2016; Keyimu et al., 2021). These long-term records enable us to identify the interannual, decadal and multi-decal variability of historical climatic conditions. They also provide a reference to better understand the nature of current climatic conditions (warming/cooling, drying/wetting) and to project the future regional climate, as well as the dynamic response of Earth processes (e.g., forest growth, glacier retreat/advance, stream flow, drought frequency and forest fires) to climate change.
Being the “third pole” of the Earth, the Tibetan Plateau (TP) (average of 4000 m a.s.l.) is particularly sensitive to climate change and is one of the fastest warming places in the world (Chen et al., 2020). The average decadal temperature increase on the TP is 0.33 ∘C, which is higher than the world's average decadal temperature increase of 0.20 ∘C (Yan and Liu, 2014). Because of its geographical extent and position within the global circulation system, the TP plays a key role in regional and global atmospheric circulation patterns (Griessinger et al., 2017), not only affecting the midlatitude westerlies but also influencing the Asian monsoon circulation through its thermodynamical feedbacks (Duan et al., 2006; Rangwala, 2009; Wu et al., 2015).
There are large areas of coniferous forest distributed at high altitudes in the southeastern Tibetan Plateau (SETP). Due to their age and relative lack of disturbance, they are a source of proxy material (tree rings) that can be used to reveal the past climatic conditions in this region (Bräuning and Mantwill, 2004; Fan et al., 2009; Fang et al., 2010; Li et al., 2011; Wang et al., 2015; Li and Li, 2017; Shi et al., 2017; Huang et al., 2019; Shi et al., 2019; Keyimu et al., 2021). Many dendroclimatological reconstructions of hydroclimatic variables have also been conducted in the SETP (Fan et al., 2008; Zhang et al., 2015; Wernicke et al., 2015; Griessinger et al., 2017; Li et al., 2017; He et al., 2018). However, few studies have focused on the reconstruction of precipitation history (He et al., 2012; Wernicke et al., 2015). The non-growing season (NGS) of vegetation (from November of the previous year to February of the current year) includes the winter monsoon and pre-summer monsoon seasons in the SETP, and water availability during the NGS might therefore have a constraining effect on radial tree growth (Linderholm and Chen, 2005). It is important to understand the long-term precipitation variations during the NGS to evaluate the current trend of precipitation variation and estimate its future patterns and to determine the future responses of the forest ecosystem under the changing precipitation trend. To our knowledge, however, there have been no reports of the reconstruction of NGS precipitation in this area. This hinders our understanding of NGS variability from a long-term perspective.
In this study, we collected tree-ring cores of hemlock forest from the Xinzhu village of northwestern Yunnan in the SETP. The main objectives of the present study were to (1) develop a new tree-ring chronology and identify the responses of hemlock forest radial growth to climate in the investigation area, (2) reconstruct the historical NGS precipitation and evaluate the recent NGS precipitation change in the long-term context and (3) validate the reliability of the reconstruction. Our results not only enrich the historical hydroclimatic information available in the SETP but also provide a basis to understand the current trend of regional NGS precipitation variation, which is relevant for evaluating the future development of regional forest ecosystem.
2.1 Study area and sampling sites
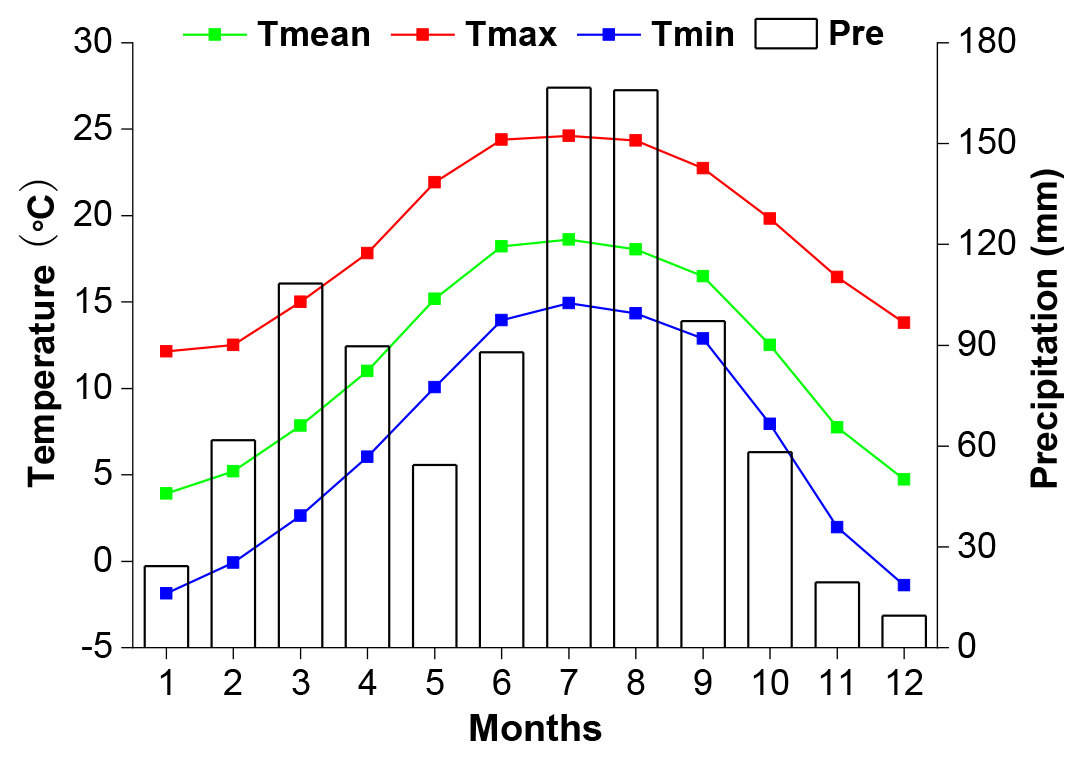
Tree-ring core samples were collected from Xinzhu Village in Lijiang County in northwestern Yunnan. The sample site was in the Hengduan Mountains in the SETP (Fig. 1). The climate of the study area is regulated by a westerly circulation and the monsoon circulations of the Indian and Pacific oceans. “Hengduan” means “transverse” in the Chinese language, which implies that the mountains in this region lie in the transverse direction from south to north, and the area is a passageway for the Indian monsoon to flow in and climb up to the TP and other parts of the mainland. The SETP is susceptible to monsoon flow and atmospheric circulations (Bräuning and Mantwill, 2004). According to the Weixi meteorological station of the China Meteorological Administration, which was the closest station to our sampling site, the mean annual precipitation was 953 mm from 1955 to 2016. Most of the annual precipitation (Nearly 70 %) concentrated in the monsoon season from May to October in this region (Fig. 2), and thus tree growth is usually constrained by water availability during the non-growing season. The coldest temperature was −2.9 ∘C in January and the warmest temperature was 18.6 ∘C in July. The topography of the sampling area is relatively steep, and it is not in favor of soil development; hence, a thin soil layer of alpine meadow soil (Chinese soil taxonomy) covers the bedrock. Hemlock is the dominant tree species of the sampling site, and its tree-ring cores were collected from trees which are healthy and relatively isolated, an optimal condition for maximizing climate signals in tree rings (Li et al., 2017). The elevation of the sampling site was 2966 m a.s.l. A total of 48 tree-ring cores were extracted from 48 trees using a 5.1 mm diameter increment borer. We have used one sampling method per tree to improve the spatial representativity of radial tree growth. Sampling was conducted along an axis perpendicular to the slope inclination to avoid the impact of tension wood (Keyimu et al., 2020).

Figure 1Map of the study area. The green triangle is the study site. The red triangles are the sites in other studies (previous-year May–current-year April Palmer Drought Severity Index (PDSI) reconstruction site in Fang et al., 2010; current-year March–May PDSI reconstruction site in Fan et al., 2008; current-year April–June PDSI reconstruction site in Li et al., 2017; current-year May–June PDSI reconstruction site in Zhang et al., 2015). The blue dot is the meteorological station in Weixi County. On the right is the landscape image of tree-ring sampling site.
2.2 Establishment of the tree-ring chronology
The tree-ring samples were treated with standard dendrochronological procedures. They were first glued onto wooden holders and air dried, and then polished to a flat surface with sand paper until the tree rings were clearly visible. The LINTAB 6.0 tree-ring measurement system (Rinntech Inc., Heidelberg, Germany) was used to measure the tree-ring width (TRW). We have marked the tree rings of each sample at each 10-year interval and visually checked the tree-ring pattern matching among samples, then confirmed the crossdating quality using the COFFECHA program (Holmes, 1983) (Arizona, USA). In total, 38 of the tree-ring cores were adopted for a further analysis after excluding the bad quality samples and the uncrossdated samples. The tree-ring series was detrended with a negative exponential model to remove the age dependency of tree growth (Cook et al., 1995). We have used the residual chronology since it removes the auto-correlation in tree-ring growth and captures a high-frequency climate signal. The “dplR” software toolkit (Bunn, 2018) within the R software environment (Bates et al., 2020) was used for detrending and chronology establishment. The reliable period of the chronology was determined based on the criterion of expressed population signal (EPS) >0.85 (Wigley, 1984).
2.3 Climate data
Temperature and precipitation records were obtained from the Weixi meteorological station (27.17∘ N, 99.28∘ E; 2326 m a.s.l.) operated by the China Meteorological Administration. Data were available for the period of 1955–2005. Climate data (including the maximum, minimum and average temperatures, and precipitation) were provided by the China Meteorological Data Sharing Service Platform. A self-calibrated Palmer Drought Severity Index (scPDSI) was downloaded from the 3.26e gridded dataset of the Climate Research Unit (CRU) via the Royal Netherlands Meteorological Institute (KNMI) climate explorer (data accessed on 23 December 2020, data re-accessed for the updated version (CRU scPDSI 4.05 early) of PDSI data on 20 April 2021) using the coordinates of the tree-ring sampling site. The range of CRU grid box is 27.0–27.5∘ N, 99.0–99.5∘ E.
2.4 Tree growth and climate relationship analysis
We analyzed the relationship between climate and tree growth using DENDROCLIM2002 software (Biondi and Waikul, 2004). Pearson correlation values and response function values were calculated for the relationships between TRW indices and climate variables for the period of 1955–2005. Due to the carryover effect of the climatic conditions of the previous year on the current-year tree growth (Fritts, 1976), the tree growth–climate relationship analysis spanned a 16-month period from June of the previous year to September of the current year. We also used the seasonalized climate variables because it made more ecophysiological sense for growth than single months. To observe the temporal stability of the climate influence on radial tree growth, we conducted a moving correlation analysis at a moving interval of 32 years. All the correlation results were considered significant at the 95 % confidence level.
2.5 Statistics of chronology and climate reconstruction
We have used the expressed population signal (EPS) to determine the reliable period of the chronology; mean inter-series correlation (Rbar), signal-to-noise ratio (SNR) and variance of first eigenvector (VFE) to evaluate the common signal among measurement series; standard deviation (SD) and mean sensitivity (MS) to show the degree of interannual variability of the chronology. According to the analysis of the relationship between the TRW indices and constraining climatic factors, we developed a linear regression model (Cook and Kairiukstis, 1990) for the climate reconstruction. As in many other tree-ring-based climate reconstructions, we tested the goodness of fit of the model using the leave-one-out cross-validation method (Michaelsen, 1987). We used the Pearson's correlation coefficient (r), explained variance (R2), adjusted explained variance (), reduction of error (RE), sign test (ST), coefficient of efficiency (CE) and product mean test (Pmt) to evaluate the fidelity of the reconstruction model (Fritts et al., 1990).
3.1 Characteristics of the TRW chronology
Residual TRW chronology of hemlock forests from the investigation area was established (Fig. 3). The descriptive statistics of the chronology were presented in Table 1. According to the criteria of EPS >0.85, the most reliable length of the TRW chronology was 406 years (1600–2005). The mean correlation among tree-ring series (Rbar) was 0.48, and the variance in the first eigenvector (VFE) was 27 %, which implied a relatively strong common signal among individual trees constituting the chronology. The relatively low interannual variability of the chronology was expressed by the small mean sensitivity value (0.23). The EPS and SNR values (average EPS and SNR were 0.89 and 6.87 for the total length chronology, respectively) further implied the existence of the common signal among each individual measurement series. In general, all the statistical parameters indicated the potential climate signal imprinted in our TRW chronology.
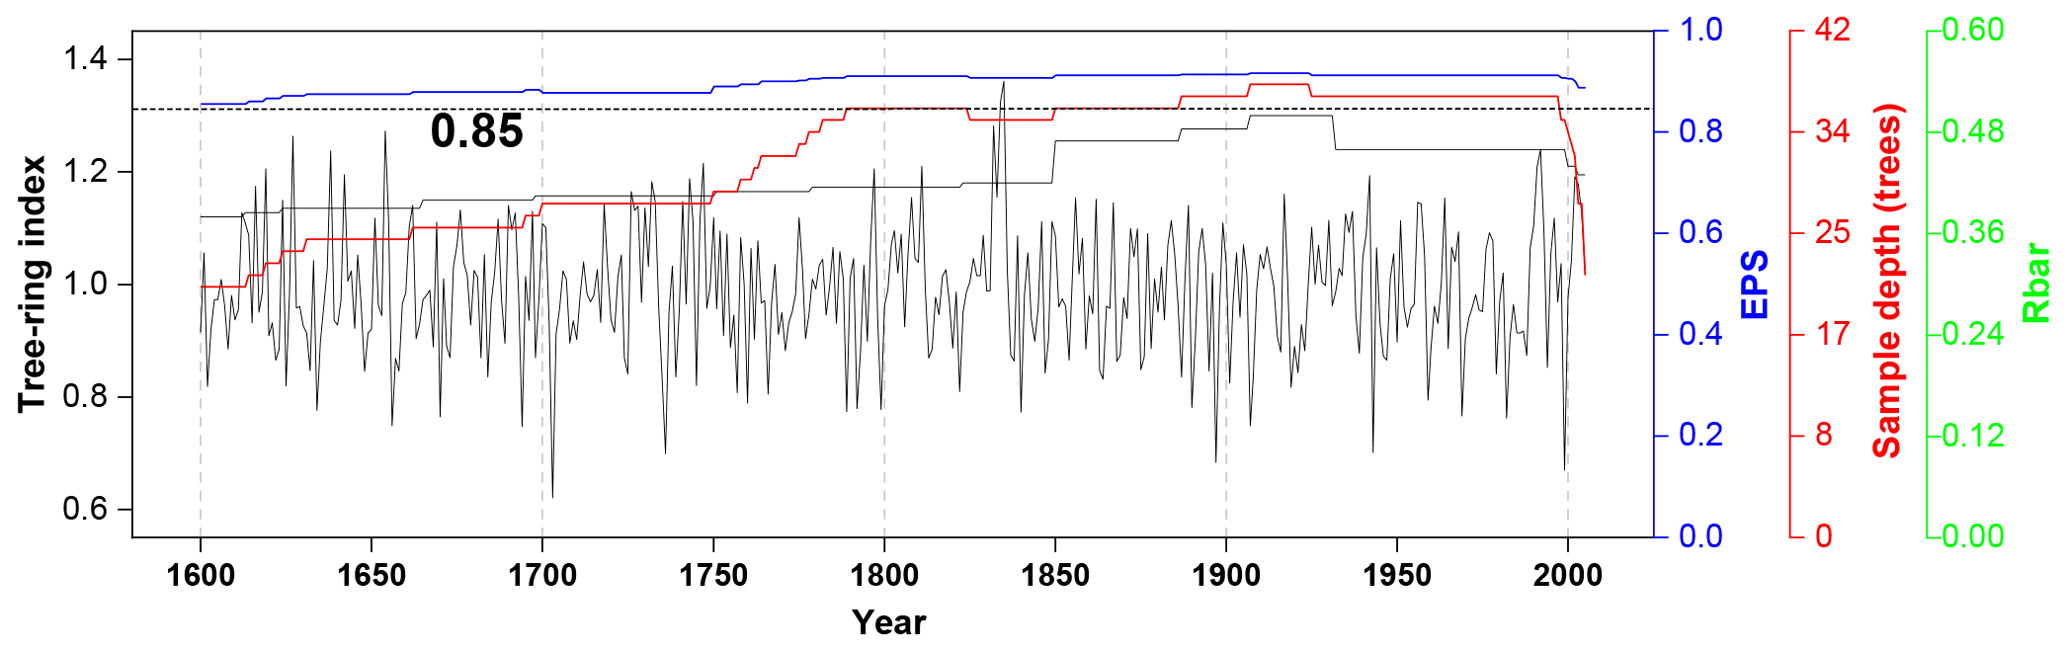
Figure 3Plot of tree-ring residual chronology, the running intercorrelations among cores (Rbar, the green line), expressed population signal (EPS, the blue line) and the sample size (the red line). The Rbar and EPS were calculated using a 30-year window, with a 15-year lag. The horizontal dashed line denotes the EPS threshold level (0.85).
Table 1Site information, chronology statistics and results of a common interval span analysis of residual tree-ring width (TRW) chronology from the Xinzhu village, northwestern Yunnan, in China.

Note: SD: standard deviation, MS: mean sensitivity, Rbar: mean inter-series correlation, SNR: signal-to-noise ratio, EPS: expressed population signal, VFE: variance in the first eigenvector.
3.2 Tree growth and climate relationship analysis
According to the results of the tree growth and climate relationship analyses (Fig. 4), the precipitation during the NGS was the most important constraining factor (R = 0.56, p<0.001) on the radial growth of hemlock forests in the study area. The results of a response function analysis further confirmed the strong correlation between NGS precipitation and hemlock forest radial growth. The results of a moving correlation analysis between TRW chronology and instrumental NGS precipitation record (Fig. 5) were positively significant (at 99 %) during the investigated period (1956–2005), indicating that the NGS precipitation influence was stationary over time.
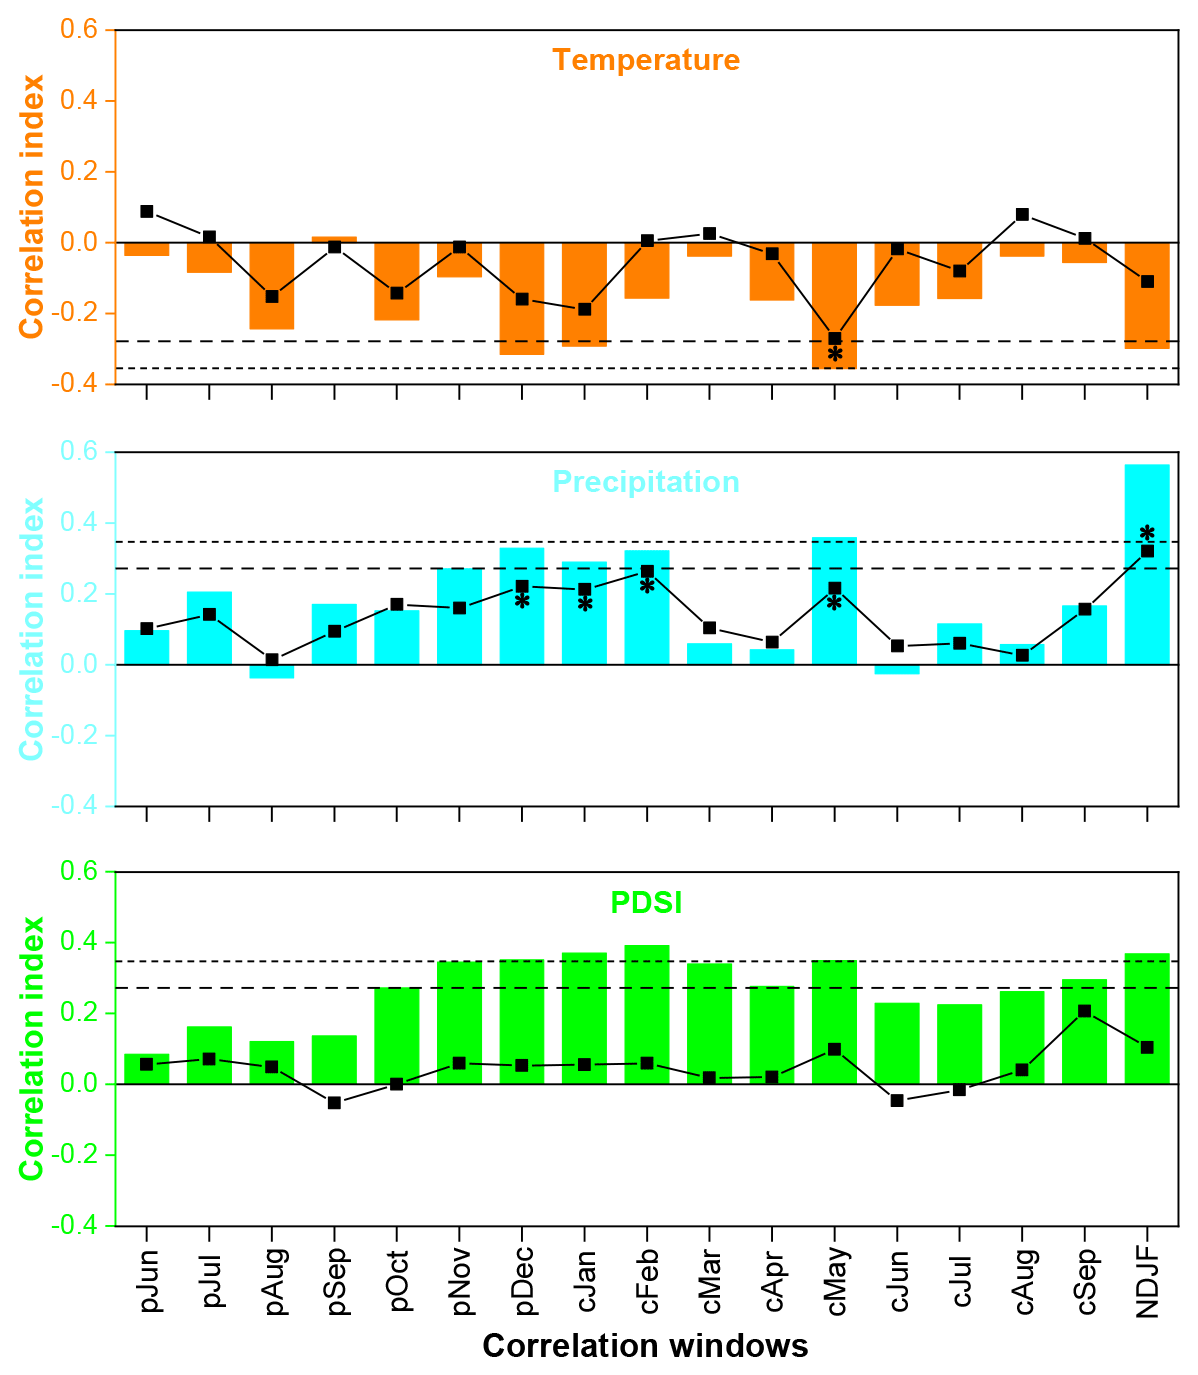
Figure 4Correlations between tree-ring indices and temperature, precipitation and scPDSI in the correlation windows from the previous-year June to current-year September, as well as in NDJF (non-growing season, NGS) for the common period from 1956 to 2005. The horizontal dashed and dotted lines indicate the threshold of the correlations at the 95 % and 99 % significance levels. The black line with squares denotes the results of response function analysis between tree-ring indices and climate variables. The asterisks next to the squares denote the significant effects (p<0.05) of response function analyses.
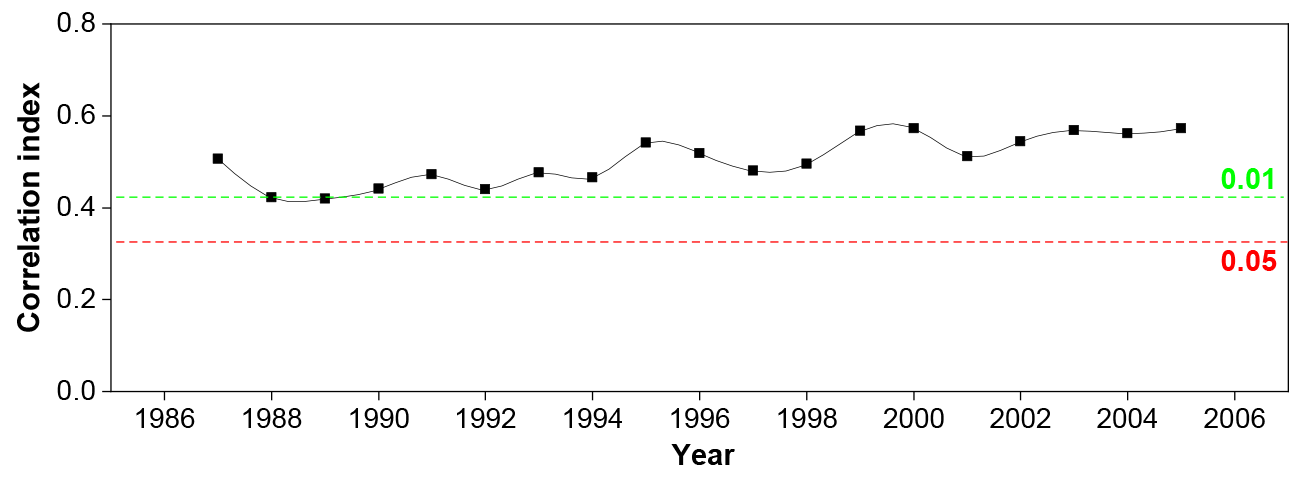
Figure 5The moving correlation result between TRW chronology and NGS precipitation during the period of 1956–2005. The horizontal red and dashed green lines denote the significance levels of 0.05 and 0.01, respectively.
3.3 Non-growing-season precipitation reconstruction
According to the relationship between the TRW chronology and NGS precipitation, we developed a linear regression model (y = 229.94x−109.45 mm) and reconstructed the historical NGS precipitation series, which extended back to 1600 (Fig. 6b). In the model, y is the NGS precipitation, and x is the TRW index. The reconstruction accounted for 28.5 % of the instrumental NGS precipitation variability during the common time span (1956–2005). Figure 6a shows the similarities between the instrumental and reconstructed NGS precipitation series. We used a leave-one-out cross-verification method to evaluate the legitimacy of the reconstruction model (Table 2). The positive RE and CE values (0.18 and 0.15, respectively) were indicative of the legitimacy of the reconstruction. The significant value (at 95 %) of the sign test implied that the model-predicted values were generally in line with the variation trend of instrumental values. In addition, the significant values of the F test (at 99 %) and PM test (at 95 %) further confirmed the validity of the reconstruction. Overall, the statistics indicated that the reconstruction model possessed good predictive skills.

Figure 6NGS precipitation reconstruction from 1600 to 2005. (a) The black line is the reconstruction series; the thick cyan line is the 11-year loess smoothed series. The horizontal dashed black line is the mean of NGS precipitation value during 1600–2005. The horizontal green and red dashed lines are 1 and 2 times the standard deviation of NGS precipitation, which demonstrated the boundaries of dry and extremely dry (below mean), and wet and extreme wet (above mean) years. The gray shading indicated the 95 % confidence interval of the reconstruction; (b) instrumental (black) and reconstructed (gray) NGS precipitation during their common period of 1956–2005.
Table 2Leave-one-out verification statistics for the NGS precipitation reconstruction.
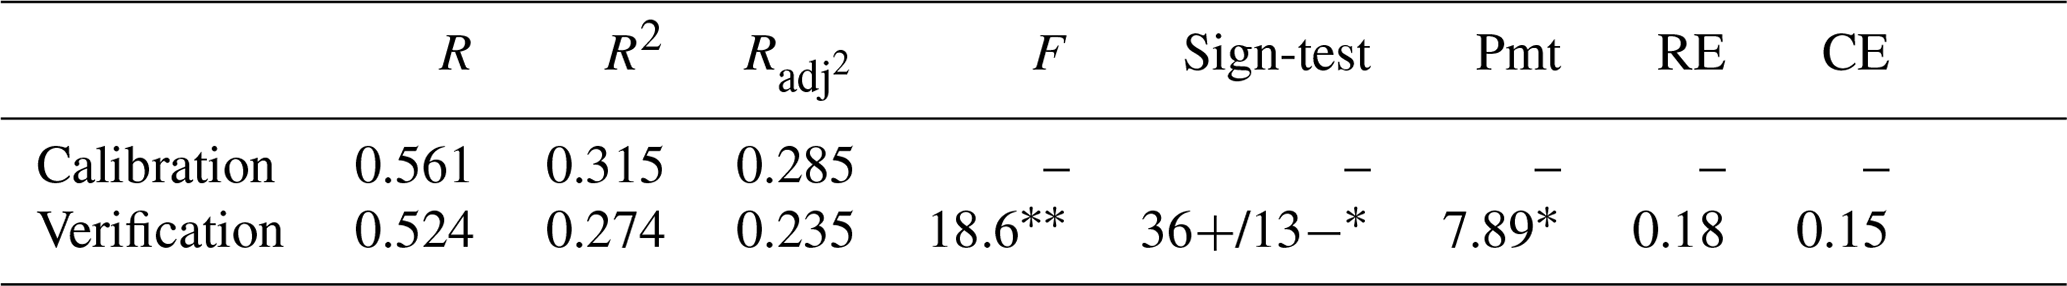
Note: R is the correlation coefficient, R2 is the explained variance, is the adjusted explained variance, F is the F test, sign test is the sign of paired observed and estimated departures from their mean on the basis of the number of agreements/disagreements, Pmt is the product mean test, RE is the reduction of error, and CE is the coefficient of efficiency; ∗ p<0.05, p<0.01.
3.4 Characteristics of the NGS precipitation reconstruction
Figure 6b shows the reconstructed NGS precipitation over the past 406 years (1600–2005). The mean of the reconstructed NGS precipitation series was 118 mm, and the standard deviation (SD) was 26 mm. We pre-defined the years that had NGS precipitation above 144 mm (mean + SD) as wet NGS years, and above 170 mm (mean + 2 SD) as extremely wet years (Table 3), whereas we defined years that had precipitation below 92 mm (mean − SD) as dry NGS years, and below 66 mm (mean − 2 SD) as extremely dry NGS years (Table 3). The dry/wet periods and some of the extreme dry/wet NGS periods in the present reconstruction were synchronized with dry/wet periods and extreme dry/wet periods in previously reported PDSI reconstruction from the surrounding region (Fig. 7, Tables S2 and S3), though some dissimilarities also existed. As shown in Fig. 8, the instrumental (a, c) and reconstructed (b, d) NGS precipitation series could represent the climatic conditions over a similar area in the SETP.
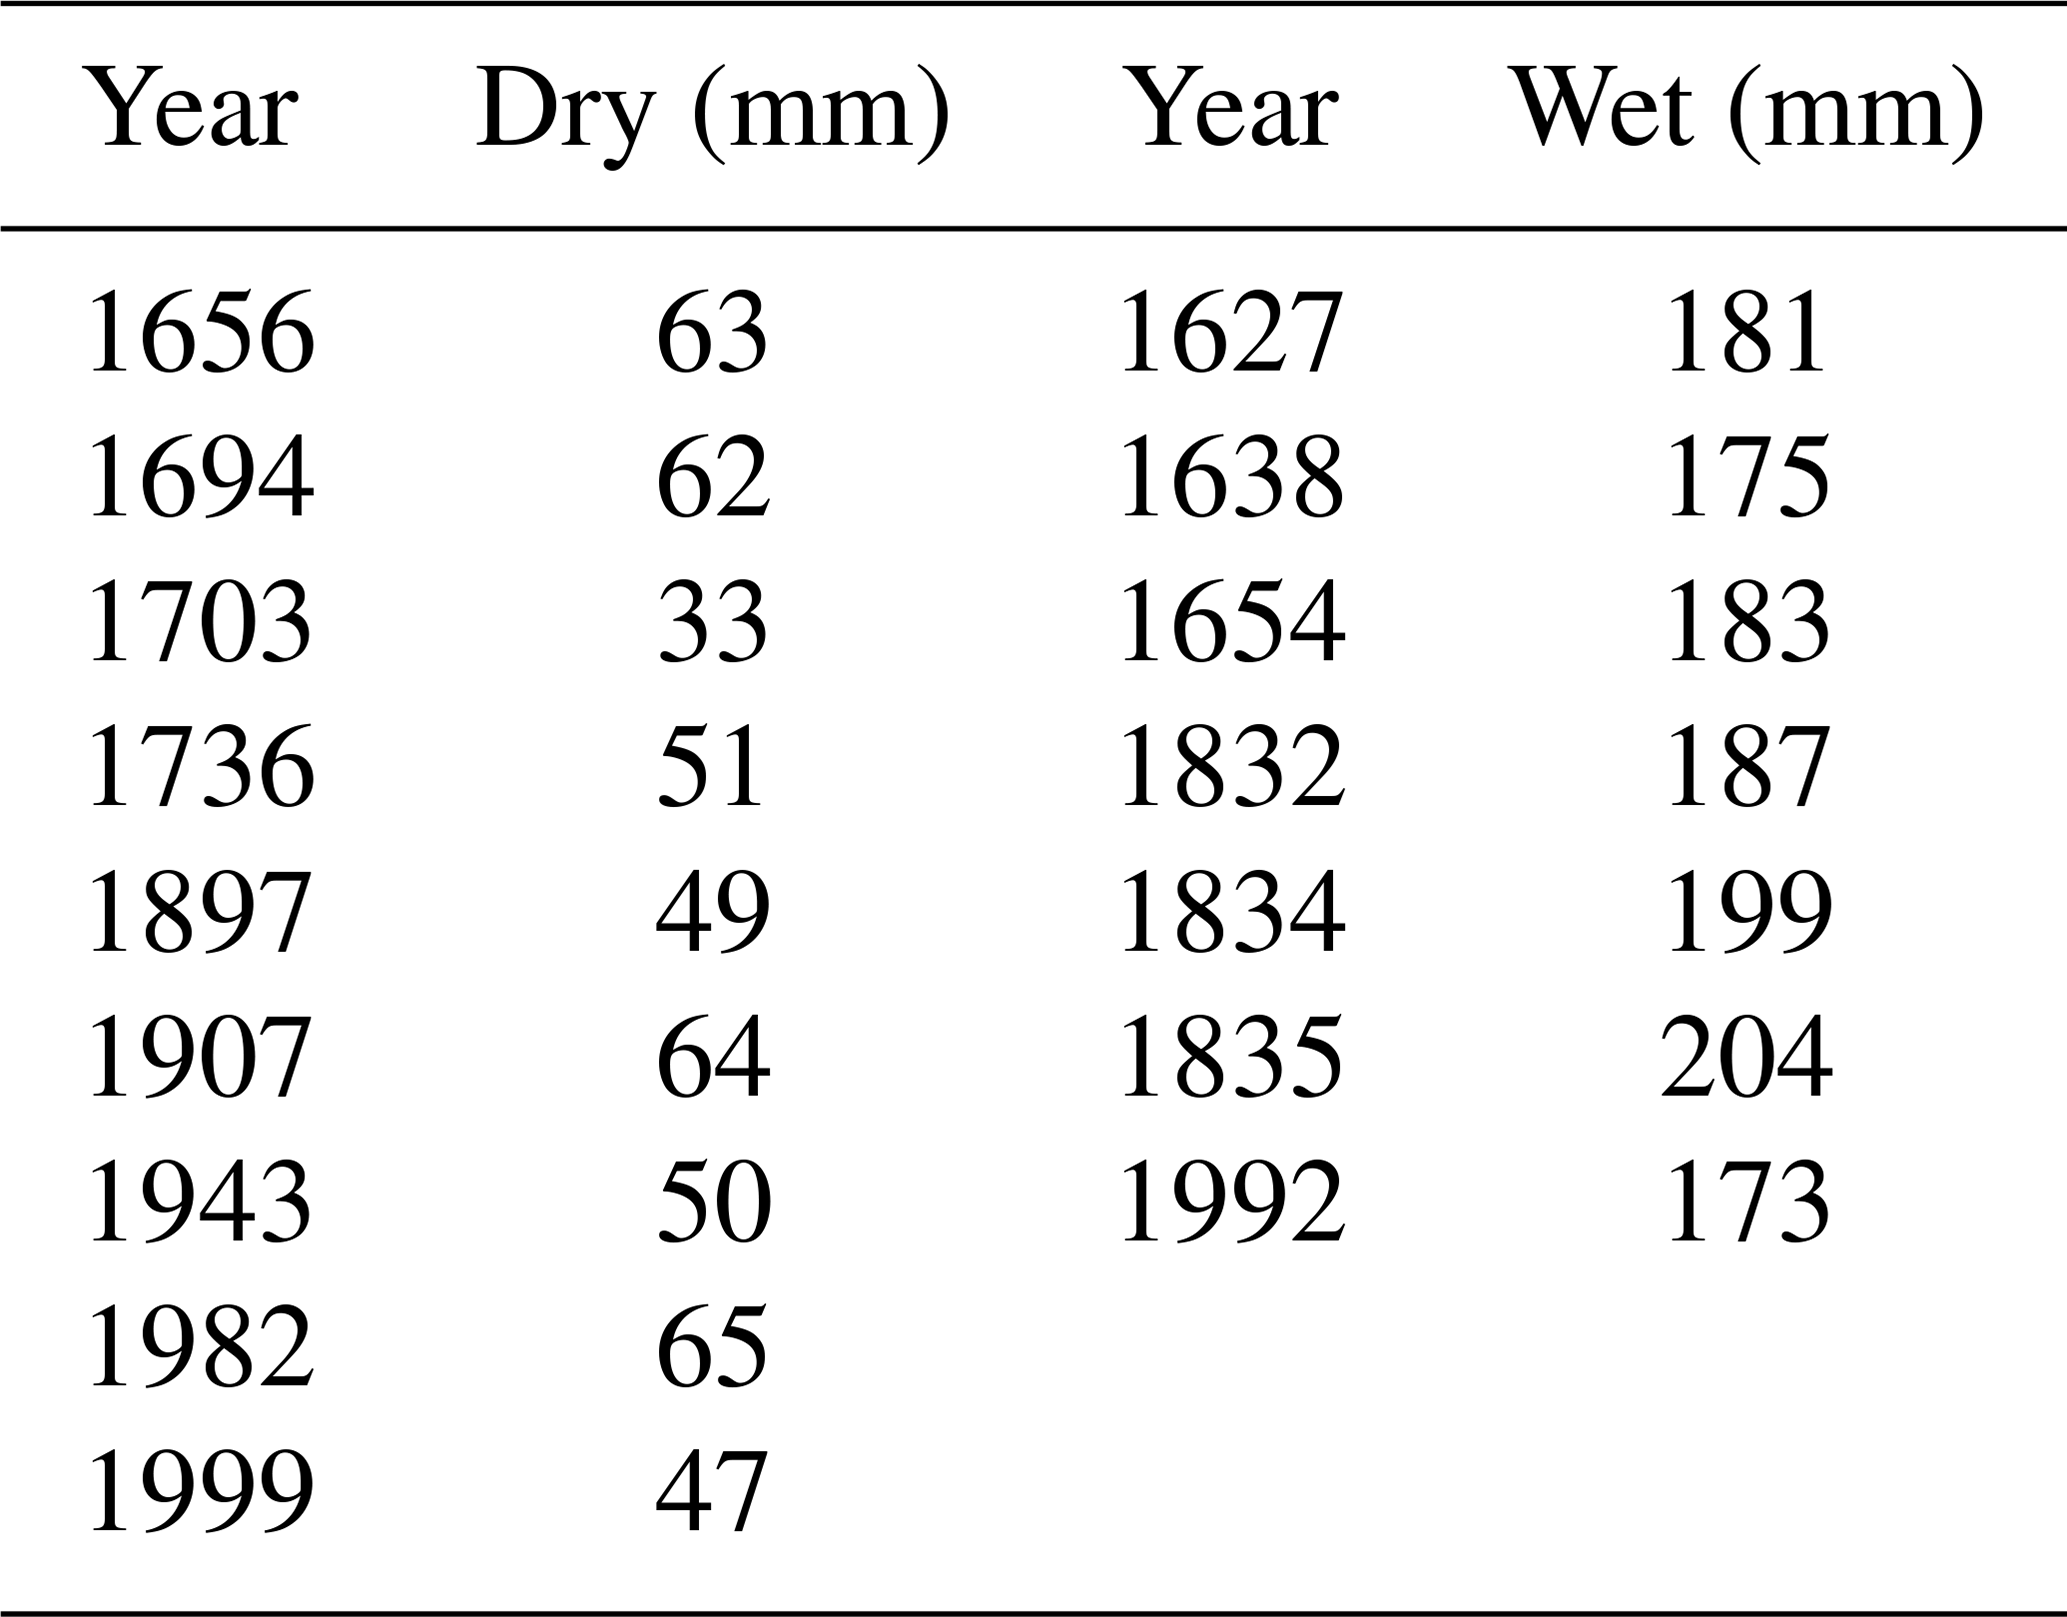
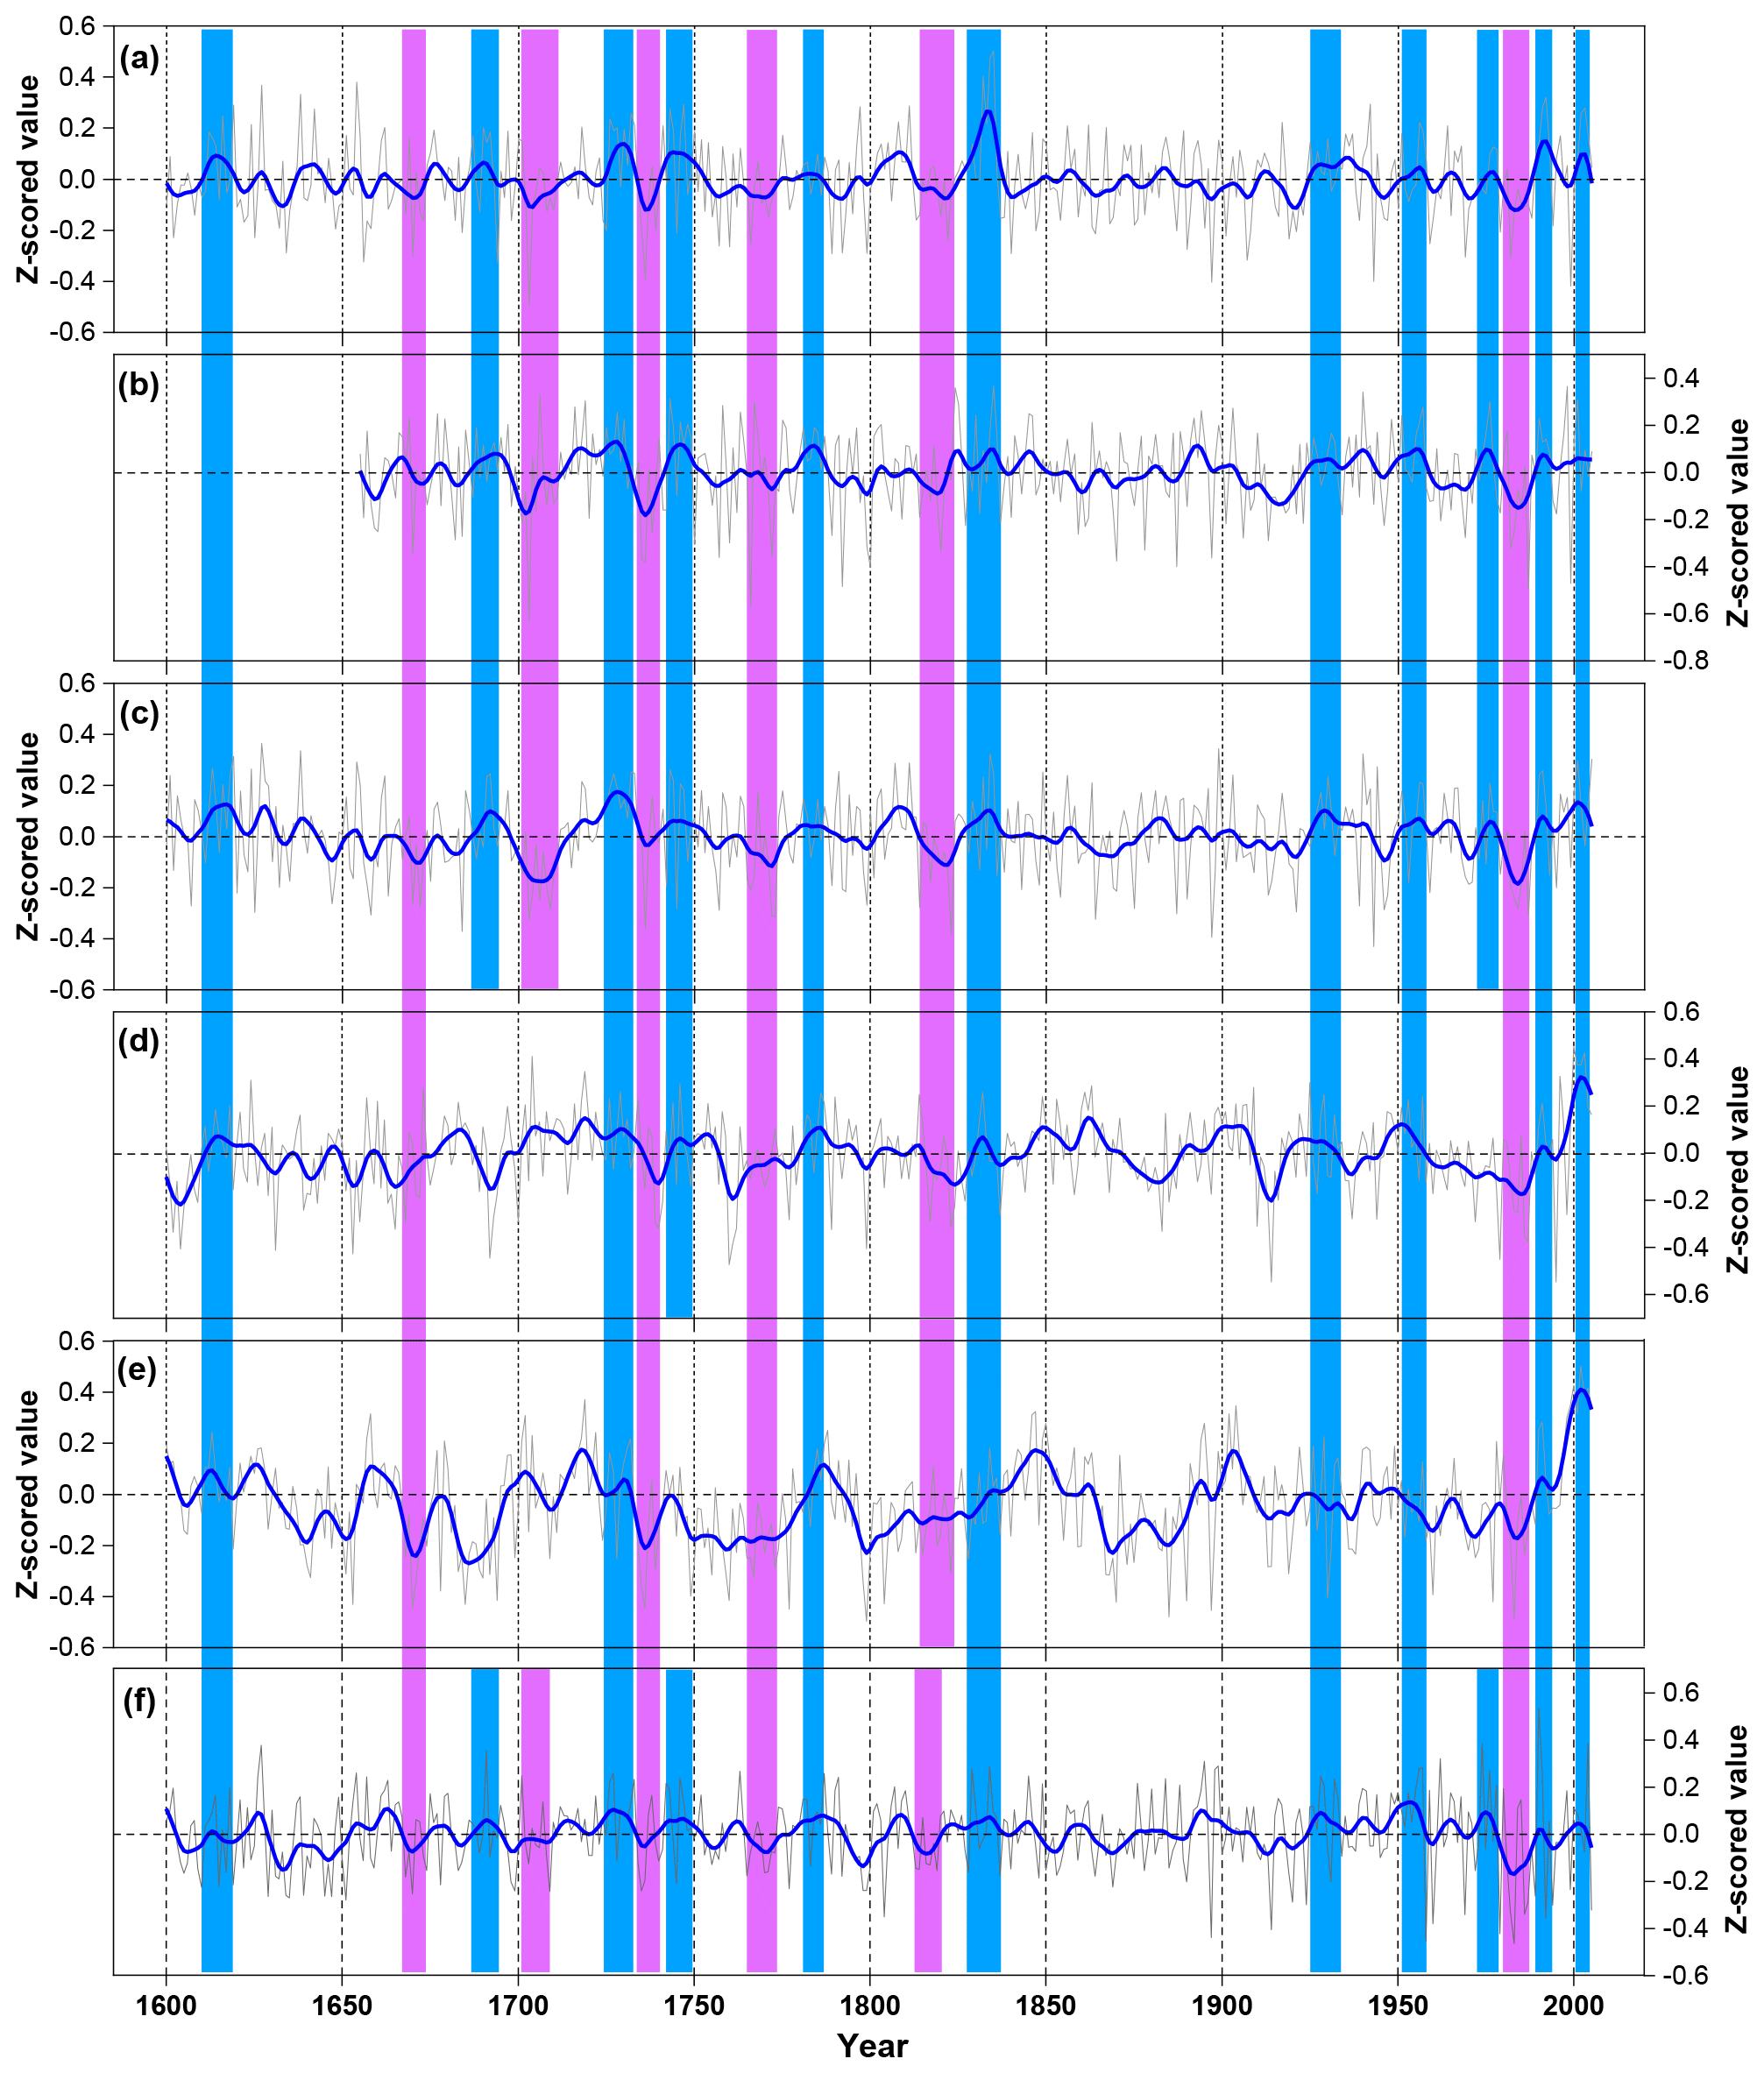
Figure 7Comparisons of the hydroclimatic reconstructions in different studies. (a) The NGS precipitation reconstruction in the present study. (b) The current-year March–May average Palmer Drought Severity Index (PDSI) reconstruction in Fan et al. (2008). (c) The reconstruction of average PDSI from May of the previous year to April of the current year in Fang et al. (2010). (d) The current-year May–June average PDSI reconstruction in Zhang et al. (2015). (e) The current-year April–June average PDSI reconstruction in Li et al. (2017). (f) Drought series extracted from Asian Monsoon Atlas from the nearest point (Cook et al., 2010). The blue and purple bars show the common wet and dry periods of the different reconstructions, respectively.
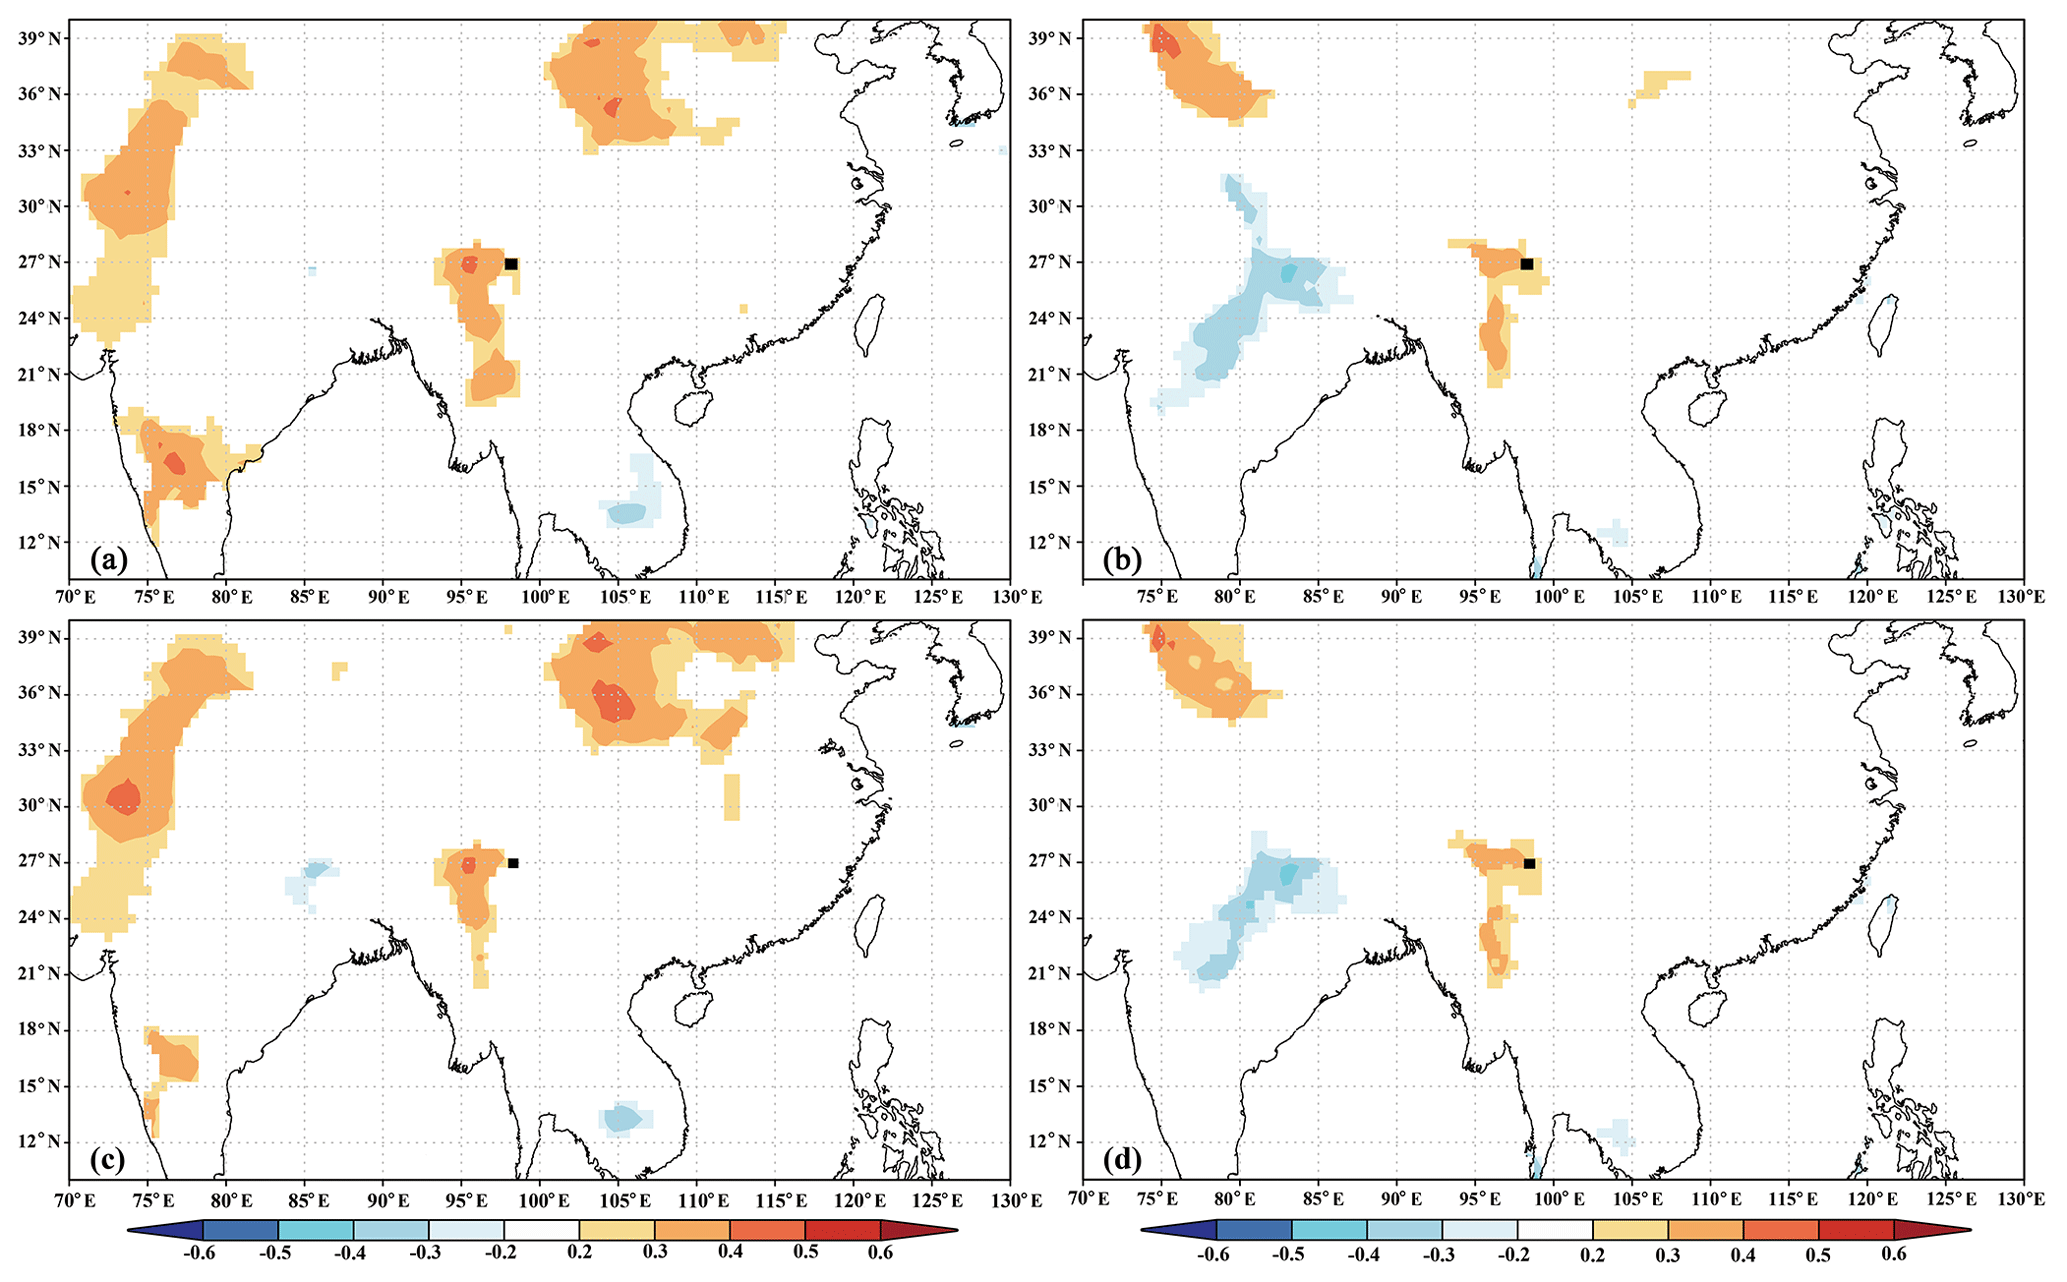
Figure 8Spatial correlations of actual (a raw data; c first-differenced data) and reconstructed (b raw data; d first-differenced data) NGS precipitation with a gridded dataset of the NGS precipitation (average from November of the previous year to February of the current year) during their overlapping periods (1956–2005). The black square indicates the location of the study site.
4.1 Tree growth and climate relationship
The results of the tree growth and climate relationship analyses suggested that the hemlock forest radial growth in the northwestern Yunnan region of the SETP was strongly constrained by hydroclimatic factors. According to the Pearson correlation analysis, the influence of precipitation during the NGS on radial tree growth was greater than that of any other investigated climate variables and any correlation window. The response function analysis further confirmed the strong impact of NGS precipitation. In addition, the results of the 32-year interval of moving correlation analysis (Fig. 5) suggested the temporally consistent influence of NGS precipitation on hemlock forest radial growth in this region. The importance of NGS precipitation on the radial tree growth could be attributed to the fact that precipitation during the NGS compensated for the soil moisture, which was crucially important for supporting tree growth in the following season (Linderholm and Chen, 2005; Treydte et al., 2006; Wu et al., 2019; Li et al., 2021). This is because tree growth is often water stressed in the early stages of its growth in each year on the SETP when the monsoon precipitation does not arrive (Bräuning and Mantwill, 2004; Zhang et al., 2015), and the earlywood of tree rings mainly use spring meltwater (Zhu et al., 2021). The ecophysiological importance of NGS precipitation on tree growth and tree water usage was also revealed by isotope-ratio method-based investigations. Brinkmann et al.'s (2018) study showed that nearly 40 % of the water taken up by Fagus sylvatica and Picea abies trees in a temperate forest of middle Europe is sourced from NGS precipitation. Tree-ring oxygen isotope ratios (δ18O) are demonstrated to contain NGS precipitation signals in the Himalayan region (Huang et al., 2019; Zhu et al., 2021). Huang et al.'s (2019) study revealed that NGS precipitation (snowfall) increased the snow depth and the later snowmelt compensated soil moisture in the spring and early summer, which was a crucially important water source for the Juniper growth in the southwestern Tibetan Plateau. Zhu et al.'s (2021) investigation in the western Himalaya revealed that formation of earlywood in tree rings of Pinus wallichiana depended on the snowmelt that originated from NGS precipitation. The weak influence of precipitation on regional hemlock forest growth during March and April and strong influence during May were connected with the saddle-shaped monthly rainfall pattern of this area (Fig. 2). The highest correlation between precipitation and TRW chronology was observed in May of the current year. This is because the xylogenous activity to form earlywood coincided with the low precipitation in this month (Fig. 2). In addition, the meltwater was probably used up (tree uptake combined with evaporation) during the early spring. Therefore, water stressed was increased during the late spring (May). The correlations between precipitation and the TRW chronology were not significant during the growing season (June–September) because an adequate water supply was available in the summer monsoon season.
Precipitation during the NGS over the SETP falls as snow. According to Sommerfeld et al. (1993) and Stadler et al. (1996), the development of a snowpack insulates the underlying soil from freezing temperatures, which creates unfrozen soil conditions and most of the soil processes that are active during warmer conditions also persist under snow cover, albeit at a reduced rate (Edwards, 2007). Unfrozen soil can reduce the cold and frost damage to the shallow root systems of conifer trees in this region (Schenk and Jackson, 2002). A reduction in the cold damage to roots decreases the energy required to form new roots in the following growth year (Pederson et al., 2004), with the saved energy potentially used to initiate xylogenesis and form earlywood cells. Evergreen tree species are known to carry out year-round photosynthetic activity (Oquist and Huner, 2003; Prats and Brodersen, 2020), albeit at a slower rate during the NGS, and therefore the higher moisture availability contributes to the carbohydrate and energy accumulation process of hemlock forests in the investigation area.
In contrast, the radial tree growth was negatively correlated to temperature in most correlation windows (Fig. 4). This can be explained by the fact that higher temperature enhances evapotranspiration, and thus decreases water availability, which eventually constrains tree growth. The negative impact of NGS temperature on radial tree growth was obvious because the strengthened evaporation due to higher temperatures might reduce the moisture compensation to the soil layer and cause water stress during the early stage of the following growth season.
4.2 Validity of the reconstructed precipitation series
We have tried to validate the fidelity of the newly reconstructed series from different aspects. Although we used the residual TRW chronology in the present study, which removes autocorrelation (Cook and Kairiukstis, 1990) to capture the high-frequency climate signals as in Fan et al. (2008) and Chen et al. (2016), the variability of dry and wet NGS at different scales was still retained in the reconstructed series. The reconstructed series in the present study demonstrated the variation in dry and wet NGS years (Fig. 6b). As in many other proxy-based historical climate reconstruction studies, we compared our NGS precipitation series with other hydroclimatic reconstructions from the surrounding areas to investigate the reliability of our reconstruction. However, there was no reported historical NGS precipitation record in the SETP, and we had to compare the present reconstruction series with available hydroclimatic reconstructions, e.g., PDSI. There are only countable numbers of PDSI reconstructions in the nearby region. Hence, we could only compare the present NGS precipitation reconstruction with existing PDSI reconstructions (Fig. 7) which are of spring or early summer. Dry/wet climate during these seasons is usually associated with the winter precipitation; hence, it makes certain sense to carry out the comparison. The correlation coefficients between our NGS precipitation reconstruction and the PDSI reconstructions of Fan et al. (2008), Fang et al. (2010), Zhang et al. (2015) and Li et al. (2017) were 0.51 (n = 702), 0.35 (n = 1062), 0.25 (n = 1062) and 0.22 (n = 1016) (p<0.001). We have extracted the drought series of Asian Monsoon Atlas (Cook et al., 2010) from the nearest point to our investigation site and compared it with the NGS precipitation reconstruction in present study (R = 0.35, n = 1062, p<0.001). As can be observed from Fig. 7, there were dry and wet periods in compared reconstruction series which were consistent with the NGS precipitation variabilities. These similarities indicated the reliability of our NGS precipitation reconstruction to some extent. The correlation coefficients for the present reconstruction with those of Fan et al. (2008) and Fang et al. (2010) were greater than those with Li et al. (2017) and Zhang et al. (2015). These differences were probably due to the different distances among the study sites. Although the major dry and wet periods were similar in the hydroclimatic reconstructions referenced above, there were still certain discrepancies in duration and the strength of the dry/wet climatic conditions. This is probably because of the differences in the types of hydroclimatic variables (precipitation, PDSI), specific seasons reconstructed (annual, seasonal), tree species (species with different drought tolerances), chronology recording methods (standard chronology, residual chronology), length of calibration period, sample replication and the geomorphic differences of the tree-ring sampling sites (altitude, slope) (Table S1 in the Supplement).
In addition, we uploaded both of the instrumental and reconstructed NGS precipitation data for the same period of 1956–2005 on the KNMI website and conducted a spatial correlation analysis with the CRU gridded climate dataset. The similar patterns of spatial correlation between the instrumental and reconstructed data and their first-differenced data (Fig. 8) indicated that the present reconstruction was reliable and could represent the NGS precipitation over a large area in the SETP. Besides, the occurrence of some great historical drought events in the Asian monsoon area (Cook et al., 2010; Kang et al., 2013), i.e., those of 1756–1768 (strange parallels drought), 1790, 1792–1796 (east India drought) and the 1920s (China mega-drought), matched the dry NGS periods in our reconstruction, which also further confirmed the reliability of our reconstruction.
In this study, we investigated 406 years of residual TRW chronology of hemlock forests in the SETP, China. The climate and tree growth relationship analyses showed that the TRW chronology was mostly negatively correlated with the thermal variable (temperature), whereas it was positively correlated with hydroclimatic variables (precipitation) and PDSI, indicating that hydroclimatic conditions determined the radial growth of hemlock forests in this region. Accordingly, we derived a linear model of the relationship between climate and tree growth, which accounted for 28.5 % of the actual NGS precipitation variance (1956–2005), and we used the model to reconstruct the historical (1600–2005) NGS precipitation. The reconstructed series showed that the NGS was extremely dry during the years 1656, 1694, 1703, 1736, 1897, 1907, 1943, 1982 and 1999. In contrast, the NGS was extremely wet during the years 1627, 1638, 1654, 1832, 1834–1835 and 1992. A comparison between the NGS precipitation reconstruction in this study and PDSI reconstructions from nearby regions revealed a coherency in the timing of dry and wet episodes, suggesting the reliability of our reconstruction. Our results showed that the NGS precipitation has demonstrated a slightly increasing trend since the 1980s, which is in favor of the future forest ecosystem development. In the future, more efforts should be made to collect the wide area of tree-ring data and develop more proxy chronologies that will enable us to reveal historical precipitation variability on a longer and wider scale in the SETP.
The climate reconstruction series in this study is provided in the Supplement.
The supplement related to this article is available online at: https://doi.org/10.5194/cp-17-2381-2021-supplement.
ZL and MK conceived the study; ZL, ZF and XWa collected the tree-ring data; MK, ZL, ZF, KF and XWu elaborated on the methodology; MK, LZ and WC analyzed the data; MK and ZL led the writing of the manuscript; ZL and ZF revised the manuscript; BF and GL and FZ validated the final manuscript.
The authors declare that they have no conflict of interest.
Publisher’s note: Copernicus Publications remains neutral with regard to jurisdictional claims in published maps and institutional affiliations.
This work was funded by the Second Tibetan Plateau Scientific Expedition and Research (STEP) program (grant nos. 2019QZKK0502 and 2019QZKK0302) and the National Key Research and Development Program of China (grant no. 2016YFC0502105). We are grateful to the editor and anonymous reviewers for their valuable comments and suggestions to improve this article.
This research has been supported by the Second Tibetan Plateau Scientific Expedition and Research (STEP) program (grant nos. 2019QZKK0502 and 2019QZKK0302) and the National Key Research and Development Program of China (grant no. 2016YFC0502105).
This paper was edited by Hans Linderholm and reviewed by three anonymous referees.
Anchukaitis, K. J., Wilson, R., Briffa, K. R., Büntgen, U., Cook, E., D'Arrigo, R., Davi, N., Esper, J., Frank, D., Gunnarson, B., Hegerl, G., Helama, S., Klesse, S., Krusic, P. J., Linderholm, H. W., Myglan, V., Osborn, T. J., Rydval, M., Schneider, L., Schurer, A., Wiles, G., Zhang, P., and Zorita, E.: Last millennium northern hemisphere summer temperatures from tree rings: Part I: the long-term context, Quat. Sci. Rev., 134, 1–18, https://doi.org/10.1016/j.quascirev.2017.02.020, 2016.
Bates, D., Chambers, J., Dalgaard, P., Gentleman, R., Hornik, K., Ihaka, R., Kalibera, T., Lawrence, M., Leisch, F., Ligges, U., Lumley, T., Maechler, M., Meyer, S., Murrell, P., Plummer, M., Ripley, B., Sarkar, D., Lang, D. T., Tierney, L., and Urbanek, S.: R: A language and environment for statistical computing, R Foundation for Statistical Computing, Vienna, Austria, available at: https://www.R-project.org/ (last access: 5 December 2019), 2020.
Biondi, F. and Waikul, K.: DENDROCLIM2002: a C program for statistical calibration of climate signals in tree ring chronologies, Comput. Geosci., 30, 303–311, https://doi.org/10.1016/j.cageo.2003.11.004, 2004.
Bräuning, A. and Mantwill, B.: Summer temperature and summer monsoon history on the Tibetan Plateau during the last 400 years recorded by tree rings, Geophys. Res. Lett., 31, L24205, https://doi.org/10.1029/2004GL020793, 2004.
Bunn, A. G. and Korpela, M.: An introduction to dplR, CRAN, available at: https://cran.biodisk.org/web/packages/dplR/vignettes/intro-dplR.pdf (last access: 10 December 2019), 2018.
Büntgen, U., Tegel, W., Nicolussi, K., McCormick, M., Frank, D., Trouet, V., Kaplan, J. O., Herzig, F., Heussner, K. U., Wanner, H., Luterbacher, J., and Esper, J.: 2500 years of European climate variability and human susceptibility, Science, 331, 578–582, https://doi.org/10.1126/science.1197175, 2011.
Büntgen, U., Myglan, V. S., Ljungqvist, F. C., McCormick, M., Di Cosmo N., Sigl, M., Jungclaus, J., Wagner, S., Krusic, P. J., Esper, J., Kaplan, J. O., de Vaan, M. A. C., Luterbacher, J., Wacker, L., Tegel, W., and Kirdyanov, A. V.: Cooling and societal change during the Late Antique Little Ice Age from 536 to around 660 AD, Nat. Geosci., 9, 231–236, https://doi.org/10.1038/ngeo2652, 2016.
Cai, Q., Liu, Y., Lei, Y., Bao, G., and Sun, B.: Reconstruction of the March–August PDSI since 1703 AD based on tree rings of Chinese pine (Pinus tabulaeformis Carr.) in the Lingkong Mountain, southeast Chinese loess Plateau, Clim. Past, 10, 509–521, https://doi.org/10.5194/cp-10-509-2014, 2014.
Chen, F., Yuan, Y. J., Zhang, T. W., and Shang, H.: Precipitation reconstruction for the northwestern Chinese Altay since 1760 indicates the drought signals of the northern part of inner Asia, Int. J. Biometeorol., 60, 455–463, https://doi.org/10.1007/s00484-015-1043-5, 2016.
Cook, E. R. and Kairiukstis, A.: Methods of Dendrochronology: Applications in the Environmental Sciences, Kluwer Academic Press, Dordrecht, 406 pp., 1990.
Cook, E. R., Briffa, K. R., Meko, D. M., Graybill, D. A., and Funkhouser, G.: The 'segment length curse' in long tree-ring chronology development for palaeoclimatic studies, Holocene, 5, 229–237, https://doi.org/10.1177/095968369500500211, 1995.
Cook, E. R., Anchukaitis, K. J., Buckley, B. M., D'Arrigo, R. D., Jacoby, G. C., and Wright, W. E.: Asian monsoon failure and megadrought during the last millennium, Science, 328, 486–489, https://doi.org/10.1126/science.1185188, 2010.
D'Arrigo, R. D., Mashig, E., Frank, D. C., Wilson, R. J. S., and Jacoby, G. C.: Temperature variability over the past millennium inferred from Northwestern Alaska tree rings, Clim. Dynam., 24, 227–236, https://doi.org/10.1007/s00382-004-0502-1, 2005.
Duan, K., Yao, T., and Thompson, L.: Response of monsoon precipitation in the Himalayas to global warming, J. Geophys. Res., 111, D19110, https://doi.org/10.1029/2006JD007084, 2006.
Edwards, A. C., Scalenghe, R., and Freppaz, M.: Changes in the seasonal snow cover of alpine regions and its effect on soil processes: a review, Quat. Int., 162–163, 172–181, https://doi.org/10.1016/j.quaint.2006.10.027, 2007.
Esper, J.: 1300 years of climatic history for Western Central Asia inferred from tree rings, Holocene, 12, 267–277, https://doi.org/10.1191/0959683602hl543rp, 2002.
Fan, Z. X., Bräuing, A., and Cao, K. F.: Tree-ring based drought reconstruction in the central Hengduan Mountains region (China) since AD 1655, Int. J. Climatol., 28, 1879–1887, https://doi.org/10.1002/joc.1689, 2008.
Fan, Z. X., Bruning, A., Yang, B., and Cao, K. F.: Tree ring density-based summer temperature reconstruction for the central Hengduan Mountains in southern China, Glob. Planet. Change, 65, 1–11, https://doi.org/10.1016/j.gloplacha.2008.10.001, 2009.
Fang, K. Y., Gou, X. H., Chen, F., Li, J. B., D'Arrigo, R., Cook, E. D., Yang, T., and Davi, N.: Reconstructed droughts for the southeastern Tibetan Plateau over the past 568 years and its linkages to the Pacific and Atlantic Ocean climate variability, Clim. Dynam., 35, 577–585, https://doi.org/10.1007/s00382-009-0636-2, 2010.
Fritts, H. C.: Tree rings and climate, Academic Press, London, 582 pp., ISBN 978-0-1241-4212-1, 1976.
Fritts, H. C., Guiot, J., and Gordon, G. A.: Verification, in: Methods of Dendrochronology: Applications in the Environmental Sciences, edited by: Cook, E. and Kairiukstis, L. A., Kluwer Academic Publishers, Dordrecht, 178–184, 1990.
Griessinger, J., Bräuning, A., Helle, G., Hochreuther, P., and Schleser, G.: Late Holocene relative humidity history on the southeastern Tibetan plateau inferred from a tree ring δ18O record: recent decrease and conditions during the last 1500 years, Quatern. Int., 430, 52–59, https://doi.org/10.1016/j.quaint.2016.02.011, 2017.
He, H. M., Yang, B., Bräuning, A., Wang, J. L., and Wang, Z. Y.: Tree-ring derived millennial precipitation record for the south-central Tibetan plateau and its possible driving mechanism, Holocene, 23, 36–45, https://doi.org/10.1177/0959683612450198, 2012.
He, H. M., Bräuning, A., Griessinger, J., Hochreuther, P., and Wernicke, J.: May–June drought reconstruction over the past 821 years on the southcentral Tibetan Plateau derived from tree-ring width series, Dendrochronologia, 47, 48–57, https://doi.org/10.1016/j.dendro.2017.12.006, 2018.
Holmes, R. L.: Computer-assisted quality control in tree-ring dating and measurement, Tree-ring Bull., 43, 69–75, 1983.
Huang, R., Zhu, H. F., Liang, E. Y., Liu, B., Shi, J. F., Zhang, R. B., Yuan, Y. J., and Griessinger, J.: A tree ring-based winter temperature reconstruction for the southeastern Tibetan Plateau since 1340 CE, Clim. Dynam., 53, 3221–3233, https://doi.org/10.1007/s00382-019-04695-3, 2019.
Kang, S. Y, Bao, Y., Qin, C., Wang, J. L, Feng, S., and Liu, J. J.: Extreme drought events in the years 1877–1878, and 1928, in the southeast Qilian mountains and the air–sea coupling system, Quatern. Int., 283, 85–92, https://doi.org/10.1016/j.quaint.2012.03.011, 2013.
Keyimu, M., Wei, J. S., Zhang, Y. X., Zhang, S., Li, Z. S., Ma, K. M., and Fu, B. J.: Climate signal shift under the influence of prevailing climate warming – Evidence from Quercus liaotungensis on Dongling Mountain, Beijing, China, Dendrochronologia, 60, 125683, https://doi.org/10.1016/j.dendro.2020.125683, 2020.
Keyimu, M., Li, Z. S., Liu, G. H., Fu, B. J., Fan, Z. X., Wang, X. C. Zhang, Y. D., and Halik, U.: Tree-ring based minimum temperature reconstruction on the southeastern Tibetan Plateau, Quat. Sci. Rev., 251, 106712, https://doi.org/10.1016/j.quascirev.2020.106712, 2021.
Li, J. B., Shi, J. F., Zhang, D. D., Yang, B., Fang, K. Y., and Yue, P. H.: Moisture increase in response to high-altitude warming evidenced by tree-rings on the southeastern Tibetan Plateau, Clim. Dynam., 48, 649–660, https://doi.org/10.1007/s00382-016-3101-z, 2017.
Li, T. and Li, J. B.: A 564 year annual minimum temperature reconstruction for the east central Tibetan Plateau from tree rings, Glob. Planet. Change, 157, 165–173, https://doi.org/10.1016/j.gloplacha.2017.08.018, 2017.
Li, Z. S., Zhang, Q. B., and Ma, K. P.: Tree-ring reconstruction of summer temperature for AD 1475–2003 in the central Hengduan Mountains, northwestern Yunnan, China, Climatic Change, 110, 455–467, https://doi.org/10.1007/s10584-011-0111-z, 2011.
Linderholm, H. W. and Chen, D.: Central Scandinavian winter precipitation variability during the past five centuries reconstructed from Pinus sylvestris tree rings, Boreas, 34, 43–52, https://doi.org/10.1111/j.1502-3885.2005.tb01003.x, 2005.
Michaelsen, J.: Crossevalidation in statistical climate forecast models, J. Clim. App. Meteorol., 26, 1589–1600, 1987.
Oquist, G. and Huner, N. P.: Photosynthesis of overwintering evergreen plants, Annu. Rev. Plant Biol., 54, 329–355, https://doi.org/10.1146/annurev.arplant.54.072402.115741, 2003.
Pederson, N., Cook, E. R., Jacoby, G. C., Peteet, D. M., and Griffin, K. L.: The influence of winter temperatures on the annual radial growth of six northern range margin tree species, Dendrochronologia, 22, 7–29, https://doi.org/10.1016/j.dendro.2004.09.005, 2004.
Prats, K. A. and Brodersen, C. R.: Seasonal coordination of leaf hydraulics and gas exchange in a wintergreen fern, AoB Plants, 12, plaa048, https://doi.org/10.1093/aobpla/plaa048, 2020.
Rangwala, I., Miller, J. R., and Xu, M.: Warming in the Tibetan Plateau: Possible influences of the changes in surface water vapor, Geophys. Res. Lett., 36, L06703, https://doi.org/10.1029/2009GL037245, 2009.
Schenk, H. J. and Jackson, R. B.: The global biogeography of roots, Ecol. Monogr., 72, 311–328, https://doi.org/10.1890/0012-9615(2002)072[0311:TGBOR]2.0.CO;2, 2002.
Schneider, L., Smerdon, J. E., Büntgen, U., Wilson, R. J. S., Myglan, V. S., Kirdyanov, A. V., and Esper, J.: Revising mid-latitude summer temperatures back to AD 600 based on a wood density network, Geophys. Res. Lett., 42, 4556–4562, https://doi.org/10.1002/2015GL063956, 2015.
Shi, C. M., Sun, C., Wu, G. C., Wu, X. C., Chen, D. L., Masson-Delmotte, V., Li, J. P., Xue, J. Q., Li, Z. S., Ji, D. Y., Zhang, J., Fan, Z. X., Shen, M. G., Shu, L. F., and Ciais, P.: Summer temperature over Tibetan Plateau modulated by Atlantic multi-decadal variability, J. Climate, 32, 4055–4067, https://doi.org/10.1175/JCLI-D-17-0858.1, 2019.
Shi, S. Y., Li, J. B., Shi, J. F., Zhao, Y. S., and Huang, G.: Three centuries of winter temperature change on the southeastern Tibetan plateau and its relationship with the Atlantic Multidecadal Oscillation, Clim. Dynam., 49, 1305–1319, https://doi.org/10.1007/s00382-016-3381-3, 2017.
Sommerfeld, R. A., Mosier, A. R., and Musselman, R. C.: CO2, CH4 and N2O flux through a Wyoming snowpack and implications for global budget, Nature, 361, 140–142, https://doi.org/10.1038/361140a0, 1993.
Stadler, D., Wunderli, H., Auckenthaler, A., and Fluhler, H.: Measurement of frost induced snowmelt runoff in a forest soil, Hydrol. Process., 10, 1293–1304, https://doi.org/10.1002/(SICI)1099-1085(199610)10:10<1293::AID-HYP461>3.0.CO;2-I, 1996.
Wang, J. L., Yang, B., and Ljungqvist, F. C.: A millennial summer temperature reconstruction for the eastern Tibetan Plateau from tree-ring width, J. Climate, 28, 5289–5304, https://doi.org/10.1175/JCLI-D-14-00738.1, 2015.
Wernicke, J., Grießinger, J., Hochreuther, P., and Bräuning, A.: Variability of summer humidity during the past 800 years on the eastern Tibetan Plateau inferred from δ18O of tree-ring cellulose, Clim. Past, 11, 327–337, https://doi.org/10.5194/cp-11-327-2015, 2015.
Wigley, T. M., Briffa, K. R., and Jones, P. D.: On the average value of correlated time series, with applications in dendroclimatology and hydrometeorology, J. Clim. Appl. Meteorol., 23, 201–213, https://doi.org/10.1175/1520-0450(1984)023<0201:OTAVOC>2.0.CO;2, 1984.
Wu, G., Duan, A., Liu, Y., Mao, J., Ren, R., Bao, Q., He, B., Liu, B., and Hu, W.: Tibetan Plateau climate dynamics: recent research progress and outlook, Natl. Sci. Rev., 2, 100–116, https://doi.org/10.1093/nsr/nwu045, 2015.
Wu, X. C., Li, X. Y., Liu, H. Y., Ciais, P., Li, Y. Q., Xu, C. Y., Babst, F., Guo, W. C., Hao, B. Y., Wang, P., Huang, Y. M., Liu, S. M., Tian, Y. H., He, B., and Zhang, C. C.: Uneven winter snow influence on tree growth across temperate China, Glob. Change Biol., 25, 144–154, https://doi.org/10.1111/gcb.14464, 2019.
Yan, L. and Liu, X.: Has climatic warming over the Tibetan Plateau paused or continued in recent years?, J. Earth Ocean Atmos. Sci., 1, 13–28, 2014.
Yang, B., Qin, C., Wang, J., He, M., Melvin, T. M., and Osborn, T. J.: A 3500 year tree-ring record of annual precipitation on the northeastern Tibetan Plateau, P. Natl. Acad. Sci. USA, 111, 2903–2908, https://doi.org/10.1073/pnas.1319238111, 2014.
Zhang, Q. B., Evans, M. N., and Lyu, L. X.: Moisture dipole over the Tibetan Plateau during the past five and a half centuries, Nat. Commun., 6, 8062, https://doi.org/10.1038/ncomms9062, 2015.
Zhu, H. F., Huang, R., Asad, F., Liang, E. Y., Bräuning, A., Zhang, X. Z., Dawadi, B., Man, W. M., and Griessinger, J.: Unexpected climate variability inferred from a 380 year tree-ring earlywood oxygen isotope record in the Karakoram, Northern Pakistan, Clim. Dynam., https://doi.org/10.1007/s00382-021-05736-6, 2021.