the Creative Commons Attribution 4.0 License.
the Creative Commons Attribution 4.0 License.
 | 15 Nov 2021
Unlocking weather observations from the Societas Meteorologica Palatina (1781–1792)
Duncan Pappert
Yuri Brugnara
Sylvie Jourdain
Aleksandra Pospieszyńska
Rajmund Przybylak
Christian Rohr
Stefan Brönnimann
In recent years, instrumental observations have become increasingly important in climate research, allowing past daily-to-decadal climate variability and weather extremes to be explored in greater detail. The 18th century saw the formation of several short-lived meteorological networks of which the one organised by the Societas Meteorologica Palatina is arguably the most well known. This network stood out as one of the few that efficiently managed to control its members, integrating, refining, and publishing measurements taken from numerous stations around Europe and beyond. Although much has been written about the network in both history, science, and individual prominent series used for climatological studies, the actual measurements have not yet been digitised and published in extenso. This paper represents an important step towards filling this perceived gap in research. Here, we provide an inventory listing the availability of observed variables for the 37 stations that belonged to the society's network and discuss their historical context. Most of these observations have been digitised, and a considerable fraction has been converted and formatted. In this paper, we focus on the temperature and pressure measurements, which have been corrected and homogenised. We then demonstrate their potential for climate research by analysing two cases of extreme weather. The recovered series will have wide applications and could contribute to a better understanding of the mechanisms behind climatic variations and extremes as well as the societal reactions to adverse weather. Even the shorter series could be ingested into reanalyses and improve the quality of large-scale reconstructions.
- Article
(2387 KB) - Full-text XML
-
Supplement
(35383 KB) - BibTeX
- EndNote


For some decades now, early instrumental observations have increasingly played an important role in climate research (see Jones, 2001, and Brönnimann et al., 2019). Not only have they shown enormous potential in reconstructing past changes in temperature, pressure, and precipitation, but they also allow for daily-to-decadal variability and extremes to be studied in great detail, particularly in 18th- and early 19th-century Europe (e.g. Brázdil et al., 2010; Camuffo et al., 2010; Csernus-Molnár et al., 2014; Pfister et al., 2019, 2020). The observations made by the extensive network of the Societas Meteorologica Palatina (henceforth referred to as SMP), or Palatine Meteorological Society, represent a major source for this research.
Although it enjoys relatively great fame among historical climatologists, the abundant weather information published by the society has yet to be understood in more depth. A lot of research has followed a historical approach, focusing on the origins of the society and its members as well as its contributions to the development of meteorology (Traumüller, 1885; Kington, 1974; Feldman, 1983; Cassidy, 1985; Wege and Winkler, 2004; Lüdecke, 2004, 2010; Vinther et al., 2006). Data from the society have been used for climatological analysis, although mostly making use of single stations (Przybylak et al., 2014; Raicich et al., 2015; Camuffo et al., 2017; Häderli et al., 2020) and rarely looking at more than a couple (Brázdil et al., 2010; Yiou et al., 2014). Aspaas and Hansen (2012) analysed occurrences of the aurora borealis recorded by the different stations as well as the phenological comments in the SMP's annual reports. In his book The Weather of the 1780s over Europe, Kington (1988) used the available station data from this decade – including several stations from the SMP – to create hand-drawn daily synoptic weather maps, showing that prevailing weather situations over Europe at the time (with regard to moving pressure systems) could be reconstructed and analysed. More recently, various data rescue projects, such as IMPROVE (Camuffo and Jones, 2002), HISTALP (Auer et al., 2007), the ANR project (CHEdaR, 2014), and CHIMES (Brugnara et al., 2020b), have incorporated larger portions of the data for reconstructing long high-quality series.
Despite these important efforts, work on SMP data has been scattered and only a small fraction of the overall measurements has been used in modern climate research; much of the data had yet to be digitised or published in extenso. There is more to be done with regard to unlocking the full potential of the data gathered by the SMP over 230 years ago. This study takes an important step toward filling this perceived gap in research by making many of the SMP’s observations available for future climate research. We provide an inventory of all meteorological observations made by the stations belonging to the network to assess data availability. Most of these measurements have been digitised and are published with this paper. We also add converted and corrected temperature and pressure measurements from all SMP stations, which are here assessed for their quality, to this new dataset. Finally, we explore the potential of the recovered series for climate research by analysing two historical cases of extreme weather.
Our work restates the importance of the society and its established role in the history of meteorology with regard to its methods of measuring and compiling weather observations. Following in the steps of previous data rescue projects, this project establishes a useful new historical climatological database, although it stands out from previous efforts due to the sheer quantity of digitised observations and processed series being published. These observations will be important for studying past climatic variations and weather variability; they will also hold value for the improvement of reanalysis products that extend to the pre-industrial period. In fact, one of the main added values of this database in comparison with existing products is its sub-daily resolution; as such, it could contribute to research on high-resolution reconstructions and lead to increased knowledge about historical weather.
To better explore the value of the database, this paper is organised as follows. In Sect. 2 we give some historical context to the society’s network and explore the contents of its yearly publications; we then provide a detailed explanation of the data rescue procedure and the corrections applied to the temperature and pressure observations, including methods of comparison to explore their potential. In Sect. 3 we present the findings from the analysis of SMP data for consistency and availability, results from quality tests of the temperature and pressure data, and results from the analysis of two case studies. Their implications are interpreted and discussed in Sect. 4, after which we make our concluding remarks.
2.1 The SMP network and the Ephemerides
The Enlightenment movement of the 18th century saw scientists make substantial contributions to the design of precise instruments of physics. More and more members of the scientific community were calling for the improved quantification and standardisation of weather observations as well as a more rigorous discipline in recording this information in a consistent manner that would allow for a cohesive characterisation of climate. The late 18th century witnessed a greater synthetic vision among meteorologists, marking a departure from the chaotic data gathering style that had characterised the preceding decades (Feldman, 1983). A number of short-lived national and international networks were zealously pursuing a more organised form of meteorology. In 1776, 2 years after publishing his influential Treaty on Meteorology, Père Louis Cotte began compiling data from several locations in France for the Société royale de médecine, based in Paris (Cotte, 1774). In Padua, the Director of the Astronomical Observatory, Giuseppe Toaldo, whose prize-winning work on the physical influence of weather on agriculture would spur the optimism of other networks (Toaldo, 1775), had been taking meteorological measurements since 1766. Additionally, Toaldo set up a network of precipitation measurements in Italy during the 1780s that functioned for nearly 30 years. Another meteorological programme was organised by the Oekonomische Gesellschaft Bern, which had distributed instruments to a number of stations in the then Republic of Bern (OeGB, 1762; Pfister, 1975). Other networks included the early Dutch meteorological society, Natuur- en Geneeskundige Correspondentie-Sociëteit (1779–1802), led by Jan Hendrik van Swinden, and the Spanish network, Real Academia de Médica Matritense (1780–1825), based in Madrid.
The SMP is commonly regarded as the most successful and prolific among these organisations, whose work, according to Theodore S. Feldman, “was not surpassed for three-quarters of a century” (Feldman, 1990, p. 154). Founded in 1780 by the Elector Palatine of Bavaria, Karl Theodor, and directed by his secretary, Johannes Jakob Hemmer, the SMP stood out as one of the few networks that efficiently managed to control its members, integrating, refining, and publishing measurements taken from numerous stations around Europe and beyond (Kington, 1974; Cassidy, 1985). Eventually, the society's increasing financial difficulties along with the political confusion and social turmoil caused by the French Revolution brought about the collapse of the society in 1795 – which had already been in decline after the death of Hemmer in 1790 – and brought a swift decline to meteorology; this slump would last until the start of continuous measurements by national networks in the 1830s. Nevertheless, what the SMP and its members achieved in the late 18th century in terms of coordination and discipline of observations meant that researchers today have a wealth of more detailed and organised information about the weather of the time.
In the period from 1781 to 1792, a total of 37 stations contributed to Hemmer's project (see Table 1). The stations covered a wide area of mainland Europe, stretching from Rome in the south, La Rochelle in the west, and reaching as far north-east as St. Petersburg and Moscow (Fig. 1). As such, the data of the SMP are well placed for an extensive study to be made of Europe’s climate variability and extreme events during that decade. Notably, there was a number of stations beyond mainland Europe that were also part of the SMP, which included Cambridge, Massachusetts in North America, Godthaab in Greenland, and Pyshminsk in Siberia.
Table 1List of stations that belonged to the SMP network, including information about height above sea level (estimations based on available information), latitude (φ), longitude (λ), and period for which data are available in the Ephemerides. This is loosely based on a list by Cassidy (1985, pp. 23–24), which does not specify the resolution of the observations.

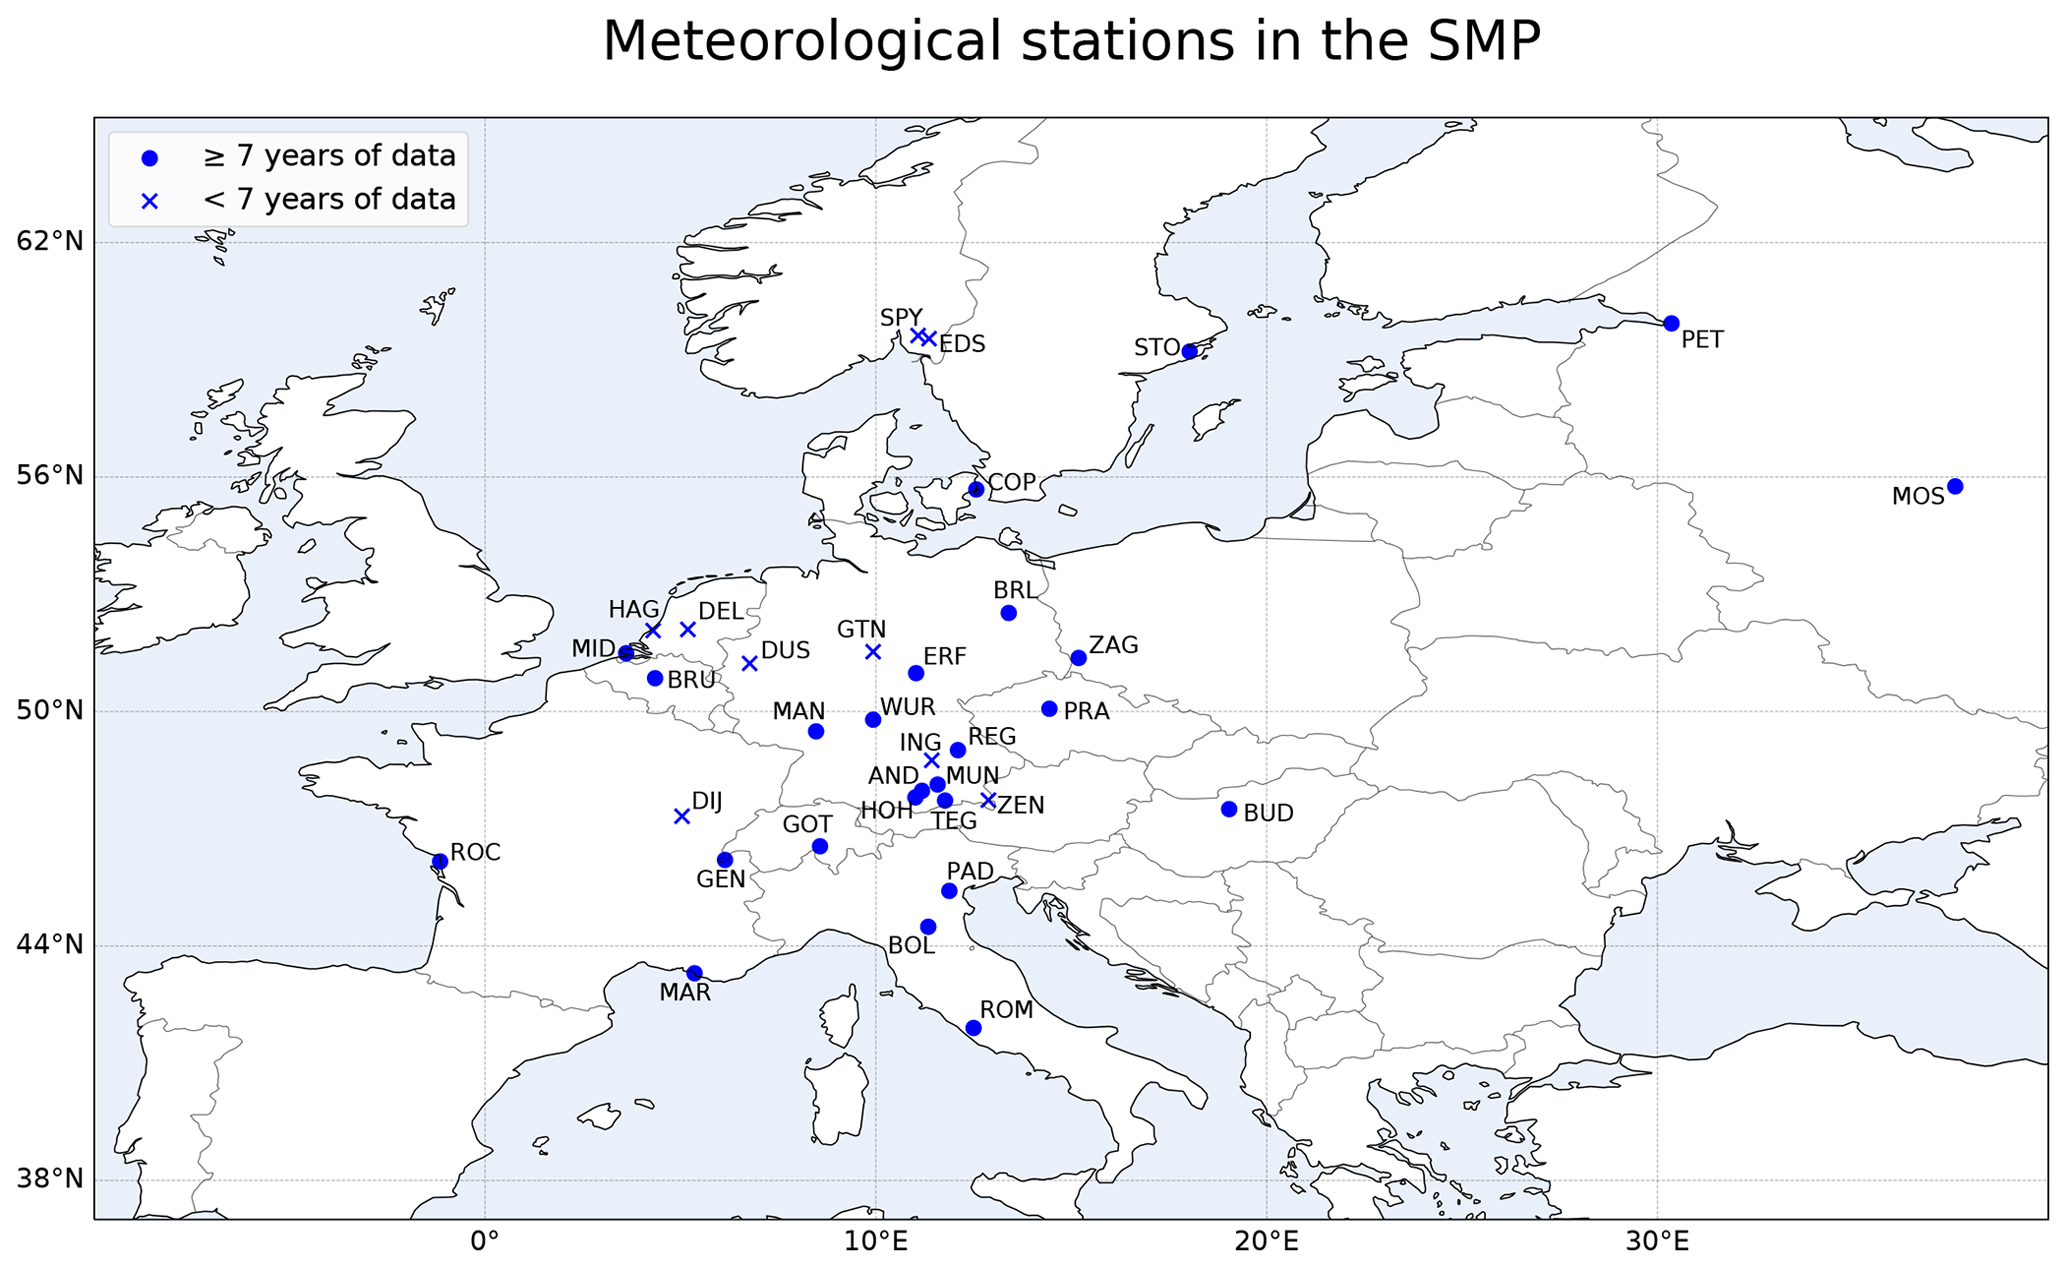
Figure 1Network of stations that contributed to the Ephemerides of the Societas Meteorologica Palatina – see Table 1 for abbreviations. Dots represent those stations that contributed for 7 or more years of the total 12-year period from 1781 to 1792; locations with a cross are stations that sent measurements for fewer than 7 years. This distinction is made to broadly convey the varying extent of the stations' participation. Not shown on the map are the stations at Cambridge (US), Godthaab (GL), and Pyshminsk (RU).
In 1780, working in Mannheim, Carlo Artaria began to manufacture the meteorological instruments that were to be distributed to the measuring sites of the network. These instruments were a mercury barometer, two mercury thermometers, a hygrometer, and for some selected sites, a magnetic declinometer (Grenon, 2010), all of which had been standardised, gauged, and calibrated to be almost identical, so that comparing measurements at a later time would be more straightforward. Other instruments, such as the pluviometer and wind vane, were to be constructed locally by the observers; these instruments did not require any calibration and only needed to be placed according to Hemmer’s instructions. The instruments are described in great detail in their first publication (Ephemerides, 1795, 1783, pp. 59–90). Using scientific Latin to overcome language differences, the SMP specified how to work with the instruments, where to place them, when to take the measurements, and in what style the observations should be written down. They were instructed to take measurements of pressure, temperature, precipitation, magnetic declination, wind direction and force, evaporation, height of rivers and lakes, clouds and state of the sky, three times a day, ideally at 07:00, 14:00, and 21:00 LT (local time), using common units and symbology. The data were then dispatched to the headquarters in Mannheim, where it was assembled and published in the annual Ephemerides Societatis Meteorologicae Palatinae. It is these yearly publications that form the basis for the data rescue project presented in this paper.
There are a total of 12 volumes published from 1783 to 1795, containing observations for the period from 1781 to 1792. The original volumes have already been scanned and can be found – among other places – online on the website of the library website of the Ludwig Maximilian University of Munich. The Ephemerides are structured in two parts; the main portion being the observationes integrae (extended observations), containing the sub-daily measurements and observations, and the appendix or observationes meteorologicae in compendium redactae (synopsis), which comprises the monthly means and other summary statistics. The publications for 1781 and 1792 only contain the extended observations. For 1787–1788, the format was temporarily changed to comprise a pars prior and a pars posterior containing a respective smaller sub-daily section and an extended appendix with both daily means and monthly summaries (see Sect. 3). In some volumes, there is an additamentum (addition) to include observations that had not made it to print for the previous publications.
Figure 2 shows an example of the typical arrangement of sub-daily data in the publications. The table is clear and straightforward: above the table, the station, the name of the observer, the observation times, and the month in question are given; for each day, the table itself contains measurements from the barometer (pressure), indoor thermometer (room temperature), outdoor thermometer (air shade temperature), hygrometer (humidity), declinometer (magnetic declination), wind vane (wind direction and force), rain gauge (rainfall), and an atmidometer (evaporation). Water level measurements of rivers and lakes were also taken where possible (in the example of Budapest in Fig. 2, for the river Danube). Additionally, the SMP adopted a common symbology to describe the phase of the moon, the state of the sky, and significant weather and special phenomena, including rain, hail, snow, frost, fog, and thunderstorms. An illustration of these symbols can be found in Kington (1988, p. 24).
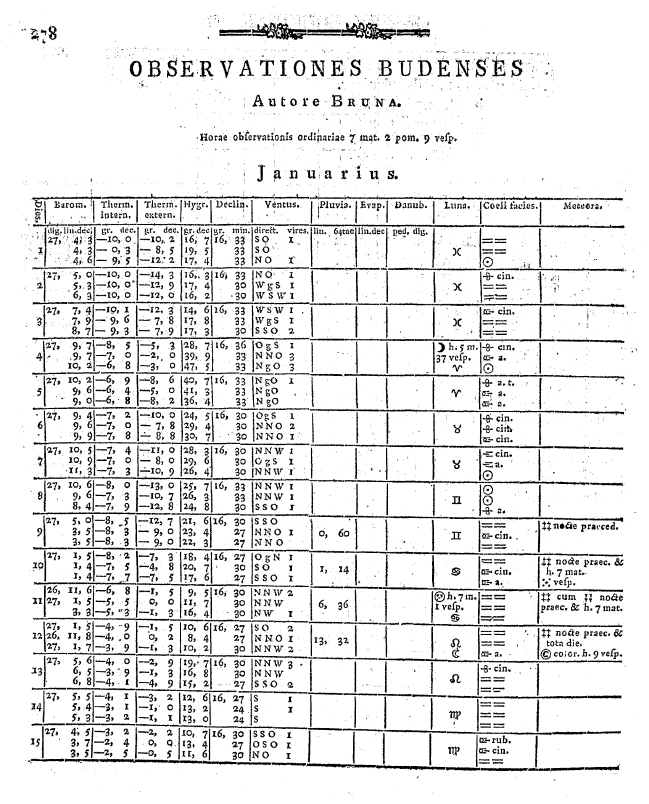
Figure 2Example of a typical table of sub-daily measurements for the period from 1 to 15 January 1789, in this case showing observations for Budapest, recorded by Ferenc Xavér Bruna (Ephemerides, 1795, 1791, p. 278).
The protocol and instructions set out by the SMP were mostly followed, although not without the odd departure. The Russian stations and Cambridge (US) initially used their old instruments and did not receive their Réaumur thermometers until years later; in fact, delivering the instruments intact to these remote locations represented an enormous logistical hurdle. That these stations used different instruments with different scales may at first seem to go against the idea of having a robust network of comparable standardised instruments, but variation was not prohibited. The perfection and improved construction of instruments was of the utmost importance to observers. Stationed in Marseille, Guillaume de Saint-Jacques de Silvabelle was keen to warn readers that the barometer initially sent to him by the SMP did not contain enough mercury, and as a result, 1782–1783 pressure measurements were three lines too high; this issue was fixed in 1784 (Ephemerides, 1795, 1785, p. 498). Thus, as long as the observers' own instruments were in very good accord with those of the SMP, they could be used. This practice is known to have been the case for Dijon and St. Petersburg, which also sent data measured with their own old devices (Euler, 1782; Maret, 1783).
Clearly, the scientific dedication and participation of like-minded people was crucial to the project. The observers had been carefully selected by the SMP from academies, monasteries, and universities across Europe to ensure that observations would be taken even after the death of initial observers (Cassidy, 1985). Indeed, it was Hemmer's decision to target organisations rather than individuals that contributed to the SMP's collaborative success. Despite the guaranteed continuity of the observations, the gathered measurements were still a product of the specific observer and, therefore, susceptible to heterogeneity.
2.2 The new SMP database
2.2.1 Inventory
The Ephemerides entailed a lot of patching work by Hemmer’s team in Mannheim, who were clearly interested in including as much information as was reasonably possible. They included a lot of information loosely related to meteorology but not limited to it, always serving the interest of economic and cultural betterment; these included reports about agriculture and medicine as well as occasional material concerning plant and human geography. Therefore, to enable a more systematic understanding of the weather information that these publications provide to historical climatologists, this study presents the meteorological observations in a way that is easier to visualise and analyse. We created a straightforward inventory focusing mainly on instrumental observations. The aim is to display the availability of observations for most parameters: we excluded descriptions of the state of sky and form of clouds as well as any astronomical, phenological, and demographic observations. Thus, it contains basic information about the availability of measurements for the 37 stations that participated in the SMP project.
For each station of the network and for each year of the 12-year periods, our inventory lists the years for which they reported measurements and which parameters were being measured (see Fig. 2); if data are available, the cell was marked with an “X”. The last four columns contain information about the resolution of the data (sub-daily, daily, or monthly), the observer or correspondent who took/oversaw the observations, any relevant comments, and the page range from the corresponding Ephemerides volume where the observations in the inventory can be found. In some cases, a variable will be available at a sub-daily resolution and as monthly summaries; here, the highest available resolution is reported. The main patterns revealed by the inventory with regard to data coverage and consistency are presented in Sect. 3.1. This inventory can be maintained as a living document and updated by future researchers who study the Ephemerides, it represents an important step in the systematic rescue and evaluation of the SMP's observations, and it can be found as a .csv file in the Supplement.
2.2.2 Data processing
In the context of this study, almost all variables from the 37 stations listed in the inventory were digitised by key entry on spreadsheets, including the observations about the state of the sky, and are available in the Supplement to this paper. Of these variables, temperature and pressure underwent conversions and corrections necessary for later scientific use. The choice to focus on these two variables is based on – besides their primary value in climate reconstruction – the advantage of being measured with carefully calibrated and standardised instruments, which ensures a more precise quantification and, thus, less effort to process. Converting and correcting the other digitised variables would require significantly more time, care, and effort. For instance, the SMP hygrometer that measured humidity had also been standardised and supplied free of charge, but it is unclear what the exact units being used are (although Camuffo et al., 2013, offers some suggestions to convert such arbitrary units); the rain gauges that quantified precipitation were designed locally and, hence, come in several different units, some of which are based on specific regional subdivisions of weight units. Conversely, we know that the thermometers and barometers provided by the Palatine Metrological Society for their network reflected the standard of the time and were already rather accurate (see e.g. the literature from the IMPROVE project – Camuffo and Jones, 2002). In fact, reliable international calibration standards were already in place by the time the society was established (Cavendish et al., 1777), meaning that the observations require few corrections beyond the ones described in this section. It should be noted that we did not analyse the specific surroundings of the sites of the observatories themselves, as has been done in some studies for Hohenpeissenberg (Wege and Winkler, 2004; Winkler, 2009) and Żagań (Przybylak et al., 2014), but we rely instead to a certain degree on the adherence of the stations to the recommendations given by the SMP on the positioning of the instruments.
The pressure readings were taken from a cistern barometer, filled with mercury, graduated in Paris inches and provided with a Vernier scale. The thermometers were of the mercury-in-glass type, in degrees Réaumur: one was to be mounted indoors, affixed to the barometer, to aid in the correction of the pressure readings, and the second was to be mounted outside, facing north, sheltered from direct sunshine, but allowing the free passage of air. The transformation of the digitised data from raw observations to scientifically usable values begins with the unit conversion; for temperature observations the conversion from Réaumur to Celsius is straightforward:
At times, the SMP's Russian stations used thermometers in the Delisle scale, and the station in Cambridge (US) initially sent observations taken with a Fahrenheit thermometer. For these units, the conversion to Celsius is done as follows:
In a second step, temperature values were corrected for a positive freezing-point bias due to the tendency of the freezing point of thermometers to gradually rise (Winkler, 2009). One postulated explanation for this phenomenon was the rapid cooling of the glass walls of the thermometer after the manufacturing process; this would cause a realignment of the glass molecules over several years as the glass was being slowly compressed by external air pressure (Bellani, 1808; Yelin, 1824). The rise of the 0 ∘C point can be corrected easily by assuming that the correction used in Winkler (2009) can be applied to all stations; that is, a stepwise −0.1 ∘C yr−1 extended over the first 6 years of observations. This correction was applied to all series with the exception of Cambridge (US), Dijon, Middelburg, Moscow, Stockholm, and St. Petersburg, which are known to have used instruments of their own, as well as the few stations that began sending data after 1785. Another known problem of the SMP thermometer is that it was only graduated until −16 ∘Ré, meaning that when the mercury dipped below this mark, the observers estimated the value by visual extrapolation, which makes lower temperatures less accurate. The correction of any larger, non-linear errors is mainly related to the exposure of the thermometer; these strongly depend on each station's specific configuration and are beyond the scope of this paper.
For pressure measured with a mercury barometer, the full conversion requires more steps. The first is a temperature correction to take the thermal expansion of the mercury into account:
where γ is the thermal expansion coefficient of mercury at 0 ∘C ( K−1), T is the temperature of the barometer (or room temperature) in degrees Celsius, and Lmm is the original observation in millimetres – for Paris inches the conversion factor is 27.07 mm. It should be noted that some observers at the time would reduce their observations to other temperatures, with 10 ∘Ré being a common standard (Brugnara et al., 2015); this is assumed to be the case for pressure values sent to Mannheim by the Russian stations. For the daily means presented in the appendices of each Ephemerides volume, no barometer temperatures are given. Differences with the corrected pressure series of neighbouring stations show a seasonal cycle – one that reflects the cycle of the (room) temperature of the barometer – indicating that these averages in the appendices were likely not reduced to 0 ∘C. Thus, in order to get a good estimate of the room temperature climatology corresponding to the daily mean pressure in the tables, these values were extrapolated from the outdoor temperature for each station using a linear regression based on the strong linear relationship between indoor and outdoor temperature in the available sub-daily observations of other years.
The next step is a unit conversion of the mercury column from millimetres to hectopascals (hPa) and the application of a gravity correction that takes the latitudinal and height-dependent variation of gravity acceleration into account:
where P0 is the absolute pressure (in hPa), ρ is the density of mercury at 0 ∘C (1.35951×10⁴ kg m−3), gφ,h is the local gravity acceleration (estimated from latitude φ and altitude h; see Brugnara et al., 2015), and L0 is the temperature-corrected barometric reading (in mm) calculated in Eq. (4). Finally, a reduction of the measurements to mean sea level is performed for use in the synoptic analysis:
where R is the gas constant for dry air, a is the standard lapse rate of the fictitious air column below the station, and Text is the outside temperature of the station in question.
Following the unit conversion, we performed quality control tests to detect any errors present in the series. Many outliers are typically due to mistypes that occurred during the digitisation, although several could be due to transcription errors made by the original observer, or even during the printing process. When possible and deemed reasonable, after careful inspection of the original source, the values were corrected, otherwise they were flagged as suspicious. To aid in their detection, the Copernicus Climate Change Service (C3S) Quality Control (QC) software provides R functions that identify climatic outliers (values outside the interquartile range), occurrences of equal consecutive values, and records where the observations exceed the tolerances suggested for temperature and pressure time consistencies from the World Meteorological Organization (WMO), among other quality tests (Brugnara et al., 2020a). Visual plots were also used to inspect the data as an alternative test for erroneous values.
Homogenisation is a final step typically performed to identify and remove systematic biases – i.e. non-climatic influences – that may have arisen in the climate time series. This can be due to a change in the local environment, the instrument, the observer, or perhaps even a change in observational procedures. Thus, temperature and pressure series of 7 years and longer were tested for homogeneity visually by applying the Craddock test (Craddock, 1979). This involves testing each series against other series based on their monthly cumulative differences according to the following equation:
where c(t0) is equal to zero, the candidate series to be tested is xc(t1…tn), and the reference series is xr(t1…tn). If either series is inhomogeneous – i.e. their mean has a sudden change – c will exhibit a sharp change in slope. It is useful to plot c several times against multiple well-correlated reference series in order to better detect the inhomogeneity (or break point) and to avoid making bad corrections (see Fessehaye et al., 2019). According to Venema et al. (2012), the Craddock test allows for good accuracy compared with other break point detection tests, although the manual effort involved is higher, meaning that it is better suited to smaller datasets such as the one in this study. Furthermore, there is some subjectivity in the selection of break points: the choice to homogenise or not is linked to the specific approach of the researcher (Brunetti et al., 2006).
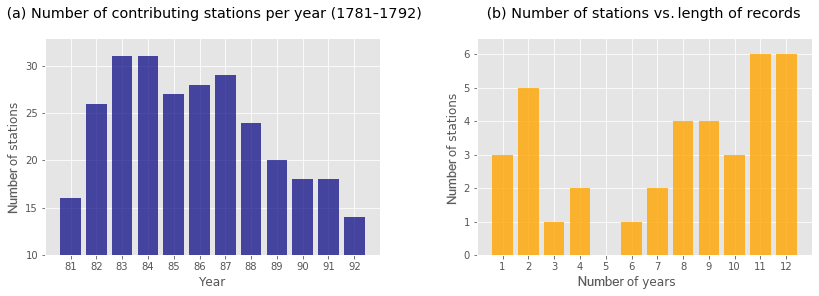
Figure 3Bar charts showing (a) the number of stations for each year in the period from 1781 to 1792 and (b) the number of stations based on the length of available records.
Series with inhomogeneities were adjusted using a constant correction. These corrections were computed by calculating the mean difference between the candidate series and the reference series before and after the break point. For instance, if the difference of a given pressure series with respect to the reference is on average 3 hPa before the break point and 7 hPa after, the correction is to be 4 hPa. The more reference series that are available to calculate this mean difference, the more accurate the estimated correction will be. Where possible, corrections were applied at the sub-daily level, and QC tests were performed again to ensure no further errors were being introduced. The results from the homogeneity tests as well as those from the quality control are presented in Sect. 3.2.
The corrected temperature and pressure series in our database are not only presented in their original resolution: daily mean values were computed from the sub-dailies and concatenated to daily means published by the SMP. For temperature, the calculation of daily means from sub-daily measurements was weighted considering the known observation times to represent the true means with respect to the Coordinated Universal Time (UTC) day. The SMP daily means of 1787–1788 were also adjusted using the known observation times from the closest year for which these are available. This adjustment was done using monthly mean diurnal cycles of 2 m temperature at the nearest grid point in the ERA5-Land reanalysis (Muñoz-Sabater, 2019; Hersbach et al., 2020), calculated over the period from 2001 to 2018. The choice of the type and length of the reference diurnal cycle can have different effects on the adjustment of daily means. Thus, for comparative purposes, a corrected version of the Żagań temperature series from Przybylak et al. (2014) is available in the Supplement, which used hourly temperature data from Wrocław for the period from 1999 to 2003. The conversion from local time to UTC was done assuming mean solar local time (i.e. the UTC offset is linearly proportional to longitude). We discard the seasonal fluctuations related to the apparent local solar time (as measured by a sundial), as these have a negligible effect on the daily means (see Camuffo et al., 2021). For pressure, the average of the available observations for a given day was calculated, with no correction for the diurnal cycle. Values that were flagged by the QC tests are ignored in the computation.
From the daily series, monthly averages were calculated and concatenated to the monthly data in the Ephemerides. Months with more than 5 missing days were excluded. The monthly “means” in the Ephemerides are arithmetic means of all sub-daily measurements until around 1784, after which mid-range values between maxima and minima were used. It would seem that editors in Mannheim could not keep up with the vast quantity of observations. Thus, published monthly data after 1784 were not included in the final monthly series.
All the data are stored in the so-called “Station Exchange Format” (SEF), a novel output for the transcription of climate data and metadata developed by the Copernicus Climate Change Service (C3S) (Brönnimann et al., 2018). SEF files have a .tsv (tab-separated values) extension and follow a straightforward structure, listing basic metadata regarding the station and the series in a header. Each line of the data table represents one observation time for which the following information is specified: year, month, day, hour, minute, period (time period of observations), value, and meta. This last column contains any metadata that are of interest to the specific value, including flags that specify if the value has failed any QC test. The common format is designed to allow people rescuing instrumental measurements to present them for widespread use in an uncomplicated format that is recognisable by software. The final aim is for such SEF files to be easily ingested into global repositories (Brunet et al., 2020). The historical series presented in this study will be eventually ingested into the Global Land and Marine Observations Database (GLAMOD).
2.2.3 Exploring potential
Following the analysis of data availability and quality, we explored the potential of the corrected SMP temperature and pressure series with respect to two historical cases of extreme weather – namely, two devastating storms around the new year 1783–1784 and the anomalously cold March of 1785. The SMP data were used in combination with additional synoptic information from existing studies of pre-industrial weather and climate. We used the CAP7 weather type reconstructions by Schwander et al. (2017), which extend the MeteoSwiss CAP9 classifications back to the year 1763 (Weusthoff, 2011), a catalogue of recurrent dynamical weather patterns over central Europe (overall seven types) that can provide important information on the state of the atmosphere during these years. Additionally, we used John Kington's hand-drawn synoptic maps (Kington, 1988), a unique source that allow insight into the daily progression and distribution of surface pressure features over Europe during these extreme events. Monthly reanalyses such as the EKF400v2 (Franke et al., 2017; Valler et al., 2021) can also contextualise anomalies on broader timescales than those of the SMP observations, which on average only cover the best part of a decade. Finally, documentary sources are a vital archive of weather information that provide important environmental and socio-economic dimensions to natural disasters (Pfister et al., 2002). Taking all these materials together, these case studies serve to demonstrate the value of the SMP data for weather and climate reconstruction.
3.1 Data coverage
The inventory reveals important information regarding the availability of meteorological observations in the Ephemerides. The coverage and consistency of the SMP observations are more variegated than initially meets the eye; some of these aspects are summarised in Fig. 3. Station participation in the network fluctuated significantly over the years (Fig. 3a). The years with most participants are 1783 and 1784, which is fortunate for climate research as these years coincide with the Laki eruptions in Iceland, whereas the final years are those with the fewest participating stations. Indeed, 1788 marks the last year when a number of stations sent data to the society, including dedicated stations that had provided observations for many years up until then, such as Berlin, Copenhagen, Erfurt, Middelburg, and Würzburg (see Table 1). A year later in 1789, Geneva and Tegernsee also stopped sending data. The last Ephemerides volume, for 1792, appeared in 1795, and it contained data recorded at 14 persevering stations. Overall, more than half of the 37 stations in the network sent data to Mannheim for longer than 7 years; 12 of these, mostly stationed in central Europe, had their data published in almost every Ephemerides issue. A total of 11 stations provided observations for 4 years or less (Fig. 3b).
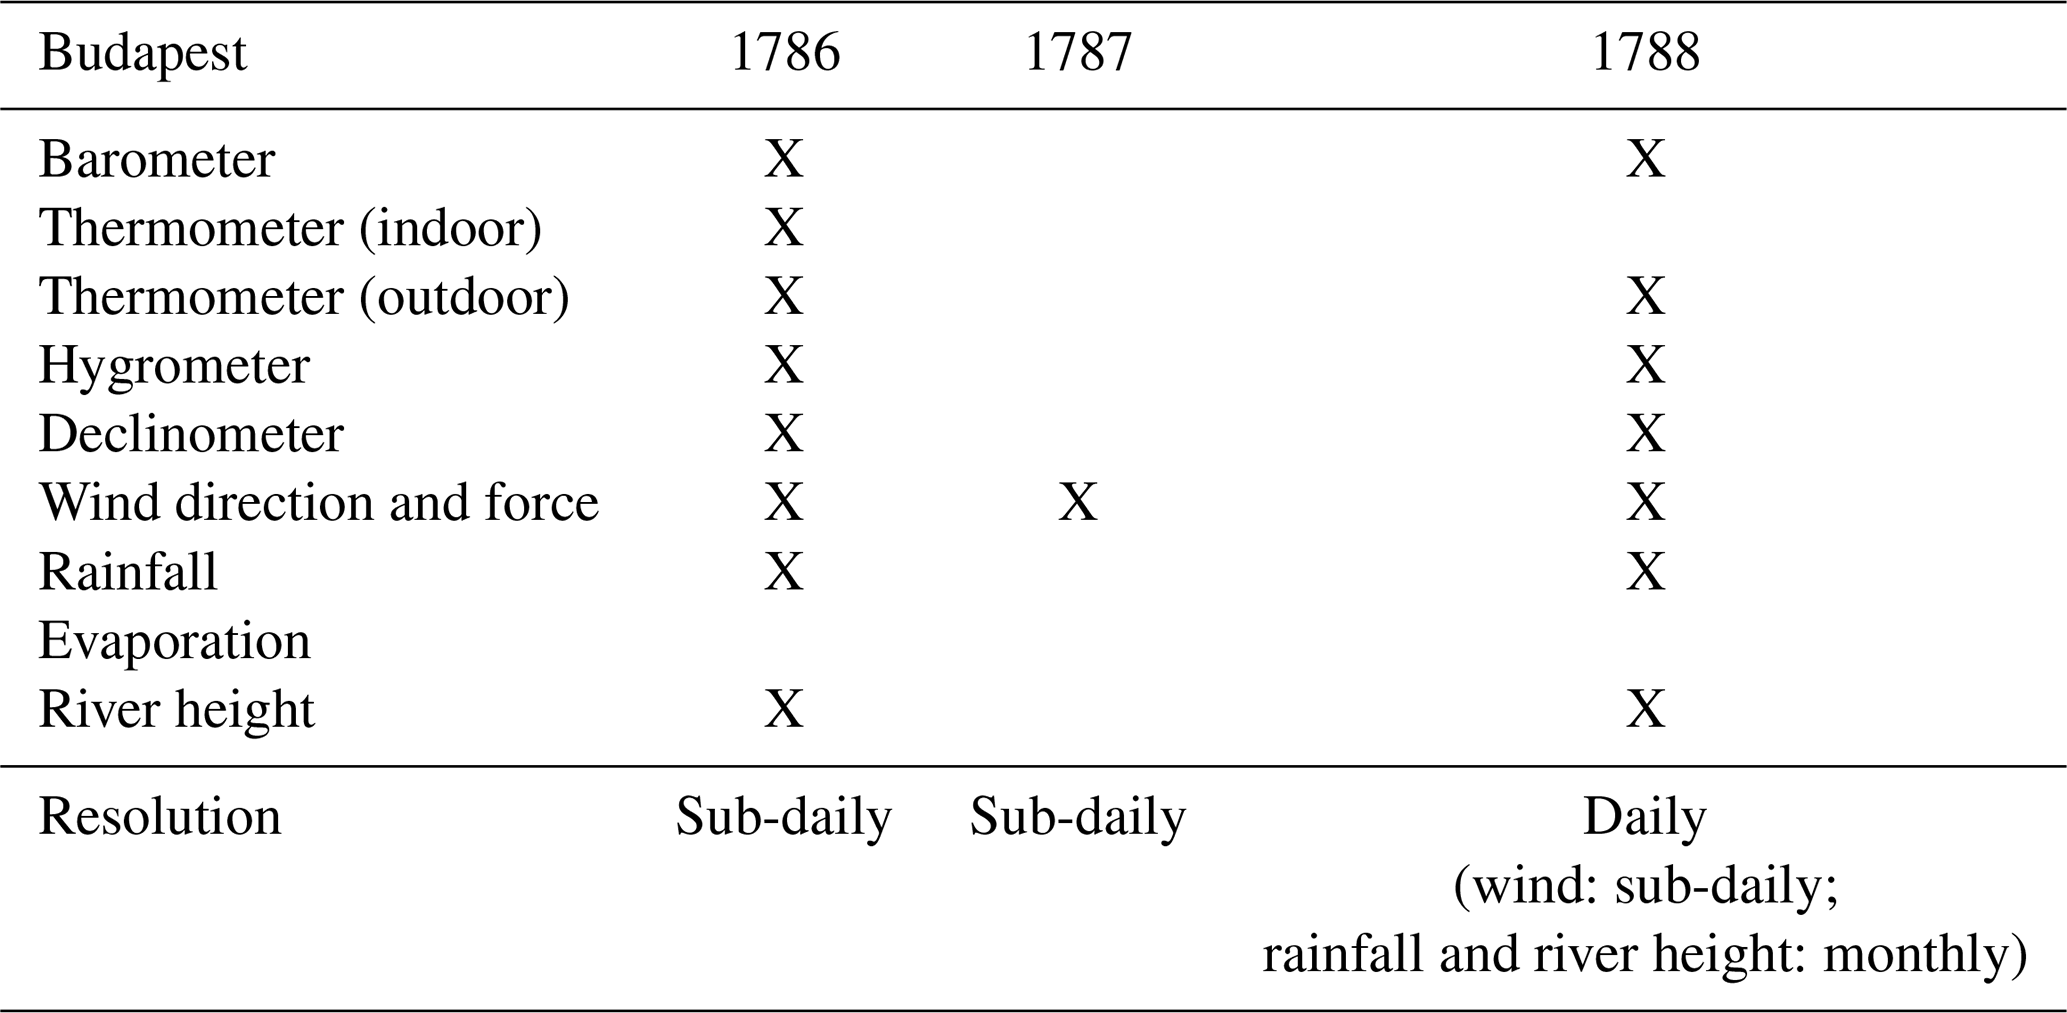
Lists such as the one in Table 1 or the one provided in Cassidy's article (Cassidy, 1985) give a rough idea of which location participated in which year; however, they do not distinguish between the type, resolution, or quantity of data recorded for each location. A station that contributed only sub-daily wind force observations in a specific year but submitted sub-daily measurements for every parameter in another year has a different value to a researcher. While the station did participate in both years, the weight of the contribution is different. Table 2 shows an extract from the inventory to illustrate this point.
Table 2Extract from the inventory for the station in Budapest for the years 1786–1788, showing how distinguishing between available parameter observations is both useful and informative.
Although there is a clear overarching framework that guided the collection of observations for the SMP, there are a number of lacunae and inconsistencies. Sometimes measurements were not taken as instructed by the SMP. For example, in the case of Żagań, measurements were not taken at regular intervals. In the case of St. Petersburg, temperature and pressure were even observed at different times. Furthermore, not all observers used the instruments provided by the society; for instance, the station in Cambridge, Massachusetts, used a Fahrenheit thermometer until 1784. In fact, the Russian stations seemed to follow a protocol of their own: Moscow and St. Petersburg only provided pressure (likely already reduced to a standard temperature), outdoor temperature, and wind observations. Moreover, there is clear evidence that they switched instruments throughout the 12-year period. Moscow used a Delisle scale thermometer until 1787, then began reporting in Réaumur units; it also used a barometer in English inches and eventually started reporting observations in Paris inches, although it is unclear whether a SMP barometer was used. St. Petersburg switched back and forth between Réaumur and Delisle thermometers. All these cases show why inconsistencies could arise.
As the inventory shows, it is also often the case that observations are only available for portions of the year or that measurements of some parameters are interrupted or missing. In some cases, measurements are printed in the next edition of the Ephemerides as an additamentum, most likely due to the data not arriving in Mannheim in time to be organised, collated, and printed. For instance, Stockholm's sub-daily tables from 1788 to 1791 are published together in the additamentum of the Ephemerides published in 1793 (covering 1791 data).
One particular pattern that emerges in the inventory is a “thinning out” of measurements available for 1787 and 1788. The data received from each location for these 2 years was not printed in extenso, as they had been in the other Ephemerides. Wind direction and force observations are sub-daily, but the rest of the data appear in the appendices as daily or monthly means – one need only glance at Mannheim or Rome in the inventory to see this. Figure 4 illustrates this pattern very clearly. After these diluted editions in the late 1780s, the old extensive publication style resumes until the last volume, containing data for 1792, although by this time the size of the network is notably smaller.
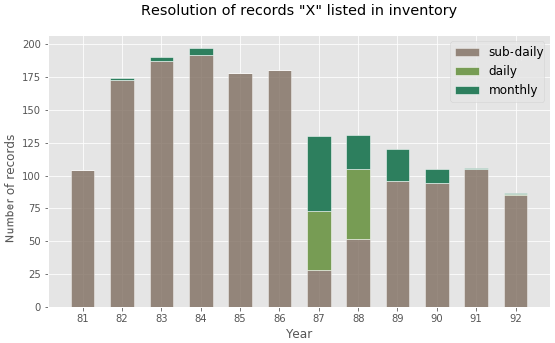
Figure 4Bar chart showing the resolution for each data series marked by an “X” in the inventory. The different formatting of the years 1787 and 1788 meant many records were printed as daily means and monthly summaries instead of the usual sub-daily tables.
3.2 Data quality
The most common type of error reported for sub-daily values by the QC software was the wmo_time_consistency, which flags observations that exceed the WMO-suggested tolerances for the temperature and pressure tendency as a function of time. The Munich sub-daily temperature series, covering 1781–1786, 1788, and 1790–1792, had as many as 82 of its observations flagged with this error, most of them in the last 3 years of observation. This hints at the possibility that the thermometer was partially exposed to sunlight for some periods at a time and did not actually measure air shade temperature. This led to several afternoon observations being overestimated, thereby creating unrealistic jumps in the measured temperature diurnal cycle.
On the whole, however, the wmo_time_consistency flags in a given series are relatively few. Some of these errors may have been due to misprints in the publications, or they were probably misread by compilers in Mannheim. Figure 5 illustrates this example with Żagań pressure readings. The highlighted barometer lines are erroneous and not in line with the expected pressure tendency for a 6 or 7.5 h time interval. One could hypothesise that the first value “0.2” was meant as “10.2”, but the real measured value cannot be known and so should ideally be left as a flagged value. That said, the correction of a suspected printing error is at the discretion of the researcher and, whenever applied, a note should be made in the digitised table.
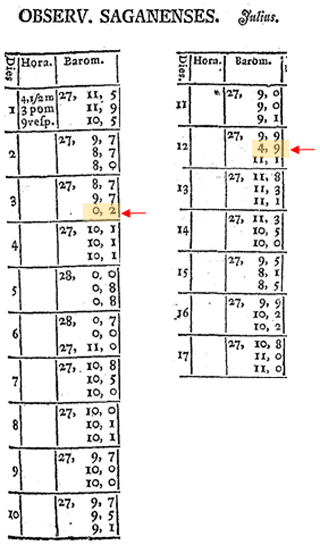
Figure 5Barometer readings at Żagań for 1–17 July 1781 (Ephemerides, 1795, 1783, pp. 373–374). The columns represent the days, observations times, and Paris inches and lines. The highlighted values are likely printing errors and are flagged in the SEF file as wmo_time_consistency errors.
A number of winter values in the temperature series were flagged as subdaily_out_of_range for exceeding the default threshold (−30 ∘C) of the QC function. These were mostly ignored as they seemed reasonable given the internal variability of temperature during the 1780s. Indeed, for extreme meteorological conditions, it could be that values are flagged as suspect, although they are correct (WMO, 1993).
A closer look at the Brussels temperature series revealed suspicious values in December 1788. It would seem that daily hygrometer observations for this month were mistakenly copied into the temperature column (Ephemerides, 1795, 1790, pars posterior, pp. 38–39). The error became apparent when comparing temperature values with those of Middelburg, located just over 100 km from Brussels. The QC software did not recognise this inconsistency due to the hygrometer measurements resembling a plausible range of temperature values.
On the lower end of the quality “spectrum” of the recovered series is the Moscow pressure series (Fig. 6). The availability of data is patchy to begin with: observations started being taken in 1783 until 1792, except for 1790; 1783–1784 and 1787 are available in the form of monthly summaries; and the rest are in sub-daily form. About 13 % of the total available sub-daily values were flagged as subdaily_repetitions, i.e. occurrences of equal consecutive values. This hints at the poor quality of the barometer that was being used. For the Moscow station, 1785 marks both a change in observer, from Heinrich Gottlieb Engel to Johann Gotthilf Stritter, and a change from noting observations in English to Paris inches. It is unclear whether there was a change in instrument: it may not have been a SMP barometer, as lines were still being reported in instead of ; alternatively, it could be that readings from the old English barometer were simply being converted to Paris inches in the editing process. Furthermore, as can be seen in the time series, the pressure series likely needs to be homogenised, a task which could not be carried out, given the paucity of nearby reference series.

Figure 6Station pressure series of Moscow for the period from 1783 to 1792. Shown are sub-daily values in hectopascals (blue) and shade areas that represent the availability of monthly data (yellow) or no available data (grey).
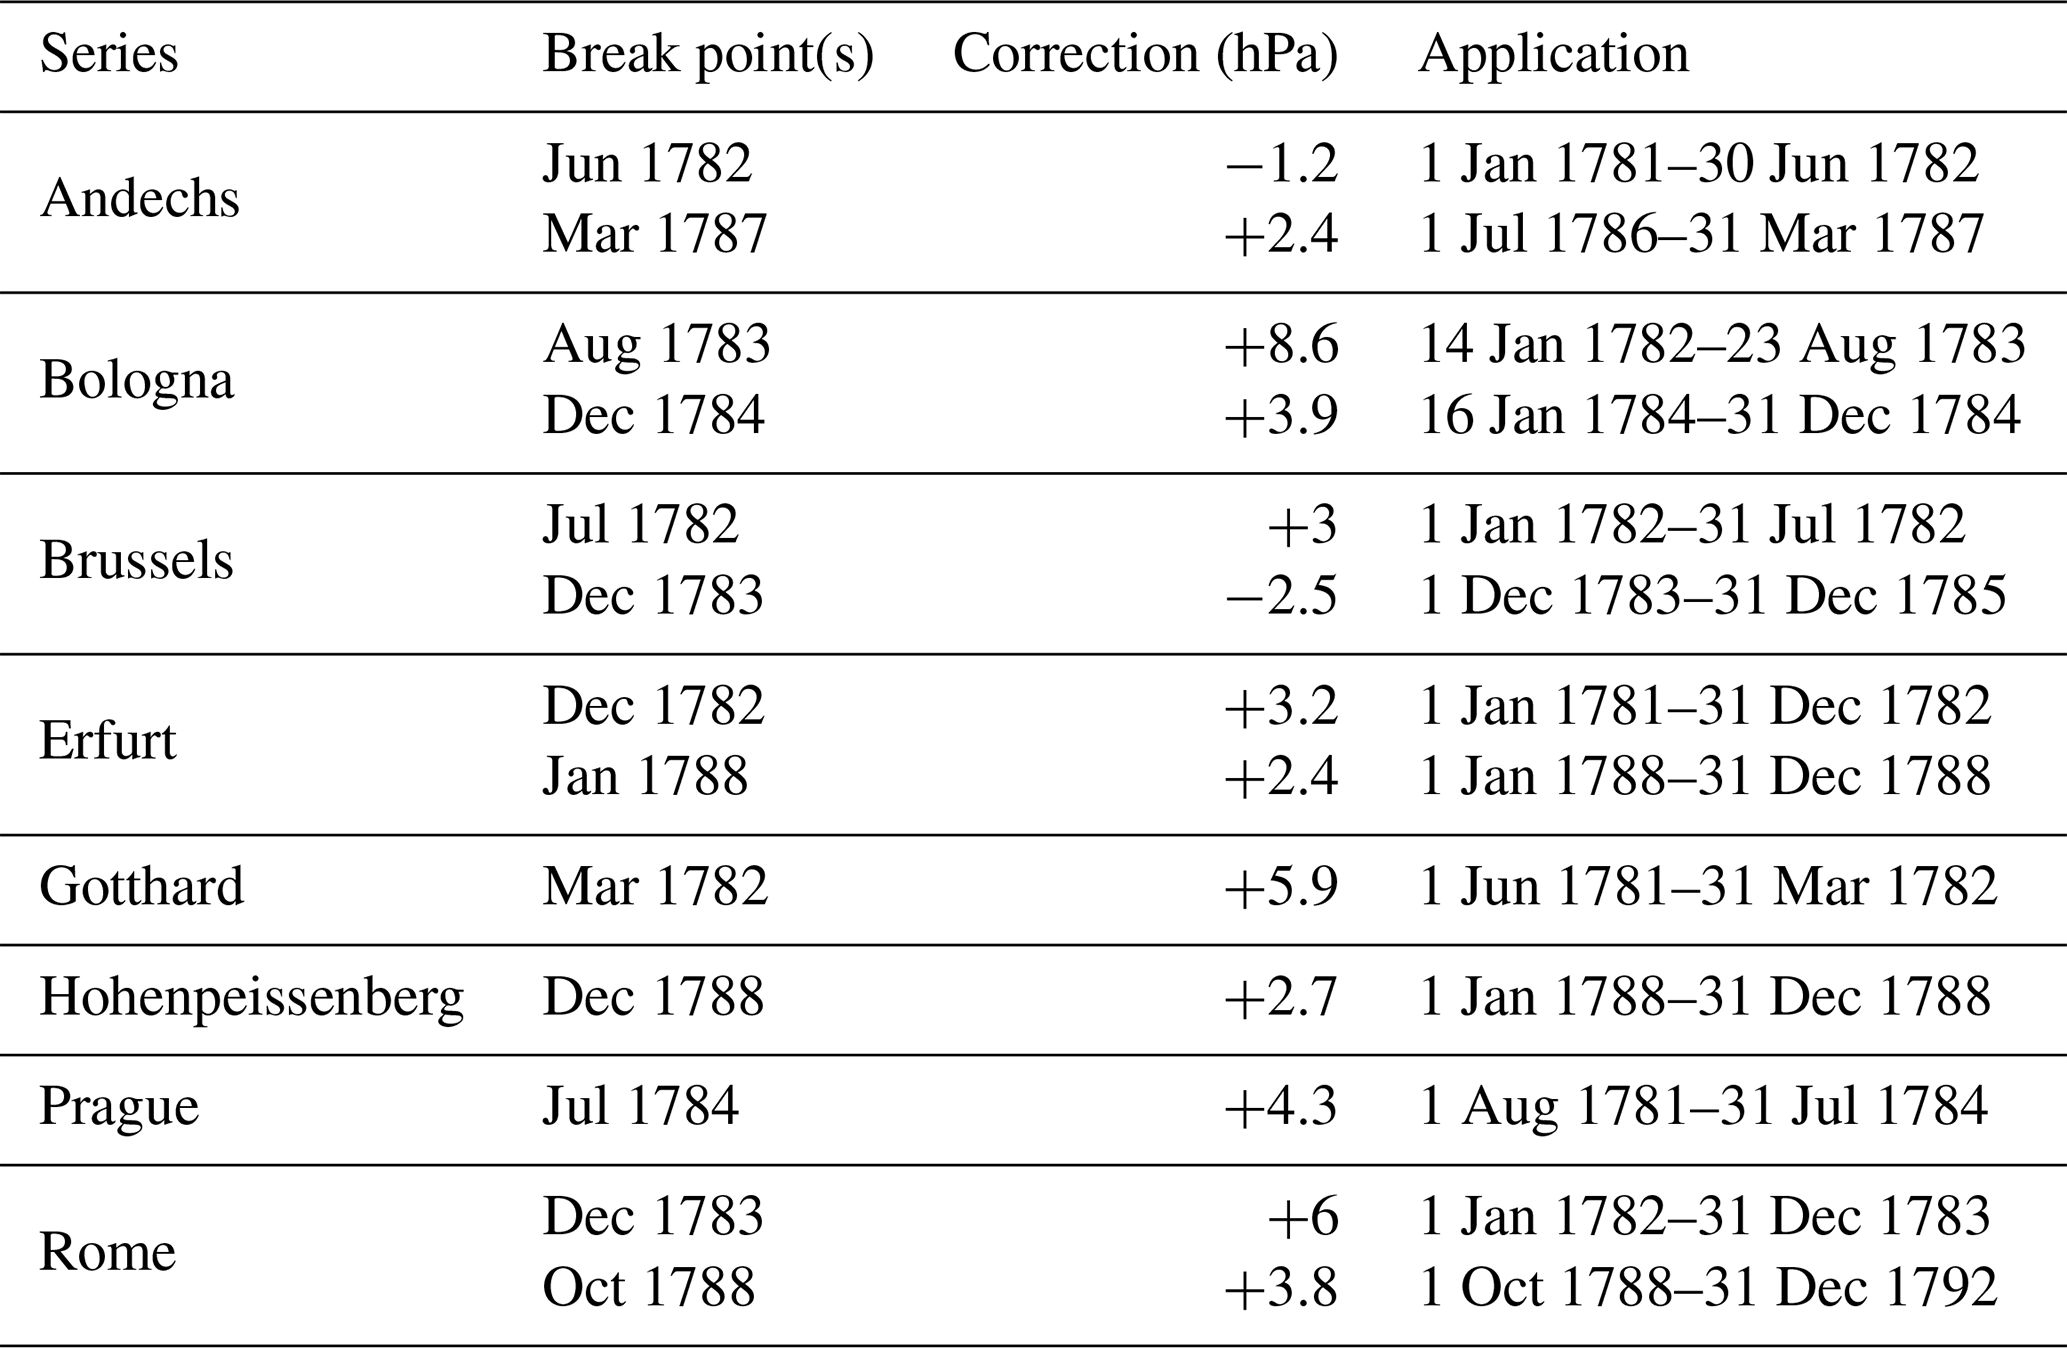
Overall, the correlations in the Craddock test showed good agreement for both variables between stations in central Europe, meaning that for most candidate series there was a sufficient number of reference series. The SMP temperature series did not manifest any significant break points, although the Craddock test allowed for the detection of other systematic quality problems: series such as Rome and Regensburg showed evidence of an annual cycle in the test, indicating that the thermometers may have been measuring indoor or at least in conditions of poor exposure; additionally, the Andechs series seems to overestimate temperature after spring 1791. A number of break points were detected in the pressure series, although, as a criteria, only those with a mean difference between before and after the break point(s) greater than 1 hPa were adjusted. Constant corrections were applied to the following SMP pressure series: Andechs, Bologna, Brussels, Erfurt, Gotthard, Hohenpeissenberg, Prague, and Rome (see Table 3).
Table 3Station pressure series for which break points were detected, showing the location in the series where the break point is, the extent of the correction, and where in the series this was applied.
3.3 Case studies
3.3.1 Storms during the winter 1783–1784
Around 24–26 December and the first days of January 1784 two violent storms hit Europe from the northwest (see Lamb, 2005, pp. 87–88). While the greatest impacts from the storms – in terms of destructive winds – occurred in the British Isles, the severe flooding that ensued in parts of mainland Europe during this season have been well documented (Demarée, 2006; Brázdil et al., 2010). There was considerable material damage in wide regions north of the Alps that exacerbated the already harsh socio-economic conditions caused by the severe winter.
The storms occurred following a long spell of extreme weather. Europe had been experiencing bitter cold temperatures, the result of persistent high-pressure systems (type 5) that had lingered over central Europe from 26 November to 16 December, which were then followed by successive northerly and easterly winds (types 1, 4, and 6). All of this was acting to prevent milder temperatures from the Atlantic Ocean moving eastwards over the continent. With the storm around Christmas and again in the first days of the new year came an upswing in temperatures: the daily mean temperature in Brussels, for instance, changed from −12.5 ∘C on 31 December to 4.6 and 2.1 ∘C in the following 2 days. With these milder temperatures came heavy rainfall and snowmelt, which caused the first floods. This was the case for the Dijle and Demer catchments of the Scheldt Basin in Belgium. The Gete River also flooded at Orp-le-Grand on 2 January and at Tienen on 4 January 1784 (Demarée, 2006). In Mannheim, Hemmer noted how the rivers “swelled greatly”, the thick ice that had constrained the Neckar tributary of the Rhine rose and broke, and the river flooded at Feudenheim around 18:00 LT, inundating the bridge and breaking parts of it off, which flowed all the way downtown towards the station (Ephemerides, 1795, 1786, p. 53).
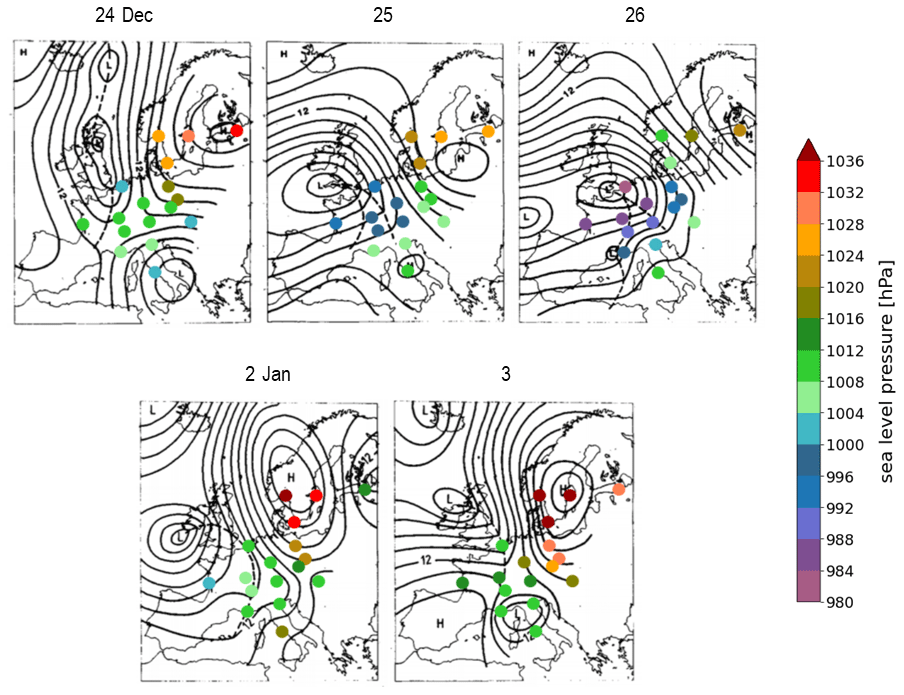
Figure 7Kington's hand-drawn synoptic maps showing the storms as they moved over Europe covering the days from 23 to 26 December 1783 and from 2 to 3 January 1784. Isobars are drawn at 4 hPa intervals, and “12” denotes the 1012 hPa isobar; dashed lines indicate fronts. Coloured points represent SMP pressure observations in hectopascals reduced to sea level from 17 selected stations. The figure is adapted from Kington (1988, pp. 99–100) and reproduced with permission from Cambridge University Press through PLSclear.
Not surprisingly, the SMP data fit very well with Kington's daily sea level pressure (SLP) fields. Figure 7 shows SMP pressure data reduced to sea level (using Eq. 6) plotted onto Kington's maps. By 24 December, a depression had arrived from the northwest and soon developed an intense centre that had moved over the English Channel within days. As the low expanded, all sites recorded a drop in pressure, with Middelburg and Mannheim at 984 and 986.2 hPa respectively. On 2–3 January, another frontal system arrived in from the Atlantic, pushing against a large high-pressure system centred over Scandinavia, creating a strong pressure gradient over the North Sea that blew gusts of Arctic air over Denmark, Germany, and the Low Countries. According to SMP measurements, the tight gradient ranged from 1000.2 hPa in La Rochelle to 1037.2 hPa in Spydeberg on 2 January.
3.3.2 The coldest March: 1785
In central Europe, March 1785 may well have been the coldest March in over 300 years. According to the EKF400v2 reanalysis (Franke et al., 2017; Valler et al., 2021), this was the coldest March since 1701 for the regions surrounding Mannheim and Padua, the second coldest for the region in and around Żagań, and it remains in the top 10 coldest for Budapest. Table 4 shows the extent of these anomalies: for Żagań, March 1785 was over 6 ∘C colder than the average during the period of the SMP's activity, and it was around 5 ∘C colder for both Mannheim and Padua. There is reasonable agreement between the SMP monthly temperature anomalies and those of the EKF400v2, with a difference <0.7 ∘C for all stations, except for Budapest where the anomaly is 2 ∘C colder for the observations than in the reanalysis. These differences are partly due to the spatially coarser resolution of the reanalysis compared with the local measurements of the SMP station data.
In Switzerland, Lake Lucerne had frozen over in Lucerne Bay as had Lake Geneva at the Geneva end (Pfister, 1999, p. 121). The SMP observer stationed in Geneva, Jean Senebier, had been observing sub-zero temperatures for days and described how the lake had frozen over by the mouth of the Rhône by 2 March (Ephemerides, 1795, 1787, p. 215). The future second president of the USA, John Adams, working as first Minister to the Netherlands and living near Paris at the time, wrote about his conversation with a local abbot, recording “that neither he nor his brother, (and they are both turned of seventy) remember ever to have experienced so cold weather in the beginning of March” (Adams, 1785/1981).
Table 4Monthly anomalies for March 1785 at four stations in central Europe: Mannheim, Padua, Budapest, and Żagań. The first column is calculated with respect to monthly climatologies from the SMP instrumental measurements, whereas the other three columns are calculated with respect to the climatologies of the EKF400v2 reanalysis grid boxes closest to the location of the four stations.
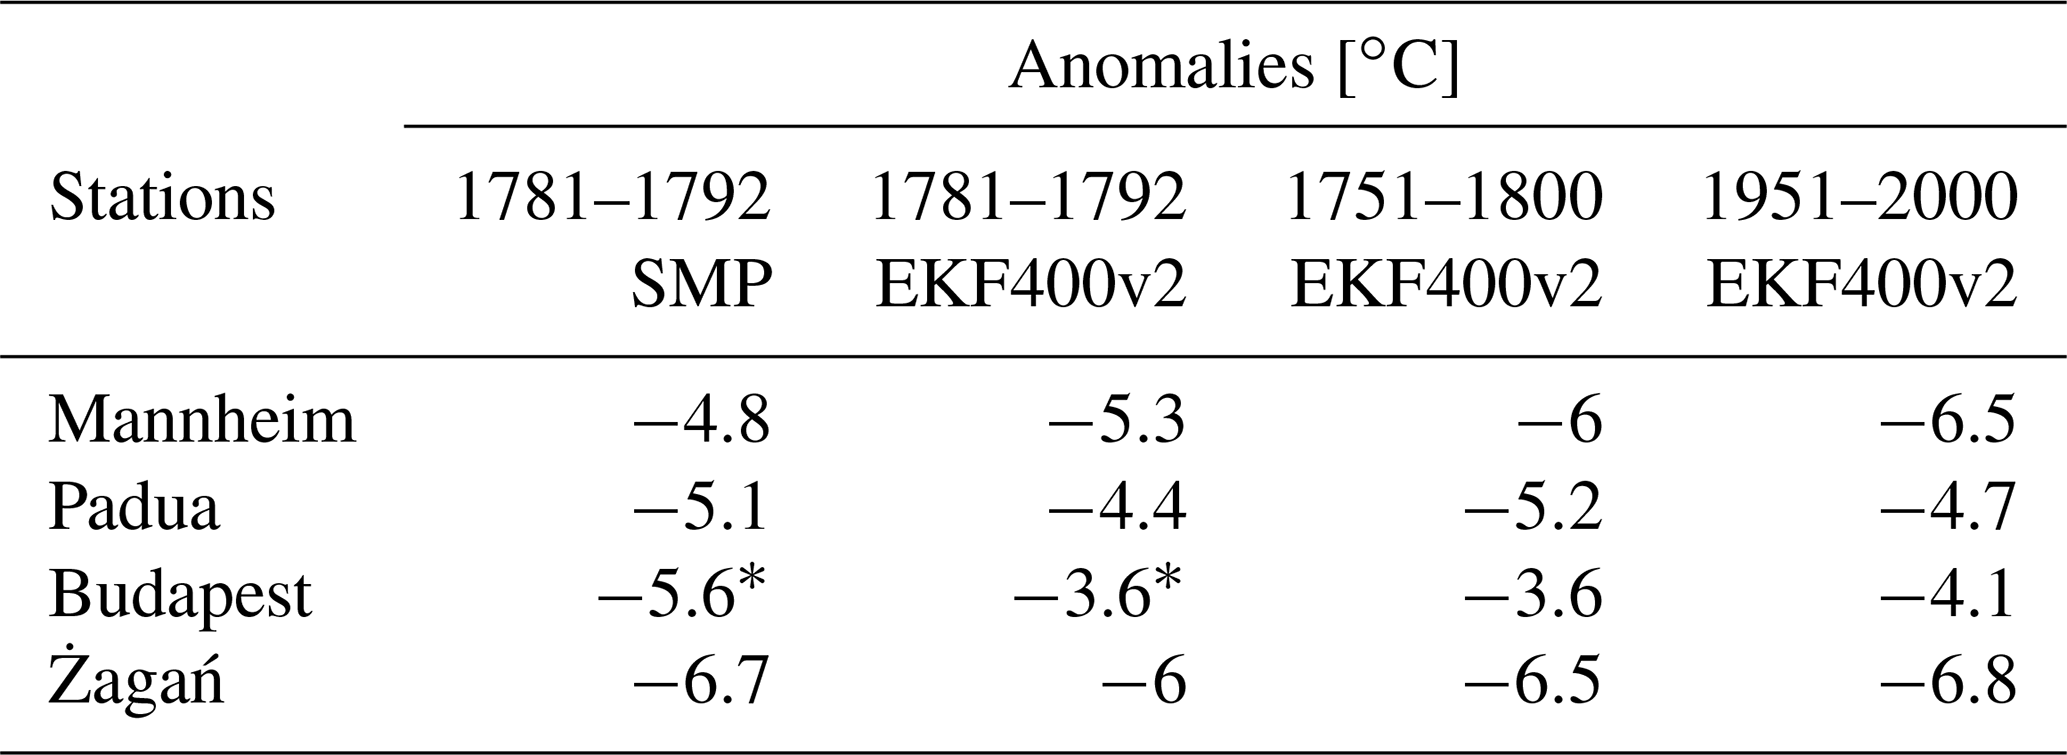
* Anomalies computed excluding 1781 and 1787.
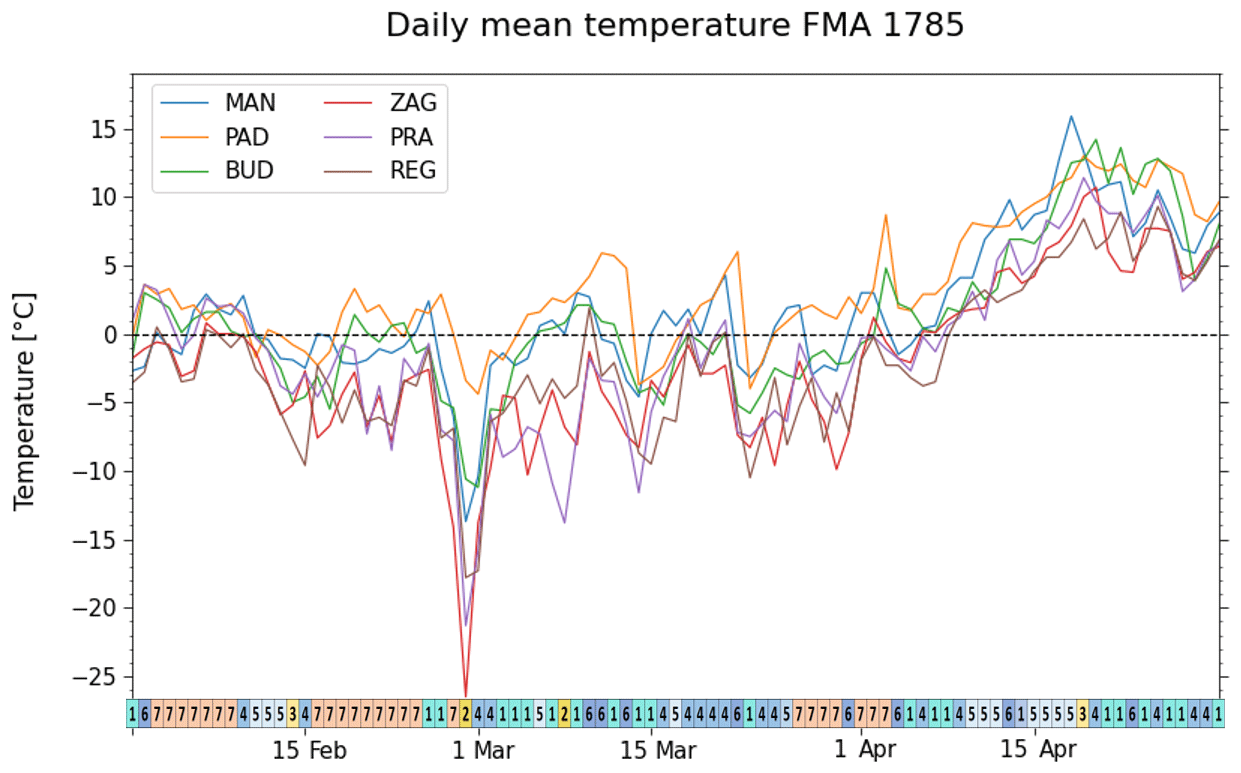
Figure 8Daily mean temperature from February to April 1785 at six SMP locations: Mannheim, Padua, Budapest, Żagań, Prague, and Regensburg. The bottom bar indicates the CAP7 weather type classifications by Schwander et al. (2017).
SMP data allow us to track the daily development of temperature throughout these weeks. Shown in Fig. 8 are mean daily temperature series for selected locations, along with the highest probability daily weather types. We present only six series for visual clarity, and the chosen stations are meant to be representative of a central area in Europe. The series have very good agreement, displaying mutual correlations between 0.78 and 0.91. Two features are immediately apparent. The first is the severe cold snap from 27 February to 2 March, with Żagań and Prague reaching temperatures below −20 ∘C. This was likely due to the strong northeast winds – type 1 weather type according to Schwander et al. (2017) – bringing freezing continental air into central Europe and was soon reversed by milder west–south-west winds (type 2). The second feature is the cold March itself, manifesting for many locations as persistent below-zero conditions for almost the entire month. Looking at the weather types, the main cause seems to have been successive days of type 4 (east, indifferent), type 1 (northeast, indifferent), type 5 (high pressure), and type 6 (north), hinting at the constant flow of cold air into the region.
Both the Palatina series and the weather types nicely complement Kington's daily synoptic maps. The maps show blocking over northwestern Europe until 7 March with a centre over the North Sea and Scotland (see Fig. 9). This is interrupted by a large cold front moving into France on 8 March, which coincides with a slight warming in the SMP series and type 2 weather. Over the next weeks, blocking resumes, this time mainly between Great Britain and Iceland (occasionally over Ireland), providing a constant flow of northerly Arctic air into central Europe.
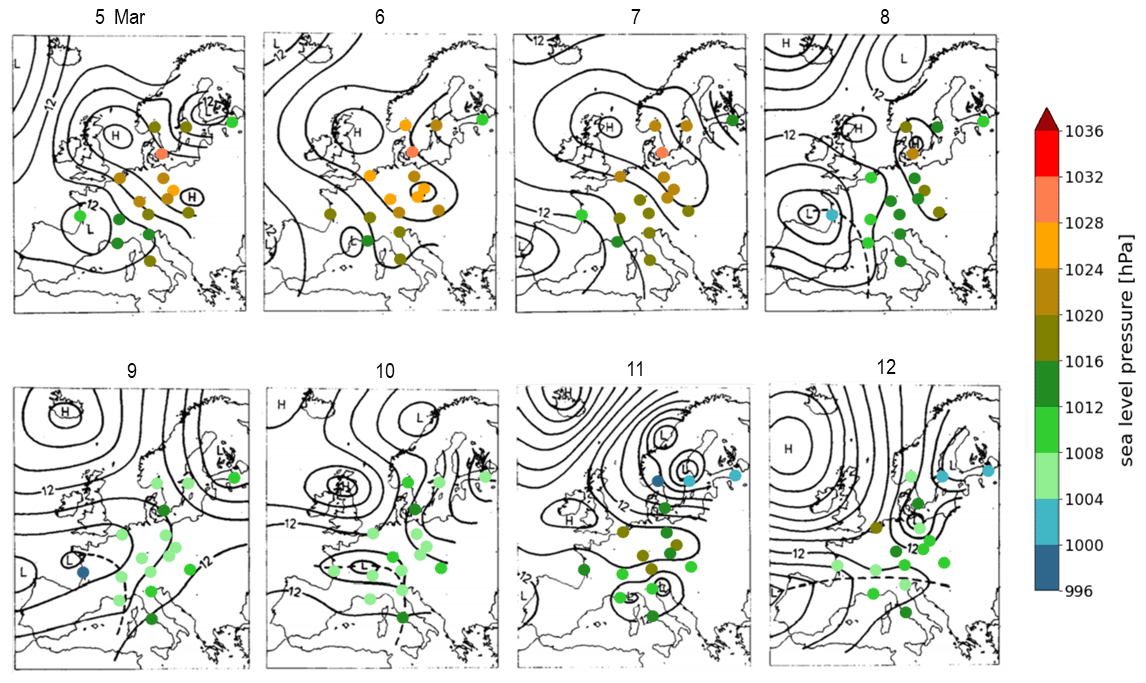
Figure 9Kington's hand-drawn synoptic maps showing the main SLP patterns over Europe covering the days from 8 to 12 March 1785. “H” and “L” denote centres of high and low pressure respectively. Isobars are drawn at 4 hPa intervals, and “12” denotes the 1012 hPa isobar; dashed lines indicate fronts. The figure is adapted from Kington (1988, p. 128) and reproduced with permission from Cambridge University Press through PLSclear.
The inventory makes it clear that not every station belonging to the network made measurements for the whole period, nor did they always record the observations in a consistent manner at a sub-daily resolution, at the specific hours instructed by the SMP. Exploring the sources and existing literature on SMP stations can shed light on some of the reasons for this heterogeneity.
The personalities and interests of SMP observers would have had an effect on the quality of the series. Taking observations in Bologna, for instance, Abbot Petronio Matteucci was far more interested in astronomy than meteorology and was therefore not too diligent in organising the meteorological observations for the SMP (Camuffo et al., 2017). He prepared sub-daily observations for 1782–1784 and 1791–1792, daily means for 1788, and substituted sub-daily readings for monthly averages in 1789 and 1790, whereas 1785 and 1786 were skipped altogether. The observations also include significant gaps at times, and the pressure series needed homogenising. In stark contrast to this example, reporting from Padua, were Giuseppe Toaldo and his nephew Vincenzo Chiminello, who were both good and accurate scientists – especially Chiminello, whose handwriting was neat and ordered (Camuffo et al., 2020). This commitment is reflected to some extent in the inventory: Padua followed (with few departures) the protocol set out by Hemmer and became one of the few stations that reported measurements for every year of the 12-year period. Indeed, unlike for Bologna, the recovered temperature and pressure series for Padua are in very good condition and required no adjustments.
Decisions by the SMP itself in Mannheim were also a factor affecting the year-to-year changes in the Ephemerides: the edition published in 1790 – containing the observations for 1788 – marks not only the absence of a number of stations that had hitherto been reporting measurements but was also the year with the highest proportion of lower-resolution observations. There is not much information in the Ephemerides as to why the volumes containing data for 1787 and 1788 were not published in extenso. The preface to the 1787 Ephemerides, published in 1789, mentions that the SMP is glad to finally be able to publish the volume after having overcome various “obstacles” posed by editing (Ephemerides, 1795, 1789, p. v). It would seem that there were delays due to observations from various stations arriving late and at different qualities and resolutions, which may have caused the decision to adopt this abridged format. The preface for the 1788 volume, published in 1790, complains about the strains of editing and compiling getting “higher every year” (Ephemerides, 1795, 1790, p. v–vi); this also may explain the choice to simplify the format then. Nevertheless, it was decided to revert to the old unabridged format after “many” expressed their “dissatisfaction” (Ephemerides, 1795, 1790, p. v). To today's climate scientists wishing to use these data for research, these diluted editions should not become an issue, as pressure, temperature, moisture, and other data are usually still available as tables of daily means, or monthly maxima and minima. That said, monthly data that have been calculated from quality-controlled sub-daily observations would lead to a higher quality monthly product than those obtained from the mid-range values of the monthly tables in the Ephemerides.
There is another issue for researchers who wish to use these data to reconstruct meaningful synoptic weather maps. That bigger issue is the gradual loss of synoptic coverage over Europe after 1787–1789, as stations stopped sending observations to the SMP. This is made more problematic by the fact that most of the station observations in 1787 are in the form of monthly maxima, minima, and mid-range values. However, even this shortcoming can be overcome by supplementing the analysis with data from independent neighbouring stations that were recording observations at the time. Thus, better geographic distribution is ensured – although this may be harder to achieve in eastern Europe.
Retrospectively, the declining participation among stations is no surprise. Jakob Hemmer died unexpectedly in 1790 without designating a successor (Cassidy, 1985, p. 19): the impetus of the SMP’s project had thus died with its leading organiser. Furthermore, what had been difficult obstacles to overcome up until then, such as the shipment of fragile instruments, personal rivalries, and poor communication, became compounded by the rapidly changing political situation in Europe. Hemmer himself had complained about the extreme difficulty in delivering instruments to the stations, which sometimes arrived vitiated and in pieces due in part to the negligence of custom officials, especially in France (Ephemerides, 1795, 1983, p. 45). It is no wonder that most of the stations that delivered data for the entire 12 years were in the Bavarian Palatinate. In 1792, France declared war against Austria and started its eastward expansion, occupying Mannheim on its way and putting an abrupt end to the society’s activities. One publication even mentions that the observer for the Brussels station, the Abbot Théodore Augustin Mann, had been forced to escape Belgium on 8 November 1792 because of the French invasion (Ephemerides, 1795, 1795, p. 112). The French Revolution undoubtedly weakened the SMP’s otherwise efficient integration of the network.
Our inventory revealed that the availability of records is heterogeneous and depends on the station and variable under consideration. Yet, despite the few inhomogeneities highlighted above, it remains a fact that the SMP managed to integrate and coordinate the collection of meteorological data on a very large scale. Amazingly, they did it rather efficiently at a time when this sort of scientific communication was very difficult, compounded also by personal and political differences. It is only due to the relatively tight control of its members, long-term central coordination, and perseverance of the SMP’s founder, Hemmer, that this project lasted as long as it did. Thanks to the efforts of the society's member stations, we currently have access to unique climate data for the late 18th century.
Indeed, keeping the usual degree of uncertainty associated with early instrumental measurements in mind, the temperature and pressure SMP data restored in this study are in usable condition. Their overall quality is good, likely due to the SMP's insistence on the use and free dispatch of standardised, comparable instruments. Nevertheless, the series are not free of errors (some more than others). A number of SMP temperature series occasionally showed evidence of the instrument being badly exposed, either indoors or in the sunlight. Some of the pressure series needed to be homogenised, and this could not be done for the Russian data. Nevertheless, the level of consistency among the SMP pressure records is remarkable if compared to similar pan-European datasets for the early instrumental period. In Brugnara et al. (2015), for instance, additional corrections of up to 10 hPa were necessary before synoptic maps for the 1810s could be drawn. Suspicious values were flagged with the C3S QC software, thereby providing an indication of the kind of problem at hand. The SEF files in the database furnish the necessary metadata pertaining to each measurement so that future users of this database can take the specific uncertainties of a given series into account when evaluating any results.
Finally, the two examples of extreme weather illustrated the usefulness of the instrumental data recovered in this study. When paired with narrative sources and atmospheric dynamical information, the SMP data can provide in situ, quantitative knowledge about the weather during these extreme events. The daily timescale of these measurement series is particularly important, as the series allow a detailed understanding of the progression and development of the event. This is especially useful for climate research because the data happen to overlap with a period of high climatic variability in Europe's history, which includes a high number of outstanding weather extremes (White et al., 2018). The figures showing the maps of Kington and SMP values demonstrate another advantage of the data: they show the relative ease of producing and visualising the data spatially, as opposed to the laborious hand-drawn charts of Kington.
The precise correction of pre-industrial meteorological data remains a challenge for climate research; they typically suffer from a lack of uniform procedures and protocols for their recording, meaning that the effort involved to recover, correct, and study them is much greater. These reasons make the data collected by the Societas Meteorologica Palatina even more valuable: their insistence on precise standardised instruments and emphasis on coordinating observations to a common plan mean that historical climatologists and data rescuers can use the database presented in this study with more confidence.
We presented a dataset that aims to uncover the historical weather data from the SMP, thereby filling a perceived gap in the research on the rescue of early instrumental observations. An assessment of the data availability in the Ephemerides revealed that the coverage and resolution vary significantly depending on the year, station, and parameter in question. Our inventory could be enriched and improved by focusing on specific stations or other variables, such as air moisture and rainfall. Additionally, 37 temperature and pressure records were digitised, converted, quality-controlled, homogenised where needed, and formatted into an accessible and standard American Standard Code for Information Interchange (ASCII) format. Their quality is generally quite good in comparison to other early instrumental datasets, although specific uncertainties associated with some of the measurements generate a need for locating and exploring further details regarding the individual stations. Two case studies highlighted the usefulness of the data when compared with existing research and historical documentary sources. These records have a number of different possible applications for climate research, including their assimilation in reanalysis datasets for use in regional dynamical downscaling studies and their use in the statistical reconstruction of daily fields over Europe with the analogue method. Their usefulness may depend on the specific goals of the study being undertaken, including which focus area and variables are of interest.
The potential here is large not only for climate science but for historians as well. The generated time series are of sufficient quality to allow historians to inspect the impact of specific periods of extreme weather on historical events. The weather information uncovered here could be used to study social developments that might have depended on day-to-day weather, or indeed on health and agriculture. More specifically, one could trace the daily impact of weather during this period on political and economic affairs, military operations, or any travels and expeditions. Databases of the type presented in our study will certainly benefit from the deep collaboration between historians and scientists.
The inventory, data, and relevant code related to this article are available in the Supplement. In addition, the data have been submitted to the Copernicus Climate Change Service Global Land and Marine Observations Database (C3S GLAMOD; https://cds.climate.copernicus.eu, GLAMOD, 2021).
The supplement related to this article is available online at: https://doi.org/10.5194/cp-17-2361-2021-supplement.
DP created the inventory, processed the data, performed the analysis, created the figures, and drafted the paper. YB oversaw the digitisation and collection of measurements, and verified the data rescue process. SJ, AP, and RP contributed a number of digitised series and, together with CR, they provided critical feedback to improve the final version of the paper. SB helped shape the research and supervised the project.
The contact author has declared that neither they nor their co-authors have any competing interests.
Publisher’s note: Copernicus Publications remains neutral with regard to jurisdictional claims in published maps and institutional affiliations.
This work was supported by the Swiss National Science Foundation (project WeaR, grant no. 188701), the European Research Council (ERC), and the European Union's Horizon 2020 Research and Innovation programme (grant no. 787574; PALAEO-RA). Sylvie Jourdain's work was carried out within the ANR CHEdaR project (grant no. ANR-09-CEP-002). The work of Aleksandra Pospieszyńska and Rajmund Przybylak was conducted within the NCN project (grant no. DEC-2020/37/B/ST10/00710).
This research has been supported by the Schweizerischer Nationalfonds zur Förderung der Wissenschaftlichen Forschung (grant no. 188701), the H2020 European Research Council (grant no. 787574), the ANR CHEdaR project (grant no. ANR-09-CEP-002), and the NCN project (no. DEC-2020/37/B/ST10/00710).
This paper was edited by Marie-France Loutre and reviewed by two anonymous referees.
Adams, J.: Diary of John Quincy Adams, The Adams Papers, Vol. 1, November 1779–March 1786, edited by: Taylor, R. J. and Friedlaender, M., Harvard, University Press, Cambridge MA, 228–242, 1981. a
Aspaas, P. P. and Hansen, T. L.: The Role of the Societas Meteorologica Palatina (1781–1792) in the History of Auroral Research, Acta Borealia, 29, 157–176, https://doi.org/10.1080/08003831.2012.732283, 2012. a
Auer, I., Böhm, R, Jurkovic, A., Lipa, W., Orlik, A., Potzmann, R., Schoner, W., Ungersböck, M., Matulla, C., Briffa, K., Jones, P. D., Efthymiadis, D., Brunetti, M., Nanni, T., Maugeri, M., Mercalli, L., Mestre, O., Moisselin, J.-M., Begert, M., Müller-Westermeier, G., Kveton, V., Bochnicek, O., Statsny, P., Lapin, M., Szalai, S., Szentimrey, T., Cegnar, T., Dolinar, M., Gajic-Capka, M., Zaninovic, K., Majstorovic, Z., and Nieplova, E.: HISTALP – Historical instrumental climatological surface time series of the Greater Alpine Region, Int. J. Climatol., 27, 17–46, https://doi.org/10.1002/joc.1377, 2007. a
Bellani, A.: Trattativi per determinare l'aumento di volume che acquista l'acqua prima e dopo la congelazione, Giornale di Fisica, 2, 429–439, 1808. a
Brázdil, R., Demarée, G. R., Deutsch, M., Garnier, E., Kiss, A., Luterbacher, J., Macdonald, N., Rohr, C., Dobrovolný, P., Kolář, P., and Chromá, K.: European floods during the winter 1783/1784: scenarios of an extreme event during the “Little Ice Age”, Theor. Appl. Climatol., 100, 163–189, https://doi.org/10.1007/s00704-009-0170-5, 2010. a, b, c
Brönnimann, S., Brugnara, Y., Allan, R. J., Brunet, M., Compo, G. P., Crouthamel, R. I., Jones, P. D., Jourdain, S., Luterbacher, J., Siegmund, P., Valente, M. A., and Wilkinson, C. W.: A roadmap to climate data rescue services, Geosci. Data J., 5, 28–39, https://doi.org/10.1002/gdj3.56, 2018. a
Brönnimann, S., Allan, R. Ashcroft, L., Baer, S., Barriendos, M., Brázdil, R., Brugnara, Y., Brunet, M., Brunetti, M., Chimani, B., Cornes, R., Domínguez-Castro, F., Filipiak, J., Founda, D., García Herrera, R., Gergis, J., Grab, S., Hannak, L., Huhtamaa, H., Jacobsen, K. S., Jones, P., Jourdain, S., Kiss, A., Lin, K. E., Lorrey, A., Lundstad, E., Luterbacher, J., Mauelshagen, F., Maugeri, M., Maughan, N., Neukom, R., Moberg, A., Nicholson, S., Noone, S., Nordli, Ø., Ólafsdóttir, K. B., Pearce, P. R., Pfister, L., Pribyl, K., Przybylak, R., Pudmenzky, C., Rasol, D., Reichenbach, D., Řezníčková, L., Rodrigo, F. S., Rohr, C., Skrynyk, O., Slonosky, V., Thorne, P. Valente, M. A., Vaquero, J. M., Westcottt, N. E., Williamson, F., and Wyszyński, P.: Unlocking Pre-1850 Instrumental Meteorological Records: A Global Inventory, Bull. Am. Meteorol. Soc., 100, ES389–ES413, https://doi.org/10.1175/BAMS-D-19-0040.1, 2019. a
Brugnara, Y., Auchmann, R., Brönnimann, S., Allan, R. J., Auer, I., Barriendos, M., Bergström, H., Bhend, J., Brázdil, R., Compo, G. P., Cornes, R. C., Dominguez-Castro, F., van Engelen, A. F. V., Filipiak, J., Holopainen, J., Jourdain, S., Kunz, M., Luterbacher, J., Maugeri, M., Mercalli, L., Moberg, A., Mock, C. J., Pichard, G., Řezníčková, L., van der Schrier, G., Slonosky, V., Ustrnul, Z., Valente, M. A., Wypych, A., and Yin, X.: A collection of sub-daily pressure and temperature observations for the early instrumental period with a focus on the “year without a summer” 1816, Clim. Past, 11, 1027–1047, https://doi.org/10.5194/cp-11-1027-2015, 2015. a, b, c
Brugnara, Y., Gilabert, A., Ventura, C., and Hunziker, S.: dataresqc: C3S Quality Control Tools for Historical Climate Data (Version 1.1.0), available at: https://cran.r-project.org/package=dataresqc (last access: 1 May 2021), 2020. a
Brugnara, Y., Pfister, L., Villiger, L., Rohr, C., Isotta, F. A., and Brönnimann, S.: Early instrumental meteorological observations in Switzerland: 1708–1873, Earth Syst. Sci. Data, 12, 1179–1190, https://doi.org/10.5194/essd-12-1179-2020, 2020. a
Brunet, M., Brugnara, Y., Noone, S., Stephens, A., Valente, M. A., Ventura, C., Jones, P., Gilabert, A., Brönnimann, S., Luterbacher, J., Allan, R., Brohan, P., and Compo, G. P.: Best Practice Guidelines for Climate Data and Metadata Formatting, Quality Control and Submission of the Copernicus Climate Change Service Data Rescue Service [Ref: C3S_DC3S311a_Lot1.3.4.2_2020_v4 – contract: 2020/C3S_311a_Lot1_Met Office/SC3], https://doi.org/10.24381/kctk-8j22, 2020. a
Brunetti, M., Maugeri, M., Monti, F., and Nanni, T.: Temperature and precipitation variability in Italy in the last two centuries from homogenised instrumental time series, Int. J. Climatol., 26, 345–381, https://doi.org/10.1002/joc.1251, 2006. a
Camuffo, D. and Jones, P. (Eds.): Improved Understanding of past Climatic Variability from Early Daily European Instrumental Sources, Springer, the Netherlands, 2002. a, b
Camuffo, D., Bertolin, C., Barriendos, M., Dominguez-Castro, F., Cocheo, C., Enzi, S., Sghedoni, M., della Valle, A., Garnier, E., Alcoforado, M.-J., Xoplaki, E., Luterbacher, J., Diodato, N., Maugeri, M., Nunes, M. F., and Rodriguez, R.: 500-Year Temperature Reconstruction in the Mediterranean Basin by Means of Documentary Data and Instrumental Observations, Climatic Change, 101, 169–199, https://doi.org/10.1007/s10584-010-9815-8, 2010. a
Camuffo, D., Bertolin, C., Bergonzini, A., Amore, C., and Cocheo, C.: Early hygrometric observations in Padua, Italy, from 1794 to 1826: the Chiminello goose quill hygrometer versus the de Saussure hair hygrometer, Climatic Change, 122, 217–227, https://doi.org/10.1007/s10584-013-0988-9, 2013. a
Camuffo, D., della Valle, A., Bertolin, C., and Santorelli, E.: Temperature observations in Bologna, Italy, from 1715 to 1815: a comparison with other contemporary series and an overview of three centuries of changing climate, Climatic Change, 142, 7–22, https://doi.org/10.1007/s10584-017-1931-2, 2017. a, b
Camuffo, D., della Valle, A., Becherini, F., and Zanini, V.: Three centuries of daily precipitation in Padua, Italy, 1713-2018: history, relocations, gaps, homogeneity and raw data, Climatic Change, 162, 923–942, https://doi.org/10.1007/s10584-020-02717-2, 2020. a
Camuffo, D., della Valle, A., and Becherini, F.: From time frames to temperature bias in temperature series, Climatic Change, 165, 1–23, https://doi.org/10.1007/s10584-021-03065-5, 2021. a
Cassidy, D.: Meteorology in Mannheim: The Palatine Meteorological Society, 1780–1795, Sudhoffs Archive, 69, 8–25, 1985. a, b, c, d, e, f
Cavendish, H., Heberden, W., Aubert, A., Deluc, J. A. D., Maskelyne, N., Horsley, S., and Planta, J.: The report of the Committee of the Royal Society to consider of the Best Method of Adjusting the Fixed Points of Thermometers; and the Precautions Necessary to be Used in Making Experiments with these Instruments, Philos. Trans., 67, 816–857, 1777. a
CHEDaR: Climat, Santé et Environnement: Sauvetage des données et modélisation, available at: https://www.adaptation-changement-climatique.fr/ (last access: 21 April 2021), 2010–2014, 2014. a
Cotte, L.: Traité de météorologie, Imprimerie Royale, Paris, 1774. a
Craddock, J. M.: Methods of comparing annual rainfall records for climatic purposes, Weather, 34, 332–346, https://doi.org/10.1002/j.1477-8696.1979.tb03465.x, 1979. a
Csernus-Molnár, I., Kiss, A., and Pócsik, E.: 18th-Century Daily Measurements and Weather Observations in the Se-Carpathian Basin: A Preliminary Analysis of the Timisoara Series (1780–1803), J. Env. Geo., 7, 1–9, https://doi.org/10.2478/jengeo-2014-0001, 2014. a
Demarée, G. R.: The catastrophic floods of February 1784 in and around Belgium – a Little Ice Age event of frost, snow, river ice and floods, Hydrol. Sci. J., 51, 878–898, https://doi.org/10.1623/hysj.51.5.878, 2006. a, b
Euler, J. A.: Comparison des instrumens météorologiques envoyés par l’Académie Electorale de Mannheim avec ceux de l’Académie Impériale des Sciences, Acta Academiae Scientiarum Imperialis Petropolitanae 1782, part 2, 25–27, 1782. a
Feldman, T. S.: The history of meteorology, 1750–1800, A case study in the development of experimental physics, Dissertation, University of California, Berkeley, 1983. a, b
Feldman, T. S.: Late Enlightenment Meteorology, in: The Quantifying Spirit in the 18th Century, edited by: Frängsmyr, T., Heilbron, J. L., and Rider, R. E., University of California Press, Berkeley, 143–177, available at: http://ark.cdlib.org/ark:/13030/ft6d5nb455/ (last access: 19 March 2021), 1990. a
Fessehaye, M., Brugnara., Y., Savage, M. J., Brönnimann, S.: A note on air temperature and precipitation variability and extremes over Asmara: 1914–2015, Int. J. Climatol., 39, 5215–5227, https://doi.org/10.1002/joc.6134, 2019. a
Franke, J., Brönnimann, S., Bhend, J., and Brugnara, Y.: A monthly global paleo-reanalysis of the atmosphere from 1600 to 2005 for studying past climatic variations, Sci. Data, 4, 170076, https://doi.org/10.1038/sdata.2017.76, 2017. a, b
GLAMOD: Global Land and Marine Observations Database: Global land surface atmospheric variables from 1755 to 2020 from comprehensive in-situ observations, Copernicus Climate Change Service (C3S) [data set], available at: https://cds.climate.copernicus.eu/, last access: 30 September 2021. a
Grenon, M.: Jean Senebier: de l'astro-météorologie au prévisionnisme empirique — en passant par la météorologie instrumentale, Arch. Sci., 63, 147–176, 2010. a
Häderli, S., Pfister, S., Villiger, L., Brugnara, Y., and Brönnimann, S.: Two Meteorological Series from Geneva, 1782–1791, in: Swiss Early Instrumental Meteorological Series, edited by: Brönnimann, S., Geographica Bernensia G96, 33–46, https://doi.org/10.4480/GB2020.G96.03, 2020. a
Hersbach, H., Bell, B., Berrisford, P., Hirahara, S., Horányi, A., Muñoz‐Sabater, J., Nicolas, J., Peubey, C., Radu, R., Schepers, D., Simmons, A., Soci, C., Abdalla, S., Abellan, X., Balsamo, G., Bechtold, P., Biavati, G., Bidlot, J., Bonavita, M., De Chiara, G., Dahlgren, P., Dee, D., Diamantakis, M., Dragani, R., Flemming, J., Forbes, R., Fuentes, M., Geer, A., Haimberger, L., Healy, S., Hogan, R. J., Hólm, E., Janisková, M., Keeley, S., Laloyaux, P., Lopez, P., Lupu, C., Radnoti, G., de Rosnay, P., Rozum, I., Vamborg, F., Villaume, S., and Thépaut, J.-N.: The ERA5 global reanalysis, Roy. Meteorol. Soc., 146, 1999–2049, https://doi.org/10.1002/qj.3803, 2020. a
Jones, P. D.: Early European instrumental records, in: History and Climate, edited by: Jones, P. D., Ogilvie, A. E. J., Davies, T. D., and Briffa, K. R., Springer, US, 55–77, https://doi.org/10.1007/978-1-4757-3365-5, 2001. a
Kington, J. A.: The Societas Meteorologica Palatina: an eighteenth-century meteorological society, Weather, 29, 416–426, https://doi.org/10.1002/j.1477-8696.1974.tb04330.x, 1974. a, b
Kington, J. A.: The Weather of the 1780s Over Europe, Cambridge University Press, Cambridge, https://doi.org/10.1017/CBO9780511735721, 1988. a, b, c, d, e
Lamb, H.: Historic Storms of the North Sea, British isles and Northwest Europe, Cambridge University Press, Cambridge, 2005. a
Lüdecke, C.: Astrometeorological Weather Prediction at the Time of the Societas Meteorologica Palatina, in: From Beaufort to Bjerknes and Beyond: Critical Perspectives on Observing, Analysing, and Predicting Weather and Climate, edited by: Lüdecke, C. and Emeis, S., Dr. Erwin Rauner Verlag, Augsburg, 69–80, 2004. a
Lüdecke, C.: Von der Kanoldsammlung (1717–1730) zu den Ephemeriden der Societas Meteorologica Palatina (1781–1792). Meteorologische Quellen zur Umweltgeschichte des 18. Jahrhunderts, in: Landschaften agrarisch-ökonomischen Wissens: Strategien innovativer Ressourcennutzung in Zeitschriften und Sozietäten des 18. Jahrhunderts, edited by: Popplow, M., Waxmann Verlag, Münster, 97–119, 2010. a
Maret, H: Histoire météorologique de 1783, Académie des Sciences, Dijon, Nouveaux Mémoires 1783, part 1, 204-230, 1783. a
Muñoz-Sabater, J.: ERA5-Land hourly data from 1981 to present. Copernicus Climate Change Service (C3S) Climate Data Store (CDS), available at: https://cds.climate.copernicus.eu/cdsapp#!/dataset/reanalysis-era5-land (last access: 27 December 2020), 2019. a
OeGB (Oekonomische Gesellschaft Bern): Auszüge einiger Berathschlagungen der ökonomischen Gesellschaft, Abhandlungen und Beobachtungen durch die Ökonomische Gesellschaft zu Bern gesammelt, 3, XLIX–LXII, 1762. a
Pfister, C.: Agrarkonjunktur und Witterungsverlauf im westlichen Schweizer Mittelland, 1755–1797, Lang Druck AG, Liebefeld, Bern, 1975. a
Pfister, C.: Wetternachhersage, 500 Jahre Klimavariationen und Naturkatastrophen (1496–1995), Haupt Verlag, Bern, 1999. a
Pfister, C., Kull, C., and Wanner, H. (Eds.): Documentary Evidence, Past Glob. Chang. Mag., 10, 1–28, https://doi.org/10.22498/pages.10.3, 2002. a
Pfister, L., Hupfer, F., Brugnara, Y., Munz, L., Villiger, L., Meyer, L., Schwander, M., Isotta, F. A., Rohr, C., and Brönnimann, S.: Early instrumental meteorological measurements in Switzerland, Clim. Past, 15, 1345–1361, https://doi.org/10.5194/cp-15-1345-2019, 2019. a
Pfister, L., Brönnimann, S., Schwander, M., Isotta, F. A., Horton, P., and Rohr, C.: Statistical reconstruction of daily precipitation and temperature fields in Switzerland back to 1864, Clim. Past, 16, 663–678, https://doi.org/10.5194/cp-16-663-2020, 2020. a
Przybylak, R., Pospieszynska, Wyszynski, P., and Nowakowski, M.: Air temperature changes in Żagań (Poland) in the period from 1781 to 1792, Int. J. Climatol., 34, 2408–2426, https://doi.org/10.1002/joc.3847, 2014. a, b, c
Raicich, F.: Long-term variability of storm surge frequency in the Venice Lagoon: an update thanks to 18th century sea level observation, Nat. Hazards Earth Syst. Sci., 15, 527–535, https://doi.org/10.5194/nhess-15-527-2015, 2015. a
Schwander, M., Brönnimann, S., Delaygue, G., Rohrer, M., Auchmann, R., and Brugnara, Y.: Reconstruction of Central European daily weather types back to 1763, Int. J. Climatol., 37, 30–44, https://doi.org/10.1002/joc.4974, 2017. a, b, c
Societas Meteorologica Palatina, Ephemerides Societatis Meteorologicae Palatinae: Observationes anni 1781–92, Vol. 12, edited by: Hemmer, J. J., Mannheim, first publication: 1783, last publication: 1795. a, b, c, d, e, f, g, h, i, j, k, l
Toaldo, G.: La Meteorologia applicata all’Agricoltura, Storti, Venice, 1775. a
Traumüller, F.: Die Mannheimer meteorologische Gesellschaft (1780–1795). Ein Beitrag zur Geschichte der Meteorologie, Dürrsche Buchhandlung, Leipzig, 1885. a
Valler, V., Franke, J., Brugnara, Y., and Brönnimann, S.: An updated global atmospheric plaeo-reanalysis covering the last 400 years, Geosci. Data J., XX, XX–XX, https://doi.org/10.1002/gdj3.121, 2021. a, b
Venema, V. K. C., Mestre, O., Aguilar, E., Auer, I., Guijarro, J. A., Domonkos, P., Vertacnik, G., Szentimrey, T., Stepanek, P., Zahradnicek, P., Viarre, J., Müller-Westermeier, G., Lakatos, M., Williams, C. N., Menne, M. J., Lindau, R., Rasol, D., Rustemeier, E., Kolokythas, K., Marinova, T., Andresen, L., Acquaotta, F., Fratianni, S., Cheval, S., Klancar, M., Brunetti, M., Gruber, C., Prohom Duran, M., Likso, T., Esteban, P., and Brandsma, T.: Benchmarking homogenization algorithms for monthly data, Clim. Past, 8, 89–115, https://doi.org/10.5194/cp-8-89-2012, 2012. a
Vinther, B. M., Andersen, K. K., Jones, P. D., Briffa, K. R., and Cappelen, J.: Extending Greenland temperature records into the late eighteenth century, J. Geophys. Res., 111, D11105, https://doi.org/10.1029/2005JD006810, 2006. a
Wege, K. and Winkler, P.: The Societas Meteorologica Palatina (1780–1795) and the Very First Beginnings of the Hohenpessienberg Observatory, in: In From Beaufort to Bjerknes and Beyond: Critical Perspectives on Observing, Analysing, and Predicting Weather and Climate, edited by: Lüdecke, C. and Emeis, S., Dr. Erwin Rauner Verlag, Augsburg, 45–54, 2004. a, b
Weusthoff, T.: Weather type classification at MeteoSwiss: introduction of new automatic classification schemes, Arbeitsberichte der MeteoSchweiz, 235, Bundesamt für Meteorologie und Klimatologie, MeteoSchweiz, Zurich, 2011. a
White, S., Pfister, C., and Mauelshagen, F. (Eds.): The Palgrave Handbook of Climate History, Palgrave Macmillan, UK, 656 pp., https://doi.org/10.1057/978-1-137-43020-5, 2018. a
Winkler, P.: Revision and necessary correction of the long-term temperature series of Hohenpeissenberg, 1781–2006, Theor. Appl. Climatol., 98, 259–268, https://doi.org/10.1007/s00704-009-0108-y, 2009. a, b, c
WMO (World Meteorological Organization): Quality Control Procedures. Guide on the Global Data-processing System, Chapter 6, WMO, Geneva, No. 305, VI.1–VI.27, 199 pp., 1993. a
Yelin, J. C.: Über die Veränderlichkeit des Nullpunktes in den Quecksilber und Weingeist-Thermometern, Archiv Naturlehre, 3, 109–122, 1824. a
Yiou, P., Boichu, M., Vautard, M., Jourdain, S., Fluteau, F., Menut, L., and Garnier, E.: Ensemble meteorological reconstruction using circulation analogues of 1781–1785, Clim. Past, 10, 797–809, https://doi.org/10.5194/cp-10-797-2014, 2014. a