the Creative Commons Attribution 4.0 License.
the Creative Commons Attribution 4.0 License.
 | 23 Jun 2021
A revised mid-Pliocene composite section centered on the M2 glacial event for ODP Site 846
Timothy D. Herbert
Rocio Caballero-Gill
Joseph B. Novak
The composite section from ODP Site 846 has provided key data sets for Pliocene stable isotope and paleoclimatic time series. We document here apparent outliers in previously published data sets for stable isotopes and alkenone-derived sea surface temperature (SST) estimates in the Pliocene interval containing the M2 glaciation (ca. 3.290–3.3 Ma) by tying high-resolution core measurements to a continuous downhole conductivity log. We generate a revised sequence of new stable isotopic and alkenone measurements across the M2 event that correlate well to the revised splices of color reflectance and gamma ray attenuation porosity evaluator data from Site 846, and to a new composite section produced at equatorial Pacific ODP Site 850. A new composite splice for Site 846 is proposed, along with composite isotope and alkenone time series that should be integrated into revised Pliocene paleoclimatic stacks.
- Article
(5283 KB) - Full-text XML
- BibTeX
- EndNote


Continuous proxy time series from ODP Site 846 occupy a privileged place in Pliocene stratigraphy and paleoclimatology. Drilled during Leg 138, this site was one of the first to systematically integrate high-resolution, non-destructive core scanning into the construction of composite sections (Shipboard Scientific Party, 1992; Hagelberg et al., 1995) that formed the basis for later detailed shore-based studies. The creation of composite sections was necessitated by the fact that coring does not completely recover the sequence at any one drill hole; continuous records must be stitched together to fill in coring gaps. Among the fruits of this work were some of the longest, best-resolved time series of Pliocene stable isotopic variations (Shackleton et al., 1995b), lithological variations (Hagelberg et al., 1995), and tropical sea surface temperatures (Lawrence et al., 2006; Herbert et al., 2010) and a proposal for an orbitally tuned late Neogene timescale (Shackleton, 1995a). The continuity and high sedimentation rate at Site 846 resulted in its isotopic data set playing an outsized role in the Pliocene interval of the widely used LR04 isotopic stack (Lisiecki and Raymo, 2005). However, it was noted (Fig. 9 of Lisiecki and Raymo, 2005) that the isotopic record in the interval surrounding the glacial event M2 (circa 3.3 Ma) at Site 846 is anomalous in comparison to other sites.
In this contribution we document significant errors in the Pliocene (equivalent to the Gauss magnetochron) composite section at Site 846. These affect the stable isotopic and paleotemperature reconstructions around the Pliocene M2 isotopic event, the most notable Pliocene glacial stage preceding cyclic Northern Hemisphere glaciation at ∼2.7 Ma (Mudelsee and Raymo, 2005) and immediately predating the well-studied Pliocene Research, Interpretation and Synoptic Mapping (PRISM) interval (Dowsett, 2007). We were drawn to revisit the original composite section because features surrounding the M2 glacial event seemed anomalous in comparison to other time-equivalent marine sections we have been investigating. We construct a more reliable composite section through a combination of tying high-resolution measurements made at offset holes to a high-resolution downhole log acquired at Hole 846B, and we supplement that stratigraphic analysis with new stable isotopic and alkenone sea surface temperature (SST) estimates from Hole 846B, which was not used in the original composite in the M2 interval. We propose a revised composite section spanning the interval equivalent to the early Gauss through Mammoth magnetic polarity zones (circa 3.2–3.6 Ma) and tie the ODP Site 846 records to ODP Site 850, which provides an indirect tie of stable isotopic and SST estimates at Site 846 to a high-quality magnetic polarity stratigraphy. Our results also yield insights into core recovery and coring distortion artifacts during hydraulic piston coring of calcareous–siliceous sediments of the equatorial Pacific.
2.1 Composite section generation
Assignments of gaps in core recovery and distortions induced by coring create challenges in accurately compositing sedimentary records from offset holes. The scientific party on board Leg 138 made excellent use of high-resolution measurements from the gamma ray porosity evaluation scanner, a reflectance spectrophotometer, and magnetic susceptibility logging of cores (Hagelberg et al., 1995; Mix et al., 1995). Constructing a composite section proceeded by identifying tie points between holes on a core-by-core basis, splicing missing material at core breaks by the section represented at an offset hole, and assuming that a linear offset applied between the drilling depth (meters below sea floor, m b.s.f.) and the composite depth that resulted from splicing materials between holes. As compared to the original drilling depth, the composite section at Site 846 grew by about 15 %, indicating that a significant amount of material was not recovered at any one hole during drilling.
Later sampling followed the logic of the initial splicing, hopping between holes to follow the composite section documented in the Initial Reports volume (Hagelberg et al., 1995). A more flexible and robust procedure for composite section generation was subsequently developed using dynamic programming to optimally align time series data (Lisiecki and Lisiecki, 2002, and Lisiecki and Herbert, 2007). This method allowed for assessing distortions in the coring process (e.g., stretching or squeezing of sedimentation relative to the undisturbed section), but it still required user guidance of key tie points and the more or less arbitrary assumption of which section of several replicates (e.g., holes B, C, and D at Site 846) provided the least disturbed representation of sedimentation.
In this work we continue to use the Match program developed by Lisiecki and Lisiecki (2002) but take advantage of a high-resolution downhole log of conductivity acquired at the time of drilling, which provides the best representation of a truly continuous and undistorted sedimentary column at Site 846. This opportunity was not recognized in the compositing of Lisiecki and Herbert (2007), although it could have been apparent based on the work of Harris et al. (1995), who used a different hostile-environment litho-density sonde (HLDS) log that has lower spatial resolution than the Formation MicroScanner (FMS) conductivity sensor log analyzed here. The FMS log (Hole 846B pass 2) acquired data at 0.25 cm resolution from ∼80 m b.s.f. (early Pleistocene) to the base of the section (see http://brg.ldeo.columbia.edu/logdb/hole/?path=odp/leg138/846B/, last access: 19 May 2021). Unlike many of the borehole logging measurements, the conductivity log preserves fine-scale (centimetric) variations related to changes in lithology and sediment physical properties. The conductivity measurements essentially represent the inverse of porosity logging, as conductivity increases with conductive pore water volume and decreases as the volume of solids grows. The conductivity log is therefore quite similar to variations in wet bulk density logged by the Gamma Ray Attenuation Porosity Evaluator (GRAPE) sensor in cores raised during drilling of Site 846 (Fig. 1 reports highly significant correlations of detrended data FMS and GRAPE). As demonstrated by shipboard results, wet bulk density correlates positively with carbonate content and therefore positively with reflectance (r=0.69 for data sets from Site 846).
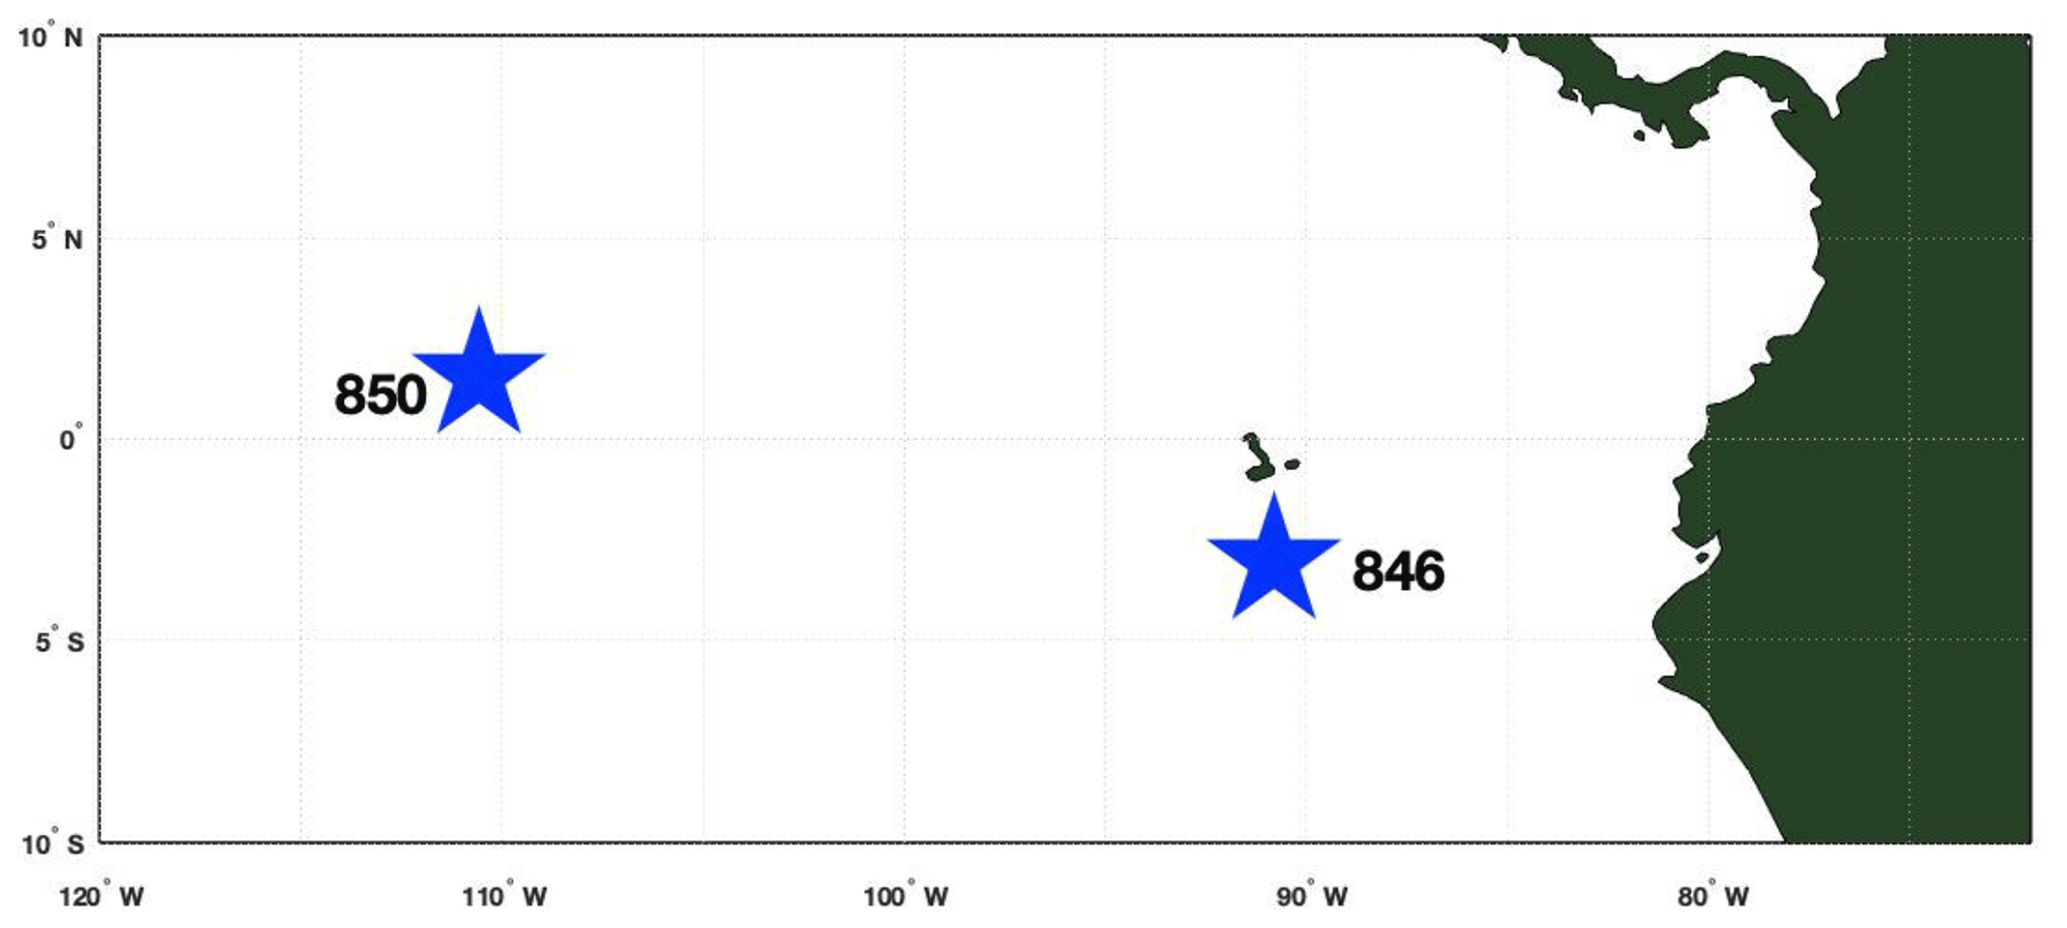
Figure 1Locations of ODP sites 846 and 850 (ODP Leg 138).
The downhole log information includes conductivity measurements from three pad sensors. We tested different combinations of weighting the log data against reflectance and GRAPE time series measured on cores (mean, geometric mean, maximum and/or minimum of the three measurements) and found that choosing the minimum of the three sensor measurements at each depth interval consistently gave the highest match to the core color reflectance and GRAPE data sets. We interpret this result as reflecting the likelihood that high-conductivity readings can result from poor pad contact with the borehole and/or washouts of sediment and are likely to be outliers. We also found that one interval of the borehole provided unreliable data from all of the sensors, most likely due to a significant washout, and we deleted data from this segment (138.37 to 138.19 m in log depth) in our alignment process. Three more short segments showed unusually low conductivity and were likewise removed (146.6799–146.746, 150.3299–150.3705, and 150.4315–150.4798 m log depth). We used core photographs to remove GRAPE and reflectance outliers at the top and base of cores based on visual evidence of core disturbance.
Mapping between offset holes and the downhole conductivity log was done to optimize the alignment of GRAPE and reflectance data to the target. In addition, guided by the downhole log, we optimized the alignment of each offset hole data to the other offset holes. Data sets were normalized and detrended and we mapped (+) reflectance and GRAPE bulk density to (–) conductivity. While we relied on the reflectance and GRAPE information, wherever possible we checked for consistency with stable isotopic (Shackleton et al., 1995b) and alkenone (Lawrence et al., 2006) data sets as well. Tie points were inserted based on both reflectance and GRAPE data, but the final composites were generated from the Match algorithm applied to the GRAPE time series only, as this consistently showed better alignment to the log and smoother variations in implied core distortion than the reflectance data. The better correlations to the bore log via GRAPE presumably reflects the benefit of consistent GRAPE calibration to density standards in comparison to the reflectivity measurements and/or a closer match between GRAPE-estimated wet bulk density and conductivity in comparison to color reflectance.
Our goal in composite section generation was to achieve alignments between the depth series of offset holes and the conductivity log robust at the scale of orbitally related variations in sedimentation and proxy variance. Given sedimentation rates in the interval of interest of 4–5 cm/kyr, this meant achieving satisfactory alignment at ∼40 cm or one half precessional wavelength. In practice, we found that approximately 20 tie points served to achieve this level of match. The Match algorithm includes a number of tradeoffs in the alignment procedure. Essentially, it determines the optimal alignment of segments of data at integer ratios, with a 1:1 alignment indicating no distortion of one record relative to the other. In addition to default choices supplied by the Match software (http://lorraine-lisiecki.com/match.html, last access: 19 May 2021) we ran an experiment where we increased the number of integer choices in the vicinity of the 1:1 match in order to suppress small-scale jumps in relative accumulation in order to see larger patterns between offset holes (the point penalty score for correlations to the log can be improved by about 15 % by letting the accumulation rate change more freely in the Match algorithm than we do for the “smooth” mapping). To enhance smoothness, we assigned a relatively high penalty function to the speed parameter but very little penalty to the speed change parameter – this allowed for fine-scale adjustment of relative accumulation rates while minimizing large and abrupt changes in the mapping functions. We also iteratively adjusted the gaps assigned between cores from the nominal gaps determined by the shipboard splices, so that the matching procedure yielded a smooth downhole mapping without artificial jumps at core breaks (Figs. 2 and 3).

Figure 2Correlations of the inverse of borehole log conductivity (detrended and normalized) to GRAPE density (detrended and normalized) and to color reflectance (channel 1, detrended and normalized) over the depth interval 85–170 m b.s.f. (95–181 m c.d.); Hole 846B. Note that the inverse of conductivity is plotted. Both correlations (N=1853, 3388) are highly significant. Correlations of the same variables from holes 846C and 846D were very similar.
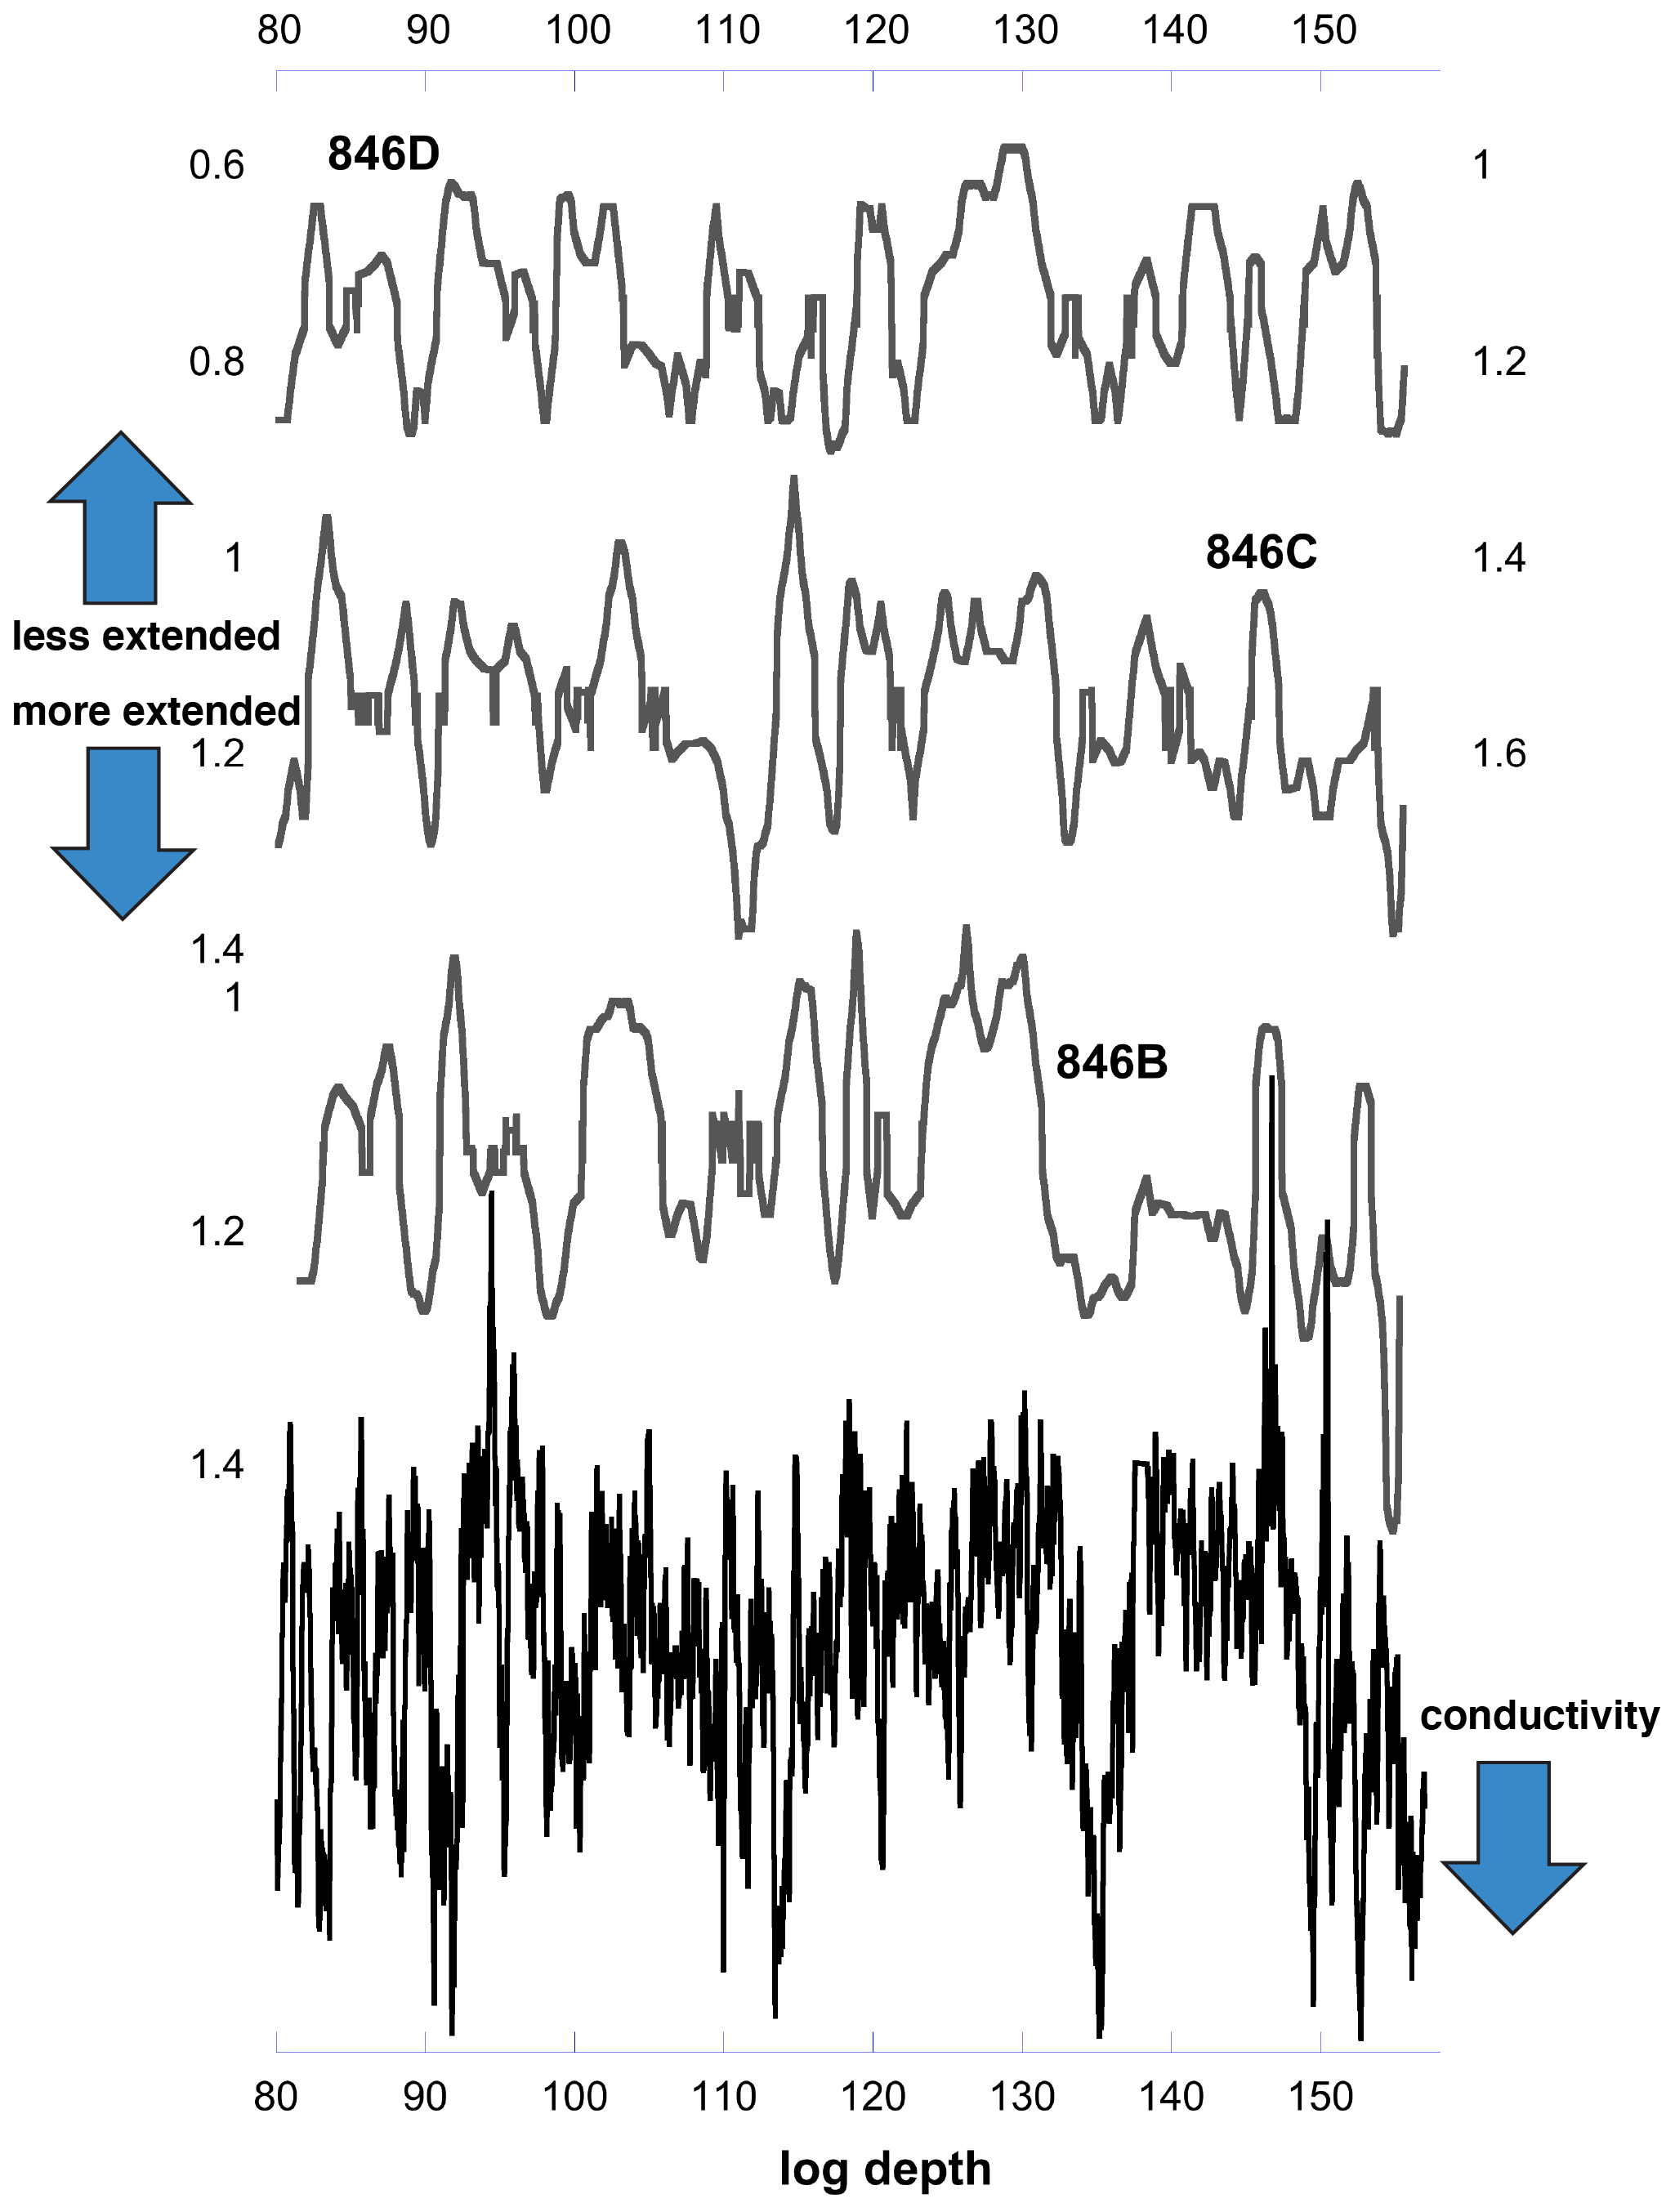
Figure 3Composite sections of GRAPE density generated using the Match algorithm for holes 846B, C, and D, on a new composite depth section, compared to the inverse conductivity log depth. All data sets were detrended and normalized for this comparison. Coring gaps at each hole have been filled in from offset holes to make continuous splices.
Ultimately, we determined that choices such as the number of intervals and penalty parameters had very little effect on the final mapping (e.g., variations in parameters by a factor of 2 produced negligible changes in mapping). Final Match parameter choices are presented in Table 1.
Table 1Values used with Match algorithm to generate “smooth” mappings of offset holes for new composite sections and for mapping to the borehole conductivity log. The default mapping for the “high-resolution” mapping used speeds of 1:3, 2:5, 1:2, 3:5, 2:3, 3:4, 4:5, 1:1, 5:4, 4:3, 3:2, 5:3, 2:1, 5:2, and 3:1.
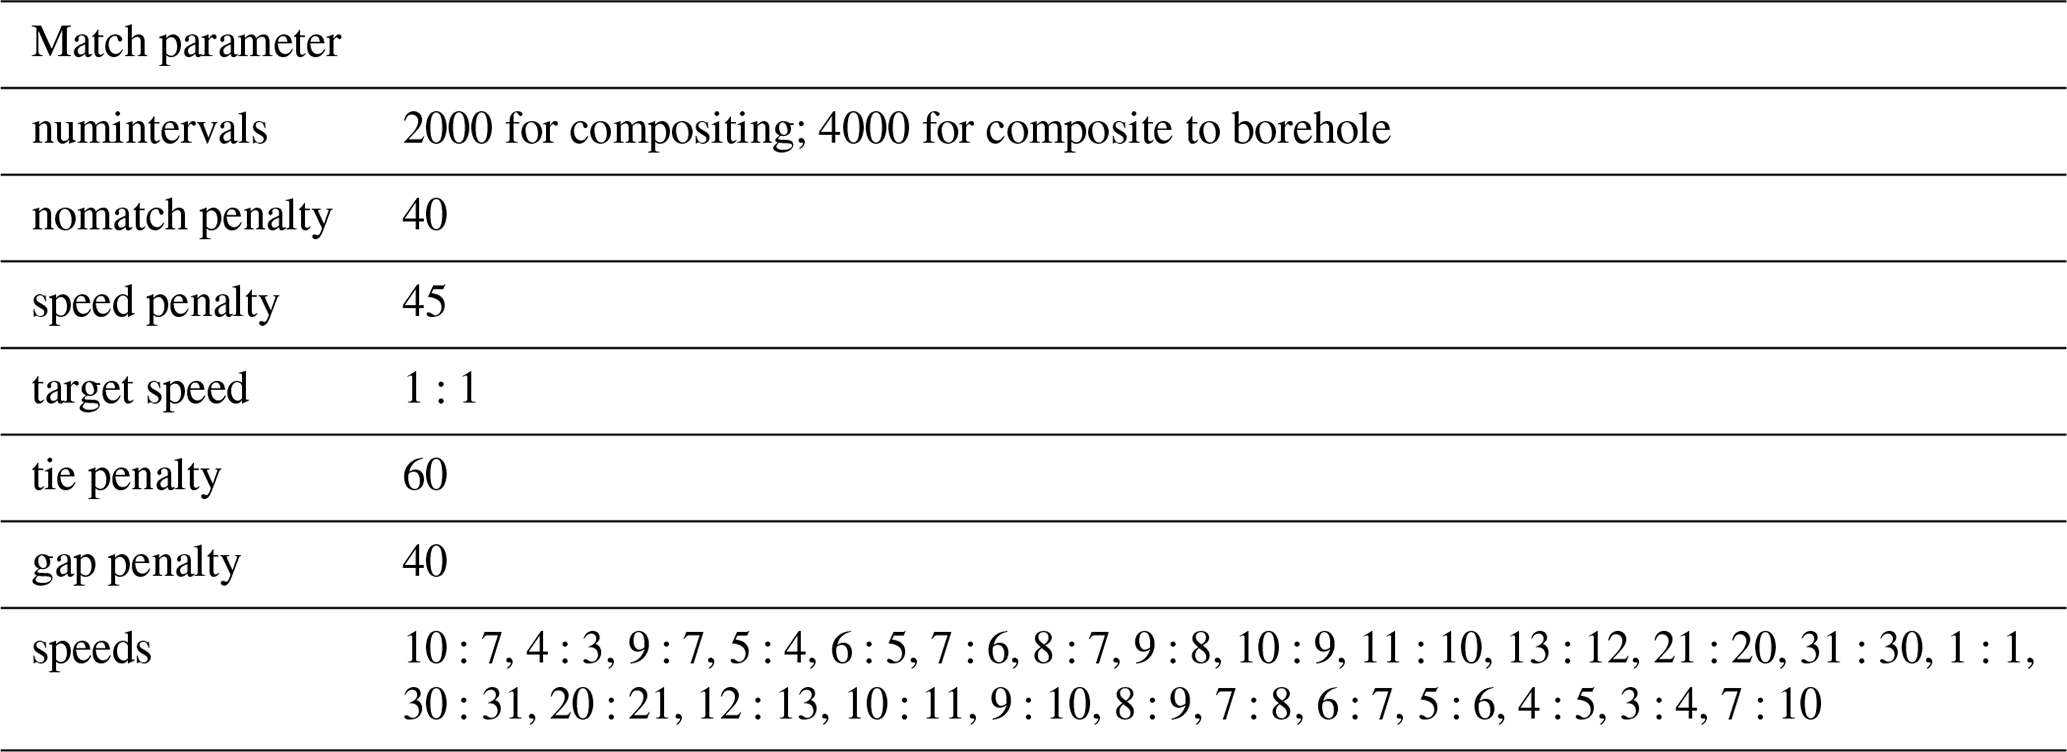
Figure 2 portrays the final alignment of individual GRAPE time series to the downhole conductivity log at Site 846. At Site 850, we produced a composite section from simultaneous alignment of GRAPE, reflectance, and magnetic susceptibility measurements at holes 850A and 850B. This composite has no downhole log reference section; however, the composite allows us to very accurately map discrete measurements between holes A and B of alkenone unsaturation and stable isotopes produced as part of the present work. Composite reflectance, GRAPE, and magnetic susceptibility (for Site 850) sections are archived at https://doi.org/10.1594/PANGAEA.931478.
2.2 Stable isotopic data
Because our initial investigation suggested an ambiguity in the composite section based on splices of holes 846D (which provides the majority of the backbone to the shipboard composite section) to 846C in the interval 95 to 181 m composite depth ( m c.d.) as defined by the shipboard scientific party (splice of 846D, core 13, to 846C, core 13, and then to 846D, core 14), we analyzed 227 new samples from Hole 846B, cores 12, 13, and 14, of which 211 yielded enough benthic foraminifera for isotope analysis at the Brown University stable isotope facility. Samples were freeze-dried, soaked in water for 24 h to disaggregate, and wet-sieved using a 150 µm mesh. Samples were then dried at 40 ∘C and split into faunal and isotope fractions. Isotope fraction vials were dry-sieved; benthic foraminifera were picked from 150–355 µm, cleaned with 70 µL ethanol, and sonified for 30 s; ethanol was drawn off with a pipette, and specimens were dried overnight at room temperature. In some cases, it was necessary to expand the size fraction to 150–355 µm to provide enough carbonate for replicate measurements. Isotope ratios were quantified at with a Finnigan MAT 252 with Carbonate Kiel III autosampler, where the individual sample is reacted with 70 ∘C H3PO4. Of the 211 intervals, 170 were analyzed at least in duplicate, and in a number of cases we were able to acquire triplicate or quadruplicate replication. We analyzed both Cibicidoides wuellerstorfi and Uvigerina peregrina (95 paired samples) and determined an average offset of 0.643 ± 0.011 ‰ (standard error of the mean) for δ18O (Uvigerina heavier) and 0.973 ‰ for δ13C (Cibicidoides heavier, ±0.018 standard error of the mean). At Site 846, we supplemented analyses with a handful (15) of measurements on Cibicidoides mundulus where C. wuellerstorfi and/or U. peregrina were not abundant enough to provide a good signal for mass spectrometry. In accordance with standard practice (Duplessy et al., 1984; Shackleton and Opdyke, 1973), Cibicidoides δ18O values were adjusted to Uvigerina values; similarly, Uvigerina carbon isotope values were adjusted to Cibicidoides. C. mundulus isotopic values were taken as equivalent to C. wuellerstorfi. Wherever replicate analyses were possible, we report results as the average.
At Site 850, we obtained 273 samples from holes A (core 7) and B (cores 6 and 7) where benthic foraminifera were sufficient for isotope analysis (we had smaller sample volumes, so the data set is less continuous than for Site 846). Replication is also less extensive (155 of 273 samples) and the proportion of C. mundulus used was higher (63 samples). Isotopic adjustments by species were handled identically to those at Site 846.
When we compared stable isotopic data acquired at Brown with values reported by Shackleton et al. (1995b) over the equivalent interval at holes 846D and C, it was evident that there was an isotope offset of 0.17 in δ18O (Brown heavier). Variance was essentially identical; therefore, we adjusted the Brown values to align with the much longer Shackleton et al. (1995b) record by adjusting the Brown δ18O values by the average difference. It is not clear that the choosing the Shackleton values is preferable on analytical grounds, but our choice allows the user to incorporate our new splice without having to adjust previously published values determined by the Shackleton et al. (1995b) study. We found no statistically significant offset between the carbon isotope values determined at Brown and the values in Shackleton et al. (1995b).
The oxygen and carbon species-specific isotopic offsets we report are identical with (δ18O) or very similar to (δ13C) the offsets used by Shackleton et al. (1995b).
2.3 Alkenone unsaturation estimates
Alkenone paleothermometry relies on the temperature dependence of the degree of unsaturation (number of double bonds) observed in the suite of organic compounds (C37:3 and C37:2 alkenones) synthesized by marine surface-dwelling haptophyte algae (Marlowe et al., 1984; Prahl and Wakeham, 1987). Alkenone extraction followed freeze-drying ∼1 g of homogenized dry sediment, using 100 % dichloromethane (DCM) and a Dionex 200 accelerated solvent extractor (ASE). Prior to quantification, extracts were evaporated with nitrogen and reconstituted with 200 µL of toluene spiked with n-hexatriacontane (C36) and n-heptatriacontane (C37) standards. Alkenone parameters were determined using an Agilent Technologies 6890 gas chromatograph–flame ionization detector (GC-FID), with an Agilent Technologies DB-1 column (60 m, 0.32 mm diameter, and 0.10 mm film thickness). The procedure entailed a 1 µL injection and initial temperature 90 ∘C, increased to 255 ∘C with a 40 ∘C/min rate, increased by 1 ∘C/min to 300 ∘C, increased by 10 ∘C/min to 320 ∘C, and an isothermal hold at 320 ∘C for 11 min. All GC analyses simultaneously provide the information to determine the U unsaturation values and an estimate of the total amount of C37 ketones by summation of the areas of the C37:2 and C37:3 alkenones. Long-term laboratory analytical error, estimated from replicate extractions and gas chromatographic analyses of a composite sediment standard, is equivalent in temperature to ±0.1 ∘C.
We analyzed a total of 249 samples from Hole 846B and 427 from holes 850A and 850B. All samples yielded adequate alkenone concentrations for unsaturation estimates. The mean U value for the interval of interest from Hole 846B of 0.896 compares very well to the average reported by Lawrence et al. (2006) from the equivalent interval of Hole 846D of 0.902, although small differences in orbital-scale peak amplitudes are observed that probably reflect small variations in gas chromatographic performance over time. For consistency to the longer Lawrence et al. (2006) record, we adjusted new U values by 0.006. To convert to estimated SST we used the global core top calibration of Müller et al. (1998).
3.1 Lessons on coring distortion
The Lisiecki and Herbert (2007) study of hydraulic piston coring relied on offset holes alone to assess distortion related to porosity rebound and coring-induced disturbance. This meant that distortion could be assessed from one hole relative to another but without a definitive undistorted reference (with the exception of reported drilling depth at the top and bottom of each core). In the present case, we can assess distortions using the Match alignment of composite sections to the presumably undistorted conductivity borehole log. Several conclusions stand out. First, there are very few instances of coring compression indicated by the Match algorithm (compression would register as a relative accumulation rate <1) (Fig. 3). Second, we can only document one instance of coring repetition, a segment of ∼40 cm at the top of 846B, core 16, consistent with the original composite section proposed by the shipboard party.
Lisiecki and Herbert (2007) found strong correlations of extension for Leg 138 sites with %CaCO3 and GRAPE density for the upper 50 m but a decreasing correlation at depth. Our mapping of each offset hole to the downhole log shows a relationship of coring distortion between the inverse of log conductivity, composite GRAPE density, and composite reflectance (not shown) over the study interval using the smoother fit option (e.g., more Match speed choices close to 1:1 between cores and the downhole log) (Fig. 3). Most of the distortions correlate between offset holes (Fig. 3), demonstrating the largely predictable coring expansion with lithological variations. In the case of these siliceous sediments, the coring distortion may also be related to lithology as well as physical properties, as zones with lower density (higher porosity) generally have high biogenic silica contents and may behave differently from carbonate-dominated lithologies during coring. While the distortion appears systematic, it somewhat counterintuitively indicates expansion of the lower-conductivity (higher-carbonate and/or lower-porosity) beds relative to lower-carbonate beds when examined in detail, although the relationship is not statistically significant (Fig. 4) and may depend on unresolved factors such as differences in the proportion of biogenic silica to detrital content in the non-carbonate fraction or to the contrast of physical properties with depth. Evaluating distortion as a function of position within each core fails to reveal systematic distortion as a function of the hydraulic piston corer (HPC) barrel penetration (Fig. 5). It therefore seems as if there is little differential distortion during the stroke of the HPC that cannot be explained by the behavior of contrasting lithologies penetrated.
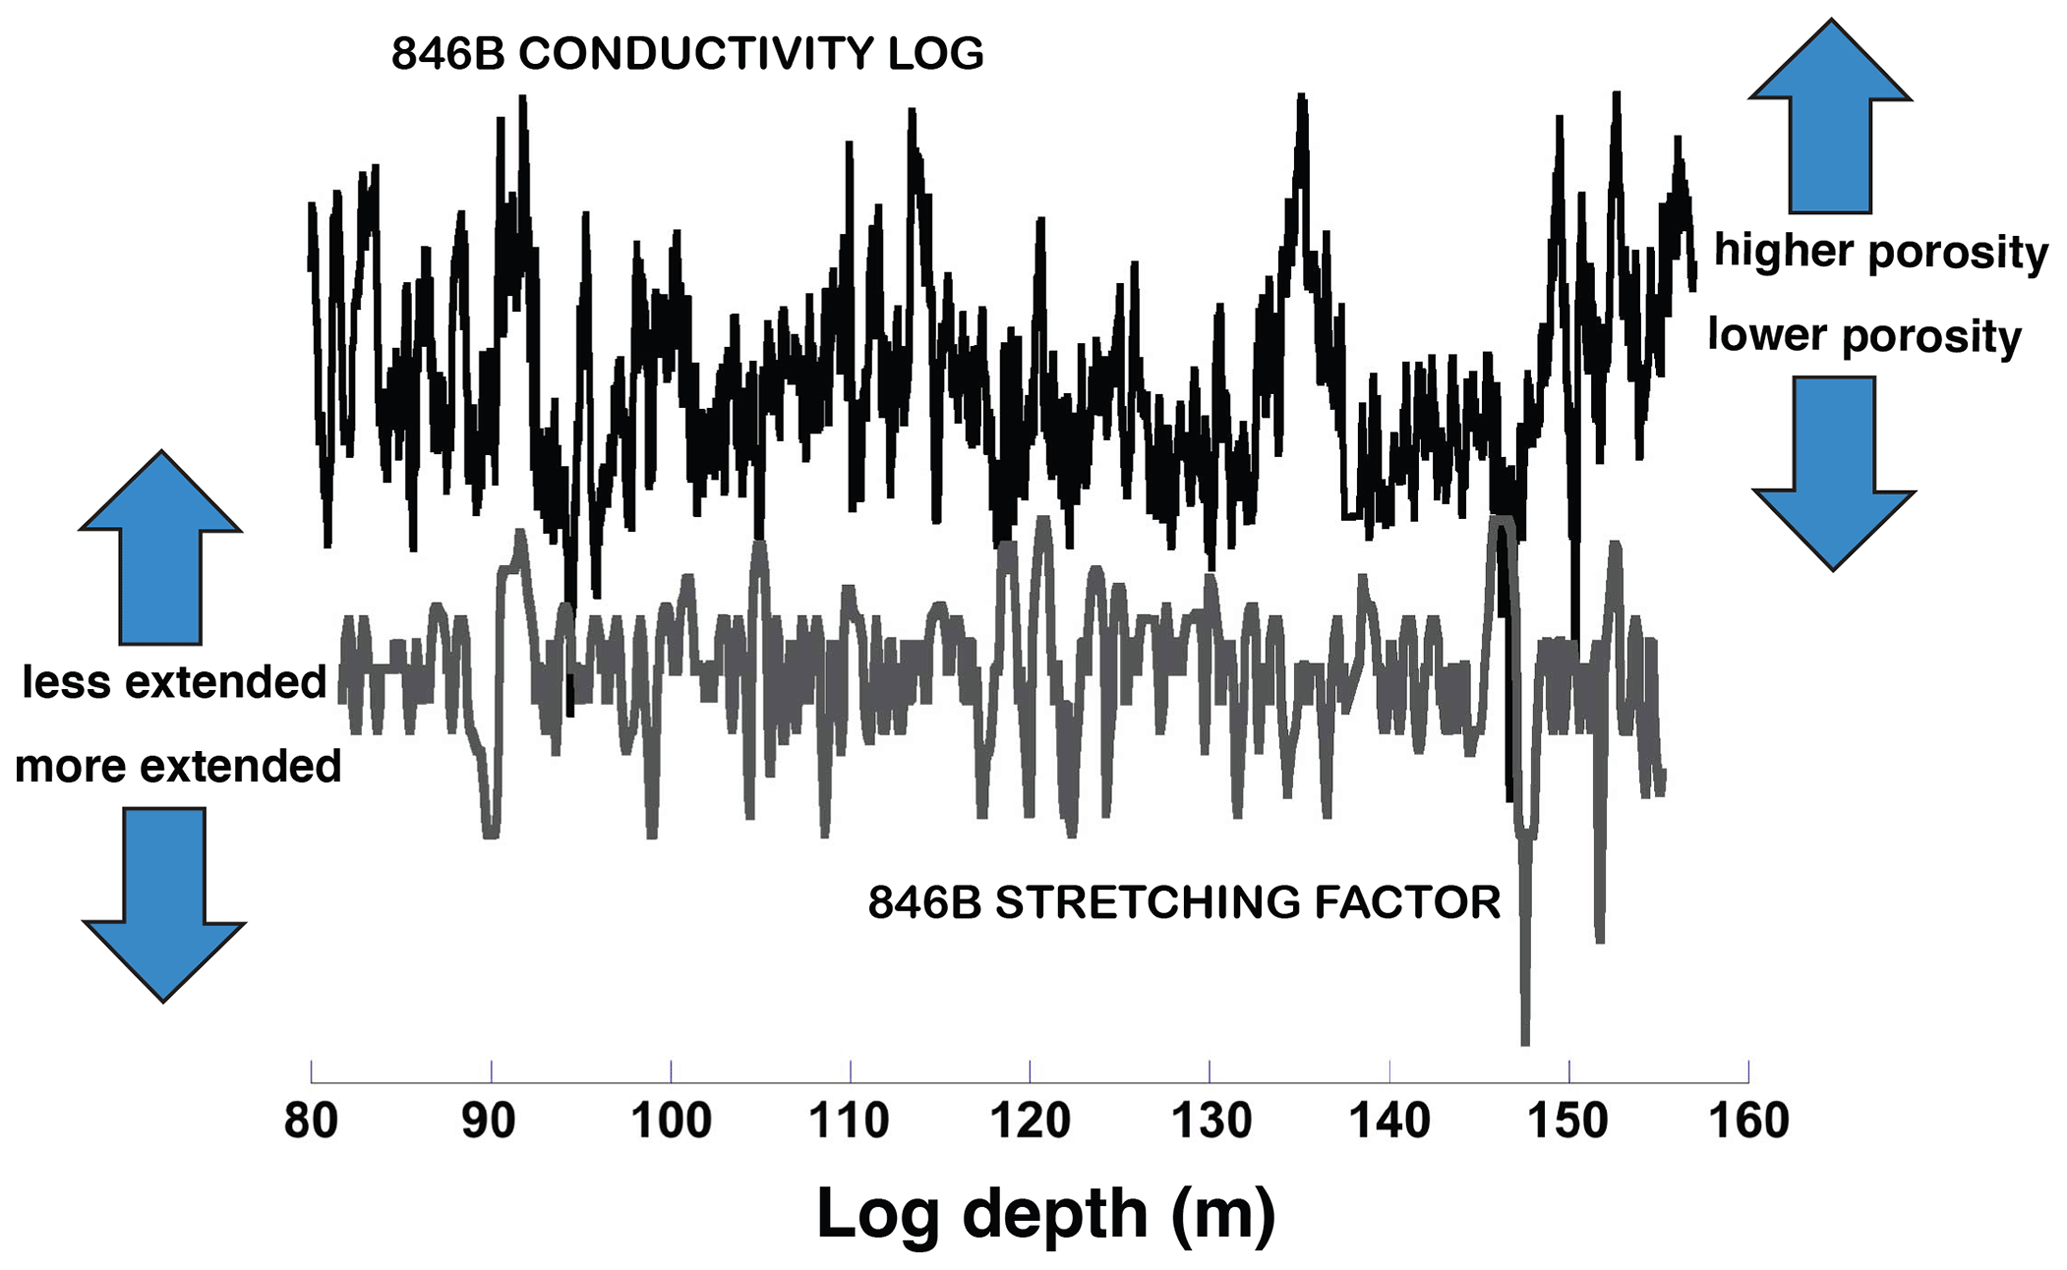
Figure 4Coring distortion inferred from Match alignment of the Hole 846B GRAPE composite section to the borehole conductivity log (conductivity data detrended and normalized) generated using the “high-resolution” Match parameters emphasizing the closest possible mapping of core data to the downhole log. Note that core stretching generally moves positively with lower-conductivity and/or porosity (higher carbonate content).
We also found that our new composites of reflectance and GRAPE density (see Supplementary Tables 2–7) compare much more favorably to the downhole log data than the prior Lisiecki and Herbert (2007) composite. We attribute the better match both to the use of a continuous log reference and to the additional splicing constraints gained from consulting stable isotopic and alkenone data. This observation highlights the importance of incorporating all available stratigraphic data to avoid mistakes in tying potentially ambiguous sections between offset holes so as to generate the most reliable composite section.
3.2 Revision of the Mammoth–Gauss and/or Gilbert equivalent section
To generate a revised composite, we used the downhole conductivity log as our reference.
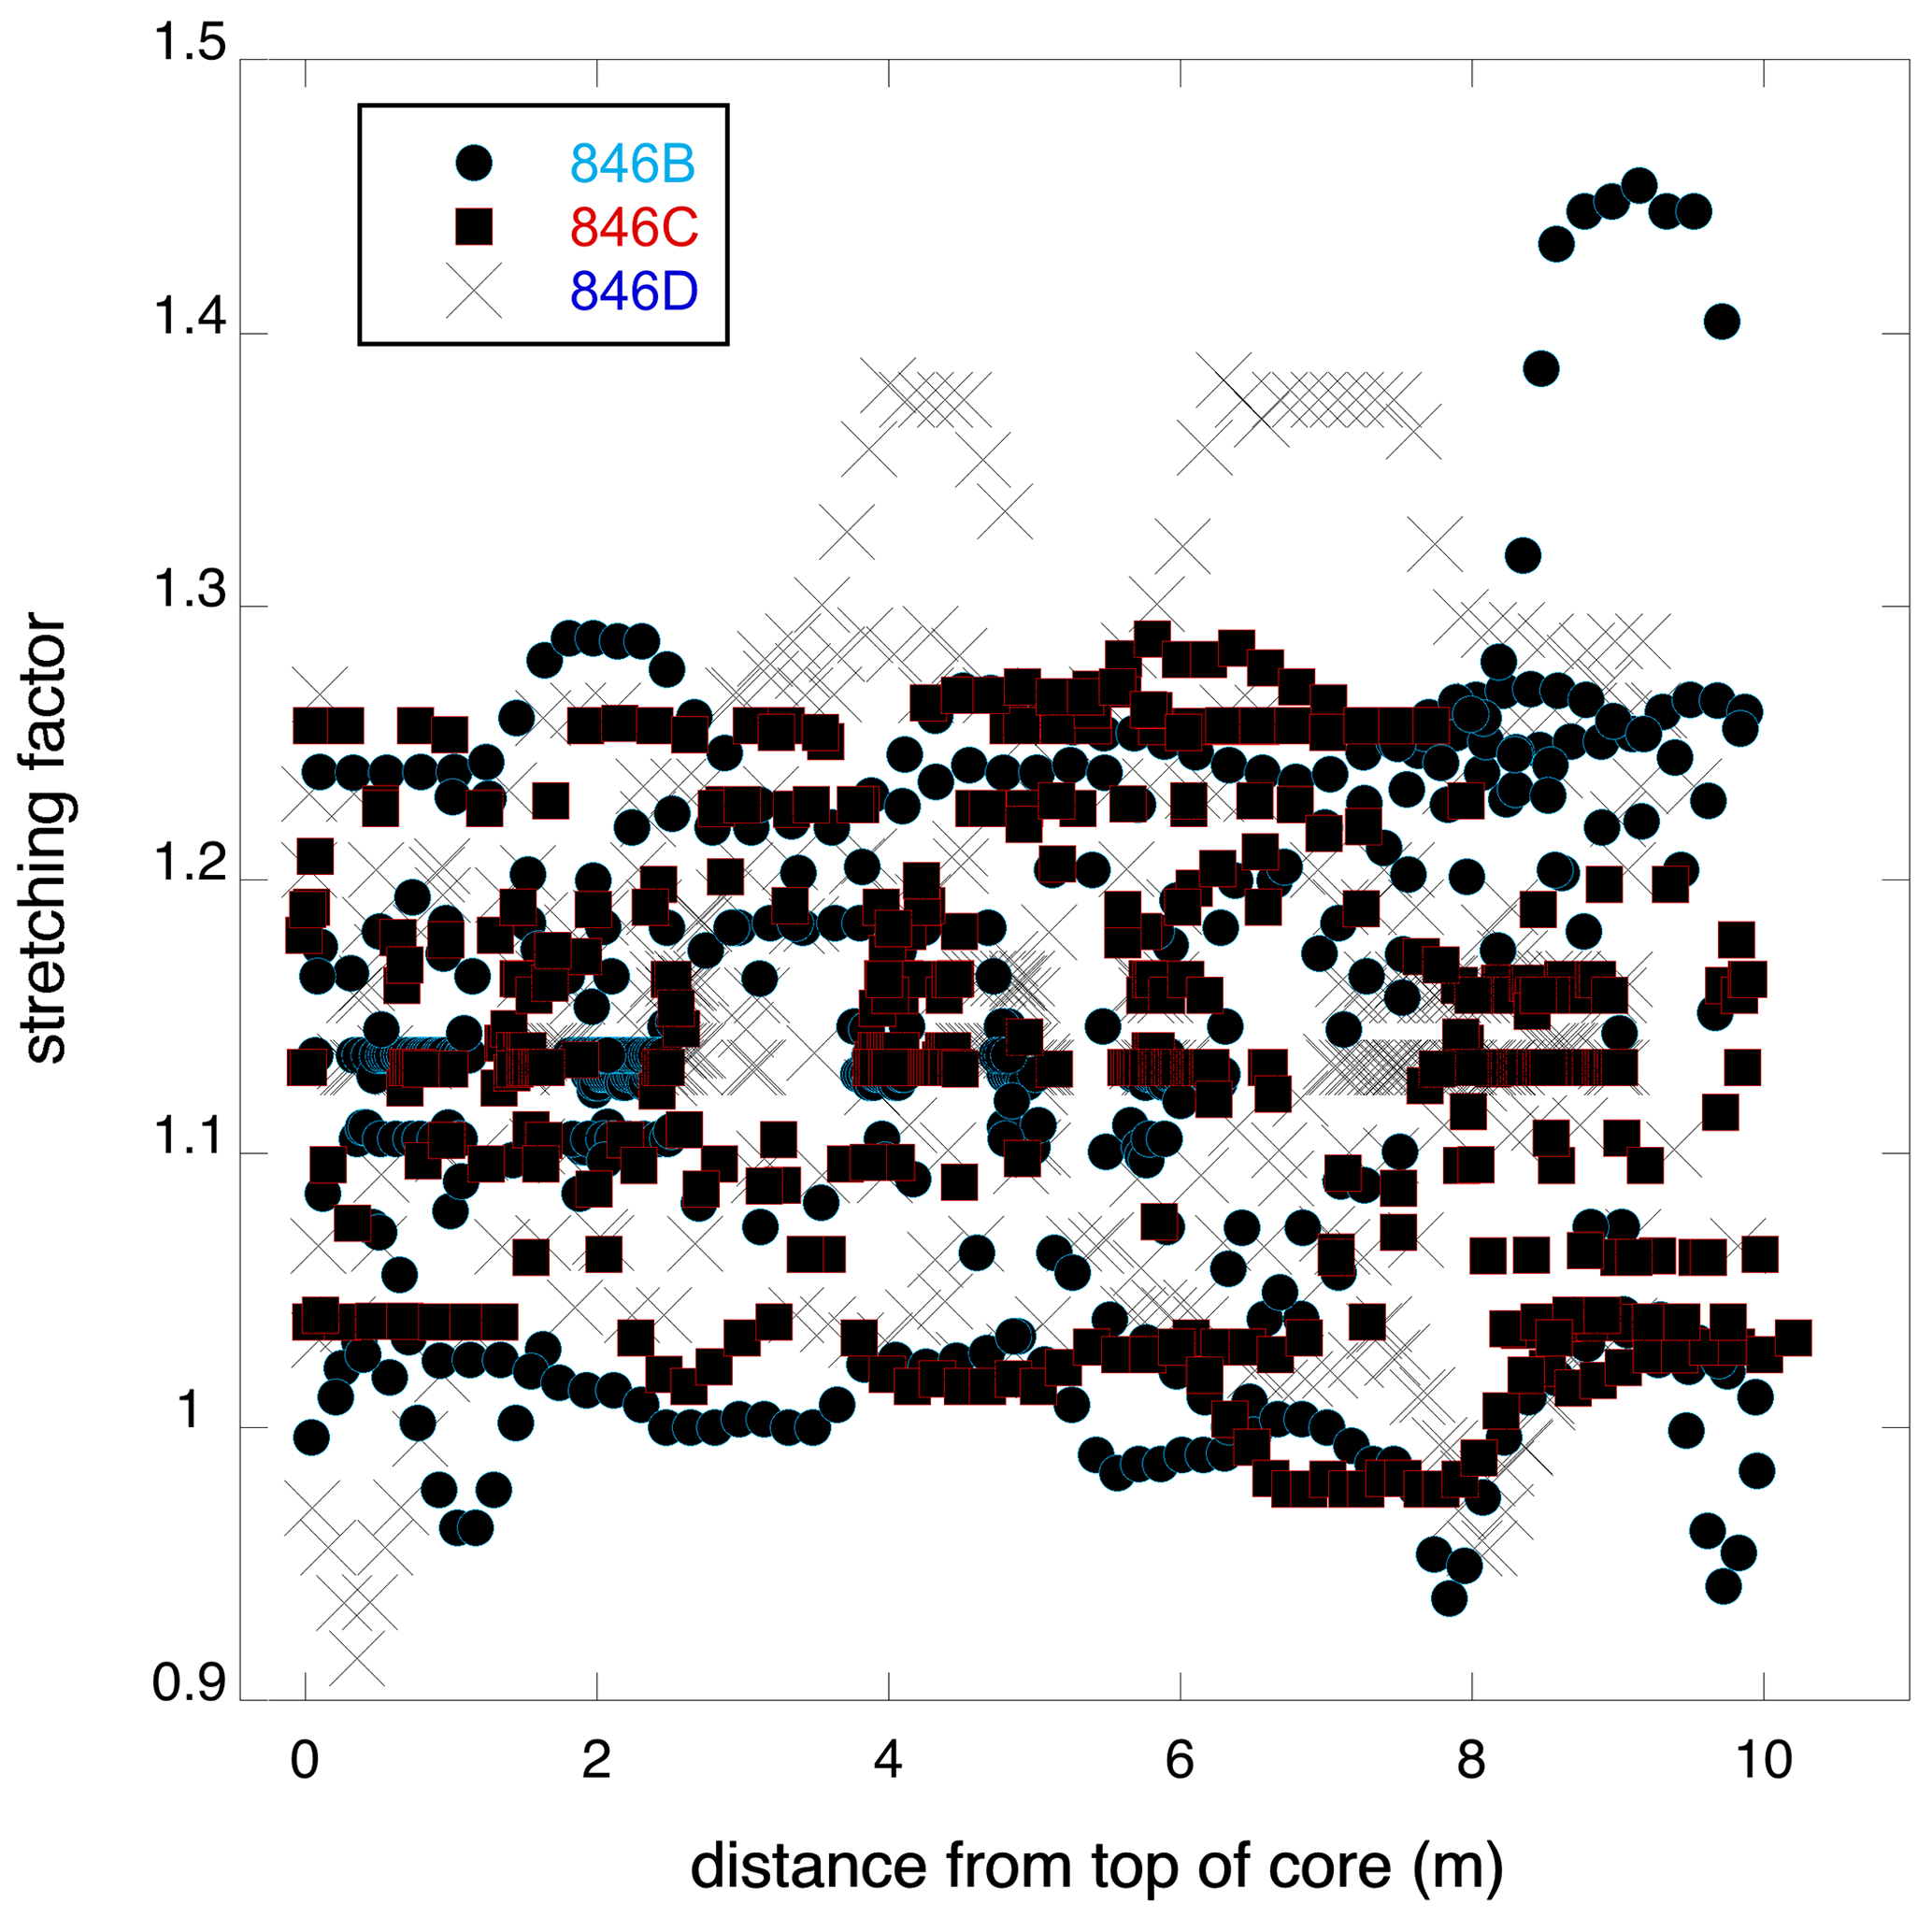
Figure 5Inferred coring distortion based on Match alignment of GRAPE composite sections to the borehole conductivity log as a function of depth in each ∼9.5 m core. Note that there is no evidence for a systematic pattern of stretching and/or squeezing as a function of penetration depth.
The Match algorithm allows a continuous mapping of reflectance and GRAPE data at offset holes 846B, 846C, and 846D with log depth as the common depth scale (Supplementary Tables 2–7). Data obtained from any of the offset holes can be correlated to this reference depth with an uncertainty on the order of 5 cm (resolution of Match alignment). The original shipboard splice links holes 846D (the primary hole used by Shackleton et al., 1995b, and followed by Lawrence et al., 2006) and 846C. As Fig. 6 demonstrates, recovery at Hole 846C entirely omits the M2 interval. We turn to Hole 846B, which contains the best representation of both the M2 interval and the subsequent interglacial recovery, to tie its record to Hole 846D. The original composite using Hole 846C does nearly completely tie the gap between cores 12 and 13 of Hole 846B, but it is extremely stretched for the last ∼2 m by coring distortion (Fig. 6). The tie lines indicated in Fig. 6 include important constraints from the GRAPE log and from our new discrete δ18O and alkenone measurements (not shown) in addition to the reflectance data displayed. Supplementary Table 8 provides the new composite section as a sequence of discrete segments from the different offset holes. Log depth again provides the new composite depth.
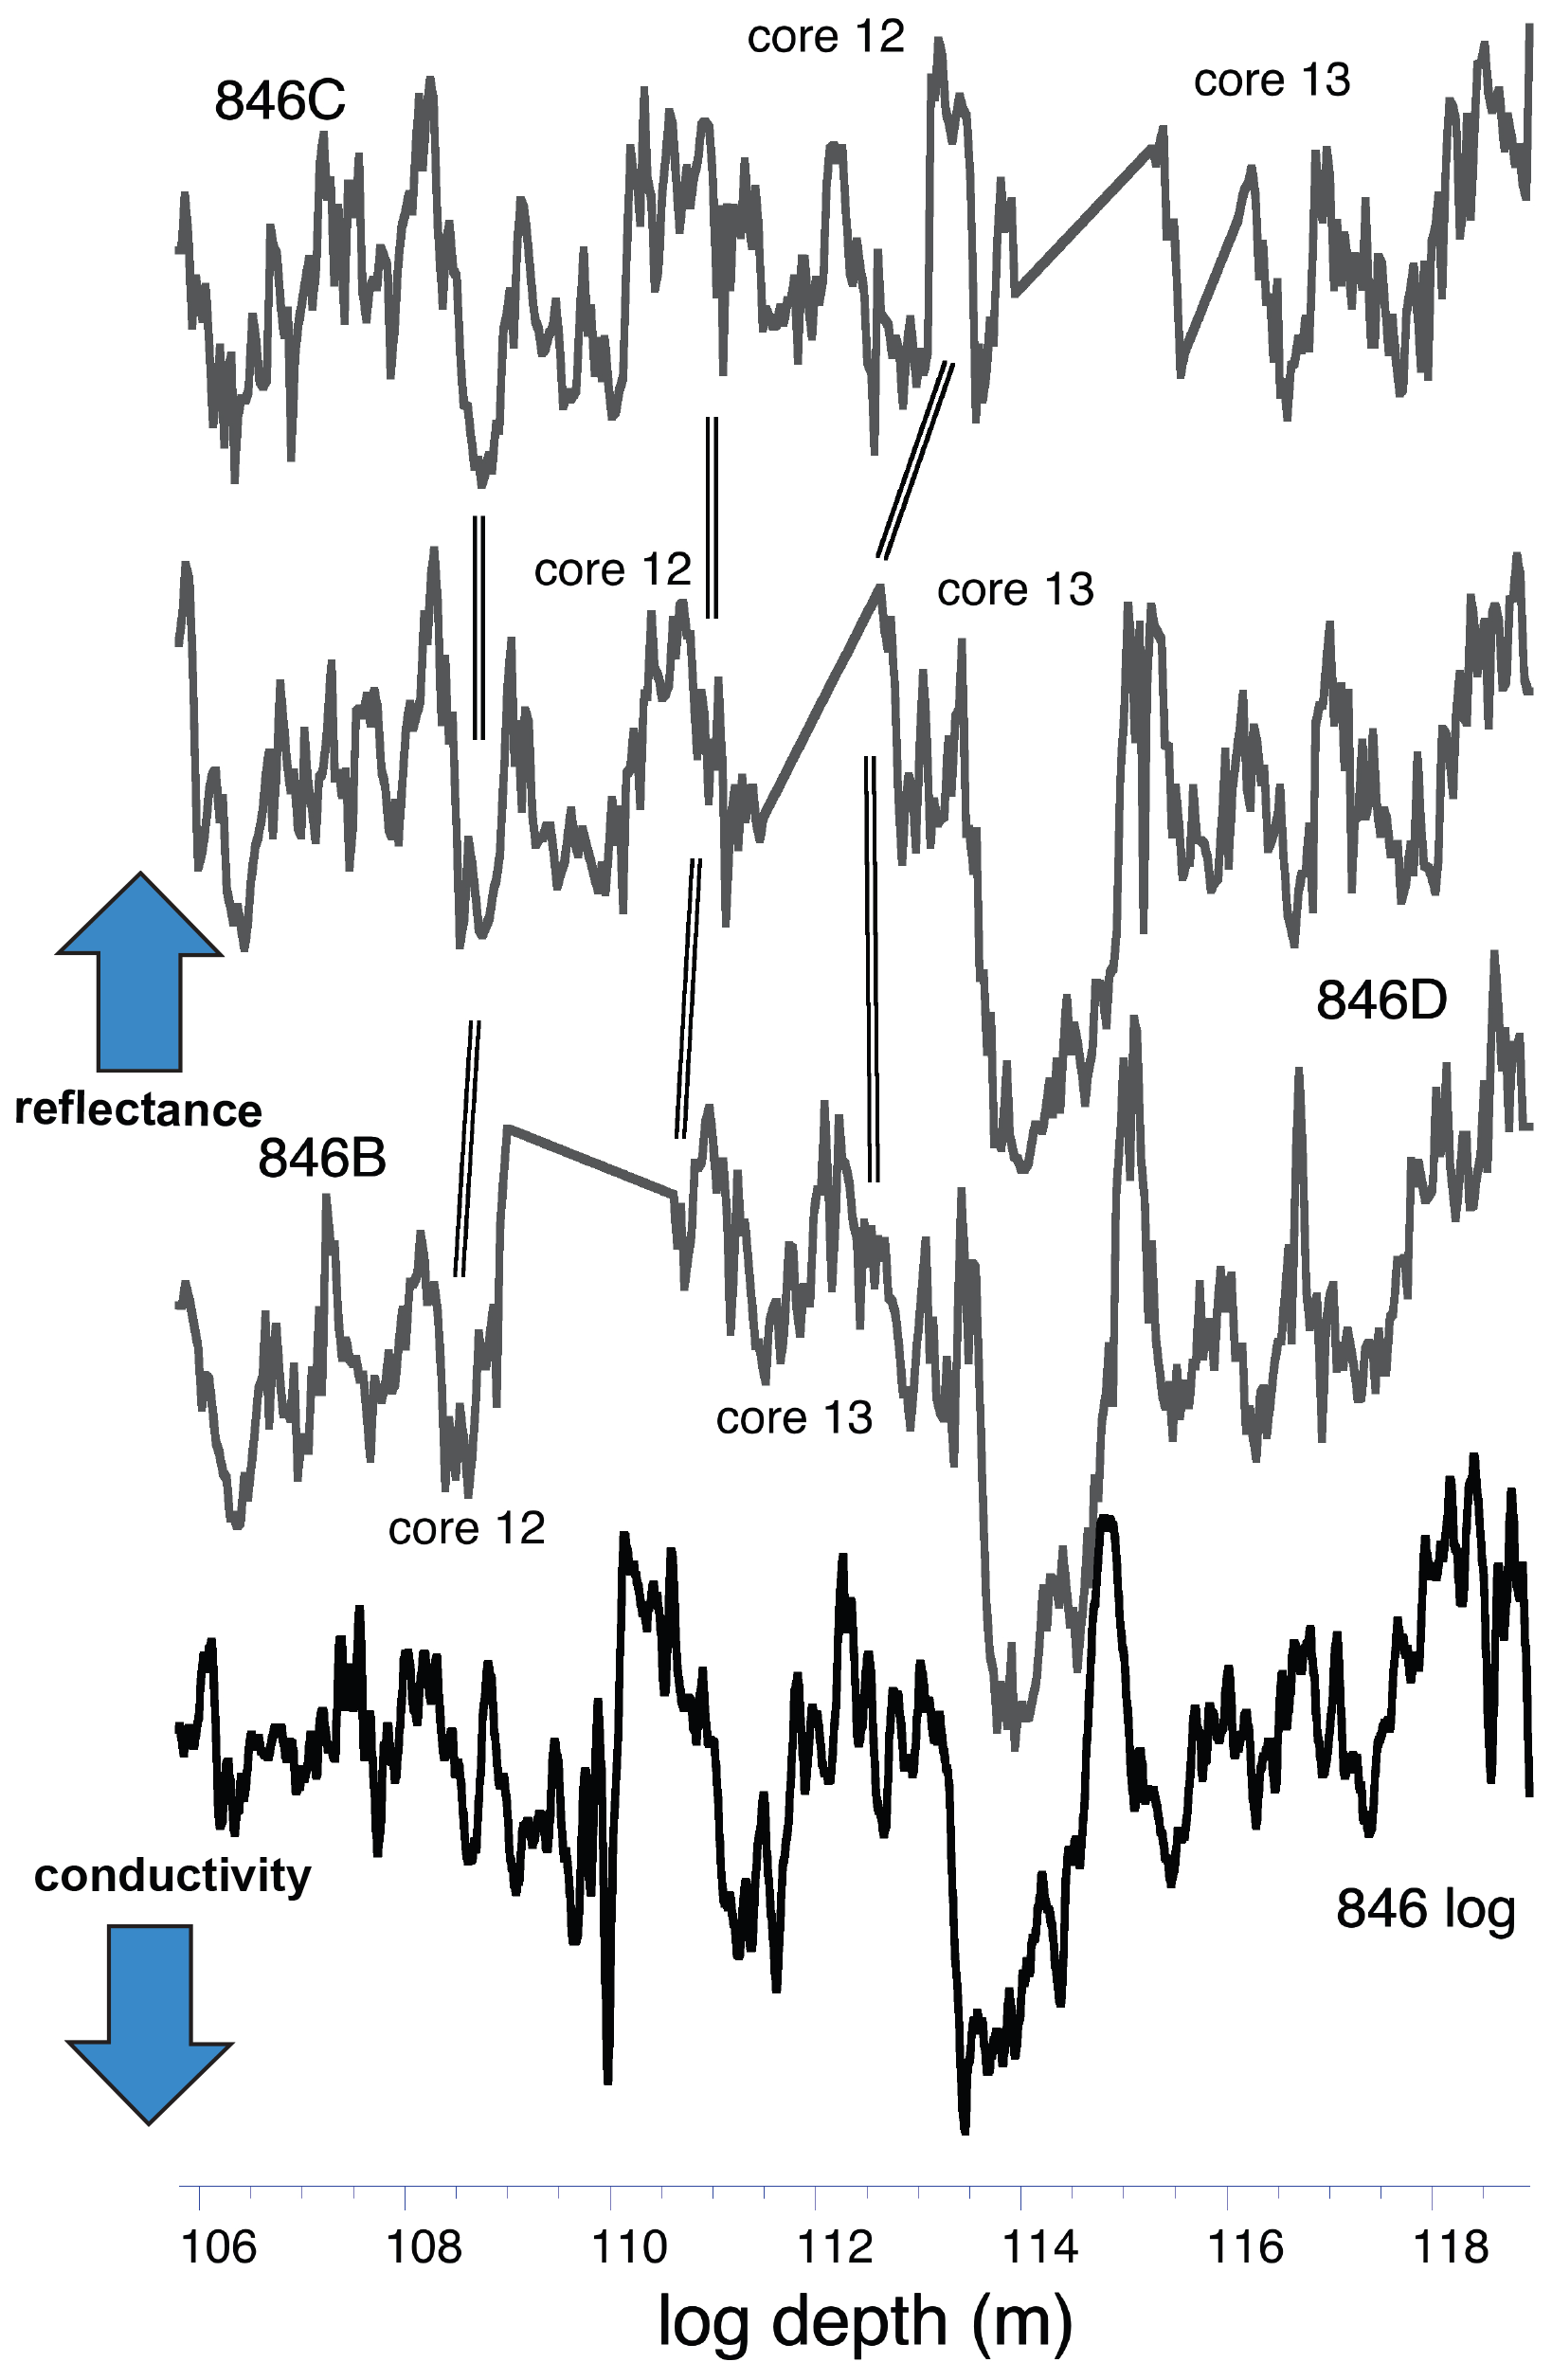
Figure 6Detail of reflectance-based correlations (originally 122.6–137.8 m c.d.) of offset holes 846B, 846C, and 846D correlated to the common depth scale of the borehole log (log depth 106–119 m). Signals were detrended and normalized; higher reflectance and lower-conductivity plot upward. Note the problematic tie of the base of Hole 846C, core 12, to the top of Hole 846D, core 13 (shipboard splice). In contrast, Hole 846B has a sequence that correlates easily to the borehole log and can be reliably spliced to the base of Hole 846D, core 12.
The original δ18O section published by Shackleton et al. (1995b) in the vicinity of the M2 glacial event seems unusual in having two distinctly separated enriched features (Fig. 7) – an anomaly that showed clearly in the original LR04 isotope stack (Fig. 9 of Lisiecki and Raymo, 2005) but that nevertheless guided the final product of that stack. Carbon isotopes (not shown) also show an anomalous depletion in the same interval. Turning to a high-resolution SST record previously generated at Site 846 (Lawrence et al., 2006), it too seems anomalous, in that a strong cooling is very short lived and does not follow the reflectance, GRAPE, and stable isotopic trends well in this particular interval (Fig. 8). As documented below, we are convinced that an error of unknown origin at Site 846 (erroneously labeled samples? Inverted core section?) has confused the stratigraphy surrounding the M2 event.
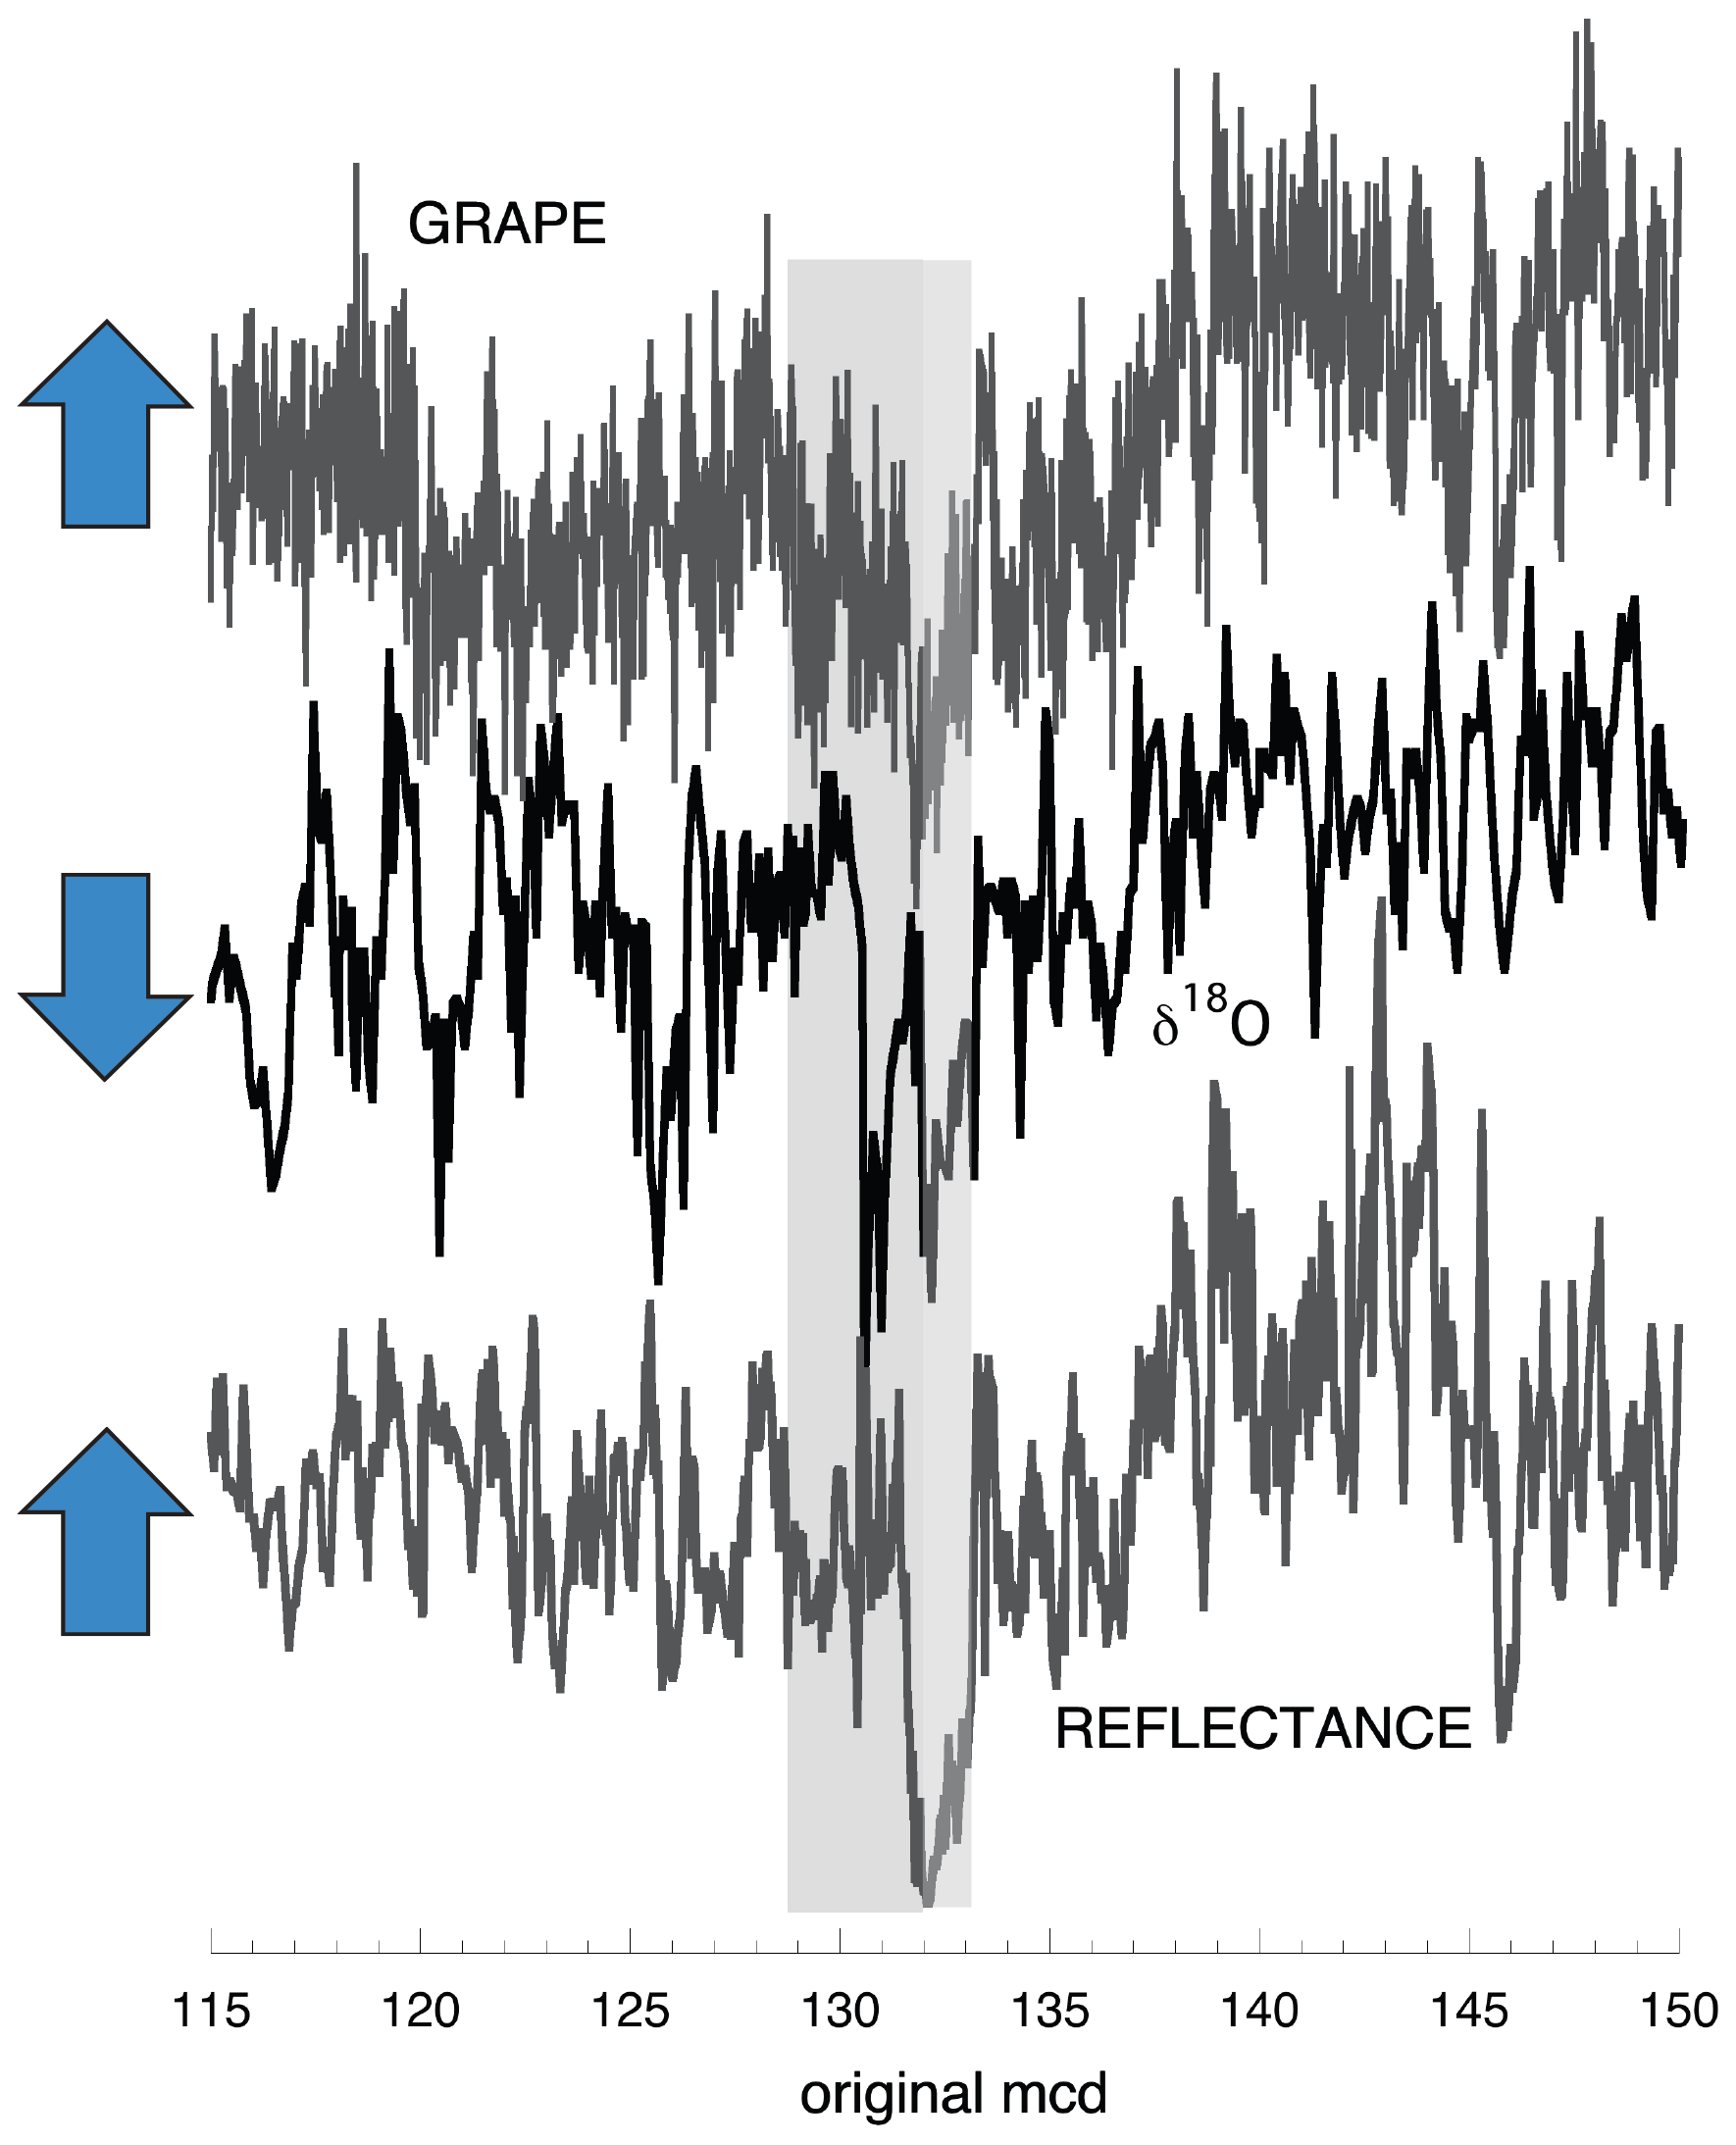
Figure 7Comparison of δ18O series of Shackleton et al. (1995b) on original composite depth (Shipboard Scientific Party, 1992) in comparison to reflectance and GRAPE data (original shipboard composite). Note the anomalous interval encompassing the M2 glacial event, indicated by gray shading where the isotopically enriched values depart from their correlation to reflectance and GRAPE values.
Both the stable isotopic and alkenone data previously generated at Hole 846D deviate in an anomalous manner relative to reflectance and GRAPE variations in the M2 interval (Figs. 7 and 8). In general, the isotopic and alkenone values align well with variations in reflectance, log conductivity, and also GRAPE bulk density at Site 846; this is the only interval we have observed with such significant deviations between proxies. In contrast, if we exclude the problematic intervals identified in Figs. 7 and 8 (specifically, stable isotope data from 846D, core 13, section 1, and alkenone data from 846D, core 13, section 2), the new composite that integrates newly generated stable isotopic and alkenone data from Hole 846B follows reflectance and log data closely through the interval containing the M2 glacial event (Figs. 9, 10). It is therefore apparent that, for unknown reasons, both previously published isotopic and alkenone data that followed the original splice in the M2 interval are not reliable. We attempted several simple fixes, such as assuming that stable isotope data from Hole 846D, core 13, section 1, were reversed in depth by a sampling error, but the data still would not align well with the new isotope section from Hole 846B or with the reflectance and GRAPE data generated on the same section at 846D. We conclude that stable isotopic data from 846D, core 13, section 1, and alkenone data from 846D, core 13, section 2, must be discarded as erroneous. In addition, the original splice from 846D, core 12, to 846C, core 12, is problematic because of what appears to be extensive coring extension at the base of core 12 at Hole 846C (Fig. 6).
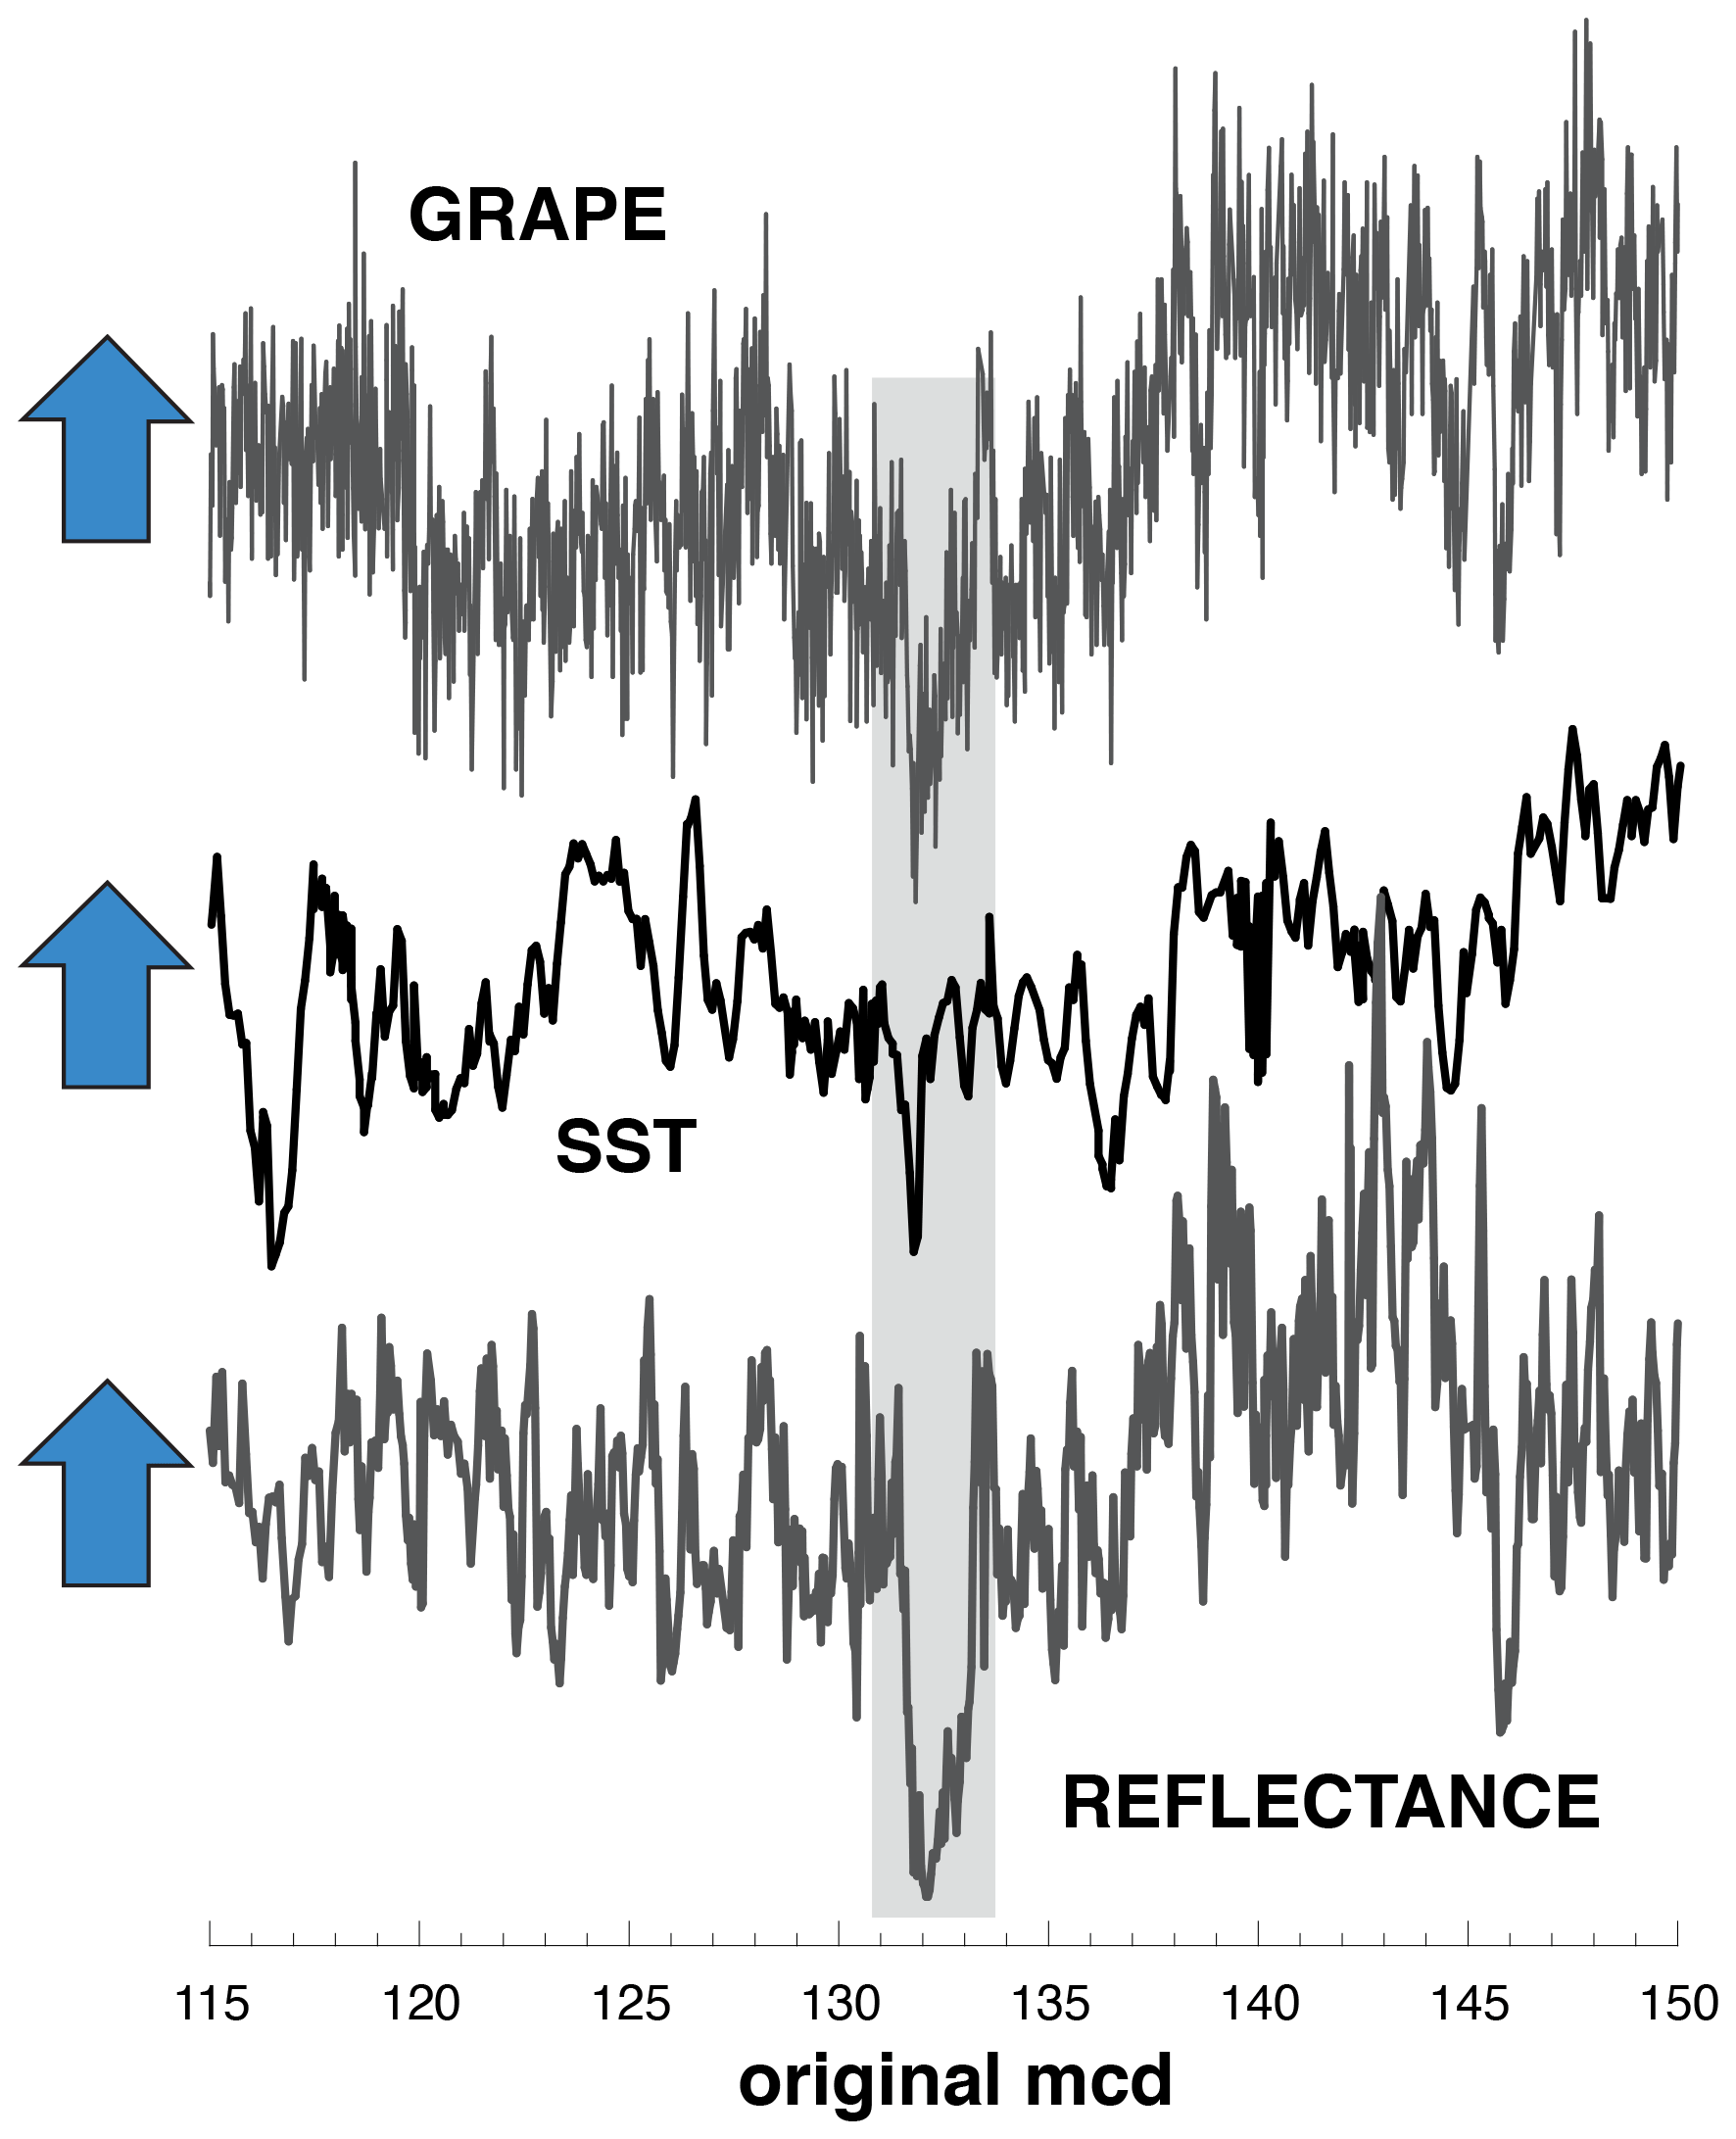
Figure 8Comparison of alkenone-based SST series of Lawrence et al. (2006) on original composite depth in comparison to detrended and normalized reflectance and GRAPE data. Note the anomalous interval indicated by gray shading where the warm SST values depart from reflectance and GRAPE values.
We can confirm the reliability of the new isotopic and SST composites at Site 846 (see Supplementary Tables 9 and 10) by comparing them to newly generated records at Site 850 (Fig. 10; Supplementary Table 11). The equivalent interval at Site 850 spans only one core break, minimizing possible uncertainties in creating a continuous composite section there. Unfortunately, the Pliocene section at Site 850 is too shallow to have had borehole logging, so we can only create a composite depth section based on coring (Supplementary Tables 12–14). Nevertheless, isotopic and reconstructed SST patterns can be matched very precisely (sample tie lines indicated in Fig. 10) between sites 846 and 850, once coring and/or sedimentation rate distortions are considered. These ties also allow us to indirectly transfer the high-quality magnetic polarity stratigraphy obtained at Site 850 to its equivalent positions at Site 846 (Fig. 10).
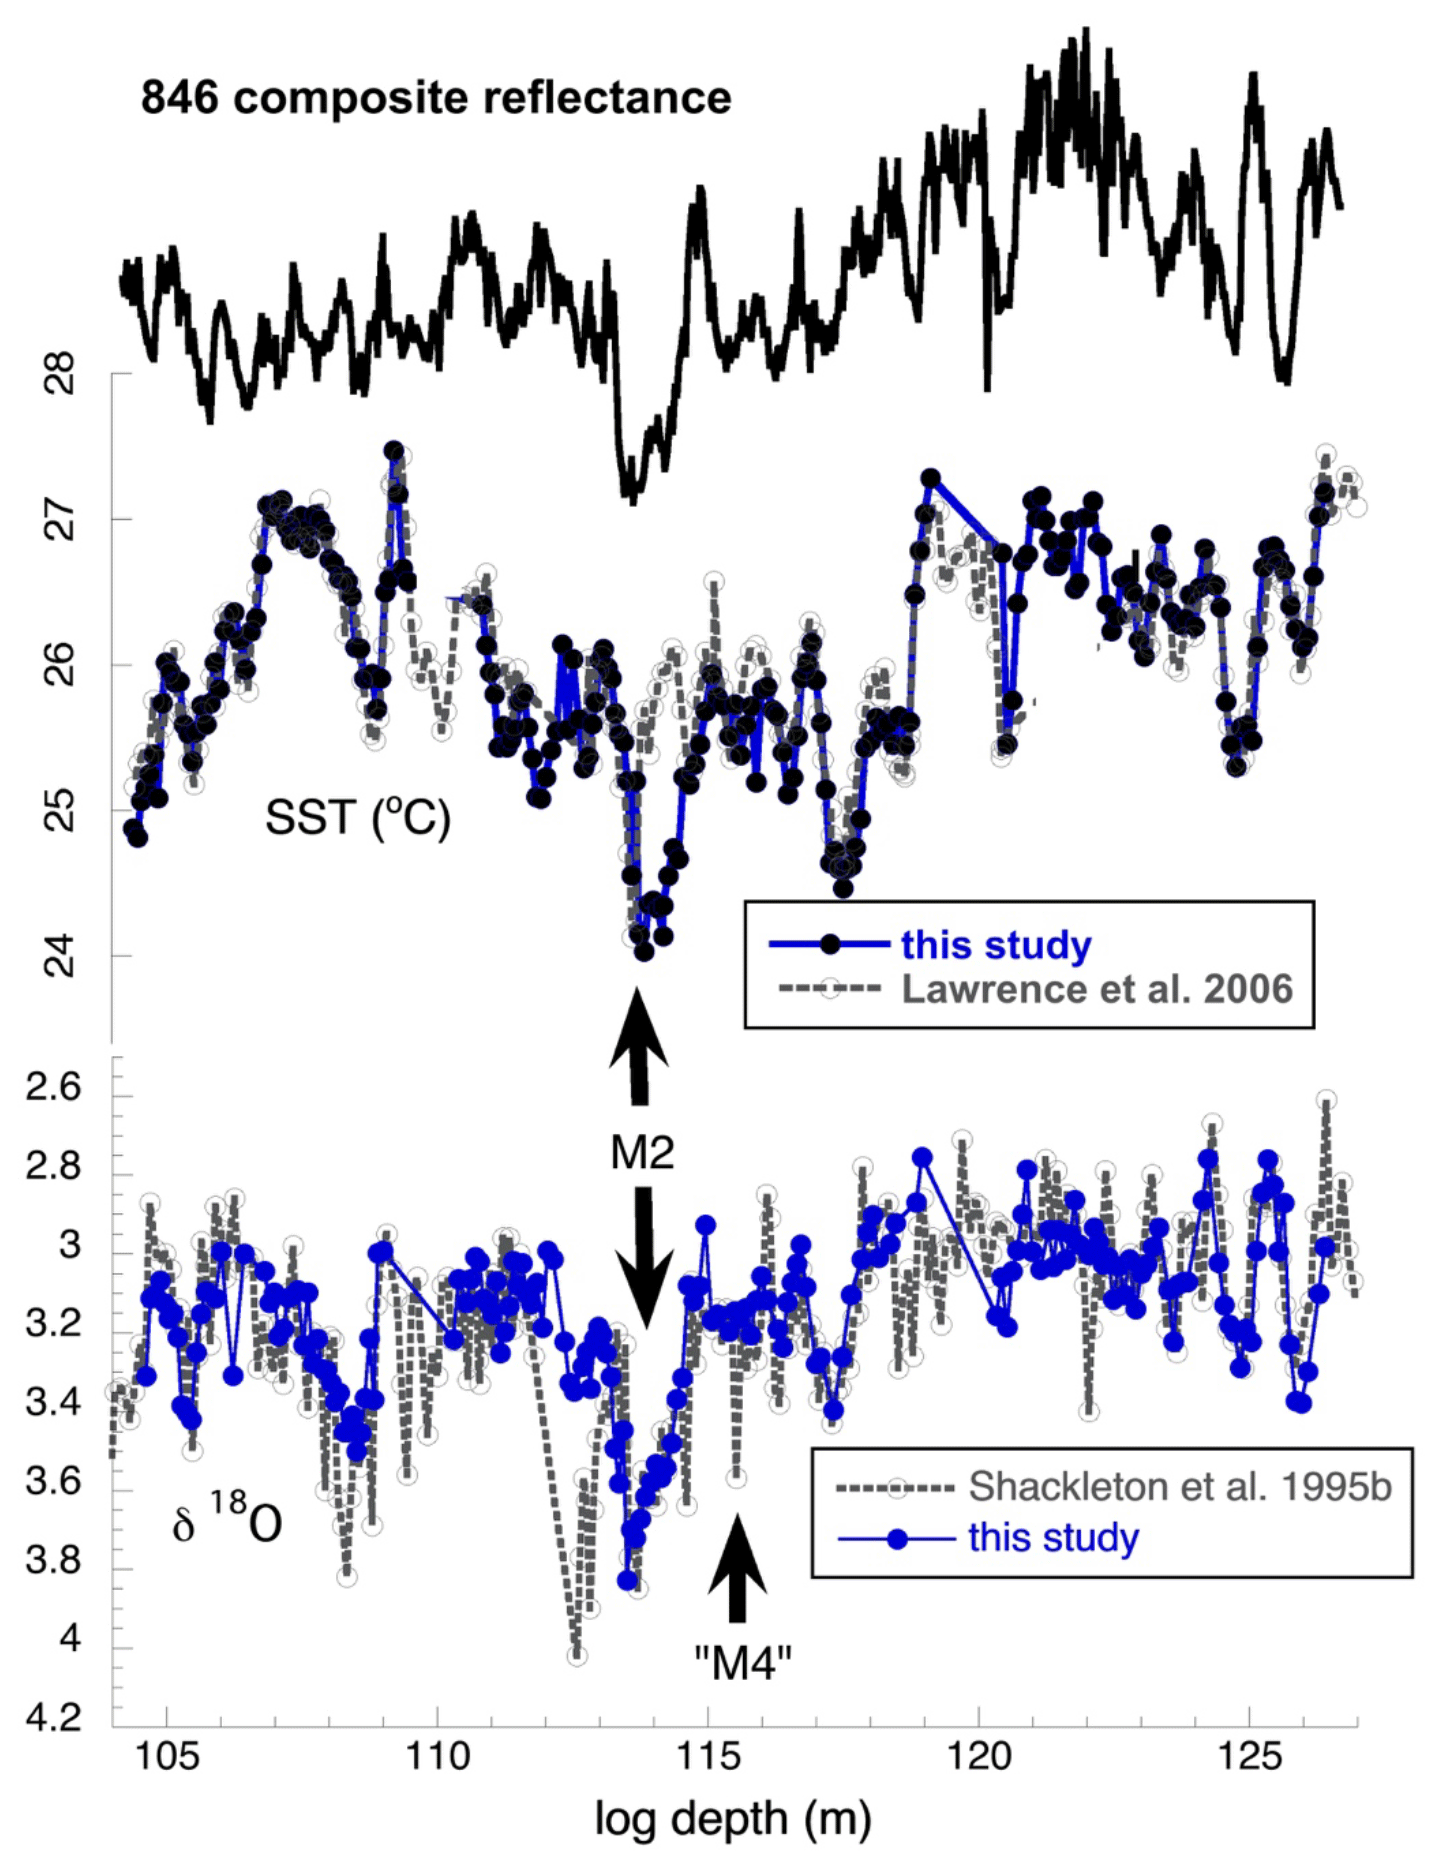
Figure 9Revised alkenone and δ18O time series based on new data from Hole 846B, aligned with prior data from Shackleton et al. (1995b) and Lawrence et al. (2006), excluding the problematic intervals around the M2 glaciation (see text). The composite section has been mapped to the borehole log depth. Previously published isotopic and alkenone data in the problematic M2 interval are shown as dashed lines. Revised composite time series now align well, and the interval containing the M2 glacial event presents as a sawtooth isotopic enrichment and cooling.

Figure 10Comparison of the new alkenone-based SST and δ18O composites from Site 846 to composites from Site 850. The location of magnetic polarity reversals (reversed Kaena, Mammoth, and Gilbert polarity zones indicated by abbreviations) at Site 850 can be mapped to Site 846 with high confidence by the close correspondence of SST patterns (note: polarity determinations are only available at Site 850).
In our new composite, we align data from offset holes to the borehole conductivity log to obtain the least distorted representation of the mid- to late Pliocene interval, focusing especially on the stratigraphy around the M2 interval. Careful analysis of the original composite section produced at Site 846 shows errors of unknown origin in the critical interval surrounding the M2 glacial event. These errors influenced the original LR04 isotopic stack and the composite tropical ocean temperature stack of Herbert et al. (2010) and persist in the recent Ahn et al. (2017) revision to LR04, although to a lesser degree as more sites have been incorporated into the new isotopic stack. In contrast to the earlier data sets from Site 846, the M2 glaciation now stands out as a long sawtooth feature of enriched δ18O and cold SST values rather than as two events separated by a significant deglaciation and/or warming. The anomalously enriched interval of the δ18O record preceding the M2 glaciation identified as MG4 in LR04 (see Fig. 9 of Lisiecki and Raymo, 2005) seems to be a one-point outlier when new isotopic information from Hole 846B is spliced into the revised composite (Fig. 9). We suggest that the new splice and composite section shown in Figs. 9 and 10 replace the previously published alkenone and stable isotope sections of Lawrence et al. (2006) and Shackleton et al. (1995b) and that this revised section (see Supplementary Tables 8 and 9) be incorporated in future stable isotope and temperature stacks. Given the expanded sedimentation rate and dense sampling resolution of stable isotopic and alkenone data at Site 846, this new composite provides one of the best representations of Pliocene paleoceanographic variability.
Composite sections of non-destructive measurements (reflectance, GRAPE wet bulk density, magnetic susceptibility, borehole conductivity log from Site 846) at sites 846 and 850 are available, with primary (hole, core, section, and centimeter depth) as well as derived (composite depth) information included. New stable isotopic and alkenone determinations at sites 846 and 850 with primary and derived (composite depth) information are also reported. All data will be available as tab-delimited text files archived on PANGAEA (https://doi.org/10.1594/PANGAEA.931478, Herbert et al., 2021).
TDH produced composite sections using the Match algorithm and wrote the bulk of the paper. All authors contributed to paper revision. RCG produced alkenone SST estimates at sites 846 and 850 and helped in the construction of composite sections. JBN picked foraminiferal samples for stable isotopic analysis and supervised running samples at the Brown Stable Isotope Facility.
The authors declare that they have no conflict of interest.
N. S. F. grants OCE-1459280 and PIRE-1545859 supported Timothy D. Herbert and Rocio Caballero-Gill during this project; stable isotopic analyses and alkenone analyses were also supported by Harry J. Dowsett of the U.S. Geological Survey. The authors gratefully acknowledge the curators of the Integrated Ocean Drilling Program for providing samples from ODP sites 846 and 850.
This research has been supported by the US National Science Foundation (grant no. OCE-1459280).
This paper was edited by Arne Winguth and reviewed by Mitch Lyle and one anonymous referee.
Ahn, S., Khider, D., Lisiecki, L. E., and Lawrence, C. E.: A probabilistic Pliocene–Pleistocene stack of benthic δ18O using a profile hidden Markov model, Dynamics and Statistics Climate Sys., 2, dzx002, https://doi.org/10.1093/climsys/dzx002, 2017.
Dowsett, H.: The PRISM palaeoclimate reconstruction and Pliocene sea-surface temperature in Deep-time perspectives on climate change: Marrying the signal from computer models and biological proxies, edited by: Williams, M., Haywood, A. M., Gregory, F. J., and Schmidt, D. N., The Geological Society, Micropaleontological Society Special Publications, London, United Kingdom, 459–480, 2007.
Duplessy, J.-C., Shackleton, N. J., Matthews, R. K., Prell, W., Ruddiman, W. F., Caralp, M., and Hendy, C. H.: 13C record of benthic foraminifera in the last interglacial ocean: implications for the carbon cycle and the global deep water circulation, Quaternary Res., 21, 225–243, 1984.
Hagelberg, T. K., Pisias, N. G., Shackleton, N. J., Mix, A. C., and Harris, S. E.: Refinement of a high-resolution, continuous sedimentary section for studying equatorial Pacific Ocean paleoceanography Leg 138, in: Proceedings of the Ocean Drilling Program, edited by: Pisias, N. G., Mayer, L. A., Janecek, T. R., Palmer-Julson, A., and van Andel, T. H., Scientific Results, 138, 31–46, 1995.
Harris, S. E., Shackleton, N. J., Hagelberg, T. K., Pisias, N. G., and Mix, A. C.: Sediment depths determined by comparison of grape and logging density data during Leg 138, in: Proceedings of the Ocean Drilling Program, edited by: Pisias, N. G., Mayer, L. A., Janecek, T. R., Palmer-Julson, A., and van Andel, T. H., Scientific Results of the Proceedings of the Ocean Drilling Program, vol. 138, College Station, TX (Ocean Drilling Program), 47–57, 1995.
Herbert, T. D., Cleaveland Peterson, L., Lawrence, K. T., and Liu, Z.: Tropical ocean temperature over the past 3.5 million years, Science, 328, 1530–1534, 2010.
Herbert, T. D., Caballero-Gill, R. P., and Novak, J. B.: Revised late Pliocene composite section for ODP Site 138–846, PANGAEA [data set], https://doi.org/10.1594/PANGAEA.931478, 2021.
Lawrence, K. T., Liu, Z., and Herbert, T. D.: Evolution of the eastern tropical Pacific through Plio-Pleistocene glaciation, Science, 312, 79–83, 2006.
Lisiecki, L. E. and Herbert, T. D.: Automated composite depth scale construction and estimates of sediment core extension, Paleoceanography, 22, PA4213, https://doi.org/10.1029/2006PA001401, 2007.
Lisiecki, L. E. and Lisiecki, P. A.: Application of dynamic programming to the correlation of paleoclimate records, Paleoceanography, 17, 1049, https://doi.org/10.1029/2001PA000733, 2002.
Lisiecki, L. E. and Raymo, M. E.: A Pliocene-Pleistocene stack of 57 globally distributed benthic δ18O records, Paleoceanography, 20, PA1003, https://doi.org/10.1029/2004PA001071, 2005.
Marlowe, I., Green, J., Neal, A., Brassell, S., Eglinton, G., and Course, P.: Long chain (n-C37–C39) alkenones in the Prymnesiophyceae. Distribution of alkenones and other lipids and their taxonomic significance, British Phycol. J., 19, 203–216, 1984.
Mix, A. C., Harris, S. E., and Janecek, T. R.: Estimating lithology from nonintrusive reflectance spectra: Leg 138, in: Proceedings of the Ocean Drilling Program, Scientific Results, edited by: Pisias, N. G., Mayer, L. A., Janecek, T. R., Palmer-Julson, A., and van Andel, T. H., Scientific Results of the Proceedings of the Ocean Drilling Program, vol. 138, College Station, TX (Ocean Drilling Program), 413–428, 1995.
Mudelsee, M. and Raymo, M. E.: Slow dynamics of the Northern Hemisphere glaciation, Paleoceanography, 20, PA4022, https://doi.org/10.1029/2005PA001153, 2005.
Müller, P. J., Kirst, G., Ruhland, G., von Storch, I., and Rosell-Melé, A.: Calibration of the alkenone paleotemperature index U based on core-tops from the eastern South Atlantic and the global ocean (60∘ N–60∘ S), Geochim. Cosmochim. Ac., 62, 1757–1772, 1998.
Prahl, F. G. and Wakeham, S. G.: Calibration of unsaturation patterns in long-chain ketone compositions for paleotemperature assessment, Nature, 330, 367–369, 1987.
Shackleton, N., Crowhurst, S., Hagelberg, T., Pisias, N., and Schneider, D.: A new Late Neogene time scale: application to Leg 138 sites, in: Proceedings of the Ocean Drilling Program, Scientific Results, edited by: Pisias, N. G., Mayer, L. A., Janecek, T. R., Palmer-Julson, A., and van Andel, T. H., vol. 138, College Station, TX (Ocean Drilling Program), 73–101, 1995a.
Shackleton, N., Hall, M. A., and Pate, D.: Pliocene stable isotope stratigraphy of Site 846, Proceedings of the Ocean Drilling Program, Scientific Results, edited by: Pisias, N. G., Mayer, L. A., Janecek, T. R., Palmer-Julson, A., and van Andel, T. H., Scientific Results of the Proceedings of the Ocean Drilling Program, vol. 138, College Station, TX (Ocean Drilling Program), 337–355, 1995b.
Shackleton, N. J., and Opdyke, N. D.: Oxygen isotope and palaeomagnetic stratigraphy of Equatorial Pacific core V28-238: Oxygen isotope temperatures and ice volumes on a 105 year and 106 year scale, Quaternary Res., 3, 39–55, 1973.
Shipboard Scientific Party: Site 846, in: Initial Reports Ocean Drill. Progr., edited by: Mayer, L., Pisias, N., and Janecek, T., vol. 138, 265–333, 1992.