the Creative Commons Attribution 4.0 License.
the Creative Commons Attribution 4.0 License.
 | 14 Jan 2021
Evaluating the utility of qualitative personal diaries in precipitation reconstruction in the eighteenth and nineteenth centuries
Alice Harvey-Fishenden
Neil Macdonald
To date few studies have reconstructed weather from personal diaries (also known as private diaries). In this paper, we consider different methods of indexing daily weather information, specifically precipitation, from eighteenth and nineteenth-century personal diaries. We examine whether there is a significant correlation between indexed weather information and local instrumental records for the period, thereby assessing the potential of discursive materials in reconstructing precipitation series. We demonstrate the potential for the use of diaries that record weather incidentally rather than as the primary purpose, and the value and utility of diaries covering short periods when used alongside nearby contemporary diaries. We show that using multiple overlapping personal diaries can help to produce a more objective record of the weather, overcoming some of the challenges of working with qualitative data. This paper demonstrates indices derived from such qualitative sources can create valuable records of precipitation. There is the potential to repeat the methodology described here using earlier material or material from further away from extant instrumental records, thereby addressing spatial and temporal gaps in current knowledge globally.
- Article
(5993 KB) - Full-text XML
- BibTeX
- EndNote


There has been an increased recognition in recent years of the value of long instrumental series spanning several centuries (Brönnimann et al., 2019; Dobrovolný et al., 2010; Todd et al., 2015), as they can provide valuable information on both climate variability (Murphy et al., 2018) and sensitivities in early records and long-term reconstructions (Murphy et al., 2020). Long series also provide value through increased robustness in back casting in climate model testing (Talento et al., 2019), extreme event contextualisation (Todd et al., 2015; Wetter et al., 2014), and for examining social and cultural changes and modifications (Pfister et al., 2010). This increased recognition has coincided with public science projects that have seen extensive archival materials transcribed and reanalysed through both national and international programmes and initiatives (e.g. ACRE) (Allan et al., 2016; Brohan et al., 2009).
Whilst the focus has been on identifying instrumental datasets, considerable information is stored within qualitative archival source materials (Strauss and Orlove, 2003). These, however, can be more challenging to analyse using citizen science approaches. Such descriptive materials incorporate valuable information detailing not just the weather but also human interactions with the weather and wider environment, documenting social, cultural, and economic responses to past extremes. In addition, they may also offer insights and information on activities undertaken during mundane intervening phases that either exacerbate or mitigate the hazards and risks presented to communities during extremes.
There have been many studies globally of weather diaries, where the diary is predominantly if not solely concerned with the weather (for example Brázdil et al., 2019a; Domínguez-Castro et al., 2015; Druckenbrod et al., 2003; Gergis et al., 2012; Mikami, 2008; Sanderson, 2018; Walsh et al., 1999). An early example is the weather diary kept in 1337–1344 by William Merle in Oxford, England (Lawrence, 1972). Other diaries document the weather alongside related information, such as tides (Woodworth, 2006). To date few studies have reconstructed weather from personal diaries, where the weather is not the focus of the document but rather noted as an aside (often daily). Where personal diaries have been considered authors have often chosen to simply extract and present the weather data as they appear in the diary (Adamson, 2015; Schove and Reynolds, 1973). However, there are some exceptions to this. For example, Chen et al. (2020) analysed the weather from a fourteenth-century private diary from Jiangsu Province, China, whilst Kelso and Vogel (2007) and Nash and Grab (2010) used diaries and correspondence from South Africa to examine rainfall and drought. The depth and quality of descriptive materials have long been recognised within the historiographical and geographical disciplines (Oliver, 1958) but have to some extent been shunned within the physical sciences, though they have received increased recognition in recent years (Sangster et al., 2018). The sciences often present a preference for “instrumental” information because of concerns relating to quality, replicability, and comparability of content within discursive materials; as Adamson (2015) notes, weather recording in personal diaries can lack rigour, be sporadic, and be affected by the identity, personality, and beliefs of the writer. However, the potential of qualitative materials is considerable, and indices derived from qualitative materials have been shown to offer good correlations, comparable to adjacent instrumental series (Macdonald et al., 2010), and have previously been used for filling gaps in instrumental rainfall data. The potential of such sources is considerable, presenting opportunities to extend further back in time and cover areas poorly represented by instrumental information.
The series presented in this paper correspond to time periods when two diarists are writing from similar locations and therefore offers the opportunity to test whether having multiple diarists recording simultaneously can between them produce a more objective record of the weather. Using multiple overlapping personal diaries may help to counteract potential biases within personal diaries and therefore provide a more reliable weather record. This differs from previous studies, which have often focused on either a single diary (Lawrence, 1972; Sanderson, 2018) or used multiple diaries for the purpose of extending the temporal time frame (Walsh et al., 1999). We consider different methods of indexing daily weather and examine whether there is a significant correlation between indexed weather information and local instrumental records for the period, thereby assessing the potential of discursive materials in reconstructing weather series.
Over 70 years of daily qualitative weather data between 1770 and 1865 for the UK were identified from diaries, letters, and similar sources at the Staffordshire Record Office, with a wide spatial and temporal extent (details of archival sources used in this reconstruction can be found at the beginning of the reference list). The longest near continuous (daily) series in the materials collected were for Scotland 1790–1794, London 1794–1795 and 1797–1801, and Trentham in Staffordshire mid-1816–1865 (Fig. 1). The majority of the daily weather data were derived from personal diaries. These do not formally record daily weather but rather describe daily life, incidentally referring to the weather (particularly precipitation).
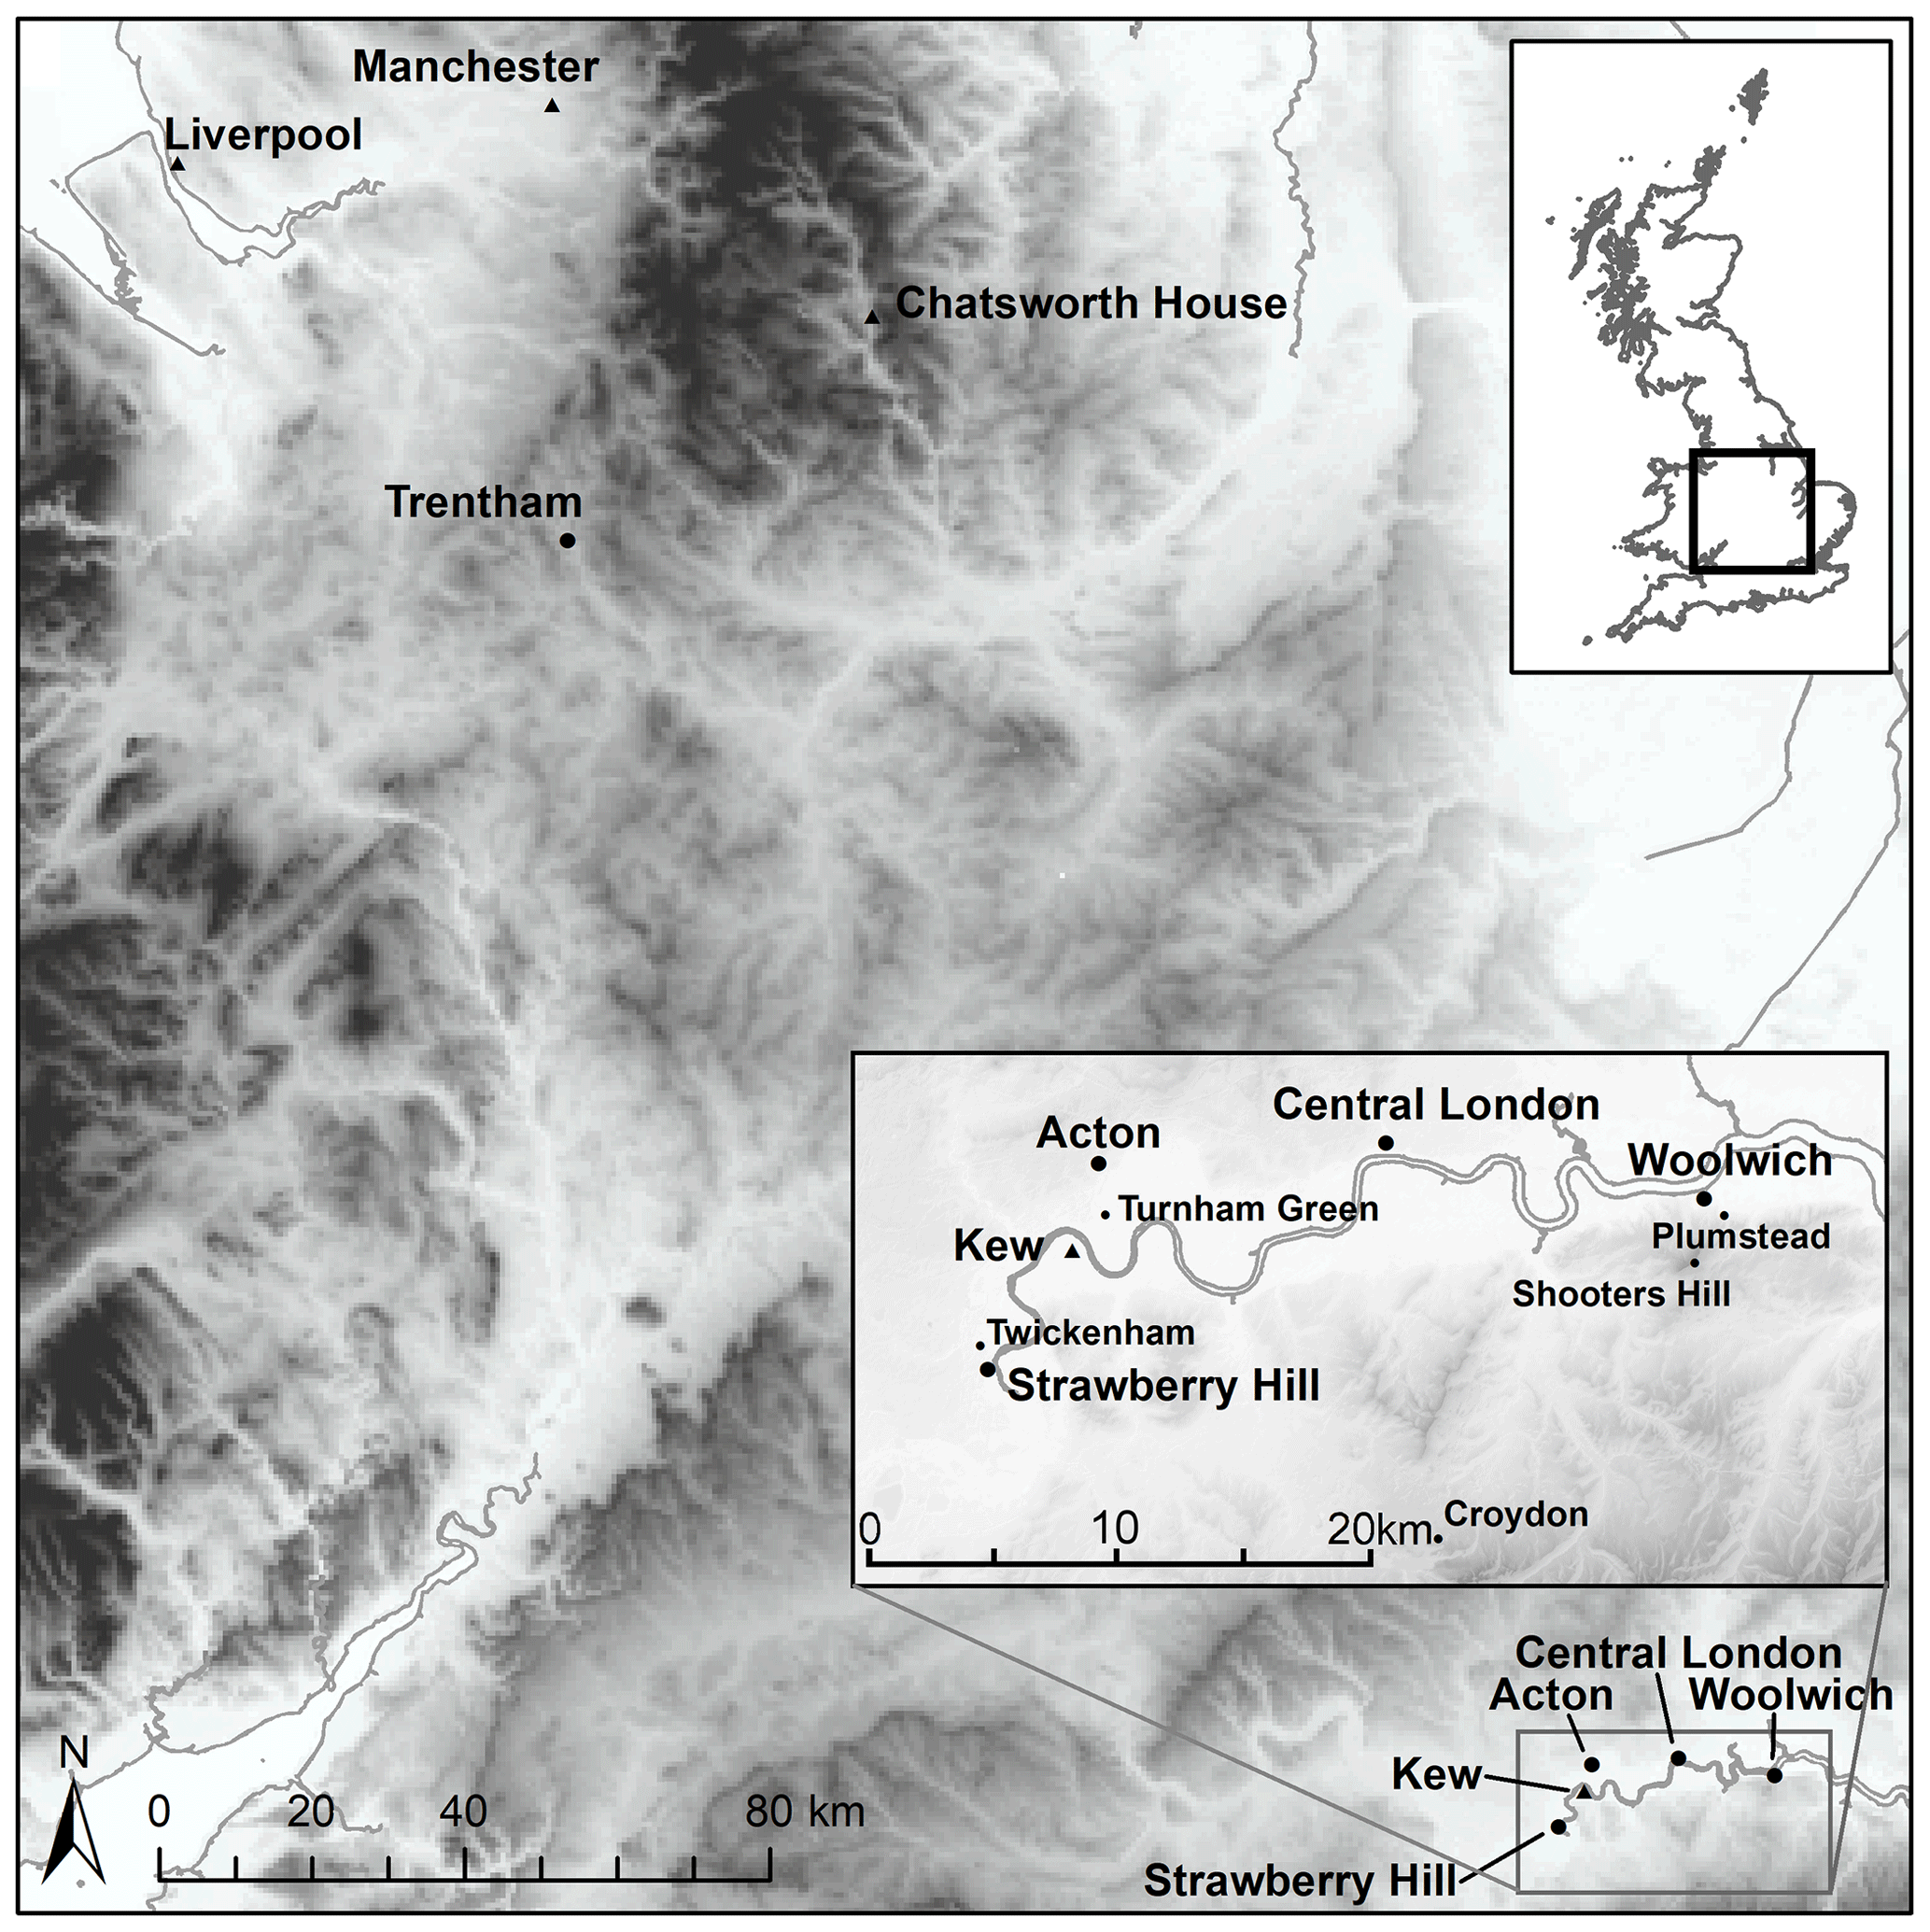
Figure 1Location of rainfall records used within this study in Staffordshire and London (instrumental rainfall series marked with a triangle; locations of large numbers of non-instrumental records marked with a large circle, small numbers with a small circle). Background map data from Digimap, © Crown copyright and database rights 2019 Ordnance Survey (100025252)).
The data analysed consist of 27 794 records (20 657 for Trentham and 2379 using three different indexing methods for London). The transcription of the materials was undertaken by a small group of volunteers working alongside the authors at the Staffordshire Record Office, with careful quality control. The classification and analysis of the index series was undertaken by a single individual (Alice Harvey-Fishenden). Previous studies that have applied indices have often used two or more researchers to provide some assessment of accuracy of classification (e.g. Nash et al., 2016); however, it would be impractical to have two (or more) researchers look at this volume of material. In considering daily qualitative data the effect of any occasional errors in classification are minimal when aggregated to monthly time frames.
For the London series, diaries belonging to the author Elizabeth Hervey (1749–1820) provided many of the daily weather records. Hervey owned a house at Acton, in modern Greater London (Fig. 1) and rented a house in central London but travelled extensively and many of her diaries relate to her travels, in the UK and throughout western Europe. She records the weather daily alongside a detailed account of her day, her health, and descriptions of the places she visits. A daily entry can run over several pages and the weather is often referenced multiple times during the day, interspersed with other information. The detailed weather descriptions recorded by Hervey are particularly noteworthy as there are few comparable female weather recorders in the late eighteenth century. Notable exceptions are Margaret Mackenzie's temperature series (1780–1805) from Delvine, Scotland (Wheeler, 1994) and Constantia Orlebar's weather book (1786–1808) from Ecton, Northamptonshire (Manley, 1955). The diaries of Richard Wilkes Unett also contribute to the London series.
For the Staffordshire (Trentham) series the major sources were from the Marquis of Stafford's Trentham Estate in Staffordshire. The majority of the information came from monthly farm reports, which include daily weather descriptions (predominantly concerning precipitation) from 1816 onwards, and from a memoranda book belonging to the agent for the Trentham Estate, William Lewis. In addition to sections on the weather, the farm reports contain details from different employees on the estate, such as the gamekeeper, which help to contextualise the weather information. Daily entries in Lewis's memoranda book are relatively short (several to a page) but recollect the weather and its impact on Lewis's activities and those of the wider estate. Letters between Lewis and his superior, James Loch, were also consulted, as were diaries and letters from the wider north Staffordshire area for comparison; however, these offered a less complete coverage.
The Scotland series will not be analysed here simply because of the geographical distance from the other two series. It consists mainly of diary entries made by Richard Wilkes Unett (1765–1815) but offers future interesting opportunities for further analysis alongside the records of Margret MacKenzie of Delvine, Perthshire (Wheeler, 1994). Unett travelled extensively with the military, with records according to his current posting. Although originally from Staffordshire, much of his diary material records life in Scotland or London. He kept a daily journal recording brief notes about his daily activities, the weather, his health, and the state of his garden. Interestingly, a small section of journal with weather reports was kept by his father, Thomas Unett, and also survives but only for June of 1774 (SRO D3610/4). Unett's diary entries are generally short and factual, with information relating to the weather easy to identify and extract.
Two sections of collected data were selected for further analysis: London (1797–1801) and north Staffordshire (1816–1865). These series contain overlapping accounts from different sources and permit an assessment of how many weather records are needed per month for the greatest reliability. The shorter series for London was used to test different types of indices and the Trentham series was used to evaluate how well the most successful index system from the London tests could be used over a longer period.
No single index system is universally used when converting qualitative weather information into quantitative data, although often a five- or seven-point scale, such as that used by Nash et al. (2016), is utilised. Indices are generally not used for daily weather data, although Brázdil et al. (2019b) calculated monthly days of rainfall for a set of weather diaries and converted these to a 7∘ index using a regular distribution of ranked monthly totals (assigning the highest and lowest 8.3 % of values an index value of 3 or −3 and assigning a further 16.6 % of values to each of intermediate index classes, as suggested by Pfister, 1992). Since these types of index rely on the concept of “normal”, they can be difficult to apply to daily weather data, particularly when working with subjective personal accounts. Within this study overlapping daily weather data from different sources are studied, so for a given year there may be >700 statements. The index therefore needs to be easy to apply, quantify daily rainfall, and be able to be averaged for months with greater or fewer records. The system applied by Macdonald et al. (2010) uses an index from 0 (no rain, hot/drought) to 5 (very wet, storm); this approach was selected for testing (index A). Each record in the London series was given a value from 0–5 following this method. For example, the 6 May 1797, described by Hervey as “Horrid weather, almost perpetual hail and heavy hail storms” (D6584/C/74), was assigned a value of 5, while the 11 April 1799 “it has been showery all day” (D6584/C/85) was assigned a value of 3. The 9 July 1801 described by Richard Wilkes Unett as “A very hot summers day” (D3610/12/3) was assigned a value of 0. Additionally, an index based on days of rainfall per month was considered, as used by several previous studies (for example Ayre et al., 2015; Brázdil et al., 2019b; Lee and MacKenzie, 2010). Two versions of this index are tested: one that assigned each day a value of 0 for no rain, very light rain, or fog or a value of 1 for any considerable rainfall (index B) and a second which introduced nuance, aiming to capture the heaviness of the rainfall (index C). Index C assigns a value of 0 to no precipitation, 0.25 to very light rain, or heavy fog, 0.5 to showers or light rain and 1 to heavy rain. For example, using index B, the 6 May 1797 and the 11 April 1799 would be assigned a value of 1 and the 9 July 1801 a value of 0. These indices were then reassessed using the more nuanced index C, to better quantify the rain where possible. Using index C for the three events detailed above, 6 May 1797 is assigned a value of 1, 11 April 1799 a value of 0.5 and 9 July 1801 a value of 0. This gave three classification systems for consideration with the weather records from London: index A (after Macdonald et al., 2010), index B (based on days of rainfall), and index C (based on days of rainfall with a consideration of heaviness of rainfall). There were insufficient data for London (only 56 months) to test the impact of converting into a 7∘ classification following the methodology of Brázdil et al. (2019b).
It is important to verify the data through comparison of indices and instrumental rainfall wherever possible (Brázdil et al., 2018). Fortunately, analysed and homogenised precipitation series covering the period of the diaries are available from sites within ∼ 50 km of the London diary locations.
For London the nearest instrumental rainfall data covering this period come from Kew Gardens (Todd et al., 2013). The greatest number (692) of the London records are from Elizabeth Hervey's home at Acton, (∼ 2 km; all distances given are distance from Kew). There are also 540 records from an unspecified location in London (although in most cases this is likely to be central London (∼ 15 km), 533 from Woolwich (∼ 30 km), 51 from Strawberry Hill (∼ 5 km), and a further 13 from various places around the Greater London area (Croydon, Plumstead, Shooters Hill, Turnham Green, Twickenham; Fig. 1). The area is relatively flat, and the weather recorded in the diaries of Elizabeth Hervey at Aston and Richard Wilkes Unett at Woolwich are generally very similar. For example, on the 10 March 1798 at Woolwich Richard Wilkes Unett wrote that it was “A fine day. About 8 in the evening it began raining.” (SRO D3610/12/3), while at Acton Elizabeth Hervey wrote “A beautiful morn[ing] ... . It rained violently this even[ing].” (SRO D6584/C/79). There are, however, occasions when Elizabeth Hervey compares the weather at her home in central London with the weather at Acton and identifies differences in rainfall. For example, on the 31 May 1798 when she writes “A morn[ing] that threatens rain... Tho' much rain fell here to day and yesterday, there was scarcely any at Acton, so that my Hay has not suffered at all” (SRO D6584/C/81). As most of the non-instrumental rainfall data for London comes from close to Kew Gardens, it is expected that there will be a high degree of correlation between the indices and recorded rainfall.
For the Trentham series, the nearest instrumental weather station is Chatsworth House in Derbyshire (Harvey-Fishenden et al., 2019) ∼ 50 km away; however, Chatsworth is located in the Peak District (Fig. 1), so the Trentham data were also compared to rainfall from Manchester (∼ 55 km) and Liverpool (∼ 70 km) (both Macdonald, unpublished data). It is likely that the correlation between rainfall at Trentham and instrumental weather stations will not be as strong as the rainfall at Kew and London. This mainly reflects the distance and topography between recorder and instrumental station, though there may be seasonal variations reflecting precipitation-generating mechanisms. There is a good correlation between rainfall for the period 1816–1865 at Chatsworth and Manchester (r=0.655, ) and Chatsworth and Liverpool (r=0.637, ) and a strong correlation between Manchester and Liverpool (r=0.875, ).
The role of snowfall is challenging to quantify and assess (Manley, 1958a); however, long snowfall records are currently receiving renewed interest (Spencer et al., 2014), particularly within early records and long series (Murphy et al., 2020). In London a long snowfall series reconstructed by Manley (1958b, 1969) from 1668–1960 exists for consideration, with the series currently being updated and reanalysed.
For 36 of the 61 months of the London series both Elizabeth Hervey and Richard Wilkes Unett were in London and keeping their diaries. During the period 1796–1801 (Fig. 2), there are 4 months with no records (July and August 1797, September and October 1798); 3 months had less than 16 d weather recorded (September 1799, October 1801, and December 1801), and a further 9 months had less than 28 d recorded (December 1796, April 1797, June 1797, September 1797, October 1797, November 1798, August 1799, July 1801, and September 1801). The period analysed has a total of 2379 daily weather descriptions, each of which was given an index score using the three different index classification systems.
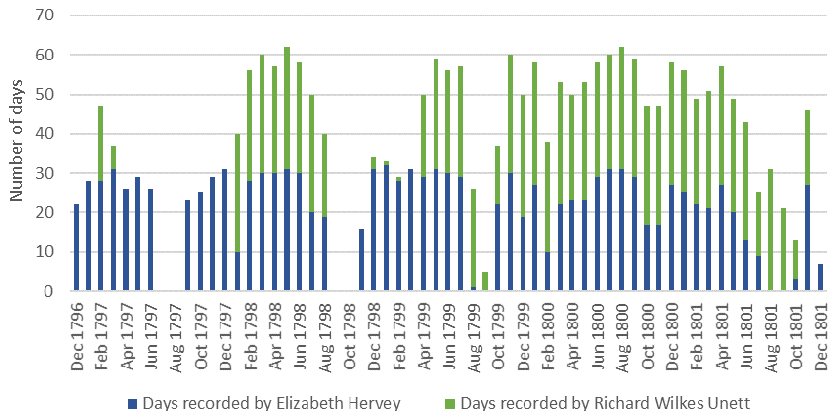
Figure 2Number of days with weather recorded in London by the two diarists Elizabeth Hervey and Richard Wilkes Unett (December 1796–1801).
Initially any month with at least 16 d of weather data was included. Subsequently, the process was repeated with only months including at least 28 d, enabling an analysis of the result sensitivity to record density. Initially, 16 d was selected as it represented >50 % record for any given month and potentially accounts for the absence of records where the diarist may not have recorded the weather as it was considered unremarkable relative to the previous day(s). The maximum number of days that could be required without systematically excluding February from the analysis was determined as being 28 d.
As different numbers of days are recorded per month within the diaries, these were standardised to aid comparison. The sum monthly index value was calculated (the total of the daily index values for the month added together) and then divided by the number of documented days within the month. Subsequently, this was multiplied by the total number of days in that calendar month. For example, using index classification A for the month of December 1796, the sum 0–5 index score for each day was calculated (49), with 22 d of records that month from a possible 31, so 49 was divided by 22, and then multiplied by 31 to get a scaled monthly value of 69. The monthly values for each of the three indices being assessed and for both data threshold levels (16 and 28 d) were plotted (Fig. 3a–f). All correlations were significant () using Pearson's product-moment correlation co-efficient (r). Index C with 28 d or more of data per month produced the best result (Fig. 3f). Correlations between descriptive accounts were better than some of those between instrumental weather stations (e.g. Manchester and Chatsworth). The strong relationships identified reflects the close proximity of Elizabeth Hervey's house to the Kew instrumental series, increasing confidence in the approach. Each of the classifications assessed produced good correlations, which were comparable or stronger than those found by similar studies. Linderholm and Molin (2005), for example, analysed the relationship between summer weather reconstructed from a Swedish diary and tree rings (R=0.59), while Zhang et al. (2013) considered 20 years of overlapping qualitative information with instrumental data (R=0.67). The strongest correlation identified (with both 16 and 28 d) was using index C; therefore this approach was selected for assessing on the longer dataset at Trentham.
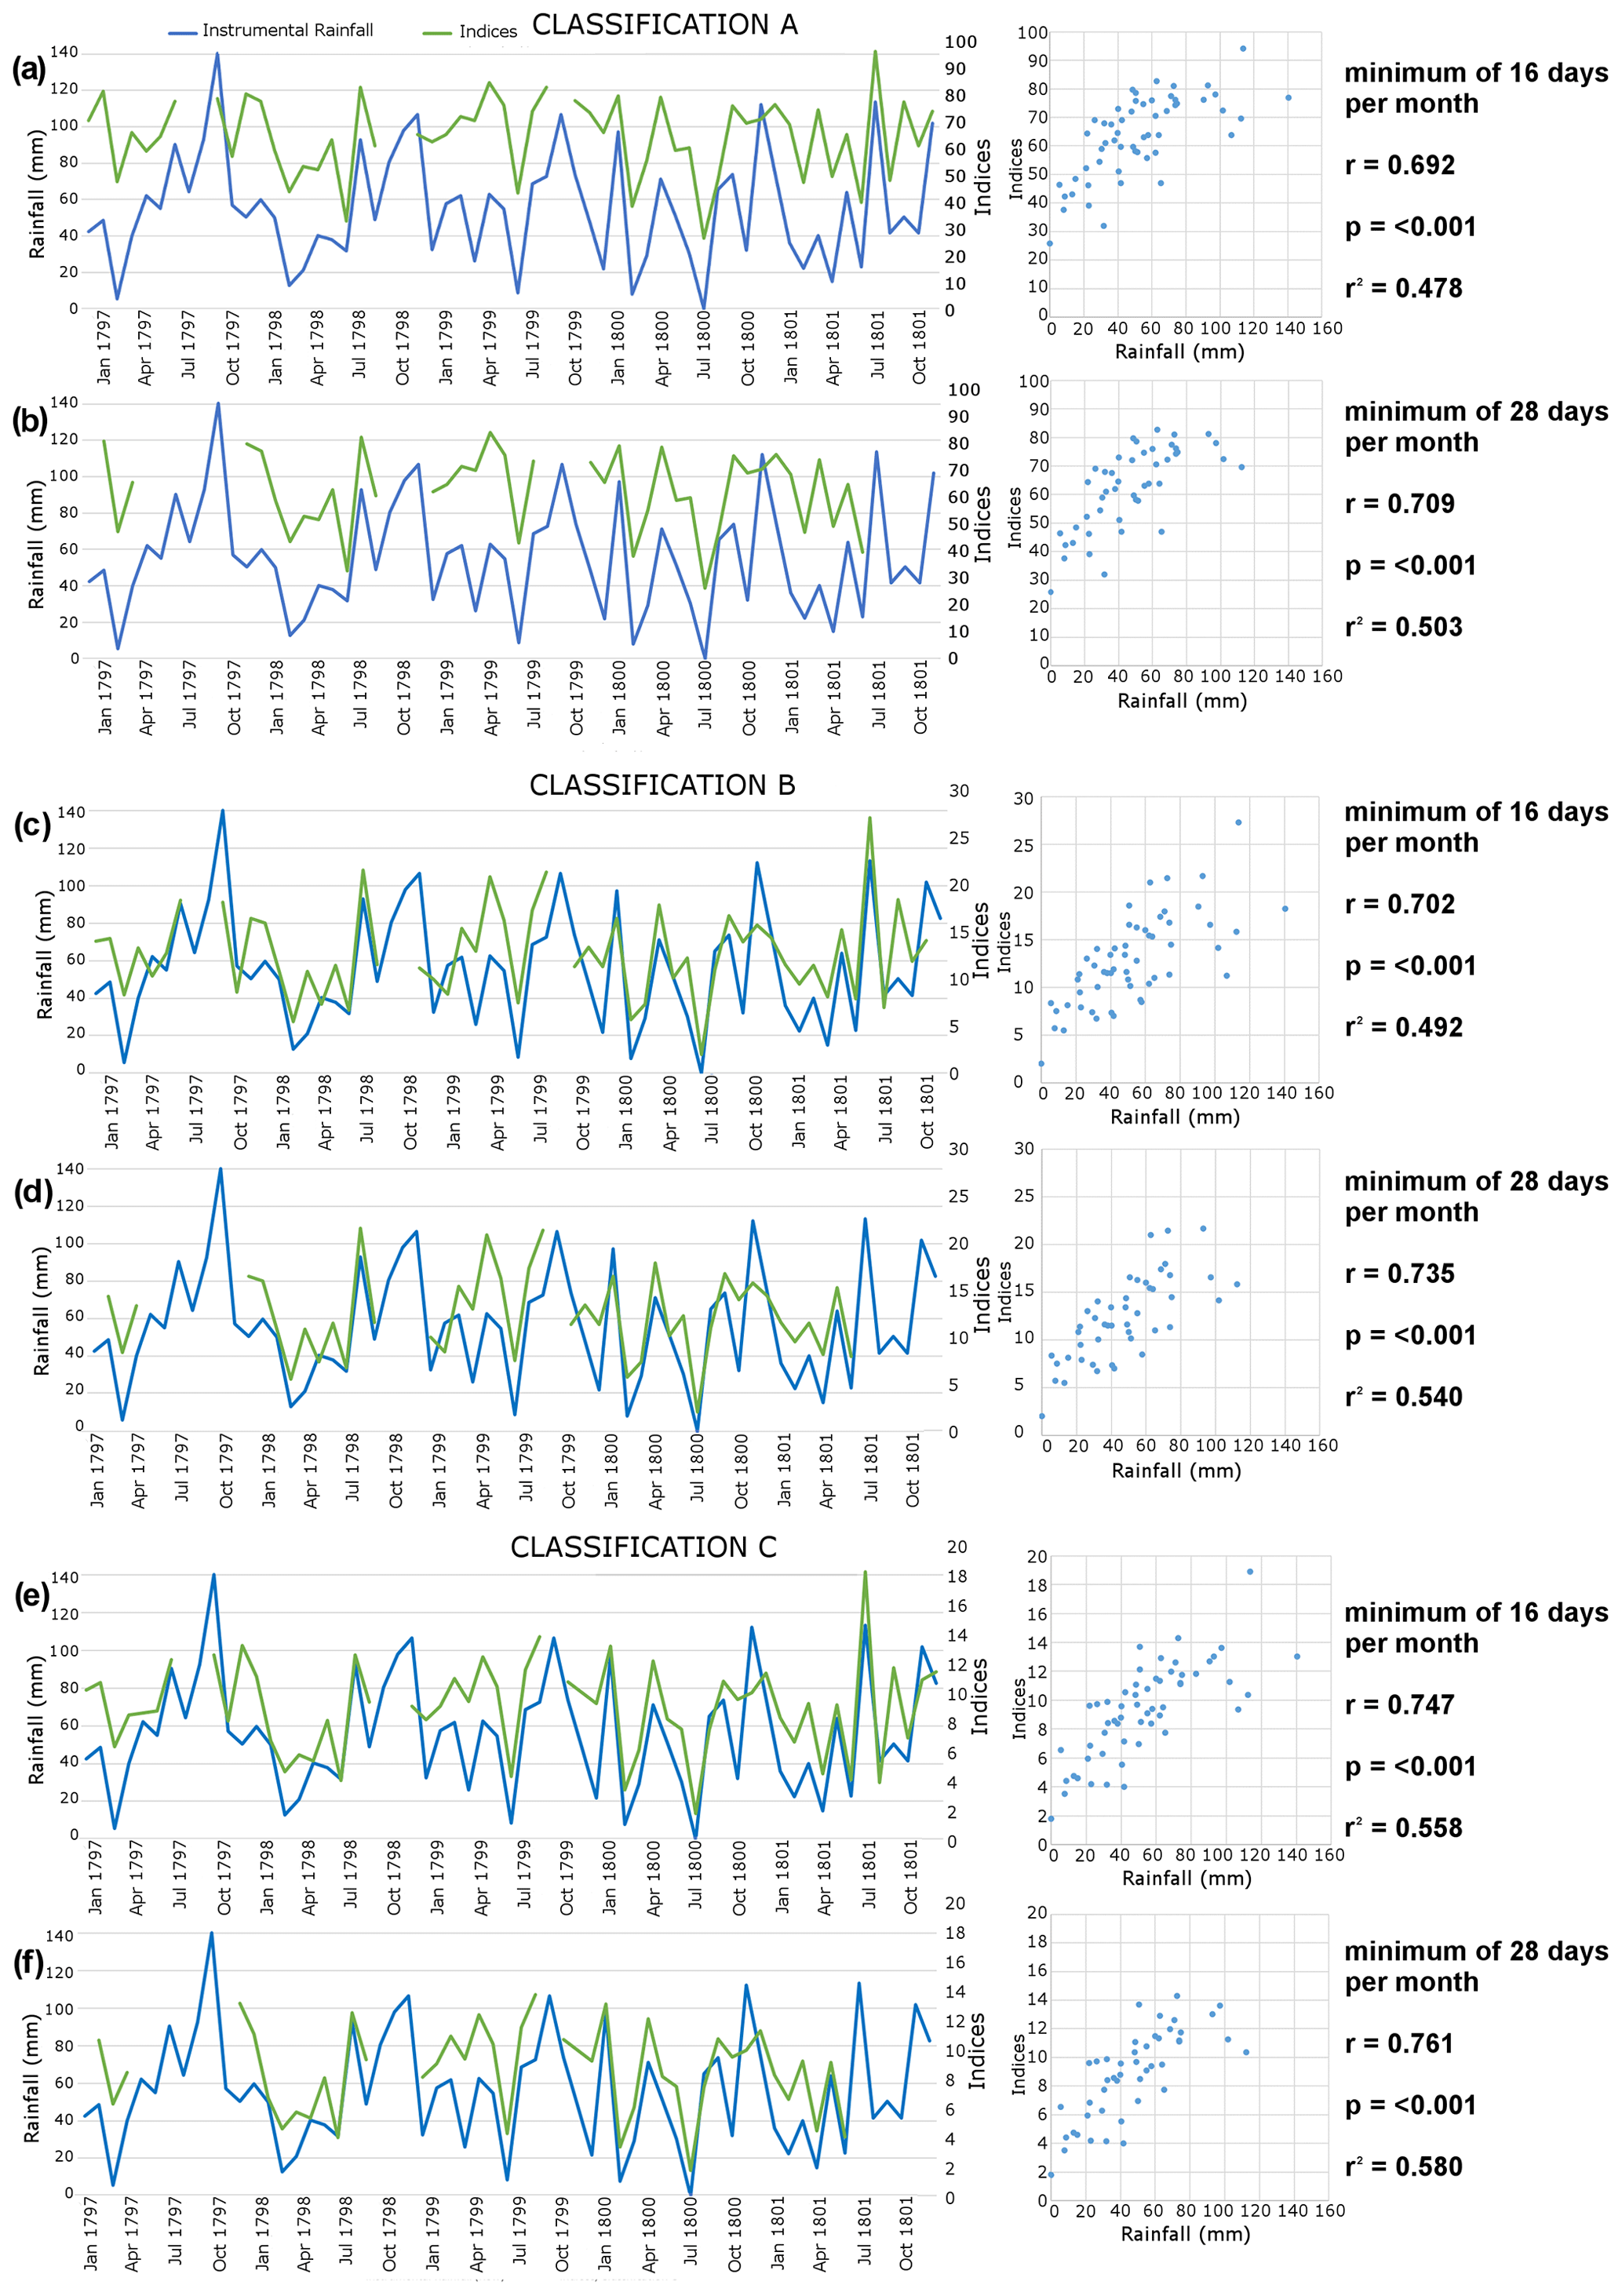
Figure 3Statistical analysis of the three classification approaches A–C (green) using 16 (a, c, e) and 28 (b, d, f) day records respectively compared to instrumental rainfall at Kew (blue).
There are considerably more data covering a longer time frame for Trentham in north Staffordshire (nearly 50 years from August 1816 to December 1865) compared to the London weather information analysed (Fig. 3). Overall, there were 20 657 weather records for Trentham for this period. Each of these records was assigned a value from 0–1, following index C.
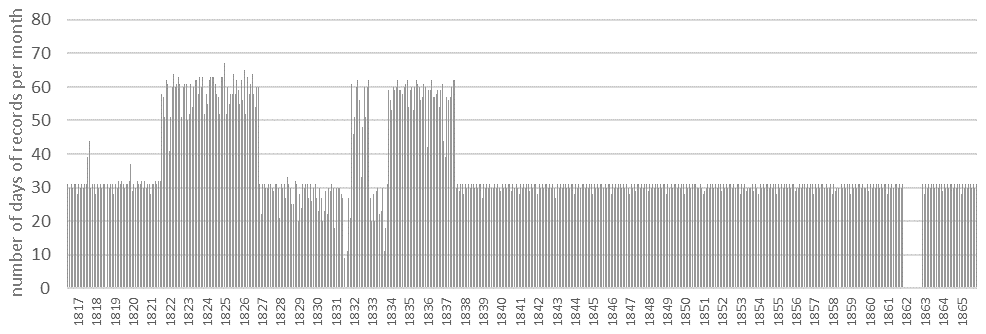
The threshold for inclusion in the analysis at Trentham was set at 20 d per month. Whilst two levels were assessed in London, with more days (28) presenting a stronger correlation with the instrumental precipitation series, selection of the higher threshold at Trentham would leave several gaps and 45 months missing. Therefore, the threshold was lowered to 20 d. This pragmatic reduction in threshold resulted in greater temporal coverage, with the results from London suggesting the impact on correlation would be relatively limited (Fig. 3e compared to 3f). Only 20 months contained insufficient records to meet the revised lower threshold. All records for 1862 are missing, as are September 1818, September 1832, and July 1858. February 1831 (which only had 18 d), August 1831 (9 d), October 1831 (11 d), October 1833 (11 d), and November 1833 (18 d) were also excluded from the analysis (Fig. 4).
The resulting index was compared to the instrumental precipitation series from Chatsworth, Manchester, and Liverpool (CML). All three showed significant correlation (), with Chatsworth the weakest (r=0.579) and Manchester (r=0.664) and Liverpool (r=0.667) stronger (Fig. 5: 1a, 2a, and 3a respectively). There is an even stronger correlation between the average of all three instrumental stations and the index generated at Trentham (r=0.706, ); a potential explanation may be that averaging has a smoothing effect on the data, reducing or removing localised extremes. While notable wet and dry periods in the instrumental precipitation series correspond well with the Trentham index (as demonstrated in Fig. 6), there are discrepancies in the distribution of data. There are much greater extremes of heavy rainfall seen in the instrumental precipitation from Chatsworth, Manchester, and Liverpool (Fig. 5: 1b, 2b, and 3b respectively). Extremes are hard to capture from descriptions in archive documents because of different people's perceptions of heavy or light rain and the potential for observers to misdescribe the weather if they have spent key periods of the day inside or if the heaviest rainfall happened over night.

Figure 5(a) Correlation between Chatsworth rainfall and the Trentham index series (r=0.579; ); (c) Manchester rainfall and Trentham index series (r=0.664; ); (e) Liverpool rainfall and Trentham index series (r=0.667; ). (b, d, f) Comparison of the Trentham rainfall index (blue) alongside instrumental rainfall from Chatsworth (red), Manchester (orange) and Liverpool (green) respectively.
An assessment of the methodology applied by Brázdil et al. (2019b) using the ranking of the months by days of rainfall and giving them values from −3 to 3 was undertaken, with 8.3 % of the months receiving the most extreme index values (−3 and 3) and all other indices (−2 to 2) being applied 16.6 % of the months. However, this was determined to be undesirable as it resulted in a loss of detail and slight reduction in the correlation with the instrumental series from Manchester (r=0.65, ).
Extremes present challenges even within instrumental series, whether it is defining the absence, excess, or form of precipitation, with considerable effort still being made to improve and reliably identify extremes in instrumental rainfall (Archer and Fowler, 2018; Miller et al., 2013) and snow measurement (Kay, 2016). These same challenges exist within descriptive accounts of the weather: whilst general wet and dry phases are reliably captured, extremes, or at least the extremeness of rainfall, can be difficult to capture.
6.1 The problem with snow
There has long been an awareness of the challenge of under-catch in early instrumental records. In 1891, George James Symonds (founder or the British Rainfall Organisation) spoke about the history of rain gauges in an address to the Royal Meteorological Society (Symons, 1891). He noted that prior to the introduction of Snowdon pattern rain gauges in 1864, there was a large under-catch of snow due to the absence of a protective rim on the rain gauge. The instrumental data examined here (Kew Gardens 1796–1801 and CML 1816–1865) were collected prior to the introduction of these gauges. Recent work has challenged widely reported long-term trends in precipitation for England in Wales, by showing that much of the trend towards wetter winters and drier summer can be explained by under-catch in the early record (Murphy et al., 2020). It is important, therefore, to consider the contribution of snow to historic data. To this end, an assessment of snow days and months with snowfall at Trentham was undertaken (Fig. 7a). References to snow can be found in these records in the months between October and May. Most years had at least some snow, with the greatest snowfall in January, with an average of 1.9 d, closely followed by March with 1.8 d, and then February with 1.6 d. All other months have less than a day of snowfall on average: December (0.9), April (0.8), November (0.5), May (0.2), and October (0.1). Most snow in the records is in winter (December–February), with an average of 4.43 d per winter, followed by the spring (March–May; 2.76 d) and autumn (September–November 0.66 d). Visual examination of the Trentham index against recorded rainfall at Chatsworth, Liverpool, and Manchester showed that months with snowfall tended to have less rainfall in the instrumental record than was suggested by the index.
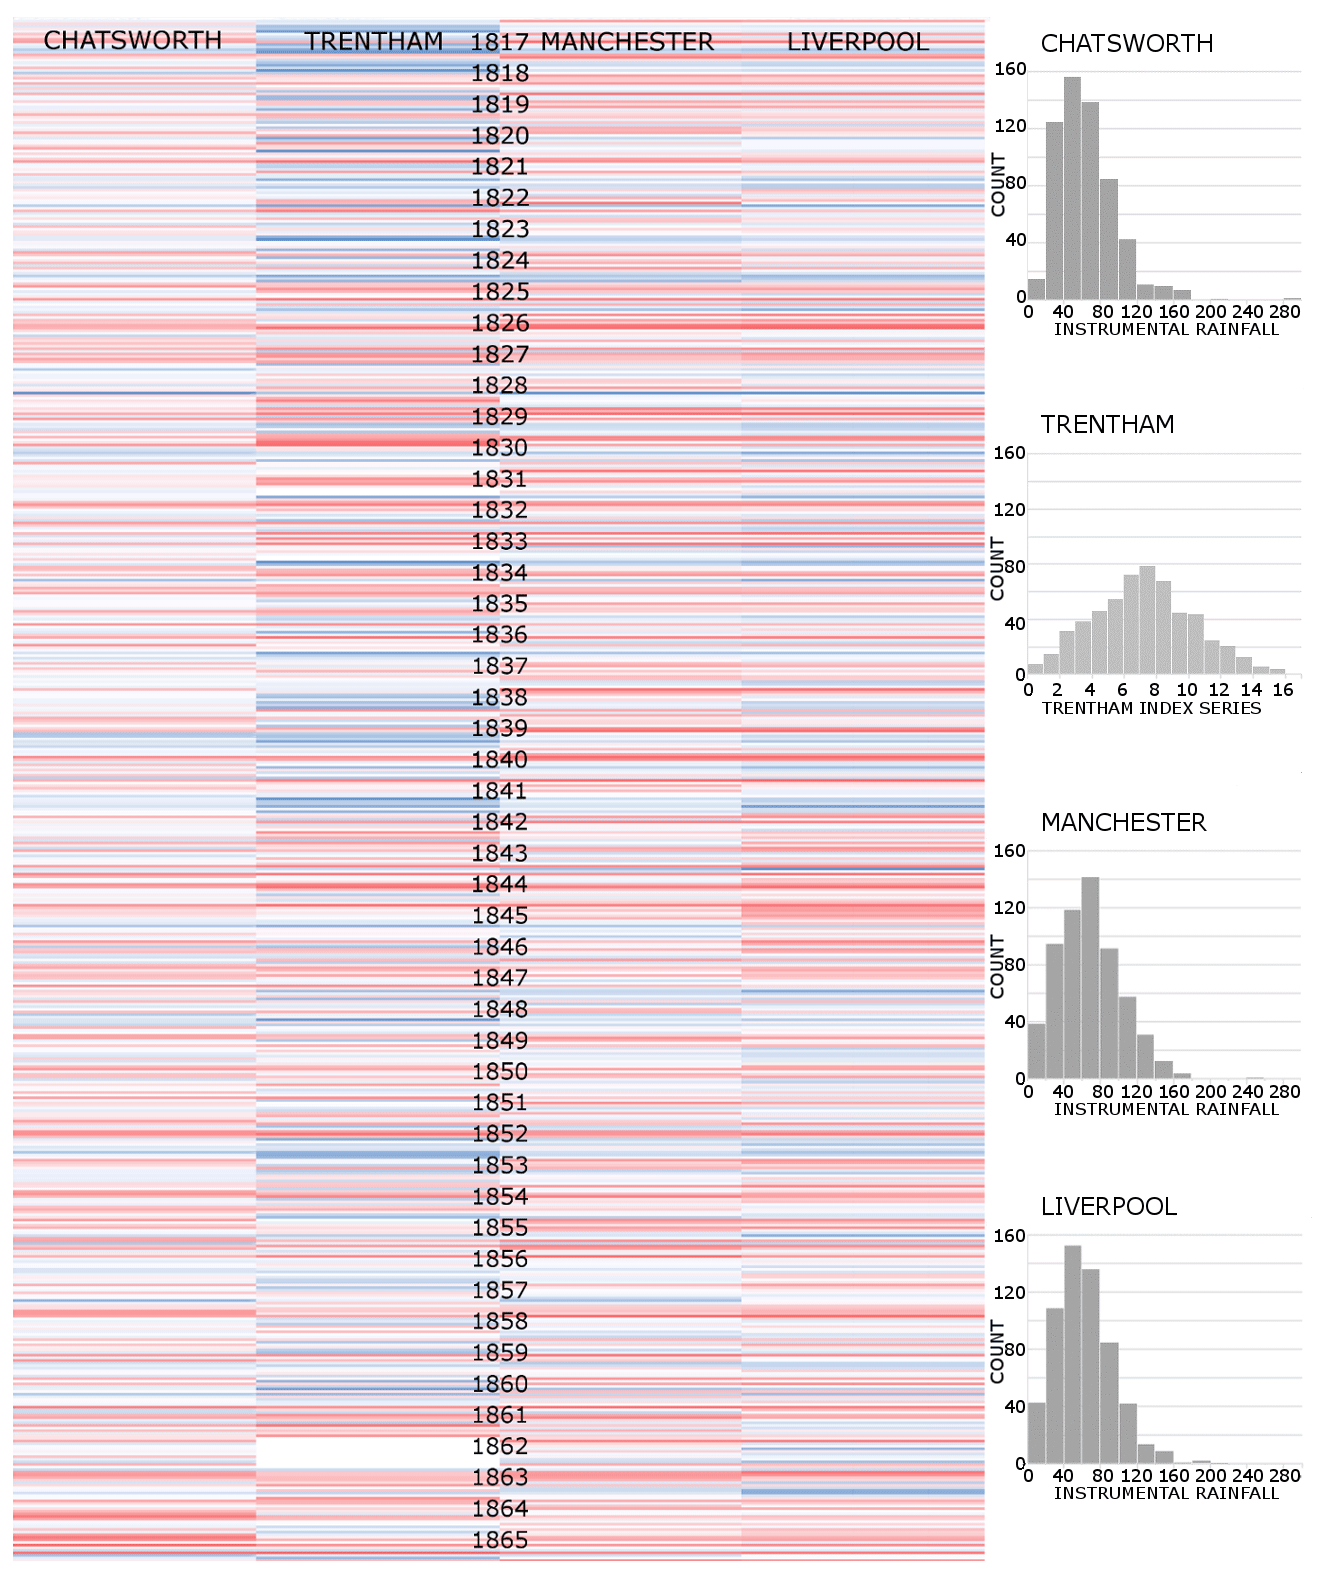
Figure 6Wet (blue) and dry (red) months August 1816–December 1865, with distribution (note data for 1862 at Trentham are missing).
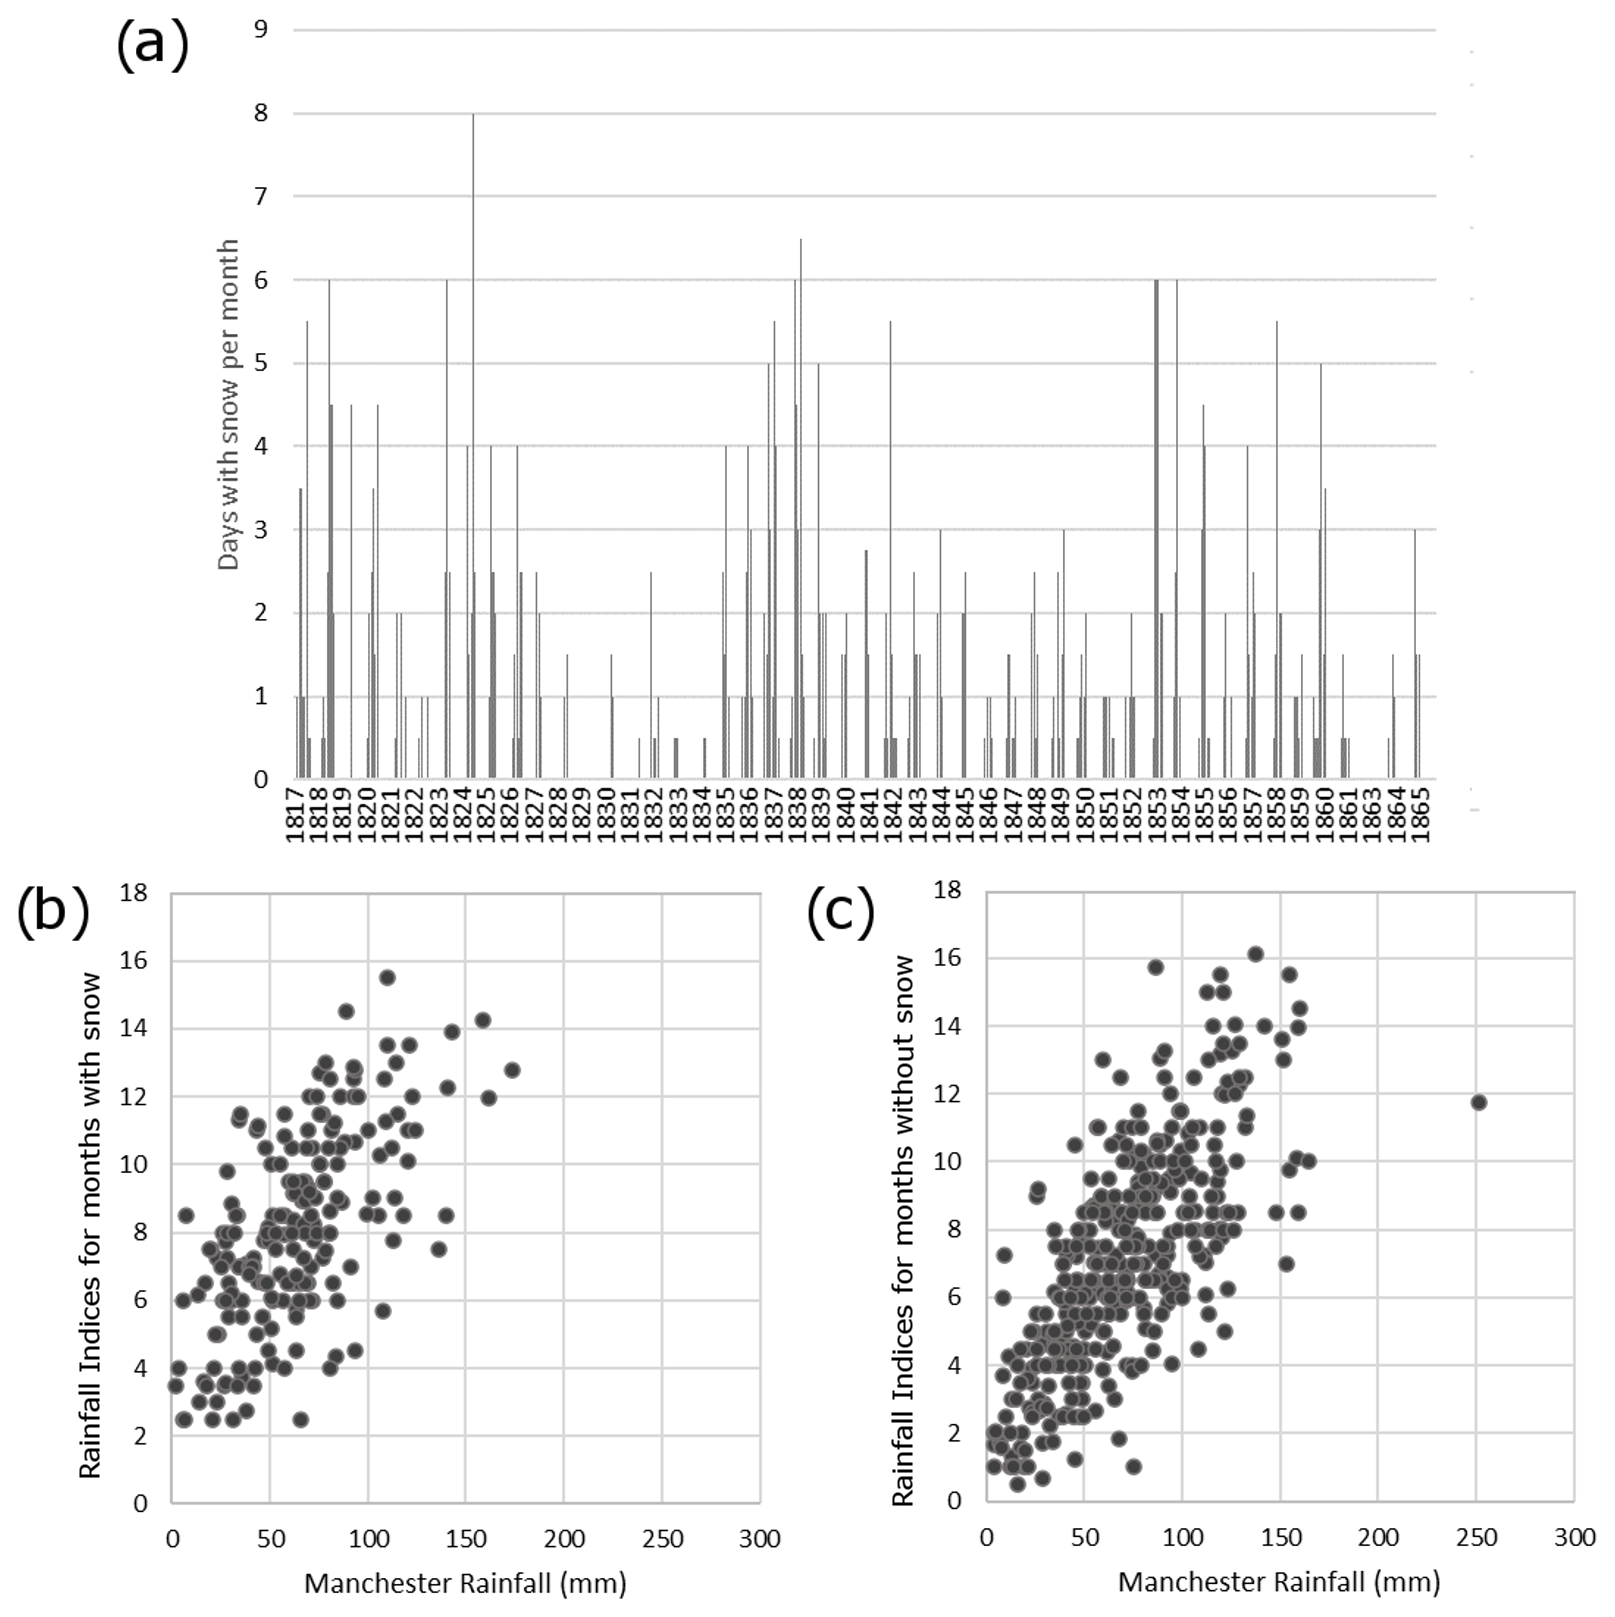
Figure 7(a) Days of snow per month at Trentham (note data for 1862 are missing) and precipitation index for months with (b) and without (c) snow, plotted against Manchester rainfall. For the months with snow r=0.63; for months without snow r=0.71 (for all correlations ).
Separating out months with and without snow gives a stronger correlation with the Manchester precipitation series for the months without snow (r=0.71) and a similar correlation for months with snow (r=0.63) (Fig. 7b and c respectively). The indices systematically indicate slightly more precipitation than is recorded by the rain gauges. There are four possible reasons for this systematic difference between the records:
- i.
There is the potential for under-catch in the instrumental record (e.g. Murphy et al., 2020).
- ii.
It might reflect overestimation of precipitation in the Trentham series due to over-reporting of snow. Snow is a highly visible weather phenomenon and therefore might be over-reported (Spencer et al., 2014). There is also the complication of whether, when a record says “snow”, it is referring to new snowfall or snow lying on the ground.
- iii.
It may reflect overestimation of precipitation resulting from the way snow has been translated into any particular index. Snow has been treated in the same way as rain in the index classification system, but it is possible that it should have been treated more like showers than substantial rainfall.
- iv.
There is the potential for greater variability in snowfall between two sites compared to rainfall, reflecting local topographic and climatic conditions, with a higher propensity for snowfall at Trentham (Barrow and Hulme, 2014; Mayes, 2000).
It is likely that a combination of these factors may account for the differences in the two series. The index for the 138 months with 2 or less days of snow had a better correlation with the rainfall at Manchester (r=0.70) compared to the 58 months with more than 2 d of snow (r=0.51). When plotted (Fig. 7a), many of the outliers come from months with moderate amounts of snowfall (i.e. 2.5–4 d of snow). This suggests that over-reporting of snow (perhaps the reporting of snow remaining on the ground, rather than fresh snow) may be the cause of the lower correlations for the months with more snow.
Snow can have severe impacts on farming in the UK (Jones et al., 2012). An example of this can be found in this material from Trentham in the winter of 1819–2020, with snow lying on the ground between the 30 December 1819 and the 29 January 1820 and with a thaw beginning on the 22 January causing flooding (SRO D593/K/3/2/2, SRO D593/L/6/2/2 and SRO D593/K/3/2/1). On the 3 January 1820, William Lewis recorded that the average depth of the snow was 22 inches (0.56 m) (D593/L/6/2/2). Lewis's letters highlight some of the impacts of this extended period of cold weather. On the 17 January he wrote the following:
The Storm continues and no appearance of any alteration. The Snow has been ever on the ground which causes both Sheep and Cattle to be fed out of doors with every morsel they consume. (Letter sent by William Lewis to James Loch; SRO D593/K/3/2/2.)
Towards the end of the episode he records that
[T]he severe weather has completely put all out door work at a stand for some weeks which is the cause of the present distress [amongst the parishioners] a moderate thaw has now taken place which I trust will continue. (Letter from William Lewis to James Loch, 23 January 1820; SRO D593/K/3/2/2.)
The long-lying snow led to underemployment (Lewis notes that he will take on more labourers for ditching and draining when the weather allows) and higher costs in cattle farming. While creating an index allows weather to be contextualised and compared with instrumental records, the original qualitative weather records tell of impacts and add details absent from the index alone (e.g. impacts of an event).
6.2 Heavy rainfall
While an index may be good at representing dry weather and moderate rainfall events, it appears to be weaker at capturing heavy and extreme rainfall. This is an inherent problem of descriptive records, which often lack clear distinctions between moderate to heavy and then extreme rainfall. When a writer describes “rain” or a “shower”, there is no way of knowing how much rain fell or where the threshold between “shower”, “rain”, and “heavy rain” is. When a lot of rain falls in a short period of time, the index will generally underestimate precipitation, since there is a maximum value which can be given for a day (in this case 1). For this reason, studies with similar data have thought it inadvisable to attempt conversion into quantitative values (for example Lee and MacKenzie, 2010). The difficulties in accurately estimating extremes and the problems with trying to convert qualitative information into quantitative values is demonstrated by Fig. 8, where a conversion from index to rainfall (millimetres) has been attempted. There are various ways to do this; for example, Zhang et al. (2012) used monthly precipitation days to reconstruct the seasonal precipitation for Beijing (1860–1897) by using regression models relating the precipitation and precipitation days based on modern data. In this case, however, since there are nearby contemporary instrumental rainfall data available, a linear regression is applied, derived from the average of the CML stations' rainfall and the Trentham index series. Compared to the instrumental data from CML stations the minimum monthly value of the rainfall series created from the Trentham index is higher (14.48 mm, compared to between 0 and 3.54 mm) and the maximum value much lower (123.78 mm, compared to between 190.95–282.35 mm) with the standard deviation also lower (21.26 mm, compared to between 31.43–35.05 mm).
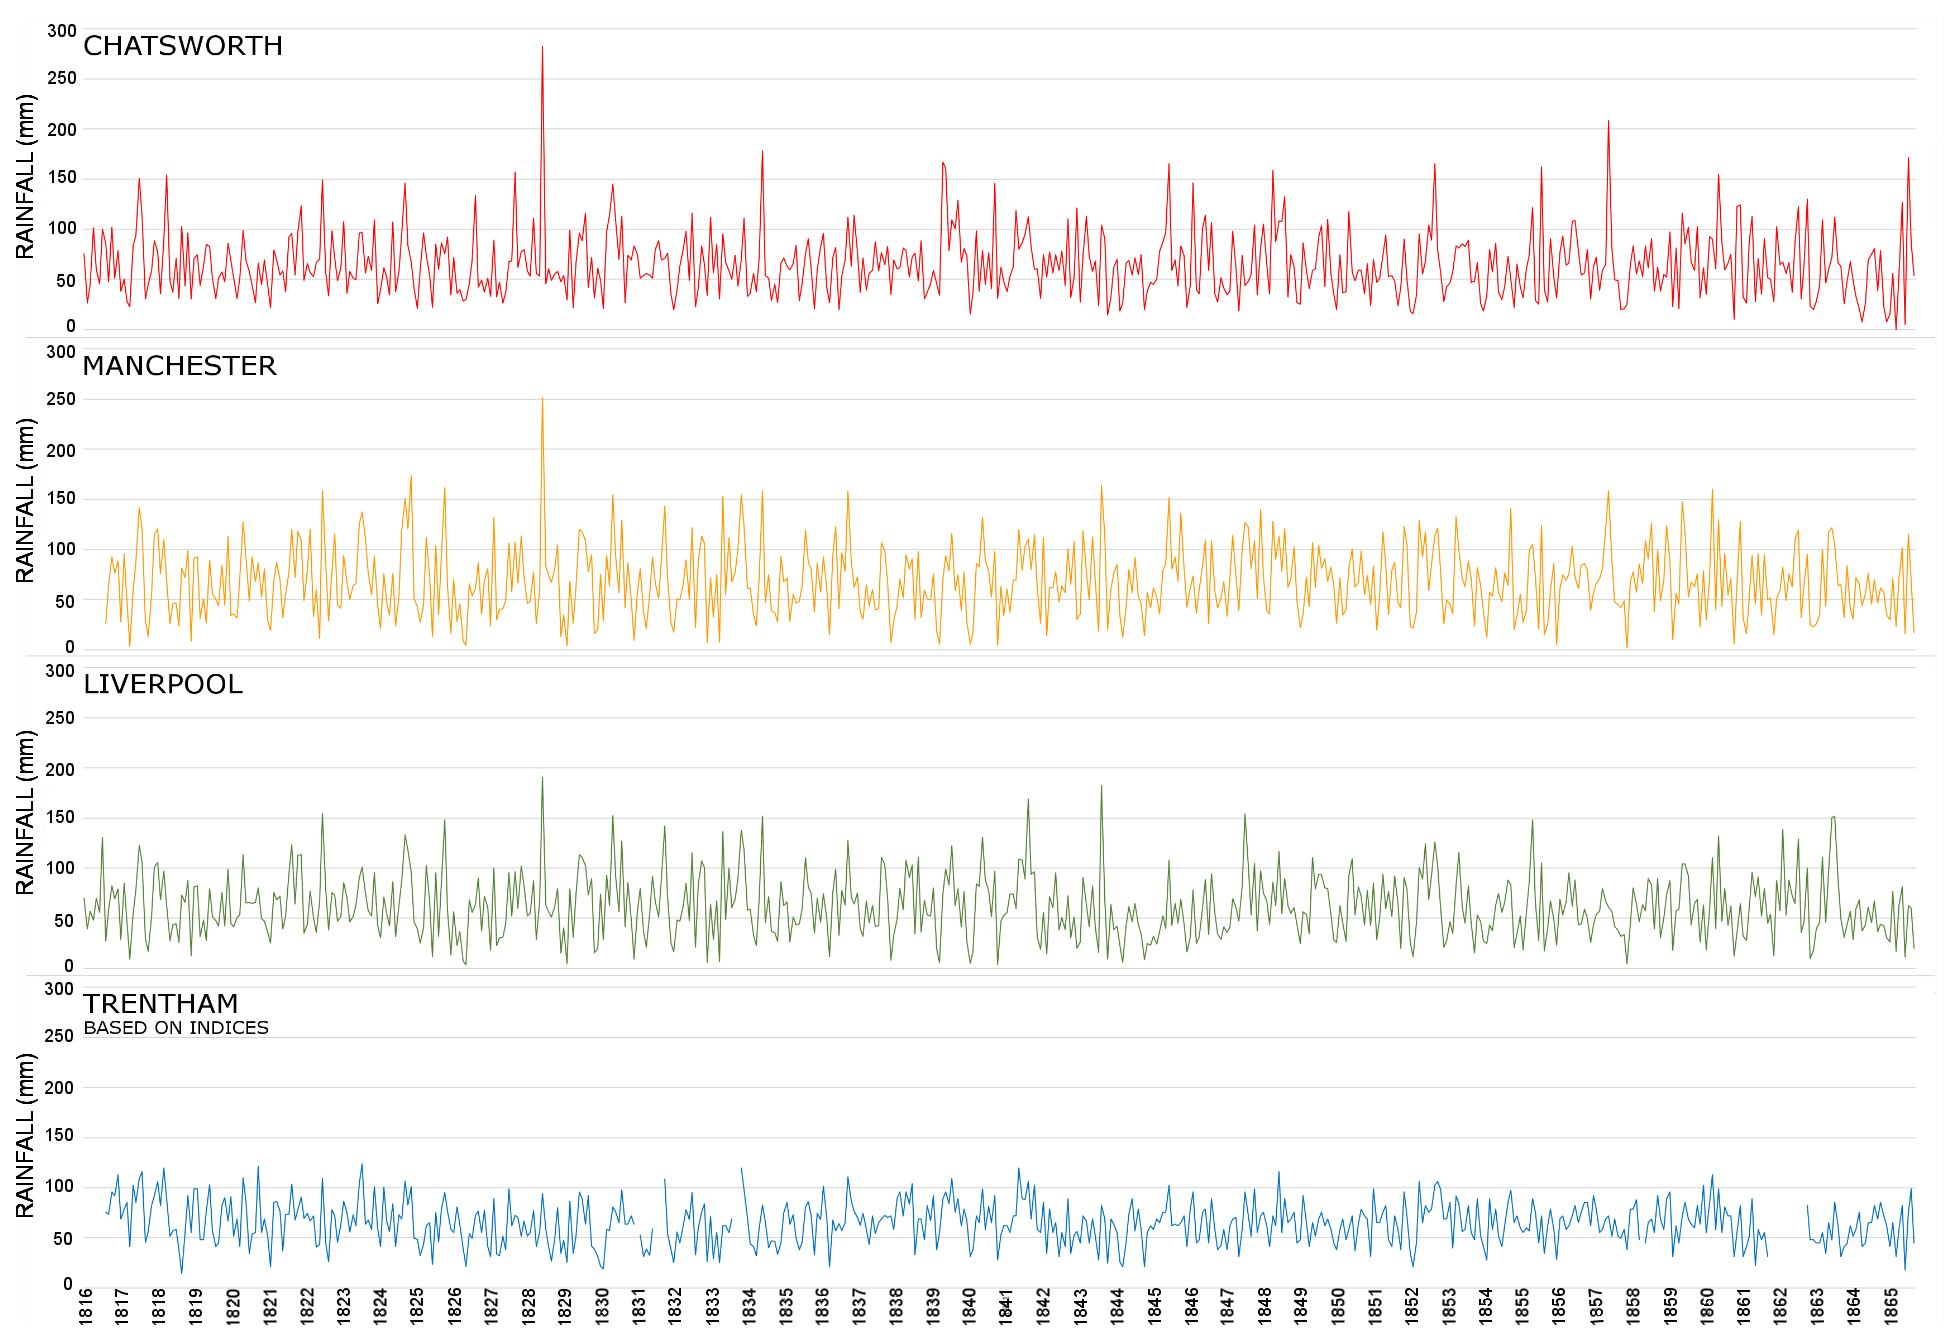
Figure 8Rainfall (in mm) at Chatsworth (red), Manchester (yellow), and Liverpool (green) and an estimate of the rainfall (in mm) at Trentham (blue) based on the index conversion.
Unlike the issues around snow where there are possibly multiple contributing factors resulting in differences between the index series and recorded instrumental rainfall, it is apparent here that the main issue with extremes of rainfall is around the lack of range in the index series, particularly when it comes to heavy and extreme rainfall. It might, however, be possible to address these deficiencies at representing extreme rainfall by adjusting the monthly index values. For example, they might be improved by increasing the values for months with recorded floods or other severe impacts. This would be similar to approaches undertaken by Brázdil et al. (2019b), where after applying an index based on a ranking of days of rain per month, the values were adjusted to account for months with particularly heavy or light rainfall.
However, taking for example July 1828, this method might not always improve results. In July 1828, 282.35 mm rainfall fell at Chatsworth, 251.42 mm at Manchester and 190.95 mm at Liverpool, whereas Trentham only experience 11.75 d of rainfall (which using this method of conversion gives 94.07 mm). It seems likely, therefore, that this is a substantial underestimation of the rainfall caused by above-average rainfall on multiple days. There are six “very wet” days mentioned in the diary descriptions, but no severe impacts of wet weather that might indicate a need for this month to be adjusted. The only impact mentioned is a delay in “getting in the hay” (SRO D593/L/2/2b), which could be caused by even mild wet weather. For the current data, it is hard to see how any methodology based on impacts would flag this month as one meriting adjustment.
From the perspective of quantifying and comparing rainfall, therefore, conversion to millimetres using this approach may create a dataset or limited utility and may also be unnecessary. Further analysis, however, may explore a more probabilistic fitting approach based on a predefined distribution, possibly from local contemporary instrumental records, to better define upper and lower bounds, although this is beyond the scope of this paper. To better quantify and compare rainfall across instrumental and non-instrumental records, it would be interesting to compare the number of days of rain per month within the instrumental record with the days in these diaries and to investigate the amounts of rain per day in the instrumental record. Unfortunately, most of the surviving instrumental records for this period only contain monthly totals and do not include daily totals nor records of the number of days of precipitation.
6.3 Droughts
There are several droughts identified elsewhere in the literature that occurred during the period covered by the records from London and Trentham. In London, there is a drought period identified by Todd et al. (2013) between 1801 and 1808. The most severe drought episode begins in September 1802 at Kew; however, it is preceded by conditions fluctuating between normal and rainfall deficit. This period of dry weather preceding drought onset is evident in the qualitative records from London. On the 20 July 1800 Elizabeth Hervey reports that “ground is sadly parched” (SRO D6584/C/93), and on the 25 July 1800, she writes that there is “Still burning weather the leaves fall as in winter” (SRO D6584/C/93). The leaves falling from the trees is corroborated by Richard Wilkes Unett, who on the 24 September 1800 wrote “Owing to the very dry weather in July, most kind of trees lost their leaves the same as in October” (D3610/12/3, p. 139). Notably low rainfall in the Kew series of 7.9 mm in February 1800 and 0 mm in July 1800 is reflected in the indices for London, although the low value in February 1797 of 5.6 mm is not captured particularly well within the indices.
In terms of the Trentham record, droughts are recorded at Chatsworth in 1821, 1826–1828, 1835–1836, 1844–1845, and 1847–1848, all of which are relatively minor droughts, within the context of the long drought series available (1760–2015; Harvey-Fishenden et al., 2019). The farm and wood-ranger reports accompanying the weather information recorded at Trentham mention drought in spring 1817, stating that the “trees planted this spring are suffering much from the extreme drought, except the Mountain Ash planted in Trentham coppice which having a cool soil, and being shaded by the larger oaks are looking very well” (D593/L/6/2/2). The CML series all show low rainfall in January 1817, March 1817, and April 1817, while the Trentham index shows dry weather in January and April 1817 and a wet March. This reflects the challenge of truly capturing a “drought” accurately following precipitation, particularly using historical descriptive accounts. A short phase of rainfall may offer some respite but may not formally terminate a drought event as defined and classified using drought indices. The dry weather may no longer have an agricultural or water resource impact but may still technically be a meteorological drought.
Neither the 1821 drought nor the 1826–1828 drought are reported as severe weather events in the archival records, with no adverse drought impacts reported at Trentham. The dry weather in 1821 seems to have led to abundant crops and fine weather, whereas in 1826–1828, diary entries are focused on the day-to-day running of the farm and fail to identify any negative impacts of the weather. There are two other droughts within this record: 1835–1836 at Chatsworth, lasting 16 months, with a peak severity of −1.0 (using the standardised precipitation index) in August 1835, and 1844–1845 at Chatsworth, lasting 15 months with a peak severity of −1.5 in March 1845. Once again, although dry, there is no comment on the weather or its impact in these records from Trentham.
6.4 Other extreme weather
One of the strengths of multi-source qualitative recording is that sometimes the overlap between different archival sources can tell you more about the impacts of extreme weather than any one document alone. For example, a letter sent on 26 June 1824, from William Lewis to James Loch about the impacts of a storm, reads
In my last I forgot to name to you that we had a severe Thunder storm on Monday last and the lightening (sic) killed six Deer under a Tree close by the reservoirs & the Day following a cow at Corn Croft be-longing to one of Mr Lord's labourers. (D593K/3/2/6)
Accordingly, in the monthly report for June 1824 at the Trentham estate, we see that an entry for the previous Monday, the 21 June, reads “Thunder and Rain”. In the accompanying park keeper's report for the same month, it notes that one buck and five does were killed by lightning (although it does not give a date) (SRO D593/L/6/2/2). William Lewis's own memoranda book for the same date, however, merely notes “a very dull morning” (SRO D593/L/2/2b). The different sources tell complementary stories: the letter identifies the event that killed the deer but not the date; the monthly report gives the date for the storms but does not state which storm killed the deer. William Lewis's memoranda book does not even mention the event at all. The notes on the weather kept by William Lewis appear to have generally been made quite early in the morning, and he appears to sometimes revisit the previous day to update it with later changes in the weather but sometimes, as in this case, fails to do so.
Descriptive accounts can also provide valuable insights relating to weather events that are poorly recorded in early instrumental records, such as tornadoes, mists, fog, haars, and lightning storms, with documentary sources offering a valuable tool in creating long reconstructions (e.g. Camuffo et al., 2000).
Table 1Diary entries for Thomas Birds and James Caldwell, December 1807.
In April 1815, Mount Tambora in Indonesia erupted, with impacts around the world (Pfister and White, 2018a). The year of 1816 has been described as the “year without a summer” by several authors (Stothers, 1984; Veale and Endfield, 2016; Pfister and White, 2018a), with the impacts of the Tambora eruption on weather extensively recorded across Europe. The diaries of Elizabeth Hervey offer considerable potential for examining its impact from a different perspective: that of a female traveller as she travels around Europe during the summer of 1816.
It is unfortunate that the Trentham record misses much of this “summer”, beginning in August 1816, as it fails to capture the potential impacts of the Tambora eruption on the day-to-day running of the farm. However, the fact that the farm reports and memoranda book start part-way through 1816 may reflect a desire to record farm experiences based on an unusual year at that point. June saw some of the worst impacts across Europe, with anomalously cold and wet weather (Luterbacher and Pfister, 2015). There have been several attempts to use diaries from this period to examine the effects of the Tambora eruption in the UK. Lee and MacKenzie (2010), for example, used a farmer's diary from near Manchester (about 50 km north of Trentham), which recorded wind direction, barometric pressure and observations of weather and other phenomena (including red skies), to examine the impact of the Tambora eruption. Veale and Endfield (2016) describe the general pattern of the weather nationally (UK) around this time: in August much hay was spoilt by rain; September was cold and frosty; there were floods in October, while November was wet and very cold (Veale and Endfield, 2016). These conditions led to food shortages, and following on from this 1817 is described as having the fourth successive cold and sunless spring and also being dry (Veale and Endfield, 2016). There was a heatwave in June, with July, August, and September being wet. The Trentham records primarily document rainfall, and there are no descriptions of non-weather phenomena, such as red skies identified in other sources. The records from Trentham, however, do support some of the overall narrative put forward by Veale and Endfield, with August to December 1816 all being relatively wet months at Trentham. This, however, differs from the instrumental records from Manchester and Liverpool, with August being quite dry (although it is wet at Chatsworth), and September and November are either dry or average at instrumental stations. In October (1816) the Trentham farm reports state that “grain of all descriptions much injured by the inclemency of the weather”; however, other crops such as beans and turnips seem to have given normal yields (D593/L/6/2/2). The weather patterns identified by Veale and Endfield (2016) for 1817 are replicated in the Trentham records. Generally, the weather records from Trentham seem to fit well with the patterns described by Veale and Endfield for the years following the Tambora eruption, although these years are not statistically different from preceding years.
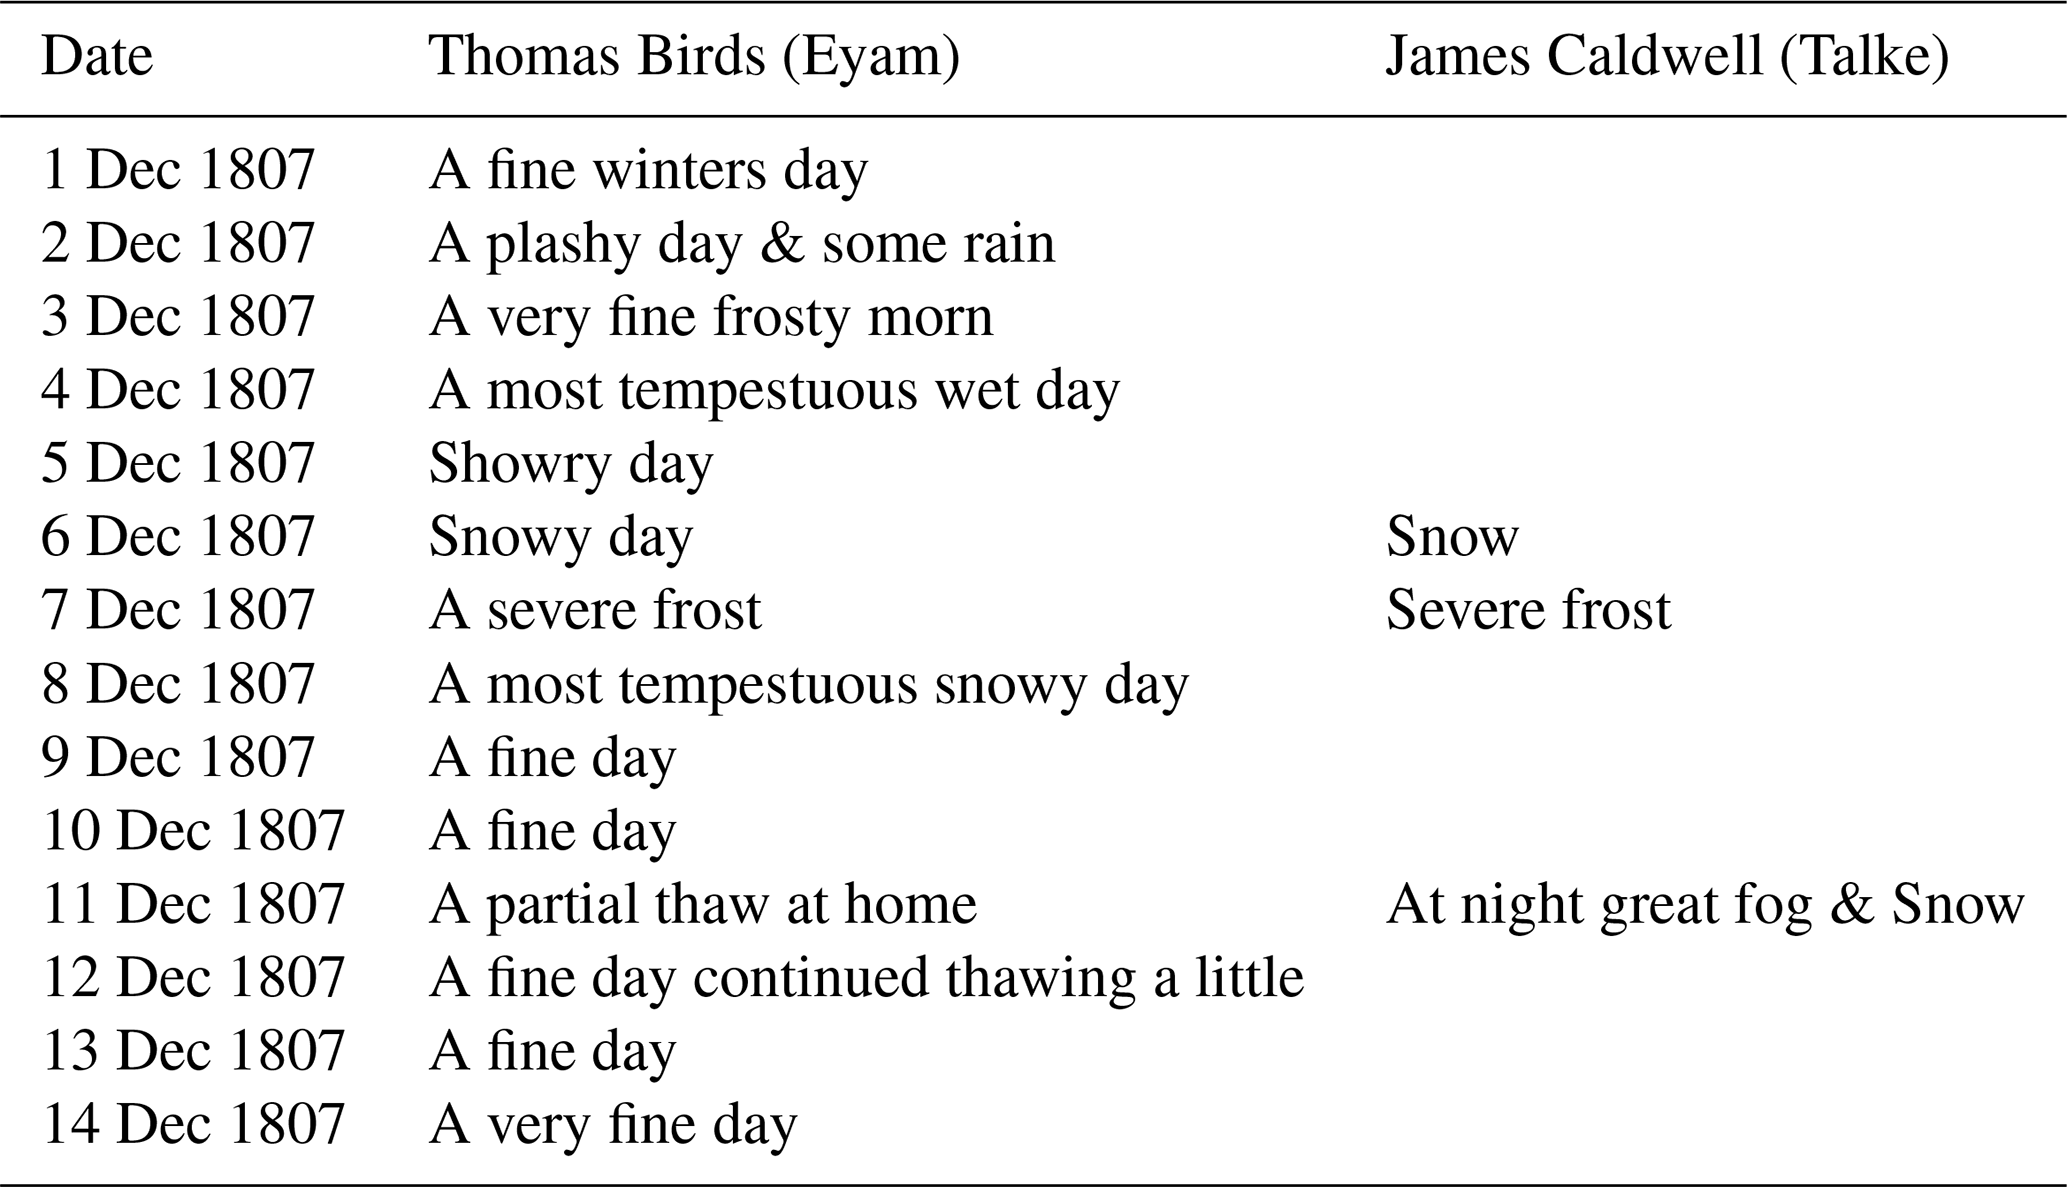
The quantity and quality of information contained within the sources impact the confidence in any derived index classification. A particular issue with diaries is that, when incomplete (not daily), they tend to only report more notable events and, in the UK and northern Europe, are biased towards snow and rainfall. Globally, biases towards recording extremes are not uncommon, but vary regionally. Nash (1996) noted a preference for documenting droughts in the Kalahari, whilst Endfield and O'Hara (1997) note a similar pattern towards droughts and water scarcity in central Mexico. Table 1 shows the entries for the first half of December 1807 from the diary of Thomas Birds (in Eyam in Derbyshire, SRO D1229/4/6/7) and James Caldwell (∼ 45 km away at Talke, in north Staffordshire). These demonstrate that James Caldwell is only recording particularly extreme days and does not report on “fine” days, and if we were to use these sources together to produce an index score for December 1807, this month might look rather colder and snowier than it was. While the London data demonstrate the benefits of having diarists recording simultaneously when producing indices, the source material must record both extreme and normal days.
Much of the collected data from Trentham, from William Lewis's memoranda and the farm reports do not include impacts, which limits their utility when considering extreme weather; however, they do record day-to-day activities such as harvest or ploughing, which may be delayed due to inclement or inappropriate weather.
While there is insufficient information in the documentary records to produce a temperature index, the Trentham farm reports include temperature measurements, taken at 08:00 and 20:00 GMT from 1821 onwards, while both Elizabeth Hervey and Richard Wilkes Unett had access to a thermometer and occasionally reported temperatures, particularly extremes. There is one day (14 July 1800) in the London series where they both report the temperature. Richard Wilkes Unett writes “Very close & warm. The glass today in a room where there are three doors was at 75∘ most of the day” from Woolwich (D3610/12/3, p. 127), while from Acton Lodge, Elizabeth Hervey writes “Hottest day we have yet had thermometer 75 in the shade” (D6584/C/93). Unfortunately, neither of these diarists consistently record the temperature, and because they both lived relatively transient lifestyles, the readings they give are not always from the same thermometer.
Different types of sources record weather differently, influencing how the resulting data can be used. Diaries often use weather as a starting point for an account of the day, as do some letters. Mundane weather acts as a space filler, a neutral topic. If a diary records the weather every day or a letter is not primarily about the weather, a full range of different types of weather are likely to be recorded. If, however, it is a diary that only records the weather occasionally, it is likely to record more unusual weather, for example heavy rain, snow, or frost (Table 1). Likewise, letters where the weather is one of the main topics are likely to record extreme weather events. The other type of weather that appears in letters is weather used to explain actions or inaction in estate correspondence. For example, William Lewis wrote to his superior, James Loch, in 1824: “I followed up the old proverb `make hay while the sun shines' the weather still remains favourable and dry and all have been busy with the Turnips which are in a very forward state and very promising.”
A further consideration is the purpose of the original diaries; most of the records are not intended to record the weather accurately for posterity, but are instead a record of someone's life and thoughts. A possible criticism of weather reconstructions from diaries is that they only record the weather during the daytime (Adamson, 2015). Whilst true, all the diaries used in this project tend to comment on heavy rain or snow if it occurs overnight, so if the object is to record rainfall, this may not always be problematic.
Careful analysis of the Elizabeth Hervey diaries presents a contrasting perspective to comments by Adamson (2015) that diaries as a source of information in climate research provide “highly personal documents... representing an unbiased account”. There is evidence in the diaries of Elizabeth Hervey of her reading aloud from her diaries for her friends and acquaintances and of the diaries being edited after her death by her son (with sections he considered uninteresting or unsuitable being redacted or removed). Although sometimes described as “private” diaries, these sources are not necessarily private but rather personal accounts which were regularly shared and performed.
Work on diaries to date has often focussed on specific weather diaries continuously recorded for long periods (Pfister and White, 2018b). This paper demonstrates the value and utility of personal diaries reflecting shorter periods, particularly when used alongside other nearby coeval diaries. In analysing over 27 500 records, providing a rich depiction of the weather in two regions of England during the periods 1797–1801 and 1816–1865, we demonstrate the considerable potential of personal diaries that recorded weather incidentally rather than as the primary purpose for reconstructing long weather series. The results demonstrate the potential of indices in weather reconstruction from qualitative sources. Having evaluated current approaches employed in such studies and based on our dataset of over 27 500 records, we advocate that future studies consider an approach that deploys a nuanced classification depicting heaviness of the rainfall (i.e. assigning a value of 0 to no precipitation, 0.25 to very light rain or heavy fog, 0.5 to showers or light rain, and 1 to heavy rain – our index C), as this provided the strongest correlations with existing nearby instrumental series. A pragmatic approach should be deployed to ensure that threshold selection (preferably between 16–28 d a month) results in the inclusion of an optimal number of months. If threshold selection is set too low or high then suboptimum results may be achieved.
This paper demonstrates that for periods with overlap between documentary sources, indices can create valuable and reliable records of precipitation. We demonstrate that while indices can statistically represent the nature of the rainfall comparably to available precipitation series in this period (1770–1865), they failed to represent extremes well. Further work is required that considers how extremes in descriptive records may be represented more effectively by indices, with potential for the use of statistical fitting approaches in defining classification bounds. In addition, alternative high-resolution indices could be created, such as consecutive dry days, which may be more useful than monthly data for investigating specific impacts such as drought (Pfister et al., 2020).
Personal diaries can provide greater spatial and temporal coverage than instrumental records currently offer, permitting the extension of existing weather and climate knowledge to areas where no, or limited, instrumental information exists. It is likely that diaries with the potential to be used in a similar way can be found in almost all regions of the world, with the potential to extend back much further than is often possible with instrumental series, as demonstrated by Chen et al. (2020) in considering the weather from fourteenth-century China. Even where instrumental records do exist, diaries can provide greater temporal resolution, overcoming challenges where only monthly or annual instrumental totals are available; as such it may enable the scaling of monthly or annual instrumental totals to the (sub-)daily scale. Descriptive accounts such as diaries can provide significant extra detail, enabling us to understand and contextualise the impacts of past extreme weather events, enabling us to contest and contextualise claims of uniqueness, unparalleled magnitude, or severity, within recent instrumental records. The qualitative nature of diaries means we can also consider the adaptive responses undertaken by individuals and communities to events and the nature of actions undertaken during periods between extremes that may exacerbate risk.
-
SRO D593/K/3/2/1: Trentham estate agent William Lewis's out letters to James Loch, 1819.
-
SRO D593/K/3/2/2: Trentham estate agent William Lewis's out letters to James Loch, 1820.
-
SRO D593/L/2/2b: Trentham estate agent William Lewis's memoranda book, used in construction of Trentham indices series, 1816–1837.
-
SRO D593/L/6/2/2: monthly general reports and farm, time, and pay reports for the Trentham Estate, used in construction of Trentham indices series, 1816–1826.
-
SRO D593/L/14-46: monthly general reports and farm, time and pay reports for the Trentham Estate, used in construction of Trentham indices series, 1832–1865.
-
SRO D1229/4/6/7: Thomas Birds' journal for 1807.
-
SRO D3610/12/2-3: journals of Richard Wilkes Unett for 1792–1797 and 1798–1803, used in the construction of the London indices series.
-
SRO D3610/4: journal of Thomas Unett for 1774.
-
SRO D6584/C/72-86, D6584/C/89-100: Elizabeth Hervey's journals, used in the construction of the London indices series.
-
Diaries of James Caldwell: transcribed material, available at: https://jjhc.info/caldwelljames1770-1808, last access: 17 April 2020.
The original archival materials used in this study, as detailed in the list of archive material, are available at the Staffordshire Record Office. The data used to create graphs are available from the corresponding author.
AHF prepared the paper, extracted data from the archives, ran a volunteer project extracting data from the archives, produced the indices, undertook the analysis, and made the figures. NM secured the funding, provided instrumental precipitation data, and contributed to the paper.
The authors declare that they have no conflict of interest.
This article is part of the special issue “International methods and comparisons in climate reconstruction and impacts from archives of societies”. It is not associated with a conference.
Some of the data used in this paper were collected by a group of volunteers at the Staffordshire Record Office as part of a Collaborative Doctoral Award Studentship. The authors would like to thank the project volunteers and the staff at the Staffordshire Record Office for their support and assistance. We would like to thank the reviewers David Nash and an anonymous reviewer for their helpful, insightful, and supportive comments on the paper.
This research has been supported by the Arts and Humanities Research Council (grant no. AH/N005147/1).
This paper was edited by Sam White and reviewed by David Nash and one anonymous referee.
Adamson, G. C. D.: Private diaries as information sources in climate research, Wiley Interdisciplinary Reviews, Climate Change, 6, 599–611, https://doi.org/10.1002/wcc.365, 2015.
Allan, R., Endfield, G., Damodaran, V., Adamson, G., Hannaford, M., Carroll, F., Macdonald, N., Groom, N., Jones, J., Williamson, F., Hendy, E., Holper, P., Arroyo-Mora, J. P. P., Hughes, L., Bickers, R., and Bliuc, A.-M. A. M.: Toward integrated historical climate research: The example of Atmospheric Circulation Reconstructions over the Earth, Wiley Interdisciplinary Reviews, Clim. Change, 7, 164–174, https://doi.org/10.1002/wcc.379, 2016.
Archer, D. R. and Fowler, H. J.: Characterising flash flood response to intense rainfall and impacts using historical information and gauged data in Britain, J. Flood Risk Manage., 11, S121–S133, https://doi.org/10.1111/jfr3.12187, 2018.
Ayre, M., Nicholls, J., Ward, C., and Wheeler, D.: Ships' logbooks from the Arctic in the pre-instrumental period, Geosci. Data J., 2, 53–62, https://doi.org/10.1002/gdj3.27, 2015.
Barrow, E. and Hulme, M.: Climates of the British Isles, Taylor and Francis, 2014.
Brázdil, R., Kiss, A., Luterbacher, J., Nash, D. J., and Řezníčková, L.: Documentary data and the study of past droughts: a global state of the art, Clim. Past, 14, 1915–1960, https://doi.org/10.5194/cp-14-1915-2018, 2018.
Brázdil, C., Řehoř, Z., Dolák, Ř., and Dobrovolný, P.: Potential of Documentary Evidence to Study Fatalities of Hydrological and Meteorological Events in the Czech Republic, Water, 11, 2014, https://doi.org/10.3390/w11102014, 2019a.
Brázdil, R., Valášek, H., Chromá, K., Dolák, L., Řezníčková, L., Bělínová, M., Valík, A., and Zahradníček, P.: The climate in south-east Moravia, Czech Republic, 1803–1830, based on daily weather records kept by the Reverend Šimon Hausner, Clim. Past, 15, 1205–1222, https://doi.org/10.5194/cp-15-1205-2019, 2019b.
Brohan, P., Allan, R., Freeman, J. E., Waple, A. M., Wheeler, D., Wilkinson, C., Woodruff, S., Brohan, P., Allan, R., Freeman, J. E., Waple, A. M., Wheeler, D., Wilkinson, C., and Woodruff, S.: Marine Observations of Old Weather, B. Am. Meteorol. Soc., 90, 219–230, https://doi.org/10.1175/2008BAMS2522.1, 2009.
Brönnimann, S., Allan, R., Ashcroft, L., Baer, S., Barriendos, M., Brázdil, R., Brugnara, Y., Brunet, M., Brunetti, M., Chimani, B., Cornes, R., Domínguez-Castro, F., Filipiak, J., Founda, D., Herrera, R. G., Gergis, J., Grab, S., Hannak, L., Huhtamaa, H., Jacobsen, K. S., Jones, P., Jourdain, S., Kiss, A., Lin, K. E., Lorrey, A., Lundstad, E., Luterbacher, J., Mauelshagen, F., Maugeri, M., Maughan, N., Moberg, A., Neukom, R., Nicholson, S., Noone, S., Nordli, Ø., Ólafsdóttir, K. B., Pearce, P. R., Pfister, L., Pribyl, K., Przybylak, R., Pudmenzky, C., Rasol, D., Reichenbach, D., Řezníčková, L., Rodrigo, F. S., Rohr, C., Skrynyk, O., Slonosky, V., Thorne, P., Valente, M. A., Vaquero, J. M., Westcottt, N. E., Williamson, F., and Wyszyński, Przemys.: Unlocking pre-1850 instrumental meteorological records a global inventory, B. Am. Meteorol. Soc., 100, ES389–ES413, https://doi.org/10.1175/BAMS-D-19-0040.1, 2019.
Camuffo, D., Cocheo, C., and Enzi, S.: Seasonality of instability phenomena (hailstorms and thunderstorms) in Padova, Northern Itlay, from archive and instrumental sources since AD 1300, The Holocene, 10, 635–642, https://doi.org/10.1191/095968300666845195, 2000.
Chen, S., Su, Y., Fang, X., and He, J.: Climate records in ancient Chinese diaries and their application in historical climate reconstruction – a case study of Yunshan Diary, Clim. Past, 16, 1873–1887, https://doi.org/10.5194/cp-16-1873-2020, 2020.
Dobrovolný, P., Moberg, A., Brázdil, R., Pfister, C., Glaser, R., Wilson, R., van Engelen, A., Limanówka, D., Kiss, A., Halíčková, M., Macková, J., Riemann, D., Luterbacher, J., and Böhm, R.: Monthly, seasonal and annual temperature reconstructions for Central Europe derived from documentary evidence and instrumental records since AD 1500, Clim. Change, 101, 69–107, https://doi.org/10.1007/s10584-009-9724-x, 2010.
Domínguez-Castro, F., García-Herrera, R., and Vaquero, J. M.: An early weather diary from Iberia (Lisbon, 1631-1632), Weather, 70, 20–24, https://doi.org/10.1002/wea.2319, 2015.
Druckenbrod, D. L., Mann, M. E., Stahle, D. W., Cleveland, M. K., Therrell, M. D., and Shugart, H. H.: Late-eighteenth-century precipitation reconstructions from James Madison's Montpelier plantation, B. Am. Meteorol. Soc., 84, 57–71, https://doi.org/10.1175/BAMS-84-1-57, 2003.
Endfield, G. H. and O'Hara, S. L.: Conflicts over water in 'the little drought age' in central Mexico, Environ. Hist., 3, 255–272, 1997.
Gergis, J., Karoly, D. J., and Allan, R. J.: A climate reconstruction of Sydney Cove, New South Wales, using weather journal and documentary data, 1788–1791, Aust. Meteorol. Ocean., 58, 83–98, https://doi.org/10.22499/2.5802.001, 2012.
Harvey-Fishenden, A., Macdonald, N., and Bowen, J. P.: Dry weather fears of Britain's early “industrial” canal network, Reg. Environ. Change 19, 2325–2337. https://doi.org/10.1007/s10113-019-01524-5, 2019.
Jones, C. A., Davies, S. J., and Macdonald, N.: Examining the social consequences of extreme weather: the outcomes of the 1946/1947 winter in upland Wales, UK, Clim. change, 113, 35–53, https://doi.org/10.1007/s10584-012-0413-9, 2012.
Kay, A. L.: A review of snow in Britain: The historical picture and future projections, Prog. Phys. Geogr., 40, 676–698, https://doi.org/10.1177/0309133316650617, 2016.
Kelso, C. and Vogel, C.: The climate of Namaqualand in the nineteenth century, Clim. Change, 83, 357–380, https://doi.org/10.1007/s10584-007-9264-1, 2007.
Lawrence, E. N.: The Earliest Known Journal of the Weather, Weather, 27, 494–501, https://doi.org/10.1002/j.1477-8696.1972.tb04255.x, 1972.
Lee, D. S. and MacKenzie, A. R.: Trans-hemispheric effects of large volcanic eruptions as recorded by an early 19th century diary, Int. J. Climatol., 30, 2217–2228, https://doi.org/10.1002/joc.2034, 2010.
Linderholm, H. and Molin, T.: Early nineteenth century drought in east central Sweden inferred from dendrochronological and historical archives, Clim. Res., 29, 63–72, https://doi.org/10.3354/cr029063, 2005.
Luterbacher, J. and Pfister, C.: The year without a summer, Nat. Geosci.,8, 246–248, https://doi.org/10.1038/ngeo2404, 2015.
Macdonald, N., Jones, C. A., Davies, S. J., and Charnell-White, C.: Historical weather accounts from Wales: An assessment of their potential for reconstructing climate, Weather, 65, 72–81, https://doi.org/10.1002/wea.418, 2010.
Manley, G.: Constantia Orlebar's weather book, 1786–1808, Q. J. Roy. Meteorol. Soc., 81, 622–625, https://doi.org/10.1002/qj.49708135017, 1955.
Manley, G.: On the frequency of snowfall in metropolitan England, Q. J. Roy. Meteorol. Soc., 84, 70–72, https://doi.org/10.1002/qj.49708435910, 1958a.
Manley, G.: Studies on the Frequency of Snowfall in England 1668–1956 and the Relation with Glacier Behaviour, in Assemblee Generale De Toronto/General Assembly of Toronto, 1957, 46, 40–45., 1958b.
Manley, G.: Snowfall in Britain over the past 300 years, Weather, 24, 428–437, https://doi.org/10.1002/j.1477-8696.1969.tb03117.x, 1969.
Mayes, J.: Changing regional climatic gradients in the United Kingdom, The Geogr. J., 166, 125–138, https://doi.org/10.1111/j.1475-4959.2000.tb00013.x, 2000.
Mikami, T.: Climatic variations in Japan reconstructed from historical documents, Weather, 63, 190–193, https://doi.org/10.1002/wea.281, 2008.
Miller, J. D., Kjeldsen, T. R., Hannaford, J., and Morris, D. G.: A hydrological assessment of the November 2009 floods in Cumbria, UK, Hydrol. Res., 44, 180–197, https://doi.org/10.2166/nh.2012.076, 2013.
Murphy, C., Broderick, C., Burt, T. P., Curley, M., Duffy, C., Hall, J., Harrigan, S., Matthews, T. K. R., Macdonald, N., McCarthy, G., McCarthy, M. P., Mullan, D., Noone, S., Osborn, T. J., Ryan, C., Sweeney, J., Thorne, P. W., Walsh, S., and Wilby, R. L.: A 305-year continuous monthly rainfall series for the island of Ireland (1711–2016), Clim. Past, 14, 413–440, https://doi.org/10.5194/cp-14-413-2018, 2018.
Murphy, C., Wilby, R. L., Matthews, T. K. R., Thorne, P., Broderick, C., Fealy, R., Hall, J., Harrigan, S., Jones, P., McCarthy, G., MacDonald, N., Noone, S., and Ryan, C.: Multi-century trends to wetter winters and drier summers in the England and Wales precipitation series explained by observational and sampling bias in early records, Int. J. Climatol., 40, 610–619, https://doi.org/10.1002/joc.6208, 2020.
Nash, D. J.: On the dry valleys of the Kalahari: documentary evidence of environmental change in central southern Africa, Geogr. J., 162, 154–168, 1996.
Nash, D. J. and Grab. S. W.: “A sky of brass and burning winds”: documentary evidence of rainfall variability in the Kingdom of Lesotho, Southern Africa, 1824 – 1900', Clim. Change, 101, 617–653, https://doi.org/10.1007/s10584-009-9707-y, 2010.
Nash, D. J., Pribyl, K., Klein, J., Neukom, R., Endfield, G. H., Adamson, G. C. D., and Kniveton, D. R.: Seasonal rainfall variability in southeast Africa during the nineteenth century reconstructed from documentary sources, Clim. Change, 134, 605–619, https://doi.org/10.1007/s10584-015-1550-8, 2016.
Oliver, J.: The use of weather diaries in the study of historic climates, Weather, 13, 251–256, https://doi.org/10.1002/j.1477-8696.1958.tb02385.x, 1958.
Pfister, C.: Monthly temperature and precipitation in central Europe 1525–1979: quantifying documentary evidence on weather and its effects, in: Climate Since A.D. 1500, edited by: Bradley, R. S. and Jones, P. D., Routledge, London, New York, 118–142, 1992.
Pfister, C. and White, S.: A year without a summer, 1816, in: The Palgrave Handbook of Climate History, Palgrave Macmillan, 551–561, 2018a.
Pfister, C. and White, S.: Evidence from the archives of societies: Personal documentary sources, in: The Palgrave Handbook of Climate History, Palgrave Macmillan, London, 49–65, 2018b.
Pfister, C., Garnier, E., Alcoforado, M.-J., Wheeler, D., Luterbacher, J., Nunes, M. F., and Taborda, J. P.: The meteorological framework and the cultural memory of three severe winter-storms in early eighteenth-century Europe, Clim. Change, 101,281–310, https://doi.org/10.1007/s10584-009-9784-y, 2010.
Pfister, L., Brönnimann, S., Schwander, M., Isotta, F. A., Horton, P., and Rohr, C.: Statistical reconstruction of daily precipitation and temperature fields in Switzerland back to 1864, Clim. Past, 16, 663–678, https://doi.org/10.5194/cp-16-663-2020, 2020.
Sanderson, M. G.: Daily weather in Dublin 1716-1734: the diary of Isaac Butler, Weather, 73, 179–182, https://doi.org/10.1002/wea.3029, 2018.
Sangster, H., Jones, C., and Macdonald, N.: The co-evolution of historical source materials in the geophysical, hydrological and meteorological sciences: Learning from the past and moving forward, Progr. Phys. Geogr., 42, 61–82, https://doi.org/10.1177/0309133317744738, 2018.
Schove, D. J. and Reynolds, D.: Weather in Scotland, 1659–1660: The diary of Andrew Hay, Ann. Sci., 30, 165–177, https://doi.org/10.1080/00033797300200091, 1973.
Spencer, M., Essery, R., Chambers, L., and Hogg, S.: The Historical Snow Survey of Great Britain: Digitised Data for Scotland, Scott. Geogr. J., 130, 252–265, https://doi.org/10.1080/14702541.2014.900184, 2014.
Strauss, S. and Orlove, B. S.: Weather, climate, culture, Berg, Oxford, 2003.
Stothers, R. B.: The Great Tambora Eruption in 1815 and its aftermath, Science, 224, 1191–1198, https://doi.org/10.1126/science.224.4654.1191., 1984.
Symons, G. J.: A contribution to the history of rain gauges, Q. J. Roy. Meteorol. Soc., 17, 127–142, https://doi.org/10.1002/qj.4970177901, 1891.
Talento, S., Schneider, L., Werner, J., and Luterbacher, J.: Millennium-length precipitation reconstruction over south-eastern Asia: a pseudo-proxy approach, Earth Syst. Dynam., 10, 347–364, https://doi.org/10.5194/esd-10-347-2019, 2019.
Todd, B., Macdonald, N., Chiverrell, R. C., Caminade, C., and Hooke, J. M.: Severity, duration and frequency of drought in SE England from 1697 to 2011, Clim. Change, 121, 673–687, https://doi.org/10.1007/s10584-013-0970-6, 2013.
Todd, B., Macdonald, N., and Chiverrell, R. C.: Revision and extension of the composite Carlisle rainfall record, northwest England: 1757–2012, Int. J. Climatol., 35, 3593–3607, 2015.
Veale, L. and Endfield, G. H.: Situating 1816, the 'year without a summer' in the UK, Geogr. J., 182, 318–330, https://doi.org/10.1111/geoj.12191, 2016.
Walsh, R. P. D., Glaser, R., and Militzer, S.: The climate of Madras during the eighteenth century, Int. J. Climatol., 19, 1025–1047, https://doi.org/10.1002/(SICI)1097-0088(199907)19:9<1025::AID-JOC402>3.0.CO;2-F, 1999.
Wetter, O., Pfister, C., Werner, J. P., Zorita, E., Wagner, S., Seneviratne, S. I., Herget, J., Grünewald, U., Luterbacher, J., Alcoforado, M.-J., Barriendos, M., Bieber, U., Brázdil, R., Burmeister, K. H., Camenisch, C., Contino, A., Dobrovolný, P., Glaser, R., Himmelsbach, I., Kiss, A., Kotyza, O., Labbé, T., Limanówka, D., Litzenburger, L., Nordl, Ø., Pribyl, K., Retsö, D., Riemann, D., Rohr, C., Siegfried, W., Söderberg, J., and Spring, J.-L.: The year-long unprecedented European heat and drought of 1540 – a worst case, Clim. Change, 125, 349–363, https://doi.org/10.1007/s10584-014-1184-2, 2014.
Wheeler, D.: The weather diary of Margaret Mackenzie of Delvine (Perthshire): 1780-1805, Scot. Geogr. Mag., 110, 177–182, https://doi.org/10.1080/00369229418736926, 1994.
Woodworth, P. L.: The meteorological data of William Hutchinson and a Liverpool air pressure time series spanning 1768–1999, Int. J. Climatol., 26, 1713–1726, https://doi.org/10.1002/joc.1335, 2006.
Zhang, X. Z., Ge, Q. S., Fang, X. Q., Zheng, J. Y., and Fei, J.: Precipitation variations in Beijing during 1860-1897 AD revealed by daily weather records from the Weng Tong-He Diary, Int. J. Climatol., 33, 568–576, https://doi.org/10.1002/joc.3448, 2013.
- Abstract
- Introduction
- Qualitative historical materials
- Indices and instrumental rainfall data
- Testing correlation with instrumental rainfall data for London
- Analysis of the Trentham records for north Staffordshire
- Extreme weather: indices as recorders of snow, rain, and droughts
- “The year without a summer” (1816) in Staffordshire
- Confidence in documentary source reconstructions
- Conclusions
- Archival sources
- Data availability
- Author contributions
- Competing interests
- Special issue statement
- Acknowledgements
- Financial support
- Review statement
- References