the Creative Commons Attribution 4.0 License.
the Creative Commons Attribution 4.0 License.
 | 30 Jan 2020
Effect of precipitation seasonality on annual oxygen isotopic composition in the area of spring persistent rain in southeastern China and its paleoclimatic implication
Hai Cheng
Yanjun Cai
Christoph Spötl
Ashish Sinha
Gayatri Kathayat
Hanying Li
This study examines the seasonality of precipitation amount and δ18O over the monsoon region of China (MRC). We found that the precipitation amount associated with the East Asian summer monsoon (EASM) in the spring persistent rain (SPR) region is equivalent to that of the nonsummer monsoon (NSM). The latter contributes ∼50 % to amount-weighted annual δ18O values, in contrast with other areas in the MRC, where the δ18O of annual precipitation is dominated by EASM precipitation. Interannual relationships between the El Niño–Southern Oscillation (ENSO) index, simulated δ18O data from IsoGSM, and seasonal precipitation amount in the SPR region were also examined. We found that on interannual timescales, the seasonality of precipitation amount (EASM ∕ NSM ratio) was modulated by ENSO and primarily influences the variability of amount-weighted annual precipitation δ18O values in the SPR region, although integrated regional convection and moisture source and transport distance may also play subordinate roles. During El Niño (La Niña) phases, less (more) EASM and more (less) NSM precipitation leading to lower (higher) EASM ∕ NSM precipitation amount ratios results in higher (lower) amount-weighted annual precipitation δ18O values and, consequently, in higher (lower) speleothem δ18O values. Characterizing spatial differences in seasonal precipitation is, therefore, key to correctly interpreting speleothem δ18O records from the MRC.
- Article
(6518 KB) - Full-text XML
-
Supplement
(362 KB) - BibTeX
- EndNote


Summertime rainfall over the MRC is largely associated with the East Asian summer monsoon (EASM) (Fig. 1a) (Ding, 1992). However, a significant portion of annual rainfall in southeastern China also occurs during springtime (i.e., from March to mid-May), known as the spring persistent rain (SPR). The SPR occurs mostly south of the middle and lower reaches of the Yangtze river (∼24 to 30∘ N, 110 to 120∘ E) (Fig. 1b) and is a unique synoptic and climatic phenomenon in East Asia (Tian and Yasunari, 1998; Wan and Wu, 2007, 2009). The SPR is another rainy period before the Meiyu rain period in early summer, and it covers the region from southeastern China to the south of Japan. It has long been debated whether the SPR marks the onset of EASM. Ding (1992) called SPR an “early summer rainy season” and considered it as a part of the summer monsoon rainfall (Ding et al., 1994). He et al. (2008) suggested that the SPR marks the establishment of the East Asian subtropical monsoon, which is considered a component of the EASM. Other studies suggest that the SPR is unrelated to EASM rainfall, and they consider it as an extension of winter atmospheric circulation (Tian and Yasunari, 1998; Wan and Wu, 2009). Wang and Lin (2002) proposed that the SPR over southeastern China is not a part of the EASM, because the large-scale circulation and rain-bearing systems differ from those associated with summer monsoon rainfall. Tian and Yasunari (1998) suggested that the SPR is the effect of the land–sea thermal contrast, and it is unrelated to topographical effects, as there is a coherent increase in the spring rain from southeastern China to southern Japan. Wan et al. (2008a, 2009) proposed that the formation of SPR is primarily influenced by the mechanical and thermal forcing of the Tibetan Plateau. Without this topographic element, the SPR rain belt would not exist. Climatic factors from the mid to high latitudes and the tropics also influence the interannual variability of the SPR (Feng and Li, 2011; Wu and Kirtman, 2007; Wu and Mao, 2016).
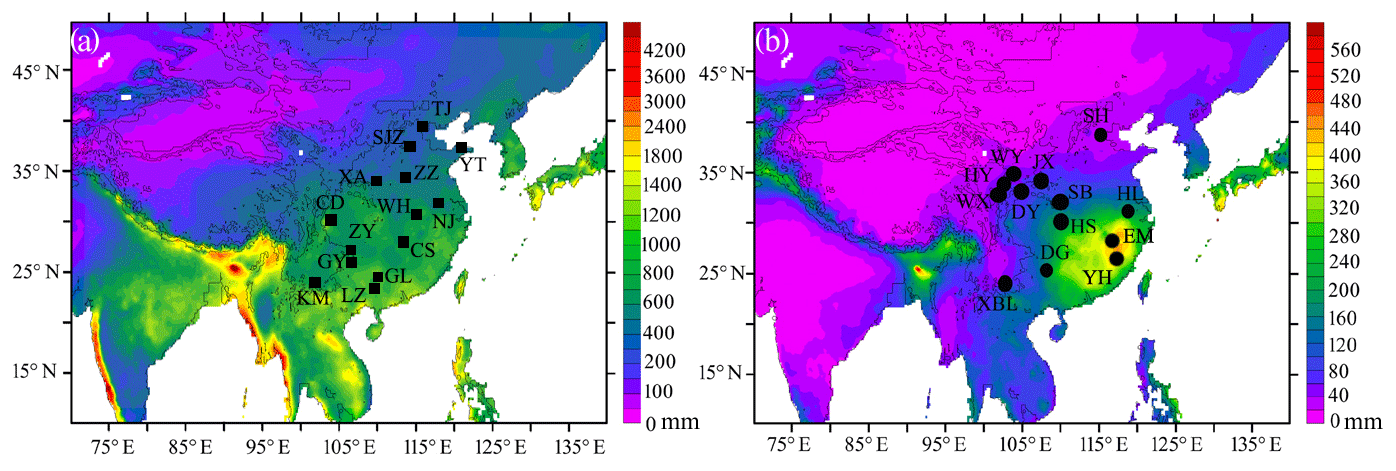
Figure 1Overview map showing the spatial distribution of seasonal precipitation amount in China and locations mentioned in this study. (a) Regional mean EASM (May–September) precipitation amount (mm) in China from 1951 to 2007. The black squares represent the locations of the Global Network for Isotopes in Precipitation (GNIP) stations (TJ is Tianjin, YT is Yantai, SJZ is Shijiazhuang, XA is Xi'an, ZZ is Zhengzhou, NJ is Nanjing, WH is Wuhan, CS is Changsha, CD is Chengdu, ZY is Zunyi, GY is Guiyang, GL is Guilin, LZ is Liuzhou, KM is Kunming; details can be found in Table 1). (b) Regional mean SPR (March–April) precipitation amount (mm) in China from 1951 to 2007. The SPR is obvious in southeastern China from about 24 to 30∘ N and from 110 to 120∘ E. The black circles represent the locations of caves with published stalagmite records (SH is Shihua cave, Li et al., 2017; HL is Hulu cave, Wang et al., 2001; SB is Sanbao cave, Cheng et al., 2016; HS is Heshang cave, Hu et al., 2008; DG is Dongge cave, Yuan et al., 2004; XBL is Xiaobailong cave, Tan et al., 2017; WY is Wuya cave, Tan et al., 2014; DY is Dayu cave, Tan et al., 2009; WX is Wanxiang cave, Zhang et al., 2008; HY is Huangye cave, Tan et al., 2010; EM is E'mei cave, Zhang et al., 2018; and YH is Yuhua cave, Jiang et al., 2012). Precipitation data source: APHRODITE (Asian Precipitation – Highly-Resolved Observational Data Integration Towards Evaluation of Water Resources, APHRO_MA_V1101R2 product, (21)) (Yatagai et al., 2009).
Although considerable emphasis has been placed on understanding the causes and mechanisms of SPR, little is known about its precipitation δ18O (δ18Op) variability and about the mechanisms that produce this variability (Tan, 2016; Zhang, 2014). Based on rainfall monitoring data from eight sites in the EASM region, Tan et al. (2016) found that, in 2012 CE, the spring rainfall amount was equivalent to the summer rainfall, but their δ18Op values were different. They suggested that the seasonal δ18Op variability is affected by the changes in moisture source but not the precipitation amount variations. Huang et al. (2017) and Wu et al. (2015) studied the δ18Op variability at the Changsha station located in the SPR region and its relationship with the El Niño–Southern Oscillation (ENSO) (Fig. 1a), but they did not focus on the δ18Op variability of SPR. A better understanding of the δ18Op variability in the SPR region on seasonal to interannual timescales, however, is crucial for a robust interpretation of the oxygen isotopic data of Chinese speleothems from this region (e.g., Cai et al., 2015; Cheng et al., 2009, 2016; Wang et al., 2001, 2008; Yuan et al., 2004; Zhang et al., 2008). Several mechanisms including the amount effect, moisture source and transport distance, integrated regional convection, winter temperature, and precipitation seasonality have been shown to influence the δ18Op and speleothem δ18O to various degrees and at different timescales across the MRC (Cai et al., 2018; Caley et al., 2014; Cheng et al., 2016; Clemens et al., 2010; Dayem et al., 2010; Maher, 2008, 2016; Maher and Thompson, 2012; Pausata et al., 2011; Tan, 2016; Zhang et al., 2018). The SPR region is located within the area of the EASM, and its rainy season includes both summertime monsoon rainfall and SPR (Wan and Wu, 2009). Therefore, the factors that influence the δ18Op in this region are likely complex. The aim of this study is to examine this climate–δ18O proxy relationship during the instrumental period. To this end, we compare the seasonal variations of precipitation amount and δ18Op in the SPR region with other regions of the MRC and discuss the interannual variations and their relationship with the large-scale ocean–atmosphere circulation.
2.1 Meteorological data
A daily gridded precipitation dataset for 1951–2007 was obtained from APHRODITE (Asian Precipitation – Highly-Resolved Observational Data Integration Towards Evaluation of Water Resources, APHRO_MA_V1101R2 product, (21)) (Yatagai et al., 2009). The regional mean SPR (March–April) and EASM (May–September) precipitation amounts in China from 1951 to 2007 are shown in Fig. 1, which was exported based on this dataset using the free software Ferret (https://ferret.pmel.noaa.gov/Ferret, last access: 3 November 2019).
Monthly precipitation datasets of 160 meteorological stations in China for the period 1951–2014, obtained from the National Climate Center (https://www.ncc-cma.net/, last access: 3 November 2019), were used to characterize the percentage of spring (March–April) and EASM (May–September) precipitation amount relative to the annual precipitation amount in China.
Monthly mean δ18Op and precipitation amount data from meteorological stations across the MRC were obtained from the Global Network for Isotopes in Precipitation (GNIP) (http://www.iaea.org/, last access: 3 November 2019) (Table 1 and Fig. 1a). The monthly mean δ18Op data are used to compare the seasonal to interannual variation of δ18Op in the MRC. The stations near the coast from the southeastern region of the MRC (Fuzhou, Haikou, Hong Kong, Guangzhou) were excluded, because their precipitation amount and δ18Op are significantly influenced by typhoons in summer and autumn. Changsha station is the only GNIP station in the SPR region.
2.2 δ18Op data from IsoGSM simulations
IsoGSM is a water isotope-permitting general circulation model (Yoshimura et al., 2008). We use the product of IsoGSM nudged toward the NCEP/NCAR Reanalysis 2 (Kanamitsu et al., 2002) atmosphere and forced with observed sea-surface temperatures (SST) and sea ice data (Yoshimura et al., 2008). A detailed description of the model setup can be found in Yoshimura et al. (2008) and Yang et al. (2016). IsoGSM can reproduce reasonably well monthly variabilities of precipitation and water vapor isotopic compositions associated with synoptic weather cycles. In order to verify the reliability of the simulated data from IsoGSM, we first cross-compare the data from GNIP Changsha station with those from IsoGSM during 1988–1992. The good replication indicates that both the precipitation amount and the δ18O data from the IsoGSM simulation are consistent (Supplement Fig. S1).
2.3 Ocean–atmosphere circulation index
ENSO plays an important role in governing the climatic variation in the MRC (e.g., Feng and Hu, 2004; Xue and Liu, 2008; Zhou and Chan, 2007). We used the Southern Oscillation Index (SOI) and the Multivariate ENSO Index (MEI) to calculate the correlations between the phases of ENSO, the δ18Op, and the seasonal precipitation amount. The SOI is defined as the normalized pressure difference between Tahiti and Darwin. Negative and positive values of SOI represent El Niño and La Niña events, respectively. The data were obtained from the Australian Government Bureau of Meteorology (http://www.bom.gov.au/climate/current, last access: 3 November 2019). The MEI is based on six ocean–atmosphere variables (sea-level pressure, zonal and meridional components of the surface wind, SST, and total cloudiness fraction of the sky) over the tropical Pacific, and it is used to examine the role of ENSO in influencing the rainfall over the MRC. The MEI is defined as the first principal component of the abovementioned six variable fields. Therefore, it provides a more complete description of the ENSO phenomenon than a single variable ENSO index such as the SOI or Niño 3.4 SST (Wolter and Timlin, 2011). Positive and negative values of MEI represent El Niño and La Niña events, respectively. The data were obtained from the website of the Earth System Research Laboratory, National Oceanic and Atmospheric Administration (NOAA) (http://www.cdc.noaa.gov/people/klaus.wolter/MEI, last access: 3 November 2019). Tropical Pacific SST show a La Niña phase during the period from May 1988 to May 1989 and an El Niño phase during the period from May 1991 to June 1992. Therefore, we define 1988–1989 as La Niña years (1988 is the developing year and 1989 is the decaying year of the La Niña event) and 1991–1992 as El Niño years (1991 is the developing year and 1992 is the decaying year of the El Niño event) in this paper.
The Arctic Oscillation (AO) can also influence the climate and precipitation over the MRC (Gong et al., 2001, 2011; He et al., 2017; Li et al., 2014). It was suggested that a warmer winter in East Asia (a positive winter AO value) is associated with increased winter rainfall in southern parts of East Asia, and a positive spring AO is followed by increased rainfall in southern China but decreased rainfall in the lower valley of the Yangtze river (He et al., 2017). We also calculated the correlation between the AO index and the seasonal rainfall amount in our study area. The data were downloaded from the website of NOAA (https://www.cpc.ncep.noaa.gov/products/precip/CWlink/daily_ao_index/ao.shtml#forecast, last access: 3 November 2019).
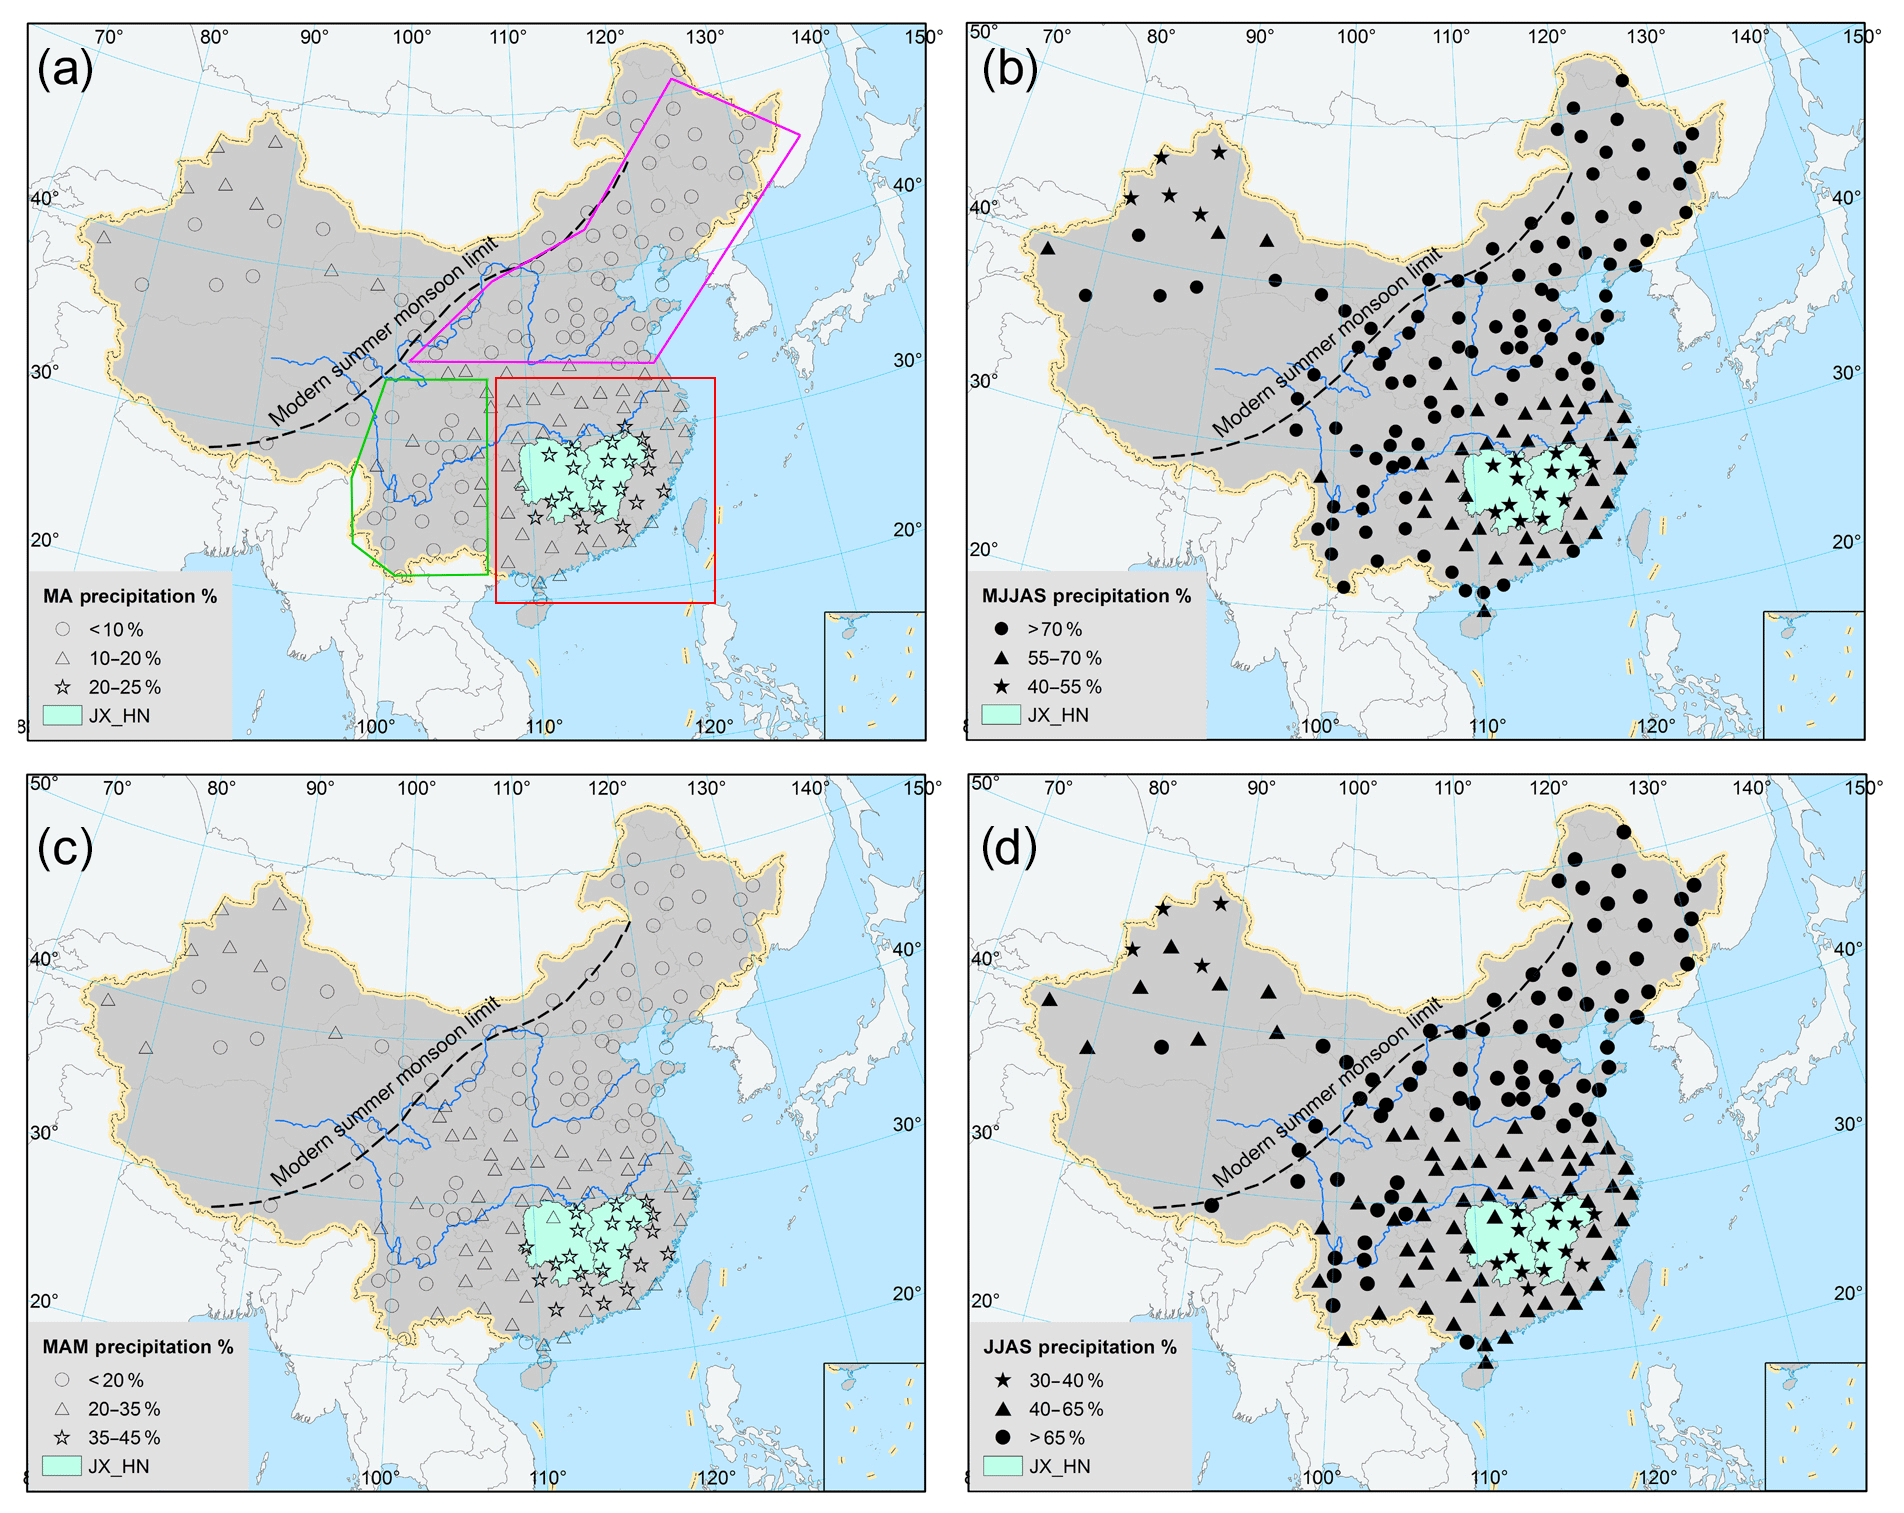
Figure 2The percentage of spring (a, March to April) and EASM (b, May to September) precipitation amount relative to the annual precipitation amount in the study area. Panels (c) and (d) are similar to (a) and (b), except that spring precipitation is shown from March to May in (c) and EASM precipitation between June and September in (d). The Jiangxi and Hunan provinces (JX_HN) are highlighted in jade color. The monthly precipitation data (1951–2014) from 11 meteorological stations (Jiujiang, Guixi, Nanchang, Guangchang, Ji'an, Ganzhou, Changsha, Yueyang, Hengyang, Chenzhou, Xinning) in Jiangxi Province and the eastern Hunan Province were used to examine the relationship between ocean-atmospheric circulation, precipitation amount, and δ18O in the SPR region. The red, pink, and green polygons in panel (a) indicate southeastern, northern, and southwestern regions of the MRC, respectively.
2.4 Back-trajectory and moisture source contribution calculations
The HYbrid Single-Particle Lagrangian Integrated Trajectory model (HYSPLIT) (Stein et al., 2015) was used to perform air mass back-trajectory calculations for the GNIP Changsha station during the period 1988–1992. In order to qualitatively assess the moisture source regions and transport paths for rainy season precipitation, only air mass back trajectories for precipitation-producing days were used. Trajectories were initiated four times daily (at 00:00, 00:60, 12:00, and 18:00 UTC) during precipitating days (> 1 mm precipitation per day) and their air parcel was released at 1500 m above ground level and moved backward by winds for 120 h (5 d). To identify the moisture uptake locations along the back trajectories during 1988–1992, we followed the method described in Sodemann et al. (2008) and Krklec et al. (2018). Two criteria (i.e., a more conservative threshold of positive gradient in specific humidity (0.2 g kg−1 within 6 h) and initial relative humidity of more than 80 %) were used to identify moisture uptake locations along the back trajectories. Following the methodology of Krklec et al. (2018), we calculated the contributions of moisture uptake locations en route to the precipitation in GNIP Changsha station and provided a map showing the percentage of moisture uptake contributing to Changsha precipitation during La Niña (1988–1989) and El Niño (1991–1992) years. A grid of ∘ was used for the computation of the moisture uptake locations.
3.1 Proportions of SPR, EASM, and NSM precipitation over MRC
We calculated the mean ratios of spring (March–April) to annual precipitation (denoted as spring ∕ annual) and EASM (May-to-September) to annual precipitation (denoted as EASM ∕ annual) ratios for the period 1951–2014. Figure 2a shows that the mean percentage of spring ∕ annual in southeastern China (about 20 to 33∘ N and 107 to 122∘ E, red rectangle in Fig. 2a), which range from 10 % to 25 % and from 0 % to 10 % in northern (about 33 to 53∘ N and 100 to 134∘ E, pink polygon in Fig. 2a) and southwestern regions of the MRC (about 20 to 33∘ N, 9 to 107∘ E, green polygon in Fig. 2a), respectively. The Jiangxi and the eastern Hunan provinces, the core regions of the SPR, show the highest mean percentage of spring ∕ annual within the MRC (20 %–25 %), which is consistent with the results from the previous studies (Tian and Yasunari, 1998; Wan and Wu, 2009). Fig. 2b shows that the mean percentage of EASM ∕ annual is 40 %–70 % in southeastern China and 70 %–95 % in other regions of the MRC. Conversely, the mean percentage of nonsummer monsoon precipitation to annual precipitation (NSM ∕ annual) is 30 %–60 % in southeastern China and 5 %–30 % in other regions of the MRC, and it reaches the maximum in the SPR region (45 %–60 %). This indicates that the proportion of EASM precipitation (40 %–55 %) is nearly equivalent to the proportion of NSM precipitation (45 %–60 %) in the SPR region.
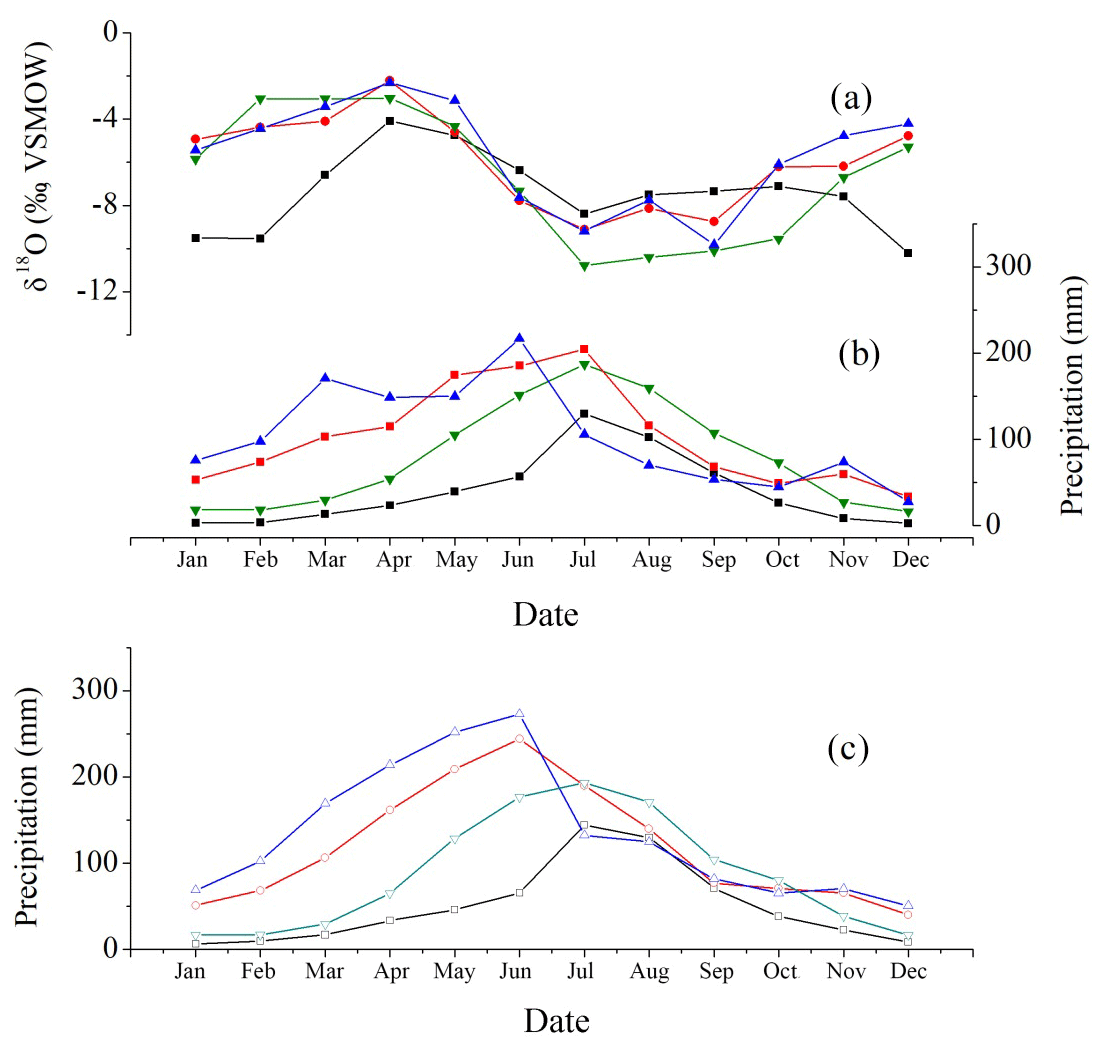
Figure 3Monthly mean δ18Op (a) and precipitation amount (b) data from GNIP stations in northern region of the MRC (black lines), southwestern region of the MRC (green lines), southeastern China (red lines), and the SPR region (blue lines, Changsha station) as grouped in Table 1. (The spatial distribution of the GNIP stations are shown in Fig. 1a.) (c) Monthly mean precipitation data from the meteorological stations closest to the GNIP stations in northern region of the MRC (black lines), southwestern region of the MRC (jade lines), southeastern China (red lines), and the SPR region (blue lines).
Usually, the SPR period lasts from March to mid-May (Wan and Wu, 2009) and the EASM period lasts from mid-May to September (Wang and Lin, 2002); however, the onset and/or retreat time of SPR and EASM and their intensities vary in different years (Zhou and Chan, 2007). The EASM starts late (late May to early June) and tends to be weaker during El Niño years (Huang et al., 2012), and EASM precipitation amount over southeastern China is reduced when the SPR starts later and lasts longer (until late May) (Wan et al., 2008a). Therefore, if we define the March-to-May precipitation as SPR and the June-to-September precipitation as EASM in El Niño years, the mean percentage of SPR ∕ annual in the SPR region is 35 %–45 % (Fig. 2c), the mean percentage of EASM ∕ annual is only 30 %–40 % (Fig. 2d), and the mean percentage of NSM ∕ annual is 60 %–70 %. However, in other regions of the MRC, the mean percentage of EASM ∕ annual (65 %–90 %) is still much higher than the mean percentage of NSM ∕ annual (10 %–35 %) (Fig. 2c and d). Conversely, during La Niña years, the March–April and May-to-September precipitation should be defined as SPR and EASM precipitation, respectively (Fig. 2a and b). Therefore, the distribution of EASM vs. NSM precipitation amount in the SPR region is distinctly different from that in other regions of the MRC, and the ratio of EASM ∕ NSM precipitation amount in the SPR region might be influenced by ENSO. We discuss this in detail in the Sect. 4.2.
3.2 Seasonal precipitation δ18Op and amount over the MRC
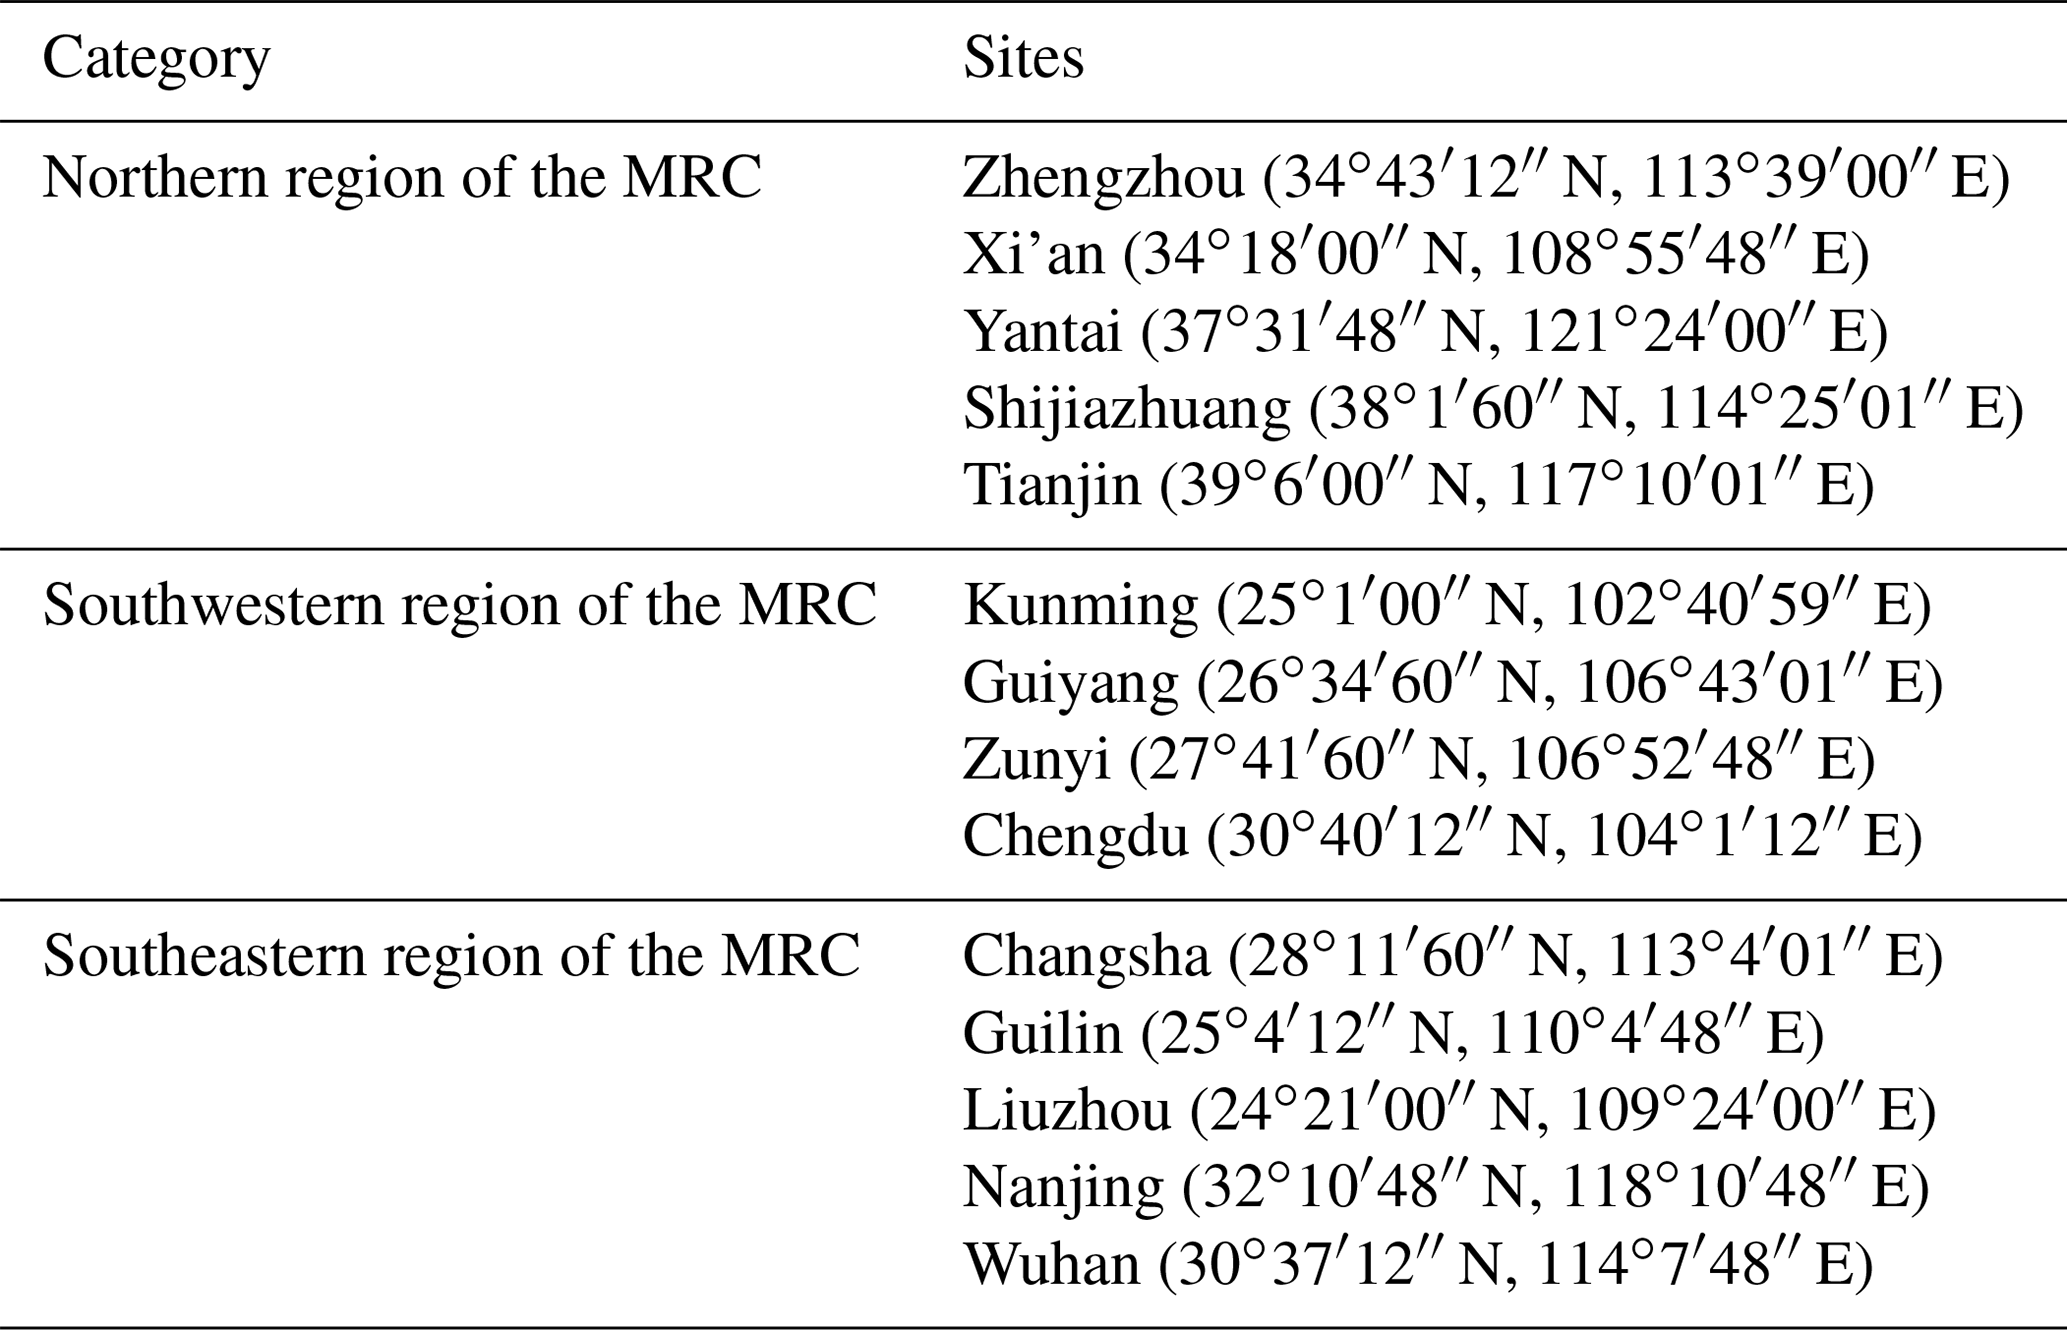
We compared the seasonal variations of precipitation amount and δ18Op in the SPR region with those in other regions of the MRC by using data from the GNIP stations. According to the spatial distribution of EASM precipitation as discussed in Sect. 3.1, we assigned Zhengzhou, Xi'an, Yantai, Shijiazhuang, and Tianjin GNIP stations to northern region of the MRC; Kunming, Guiyang, Zunyi, and Chengdu GNIP stations to southwestern region of the MRC; and Changsha, Guilin, Liuzhou, Nanjing, and Wuhan GNIP stations to southeastern China. Only the Changsha GNIP station is located in the SPR region (Table 1 and Fig. 1a).
Table 1GNIP stations used for the comparison of the seasonal precipitation amount and δ18Op in the MRC.
The seasonal variation of δ18Op in the MRC is consistently related to the onset, advancement, and retreat of the EASM. The δ18Op values decrease in May as the summer monsoon starts (Fig. 3). The δ18Op values are relatively low during the monsoon season (June–August) (Fig. 3) because of the long-distance transport of water vapor from the distal Indian Ocean to the MRC. Along this pathway, progressive rainout associated with regional convection leads to more negative δ18Op values via Rayleigh distillation (Baker et al., 2015; He et al., 2018; Liu et al., 2010; Moerman et al., 2013; Tan, 2014). The δ18Op values become progressively higher as the EASM withdraws in September (Fig. 3). From October to next April, the δ18Op values are rather high (Fig. 3), resulting from the short-distance transport of water vapor from the western Pacific Ocean or local moisture recycling and local convection (He et al., 2018; Moerman et al., 2013; Tan et al., 2016; Wu et al., 2015). The low δ18Op values in winter in northern region of the MRC are caused by the temperature effect, but it is less important because of its small contribution to the amount-weighted mean annual precipitation δ18O (δ18Ow) (Cheng et al., 2012). Therefore, the seasonal δ18Op values over the MRC show a broadly consistent pattern reaching a maximum in March–April and a minimum in July–August in the MRC with the exception of low winter δ18Op values in northern region of the MRC.
Given that there are only a few years of data from those GNIP stations, we obtained the mean monthly precipitation amount from the nearest meteorological station to each GNIP station in the MRC for the period 1951–2014 (Fig. 3c). Both datasets show that the seasonal variation of precipitation amount in southeastern China, especially in the SPR region, is different from that in other regions of the MRC (Fig. 3b and c). The precipitation amount in March and April before the onset of EASM is high over southeastern China. It is even higher than the summer monsoon precipitation amount in June, July, and August in other regions of the MRC. In the SPR region, the summer monsoon precipitation amount in July–August is much smaller than the precipitation in March–April. However, in other regions of the MRC, the summer monsoon precipitation in July–August is the highest of the whole year.
3.3 Moisture source contribution to precipitation in Changsha station
We identified the moisture uptake locations along the back trajectories and calculated their contributions to the precipitation at the GNIP Changsha station during EASM and NSM seasons in a La Niña phase (1988–1989) with low δ18Op anomalies and in an El Niño phase (1991–1992) with high δ18Op anomalies (Fig. 4). The results show that the moisture uptake locations and contributions during the EASM season are similar between El Niño and La Niña phases as well as those during the NSM season. During the EASM season, the moisture sources are mainly from South China Sea–South China, the Bay of Bengal–Indochinese Peninsula, and the Indian Ocean, while the remaining ones are from North China–western Pacific (Fig. 4a and c). In previous studies researchers mainly focused on the variations in moisture source during the EASM season (Baker et al., 2015; Cai et al., 2017; Tan, 2014). In this study, however, we also analyzed the back trajectories during the NSM season because NSM precipitation contributes ∼50 % to the annual precipitation in the SPR region. It shows that the NSM moisture sources originate from the South China Sea and southern China; the remaining ones are driven from local evaporation. Compared to the moisture sources during the EASM season, very few moisture sources are indicated for the Bay of Bengal–Indochinese Peninsula and the Indian Ocean during the NSM season.
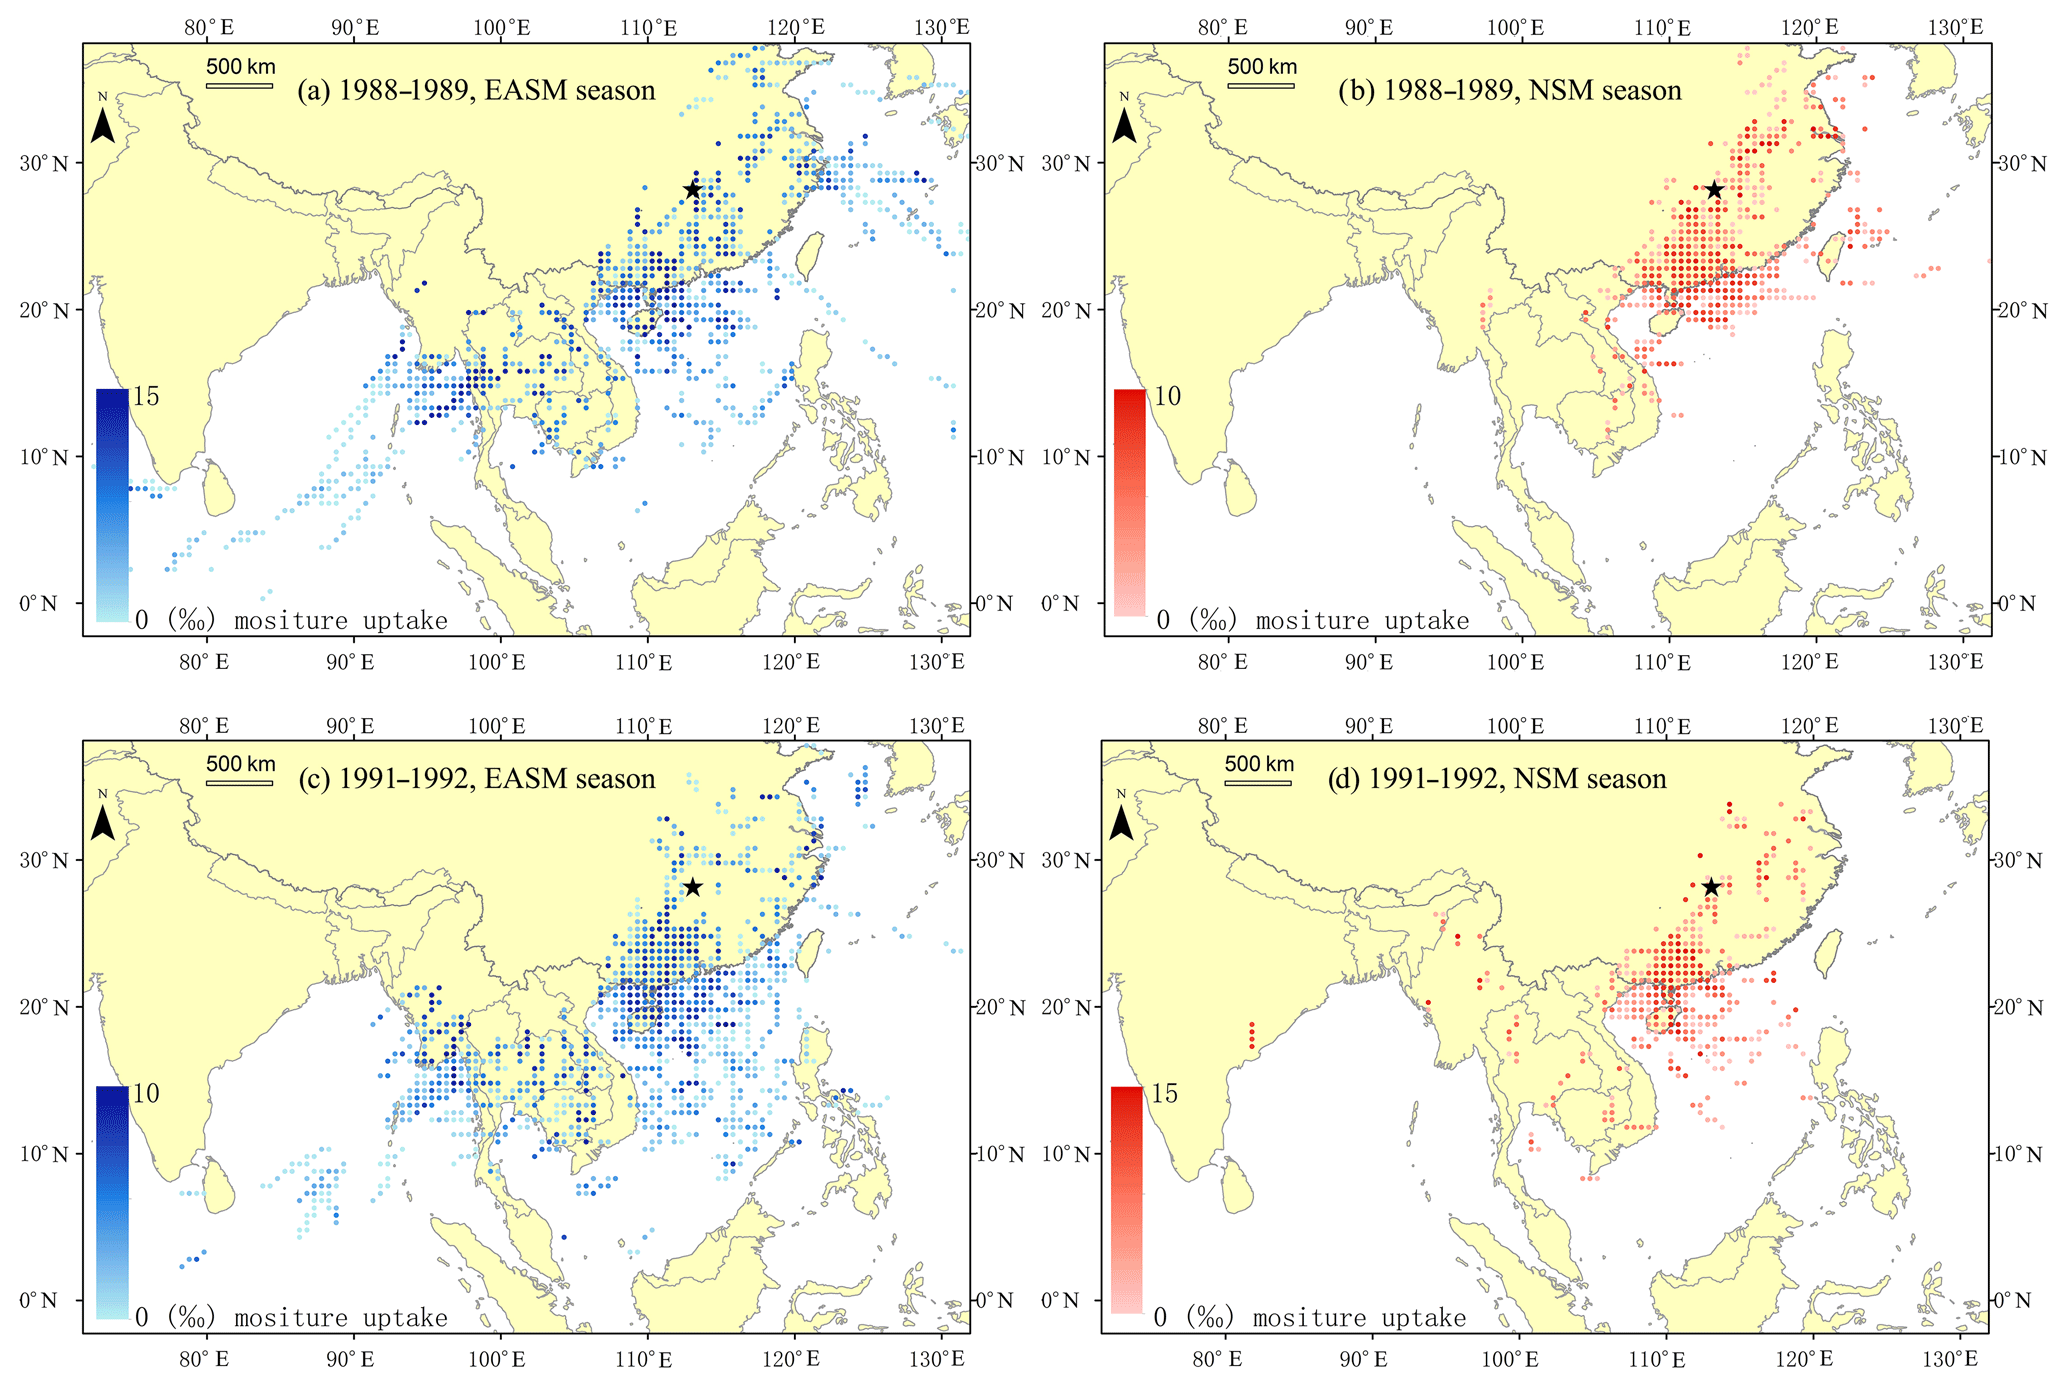
Figure 4Seasonal distribution of moisture uptake contributing to Changsha precipitation in El Niño and La Niña years. Panels (a) and (b) show the moisture source uptake locations and their contribution to precipitation during EASM and NSM seasons in a La Niña phase (1988–1989), respectively; panels (c) and (d) are the same as (a) and (b) but for an El Niño phase (1991–1992). The black star indicates the Changsha GNIP station.
4.1 Amount-weighted mean annual precipitation δ18O
In principle, the amount-weighted mean annual precipitation δ18O (δ18Ow) can be calculated from the sum of monthly weighted isotopic values divided by the total amount of precipitation as
Based on the characteristics of the precipitation amount and δ18O during EASM and NSM seasons in the MRC, Eq. (1) can be written in the following mode:
where PEASM-mean and PNSM-mean are the mean precipitation amounts of EASM and NSM, respectively; δ18OEASM-mean and δ18ONSM-mean are the mean values of EASM and NSM precipitation, respectively; and EASM % and NSM % are the mean percentages of the EASM and NSM precipitation amounts, respectively.
Therefore, we can consider that the δ18Ow is controlled by both precipitation amount and δ18Op during the EASM and NSM seasons in the MRC. Given the relationship between monthly precipitation amount and δ18Op in the MRC (Fig. 3), we find that (1) in northern and southwestern regions of the MRC δ18Ow values are mainly controlled by the amount and δ18O of EASM precipitation, because the precipitation amount of the EASM with rather low δ18Op values accounts for 70 % of the annual precipitation and the NSM precipitation is only a small contribution to the δ18Ow (less than 30 %). (2) In southeastern China, especially in the SPR region, the precipitation amount of the NSM with rather high δ18Op values even exceeds that of the EASM with rather low δ18Op values, and it also has an important effect on δ18Ow. Hence, δ18Ow in the SPR region is affected by both EASM and NSM precipitation. In addition, except for the effect of the seasonal distribution of precipitation amount, the seasonal δ18O itself also attributes to the δ18Ow, which is related, among others, to the variations in integrated regional convection and moisture source and transport distance (Cai et al., 2018; Baker et al., 2015; Huang et al., 2017; Tan et al., 2016).
In order to separate the influences of precipitation seasonality and monthly δ18Op, we used the decomposition method used by Liu and Battisti (2015) and Cai and Tian (2016) to evaluate the role of changes in precipitation seasonality (δ18Ops; assuming that the monthly precipitation δ18Op in El Niño years 1988–1989 is the same as that in La Niña years 1991–1992). We then calculated the difference between precipitation δ18Ow in El Niño years and La Niña years and the change in precipitation δ18O (δ18Oiso; method is similar to that for calculating δ18Ops but assuming that the monthly precipitation amount is the same). The results for the Changsha station indicate that the difference in precipitation δ18Ow between El Niño years (1988–1989) and La Niña years (1991–1992) (i.e., El Niño minus La Niña) is 2.7 ‰, δ18Ops is 1.3 ‰, and δ18Oiso is 1.3 ‰. These results imply that the difference in δ18Ow between El Niño and La Niña conditions reflects the differences of both the δ18Op and the precipitation seasonality.
Tan (2014) suggested that positive (negative) δ18Ow anomalies during El Niño (La Niña) phases reflect more (less) water vapor originating from the nearby South China Sea and the western Pacific Ocean (characterized by rather high δ18Op values) relative to the remote Indian Ocean (showing comparable low δ18Op values). By using the HYSPLIT model, however, Cai et al. (2017) demonstrated that the moisture sources vary little between years with relatively high and low δ18O values (corresponding to El Niño and La Niña years) in the EASM region; hence, EASM precipitation is primarily derived from the Indian Ocean, while the Pacific Ocean moisture is a minor contributor. This is consistent with our results (Fig. 4). In addition, by using a Lagrangian precipitation moisture source diagnostic, Baker et al. (2015) suggested that the moisture uptake area in the Pacific Ocean does not differ significantly between summer and winter and is thus a minor contribution to monsoonal precipitation; changes in moisture transport, however, may impact the δ18O variation of EASM precipitation. Dayem et al. (2010) also proposed that several processes (e.g., source regions, transport distance and types of precipitation) contribute to the δ18Op variation. We found that the moisture sources in the Bay of Bengal–Indochinese Peninsula and the Indian Ocean were less important during the NSM season compared to the EASM season (Fig. 4). The moisture uptake area in the EASM season does not differ significantly between El Niño and La Niña years nor in the NSM season. Their contributions to the whole precipitation in El Niño and La Niña years, however, are different (Fig. 4). The variation in moisture source during the EASM period, to some extent, might contribute to changes in δ18Ow, but it is not the main factor. We emphasize the effect of NSM precipitation amount on δ18Ow in the SPR region, and we made an attempt to analyze the relationship between the seasonal precipitation amount and δ18Ow with ENSO phase on interannual timescale in the next section.
4.2 Interannual variation of precipitation amount and δ18Ow over the SPR region influenced by ENSO
The ENSO is a coupled ocean–atmosphere phenomenon controlling the interannual variation in precipitation amount and δ18O over southeastern China (e.g., Feng and Hu, 2004; He et al., 2018; Huang et al., 2017; Moerman et al., 2013; Tan et al., 2014; Xue and Liu, 2008; Yang et al., 2016). Our analysis of the 1988–1992 data from the Changsha GNIP station suggests that the mean value of δ18Ow (−6.73 ‰) in La Niña years (1988–1989) is significantly more negative than during El Niño years (1991–1992; −4.11 ‰). However, there is no significant variation in the annual precipitation amount between La Niña and El Niño years (Fig. 5a). The difference of δ18Ow between La Niña and El Niño phases cannot be explained by variations in annual precipitation amount. This is consistent with the analyses based on instrumental meteorological data (Huang et al., 2017; Tan, 2014) and climate simulations (Yang et al., 2016). Previous studies showed that during El Niño years, the EASM is generally weak and the integrated regional convection decreases in the EASM region, thereby leading to higher δ18Op values, while the effect of La Niña is opposite (Cai et al., 2018; Gao et al., 2013; Zwart et al., 2016). Continental moisture recycling or local convection during the NSM season has limited impact on δ18Op relative to the integrated regional convective activities during the EASM season. As we discussed in Sect. 4.1, however, the difference in δ18Ow between El Niño and La Niña years is influenced by both the δ18Op and the precipitation seasonality. Indeed, there is more summer monsoon precipitation in June to September during La Niña years (1988–1989) but more SPR in March–April during El Niño years (1991–1992), though the annual precipitation amounts are similar (Fig. 5b). We find that the δ18Ow variability is broadly consistent with the variation in the ratio of EASM ∕ NSM precipitation amount during 1988–1992 (Fig. 5). Unfortunately, the data series of the Changsha GNIP station is too short (5 years) to evaluate the relationship between the EASM ∕ NSM ratio and δ18Op in the SPR region. Therefore, we used the average precipitation data from 11 meteorological stations (1951–2014) in Jiangxi Province and the eastern Hunan Province (Fig. 2, i.e., from the core area of the SPR) as well as the δ18O data obtained from the IsoGSM simulation (1979–2009) to examine the relationship between ENSO, AO, δ18Ow, and precipitation amount in the SPR region on interannual timescales.
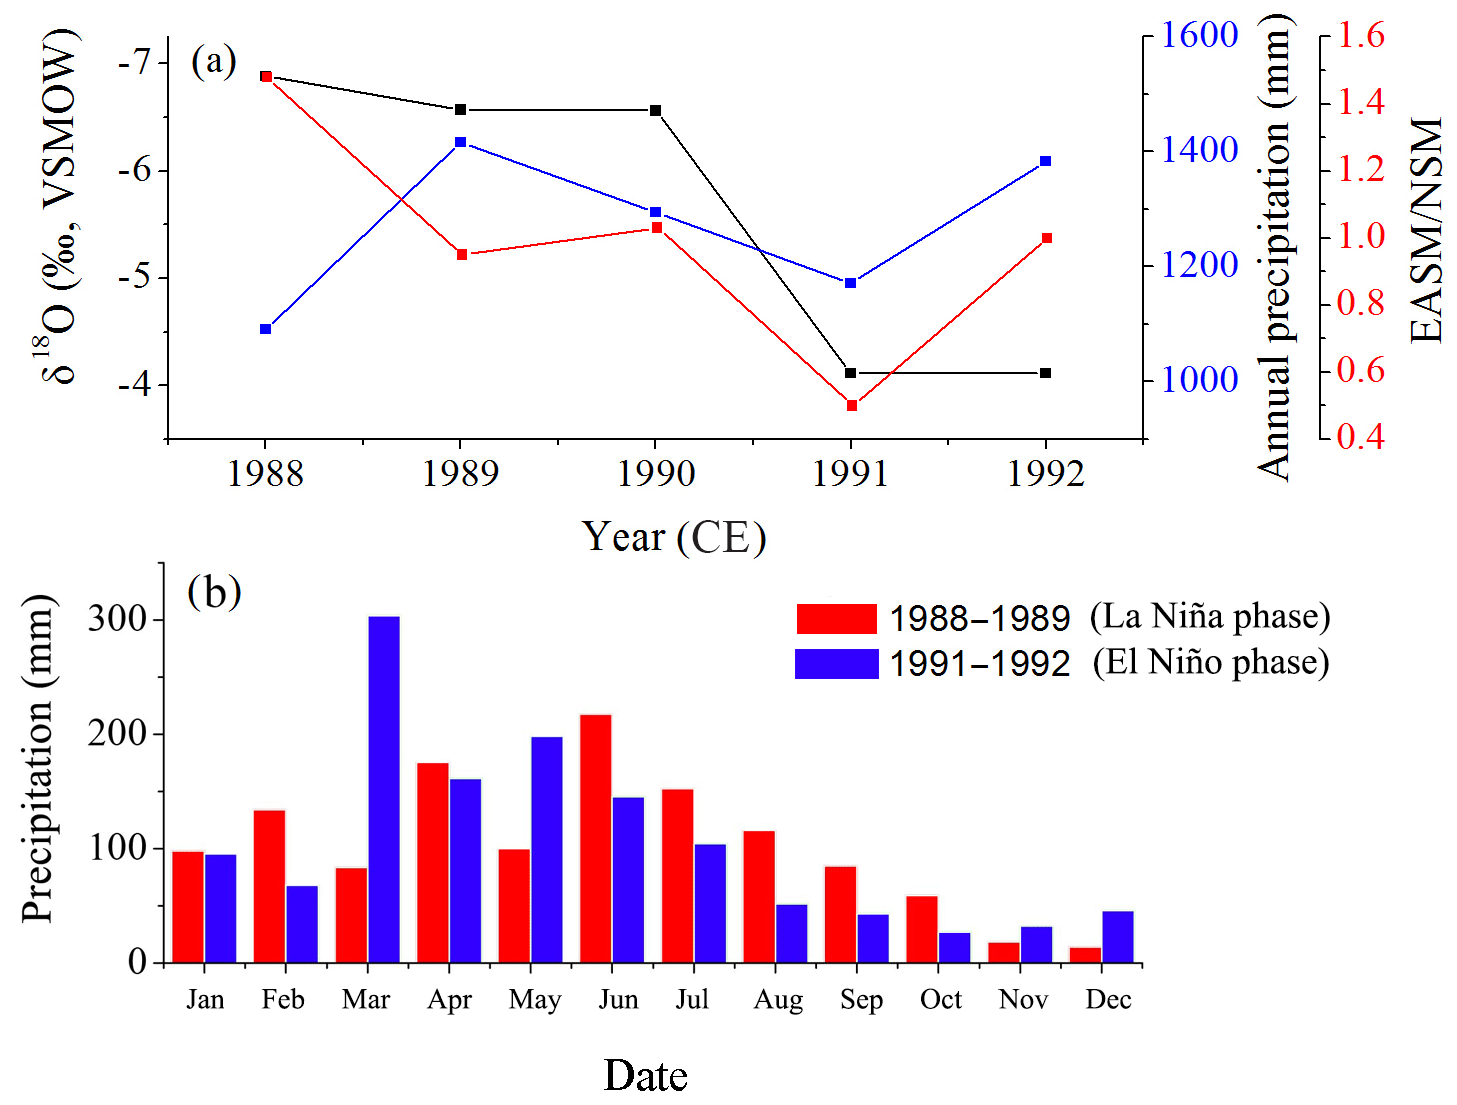
Figure 5Comparison between ENSO events, precipitation amount, and δ18Ow at the Changsha GNIP station for the period 1988–1992. (a) Comparison between annual precipitation amount, δ18Ow, and the EASM ∕ NSM ratio. (b) Comparison of mean monthly precipitation amount between La Niña (1988–1989) and El Niño (1991–1992) years. In this calculation, the temporal coverage of the annual precipitation and the precipitation δ18Ow is from January to December, the EASM precipitation is from May to September, and the NSM precipitation is from January to April and from October to December.
We calculated correlation coefficients between the simulated δ18Ow; the SOI; the MEI; the EASM ∕ NSM ratio; and the annual, EASM, and NSM precipitation amounts for 1979–2009 (Table 2 and Fig. 6). The results show that the time series of the simulated δ18Ow data significantly correlates with the SOI (2, p < 0.01) and the MEI (r=0.51, p < 0.01), consistent with the positive relationship between the ENSO index and δ18Ow observed in modern precipitation (Huang et al., 2017; Tan, 2014; Yang et al., 2016) as well as in the δ18O records of speleothems and tree-ring cellulose (Tan, 2016; Xu et al., 2013, 2016a, b; Zhang et al., 2018). Furthermore, the same relationship holds for the Changsha GNIP station (Fig. 5a). This indicates that the precipitation δ18Ow is higher (lower) during the El Niño (La Niña) phase in the SPR region. There is, however, no significant correlation between the δ18Ow with the annual, EASM, or NSM precipitation amounts. This indicates that on interannual timescales, the δ18Ow is not controlled by the annual or EASM precipitation amount in southeastern China, consistent with the result based on instrumental data from the Changsha station (Fig. 5a) and other studies (Tan et al., 2014; Yang et al., 2016). The time series of the simulated δ18Ow data correlates with the EASM ∕ NSM ratio (, p < 0.05) (Fig. 6 and Table 2), suggesting that the precipitation δ18Ow may be influenced by the precipitation seasonality (i.e., EASM ∕ NSM ratio) modulated by ENSO on interannual timescales.
Applying a 2-year smoothing, the time series of the simulated δ18Ow data significantly correlates with the annual precipitation (, p < 0.01), the EASM precipitation (1, p < 0.01), and the EASM ∕ NSM ratio (, p < 0.01) (Table 2 and Fig. 6). This indicates that on interannual to decadal timescales the precipitation δ18Ow might reflect changes in EASM precipitation amount and also the annual precipitation amount and the EASM ∕ NSM ratio, because the EASM ∕ NSM ratio and annual precipitation amount are significantly dominated by the EASM precipitation amount (Table 2).
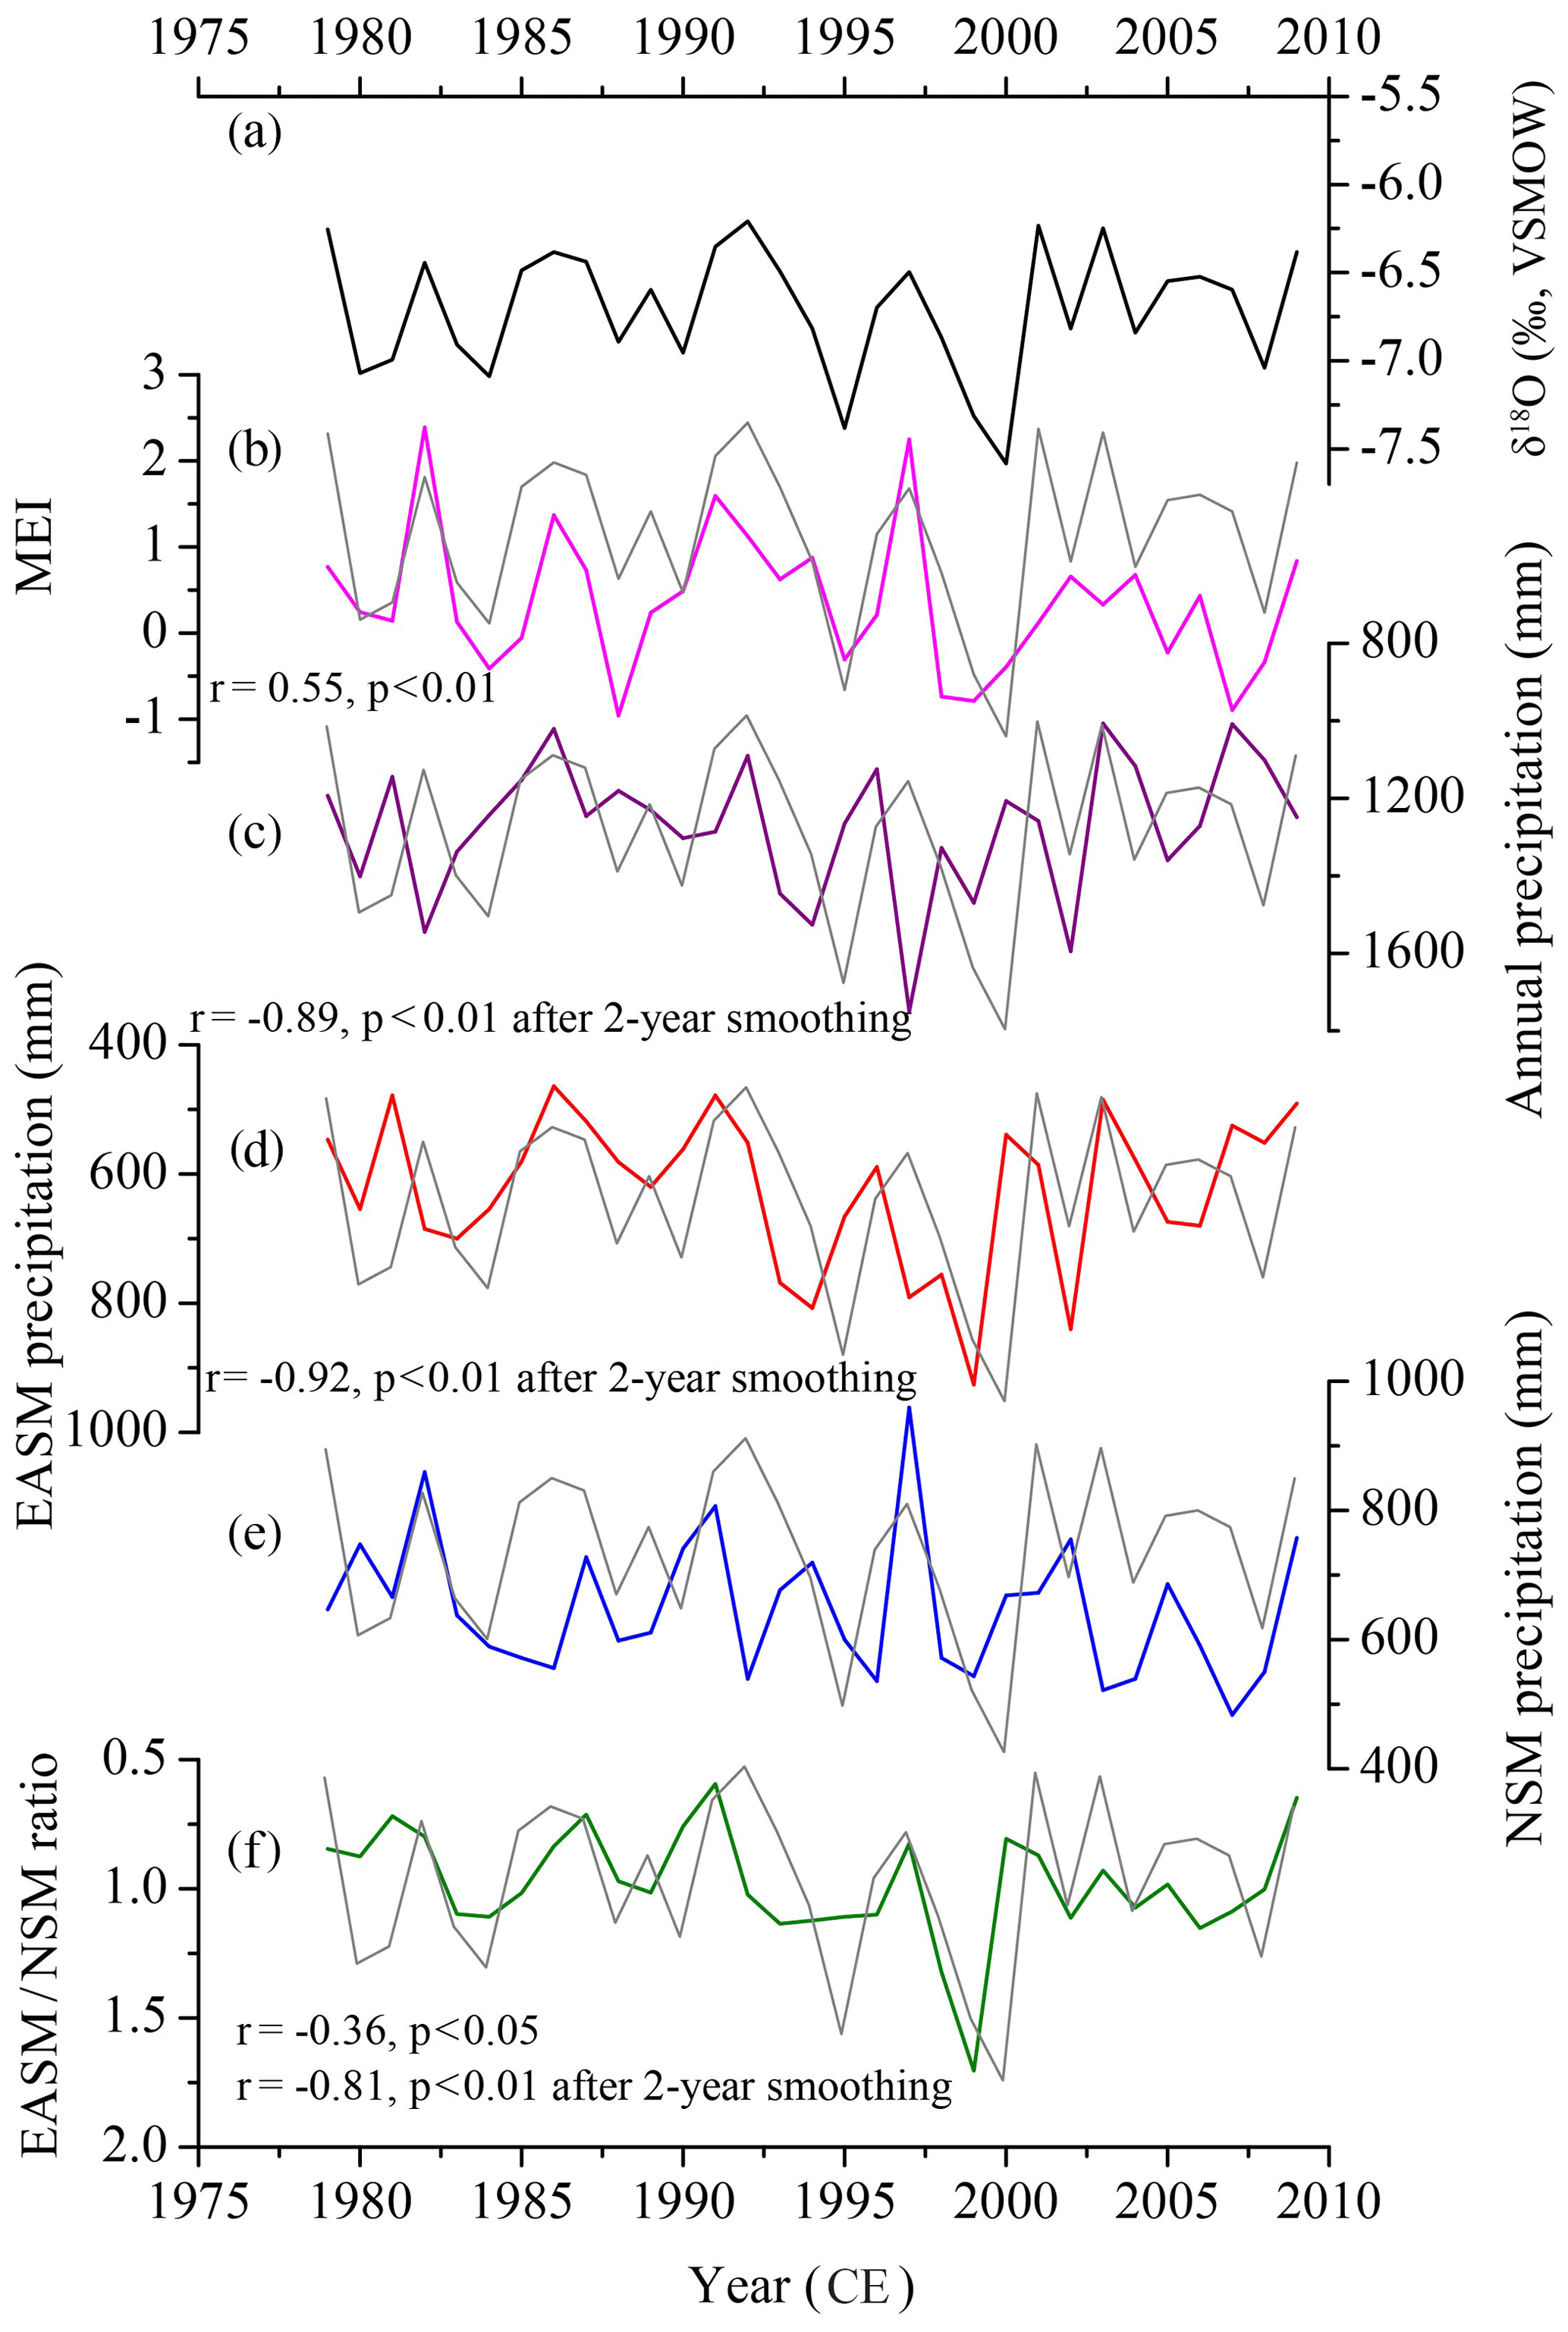
Figure 6Correlation between the time series of the simulated δ18Ow (a, black line, from May to next April); MEI (b, pink line, from October to next June); annual (c, purple line, from May to next April), EASM (d, red line, from May to September), and NSM (e, blue line, from October to next April) precipitation amounts; and the EASM ∕ NSM ratio (f, green line) in the SPR region for 1979–2009. The correlation coefficient between δ18Ow with MEI and EASM ∕ NSM ratio is 0.55 (p < 0.01) and −0.36 (p < 0.05), respectively. Applying a 2-year smoothing to δ18Ow is significantly correlated with annual precipitation (, p < 0.01), EASM precipitation (, p < 0.01), and the EASM ∕ NSM ratio (−0.81, p < 0.01).
Table 2Correlation coefficients between the time series of precipitation δ18Ow; MEI; the EASM ∕ NSM ratio; and the annual, EASM, and NSM precipitation amounts in the SPR region for 1979–2009. The temporal coverage of the annual precipitation and the precipitation δ18Ow is from May to next April, the EASM precipitation is from May to September, and the NSM precipitation is from October to next April. The temporal coverage of the MEI and the SOI is from October to April.
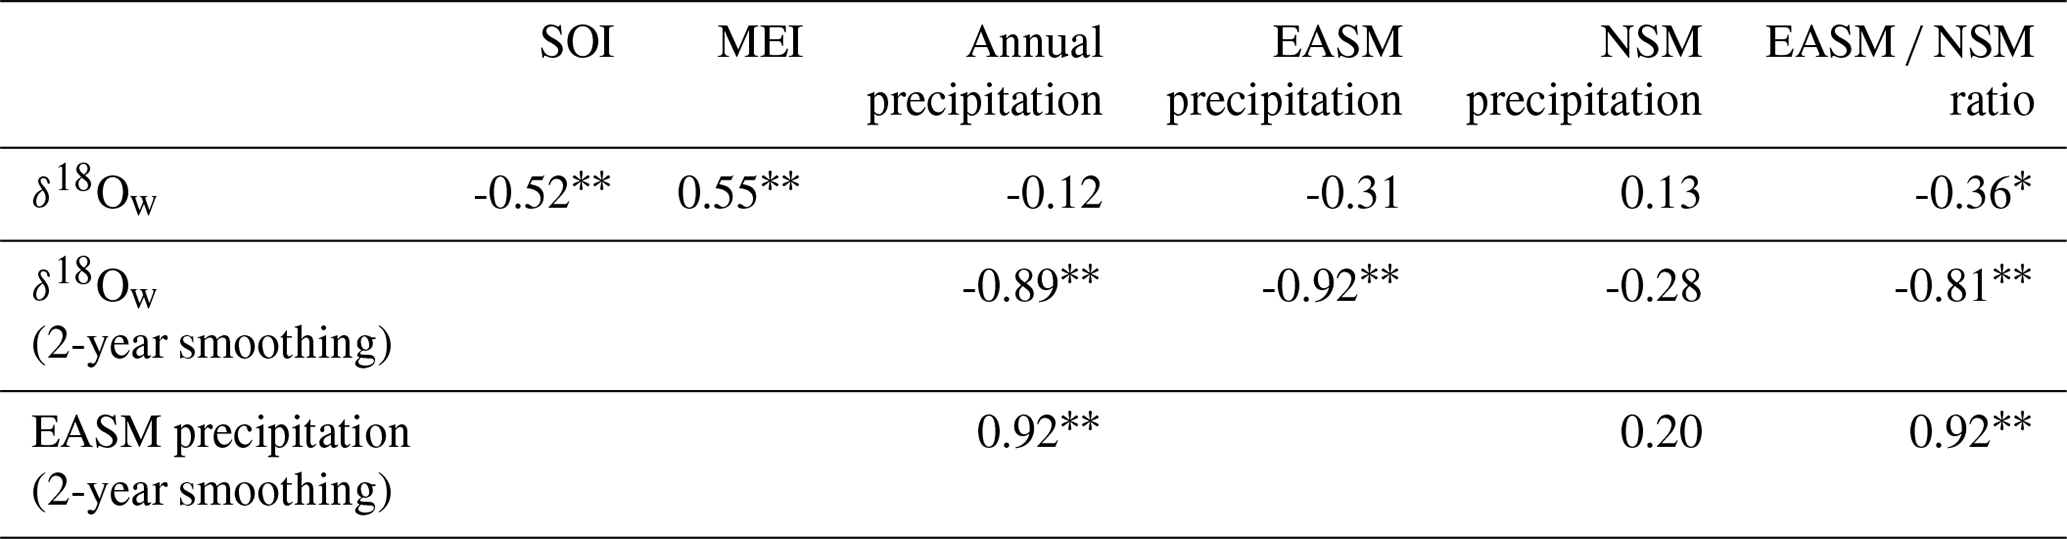
* Correlation is significant at the 0.05 level (2-tailed). Correlation is significant at the 0.01 level (2-tailed).
To explore the relationship between ocean-atmospheric circulation (e.g., ENSO, AO) and the seasonal precipitation amount, we calculated correlation coefficients between the SOI; MEI; AO index; the EASM ∕ NSM ratio; and the annual, EASM, and NSM precipitation amounts for 1951–2010 (Table 3). The mean value of October to next June SOI correlates with the EASM precipitation amount (r=0.26, p < 0.05), NSM precipitation amount (, p < 0.01), and the EASM ∕ NSM ratio (r=0.52, p < 0.01) (Table 3). The mean value of October to next June MEI correlates with the EASM precipitation amount (9, p < 0.05), NSM precipitation amount (r=0.54, p < 0.01), and the EASM ∕ NSM ratio (, p < 0.01) (Table 3). This indicates, on interannual timescales, decreased EASM precipitation during the developing stage of El Niño and increased NSM precipitation during the mature stage of El Niño, resulting in lower EASM ∕ NSM ratios during El Niño phases and vice versa. There is, however, no significant correlation between the SOI, MEI, and the annual precipitation amount. In addition, the EASM ∕ NSM ratio significantly correlates with the EASM (r=0.64, p < 0.01) and the NSM (0, p < 0.01) (Table 3).
Previous studies found that decreased summer rainfall in the south of the Yangtze river occurs during the developing stage of El Niño, resulting from a southward shift of the subtropical high associated with colder SST in the western tropical Pacific and weak convective activities in the South China Sea and the Philippines (Huang and Wu, 1989; Zhang et al., 1999). Kong and Tu (2003) found that there is less EASM rainfall in May–September in the lower reaches of the Yangtze river valley during 14 El Niño events since the 1950s. The same relationship is observed in the May–October rainfall reconstruction based on tree-ring cellulose δ18O (Xu et al., 2016a) during El Niño phases. Cooler summer SST in the western Pacific led to a weakened western Pacific subtropical high resulting in less rainfall during May–October in the middle-to-lower reaches of the Yangtze river (Liu and Li, 2011; Xu et al., 2016a) and vice versa. Increased rainfall in autumn, winter, and spring (i.e., NSM) occurred in southern China during the mature stage of El Niño (Wan et al., 2008b; Wang et al., 2000; Zhang et al., 1999, 2015; Zhou, 2011; Zhou and Wu, 2010). During these phases, lower-level southwesterly anomalies over the South China Sea transport more moisture into southeastern China, leading to increased NSM precipitation (Wang et al., 2000; Zhang et al., 1999; Zhou, 2011; Zhou and Wu, 2010). These conclusions are consistent with our findings in the SPR region. It is notable that there is no significant variation in EASM precipitation amount in our study area during the decaying stage of El Niño, although increased summer rainfall was observed in southern China (Huang and Wu, 1989).
We also find that the May AO index significantly and negatively correlates with the annual (, p < 0.01) and EASM (, p < 0.01) precipitation amounts in the SPR region (Table 3). This is consistent with previous observations that the positive May AO index is followed by decreased summer precipitation amount in the lower Yangtze river valley (Gong and Ho, 2002; He et al., 2017). It was suggested that a stronger May AO is associated with a northwards movement of the summer jet stream, leading to drier conditions in the lower Yangtze river. The positive spring AO gives rise to warmer equatorial SSTs between 150–180∘ E and weakens summer subtropical high in the western North Pacific. Consequently, decreased summer precipitation occurs in the lower Yangtze river (Gong et al., 2011). There is, however, no significant correlation between the AO index and the NSM precipitation amount and the EASM ∕ NSM ratio in the SPR region (Table 3). This might be because the influence of AO on the winter climate varied spatially and temporally, resulting from the unstable relationship between the AO index and the East Asian winter monsoon (He et al., 2017; Li et al., 2014). This indicates that the AO mainly influences the changes in EASM and annual precipitation amount but not the precipitation seasonality (i.e., EASM ∕ NSM ratio) in the SPR region. The February AO index positively correlates with precipitation amount in February (r=0.28, p < 0.05).
Given the relationship between δ18Ow, SOI, MEI, and seasonal precipitation amount, we find that less EASM during the developing stages of El Niño and more NSM precipitation during the mature stages of El Niño lead to lower EASM ∕ NSM ratios, resulting in higher δ18Ow values in the SPR region during El Niño phases and vice versa. We therefore suggest that over the SPR region the precipitation seasonality (i.e., the EASM ∕ NSM ratio) modulated by ENSO primarily influences the interannual variability of δ18Ow. The AO mainly influences changes in EASM and annual precipitation amount but not the precipitation seasonality (i.e., EASM ∕ NSM ratio) in the SPR region.
Table 3Correlation coefficients between the time series of the MEI; the EASM ∕ NSM ratio; and the annual, EASM, and NSM precipitation amounts in the SPR region for 1951–2010. The temporal coverage of the annual precipitation and the δ18Ow is from May to next April, the EASM precipitation is from May to September, and the NSM precipitation is from October to next April. The temporal coverage of the SOI and MEI is from October to next June.
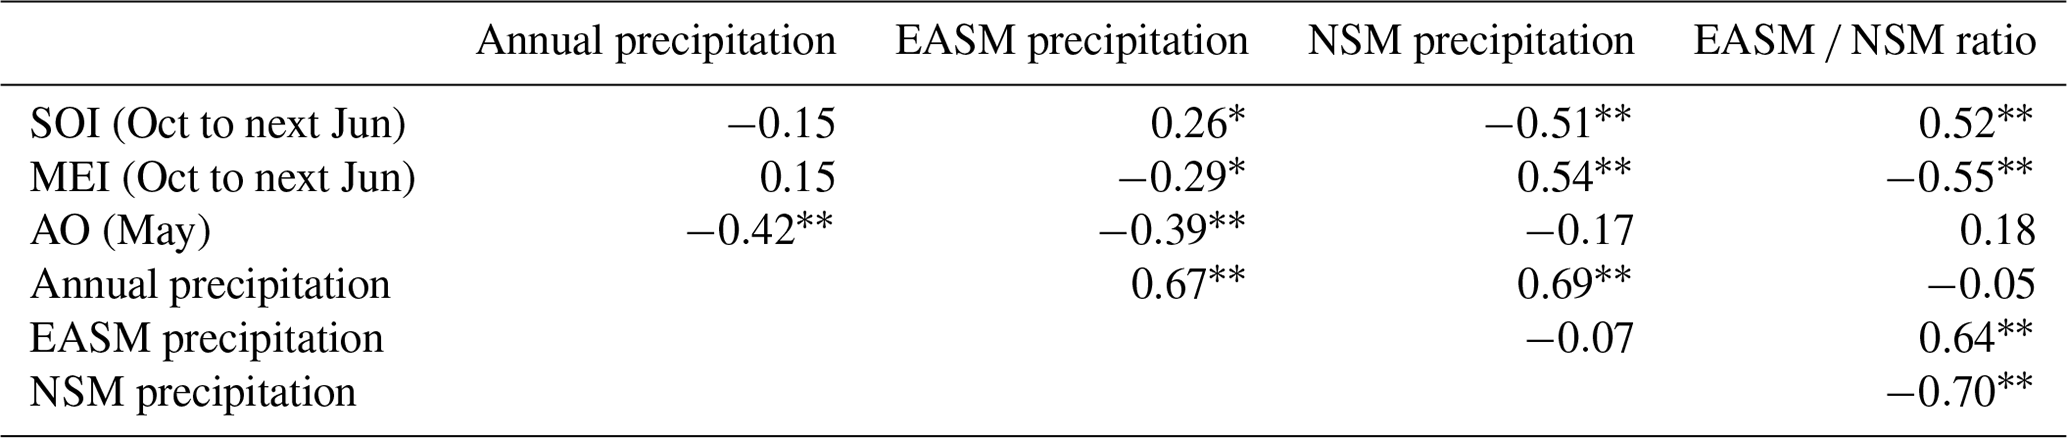
* Correlation is significant at the 0.05 level (2-tailed). Correlation is significant at the 0.01 level (2-tailed).
4.3 Implication for paleoclimatic reconstructions
Although speleothem δ18O records have massively improved our understanding of the EASM variability on different timescales, the significance and quantification of these proxy records is still a subject of debate, because speleothem δ18O is influenced by several competing factors. We emphasize that the spatial differences in seasonal precipitation over the MRC are key to understanding the speleothem δ18O–climate relationship. Fig. 1 illustrates that (1) Wanxiang (Zhang et al., 2008), Dayu (Tan et al., 2009), Huangye (Tan et al., 2010), Wuya (Tan et al., 2014), Shihua (Li et al., 2017), and Xiaobailong (Tan et al., 2017) caves are located in the northern and southwestern part of the MRC, where δ18Ow is primarily controlled by the EASM and annual precipitation amount. Therefore, these records show a significant correlation with the instrumental precipitation and the regional drought/flood (D/F) index obtained from historical documents (e.g., Li et al., 2017; Liu et al., 2008; Tan et al., 2009, 2010, 2014, 2017; Zhang et al., 2008). (2) Dongge (Yuan et al., 2004), Heshang (Hu et al., 2008), Hulu (Wang et al., 2001), Yuhua (Jiang et al., 2012), and E'mei (Zhang et al., 2018) caves are located in southeastern China, where δ18Ow is not only affected by EASM precipitation but also by NSM precipitation. Hence, according to Wang et al. (2001), speleothem δ18O from Hulu cave reflects the ratio of summer-to-winter precipitation amount. Factors related to the NSM (e.g., moisture source, integrated regional convection, precipitation seasonality, winter temperature) have also been taken into consideration in the interpretation of speleothem δ18O in southeastern China (e.g., Baker et al., 2015; Cai et al., 2018; Cheng et al., 2016; Clemens et al., 2010; Dayem et al., 2010; Zhang et al., 2018). On the other hand, the high percentage of NSM precipitation with relatively high δ18Op values in southeastern China should be an important reason why δ18Ow and speleothem δ18O are much lower and their variability is much larger in southwestern China than in southeastern China (Li et al., 2016; Liu et al., 2010; Zhang et al., 2018), except for the influence of integrated regional convection and moisture source and transport distances during the EASM season.
We find that the precipitation seasonality modulated by ENSO mainly controls the δ18Ow values in the SPR region, with lower (higher) EASM ∕ NSM ratios associated with El Niño (La Niña) phases resulting in higher (lower) δ18Ow values. Therefore, we suggest that the interannual variability of speleothem δ18O in the SPR region is primarily controlled by precipitation seasonality (i.e., the EASM ∕ NSM ratio) modulated by ENSO. In addition, the ENSO index in the SPR region also significantly correlates with the EASM precipitation amount on interannual timescales and the precipitation δ18Ow negatively correlates with the EASM precipitation amount on interannual-to-decadal timescales, implying that additional studies are needed to disentangle the main driving factor(s) (e.g., EASM precipitation amount vs. EASM ∕ NSM ratio) operating on different timescales. Few speleothem δ18O records have been published for the SPR region so far (Jiang et al., 2012; Zhang et al., 2018). Such long-term records, however, are critically needed to examine the climate–proxy relationship both on interannual and on decadal to millennial timescales.
We find that the distribution of seasonal precipitation amount in southeastern China, especially in the SPR region, is different from other regions of the MRC for the time interval of this study (1951–2014 CE). In the SPR region, the mean precipitation amount of the EASM is equivalent to that of the NSM. However, in northern and southwestern regions of the MRC, the mean percentage of EASM to the annual precipitation amount exceeds 70 %. The seasonal δ18Op in the MRC shows broadly consistent variations with relatively low and high values for EASM and NSM precipitation, respectively. The low δ18Op values associated with winter precipitation in northern region of the MRC, however, represent only a minor contribution to δ18Ow. Thus, the NSM precipitation in the SPR region also has an important effect on δ18Ow, but the δ18Ow in northern and southwestern regions is primarily influenced by EASM precipitation.
Based on a statistical analysis of the ENSO index, simulated δ18O data, and seasonal precipitation amount in the SPR region, we find that less (more) EASM and more (less) NSM precipitation leads to a lower (higher) EASM ∕ NSM ratio resulting in higher (lower) δ18Ow in the SPR region during El Niño (La Niña) phases. The AO mainly influences the changes in EASM and annual precipitation amount but not the precipitation seasonality (e.g., EASM ∕ NSM ratio) in the SPR region. Recognizing this spatial difference in seasonal precipitation is essential for a robust interpretation of speleothem δ18O in the MRC. On interannual timescales, speleothem δ18O variability in northern and southwestern regions of the MRC is primarily influenced by the EASM or the annual precipitation amount. In the SPR region, however, precipitation seasonality (i.e., the EASM ∕ NSM ratio) modulated by ENSO plays a key role in governing speleothem δ18O variability, although integrated regional convection and moisture source and transport distance may also have subordinate impacts.
The National Climate Center (https://www.ncc-cma.net/, last access: 3 November 2019) provided the monthly precipitation data, the IAEA (http://www.iaea.org/, last access: 3 November 2019) provided the GNIP precipitation isotope data, the Australian Government Bureau of Meteorology (http://www.bom.gov.au/climate/current, last access: 3 November 2019) provided the SOI data, and the NOAA (http://www.cdc.noaa.gov/, last access: 3 November 2019) provided the MEI and AO data. The related computations were provided in the “Data and methods” section. Correspondence and requests for materials should be addressed to Haiwei Zhang (zhanghaiwei@xjtu.edu.cn).
The supplement related to this article is available online at: https://doi.org/10.5194/cp-16-211-2020-supplement.
HZ designed the research and wrote the first draft of the article. HC, YC, CS, and AS helped to revise the article. GK and HL helped to get the IsoGSM simulation data. All authors discussed the results and provided input on the article.
The authors declare that they have no conflict of interest.
We thank the editor Helen McGregor and the reviewer Norbert Frank as well as three anonymous referees for their comments and suggestions. Thanks to Ming Tan for reviewing the article and giving many constructive suggestions. Thanks to Kristina Krklec, Hui Tang, and Zhongyin Cai for helping with the back-trajectory analyses and moisture source calculations.
This research has been supported by the NSFC (grant no. 41502166), the China Postdoctoral Science Foundation (grant no. 2015M580832), the State Key Laboratory of Loess and Quaternary Geology (grant no. SKLLQG1046), and the Key Laboratory of Karst Dynamics, Ministry of Land and Resources of the People's Republic of China (MLR) and Guangxi Zhuang Autonomous Region (GZAR) (grant no. KDL201502).
This paper was edited by Helen McGregor and reviewed by Norbert Frank and three anonymous referees.
Baker, A. J., Sodemann, H., Baldini, J. U., Breitenbach, S. F., Johnson, K. R., Hunen, J., and Zhang, P.: Seasonality of westerly moisture transport in the East Asian summer monsoon and its implications for interpreting precipitation δ18O, J. Geophys. Res.-Atmos., 120, 5850–5862, 2015.
Cai, Y., Fung, I. Y., Edwards, R. L., An, Z., Cheng, H., Lee, J.-E., Tan, L., Shen, C.-C., Wang, X., and Day, J. A.: Variability of stalagmite-inferred Indian monsoon precipitation over the past 252,000 y, P. Natl. Acad. Sci. USA, 112, 2954–2959, 2015.
Cai, Z., Tian, L., and Bowen, G. J.: ENSO variability reflected in precipitation oxygen isotopes across the Asian Summer Monsoon region, Earth Planet. Sc. Lett., 475, 25–33, 2017.
Cai, Z., Tian, L., and Bowen, G. J.: Spatial-seasonal patterns reveal large-scale atmospheric controls on Asian Monsoon precipitation water isotope ratios, Earth Planet. Sc. Lett., 503, 158–169, 2018.
Caley, T., Roche, D. M., and Renssen, H.: Orbital Asian summer monsoon dynamics revealed using an isotope-enabled global climate model, Nat. Commun., 5, 5371, https://doi.org/10.1038/ncomms6371, 2014.
Cheng, H., Edwards, R. L., Broecker, W. S., Denton, G. H., Kong, X., Wang, Y., Zhang, R., and Wang, X.: Ice age terminations, Science, 326, 248–252, 2009.
Cheng, H., Sinha, A., Wang, X., Cruz, F. W., and Edwards, R. L.: The Global Paleomonsoon as seen through speleothem records from Asia and the Americas, Clim. Dynam., 39, 1045–1062, 2012.
Cheng, H., Edwards, R. L., Sinha, A., Spötl, C., Yi, L., Chen, S., Kelly, M., Kathayat, G., Wang, X., Li, X., Kong, X., Wang, Y., Ning, Y., and Zhang, H.: The Asian monsoon over the past 640,000 years and ice age terminations, Nature, 534, 640–646, 2016.
Clemens, S. C., Prell, W. L., and Sun, Y.: Orbital-scale timing and mechanisms driving Late Pleistocene Indo-Asian summer monsoons: Reinterpreting cave speleothem δ18O, Paleoceanography, 25, PA4207, https://doi.org/10.1029/2010PA001926, 2010.
Dayem, K. E., Molnar, P., Battisti, D. S., and Roe, G. H.: Lessons learned from oxygen isotopes in modern precipitation applied to interpretation of speleothem records of paleoclimate from eastern Asia, Earth Planet. Sc. Lett., 295, 219–230, 2010.
Ding, Y.: Summer monsoon rainfalls in China, J. Meteorol. Soc. Jpn., 70, 373–396, 1992.
Ding, Y., Chen, L., and Murakami, M.: The East Asian Monsoon [M], Beijing, China Meteorological Press, 1994.
Feng, J. and Li, J.: Influence of El Niño Modoki on spring rainfall over south China, J. Geophys. Res.-Atmos., 116, D13102, https://doi.org/10.1029/2010JD015160, 2011.
Feng, S. and Hu, Q.: Variations in the teleconnection of ENSO and summer rainfall in northern China: a role of the Indian summer monsoon, J. Climate, 17, 4871–4881, 2004.
Gao, J., Masson-Delmotte, V., Risi, C., He, Y., and Yao, T.: What controls precipitation δ18O in the southern Tibetan Plateau at seasonal and intra-seasonal scales? A case study at Lhasa and Nyalam, Tellus B, 65, https://doi.org/10.3402/tellusb.v65i0.21043, 2013.
Gong, D. Y. and Ho, C. H.: Shift in the summer rainfall over the Yangtze River valley in the late 1970s, Geophys. Res. Lett., 29, 1436, https://doi.org/10.1029/2001GL014523, 2002.
Gong, D. Y., Wang, S. W., and Zhu, J. H.: East Asian winter monsoon and Arctic oscillation, Geophys. Res. Lett., 28, 2073–2076, 2001.
Gong, D.-Y., Yang, J., Kim, S.-J., Gao, Y., Guo, D., Zhou, T., and Hu, M.: Spring Arctic Oscillation-East Asian summer monsoon connection through circulation changes over the western North Pacific, Clim. Dynam., 37, 2199–2216, 2011.
He, J., Zhao, P., Zhu, C., Zhang, R., Tang, X., Chen, L., and Zhou, X.: Discussion of some problems as to the East Asian subtropical monsoon, J. Meteorol. Res.-PRC, 22, 419–434, 2008.
He, S., Gao, Y., Li, F., Wang, H., and He, Y.: Impact of Arctic Oscillation on the East Asian climate: A review, Earth-Sci. Rev., 164, 48–62, 2017.
He, S., Goodkin, N. F., Jackisch, D., Ong, M. R., and Samanta, D.: Continuous real-time analysis of the isotopic composition of precipitation during tropical rain events: Insights into tropical convection, Hydrol. Process., 32, 1531–1545, 2018.
Hu, C., Henderson, G., Huang, J., Xie, S., Sun, Y., and Johnson, K.: Quantification of Holocene Asian monsoon rainfall from spatially separated cave records, Earth Planet. Sc. Lett., 266, 221–232, 2008.
Huang, R. and Wu, Y.: The influence of ENSO on the summer climate change in China and its mechanism, Adv. Atmos. Sci., 6, 21–32, 1989.
Huang, R., Chen, J., Wang, L., and Lin, Z.: Characteristics, processes, and causes of the spatio-temporal variabilities of the East Asian monsoon system, Adv. Atmos. Sci., 29, 910–942, 2012.
Huang, Y., Song, X., Zhang, X., He, Q., Han, Q., and Li, Q.: Relationship of Stable Water Isotopes in Precipitation with ENSO in Dongting Lake Basin, Scientia Geographica Sinica, 37, 792–798, 2017 (in Chinese with English abstract).
Jiang, X. Y., Li, Z. D., Li, J. Q., Kong, X. G., and Guo Y.: Stalagmite δ18O record from Yuhua cave over the past 500 years and its regional climate significance, Scientia Geographica Sinica, 32, 207–212, 2012 (in Chinese with English abstract).
Kanamitsu, M., Ebisuzaki, W., Woollen, J., Yang, S.-K., Hnilo, J., Fiorino, M., and Potter, G.: Ncep–doe amip-ii reanalysis (r-2), B. Am. Meteorol. Soc., 83, 1631–1644, 2002.
Kong, C. Y. and Tu, Q. P.: Influence of El Niño events on summer precipitation in east China under different climatic backgrounds, Journal of Nanjing Institute of Meteorology, 1, 84–88, 2003 (in Chinese with English abstract).
Krklec, K., Domínguez-Villar, D., and Lojen, S.: The impact of moisture sources on the oxygen isotope composition of precipitation at a continental site in central Europe, J. Hydrol., 561, 810–821, 2018.
Li, F., Wang, H., and Gao, Y.: On the strengthened relationship between the East Asian winter monsoon and Arctic oscillation: A comparison of 1950–70 and 1983–2012, J. Climate, 27, 5075–5091, 2014.
Li, X., Cheng, H., Tan, L., Ban, F., Sinha, A., Duan, W., Li, H., Zhang, H., Ning, Y., and Kathayat, G.: The East Asian summer monsoon variability over the last 145 years inferred from the Shihua Cave record, North China, Sci. Rep., 7, 7078, https://doi.org/10.1038/s41598-017-07251-3, 2017.
Li, Y., Rao, Z., Cao, J., Jiang, H., and Gao, Y.: Highly negative oxygen isotopes in precipitation in southwest China and their significance in paleoclimatic studies, Quatern. Int., https://doi.org/10.1016/j.quaint.2016.05.013, 2016.
Liu, J., Zhang, P., Cheng, H., Chen, F., Yang, X., Zhang, D., Zhou, J., Jia, J., An, C., and Sang, W.: Asian summer monsoon precipitation recorded by stalagmite oxygen isotopic composition in the western Loess Plateau during AD1875–2003 and its linkage with ocean-atmosphere system, Chinese Science Bulletin, 53, 2041–2049, 2008.
Liu, J., Song, X., Yuan, G., Sun, X., Liu, X., and Wang, S.: Characteristics of δ18O in precipitation over Eastern Monsoon China and the water vapor sources, Chinese Science Bulletin, 55, 200–211, 2010.
Liu, N. and Li, Z.: Relationship of the western Pacific warm pool SST anomaly and summer precipitation in China, Meteorology & Disaster Reduction Research, 34, 8–13, 2011 (in Chinese with English abstract).
Liu, X. and Battisti, D. S.: The influence of orbital forcing of tropical insolation on the climate and isotopic composition of precipitation in South America, J. Climate, 28, 4841–4862, 2015.
Maher, B. A.: Holocene variability of the East Asian summer monsoon from Chinese cave records: a re-assessment, Holocene, 18, 861–866, 2008.
Maher, B. A.: Palaeoclimatic records of the loess/palaeosol sequences of the Chinese Loess Plateau, Quaternary Sci. Rev., 154, 23–84, 2016.
Maher, B. A. and Thompson, R.: Oxygen isotopes from Chinese caves: records not of monsoon rainfall but of circulation regime, J. Quaternary Sci., 27, 615–624, 2012.
Moerman, J. W., Cobb, K. M., Adkins, J. F., Sodemann, H., Clark, B., and Tuen, A. A.: Diurnal to interannual rainfall δ18O variations in northern Borneo driven by regional hydrology, Earth Planet. Sc. Lett., 369, 108–119, 2013.
Pausata, F. S., Battisti, D. S., Nisancioglu, K. H., and Bitz, C. M.: Chinese stalagmite δ18O controlled by changes in the Indian monsoon during a simulated Heinrich event, Nat. Geosci., 4, 474–480, 2011.
Sodemann, H., Schwierz, C., and Wernli, H.: Interannual variability of Greenland winter precipitation sources: Lagrangian moisture diagnostic and North Atlantic Oscillation influence, J. Geophys. Res.-Atmos., 113, https://doi.org/10.1029/2007JD008503, 2008.
Stein, A., Draxler, R. R., Rolph, G. D., Stunder, B. J., Cohen, M., and Ngan, F.: NOAA's HYSPLIT atmospheric transport and dispersion modeling system, B. Am. Meteorol. Soc., 96, 2059–2077, 2015.
Tan, L., Cai, Y., Cheng, H., An, Z., and Edwards, R. L.: Summer monsoon precipitation variations in central China over the past 750 years derived from a high-resolution absolute-dated stalagmite, Palaeogeogr. Palaeocl., 280, 432–439, 2009.
Tan, L., Cai, Y., An, Z., Edwards, R. L., Cheng, H., Shen, C. C., and Zhang, H.: Centennial-to decadal-scale monsoon precipitation variability in the semi-humid region, northern China during the last 1860 years: Records from stalagmites in Huangye Cave, Holocene, 21, 287–296, 2010.
Tan, L., An, Z., Huh, C.-A., Cai, Y., Shen, C.-C., Shiau, L.-J., Yan, L., Cheng, H., and Edwards, R. L.: Cyclic precipitation variation on the western Loess Plateau of China during the past four centuries, Scie Rep., 4, 6381, https://doi.org/10.1038/srep06381, 2014.
Tan, L., Cai, Y., An, Z., Cheng, H., Shen, C.-C., Gao, Y., and Edwards, R. L.: Decreasing monsoon precipitation in southwest China during the last 240 years associated with the warming of tropical ocean, Clim. Dynam., 48, 1769–1778, 2017.
Tan, M.: Circulation effect: response of precipitation δ18O to the ENSO cycle in monsoon regions of China, Clim. Dynam., 42, 1067–1077, 2014.
Tan, M.: Circulation background of climate patterns in the past millennium: Uncertainty analysis and re-reconstruction of ENSO-like state, Science China Earth Sciences, 59, 1225–1241, 2016.
Tan, M., Nan, S., and Duan, W.: Seasonal scale circulation effect of stable isotope in atmospheric precipitation in the monsoon regions of China, Quaternary Res., 36, 575–580, 2016 (in Chinese with English abstract).
Tian, S.-F. and Yasunari, T.: Climatological aspects and mechanism of spring persistent rains over central China, J. Meteorol. Soc. Jpn., 76, 57–71, 1998.
Wan, R. and Wu, G.: Mechanism of the spring persistent rains over southeastern China, Sci. China Ser. D, 50, 130–144, 2007.
Wan, R. and Wu, G.: Temporal and spatial distributions of the spring persistent rains over Southeastern China, J. Meteorol. Res., 23, 598–608, 2009.
Wan, R., Wang, T., and Wu, G.: Temporal variations of the spring persistent rains and South China Sea sub-high and their correlations to the circulation and precipitation of the East Asian Summer Monsoon, J. Meteorol. Res., 22, 530–537, 2008a.
Wan, R., Zhao, B. K., and Hou, Y. L.: Interannual variability of spring persistent rain over southeastern China and its effect factor, Plateau Meteorology, 27, 118–123, 2008b (in Chinese with English abstract).
Wan, R., Zhao, B., and Wu, G.: New evidences on the climatic causes of the formation of the spring persistent rains over southeastern China, Adv. Atmos. Sci., 26, 1081–1087, 2009.
Wang, B. and Lin, H.: Rainy season of the Asian–Pacific summer monsoon, J. Climate, 15, 386–398, 2002.
Wang, B., Wu, R., and Fu, X.: Pacific–East Asian teleconnection: how does ENSO affect East Asian climate?, J. Climate, 13, 1517–1536, 2000.
Wang, Y., Cheng, H., Edwards, R., An, Z., Wu, J., Shen, C., and Dorale, J.: A high-resolution absolute-dated late Pleistocene monsoon record from Hulu Cave, China, Science, 294, 2345–2348, 2001.
Wang, Y., Cheng, H., Edwards, R., Kong, X., Shao, X., Chen, S., Wu, J., Jiang, X., Wang, X., and An, Z.: Millennial-and orbital-scale changes in the East Asian monsoon over the past 224,000 years, Nature, 451, 1090–1093, 2008.
Wolter, K. and Timlin, M. S.: El Niño/Southern Oscillation behaviour since 1871 as diagnosed in an extended multivariate ENSO index (MEI. ext), Int. J. Climatol., 31, 1074–1087, 2011.
Wu, H., Zhang, X., Xiaoyan, L., Li, G., and Huang, Y.: Seasonal variations of deuterium and oxygen – 18 isotopes and their response to moisture source for precipitation events in the subtropical monsoon region, Hydrol. Process., 29, 90–102, 2015.
Wu, R. and Kirtman, B. P.: Observed relationship of spring and summer East Asian rainfall with winter and spring Eurasian snow, J. Climate, 20, 1285–1304, 2007.
Wu, X. and Mao, J.: Interdecadal modulation of ENSO-related spring rainfall over South China by the Pacific Decadal Oscillation, Clim. Dynam., 47, 3203–3220, 2016.
Xu, C., Zheng, H., Nakatsuka, T., and Sano, M.: Oxygen isotope signatures preserved in tree ring cellulose as a proxy for April–September precipitation in Fujian, the subtropical region of southeast China, J. Geophys. Res.-Atmos., 118, 12805–12815, 2013.
Xu, C., Ge, J., Nakatsuka, T., Yi, L., Zheng, H., and Sano, M.: Potential utility of tree ring δ18O series for reconstructing precipitation records from the lower reaches of the Yangtze River, southeast China, J. Geophys. Res.-Atmos., 121, 3954–3968, 2016a.
Xu, C., Zheng, H., Nakatsuka, T., Sano, M., Li, Z., and Ge, J.: Inter-and intra-annual tree-ring cellulose oxygen isotope variability in response to precipitation in Southeast China, Trees, 30, 785–794, 2016b.
Xue, F. and Liu, C.: The influence of moderate ENSO on summer rainfall in eastern China and its comparison with strong ENSO, Chinese Sci. Bull., 53, 791–800, 2008.
Yang, H., Johnson, K., Griffiths, M., and Yoshimura, K.: Interannual controls on oxygen isotope variability in Asian monsoon precipitation and implications for paleoclimate reconstructions, J. Geophys. Res.-Atmos., 121, 8410–8428, 2016.
Yatagai, A., Arakawa, O., Kamiguchi, K., Kawamoto, H., Nodzu, M. I., and Hamada, A.: A 44-year daily gridded precipitation dataset for Asia based on a dense network of rain gauges, Sola, 5, 137–140, 2009.
Yoshimura, K., Kanamitsu, M., Noone, D., and Oki, T.: Historical isotope simulation using reanalysis atmospheric data, J. Geophys. Res.-Atmos., 113, https://doi.org/10.1029/2008JD010074, 2008.
Yuan, D., Cheng, H., Edwards, R., Dykoski, C., Kelly, M., Zhang, M., Qing, J., Lin, Y., Wang, Y., and Wu, J.: Timing, duration, and transitions of the last interglacial Asian monsoon, Science, 304, 575–577, 2004.
Zhang, H.: The different precipitation patterns in East Asian monsoon region during Holocene, PhD thesis, The University of Chinese Academy of Sciences, 2014 (in Chinese with English abstract).
Zhang, H., Cheng, H., Spötl, C., Cai, Y., Sinha, A., Tan, L., Yi, L., Yan, H., Kathayat, G., Ning, Y., Li, X., Zhang, F., Zhao, J., and Edwards, R. L.: A 200-year annually laminated stalagmite record of precipitation seasonality in southeastern China and its linkages to ENSO and PDO, Sci. Rep., 8, 12344, https://doi.org/10.1038/s41598-018-30112-6, 2018.
Zhang, P., Cheng, H., Edwards, R., Chen, F., Wang, Y., Yang, X., Liu, J., Tan, M., and Wang, X.: A test of climate, sun, and culture relationships from an 1810-year Chinese cave record, Science, 322, 940–942, 2008.
Zhang, R., Sumi, A., and Kimoto, M.: A diagnostic study of the impact of El Nino on the precipitation in China, Adv. Atmos. Sci., 16, 229–241, 1999.
Zhang, X. P., Guan, H. D., Zhang, X. Z., Wu, H. W., Li, G., and Huang, Y. M.: Simulation of stable water isotopic composition in the atmosphere using an isotopic Atmospheric Water Balance Model, Int. J. Climatol., 35, 846–859, 2015.
Zhou, L. T.: Impact of East Asian winter monsoon on rainfall over southeastern China and its dynamical process, Int. J. Climatol., 31, 677–686, 2011.
Zhou, L.-T. and Wu, R.: Respective impacts of the East Asian winter monsoon and ENSO on winter rainfall in China, J. Geophys. Res.-Atmos., 115, D02107, https://doi.org/10.1029/2009JD012502, 2010.
Zhou, W. and Chan, J. C.: ENSO and the South China Sea summer monsoon onset, Int. J. Climatol., 27, 157–167, 2007.
Zwart, C., Munksgaard, N., Kurita, N., and Bird, M.: Stable isotopic signature of Australian monsoon controlled by regional convection, Quaternary Sci. Rev., 151, 228–235, 2016.