the Creative Commons Attribution 4.0 License.
the Creative Commons Attribution 4.0 License.
 | 28 Oct 2020
Dynamics of primary productivity in the northeastern Bay of Bengal over the last 26 000 years
Xinquan Zhou
Stéphanie Duchamp-Alphonse
Masa Kageyama
Franck Bassinot
Luc Beaufort
Christophe Colin
At present, variations of primary productivity (PP) in the Bay of Bengal (BoB) are driven by salinity-related stratification, which is controlled by the Indian summer monsoon (ISM). The relationships between PP, precipitation, and more generally climate in the past are not clearly understood. Here, we present a new record of PP based on the examination of coccolithophore assemblages in a 26 000-year sedimentary series retrieved in the northeastern BoB (core MD77-176). We compare our PP records to published climate and monsoon records, as well as outputs from numerical experiments obtained with the Earth system model IPSL-CM5A-LR, including the marine biogeochemical component PISCES, and with the transient climate simulation TraCE-21. Our results show that PP was most probably controlled by nutrient contents and distribution within the upper water column, which were predominantly influenced by (i) regional river systems between 26 and 19 ka, i.e. when sea level was relatively low and climate was relatively dry, and (ii) salinity-related stratification over the last 19 kyr, i.e. when sea level rose and more humid conditions prevailed. During that period, salinity and stratification were directly related to monsoon precipitation dynamics, which were chiefly forced by both insolation and Atlantic meridional overturning circulation (AMOC) strength. During Heinrich Stadial 1 and the Younger Dryas, i.e. when the AMOC collapsed, weaker South Asian precipitation diminished stratification and enhanced PP. During Bølling–Allerød, i.e. when the AMOC recovered, stronger South Asian precipitation increased stratification and subdued PP. Similarly, the precipitation peak recorded around the middle–early Holocene is consistent with a stronger stratification that drives PP minima.
- Article
(12663 KB) - Full-text XML
-
Supplement
(2415 KB) - BibTeX
- EndNote


The climatology and oceanography of South Asia and the north Indian Ocean are dominated by the Indian monsoon, which is characterized by strong seasonal contrasts in wind and precipitation patterns (Shankar et al., 2002; Gadgil, 2003). During the Northern Hemisphere summer season, the north Indian Ocean is strongly influenced by southwesterly winds blowing from the sea toward the Asian continent, thus carrying large amounts of moisture onto land. During the winter season, the winds blow over the continent toward the Indian Ocean from the northeast, thus causing relatively dry conditions on land, with precipitation moved over the ocean. Monsoon precipitation is directly associated with the position of the Intertropical Convergence Zone (ITCZ; Schneider et al., 2014), whose latitudinal displacement is paced by seasonal changes in insolation due to the obliquity of the Earth's axis and precession, and it results from variations in the land–sea thermal contrast caused by differences in heat capacity of the continent and the ocean (Meehl, 1994, 1997; Webster, 1998; Wang et al., 2003). It is also influenced by teleconnections with the El Niño–Southern Oscillation and the Indian Ocean Dipole, two climate modes of interannual variability that develop from air–sea interactions in the tropical Pacific and drive significant changes within the Indian Ocean (Ashok et al., 2004; Wang et al., 2008; Currie et al., 2013; Jourdain et al., 2013).
Remarkably, the eastern part of the north Indian Ocean, i.e. the Bay of Bengal (BoB) and the Andaman Sea, receives heavier annual precipitation than its western counterpart, i.e. the Arabian Sea (AS). This pattern, together with differences in local evaporation, results in hydrological and ecological differences between these two areas (e.g. Prasanna Kumar et al., 2002; Vinayachandran et al., 2002; Shenoi et al., 2002; Shi et al., 2002; Dey and Singh, 2003; Rao and Sivakumar, 2003; Prasad, 2004; Currie et al., 2013). A noteworthy characteristic of modern conditions prevailing in the north Indian Ocean is the low PP in the BoB and the Andaman Sea compared to the AS (Prasanna Kumar et al., 2002). Previous studies revealed that low annual PP in the BoB results from important freshwater input by rivers and direct rainfall on the sea, which cause a strong stratification of the upper seawater column and an impoverishment of nutrients in surface layers (Vinayachandran et al., 2002; Madhupratap et al., 2003; Gauns et al., 2005). In contrast, the AS has high PP, which is mainly associated with high nutrient content in the upper layer thanks to wind-driven mixing during winter and coastal upwelling during summer (Schott, 1983; Anderson and Prell, 1992; Madhupratap et al., 1996; Gardner et al., 1999; Prasanna Kumar et al., 2001; Wiggert et al., 2005). Both the BoB and AS are characterized by a relatively small sea surface temperature (SST) seasonal cycle. Thus, seasonal and interannual changes in PP result chiefly from variations in the nutricline depth (i.e. variations in nutrient availability in the photic zone) controlled by salinity-related stratification of the upper seawater column in relation to local evaporation–precipitation balance, river runoff, and/or dynamical processes such as wind-driven mixing and/or upwelling (e.g. Lévy et al., 2001; Vinayachandran et al., 2002; Chiba et al., 2004; Rao et al., 2011; van de Poll et al., 2013; Behara and Vinayachandran, 2016; Spiro Jaeger and Mahadevan, 2018).
Past changes in PP at both orbital and millennial scales in the western and northern AS have been widely studied, and authors have interpreted PP variations as chiefly reflecting changes in the intensity of Indian summer monsoon (ISM) southwesterly winds (e.g. Schulz et al., 1998; Ivanova et al., 2003; Ivanochko et al., 2005; Singh et al., 2011). Far less is known about past changes in PP in the BoB and their link to changes in monsoon precipitation, although reconstructions and climate model simulations have clearly pointed to important changes in ISM precipitation driven by both orbital forcing and fast changes at high latitude, such as those associated with the Atlantic meridional overturning circulation (AMOC) (e.g. Braconnot et al., 2007a, b; Kageyama et al., 2013; Marzin et al., 2013; Contreras-Rosales et al., 2014). The poorer attention devoted to past PP in the BoB is in part due to the absence of high-time-resolution PP records in the BoB and the Andaman Sea (Phillips et al., 2014; Da Silva et al., 2017; Li et al., 2019), which precludes our complete understanding of how monsoon climate changes impact tropical ocean ecology through different mechanisms and at different timescales. To fill this gap, reliable paleo-PP records are needed for that region.
Coccolithophores are marine-calcifying phytoplankton organisms that constitute one of the most important “functional groups” responsible for primary production and export of carbonate particles (i.e. the coccoliths they produce) to the sedimentary reservoir. The coccoliths preserved in marine sediment are good study material for paleoenvironmental reconstructions. Particularly, Florisphaera profunda is a lower-photic-zone dweller, and its relative abundance in marine coccolithophore assemblages obtained from sediments has been successfully used to reconstruct past changes in the nutricline depth and PP (Molfino and McIntyre, 1990a, b; Beaufort et al., 1997; Zhang et al., 2016; Hernández-Almeida et al., 2019).
In this study, we provide the first record of coccolith assemblage changes in the BoB. The relative abundance of F. profunda in the sediment core MD77-176 makes it possible to reconstruct at high temporal resolution paleo-PP over the last 26 kyr in the northeastern BoB. The studied period covers a complete precession cycle and the last deglaciation. This time interval is characterized by rapid climate changes remotely controlled by Northern Hemisphere high-latitude climate and disruptions of the AMOC (McManus et al., 2004; Clement and Peterson, 2008; Liu et al., 2009; Wolff et al., 2010; Clark et al., 2012), as observed during the cold periods of Heinrich Stadial 1 (17–14.8 ka) and the Younger Dryas (12.9–11.8 ka) when massive collapses of Northern Hemisphere ice shelves released prodigious volume of icebergs and fresh water in the North Atlantic Ocean (Heinrich, 1988). In addition, we used the outputs of paleoclimate experiments obtained with the Institut Pierre Simon Laplace Earth System Model version 5 (IPSL-CM5A-LR) (Dufresne et al., 2013), in which marine biogeochemistry is represented, and the transient climate simulations run with the Community Climate System Model version 3 (CCSM3) (He, 2008; Collins et al., 2006a) to analyse our reconstructed PP results in terms of the local evolution of upper seawater stratification and monsoon climate dynamics. Based on our reconstructed PP record and modelling results documented through integrated PP maps as well as oceanic parameter profiles and cross plots, we unravelled the dynamical relationship between PP in the northeastern BoB and the Indian monsoon at both orbital and millennial timescales.
Core MD77-176 (14∘30′5′′ N, 93∘07′6′′ E) was retrieved from the northeastern BoB, at the junction with the Andaman Sea, during the OSIRIS 3 cruise of the R.V. Marion Dufresne in 1977 (Fig. 1a). The site lies ∼ 200 km southwest of the modern Irrawaddy River mouth. It was retrieved on the continental slope at a water depth of 1375 m, i.e. above the modern lysocline located between ∼ 2000 and ∼ 2800 m in the northern BoB (Cullen and Prell, 1984; Belyaeva and Burmistrova, 1985). The lithology consists of olive grey terrigenous clay and silty clay layers with foraminifera- and nannofossil-bearing oozes.
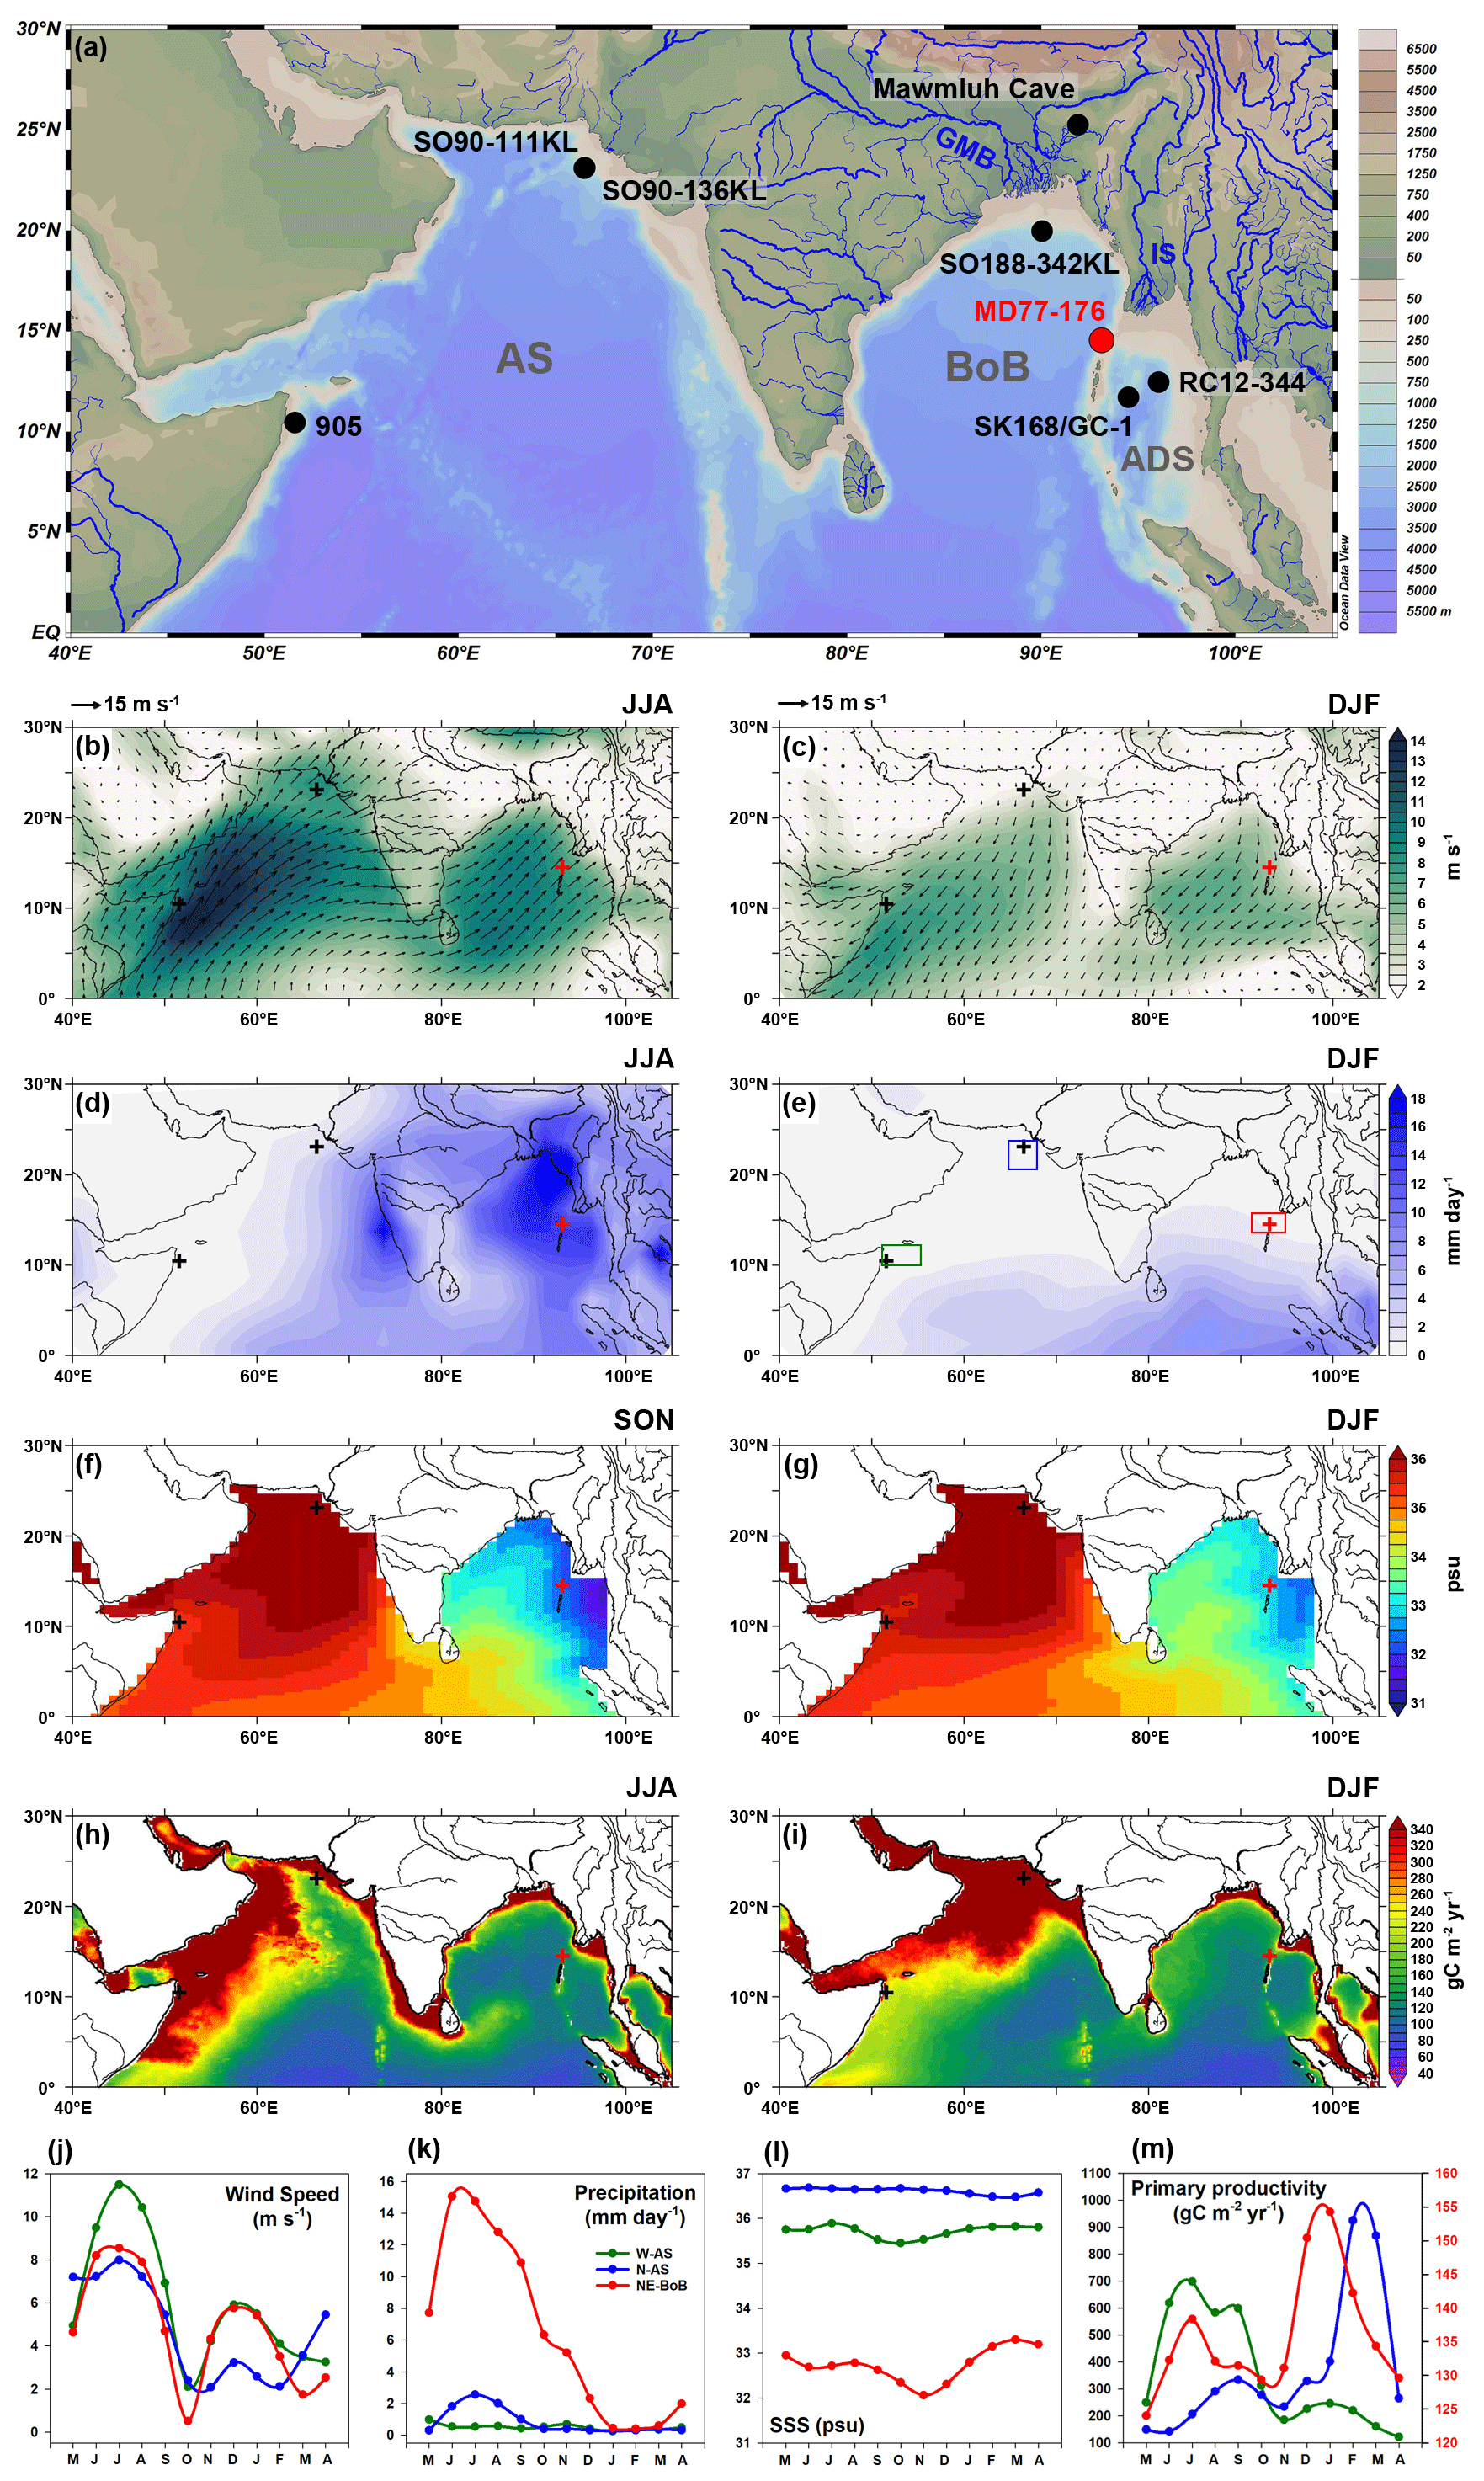
Figure 1(a) Geographic setting and bathymetric map of the Indian monsoon climate zone including the Arabian Sea (AS), the Bay of Bengal (BoB), the Andaman Sea (ADS), the Ganges–Brahmaputra–Meghna river system (GMB), and the Irrawaddy–Salween river system (IS). The map was created with Ocean Data View software (© Reiner Schlitzer, Alfred Wegener Institute) with its built-in global high-resolution bathymetric data (GlobHR). The location of the sediment core MD77-176 is marked by the red circle. Black circles mark the locations of published records shown in Fig. 6. (b, c) Mean (from 1979 to 2018) surface wind speed and wind vectors for Northern Hemisphere (NH) summer (June–July–August, JJA) and winter (December–January–February, DJF), respectively. Data are from NCEP-DOE Reanalysis 2 (https://psl.noaa.gov/data/gridded/data.ncep.reanalysis2.html, last access: 25 October 2020). (d, e) Mean (from 1979 to 2018) precipitation rate for NH winter and summer, respectively. Data are from the CPC Merged Analysis of Precipitation (https://psl.noaa.gov/data/gridded/data.cmap.html, last access: 25 October 2020). (f, g) Mean (from 1979 to 2018) surface seawater salinity (SSS) for NH autumn (September–October–November, SON) and winter, respectively. Data are from the NCEP Global Ocean Data Assimilation System (https://psl.noaa.gov/data/gridded/data.godas.html, last access: 25 October 2020). (h, i) Mean (from 2003 to 2018) net primary productivity for NH summer and winter, respectively. PP data are based on MODIS chlorophyll a and calculated using the Vertical Generalized Production Model (VGPM; Behrenfeld and Falkowski, 1997) (http://science.oregonstate.edu/ocean.productivity, last access: 25 October 2020). (j–m) Regional climatology and oceanography in the western AS, northern AS, and northeastern BoB. The regions of data extraction are marked by coloured rectangles in panel (e). Data sources are the same as above.
At our core site, the lowest and highest SSTs recorded during winter (∼ 26 ∘C) and summer (∼ 28–29 ∘C), respectively, clearly reflect the relatively low-amplitude SST seasonal changes (∼ 2–3 ∘C) observed in the area (Locarnini et al., 2010). The oceanic environment is under the influence of the Indian monsoon and shows strong seasonal variations in evaporation and precipitation that are expected under such conditions (Webster et al., 1998; Schott and McCreary, 2001; Shankar et al., 2002; Gadgil, 2003). During the summer, moisture-rich southwesterly surface winds blowing from the Indian Ocean result in heavy precipitation (Fig. 1b, d; Lau et al., 2000; Chen, 2003; Randel and Park, 2006). During winter, dry and cool northeasterly surface winds, weaker than the summer winds, blow from Himalayan highlands and result in drier conditions (Fig. 1c, e).
The summer precipitation rates over the BoB, the Andaman Sea, and the surrounding lands (up to 15 mm d−1) are much higher than in the AS (1–3 mm d−1; Fig. 1d, k). This heavy precipitation area covers the catchments of the Ganges–Brahmaputra–Meghna (GBM) and Irrawaddy–Salween (IS) river systems and thus generates massive freshwater discharge (up to 4050 km3 yr−1) to the ocean (Sengupta et al., 2006). This input of fresh water depletes sea surface salinity (SSS) at our core site (lower than 33 psu) in the same way as the entire northern BoB and Andaman Sea, which is occupied by a low-salinity tongue, with the largest extension in November, several months later than the peak of summer precipitation (Akhil et al., 2014; Fournier et al., 2017; Fig. 1f, g, l). Low SSS decreases sea surface density, thereby increasing the density gradient of the upper water column and thus leading to a strong stratification that impedes the transfer of nutrients from the nutrient-rich deep layer into the euphotic zone. Such a “barrier layer” effect results in generally low annual PP (around 100–140 g C m−2 yr−1) in this area (Prasanna Kumar et al., 2002; Madhupratap et al., 2003; Fig. 1h, i), with maxima being reached during winter when increased surface wind intensity together with decreased precipitation enhance upper seawater column mixing. The low annual PP at the studied site indicates that this area is not significantly influenced by nutrient inputs from rivers, which is different from nearshore settings characterized by annual PP maxima (up to 340 g C m−2 yr−1). By contrast, evaporation is high and precipitation is low over the AS. It generates higher SSS (higher than 35 psu) than in the BoB (Fig. 1f, g, l). Such SSS conditions and therefore the absence of strong stratification make it possible for the development of upwelling and convective mixing during summer and winter, respectively, and thus high PP through the year (up to 320–340 g C m−2 yr−1; Fig. 1h) (Anderson and Prell, 1992; Prasanna Kumar et al., 2001, 2009; McCreary et al., 2009).
3.1 Age model and sampling
The age model of core MD77-176 was previously established by Marzin et al. (2013) based on 31 accelerator mass spectrometry (AMS) 14C ages combined with the MD77-176 high-resolution oxygen isotope record obtained on the planktonic foraminifera Globigerinoides ruber, which were correlated with the GISP2 Greenland ice core oxygen isotope curve. The correlated age model is consistent with the AMS 14C age model, especially after 20 kyr (Marzin et al., 2013). The sedimentation rates recorded at site MD77-176 (∼ 25 cm kyr−1 and up to 40 cm kyr−1 for the Holocene) provide a good opportunity to study productivity patterns over the last 26 kyr with millennial to centennial resolutions (Fig. S1 in the Supplement).
3.2 Coccolith analysis and PP reconstruction
For coccolith data, a total of 212 samples were analysed, with a temporal resolution of ∼ 50 to 400 years. Slides were prepared using the “settling” technique described in Duchamp-Alphonse et al. (2018) after Beaufort et al. (2014). About 0.004 g of dry sediment was diluted in 28 mL Luchon™ water (pH 8, bicarbonate 78.1 mg L−1, total dissolved solid 83 mg L−1) within a flat beaker and settled on a 12 × 12 mm coverslip for 4 h. After pumping the clear liquid out, the coverslip was then dried at 60 ∘C in an oven and mounted on a slide with NOA74 glue. This technique ensures a homogenous distribution of coccoliths on the coverslip.
Slices were analysed with a polarized light microscope (Leica DM6000B) at × 1000 magnification. For each slice, at least 500 coccolith specimens were counted by human eyes under at least three random fields of view. The relative abundance of F. profunda (Fp%) was calculated as Fp% = 100 × (Fp number ∕ total coccolith number). The 95 % confidence interval for Fp% was calculated following the method of Patterson and Fishbein (1984) and corresponds to a reproducibility smaller than ± 5 %.
Fp% indicates the relative depth of the nutricline, which is critical for PP (Molfino and McIntyre, 1990a, b). In contrast to most coccolith species that are found in the upper photic zone (< 100 m of water depth), F. profunda dwells in the lower photic zone at water depths of ∼ 100–200 m (Okada and Honjo, 1973). Therefore, when the nutricline gets shallower, more nutrients are brought into the upper euphotic zone and primary production increases, while the relative abundance of F. profunda decreases. By contrast, when the nutricline becomes deeper and primary production decreases, the relative abundance of F. profunda increases. This relationship between Fp% and nutricline depth is the basis of PP reconstructions via Fp% in marine sediment. Beaufort et al. (1997) first established an Fp%–PP empirical relationship in the AS based on PP estimates from satellite observations and Fp% in surface sediments. In this study, we estimated PP for the last 26 kyr using a recently published Fp%–PP empirical equation suited for the tropical Indian Ocean (Hernández-Almeida et al., 2019): PP = [] × 365∕1000. The unit of estimated PP is grams of carbon per metre squared per year (g C m−2 yr−1).
3.3 Paleoclimate simulations
3.3.1 Experiments run with IPSL-CM5A-LR
IPSL-CM5A-LR (termed IPSL-CM5A in the following) is an Earth system model (ESM) developed at the Institut Pierre Simon Laplace (Dufresne et al., 2013) for the Coupled Model Intercomparison Project phase 5 (CMIP5; Taylor et al., 2012) and the Paleoclimate Modelling Intercomparison Project phase 3 (PMIP3; Braconnot et al., 2012). It is composed of several model components representing the atmospheric general circulation and physics (LMDZ5A; Hourdin et al., 2013), the land surface (ORCHIDEE; Krinner et al., 2005), and the ocean (NEMO v3.2; Madec, 2008), which includes the ocean general circulation and physics (OPA9), sea ice (LIM-2; Fichefet and Maqueda, 1997), and marine biogeochemistry (PISCES; Aumont and Bopp, 2006). The LMDZ atmospheric grid is regular in the horizontal with 96× 95 points in longitude × latitude (corresponding to a resolution of ∼ 3.75∘ × 1.9∘) and 39 irregularly spaced vertical levels. The oceanic grid is curvilinear, with 182 × 149 points corresponding to a nominal resolution of 2∘ and 31 vertical levels. It is refined close to the Equator, where the resolution reaches ∼ 0.5∘.
Four experiments set under different boundary conditions were exploited in this study. Three of them were run for the PMIP3 exercise: the pre-industrial experiment (CTRL), the mid-Holocene experiment (MH), and the Last Glacial Maximum experiment (LGMc). Boundary conditions and details for these three experiments can be found in Le Mézo et al. (2017). The fourth experiment (LGMf) is a freshwater “hosing” simulation similar to the IPSL-CM4 freshwater hosing simulation (Kageyama et al., 2013), in which a freshwater flux of 0.2 Sv is applied under LGM (LGMc) conditions over the North Atlantic Ocean, the Nordic Seas, and the Arctic Ocean, which causes the AMOC to slow down (Fig. S2). Both LGMf and LGMc were run for nearly 500 model years. The monthly outputs averaged over the last 100 years of the four experiments were used to compare their mean states. In addition, we focused on monthly results averaged over successive periods of 10 years for the LGMc and LGMf experiments to analyse the transient effects of AMOC changes.
In the glacial experiments (LGMc and LGMf) the sea level is lower, resulting in more extensive continents, including in the study area. The core location is then closer to the coast. In these simulations, the river mouth locations, at which fresh water and nutrients from rivers are brought to the ocean, are moved together with the modified coastline. In particular, the GBM river mouth is brought to the south of its present location, while the IS river mouth is brought northeastward. These locations have been chosen as they reflect the closest LGM coastal points to the present river mouths and the most probably river paths during low sea level conditions. In our relatively simple set-up, for the MH, LGMc, and LGMf simulations we are using the same nutrient content of river inputs for the CTRL simulations, in which they are prescribed according to Ludwig et al. (1996). However, due to the sea level drop and associated continental extension under glacial conditions, in LGMc and LGMf, the nutrients from rivers are less diluted before reaching a fixed location.
Several parameters were extracted to describe climate conditions, including surface wind speed and precipitation minus evaporation rates (P−E), as well as ocean conditions: potential temperature (Tθ), salinity, nitrate content (NO), upper seawater stratification based on the potential density (σT) difference between 200 and 5 m (ΔPD; Behrenfeld et al., 2006), and primary productivity (PP). Tθ and salinity of the top layer of the oceanic model are used as SST and SSS.
3.3.2 TraCE-21 simulation
TraCE-21 (termed TraCE in the following) is a transient simulation of the global climate evolution over the last 22 kyr which was run with the CCSM3 model designed by the National Center of Atmosphere Research (He, 2008; Collins et al., 2006a; Liu et al., 2009). CCSM3 is a global, coupled ocean–atmosphere–sea ice–land surface climate model run without flux adjustment (Collins et al., 2006a). It includes four components representing the atmosphere (CAM3; Collins et al., 2006b), land surface (CLM3; Dickinson et al., 2006), sea ice (CSIM5; Briegleb et al., 2004), and ocean (POP; Smith and Gent, 2002). The forcing of the TraCE-21 simulation comprises changes in insolation due to the slow variations of astronomical parameters (ORB), atmospheric greenhouse gases (GHGs) as measured in ice cores, topography, land surface type, coastlines (ICE-5G; Peltier, 2004), and freshwater discharge from melting ice sheets, which force the AMOC strength to change (MWF; Fig. S3). In addition to the full TraCE-21 simulation, we used the four single-forcing sensitivity experiments (ORB, GHG, MWF, and ICE), with only one of the forcings mentioned above allowed to evolve through time, while the three others are kept fixed at their 19 ka value. Atmosphere decadal mean seasonally averaged and ocean decadal mean annually averaged datasets were downloaded from the website of the Earth System Grid: https://earthsystemgrid.org/project/trace.html (last access: 25 October 2020). They have been used to provide the same atmospheric and oceanic parameters simulated by the IPSL model, but over the last 26 kyr and with the exception of marine biogeochemical variables which are not computed in the CCSM3.
4.1 Coccolith abundances and reconstructed PP over the last 26 kyr
At the studied site, coccolith assemblages mainly consist of Florisphaera profunda, Emiliania huxleyi, and Gephyrocapsa spp. F. profunda largely dominates the assemblage (> 60 %) over the last 26 kyr, while E. huxleyi and Gephyrocapsa spp. never exceed 23 % (Fig. 2). Such relative contributions are coherent with coccolith distribution in sediment traps from the northern BoB (Stoll et al., 2007), which shows a high abundance of F. profunda due to a strong salinity-related stratification and low surface nutrient concentration (see Sect. 2).

Figure 2Relative abundance changes (%) of main coccolith species and reconstructed PP of core MD77-176: Gephyrocapsa spp. (pink), Emiliania huxleyi (green), Florisphaera profunda (blue), PP (red). The curves are smoothed results (five-point moving average of 0.1 kyr interpolation of original data).
The most striking shifts of coccolith abundances are observed between ∼ 20 and ∼ 11 ka, particularly around 15–14 ka when F. profunda drastically increases from 60 % to 93 %, while E. huxleyi decreases from 22 % to 1 % and Gephyrocapsa spp. slightly decreases from 12 % to 5 %. Such patterns subdivide the record into three main time intervals: (i) from ∼ 26 to 19 ka when F. profunda depicts relatively high-amplitude variations, ranging from 60 % to 85 % with minima at ∼ 25, 23, and 21 ka, while E. huxleyi and Gephyrocapsa spp. both average ∼ 10%; (ii) from 19 to 11 ka when F. profunda, E. huxleyi, and Gephyrocapsa spp. depict their highest variations (up to about 33 %, 21 %, and 15 % in amplitude, respectively); and (iii) from 11 to 1 ka when F. profunda shows a long-term increasing trend up to 8 kyr, a maxima of 85 % between 8 and 6 kyr, and a long-term decreasing trend up to 1 kyr, while Gephyrocapsa spp. abundances exceed those of E. huxleyi despite minima of ∼ 7 % between 8 and 6 ka.
Estimated PP varies between 80 and 170 g C m−2 yr−1 (Fig. 2). Remarkably, values obtained during the late Holocene (∼ 125 g C m−2 yr−1) are comparable to those recorded in the study area today (annual PP mean of ∼ 135 g C m−2 yr−1). Because estimated PP is inversely related to F. profunda percentages (see Sect. 3.2), PP reconstructed over the last 26 kyr mirrors F. profunda distribution. It is characterized by peaks higher than 140 g C m−2 yr−1 at ∼ 25, 23, and 21 ka. Changes with the largest amplitude are found over the deglaciation with a maximum (∼ 170 g C m−2 yr−1) and a minimum (∼ 80 g C m−2 yr−1) observed at ∼ 15 and 14 ka, respectively. Relatively low PP is recorded during the Holocene, with minima of 90 g C m−2 yr−1 obtained between 8 and 6 ka.
4.2 Simulated PP and physicochemical profiles
Simulated annual and seasonal (summer and winter) patterns of PP (g C m−2 yr−1) are shown for the BoB and the Andaman Sea in Fig. 3, where the MH and LGMc simulations are compared to the CTRL and where the LGMf simulation is compared to the LGMc, highlighting the effects of the AMOC slowdown. According to the CTRL simulation, the coastal northern BoB and Andaman Sea as well as the southwestern BoB appear to be the most productive areas under pre-industrial conditions, which is in accordance with the Vertical Generalized Production Model (VGPM), representing in situ PP distribution based on satellite-derived chlorophyll concentration (Fig. 1h, i; Behrenfeld and Falkowski, 1997). In all cases, high PP (> 220 g C m−2 yr−1) is related to high nutrient contents in the upper column, thanks to the influence of river discharge (northern coastal BoB and Andaman Sea) or the development of coastal upwelling (southwestern BoB; Vinayachandran et al., 2004). Hence, despite its coarse spatial resolution, the IPSL-CM5A model is able to represent the main area of high PP and the seasonal cycles. The differences in annual PP between MH and CTRL reveal a dipole structure in the studied area, with slightly lower PP in the western part of the BoB and slightly higher PP in the eastern part including the Andaman Sea. A strong signal of lower PP is found in the southwestern BoB during summer and in the northern BoB during winter. Slightly higher PP is found in the eastern BoB and the Andaman Sea, mainly during summer. The overall increase in annual PP simulated within the centre part of the BoB during the LGM compared to pre-industrial (LGMc–CTRL) reflects the general PP increase simulated during the summer season. This area is an extension of the high PP found by the CTRL simulation within the southwestern BoB. One of the most striking patterns highlighted by this comparison is the important increase in annual PP in the northeastern part of the BoB at the junction with the Andaman Sea, which reflects significant increases in PP during both summer and winter seasons, while PP in the northern BoB and the whole Andaman Sea is lower. This pattern highlights the CTRL river mouth grid shift toward the northeastern BoB during the LGM (Sect. 3.3.1) and its most probable location closer to the MD77-176 site in that period. Between LMGf and LGMc, PP is lower in the entire BoB, except in the northeastern part of the BoB in winter, for which a higher annual PP is simulated.

Figure 3IPSL-CM5A-LR-simulated integrated PP of the full water column (g C m−2 yr−1) for the pre-industrial (CTRL) (a–c). PP differences between the mid-Holocene (MH) and CTRL (d–f), the Last Glacial Maximum (LGMc) and CTRL (g–i), and the Last Glacial Maximum under AMOC shutdown (LGMf) and LGMc (j–l). Results are shown for annual mean (ANN), summer (June–July–August, JJA), and winter (December–January–February, DJF). Rectangles 1 and 2 in panel (d) mark the grids from which the vertical profiles in Fig. 4 are extracted. Rectangle 3 in panel (e) marks the grids from which the vertical profiles in Fig. 5 are extracted. The black dots mark the location of core MD77-176.
Summer and winter vertical profiles are extracted from grids at the GBM and the IS river mouths for CTRL and MH (Fig. 4), as well as from grids at the northeastern BoB, near the location where core MD77-176 was retrieved, for CTRL, MH, LGMc, and LGMf (Fig. 5).
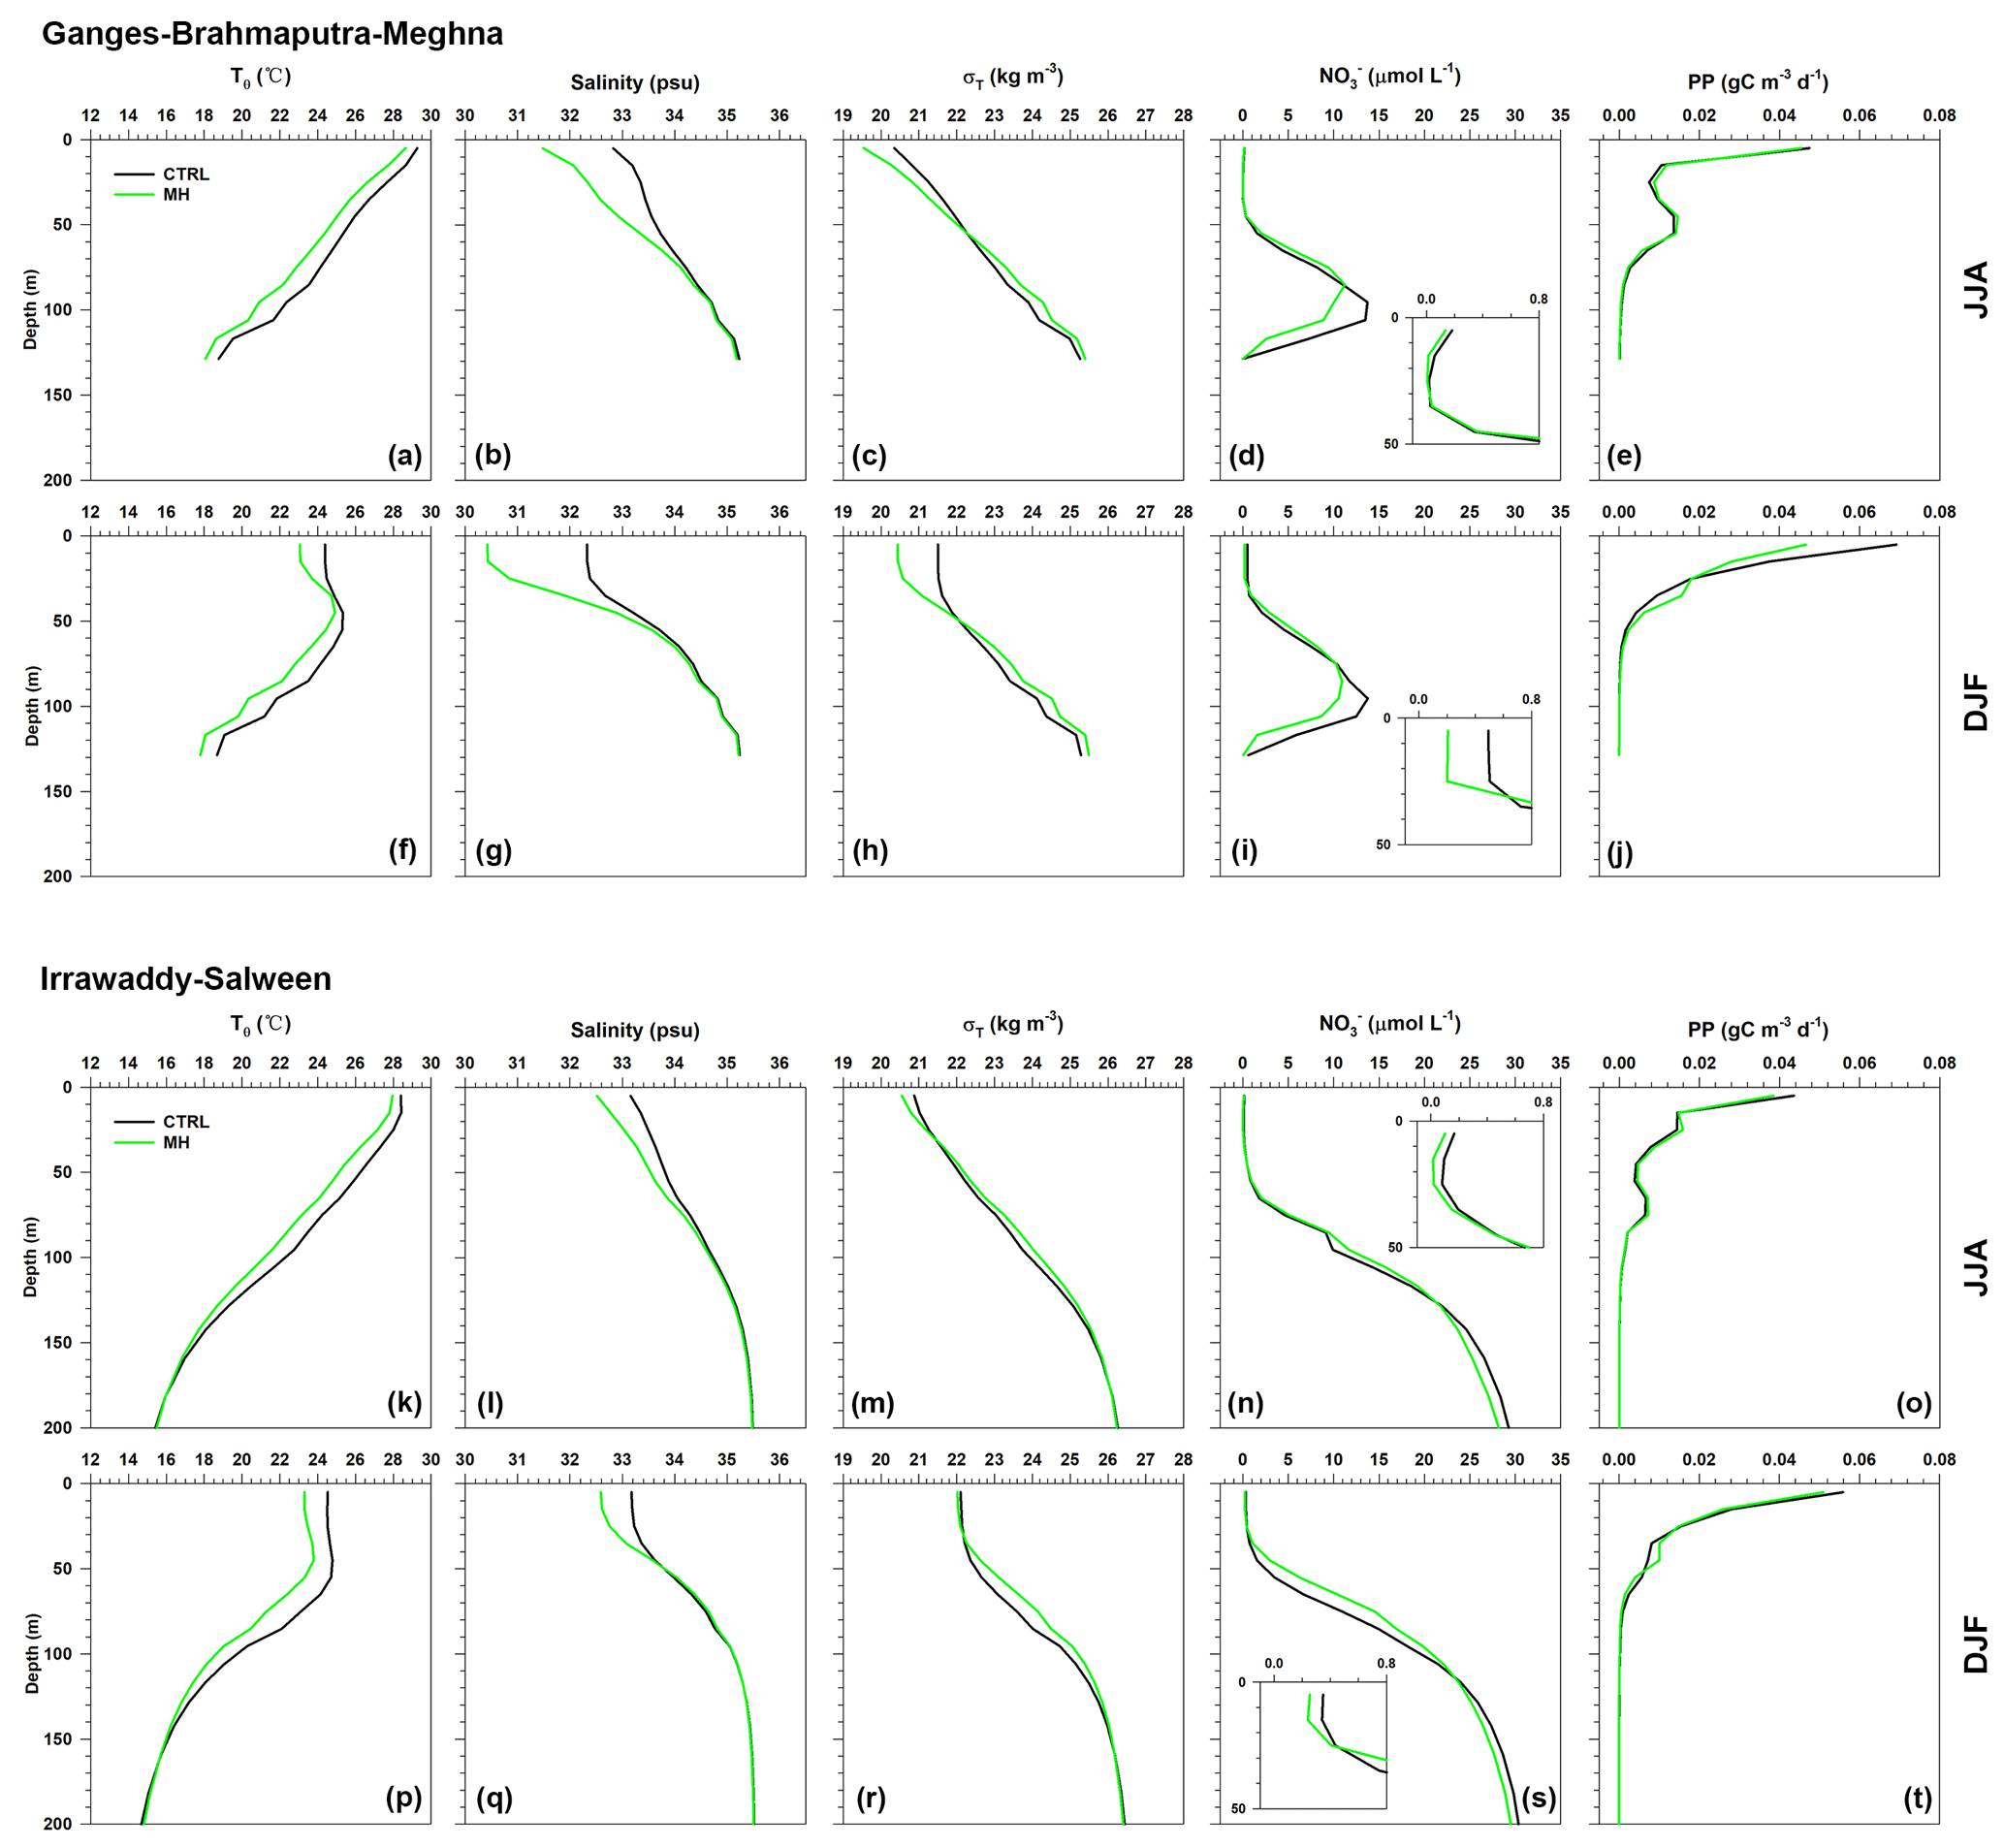
Figure 4Simulated ocean profiles between 0 and 200 water depths in the MH and CTRL simulations run with IPSL-CM5A-LR. Data in panels (a)–(j) have been extracted from the grids located in the Ganges–Brahmaputra–Meghna river mouth (rectangle 1 in Fig. 3d). (a–e) Results for summer (June–July–August, JJA). (f–j) Results for winter (December–January–February, DJF). Data in panels (k)–(t) have been extracted from the grids located in the Irrawaddy–Salween river mouth (rectangle 2 in Fig. 3d). (k–o) Results for summer (JJA). (p–t) Results for winter (DJF). The parameters shown here are potential temperature (Tθ), salinity, potential density (sigma-t, σT), nitrate concentration of seawater representing seawater nutrient content (NO), and total primary productivity (PP). The nutricline, halocline, and pycnocline are the depths with the largest vertical gradients of nutrient content, potential density, and salinity under the upper seawater layers.

Figure 5Simulated ocean profiles between 0 and 200 m of water depth in four experiments run with IPSL-CM5A-LR. (a–e) Results for summer (June–July–August, JJA). (f–j) Results for winter (December–January–February, DJF). Data have been extracted from the grids located in the northeastern part of the BoB closed to the MD77-176 core site (rectangle 3 in Fig. 3e). The parameters shown here are potential temperature (Tθ), salinity, potential density (sigma-t, σT), nitrate concentration of seawater representing seawater nutrient content (NO), and total primary productivity (PP). The nutricline, halocline, and pycnocline are the depths with the largest vertical gradients of nutrient content, potential density, and salinity under the upper seawater layers.
CTRL and MH river mouth profiles depict PP maxima within the surface layers (0–50 m), where reduced salinity and density conditions help maintain a nutricline around 50 m of water depth in both seasons (Fig. 4). In all cases, temperatures and SSS are lower during the MH compared to CTRL. The most striking difference is observed for the GBM river mouth system, where salinity is clearly lower within the surface layer (0–30 m) during MH compared to CTRL, especially during winter, while temperature change is limited. Such a pattern results in lower density in the surface layer and a stronger density gradient within the upper 200 m of the seawater (i.e. stronger salinity-related stratification) during winter in the MH. Under such conditions, nutrient content and thus PP are lower in the upper 30 m of water depth.
For the CTRL profiles of the northeastern BoB, PP maxima are found at ∼ 75 m of water depth, just above the nutricline, in both seasons (Fig. 5). Such a pattern reflects what is found in the open sea environment of the BoB at present (Madhupratap et al., 2003). MH PP profiles show no large difference compared to the CTRL ones. It is only during winter that salinity is significantly lower, between 0 and 50 m of water depth, and that the associated increase in the density gradient within the photic zone is related to slightly lower PP.
PP profiles of LGMc and LGMf are very different from those of CTRL and MH. They are associated with generally saltier and/or colder surface waters. Interestingly, high PP is found in the surface layers (0–50 m) where nutrient contents are higher than CTRL and MH conditions (Fig. 5). Such distributions show that nutrient content and PP are comparable to those found in the CTRL river mouth profiles, particularly during winter when LGMc and LGMf simulations of the salinity gradient show a shallower halocline that raises the density gradient of surface layers and is thus accompanied by a shallower pycnocline. It indicates that PP reacts to the shift from the open sea environment configuration during CTRL and MH simulations to the more coastal one during LGMc and LGMf simulations, as previously documented in Sect. 3.3.1. Interestingly, during the winter, PP and nutrient contents between 0 and 30 m water depths in LGMf are higher than those of LGMc. Such patterns are associated with higher salinity in surface waters and a reduced density gradient that might promote upper layer mixing. Overall, the LMGc, LMGf, and MH simulations do not show a strong difference in the vertical variation of temperature compared to the MH. Changes in PP and nutrient contents are rather associated with modifications in the density gradient thanks to salinity changes, which highlight the importance of salinity-related stratification vs. mixing in the PP distribution in the past.
5.1 The last glacial period
During the LGM (23–19 ka), i.e. when drier conditions prevailed in the area, our reconstructed PP estimates average ∼ 120 g C m−2 yr−1, which is nearly the same value as the one reconstructed for the late Holocene (2–1 ka) (Figs. 6i and 7f, g). An important discovery is the high-amplitude millennial-scale variations that PP depicts from 26 to 19 ka. Such variations mirror those of SSS (seawater δ18O anomaly signal) obtained on the same core (Fig. 6h) and to some extent in the Andaman Sea (Fig. 6e, g), thus documenting high PP intervals at times of low SSS pulses and vice versa. In such a context, the most plausible explanation for higher PP coeval with low SSS involves higher nutrient inputs from rivers. Indeed, during the LGM and relatively low sea level, a more proximal IS river mouth system might promote freshwater and terrigenous nutrient transfer to our core site, thus decreasing (increasing) SSS and increasing (decreasing) nutrient content and PP, according to South Asia precipitation and riverine flux dynamics. Such millennial-scale variations are readily seen in the record of South Asian monsoonal precipitation, thus confirming our assumption. Indeed, despite long-term aridity during the LMG, as documented by the net precipitation results of the TraCE simulation together with δ18O and δD alkane signals from cave speleothems and marine sediments, respectively (Fig. 6c, d), rapid SSS decreases at our core site are in phase with short-term increases in precipitation and vice versa (Fig. 6h). They are also found in IPSL-CM5A simulations with higher PP and higher nutrient contents within the upper 50 m of the photic zone during LGMf and LGMc compared to MH and CTRL, reflecting higher terrigenous nutrient inputs to the studied site as the IS river mouth system probably migrates northward, i.e closer to our core site (Sect. 4.2). Interestingly, the highest reconstructed PP (∼ 160 g C m−2 yr−1) remains lower than the simulated PP at river mouths (> 220 g C m−2 yr−1), thus suggesting that core MD77-176 is not within the coastal environment during the LGM but is rather influenced by the nutrient-enriched river system plume. The local specificities of the area have in part been highlighted by Sijinkumar et al. (2016), who reported lower SSS compared to the modern time in the northern Andaman Sea due to major changes in basin morphologies between the two periods, thanks to the sea level being significantly lower during the LGM compared to modern times. Therefore, in such contexts, one cannot exclude the possibility that both the low sea level conditions and the migration of the IS river mouth system might result in the specific SSS and PP records obtained at our core site. In all cases, it appears that between 26 and 19 ka, the IS river system renders MD77-176 PP sensitive to millennial-scale variations in South Asian monsoonal precipitation, as it modulates riverine flux and the extent of the nutrient-rich riverine plume in the area.

Figure 6(a) 30∘ N August insolation (Laskar et al., 2004). (b) AMOC strength indicated by the 231Pa∕230Th ratio of marine sediment from the western subtropical Atlantic Ocean (in pink, McManus et al., 2004). The changes in the maximum AMOC stream function below 500 m (AMOC strength) in TraCE-21 (in grey). (c) Mawmluh Cave speleothem δ18O signal (Dutt et al., 2015). (d) Alkane δD signal in marine core SO188-342 (in green, Contreras-Rosales et al., 2014) and simulated annual mean precipitation minus evaporation of TraCE-21 (in grey). (e) Seawater δ18O record of core RC12-344 (Rashid et al., 2007). (f) Simulated annual mean SST in the NE BoB. (g) Ba∕Ca ratio derived from the mixed layer foraminifer species Globigerinoides sacculifer from core SK 168/GC-1 (Gebregiogis et al., 2016). (h) Seawater δ18O anomaly record of core MD77-176 (Marzin et al., 2013). (i) Estimated PP record of core MD77-176 (this study, in red) and simulated annual mean potential density gradient between 200 and 5 m for TraCE-21 (in grey), which reflects the stratification of the upper seawater (Behrenfeld et al., 2006). (j) Ba∕Al ratio of sediment core 905 (Ivanochko et al., 2005). (k) Total organic carbon weight percentage of core SO90-136KL (Schulz et al., 1998). TraCE curves are shown using 100-year averaged results. The results of single forcing experiments are shown in Fig. S4. Core locations of all these records above are marked in Fig. 1a. Grids of extracted TraCE data are shown in Fig. S5. High-resolution reconstructed and Trace21 data provide coherent climate patterns for the following: (i) 26–19 ka when higher PP is associated with lower SSS, lower moister conditions, and vice versa, highlighting the control that the river mouth system exerts on PP; (ii) 19–11 ka when higher PP, in phase with AMOC strength, is associated with higher SSS and reduced precipitation, highlighting the impact of high-latitude climate on South Asian precipitation, salinity-related stratification, and PP; and (iii) 11–1 ka when higher PP, in phase with August insolation, is associated with higher SSS and reduced precipitation, highlighting the impact of insolation on South Asian precipitation on salinity-related stratification and PP during the Holocene, more particularly during the Early Holocene Climatic Optimum (∼ 8–6 ka).
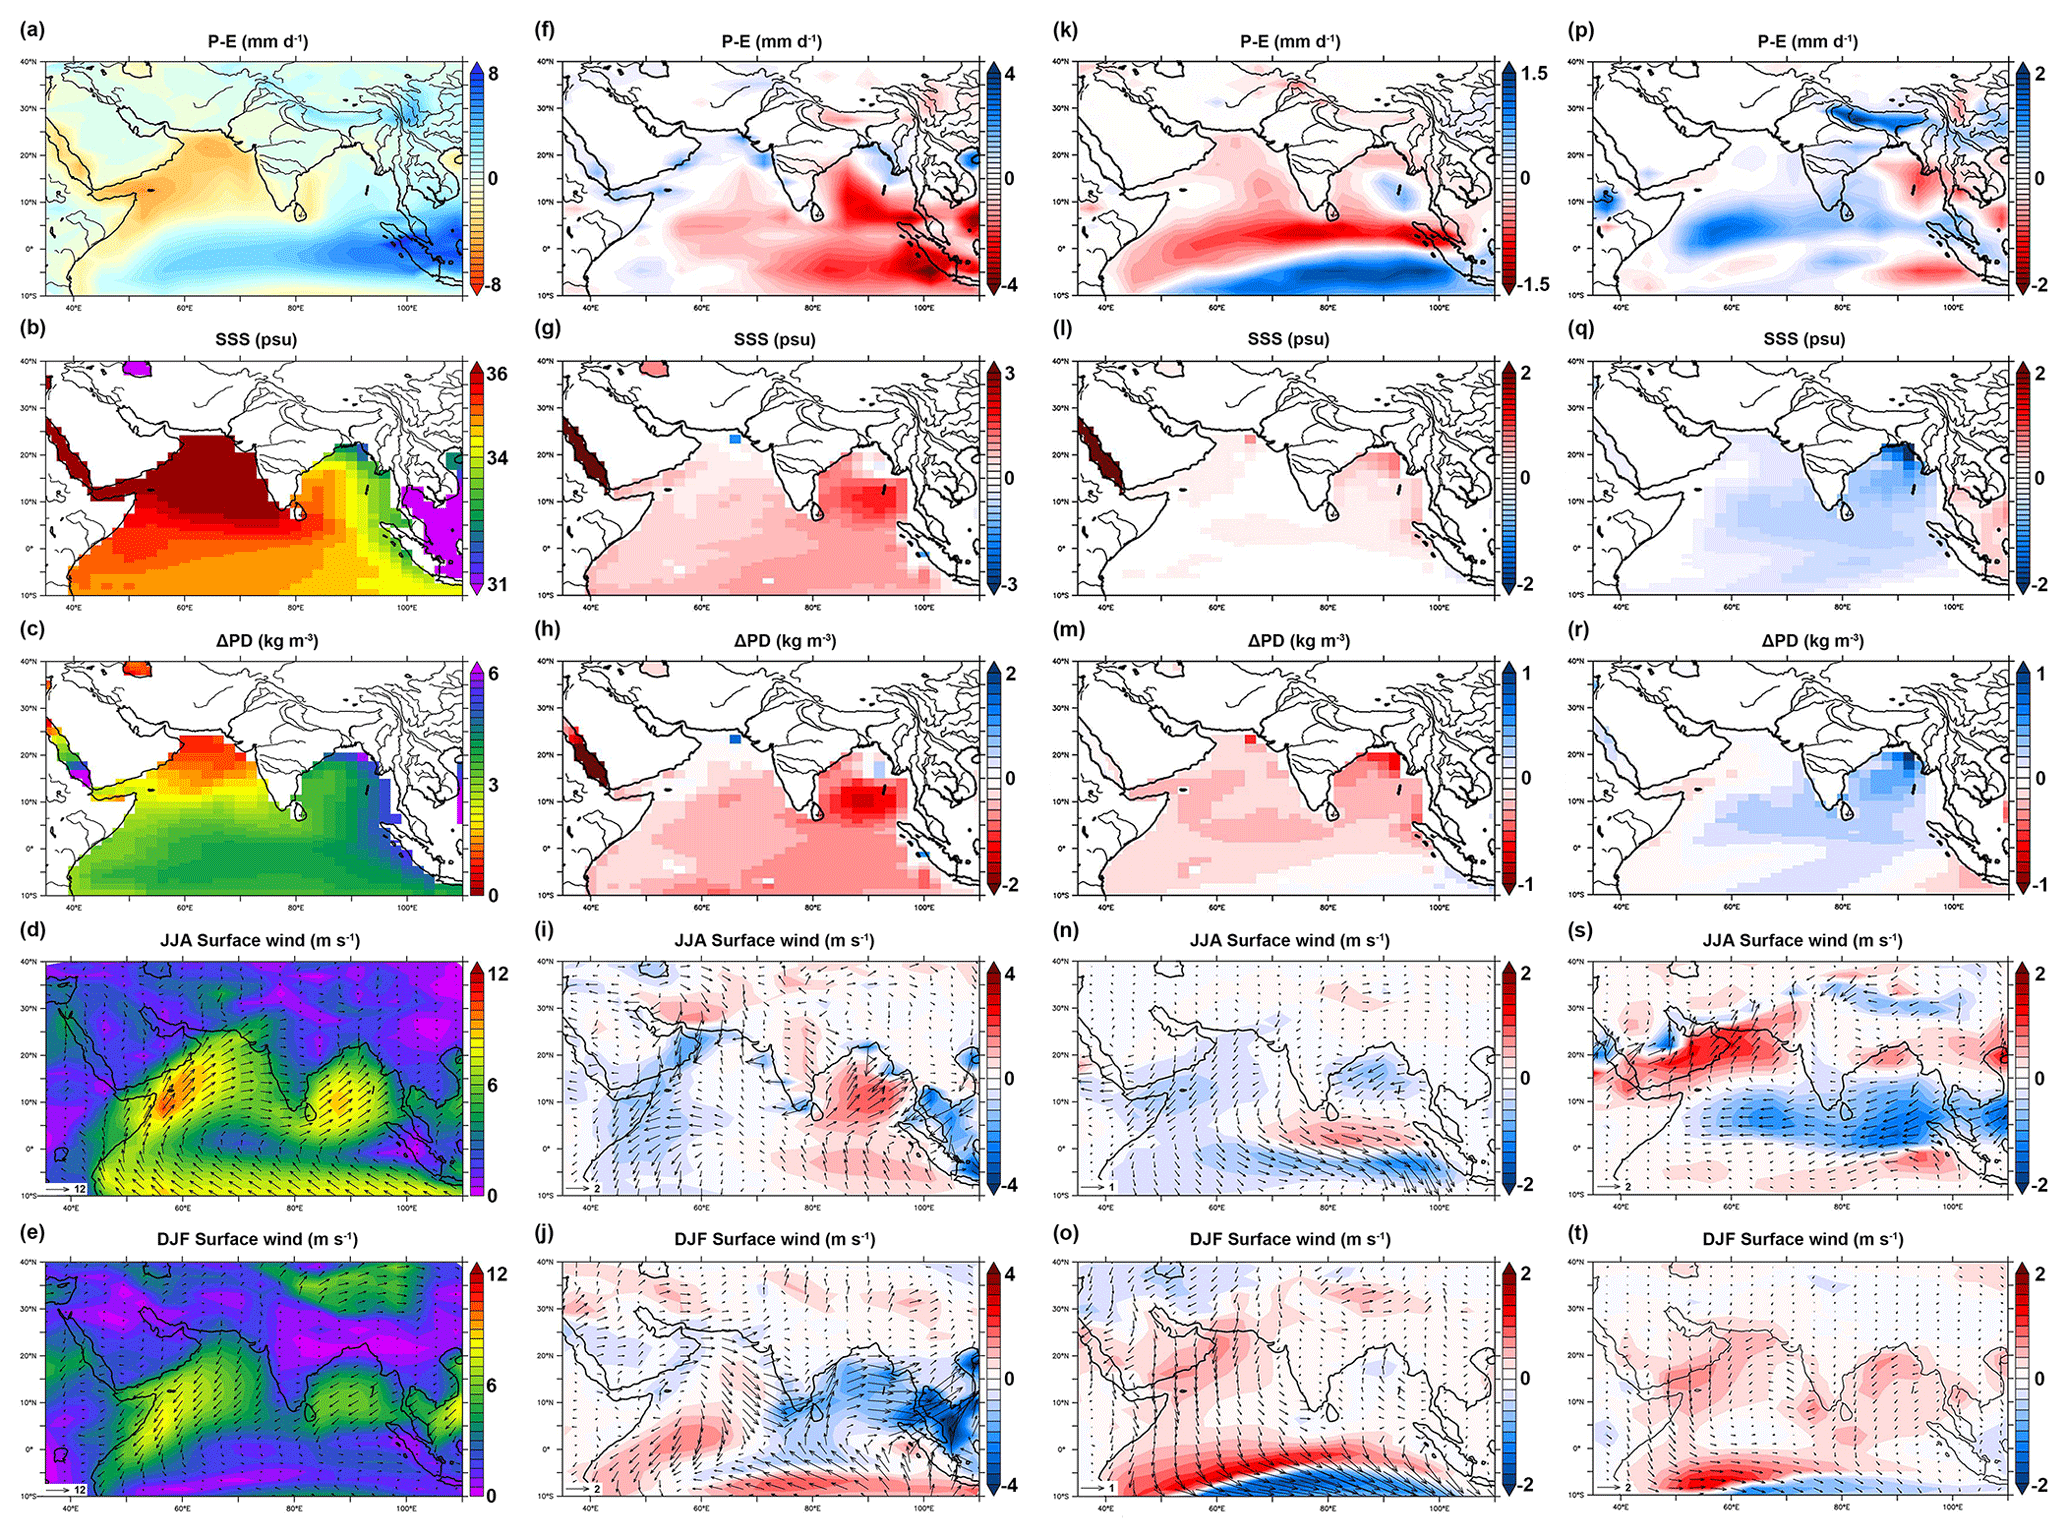
Figure 7IPSL-CM5A-LR outputs. (a–e) Results of CTRL. (f–j) Differences between LGMc and CTRL. (k–o) Differences between LGMf and LGMc. (p–t) Differences between MH and CTRL. The parameters are annual mean precipitation minus evaporation (P−E, net precipitation), sea surface salinity (SSS), potential density gradient between 200 and 5 m (stratification of the upper seawater; Behrenfeld et al., 2006), and summer (June–July–August, JJA) and winter (December–January–February, DJF) surface wind speed and vectors. These figures give the results of simulated changes in climate and oceanic conditions over South Asia and the northern Indian Ocean. Stronger net precipitation is marked by blue, higher SSS is marked by red, stronger stratification is marked by blue, and stronger surface wind is marked by red.
5.2 The last deglaciation
During the last deglaciation (19–11 ka), the most striking changes in reconstructed PP covary positively with SSS, especially after the 19–17 ka transient period when high PP intervals correspond to high SSS ones and vice versa (Fig. 6h, i). Both signals show three stages that correspond to abrupt temperature changes in the North Atlantic Ocean, i.e. the cold Heinrich Stadial 1 (HS1; 17–14.8 ka), the warm Bølling–Allerød (B-A; 14.8–12.9 ka), and the cold Younger Dryas (YD; 12.9–11.8 ka), which are characterized by changes in AMOC strength (Fig. 6b, h, i; Elliot et al., 2002; McManus et al., 2004). The AMOC is a component in inter-hemispheric transport of heat (e.g. Liu et al., 2009; Buckley and Marshall, 2016) and its changes in intensity, which are related to the inter-hemisphere temperature gradient and have a strong influence on tropical Atlantic (Wang et al., 2004; Peterson et al., 2000; Peterson and Huaug, 2006; Swingedouw et al., 2009) and South Asia rainfall (Overpeck et al., 1996; Barber et al., 1999; Fleitmann et al., 2003; Gupta et al., 2003; Murton et al., 2010; Yu et al., 2010; Cai et al., 2012; Marzin et al., 2013). Cold periods in the North Atlantic are associated with a relatively weak AMOC, low monsoon precipitation, and vice versa. The relationship between South Asian rainfall and the AMOC during the last deglaciation has been studied by Marzin et al. (2013) based on several water hosing experiments run with the IPSL-CM4 model. They found a strong positive correlation between the AMOC strength and South Asian summer precipitation rates and pointed out that temperature anomalies over the tropical Atlantic Ocean are key elements in modulating the teleconnection mechanisms between the AMOC and South Asian rainfall. It has been proposed that a southward shift of the ITCZ was triggered by low tropical Atlantic Ocean temperatures and weakened AMOC during HS1 and possibly the YD (Stocker and Johnsen, 2003; Gupta et al., 2003; Goswami et al., 2006; Li et al., 2008; Pausata et al., 2011; McGee et al., 2014; Schneider et al., 2014). Such variations of moisture are simulated here in the IPSL-CM5A housing simulation (LGMf), which shows weaker summer winds and drier climate over the AS and South Asia when the AMOC is weakened compared to the LGMc simulation (Fig. 7k, n). They are also observed in the TraCE simulation over the deglaciation, with millennial-scale variations of net precipitation being mainly forced by changes in AMOC strength and the colder periods (HS1 and YD) being associated with weaker precipitation (Figs. 6d, S4). More importantly, the reconstructed records and TraCE results together show that weaker net precipitation intervals correspond to higher SSS ones, which indicates that South Asian net precipitation controls the salinity budget in the BoB and Andaman Sea (Figs. 6d, h). Since SSS and PP variations at the MD77-176 site are highly correlated with the upper seawater density gradient (stratification) while SST remains relatively stable (Fig. 6f, h, i), it seems reasonable to propose that during the last deglaciation, PP variations are directly driven by precipitation dynamics through changes in upper water column stratification associated with SSS variations (the so-called “barrier layer” effect). An important finding is that millennial-scale variations of MD77-176 PP are anti-phased with those in the western and northern AS (Fig. 6j, k), which are indicators of local summer wind strength. We interpret these anti-phased PP patterns as reflecting the fact that weaker summer winds (i.e. reduced PP) over the AS, by bringing less moisture to South Asia, result in subdued freshwater inputs within the NE BoB that weaken stratification and increase PP. In contrast, stronger summer winds (i.e. higher PP) over the AS reinforce precipitation over South Asia, enhance freshwater inputs within the NE BoB, and ultimately decrease PP through enhanced stratification.
The relationships between the ITCZ, southwesterly winds over the AS, South Asian rainfall, SSS, and stratification over the northern BoB and Andaman Sea are confirmed by IPSL-CM5A. Compared to LGMc, LGMf clearly shows higher SSS and weaker stratification, especially in the northeastern BoB, under weakened AMOC conditions (Fig. 7k–o). The areas with higher PP in the northeastern BoB that correspond to the LGMc river mouth grids match those with the largest increase in SSS (Figs. 3j and 7m), indicating that salinity stratification controls PP, even under an unchanged amount of nutrient inputs from rivers (Sect. 3.3.1). The relationship that exists between the salinity stratification and PP of these grids is shown in Fig. 8. It clearly shows a positive correlation between PP and nitrate contents and between nitrate contents in the upper photic zone (0–50 water depth) and SSS. In such a context, PP is therefore inversely correlated with the stratification, with high PP being associated with high nutrients, high SSS, and a reduced vertical density gradient. Moreover, the annual simulated PP increase is mainly associated with PP increase during winter (Fig. 3l), which mirrors the winter peak of PP observed in modern times (Fig. 1m).
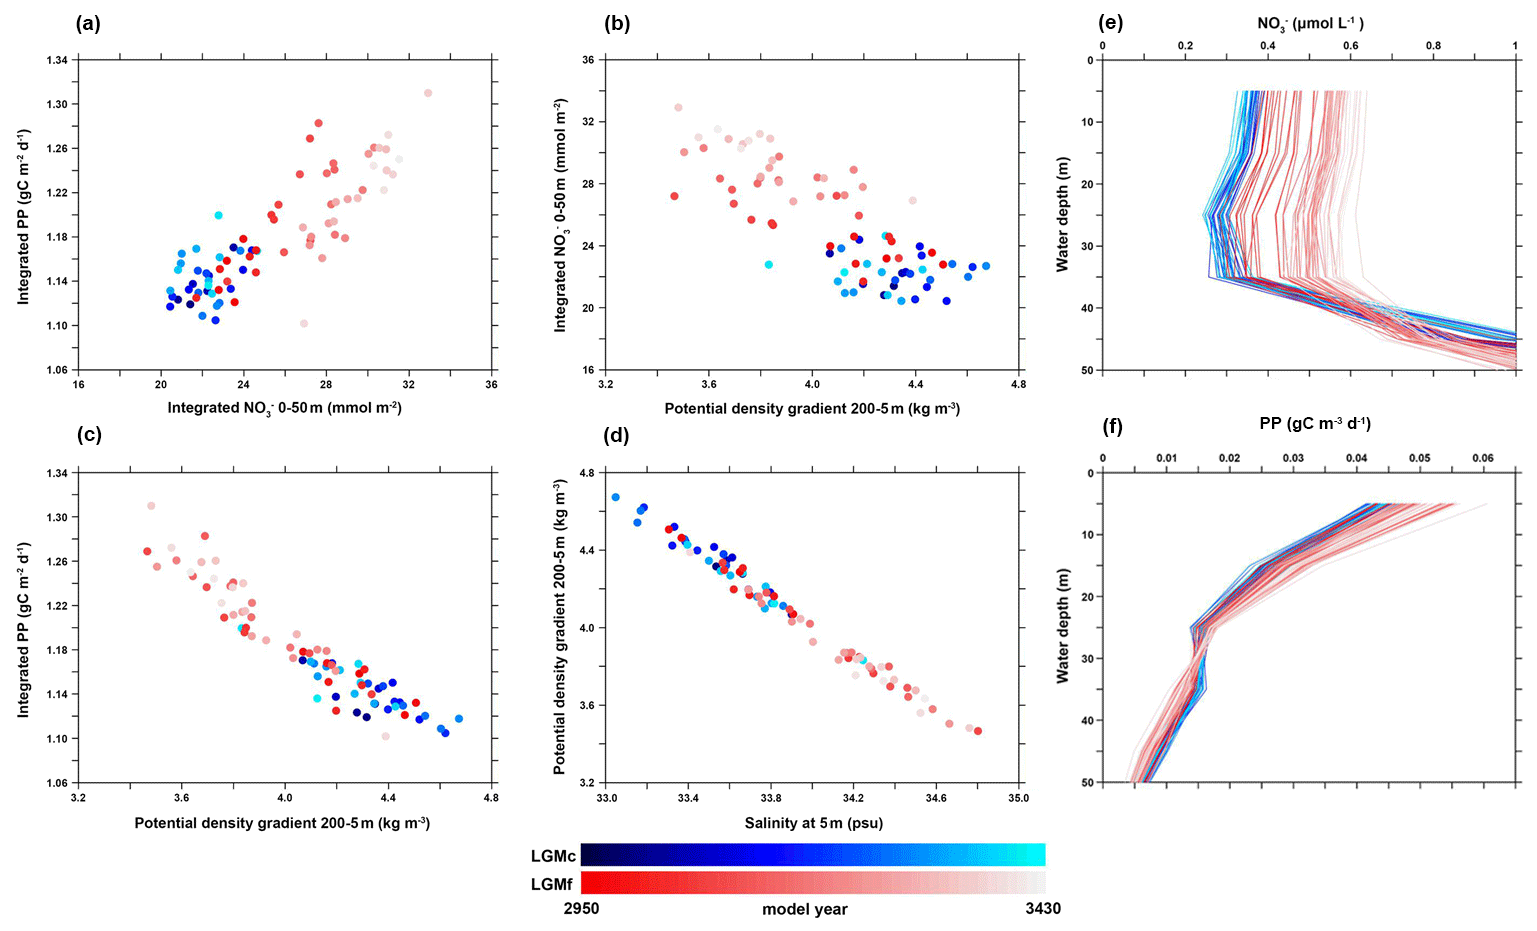
Figure 8IPSL-CM5A-LR outputs. (a–d) Cross plots between different oceanic parameters in LGMc and LGMf. (e, f) Vertical profiles of nitrate content and PP in LGMc and LGMf. All the results are from winter (December–January–February) and every curve represents an average of 10 model years. Data have been extracted from the grids located in the northeastern part of the BoB close to the MD77-176 core site (rectangle 3 in Fig. 3e). They highlight the control that salinity stratification exerts on upper layer nutrient content and integrated PP: higher PP is found when higher SSS drives weaker stratification.
Although LGMf is not set under the complete conditions of HS1 or YD (higher atmospheric pCO2 and sea level compared to the LGM), it helps decipher the control that salinity stratification exerts on PP in the northeastern BoB under weakened AMOC conditions and lower South Asian rainfall. Together with the robust relationships that exist between reconstructed PP, SSS, South Asia rainfall, and AS southwesterly winds, we can conclude that as the sea level rises during the last deglaciation, the location of MD77-176 is less influenced by nutrient inputs from the IS river mouth system than during the last glacial period and that the barrier layer effect dominates. Therefore, PP variability is highly controlled by the changes in salinity stratification that are linked to the changes in AMOC strength and monsoon precipitation.
5.3 The Holocene
During the Holocene (11–1 ka), long-term decreasing trends in reconstructed PP match long-term decreasing trends in SSS, increasing trends in South Asian precipitation, and increasing trends in AS PP, while simulated SST shows a gradual increase of ∼ 1 ∘C across the area (Fig. 6). Therefore, the relationships between these parameters are similar to those we observed over the last deglaciation. The most obvious pattern is found during the early–middle Holocene (8–6 ka) when PP and SSS minima correspond to South Asian precipitation and AS PP maxima. This time interval, also called the Early Holocene Climatic Optimum (EHCO; e.g. Ciais et al., 1992; Contreras-Rosales et al., 2014), is characterized by higher Northern Hemisphere (NH) summer insolation compared to present, as highlighted by a maximum in the 30∘ N August mean insolation (Fig. 6a) and the peak of the insolation difference between 6 ka and the present day over low- and mid-latitude areas (Marzin and Braconnot, 2009). Under enhanced boreal summer insolation, the MH simulation reveals stronger southwesterly summer winds over the AS and enhanced net precipitation over South Asia (Fig. 7p, s), thanks to the northward shift of the ITCZ system (Bassinot et al., 2011; McGee et al., 2014; Schneider et al., 2014). Lower SSS and a higher density gradient (stronger stratification) are concomitantly documented over the entire BoB, but they are particularly obvious in the northern BoB (Fig. 7q, r), which is directly influenced by the freshwater budget and input from the GBM river system (Behara and Vinayachandran, 2016). All these elements suggest that during the Holocene PP changes in the northeastern BoB were most probably driven by salinity stratification associated with the changes in precipitation. This is confirmed by the comparison between the MH and CTRL profiles of the GMB river mouth system, which highlights lower nutrient contents and PP in the upper seawater associated with reduced SSS and an increased density gradient between 0 and 30 m water depths (Sect. 4.2, Fig. 4).
We document, for the first time, a 26 kyr PP record for the northeastern BoB using an empirical equation relating Fp% to PP. Comparisons of this PP signal with previous geochemical data and new model outputs helped us propose two coherent scenarios behind PP distribution during the 26–19 and 19–1 ka intervals. In all cases, PP is related to nutrient content and distribution at the sea surface. From 26 to 19 ka, when drier and lower sea level conditions prevailed, millennial-scale PP changes are most probably related to nutrient discharge from the Irrawaddy–Salween river mouth system, which is paced by South Asian monsoon precipitation changes. Over the last 19 kyr, while sea level rise and more humid conditions prevailed, millennial-scale PP variations over the deglaciation and long-term trends over the Holocene are rather controlled by salinity-related stratification that monitors nutrient distribution within the photic zone and is therefore less influenced by nutrient inputs from the IS river mouth system. We demonstrate more generally that stratification dynamics during that period are driven by Indian monsoon precipitation changes, which generate changes in freshwater supply to the ocean. The analysis of climate model outputs provides additional evidence for the salinity stratification hypothesis and helps demonstrate that paleoceanographic changes are forced by AMOC dynamics during the last deglaciation and insolation during the Holocene.
Coccolith data from core MD77-176 can be found in the Supplement.
The supplement related to this article is available online at: https://doi.org/10.5194/cp-16-1969-2020-supplement.
XZ, SDA, MK, and CC developed the idea. CC and FB provided sediment samples. XZ did coccolith analysis and visualization of the climate modelling results. The datasets of climate model IPSL-CM5A-LR were provided by MK. FB and LB joined the discussion and gave additional ideas for the paper. All authors contributed to the paper writing.
The authors declare that they have no conflict of interest.
The authors are grateful to the two anonymous reviewers for their helpful comments and suggestions. Xinquan Zhou thanks the China Scholarship Council (CSC) for providing a scholarship and the Laboratoire des Sciences du Climat et de l'Environnement (LSCE) for admitting his study related to the climate model. He also thanks Hongrui Zhang for personal communication. The simulations presented in this work have been run on the TGCC (Très Grand Centre de Calcul du CEA) supercomputing equipment under the gen2212 project, provided by GENCI (Grand Equipement National de Calcul Intensif). The authors wish to thank all of the people who developed to IPSLCM5A model, which was used for this study, and who ran the model for the CMIP5 and PMIP3.
This paper was edited by Qiuzhen Yin and reviewed by two anonymous referees.
Akhil, V. P., Durand, F., Lengaigne, M., Vialard, J., Keerthi, M. G., Gopalakrishna, V. V., Deltel, C., Papa, F., and de Boyer Montegut, C.: A modeling study of the processes of surface salinity seasonal cycle in the Bay of Bengal, J. Geophys. Res.-Oceans, 119, 3926–3947, 2014.
Anderson, D. M. and Prell, W. L.: The structure of the southwest monsoon winds over the Arabian Sea during the late Quaternary: observation, simulations, and marine geologic evidence, J. Geophys. Res., 97, 15481–15487, 1992.
Ashok, K., Guan, Z., Saji, N. H., and Yamagata, T.: Individual and combined inflences of ENSO and the Indian Ocean Dipole on the Indian Summer Monsoon, J. Climate, 17, 3141–3155, 2004.
Aumont, O. and Bopp, L.: Globalizing results from ocean in situ iron fertilization studies, Global Biogeochem. Cy., 20, GB2017, https://doi.org/10.1029/2005GB002591, 2006.
Barber, D. C., Dyke, A., Hillaire-Marcel, C., Jennings, A. E., Andrews, J. T., Kerwin, M. W., Bilodeau, G., McNeely, R., Southon, J., Morehead, M. D., and Gagnon, J.-M.: Forcing of the cold event of 8200 years ago by catastrophic drainage of Laurentide lakes, Nature, 400, 344–348, 1999.
Bassinot, F. C., Marzin, C., Braconnot, P., Marti, O., Mathien-Blard, E., Lombard, F., and Bopp, L.: Holocene evolution of summer winds and marine productivity in the tropical Indian Ocean in response to insolation forcing: data-model comparison, Clim. Past, 7, 815–829, https://doi.org/10.5194/cp-7-815-2011, 2011.
Beaufort, L., Lancelot, Y., Camberlin, P., Cayre, O., Vincent, E., Bassinot, F., and Labeyrie, L.: Insolation cycles as a major control of Equatorial Indian Ocean primary production, Science, 278, 1451–1454, 1997.
Beaufort, L., Barbarin, N., and Gally, Y.: Optical measurements to determine the thickness of calcite crystals and the mass of thin carbon particles such as coccoliths, Nat. Protoc., 9, 633–642, 2014.
Behara, A. and Vinayachandran, P. N.: An OGCM study of the impact of rain and river water forcing on the Bay of Bengal, J. Geophys. Res.-Oceans, 121, 2425–2446, 2016.
Behrenfeld, M. J. and Falkowski, P. G.: Photosynthetic rates derived from satellite-based chlorophyll concentration, Limnol. Oceanogr., 42, 1–20, 1997.
Behrenfeld, M. J., O'Malley, R. T., Siegel, D. A., McClain, C. R., Sarmiento, J. L., Feldman, G. C., Milligan, A. J., Falkowski, P. G., Letelier, R. M., and Boss, E. S.: Climate-driven trends in contemporary ocean productivity, Nature, 444, 752–755, 2006.
Belyaeva, N. V. and Burmistrova, I. I.: Critical carbonate levels in the Indian Ocean, J. Foramin. Res., 15, 337–341, 1985.
Braconnot, P., Otto-Bliesner, B., Harrison, S., Joussaume, S., Peterchmitt, J.-Y., Abe-Ouchi, A., Crucifix, M., Driesschaert, E., Fichefet, Th., Hewitt, C. D., Kageyama, M., Kitoh, A., Laîné, A., Loutre, M.-F., Marti, O., Merkel, U., Ramstein, G., Valdes, P., Weber, S. L., Yu, Y., and Zhao, Y.: Results of PMIP2 coupled simulations of the Mid-Holocene and Last Glacial Maximum – Part 1: experiments and large-scale features, Clim. Past, 3, 261–277, https://doi.org/10.5194/cp-3-261-2007, 2007a.
Braconnot, P., Otto-Bliesner, B., Harrison, S., Joussaume, S., Peterchmitt, J.-Y., Abe-Ouchi, A., Crucifix, M., Driesschaert, E., Fichefet, Th., Hewitt, C. D., Kageyama, M., Kitoh, A., Loutre, M.-F., Marti, O., Merkel, U., Ramstein, G., Valdes, P., Weber, L., Yu, Y., and Zhao, Y.: Results of PMIP2 coupled simulations of the Mid-Holocene and Last Glacial Maximum – Part 2: feedbacks with emphasis on the location of the ITCZ and mid- and high latitudes heat budget, Clim. Past, 3, 279–296, https://doi.org/10.5194/cp-3-279-2007, 2007b.
Braconnot, P., Harrison, S. P., Kageyama, M., Bartlein, P. J., Masson-Delmotte, V., Abe-Ouchi, A., Otto-Bliesner, B., and Zhao, Y.: Evaluation of climate models using palaeoclimatic data, Nat. Clim. Change, 2, 417–424, 2012.
Briegleb, B. P., Bitz, C. M., Hunke, E. C., Lipscomb, W. H., Holland, M., Schramm, J. L., and Moritz, R. E.: Scientific description of the sea ice component in the Community Climate System Model, Version 3, University Corporation for Atmospheric Research, Boulder, Colorado, USA, 2004.
Buckley, M. W. and Marshall, J.: Observations, inferences, and mechanisms of the Atlantic Meridional Overturning Circulation: A review, Rev. Geophys., 54, 5–63, 2016.
Cai, Y., Zhang, H., Cheng, H., An, Z., Edwards, R. L., Wang, X., Tan, L., Liang, F., Wang, J., and Kelly, M.: The Holocene Indian Monsoon variablility over the southern Tibetan Plateau and its teleconnections, Earth Planet. Sc. Lett., 335–336, 135–144, 2012.
Chen, T.-C.: Maintenance of summer monsoon circulations: a planetary-scale perspective, J. Climate, 16, 2022–2037, 2003.
Chiba, S., Ono, T., Tadokoro, K., Midorikawa, T., and Saino, T.: Increased stratification and decreased lower trophic level productivity in the Oyashio Region of the North Pacific: A 30-year retrospective study, J. Oceanogr., 60, 149–162, 2004.
Ciais, P., Petit., J. R., Jouzel, J., Lorius, C., Barkov, N. I., Lipenkov. V., and Nicolaiev, V.: Evidence for an early Holocene climatic optimum in the Antarctic deep ice-core record, Clim. Dynam., 6, 169–177, 1992.
Clark, P. U., Shakun, J. D., Baker, P. A., Bartlein, P. J., Brewer, S., Brook, E., Carlson, A. E., Cheng, H., Kaufman, D. S., Liu, Z., Marchitto, T. M., Mix, A. C., Morrill, C., Otto-Bliesner, B. L., Pahnke, K., Russell, J. M., Whitlock, C., Adkins, J. F., Blois, J. L., Clark, J., Colman, S. M., Curry, W. B., Flower, B. P., He, F., Johnson, T. C., Lynch-Stieglitz, J., Markgraf, V., McManus, J., Mitrovica, J. X., Moreno, P. I., and Williams, J. W.: Global climate evolution during the last deglaciation, P. Natl. Acad. Sci. USA, 109, E1134–E1142, 2012.
Clement, A. C. and Peterson, L. C.: Mechanisms of abrupt climate change of the last glacial period, Rev. Geophys., 46, RG4002, https://doi.org/10.1029/2006RG000204, 2008.
Collins, W. D., Bitz, C. M., Blackmon, M. L., Bonan, G. B., Bretheton, C. S., Carton, J. A., Chang, P., Doney, S. C., Hack, J. J., Henderson, T. B., Kiehl, J. T., Large, W. G., McKenna, D. S., Santer, B. D., and Smith, R. D.: The Community Climate System Model Version 3 (CCSM3), J. Climate, 19, 2122–2143, 2006a.
Collins, W. D., Rasch, P. J., Boville, B. A., Hack, J. J., McCaa, J. R., Williamson, D. L., Briegleb, B. P., Bitz, C. M., Lin, S.-J., and Zhang, M.: The formulation and atmospheric simulation of the Community Atmosphere Model Version 3 (CAM3), J. Climate, 19, 2144–2161, 2006b.
Contreras-Rosales, L. A., Jennerjahn, T., Tharammal, T., Meyer, V., Lückge, A., Paul, A., and Schefuß, E.: Evolution of the Indian Summer Monsoon and terrestrial vegetation in the Bay of Bengal region during the past 18 ka, Quaternary Sci. Rev., 102, 133–148, 2014.
Cullen, J. L. and Prell, W. L.: Planktonic foraminifera of the northern Indian Ocean: Distribution and preservation in surface sediments, Mar. Micropaleontol., 9, 1–52, 1984.
Currie, J. C., Lengaigne, M., Vialard, J., Kaplan, D. M., Aumont, O., Naqvi, S. W. A., and Maury, O.: Indian Ocean Dipole and El Niño/Southern Oscillation impacts on regional chlorophyll anomalies in the Indian Ocean, Biogeosciences, 10, 6677–6698, https://doi.org/10.5194/bg-10-6677-2013, 2013.
Da Silva, R., Mazumdar, A., Mapder, T., Peketi, A., Joshi, R. K., Shaji, A., Mahalashmi, P., Sawant, B., Naik, B. G., Carvalho, M. A., and Molletti, S. K.: Salinity stratification controlled productivity variation over 300 ky in the Bay of Bengal, Sci. Rep., 7, 14439, https://doi.org/10.1038/s41598-017-14781-3, 2017.
Dey, S. and Singh, R. P.: Comparison of chlorophyll distributions in the northeastern Arabian Sea and southern Bay of Bengal using IRS-P4 Ocean Color Monitor data, Remote Sens. Environ., 85, 424–428, 2003.
Dickinson, R. E., Oleson, K. W., Bonan, G., Hoffman, F., Thirnton, P., Vertenstein, M., Yang, Z.-L., and Zeng, X.: The Community Land Model and its climate statistics as a component of the Community Climate System Model, J. Climate, 19, 2302–2324, 2006.
Duchamp-Alphonse, S., Siani, G, Michel, E., Beaufort, L, Gally, Y., and Jaccard, S. L.: Enhanced ocean-atmosphere carbon partitioning via the carbonate counter pump during the last deglacial, Nat. Commun., 9, 2396, https://doi.org/10.1038/s41467-018-04625-7, 2018.
Dufresne, J.-L., Foujols, M.-A., Denvil, S., Caubel, A., Marti, O., Aumont, O., Balkanski, Y., Bekki, S., Bellenger, H., Benshila, R., Bony, S., Bopp, L., Braconnot, P., Brockmann, P., Cadule, P., Cheruy, F., Codron, F., Cozic, A., Cugnet, D., de Noblet, N., Duvel, J.-P., Ethé, C., Fairhead, L., Fichefet, T., Flavoni, S., Friedlingstein, P., Grandpeix, J.-Y., Guez, L., Guilyardi, E., Hauglustaine, D. A., Hourdin, F., Idelkadi, A., Ghattas, J., Jous- saume, S., Kageyama, M., Krinner, G., Labetoulle, S., Lahellec, A., Lefebvre, M.-P., Lefevre, F., Levy, C., Li, Z. X., Lloyd, J., Lott, F., Madec, G., Mancip, M., Marchand, M., Masson, S., Meurdesoif, Y., Mignot, J., Musat, I., Parouty, S., Polcher, J., Rio, C., Schulz, M., Swingedouw, D., Szopa, S., Talandier, C., Terray, P., Viovy, N., and Vuichard, N.: Climate change projections using the IPSL-CM5 Earth System Model: from CMIP3 to CMIP5, Clim. Dynam., 40, 2123–2165, 2013.
Dutt, S., Gupta, A. K., Clemens, S. C., Cheng, H., Singh, R. K., Kathayat, G., and Edwards, R. L.: Abrupt changes in Indian summer monsoon strength during 33 800 to 5500 years B.P., Geophys. Res. Lett., 42, 5526–5532, 2015.
Elliot, M., Labeyrie, L., and Duplessy, J.-C.: Changes in North Atlantic deep-water formation associated with the Dansgaard-Oeschger temperature oscillations (60–10 ka), Quaternary Sci. Rev., 21, 1153–1165, 2002.
Fichefet, T. and Maqueda, M. A. M.: Sensitivity of a global sea ice model to the treatment of ice thermodynamics and dynamics, J. Geophys. Res.-Oceans, 102, 12609–12646, 1997.
Fleitmann, D., Burns, S. J., Mudelsee, M., Neff, U., Kramers, J., Mangini, A., and Matter, A.: Holocene forcing of the Indian Monsoon recored in a stalagmite from southern Oman, Science, 300, 1737–1739, 2003.
Fournier, S., Vialard, F., Lengaigne, M., Lee, T., Gierach, M. M., and Chaitanya, A. V. S.: Modulation of the Ganges-Brahmaputra River Plume by the Indian Ocean Dipole and Eddies inferred from satellite observations, J. Geophys. Res.-Oceans, 122, 9591–9604, 2017.
Gadgil, S.: The Indian Monsoon and its variability, Annu. Rev. Earth Pl. Sc., 31, 429–467, 2003.
Gardner, W. D., Gundersen, J. S., Richardson, M. J., and Walsh, I. D.: The role of seasonal and diel changes in mixed-layer depth on carbon and chlorophyll distributions in the Arabian Sea, Deep-Sea Res. Pt. II, 46, 1833–1858, 1999.
Gauns, M., Madhupratap, M., Ramaiah, N., Jyothibabu, R., Fernandes, V., Paul, J. T., and Prasanna Kumar, S.: Comparative accounts of biological productivity characteristics and estimates of carbon fluxes in the Arabian Sea and the Bay of Bengal, Deep-Sea Res. Pt. II, 52, 2003–2017, 2005.
Gebregiorgis, D., Hathorne, E. C., Sijinkumar, A. V., Nagender Nath, B., Nürnberg, D., and Frank, M.: South Asian summer monsoon variability during the last ∼ 54 kyrs inferred from surface salinity and river runoff proxies, Quaternary Sci. Rev., 138, 6–15, 2016.
Goswami, B. N., Madhusoodanan, M. S., Neema, C. P., and Sengupta, D.: A physical mechanism for North Atlantic SST influence on the Indian summer monsoon, Geophys. Res. Lett., 33, L02706, https://doi.org/10.1029/2005GL024803, 2006.
Gupta, A. K., Andrews, D. M., and Overpeck, J. T.: Abrupt changes in the Asian southwest monsoon during the Holocene and their links to the North Atlantic Ocean, Nature, 421, 354–357, 2003.
He, F.: Simulating transient climate evolution of the last deglaciation with CCSM3, PhD dissertation, University of Wisconsin-Madison, Madison, Wisconsin, USA, 2008.
Heinrich, H.: Origin and consequences of cyclic ice rafting in the northeast Atlantic Ocean during the past 130 000 years, Quaternary Res., 29, 142–152, 1988.
Hernández-Almeida, I., Ausín, B., Saavedra-Pellitero, M., Baumann, K.-H., and Stoll, H. M.: Quantitative reconstruction of primary productivity in low latitudes during the last glacial maximum and the mid-to-late Holocene from a global Florisphaera profunda calibration dataset, Quaternary Sci. Rev., 205, 166–181, 2019.
Hourdin, F., Foujols, M.-A., Codron, F., Guemas, V., Dufresne, J.-L., Bony, S., Denvil, S., Guez, L., Lott, F., Ghattas, J., Braconnot, P., Marti, O., Meurdesoif, Y., and Bopp, L.: Impact of the LMDZ atmospheric grid configuration on the climate and sensitivity of the IPSL-CM5A coupled model, Clim. Dynam., 40, 2167–2192, https://doi.org/10.1007/s00382-012-1411-3, 2013.
Ivanochko, T. S., Ganeshram, R. S., Brummer, G. A., Ganssen, G., Jung, S. J. A., Moreton, S. G., and Kroon, D.: Variations in tropical convection as an amplifier of global climate change at the millennial scale, Earth Planet. Sc. Lett., 235, 302–314, 2005.
Ivanova, E., Schiebel, R., Singh, A. D., Schmiedl, G., Niebler, H.-S., and Hemleben, C.: Primary production in the Arabian Sea during the last 135 000 years, Palaeogeogr. Paleocl., 197, 61–82, 2003.
Jourdain, N. C., Gupta, A. S., Taschetto, A. S., Ummenhofer, C. C., Moise, A. F., and Ashok, K.: The Indo-Australian monsoon and its relationship to ENSO and IOD in reanalysis data and the CMIP3/CMIP5 simulations, Clim. Dynam., 41, 3073–3102, 2013.
Kageyama, M., Merkel, U., Otto-Bliesner, B., Prange, M., Abe-Ouchi, A., Lohmann, G., Ohgaito, R., Roche, D. M., Singarayer, J., Swingedouw, D., and X Zhang: Climatic impacts of fresh water hosing under Last Glacial Maximum conditions: a multi-model study, Clim. Past, 9, 935–953, https://doi.org/10.5194/cp-9-935-2013, 2013.
Krinner, G., Viovy, N., de Noblet-Ducoudré, N., Ogée, J., Polcher, J., Friedlingstein, P., Ciais, P., Sitch, S., and Prentice, I. C.: A dynamic global vegetation model for studies of the cou- pled atmosphere-biosphere system, Global Biogeochem. Cy., 19, GB1015, https://doi.org/10.1029/2003GB002199, 2005.
Laskar, J., Robutel, P., Joutel, F., Gastineau, M., Correia, A. C. M., and Levrard, B.: A long-term numerical solution for the insolation quantities of the Earth, Astronomy and Astrophysics, 428, 261–285, 2004.
Lau, K.-M., Kim, K.-M., and Yang, S.: Dynamicsal and boundary forcing characteristics of regional components of the Asian Summer Monsoon, J. Climate, 13, 2461–2482, 2000.
Le Mézo, P., Beaufort, L., Bopp, L., Braconnot, P., and Kageyama, M.: From monsoon to marine productivity in the Arabian Sea: insights from glacial and interglacial climates, Clim. Past, 13, 759–778, https://doi.org/10.5194/cp-13-759-2017, 2017.
Lévy, M., Klein, P., and Treguier, A.-M.: Impact of sub-mesoscale physics on production and subduction of phytoplankton in an oligotrophic regime, J. Mar. Res., 59, 535–565, 2001.
Li, S., Perlwitz, J., Quan, X., and Hoerling, M. P.: Modelling the influence of North Atlantic multidecadal warmth on the Indian summer rainfall, Geophys. Res. Lett., 35, L05804, https://doi.org/10.1029/2007GL032901, 2008.
Li, J., Liu, S., Shi, X., Zhang, H., Fang, X., Cao, P., Yang, G., Xue, X., Khokiattiwong, S., and Kornkanitnan, N.: Sedimentary responses to the sea level and Indian summer monsoon changes in the central Bay of Bengal since 40 ka, Mar. Geol., 415, 105947, https://doi.org/10.1016/j.margeo.2019.05.006, 2019.
Liu, Z., Otto-Bliesner, B. L., He, F., Brady, W. C., Tomas, R., Clark, P. U., Carlson, A. E., Lynch-Stieglitz, J., Curry, W., Brook, E., Erickson, D., Jacob, R., Kutzbach, J., and Cheng, J.: Transient Simulation of Last Deglaciaiton with a new mechanism for Bølling-Allerød Warming, Science, 325, 310–314, 2009.
Locarnini, R. A., Mishonov, A. V., Antonov, J. I., Boyer, T. P., Garcia, H. E., Baranova, O. K., Zweng, M. M., ans Johnson, D. R.: World ocean atlas 2009, in: Temperature, edited by: Levitus, S., NOAA Atlas NESDIS 68, 1. Government Printing Office, Washington, D.C., USA, p. 184, 2010.
Ludwig, W., Probst, J.-L., and Kempe, S.: Predicting the oceanic input of organic carbon by continental erosion, Global Biogeochem. Cy., 10, 23–41, 1996.
Madec, G.: NEMO ocean engine, Note du pôle de modélisation, Institut Pierre-Simon Laplace (IPSL), Paris, France, No. 27, ISSN 1288-1619, 2008.
Madhupratap, M., Prasanna Kumar, S., Bhattathiri, P. M. A., Dileep Kumar, M., Raghukumar, S., Nair, K. K. C., and Ramaiah, N.: Mechanism of the biological response to winter cooling in the northeastern Arabian Sea, Nature, 384, 549–552, 1996.
Madhupratap, M., Gauns, M., Ramaiah, N., Prasanna Kumar, S., Muraleedharan, P. M., Sousa, S. N., and Muraleedharan, U.: Biogeochemistry of the Bay of Bengal: physical, chemical and primary productivity characteristics of the central and western Bay of Bengal during summer monsoon 2001, Deep-Sea Res. Pt. II, 50, 881–896, 2003.
Marzin, C. and Braconnot, P.: Variations of Indian and African monsoons induced by insolation changes a 6 and 9.5 kyr BP, Clim. Dynam., 33, 215–231, 2009.
Marzin, C., Kallel, N., Kageyama, M., Duplessy, J.-C., and Braconnot, P.: Glacial fluctuations of the Indian monsoon and their relationship with North Atlantic climate: new data and modelling experiments, Clim. Past, 9, 2135–2151, https://doi.org/10.5194/cp-9-2135-2013, 2013.
McCreary, J. P., Murtugudde, R., Vialard, J., Vinayachandran, P. N., Wiggert, J. D., Hood, R. R., Shankar, D., and Shetye, S.: Biophysical processes in the Indian Ocean, Geoph. Monog. Series, 185, 9–32, https://doi.org/10.1029/2008GM000768, 2009.
McGee, D., Donohoe, A., Marshall, J., and Ferreira, D.: Changes in ITCZ location and cross-equatorial heat transport at the Last Glacial Maximum, Heinrich Stadial 1, and the mid-Holocene, Earth Planet. Sc. Lett., 390, 69–79, 2014.
McManus, J. F., Francois, R., Gherardi, J.-M., Keigwin, L. D., and Brown-Leger, S.: Collapse and rapid resumption of Atlantic meridional circulation linked to deglacial climate changes, Nature, 428, 834–837, 2004.
Meehl, G. A.: Couple land-ocean-atmosphere processes and South Asian Monsoon variability, Science, 266, 263–267, 1994.
Meehl, G. A.: The South Asian Monsoon and the Tropospheric Biennial Oscillation, J. Climate, 10, 1921–1943, 1997.
Molfino, B. and McIntyre, A.: Precessional forcing of nutricline dynamics in the Equatorial Atlantic, Science, 249, 766–769, 1990a.
Molfino, B. and McIntyre, A.: Nutricline variation in the Equatorial Atlantic coincident with the Younger Dryas, Paleoceanography, 5, 997–1008, 1990b.
Murton, J. B., Bateman, M. D., Dallimore, S. R., Teller, J. T., and Yang, Z.: Identification of Younger Dryas outburst flood path from Lake Agassiz to the Arctic Ocean, Nature, 464, 740–743, 2010.
Okada, H. and Honjo, S.: The distribution of oceanic coccolithophorids in the Pacific, Deep-Sea Res., 20, 355–364, 1973.
Overpeck, J., Anderson, D., Trumbore, S., and Prell, W.: The southwest Indian Monsoon over the last 18 000 year, Clim. Dynam., 12, 213–225, 1996.
Patterson, R. T. and Fishbein, E.: Re-examination of the statistical methods used to determine the number of point counts needed for micropaleontological quantitative research, J. Paleontol., 63, 245–248, 1984.
Pausata, F. S. R., Battusti, D. S., Nisancioglu, K. H., and Bitz, C. M.: Chinese stalagmite δ18O controlled by changes in the Indian monsoon during a simulated Heinrich event, Nat. Geosci., 4, 474–480, 2011.
Peltier, W. R.: Global glacial isostasy and the surface of the ice-age earth: The ICE-5G (VM2) model and GRACE, Annu. Rev. Earth Pl. Sc., 32, 111–149, 2004.
Peterson, L. C. and Huang, G. H.: Variability in mean latitude of the Atlantic Intertropical Convergence Zone as recorded by riverine input of sediments to the Cariaco Basin (Venezuela), Palaeogeogr. Palaeocl., 234, 97–113, 2006.
Peterson, L. C., Haug, G. H., Hughen, K. A., and Röhl, U.: Rapid changes in the hydrologic cycle of the tropical Atlantic during the last Glacial, Science, 290, 1947–1951, 2000.
Phillips, S. C., Johnson, J. E., Giosan, L., and Rose, K.: Monsson-influenced variation in productivity and lithogenic sediment flux since 110 ka in the offshore Mahanadi Basin, northern Bay of Bengal, Mar. Petrol. Geol., 58, 502–525, 2014.
Prasad, T. G.: A comparison of mixed-layer dynamics between the Arabian Sea and Bay of Bengal: One-dimensional model results, J. Geophys. Res., 109, C03035,https://doi.org/10.1029/2003JC002000, 2004.
Prasanna Kumar, S., Madhupratap, M., Dileep Kumar, M., Muraleedharan, P. M., de Souza, S. N., Gauns, M., and Sarma, V. V. S. S.: High biological productivity in the central Arabian Sea during the summer monsoon driven by Ekman pumping and lateral advection, Curr. Sci. India, 81, 1633–1638, 2001.
Prasanna Kumar, S., Muraleedharan, P. M., Prasad, T. G., Gauns, M., Ramaiah, N., de Souza, S. N., Sardesai, S., and Madhupratap, M.: Why is the Bay of Bengal less productive during summer monsoon compared to the Arabian Sea? Geophys. Res. Lett., 29, 2235, https://doi.org/10.1029/2002GL016013, 2002.
Prasanna Kumar, S., Narvekar, J., Nuncio, M. Ganus, M., and Sardesai, S.: What drives the biological productivity of the Northern Indian Ocean?, Geoph. Monog. Series, 185, 33–56, https://doi.org/10.1029/2008GM000757, 2009.
Randel, W. J. and Park, M.: Deep convective influence on the Asian summer monsoon anticyclone and associated tracer variability observed with Atmospheric Infrared Sounder (AIRS), J. Geophys. Res.-Atmos., 111, D12314, https://doi.org/10.1029/2005JD006490, 2006.
Rao, S. A., Saha, S. K., Pokhrel, S., Sundar, D., Dhakate, A. R., Mahapatra, S., Ali, S., Chaudhari, H. S., Shreeram, P., Vasimalla, S., Srikanth, A. S., and Suresh, R. R. V.: Modulation of SST, SSS over northern Bay of Bengal on ISO time scale, J. Geophys. Res., 116, C09026, https://doi.org/10.1029/2010JC006804, 2011.
Rao, R. R. and Sivakumar, R.: Seasonal variability of sea surface salinity and salt budget of the mixed layer of the north Indian Ocean, J. Geophys. Res., 108, C13009, https://doi.org/10.1029/2001JC000907, 2003.
Rashid, H., Flowe, B. P. Poore, R. Z., and Quinn, T. M.: A ∼ 25 ka Indian Ocean monsoon variability record from the Andaman Sea, Quaternary Sci. Rev., 26, 2586–2597, 2007.
Schott, F.: Monsoon response of the Somali Current and associated upwelling, Prog. Oceanogr., 12, 357–381, 1983.
Schott, F. A. and McCreary, J. P.: The monsoon circulation of the Indian Ocean, Prog. Oceanogr., 51, 1–123, 2001.
Schneider, T., Bischoff, T., and Huang, G. H.: Migrations and dynamics of the intertropical convergence zone, Nature, 513, 45–53, 2014.
Schulz, H., von Rad, U., and Erlenkeuser, H.: Correlation between Arabian Sea and Greenland climate oscillations of the past 110 000 years, Nature, 393, 54–57, 1998.
Sengupta, D., Bharath Raj, G. N., and Shenoi, S. S. C.: Surface freshwater from Bay of Bengal runoff and Indonesian Throughflow in the tropical Indian Ocean, Geophys. Res. Lett., 33, L22609, https://doi.org/10.1029/2006GL027573, 2006.
Shankar, D., Vinayachandran, P. N., and Unnikrishnan, A. S.: The monsoon currents in the north Indian Ocean, Prog. Oceanogr., 52, 63–120, 2002.
Shenoi, S. S. C., Shankar, D., and Shetye, S. R.: Differences in heat budgets of the near-surface Arabian Sea and Bay of Bengal: Implications for the summer monsoon, J. Geophys. Res., 107, C63052, https://doi.org/10.1029/2000JC000679, 2002.
Shi, W., Morrison, J. M., and Bryden, H. L.: Water, heat and freshwater flux out of northern Indian Ocean in September–October 1995, Deep-Sea Res. Pt. II, 49, 1231–1252, 2002.
Sijinkumar, A. V., Clemens, S., Nath, B. N., Prell, W., Benshila, R., and Lengaigne, M.: δ18O and salinity variability from the Last Glacial Maximum to Recent in the Bay of Bengal and Andaman Sea, Quaternary Sci. Rev., 135, 79–91, 2016.
Singh, A. D., Jung, S. J. A., Darling, K., Ganeshram, R., Ivanochko, T., and Kroon, D.: Productivity collapses in the Arabian Sea during glacial cold phases, Paleoceanography, 26, PA3210, https://doi.org/10.1029/2009PA001923, 2011.
Smith, R. D. and Gent, P. R.: Reference manual for the Parallel Ocean Program (POP), ocean component of the Community Climate System Model (CCSM2.0 and 3.0), Los Alamos National Laboratory, Los Alamos, New Mexico, USA, LAUR-02-2484, 2002.
Spiro Jaeger, G. and Mahadevan, A.: Submesoscale-selective compensation of fronts in a salinity-stratified ocean, Sci. Adv., 4, e1701504, https://doi.org/10.1126/sciadv.1701504, 2018.
Stocker, T. F. and Johnsen, S. J.: A minimum thermodynamics model for the bipolar seesaw, Paleoceanography, 18, 1087, https://doi.org/10.1029/2003PA000920, 2003.
Stoll H. M., Arevalos, A., Burke, A., Ziveri, P., Mortyn, G., Shimizu, N., and Unger, D.: Seasonal cycles in biogenic production and export in Northern Bay of Bengal sediments traps, Deep-Sea Res. Pt. II, 54, 558–580, 2007.
Swingedouw, D., Mignot, J., Braconnot, P., Mosquet, E., Kageyama, M., and Alkama, R.: Impact of freshwater release in the North Atlantic under different climate conditions in an OAGCM, J. Climate, 22, 6377–6403, 2009.
Taylor, K. E., Stouffer, R. J., and Meehl, G. A.: An overview of CMIP5 and the experiment design, B. Am. Meteorol. Soc., 93, 485–498, 2012.
van de Poll, W. H., Kulk, G., Timmermans, K. R., Brussaard, C. P. D., van der Woerd, H. J., Kehoe, M. J., Mojica, K. D. A., Visser, R. J. W., Rozema, P. D., and Buma, A. G. J.: Phytoplankton chlorophyll a biomass, composition, and productivity along a temperature and stratification gradient in the northeast Atlantic Ocean, Biogeosciences, 10, 4227–4240, https://doi.org/10.5194/bg-10-4227-2013, 2013.
Vinayachandran, P. N., Murty, V. S. N., and Ramesh Bahu, V.: Observations of barrier layer formation in the Bay of Bengal during summer monsoon, J. Geophys. Res., 107, 8018, https://doi.org/10.1029/2001JC000831, 2002.
Vinayachandran, P. N., Chauhan, P, Mohan, M., and Nayak, S.: Biological response of the sea around Sri Lanka to summer monsoon, Geophys. Res. Lett., 31, L01302, https://doi.org/10.1029/2003GL018533, 2004.
Wang, B., Clemens, S. C., and Liu, P.: Contrasting the Indian and East Asian monsoons: implications on geologic timescales, Mar. Geol., 201, 5–21, 2003.
Wang, B., Yang, J., Zhou, T., and Wang, B.: Interdecadal changes in the major modes of Asian-Australian Monsoon variability: strengthening relationship with ENSO since the late 1970s, J. Climate, 21, 1771–1789, 2008.
Wang, X., Auler, A. S., Edwards, R. L., Cheng, H., Cristalli, P. S., Smart, P. L., Richards, D. A., and Shen, C.-C.: Wet periods in northeastern Brazil over the past 210 kyr linked to distant climate anomalies, Nature, 432, 740–743, 2004.
Webster, P. J., Magaña, V. O., Palmer, T. N., Shukla, J. Tmas, R. A., Yanai, M., and Yasunari, T.: Monsoons: Processes, predictability, and the prospects for prediction, J. Geophys. Res., 103, 14451–14510, 1998.
Wiggert, J. D., Hood, R. R., Banse, K., and Kindle, J. C.: Monsoon-driven biogeochemical processes in the Arabian Sea, Prog. Oceanogr., 65, 176–213, 2005.
Wolff, E. W., Chappellaz, J., Blunier, T., Rasmussen, S. O., and Svensson, A.: Millennial-scale variability during the last glacial: The ice core record, Quaternary Sci. Rev., 29, 2828–2838, 2010.
Yu, S.-Y., Colman, S. M. Lowell, T. V., Milne, G. A., Fisher, T. G., Breckenridge, A., Boyd, M., and Teller, J. T.: Freshwater ourbrust from Lake Superior as a trigger for the cold event 9300 years ago, Science, 328, 1262–1266, 2010.
Zhang, H., Liu, C., Jin, X., Shi, J., Zhao, S., and Jian, Z.: Dynamics of primary productivity in the northern South China Sea over the past 24 000 years, Geochem. Geophy. Geosy., 17, 4878–4891, 2016.
- Abstract
- Introduction
- Site description and oceanographic setting
- Materials and methods
- Results
- Discussion: forcing factors behind PP variations over the last 26 kyr as revealed by a model–data comparison
- Conclusion
- Data availability
- Author contributions
- Competing interests
- Acknowledgements
- Review statement
- References
- Supplement