the Creative Commons Attribution 4.0 License.
the Creative Commons Attribution 4.0 License.
 | 20 Oct 2020
Reassessing long-term drought risk and societal impacts in Shenyang, Liaoning Province, north-east China (1200–2015)
Neil Macdonald
Heather Sangster
Richard Chiverrell
Rachel Gaulton
The occurrence of two severe droughts in north-east China since 2000 has raised attention in the risk presented by droughts. This paper presents a historic drought series for Shenyang in Liaoning Province, north-east China, from 1200 CE to the present with a reconstructed long precipitation series (1906–2015) augmented with historical documentary accounts. Analysis of the instrumental series using a standardized precipitation index (SPI) and extending it using historical records has produced a combined series spanning over 8 centuries. The combined long series was analysed for patterns in drought frequency, severity and typology. Three droughts comparable to those since 2000 occur in the instrumental series during the early 20th century (i.e. 1907, 1916–1918 and 1920–1921), and coeval archival sources reveal the human impacts of these severe droughts. The archival sources demonstrate how reduced vulnerability resulting from societal and cultural changes in the early 20th century helped prevent the loss of life experienced during comparable severe droughts at the end of the 19th century (1887 and 1891). Incorporating a longer temporal perspective to drought analysis shows that onset is often earlier than is documented explicitly within the archives, and so combined SPI series for a region could provide an early warning of drought development expressed as a water deficit in the previous year. Analysis of archival data provides a rich historical description of impacts and societal responses to severe drought. The archives provide a rich historical description of drought impacts and responses at the personal and community level whilst also detailing the different roles played by communities, state and international organizations in responding to events.
- Article
(2862 KB) - Full-text XML
-
Supplement
(92 KB) - BibTeX
- EndNote


Drought is a world-wide problem causing more deaths globally than any other natural disaster (Delbiso et al., 2017), with over 485 000 deaths and more than 1.6 billion people adversely affected during the last decade (2010–2019; EM-DAT, 2019). Drought is often a slow developing pervasive environmental disaster that is difficult to predict and manage, with a variety of definitions in operational use around the world. There is no single universal definition defining what constitutes a drought, with a variety of definitions applied globally, with many focusing on a deficiency in precipitation over a period of time (Belal et al., 2014; Lloyd-Hughes, 2014; Wilhite, 2000). Droughts often develop slowly under natural conditions or through human intervention, causing adverse impacts on activities (e.g. food production) or societal groups (e.g. farmers) (Dai, 2011). Droughts often begin following a prolonged period of moisture deficiency (van Lanen, 2006; Palmer, 1965), propagating through the hydrological cycle, and exhibit differing spatial and temporal characteristics dependent on a variety of factors, such as antecedent conditions and soil moisture (Heim, 2002; Todd et al., 2013). Wilhite and Glantz (1985) classified droughts into four types: meteorological, hydrological, agricultural and socio-economic, with Mishra and Singh (2010) recommending the inclusion of a fifth classification – groundwater drought. Drought has been referred to as a “creeping phenomenon” (Mishra and Singh, 2010), and its impacts vary from region to region, with drought effects exacerbated by other meteorological elements such as temperature, wind and humidity (Brázdil et al., 2009). Palmer (1965, p. 1) notes that “drought means various things to various people, depending on specific interest”. Droughts are complex so-called “natural” hazards – the term “natural” in natural hazards – although etymologically doubtful because, in a sense, all hazards are natural – may be considered as “natural” as sanctioned by a long-term use in disaster research (Sangster et al., 2018), with droughts causing significant environmental, social and economic impacts (Van Loon et al., 2016). Drought is an international phenomenon with notable drought episodes throughout the 20th and 21st centuries, such as the 1930s Dust Bowl in the USA (Schubert et al., 2004); 1975–1976 in Europe (Parry et al., 2012; Zaidman et al., 2002); China in 1994 and 2010–2011 (Zhang et al., 2019), and South Africa in 2015–2017 (Wolski, 2018). Over recent decades, several studies have started to explore historical droughts (Brázdil et al., 2009, 2018b) and their associated impacts over timescales ranging from decades to centuries on water resources (Lennard et al., 2016), agriculture (Brázdil et al., 2018a), infrastructure (Harvey-Fishenden et al., 2019), stream and river flows (Zaidman et al., 2002), and groundwater (Bloomfield and Marchant, 2013). Recent calls (e.g. Trnka et al., 2018) in historical climatology have been for more analysis to be undertaken with existing data, particularly in understanding past socio-economic drought responses and changes in vulnerability. Considerable work has been undertaken in recent decades in developing robust long flood and drought chronologies, using combinations of archival (Brázdil et al., 2018b; Yan et al., 2014; Zheng et al., 2006) and instrumental (Brázdil et al., 2009) sources from around the globe, although much work to date has focused on Europe (Wilhelm et al., 2018). The development of new online digitized sources has facilitated greater historical analysis (Black and Law, 2004; Wang et al., 2018) with increased recognition from regulatory authorities in the value of historical information (Kjeldsen et al., 2014).
China is one of the most natural disaster prone countries in the world (Dai, 2011; He et al., 2011; Loorbach et al., 2011) with droughts a recurrent feature of the Chinese climate (He et al., 2011). Droughts are considered to be the most disastrous natural hazard within China with over 465 000 deaths and more than 3.1 billion adversely affected from 1970 to the present and over 12 million deaths since 1900 (EM-DAT, 2019). Historically notable droughts in 1876–1878, 1928–1930 and 1958–1962 resulted in widespread loss of life and poor harvests, leading to serious social consequences including famine, robbery, unrest and political instability (De Châtel, 2014; Janku, 2018; Teklu et al., 1992; Yang et al., 2012). Between 206 BCE and 1948 CE, 1056 severe droughts were recorded in Chinese history, though not spatially coherent (Zhang, 2004, 2013). In the period 1949–2000, Zhang et al. (2008b) identify 10 years of “heavy” (severe) agricultural drought and 4 years of “extreme” agricultural drought. Precipitation recording in China has developed through time, with some of the most globally advanced approaches applied during the early Qing Dynasty (1644–1912 CE) with both rainfall and snow depth recorded from 1736 to 1911 (Ge et al., 2005). The installation of better equipment through the 1920s and 1950s saw many stations upgraded, with meteorological stations often retained; however, the availability of metadata on early recorders is limited. Past droughts have had a far-reaching impact on society in China; a clear understanding of current and future drought risk is therefore critical. With population growth, economic development, urbanization and climatic change, drought is a global challenge, and it poses a severe threat to food security, environmental ecology, and urban and rural water supply in China (Bohle et al., 1994; Homer-Dixon, 1994).
This paper examines the history of drought in the Shenyang region of north-east China. It considers the spatial and temporal variability of droughts, assesses drought characteristics, and examines drought-causing climatic conditions and the impacts of past droughts on society. Our objectives are as follows:
- i.
to develop and analyse a record of droughts and associated impacts (1200 CE–present) for Shenyang using a variety of sources including documentary evidence and the compendium of Chinese droughts produced by Zhang (2004, 2013);
- ii.
to identify and analyse contemporary droughts using instrumented daily precipitation series from the Shenyang Meteorological Observatory (Station 54342; 1961–2015) and to augment this series with the longer monthly precipitation data for Shenyang (1906–1988);
- iii.
to generate a standardized precipitation index (SPI-1, -6 and -12) for the augmented precipitation series spanning the period 1906–2015, to construct one of the longest drought series (1200–present) in China by combining the augmented instrumental series (ii) with historical data (i), and then to classify the different types of drought and event severity;
- iv.
to analyse patterns in drought frequency, severity and type for Shenyang, examining the documented impacts and responses to drought to better understand how societal vulnerability has changed through time.
Shenyang (41.8∘ N, 123.4∘ E) is the capital city of Liaoning Province in north-east China (Fig. 1) with a temperate continental monsoon climate and temperatures ranging from −17 ∘C (January) to 29 ∘C (July) and decreasing from the south-west to the north-east (plain to mountain) (Chen et al., 2016), whilst average annual precipitation (500–1000 mm yr−1) increases from west to east (Zhang et al., 2013). The region has witnessed reductions (at 78 % of stations) in annual precipitation over the period 1961–2008 (Liang et al., 2011). The Shenyang municipality is home to approximately 8 million people in 2016. Liaoning Province is a primary grain-producing region in China; as such, droughts and associated impacts on regional agricultural production are of national importance, with previous studies detecting recent warming and reductions in precipitation (Chen et al., 2016).
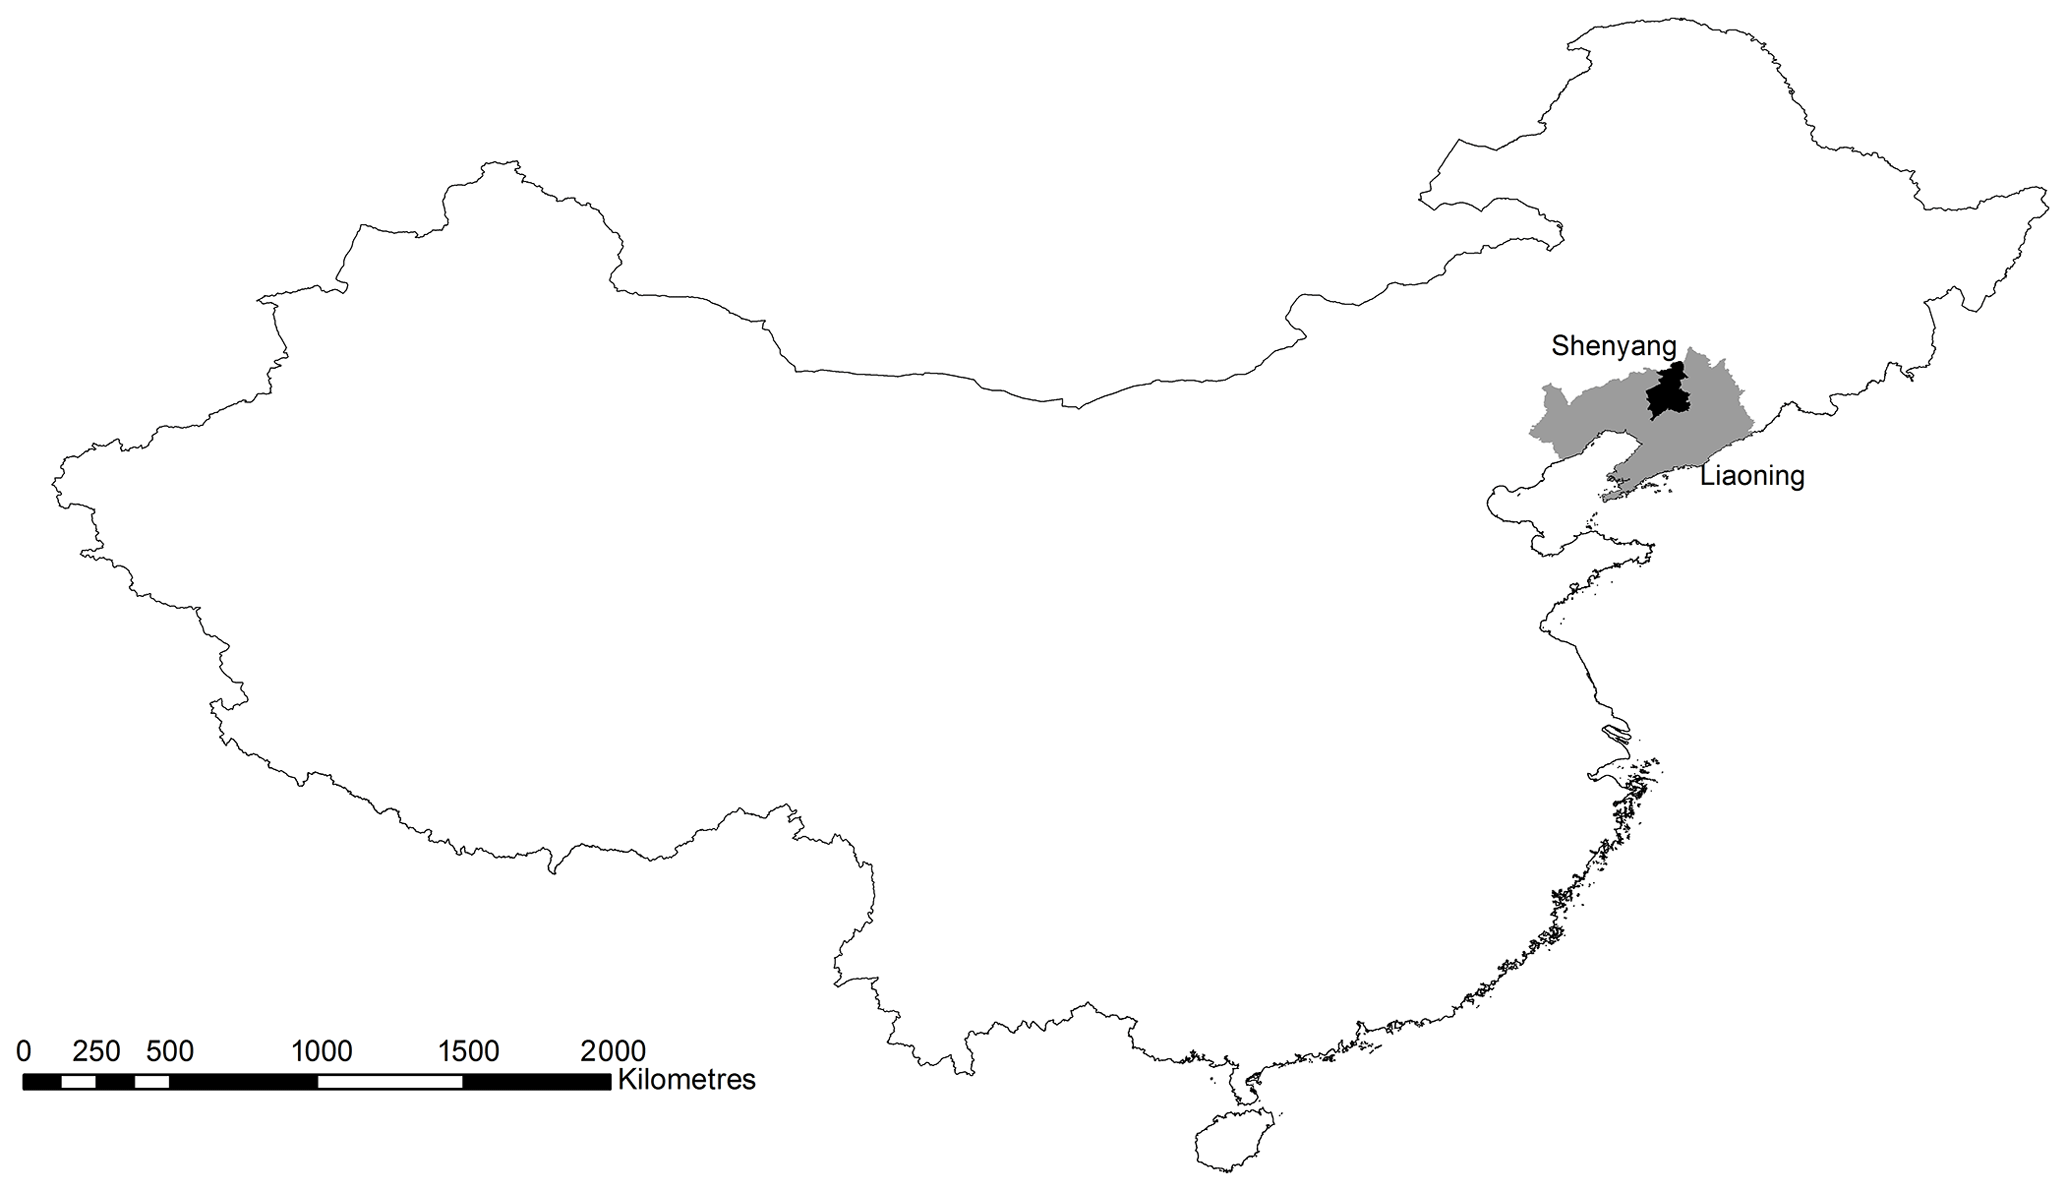
Figure 1The geographical location of Shenyang, Liaoning Province, and mainland China.
3.1 Data sources
This study uses a variety of source materials including historical and instrumental datasets detailed below.
3.1.1 Documentary data
The A compendium of Chinese Meteorological Records of the Last 3000 Years, produced by Zhang (2004) and updated in 2013, summarizes 7835 historical sources. These sources include the earliest existent materials in the Chinese language, the Oracle Bones collection (ca. 1600 BCE), through to more recent sources which describe meteorological incidences in China. The Oracle Bones collection have a long history of being studied for meteorological information with early studies undertaken by Wittfogel (1940). There are also a small number of private diaries and court memorial files of the Qing Dynasty, though the History of Drought Archives in the Qing Dynasty (Tan, 2013) provides a summary of the collection spanning from 1689 to 1911 with more than one million pieces present in the Qing Dynasty palace archive. The China Meteorological Disasters Ceremony (Liaoning volume) from Li and Meng (2005) provides detailed accounts of droughts, together with associated disasters including those potentially caused by droughts, such as famine and plague; a full list of source materials can be found in Table 1. Over recent decades considerable effort has focused on collating archival materials present across China that detail natural hazards, this wealth of information provides valuable opportunities for further exploration. However, such a high volume of material limits the capacity for cross-checking and validation, with many sources not easily accessible. This has raised questions of reliability and transparency, but as Bradley (2006) notes, the compendium produced by Zhang (2004) clearly illustrates critical analysis with careful checking for consistency and discrepancies clearly identified. Recent developments include a move to digitize these databases, ensuring and maintaining high levels of archival practice with the development of the REACHES (Reconstructed East Asian Climate Historical Encoded Series) climate database (Wang et al., 2018).
Table 1Historical source materials used in the drought reconstruction for Shenyang.
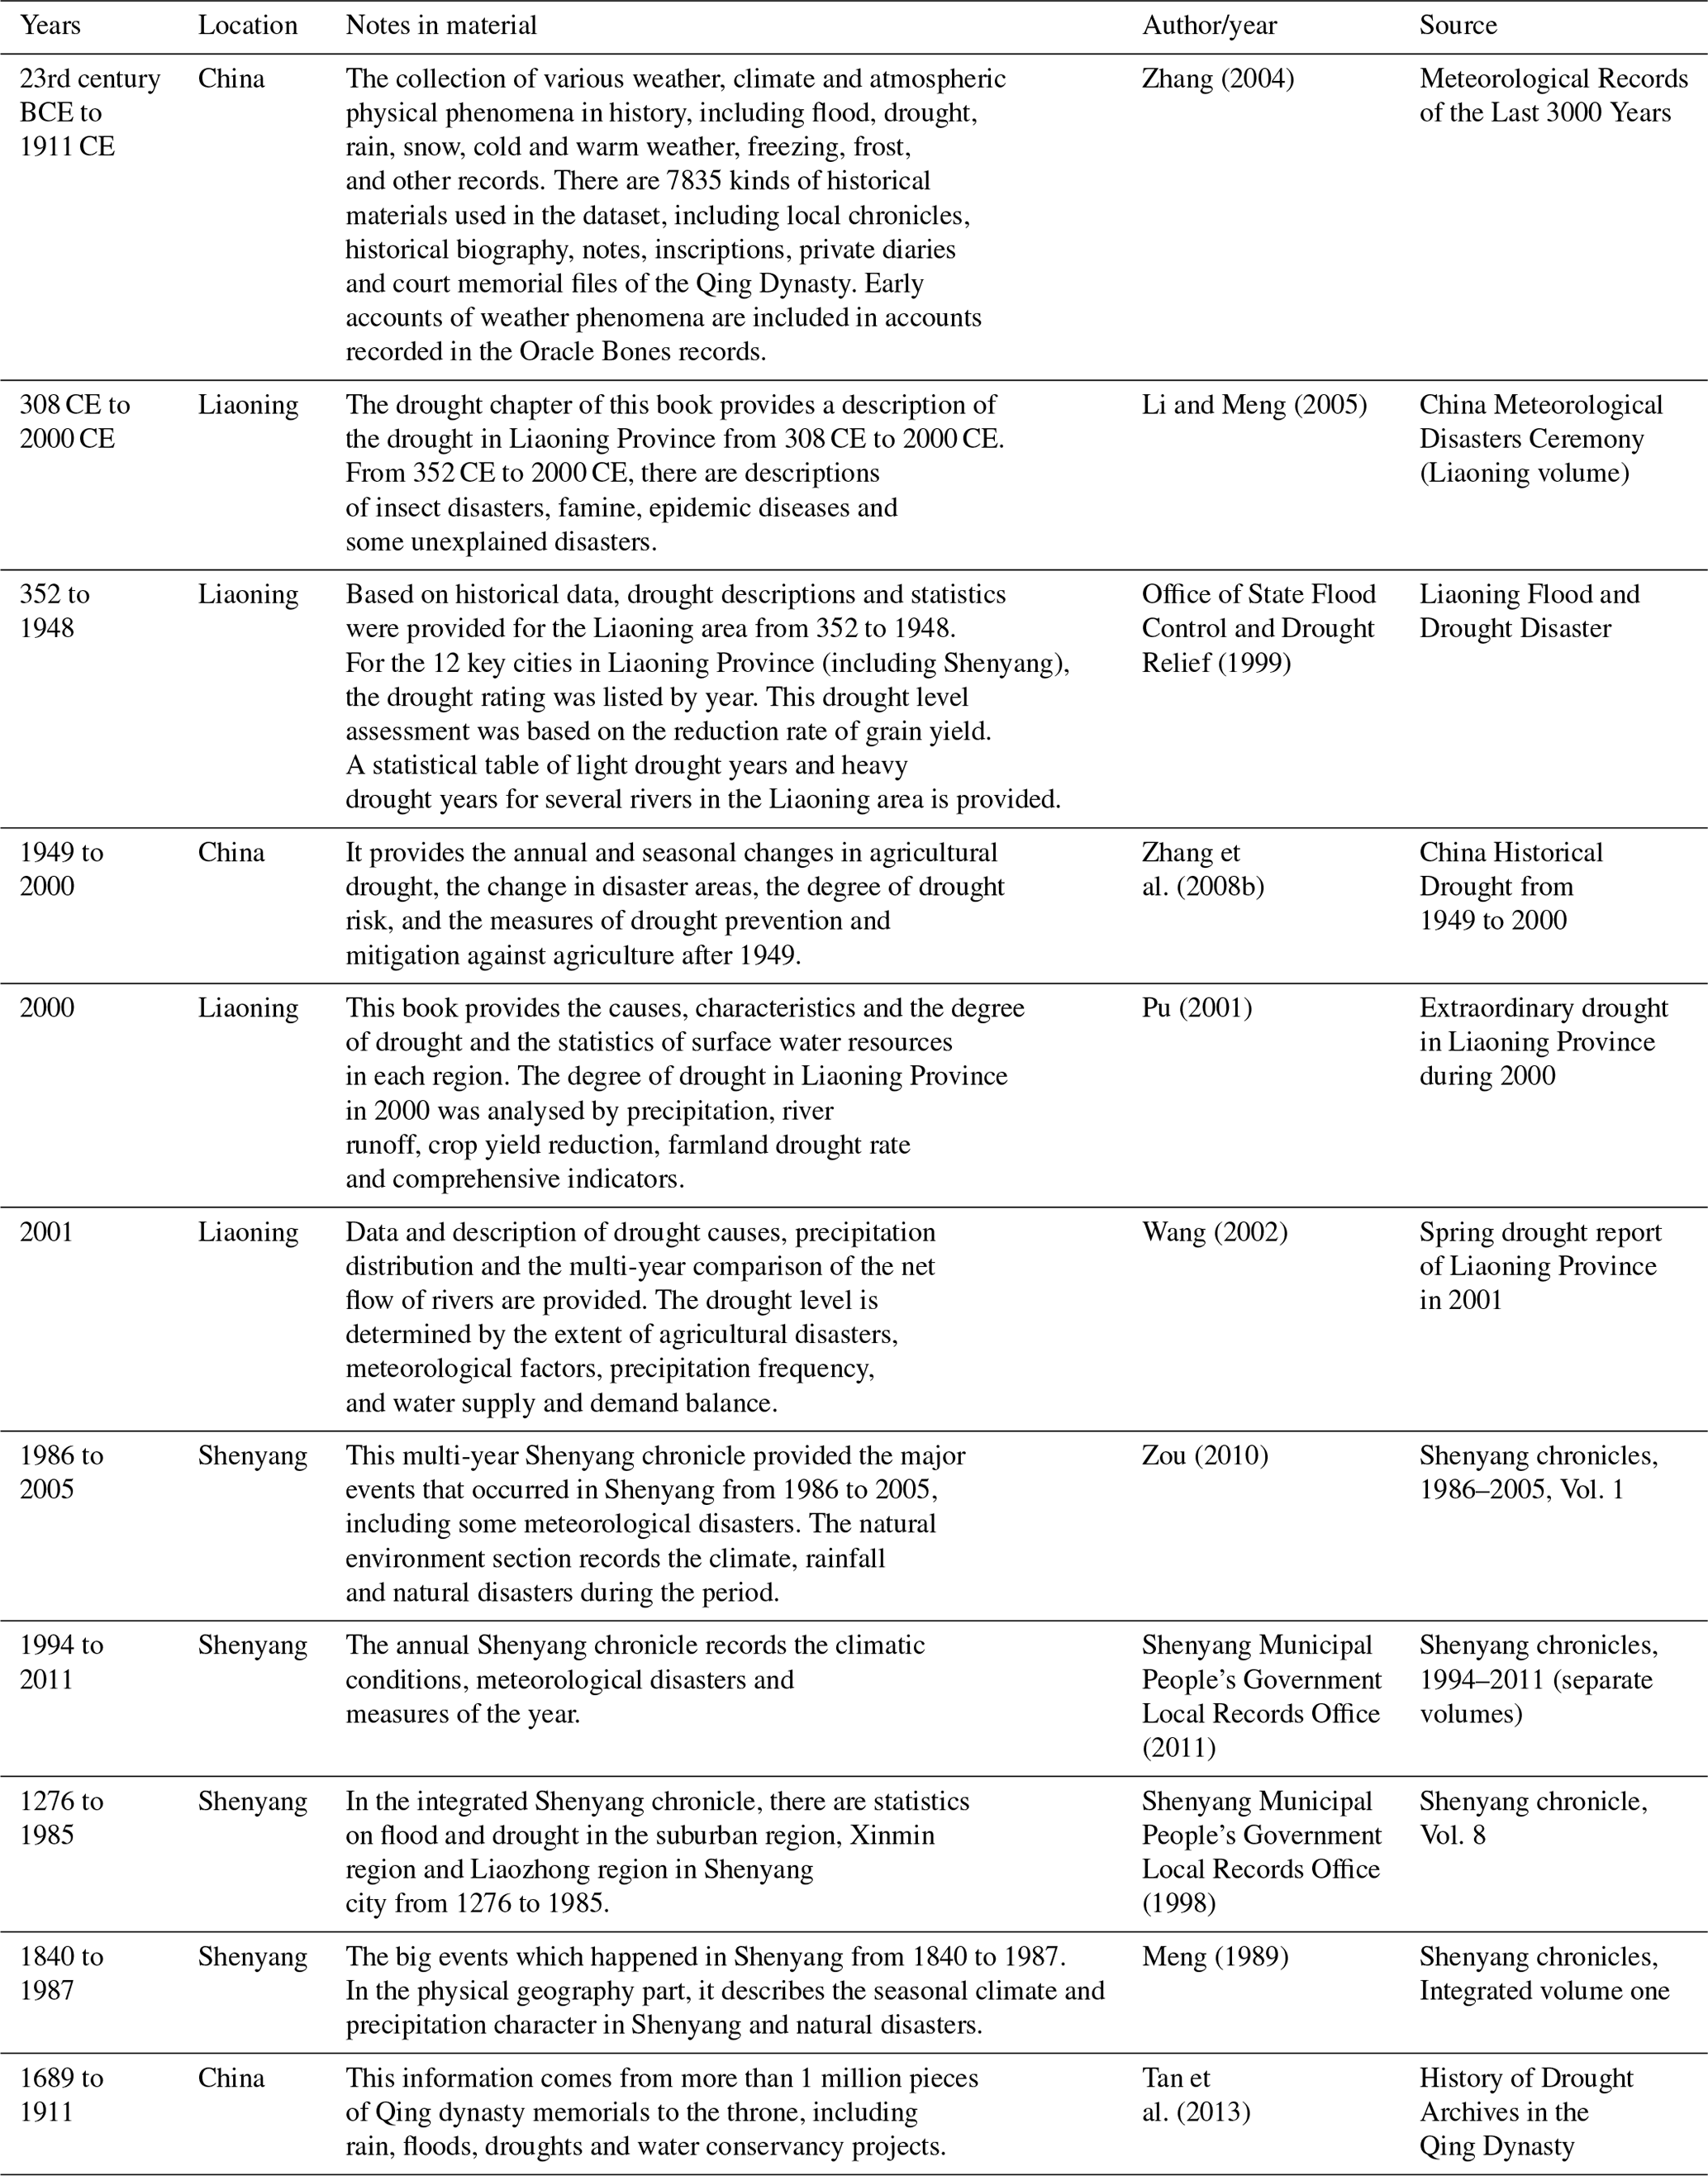
In addition to the meteorological sources identified, information from sources detailing agricultural activity provides valuable auxiliary reference materials, including the following items: Shenyang local records (Meng, 1989; Shenyang Municipal People's Government Local Records Office (1994–2011), 2011) and the year of flood and drought in Shenyang from 1276 to 1985 (Shenyang Municipal People's Government Local Records Office, 1998). The following datasets have been acquired from the Office of State Flood Control and Drought Relief (1999): farmland affected areas from 1949 to 1990 in Liaoning Province; statistics on drought area of heavy drought in Liaoning Province; drought rating assessments in various regions of Liaoning Province from 1949 to 1990; drought statistics in the province from 1470 to 1949; comparison of precipitation in Liaoning Province from 1949 to 1964 and from 1965 to 1990; comparison of grain yield per plant, drought frequency and drought reduction in various regions of Liaoning Province; hydrological station data for Liaoning Province; and regular frequency of continuous drought in the dry season in Liaoning Province. Local newspapers have also been accessed to corroborate records of droughts, such as the Shengjing Times (Shenyang was previously called Shengjing; see Table S1 in the Supplement).
3.1.2 Instrumental data
Instrumental climate data are taken from two datasets. The first is long-term meteorological data including monthly precipitation (May 1905 to December 1988) from the Research Data Archives Computational and Information Systems Lab (NCAR, 1996), no records are present for 1944–1946. The precipitation records for Shenyang have also been viewed and photographed in the Chinese Meteorological Archives in Beijing. The second precipitation series was retrieved from the National Disaster Reduction Centre of China (NDRCC), which provides daily data for air pressure (parameter code: V10004), daily average temperature (V12001), daily highest temperature (V12052), daily lowest temperature (V12053), precipitation (V13201), average wind speed (V11002) and sunshine hours (V14032) for the period 1 January to 31 May 2016. This study uses the precipitation data (V13201). However, subsequent drought analyses could use additional meteorological variables for more complex drought modelling. Analysis of these two datasets permits a temporal analysis of the reconstructed long-term precipitation series with a long overlap period ensuring a statistical comparison of the datasets can be made.
Previous studies have illustrated a strong relationship between droughts and El Niño–Southern Oscillation (ENSO) anomalies (Li et al., 2019; L. Zhang et al., 2018) for differing regions of China; however, many of these studies use relatively short series (1960–2015). The extended precipitation series (1906–2015 CE) presented here provides a valuable opportunity to explore this relationship over a longer timescale. The ENSO3.4 sea surface temperature index, defined as the area-averaged sea surface temperature (SST) anomalies over 5∘ N–5∘ S, 170–120∘ W using the HadISST1 dataset for the period 1870–2015 by Rayner et al. (2003), is used in this study.
3.2 Data processing
3.2.1 Documentary data
The compendium provided by Zhang (2004, 2013) provides the framework for the early record (pre-1911); however, great care was taken in assessing the historical record through the verification of original accounts.
In the process of analysing documentary sources for Shenyang, it is necessary to pay particular attention to historical changes to the name of Shenyang and the province boundary (see Table S1). For example, in the book Zhong Guo Dong Bei Yu Dong Bei Ya Gu Dai Jiao Tong Shi (Wang and Pu, 2016), it is noted that during the Han Dynasty, “Liao Dong Jun” was used for the Shenyang area. In contrast, during the Dong Han Dynasty, the southern part of Shenyang continued to belong to Liao Dong Jun, and the northern part belonged to Xuan Tu Jun (Zhao, 2006). In addition, the Gao Xian region is now the Sujiatun area in Shenyang (Wang and Pu, 2016); Yan (2012) detailed historical changes in the Shenyang area (Table S1).
Historical records for all drought years are included when records exist, but historical records for the following situations are excluded.
- i.
Information concerning the cause of the disaster or event location is unclear. For example, in 1549, a drought and locust disaster occurred in Xingcheng County in Liaoning Province (Ming Shi Lu Shi Zong Shi Lu, Vol. 353, No. 42). In 1549, Xingcheng belonged to Liaoxi; however, Shenyang belonged to Liaodong. Therefore, this record is not in the target region and is excluded.
- ii.
A record is excluded if it does not clearly state drought or that a drought was the cause. Although there are many types of event that are associated with or related to droughts, such as locusts, epidemic disease or famine, when historical records do not directly state drought or attribute the cause to drought, they are excluded. For example, in October 1551, the Liaodong area did not collect grain tax because of disasters (Ming Shi Lu Shi Zong Shi Lu, Vol. 378). The record does not explicitly state that a drought occurred, though this is a typical response to drought; therefore, the record is excluded.
3.2.2 Instrumental data
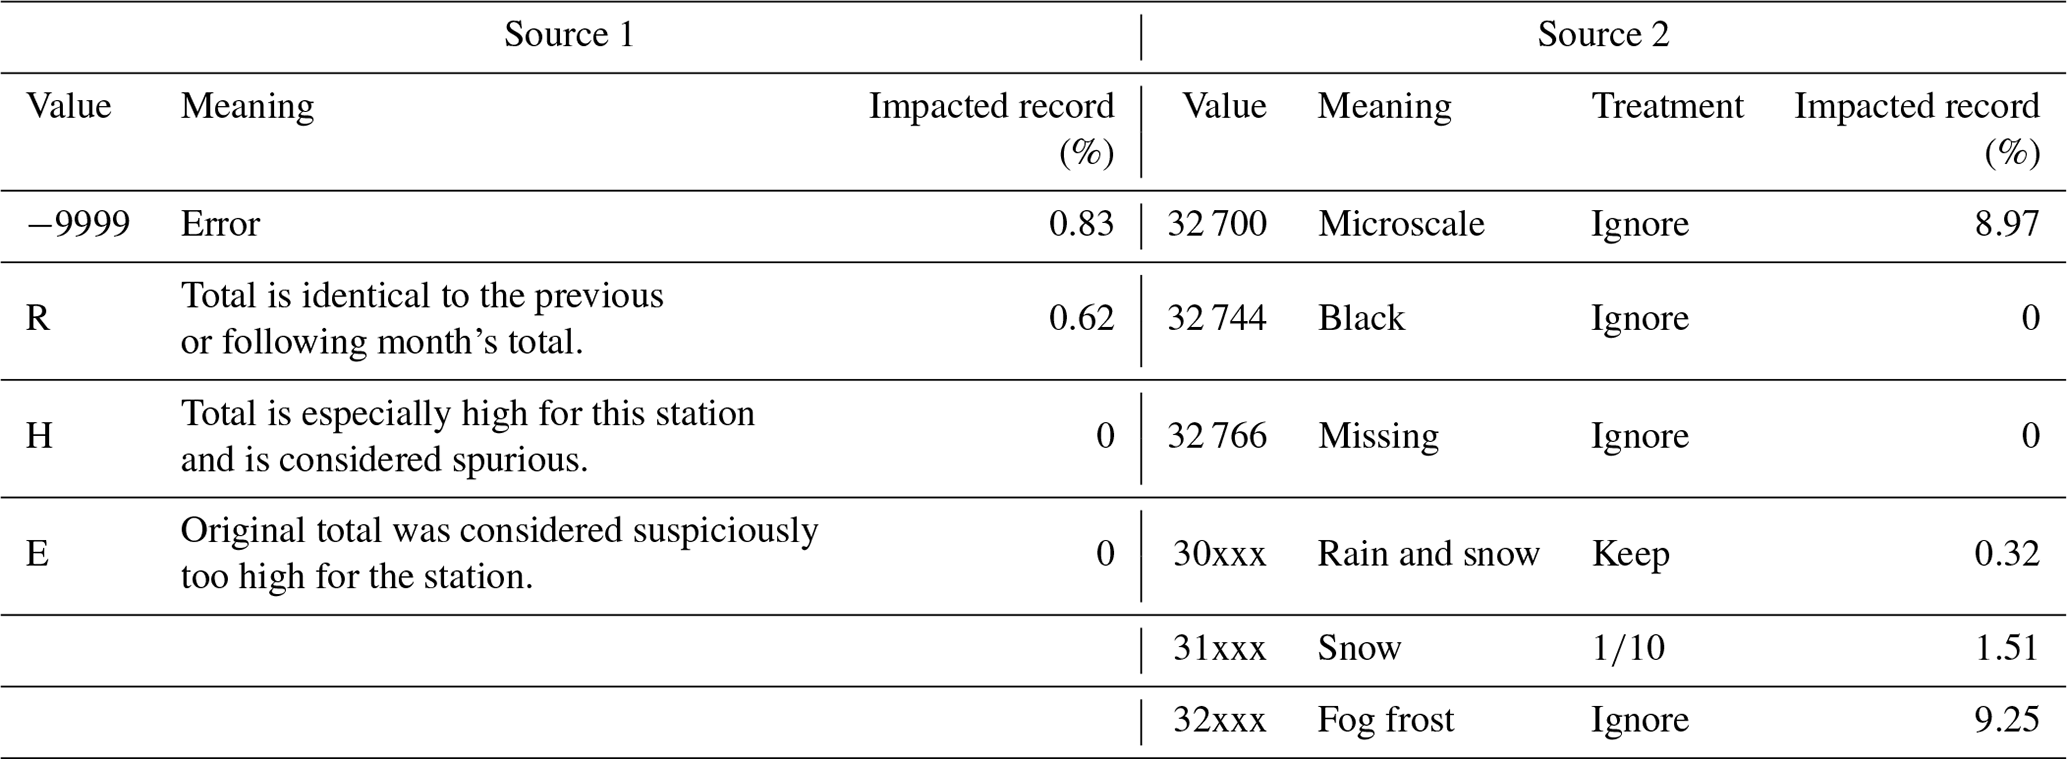
Data quality assessment and management of both long (NCAR) and shorter (NDRCC) series are required to ensure homogenization and data suitability (see Sect. 3.1.2). Total precipitation includes both liquid and equivalent frozen precipitation. All meteorological variables are recorded as one-tenth of their specific units (mm) but are converted to millimetres throughout. For both instrumental series, care and attention are taken with the original data series quality, with the data descriptors recorded in Table 2. At Shenyang meteorological station, missing data occurred eight times (representing 0.826 % of the record), and rainfall was marked three times with “R”, reflecting monthly totals identical to the previous month, raising concerns as to the validity of the data (January–February 1906, December 1908–January 1909 and December 1968–January 1969). There is a reduction of available meteorological data during the years 1943–1946 following the Second World War across much of eastern China; as such, no suitable local sites could be identified to infill this series. For other missing monthly data, monthly averages are included when single months are missing as often local stations are also missing data. For the shorter instrumental daily precipitation series (NDRCC), data descriptors are included in Table 2, including the percentage of record impacted. The precipitation record for Shenyang has had four station relocations/instrument renewals during its monitoring record (October 1970, October 1976, January 1989 and June 2006). An analysis of the homogeneity of the record was undertaken using the approach presented by Li et al. (2014) when assessing temperature changes in Shenyang. Correlation analysis of Shenyang with the nearby Benxi precipitation station record (∼41 km south-east of Shenyang) demonstrates a stable difference (prediction ratio) between the two series for all periods and an R2 throughout of >0.88 (Table S2). In the absence of any evident changes within the precipitation record resulting from localized station relocation/instrument renewal, we consider the precipitation data at Shenyang to be homogeneous and reliable.
Table 2Data information description table (source 1: https://rda.ucar.edu/datasets/ds578.5/docs/ndp039.des, last access: 10 April 2019; source 2: NDRCC).
Analysis of the two series for the coeval years of record (1961–1988) was undertaken, and a Q–Q plot verified that both data sources are normally distributed (Fig. 2a). Figure 2b shows a linear distribution (p value of 0.028); however, differences between the series exist. During the period 1961–1988, the average difference between the two datasets is 12.72 mm, and the maximum is 313.2 (October 1974); further examination reveals that all the variations occur in the period 1961–1979, with the two datasets producing identical values for all months from 1980 onwards; this replicability in the later records provides confidence in extending the NCAR dataset through to 2015. Analysis of the dispersion and outliers for each month was also undertaken (Fig. 2c), and the months with the greatest discrepancy are March and April, possibly reflecting challenges in the recording of snow/ice fall. A comparison of the monthly and seasonal precipitation patterns presented in Fig. 3 for Shenyang for the period 1906–2015 using the new augmented series identifies some abnormal values from the NDRCC data from the period 1961 to 1979 which appear unrealistic, e.g. April 1964, 285.9 mm with an average usually of ca. 50 mm. An analysis of the variability in the precipitation is presented (Fig. 4) with the lowest precipitation (the driest) (1913, 341.1 mm yr−1) and highest (wettest) years noted (1923, 1064.9 mm yr−1; Fig. 4a); a seasonal analysis and long-term trends are also presented (Fig. 4b–e) with a 30-year Savitzky–Golay filter (Savitzky and Golay, 1964).

Figure 2(a) Q–Q plot of the two coeval precipitation series (mm) data sources (p value 0.028); (b) monthly precipitation comparison of two datasets (significance analysis of precipitation from 1961 to 1988); (c) monthly precipitation distribution and outliers for January to December.
3.3 Drought identification
Using the combined instrumental and archival source materials, a record of droughts is reconstructed for Shenyang. The droughts are explored and examined from a number of perspectives, including type of drought (classification), intensity/magnitude, frequency and trends, which together characterize drought structure.
3.3.1 Standardized precipitation index
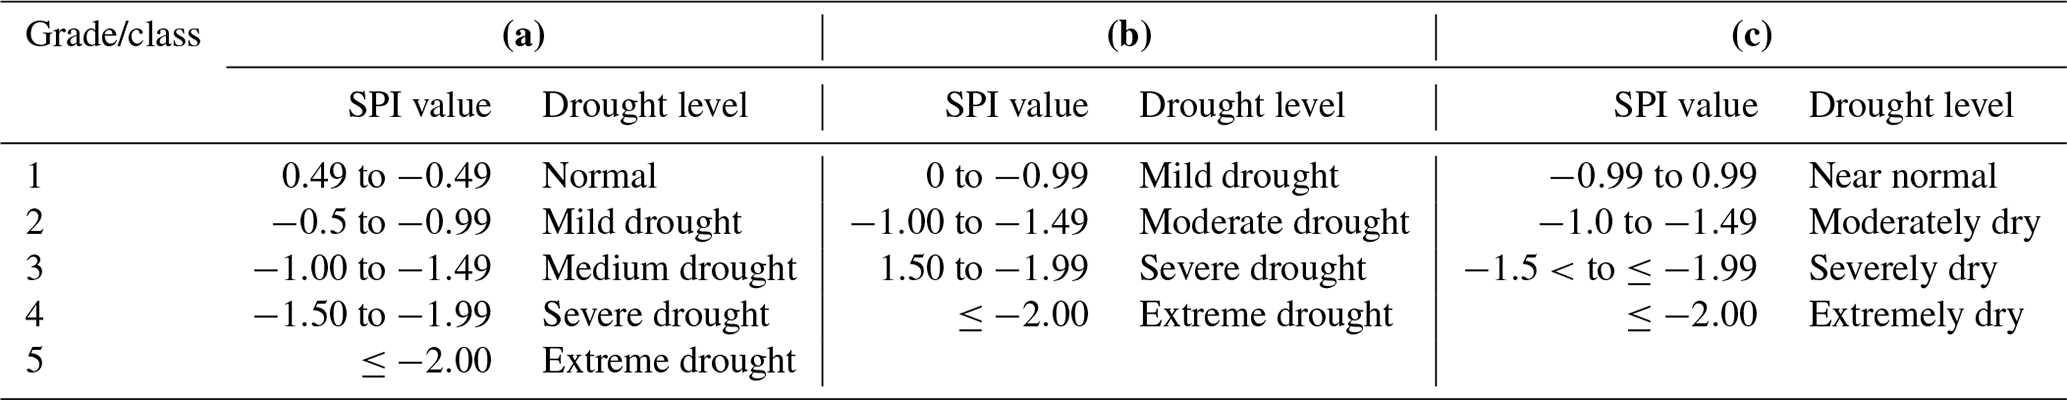
There are several different drought indices that have been developed (Heim, 2002) which use a range of different input parameters. The long precipitation series reconstructed in this study only includes monthly data; therefore, the standardized precipitation index (SPI) is used as this index has several advantages when considered over long timescales compared to other potential drought indices. Meteorological drought indicators can be divided into two categories focused on either the physical mechanisms of drought or the statistical distribution of meteorological elements; the SPI belongs to the latter group and is widely used (Lennard et al., 2016; Mckee et al., 1993). The SPI developed by Mckee et al., (1993) is a widely applied meteorological drought index that quantifies precipitation deficits or excesses across different climates at multiple timescales, typically of 1–24 months. However, the simplicity of the SPI (precipitation is the only input) causes some limitations too, such as no consideration of evaporative demand (Vicente-Serrano et al., 2014). SPI values are dimensionless units, with negative values indicating drier than normal conditions and positive values wetter than normal conditions. Drought onset is generally assumed to occur at SPI values exceeding ≤1. However, the National Standards of the People's Republic of China (2017) classification uses as being indicative of drought onset, with drought termination identified as when SPI returns to ≥0 (Table 3a); within this study, we apply the classification as defined for China. The SPI can be used to characterize drought duration, severity and timing of onset and termination; together known as the drought structure (Noone et al., 2017). The SPI classification recommended in China (National Standards of the People's Republic of China, 2017) differs slightly from that of the World Meteorological Organization (WMO; 2012; Table 3a, c), though others have also proposed regionally specific SPI versions, such as Moreira et al. (2008) for Portugal. Drought duration is determined by the number of months between drought onset () and termination (SPI≥0), and drought severity is categorized using the SPI classification system with peak severity the minimum SPI value recorded during the drought. Within this study, SPI will be examined at three temporal scales: SPI-1 (1 month), SPI-6 (6 months) and SPI-12 (12 months) (Fig. 5a–c). The SPI was determined by fitting a probability density function to selected accumulation periods using L-moments to estimate parameters. A gamma probability density distribution was found to be the most appropriate fit, using a Kolmogorov-Smirnov (K–S) test to compare empirical and theoretical fit and calculating the cumulative probability. These are then converted into the standard normal distribution with the transformation of the cumulative probability of the fitted distribution to standard normal distribution to define the SPI value (Lloyd-Hughes and Saunders, 2002; Vicente-Serrano et al., 2010). Other univariate distributions have been recommended when a gamma distribution is not appropriate (Barker et al., 2016; Stagge et al., 2015).
Table 3SPI drought classifications applied within different regions. (a) Chinese grades of meteorological drought (National Standards of the People's Republic of China, 2017) and (b) the arbitrary drought intensity classes originally defined by Mckee et al. (1993) and (c) as used by the WMO (World Meteorological Organization; WMO, 2012).
3.3.2 Documentary analysis
Documentary data provide additional detail beyond that offered by instrumental series, adding valuable information reflecting both societal impacts and responses to past events (Pfister, 2010). At Shenyang, the first recorded drought occurs in 347 CE, but only three events are recorded during the period 347–1200. Therefore, the records analysed within this paper start post-1200 as the frequency of records increases. Previous studies (e.g. Brázdil et al., 2009; Hanel et al., 2018; Todd et al., 2013) using historical archival sources have examined qualitative records and used a variety of different indices or grades of drought. The use of ordinal index systems for the classification of descriptive accounts in historical climatology is common with a range of classes employed, such as Nash et al. (2016) who used a +2 to −2 classification in examining wet/dry phases in Natal and Zululand, South Africa. In augmenting the instrumental data with the historical series, clear benefits can be achieved if the descriptive classification is comparable to the SPI drought classification applied (Table 3a). Therefore, initially five drought classes are used in considering the historical descriptions, allowing alignment between the two data forms with typical types of descriptor for each of the five classes presented in Table 4.
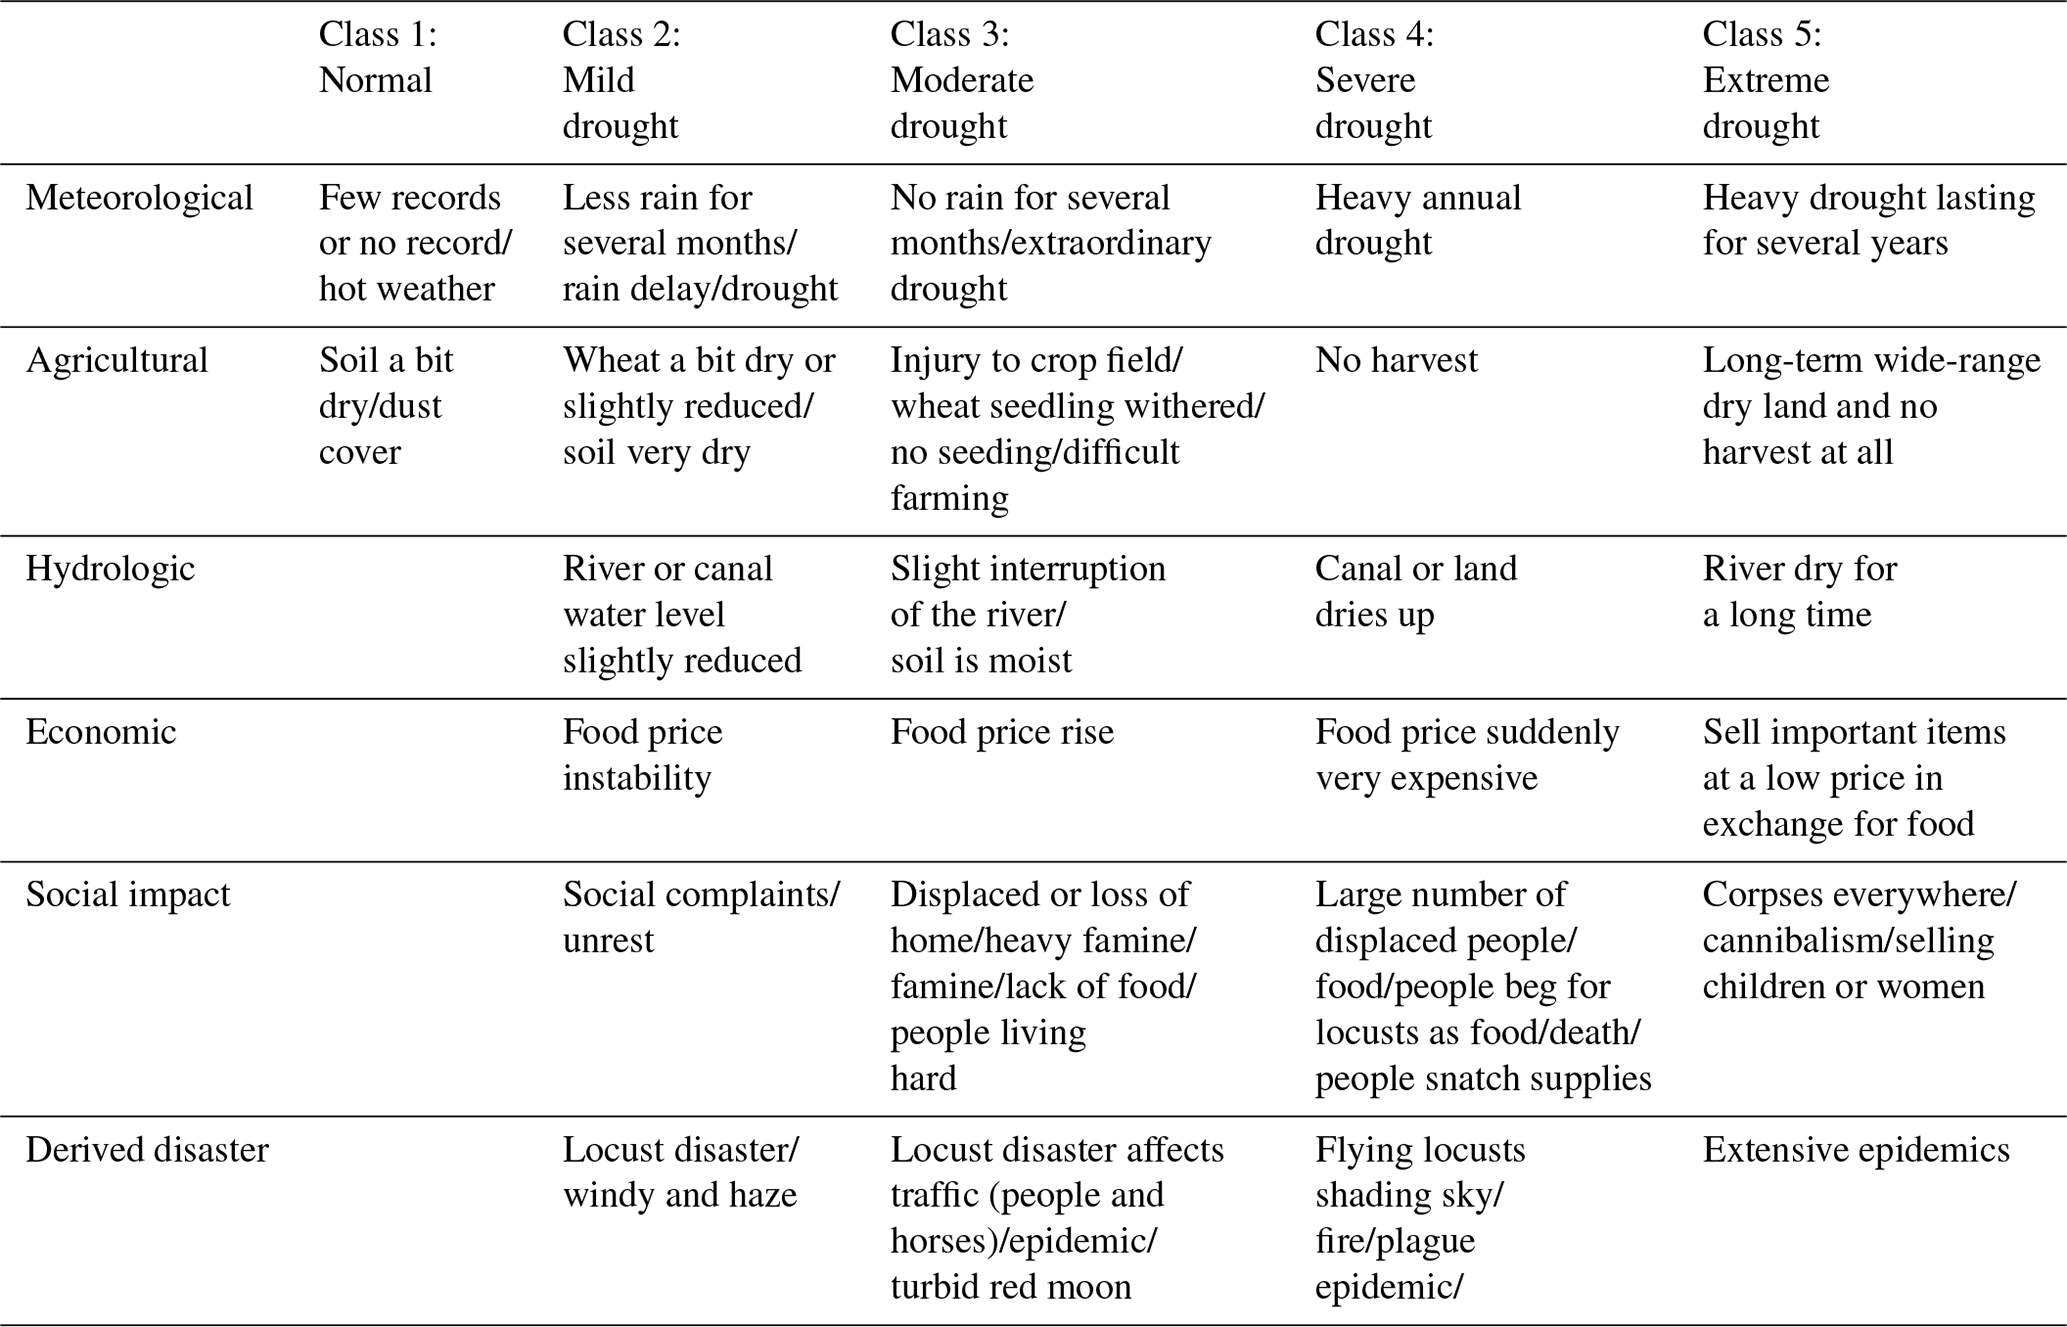
Analysing the historical records unearthed different forms of drought impact which broadly reflect the five drought classes identified by Mishra and Singh (2010). Meteorological, hydrological and agricultural are comparable, the difference being that few accounts detail groundwater droughts within the historical records; as such, they are incorporated into hydrological droughts within this study. Socio-economic droughts are split into economic (impacts of precise cost) and social (impacts on people's health, for example) impact. In dividing the socio-economic class into economic and social impact, we are responding to the wealth of historical materials present documenting drought impacts of this type. Each of the different classes of drought has varying degrees of impact severity (Table 4). In documenting each of these, an assessment of the interrelationship between different types of impact can be made, for example, the point at which food relief may be initiated or tax payments suspended (typically class 2/3), and others such as praying for rain/snow are associated with high classes (4/5), reflecting personal, communal and governmental responses (e.g. government control of food prices).
Annual drought values for the instrumental period (1906–2015) are represented by the minimum SPI-12 value within each calendar year; within the documentary accounts, the most severe class of drought is used to determine the classification. We opted to use the SPI-12 in preference to SPI-6 (or shorter timescales) as precipitation in Shenyang has such a strong seasonal skew toward the summer months. Use of SPI-12 also permits a more robust analysis of interannual drought, a key feature in this paper over the long period analysed.
3.3.3 Drought trend and frequency analysis
The reconstructed drought series for Shenyang (1200–2015) permits an analysis of long-term drought trends and patterns. Over such long timescales, a number of socio-political and cultural changes have occurred (Bavel et al., 2019) which may influence the capacity a population has to respond to a drought of any given magnitude or severity (Keenan and Krannich, 2010; Kreibich et al., 2019; Mechler and Bouwer, 2015). Human interventions may mitigate and/or exacerbate the impacts of drought downstream through hydrological system management and engineering (He et al., 2017). The socio-political and cultural circumstances during each recorded drought represent an essential underpinning in considering long-term drought trends and variability and are considered individually in each instance (see discussion by Brázdil et al., 2020).
An analysis of the different types of drought will be undertaken to assess long-term variability, severity and frequency, including an examination of where droughts have been documented during the instrumental period. The severity of droughts will be considered using the different classes of drought, examining whether any notable differences in drought type emerge which may help determine underlying changes in vulnerability through time. The reliability of the historical account classification process was assessed for the period 1906–2015 through statistical analysis (Spearman's p value – ordinal drought class) of the assigned drought class to annual minimum SPI.
The principal challenge identified within this study is in attempting to assess droughts defined between those characterized by the historical analysis, which is subjective, and that classified by the indices (SPI), which assumes a distribution with predefined probabilities attributed to each class (Guttman, 1998). Whilst an advantage in drought risk analysis, this makes the comparison to a subjective classification challenging.
4.1 Temporal analysis of instrumental time series
The augmented precipitation series illustrates the range of precipitation experienced at Shenyang over the last 110 years with a maximum annual rainfall of 1064.9 mm (1923) and a minimum of 341 mm (1913). The mean of 704 mm is slightly higher than the median value (dashed red line; Fig. 4a). Of the 28 years of annual rainfall below the quartile, 10 occur prior to 1960 and 18 after. Precipitation at Shenyang is concentrated in the summer months with little winter precipitation (Fig. 3), which is typical of a continental climate. Documentary accounts often discuss spring droughts in Shenyang which hinder the development of crops at the start of the growing season (Wang et al., 2019).
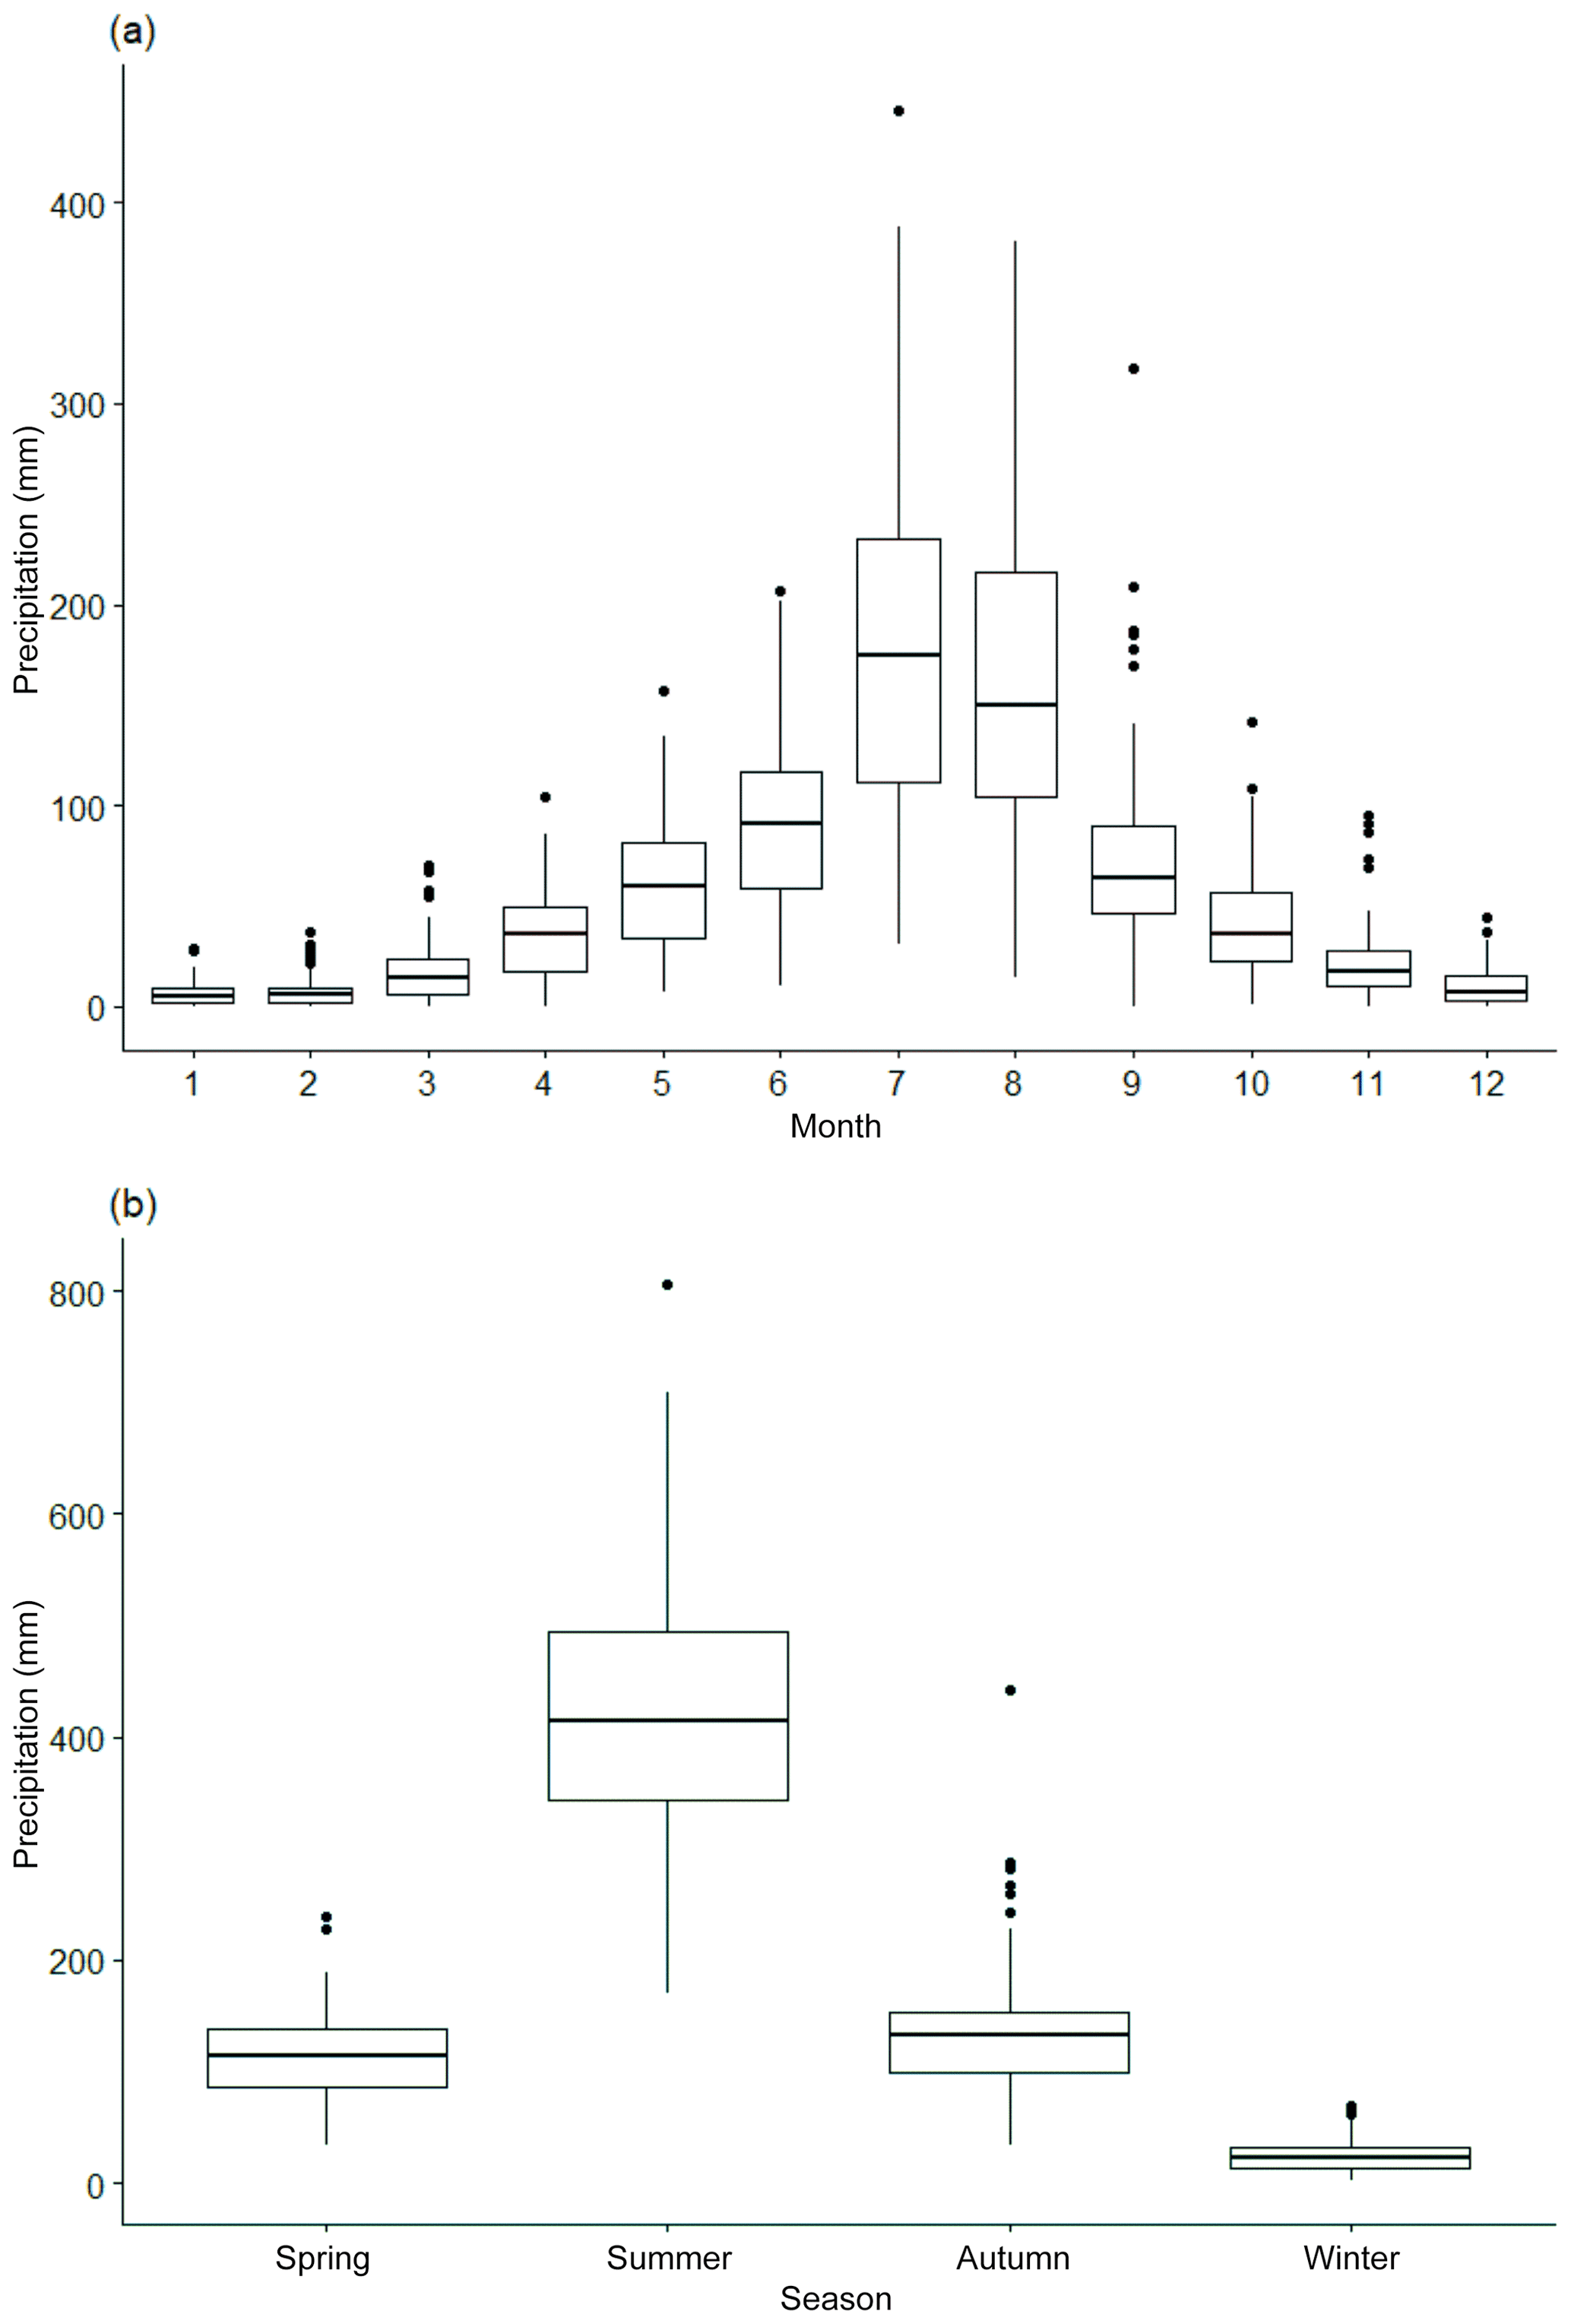
Seasonal analysis of precipitation (1906–2015; Fig. 4b, e) illustrates that precipitation in winter and spring gradually increases with time with a slight reduction in summer and autumn precipitation, but all are statistically insignificant (at 0.05 level; Fig. 4c, d). The most severe spring drought occurred in 2001 with only 33.7 mm of spring precipitation; this is supported with widespread media coverage of the drought in Shenyang and more widely in Liaoning. The worst summer drought occurred in 2014 (170.6 mm) with precipitation less than 50 % of the norm presenting the worst summer drought since 1961; in response, the Liaoning provincial government instigated a level III drought emergency response, which included additional funding from the central government (CNY 150 million) and provincial departments (CNY 70 million) (Wang, 2014), with drought relief teams being created to support community water infrastructure projects (Sun, 2015).

Figure 4Annual and seasonal precipitation from 1906 to 2015: (a) annual (quartiles indicated by dashed lines), (b) spring, (c) summer, (d) autumn and (e) winter. A 30-year Savitzky–Golay filter is presented (bold line in b–e).
The SPI generated from the long precipitation series is analysed at SPI-1, -6 and -12, with SPI-1 suited to short-term (monthly) analysis, SPI-6 being appropriate for seasonal drought analysis and SPI-12 for annual to multi-annual droughts. SPI-6 with scores of (severe droughts) occur 14 times during the 110-year record (Fig. 5b, c). There are six severe drought years before (1907, 1913, 1914, 1917, 1920, 1926) and eight (1961, 1963, 1965, 1989, 1997, 2000, 2014, 2015) after 1960, with several of these constituting multi-annual droughts. There are seven droughts that exceed in the SPI-12 series (Fig. 5c).
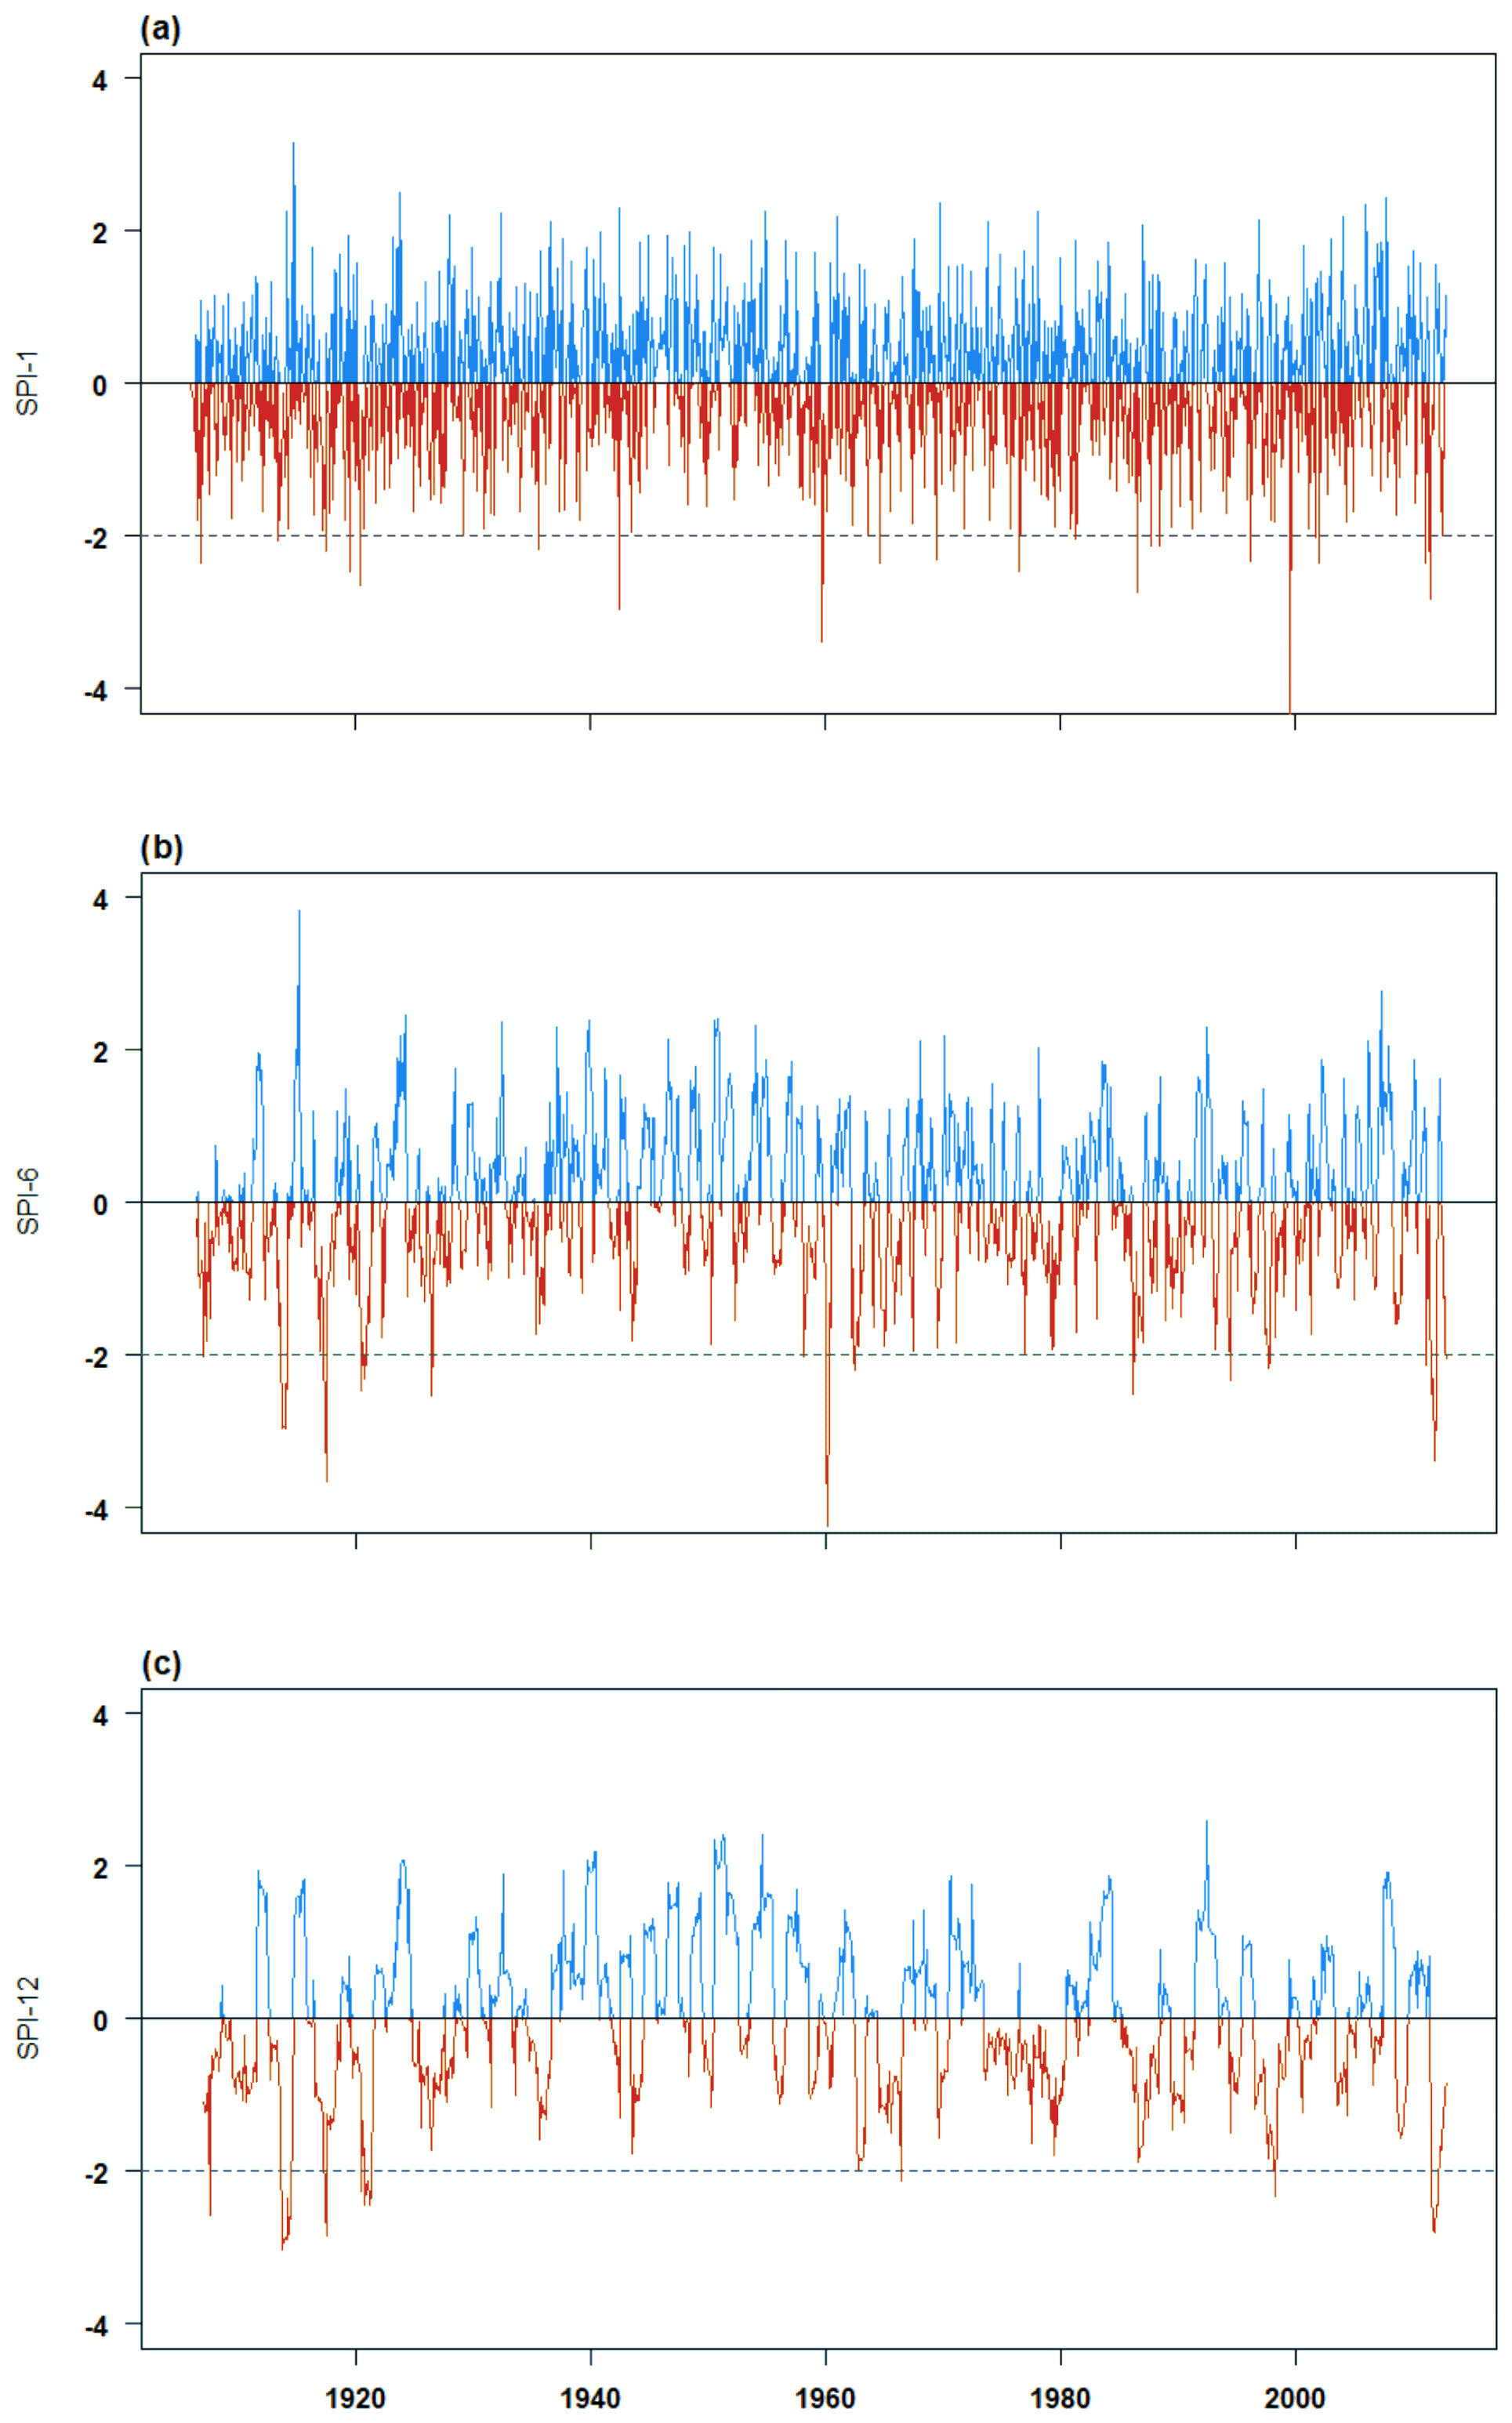
Figure 5Standard precipitation index from 1906 to 2015, with wetter (blue) and drier (red) than normal conditions indicated for (a) SPI-1, (b) SPI-6 and (c) SPI-12.
4.2 Drought classification and trends
The reconstruction of historical droughts in Shenyang is divided into two parts. The first obtains drought class information from the SPI for the period 1906–2015 from an augmented instrumental series. The second uses historical documents and is defined based on specific classification criteria shown in Table 2, producing a long drought reconstruction from 1200 to 2015 with documentary (coloured) and instrumental data (black) for Shenyang (Fig. 6b). Analysis of the period 1906–2015 demonstrates that a non-statistically significant correlation exists in the relationship between annual minimum SPI-12 and documentary drought class for any given year; of the 107 years of records, 42 record both an SPI and descriptive account of drought. The relative absence of class 1 events in the documentary record suggests that no account is often made during “normal” conditions, with the absence of record often likely reflecting no drought; therefore, the analysis was repeated, and years with no description were attributed to class 1. As a result, a statistically significant relationship is identified (Spearman, p<0.05).
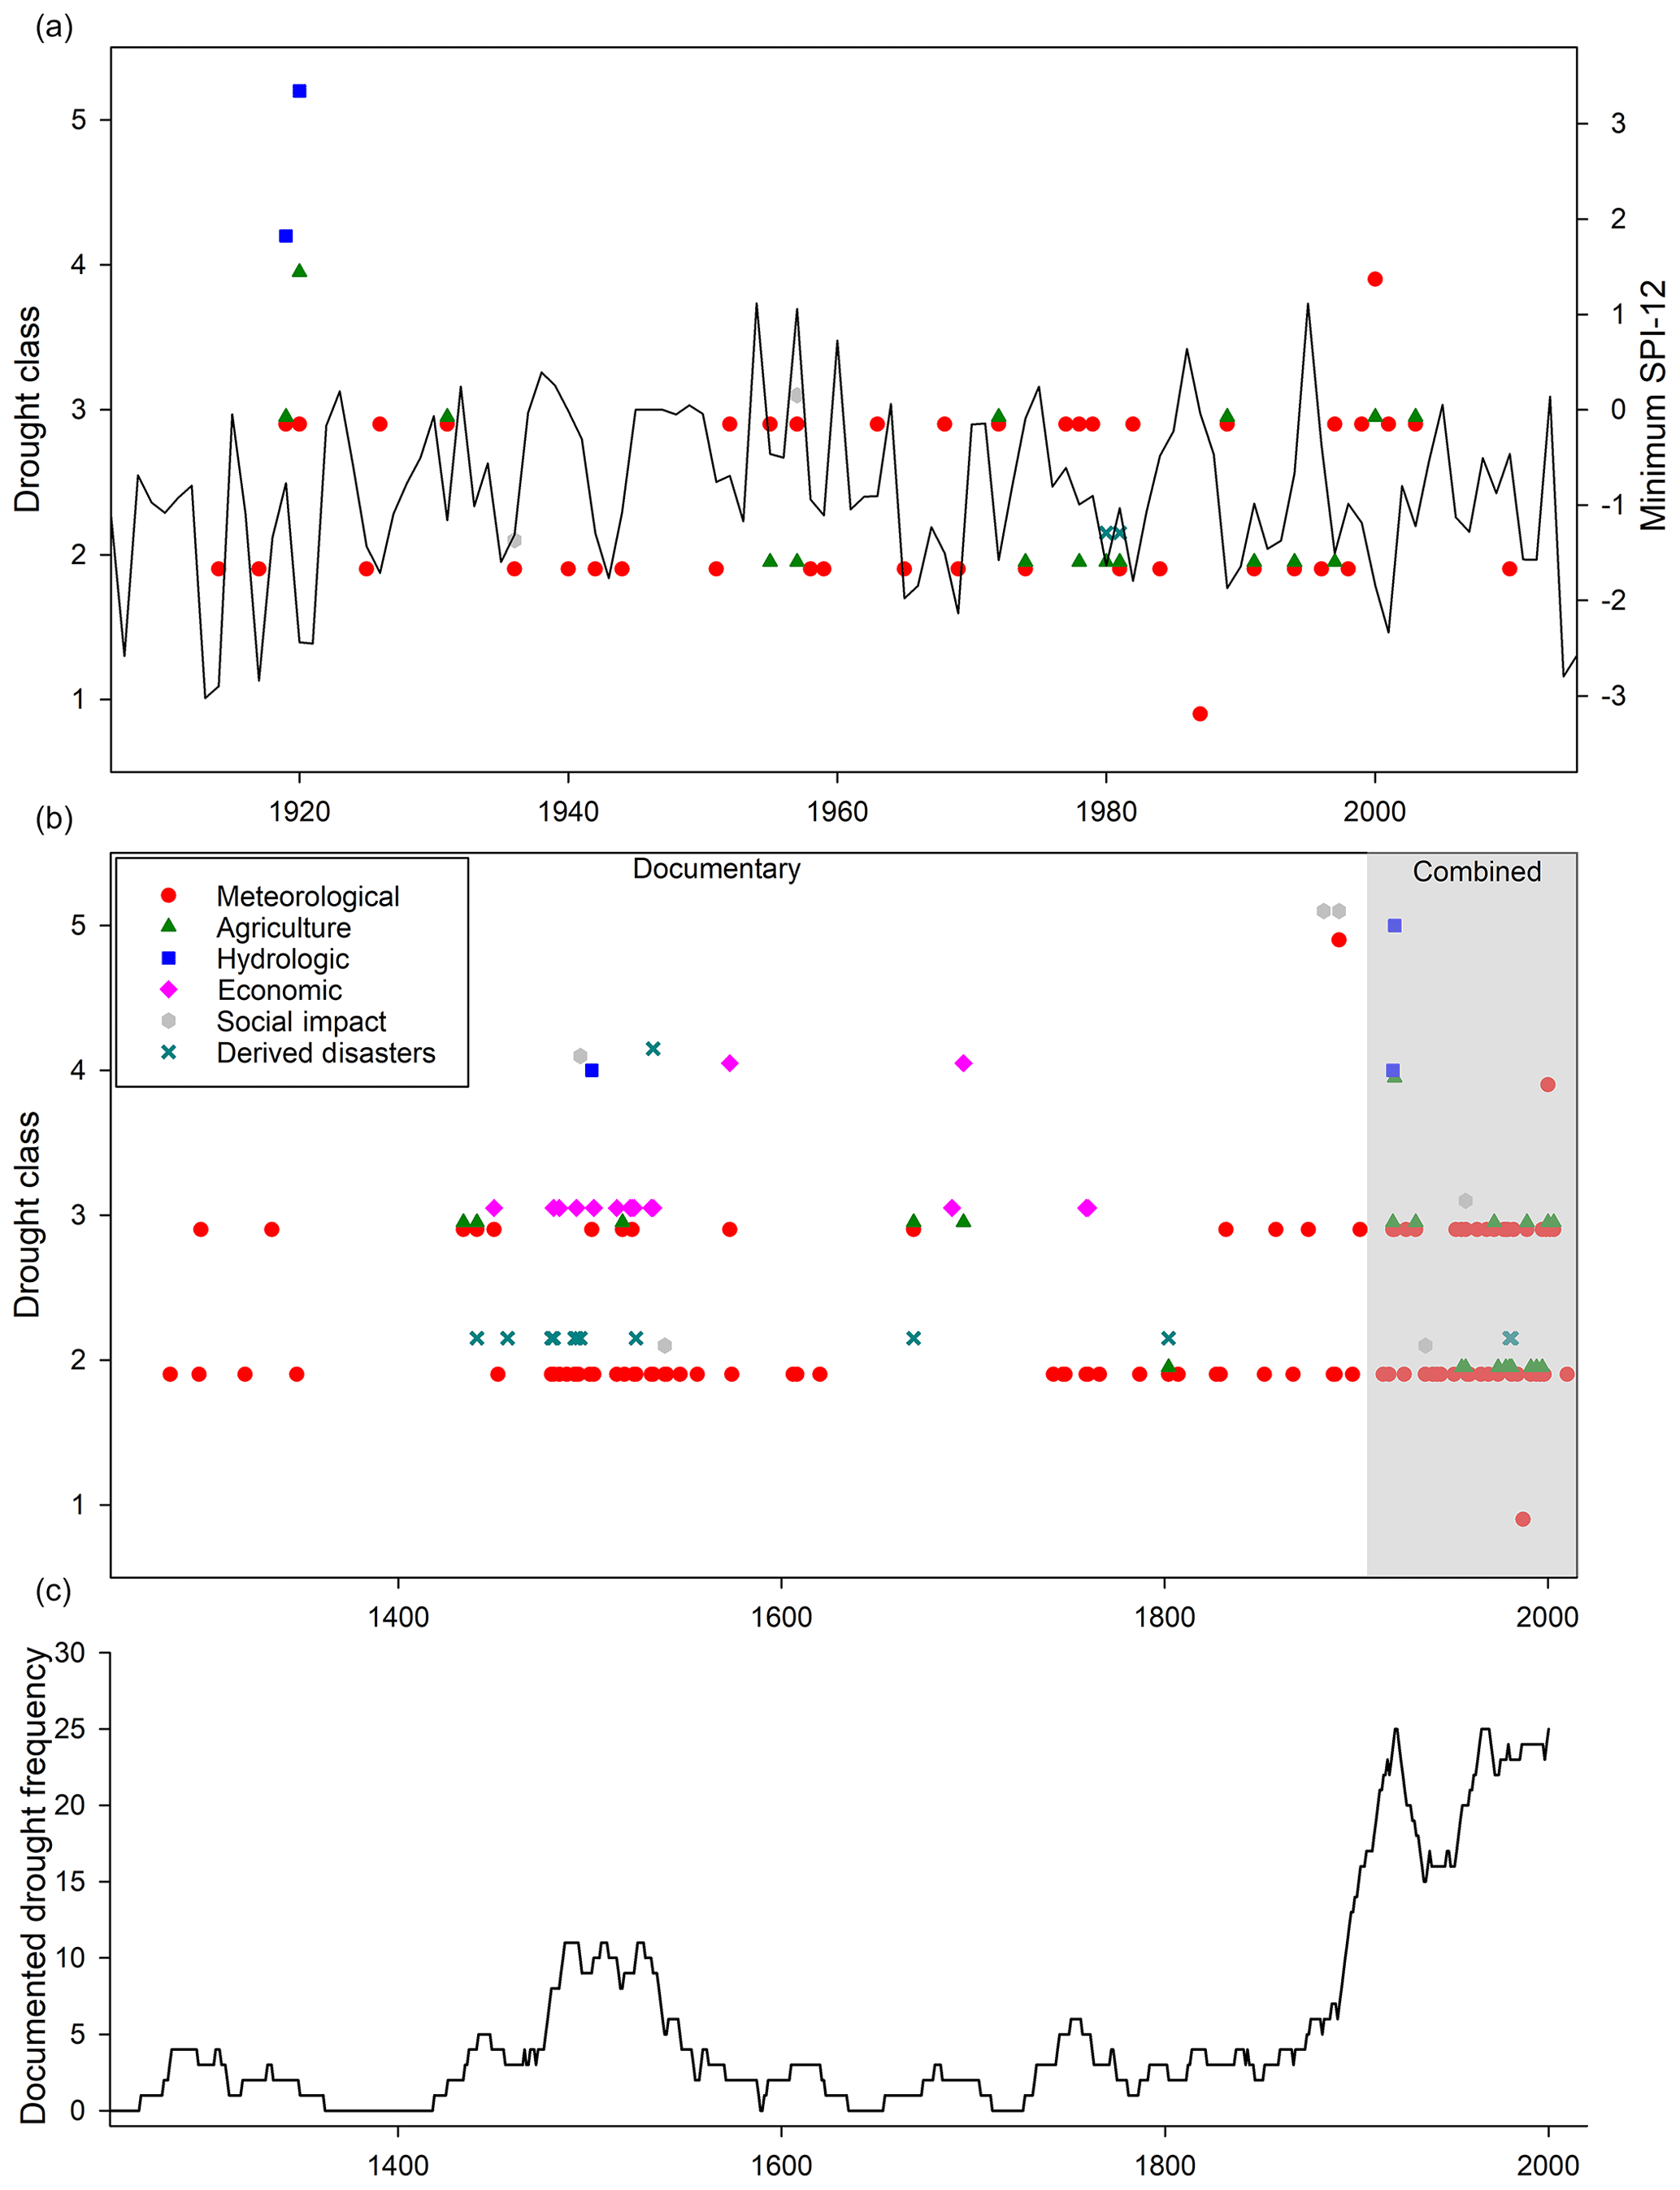
Figure 6Shenyang drought classification (colour/shape) for (a) combined archival and instrumental period (1906–2015) with minimum annual SPI-12, (b) augmented period (1200–2015), and (c) a running 30-year mean drought frequency (1200–2015).
There are few early records from the 13th and 14th centuries;
however, there is a small peak in Fig. 6c indicating that the region
experienced increased droughts, and, as Li (2019, p. 168) reflects, the period was one of “non-stop calamities” elsewhere in China. The low
number of accounts during this period for the Shenyang region may reflect
limited recording rather than non-occurrence. There is a clustering of
events during the 15th and 16th centuries, and these events are
evidenced across multiple drought types with several being class 3,
including droughts in 1434 and 1450 and the class 4 drought of
1501, which are described as follows:
“![]() ” (summer, Liaodong no rain, drought disaster. Although farmland sowed, most people do not have harvest
grain) (Ming Shi Lu Shi Zong Shi Lu, Vol. 112, No. 41),
“
” (summer, Liaodong no rain, drought disaster. Although farmland sowed, most people do not have harvest
grain) (Ming Shi Lu Shi Zong Shi Lu, Vol. 112, No. 41),
“![]() ” (summer May,
reduction and exemption of Shenyang and other regions summer taxes for
seven-tenths, autumn grain crops four-tenths)
(Ming Shi Lu Ying Zong Shi Lu, Vol. 192, No. 10),
and “
” (summer May,
reduction and exemption of Shenyang and other regions summer taxes for
seven-tenths, autumn grain crops four-tenths)
(Ming Shi Lu Ying Zong Shi Lu, Vol. 192, No. 10),
and “![]() ” (from spring to autumn, Liaodong no rain, the river and ditch dry up) (Ming Shi, Zhi Di Liu, Wu Hang San, No. 10).
” (from spring to autumn, Liaodong no rain, the river and ditch dry up) (Ming Shi, Zhi Di Liu, Wu Hang San, No. 10).
This drought period is coeval with a previously identified reduced monsoon phase in central China (Zhang et al., 2008a) and the Spörer period (1460–1550) of reduced solar activity which coincides with a cold phase in China as noted by H. Zhang et al. (2018). This represents a notable drought-rich phase with multiple types of droughts recorded (Fig. 6b, c), and it also coincides with a mega-drought identified across much of Europe (Cook et al., 2015) and parts of North America (Cook et al., 2014), suggesting that this drought may have extended across more of the Northern Hemisphere than previously identified.
A relative quiescent phase is then noted between 1600 and 1750 with few droughts recorded (Fig. 6b). Several droughts are identified in the period 1750–1880 CE; however, the frequency and severity of droughts increase after that (Fig. 6c). The first drought year with an assessment of class 5 occurs in March 1883, with the Shenyang chronicles referring to drought, a cholera epidemic and more than 20 000 deaths in a week (Shenyang Municipal People's Government Local Records Editing Office, 1989). This was followed by a second event in 1891 with documentary sources detailing famine and over 20 000 estimated deaths (Wen et al., 2005). Table 5 summarizes the frequency of droughts at Shenyang in each century with a small peak in drought frequency from 1501 to 1600 and drought frequency then decreasing until the 19th century (Fig. 6c).
Table 5The frequency of droughts in Shenyang since 1200 and associated drought classes (see Table 4). The average drought reflects the average class achieved for each period.

The frequency of class 5 drought events indicates an increase during the 20th century, but they are not evenly distributed with most (66 %) occurring in the period 1906–1921 (1907, 1913–1914, 1916–1918 and 1920–1921) and with only three severe (SPI-12, ) drought events after 1921 in Shenyang in 1968–1969, 1999–2002 and 2014–2015 (Fig. 6a). The documentary accounts in the period 1906–2015 provide valuable corroborative evidence when compared to the annual minimum SPI-12 data, with most documentary accounts identified as classes 2 and 3 and few events classified as either 1, 4 or 5. However, the presence and magnitude of the early droughts in the period 1906–1921 are corroborated by documentary accounts classed as 4 and 5, with documentary evidence in 2002 also supporting a class 4 drought.
The types of drought recorded within the records are indicated in Fig. 6b. These illustrate that the majority of records document meteorological drought conditions, followed by economic impacts. The drought severity in the descriptive accounts' places most of the documented droughts in classes 2 and 3 (Fig. 6b). The absence of deaths being documented restricts the number of class 5 socio-economic droughts, although the drought of 1920–1921 is documented as a class 5 hydrological drought, the only documentary class 5 event in the 20th century. It may be that information detailing the most severe aspects of past droughts was not published and/or that the droughts within Liaoning Province did not lead to such severe impacts as few events prior to the late 19th century approach class 5. In focussing on the city of Shenyang, there is also a risk that the impacts differed within the city to those experienced in rural communities within the province, thereby reducing the number of agricultural droughts documented. Future works should, therefore, focus on the provincial scale to incorporate a more extensive diversity of impact.
4.3 Societal vulnerability to droughts
The transformation of responses in Shenyang from pre-industrial (folk), to industrial (technological) and subsequently to post-industrial (Chester et al., 2012; White, 1974) during the period of study presents challenges in assessing and comparing impacts. Recent droughts of comparable meteorological severity, e.g. 2014 (SPI-12, −2.8), to those of the early 20th century, namely 1907 (−2.6), 1917 (−2.8) and 1921 (−2.5), illustrate how the responses and resulting impacts potentially changed. In analysing these events, the consequences of the droughts differed considerably; whilst they do not record deaths among the population in Shenyang and/or Liaoning Province, they are severe, with the 1920–1921 drought described as “spring drought for several months, well and river dries up, the land dries up, no harvest at all, winter disaster victims everywhere, people live in hunger, and could move out from the mountain village, village empty” (class 4 socio-economic drought but class 5-hydrological drought; Office of State Flood Control and Drought Relief, 1999, p. 388); across China, an estimated 500 000 people died (Edwards, 1922). Analysis of the international media at the time reporting on the event is shaped by the socio-political circumstances, with The Times (London) recording 3 million people being displaced (9 November 1920, p. 11); however, as Fuller (2011) importantly notes, this is often viewed from an international perspective, with local relief providers often failing to receive recognition. The responses to the drought varied but included those responses expected within an industrial framework, with both national and international relief occurring but also local support complementing pre-industrial responses, with the Shengjing Times (1920) reporting on 1 July that “Chief Zhang set up an altar begging for rain” (6080, p. 4). However, as Li (2007) notes in northern China, population increases without apparent agricultural intensification or expansion during the late 19th century may have contributed to an increased susceptibility to drought-associated harvest fluctuations. In comparison, during the 2014 drought which resulted in a level III emergency response, itself a notable difference from 1921 as a plan was in place, a number of responses were deployed to mitigate the impacts of the drought, and these included the provision of central and provincial relief funds (see Sect. 4.1), water transfer of 400 000 000 m3 from the Hun River, securing domestic and agricultural provisions (Sun, 2015), and the provision of relief service teams to support local infrastructure improvements, e.g. drilling new wells and supplying water to over 32 000 people suffering shortages (Wang, 2014). The impacts of the drought were widely reported in the media, with notable commentary focused on the impacts on water supplies and food production: “Food production in Liaoning … estimated to decline by 5 billion kg this year” (China Daily, 2014). Whilst both events, 1920–1921 and 2014, were severe droughts, the relief planning and coordinated effort coupled with improved infrastructure and a more stable socio-political environment facilitated a more efficient response.
4.4 Contemporary droughts and generating mechanisms
Analysis of contemporary droughts through coupled documentary sources and SPI provide valuable insights into the importance of drought severity and duration on associated impacts. The “severe drought” as defined by the SPI of 1968 (SPI-12, −2.13, duration 26 months) appears to have had a relatively limited impact in Liaoning Province, with few accounts recording particularly notable impacts beyond reduced agricultural output, whereas, interestingly, the drought of August 1979 to July 1983, whilst not as severe from the perspective of the SPI (−1.8) but of longer duration (47 months), receives greater coverage within the documentary accounts, possibly reflecting the duration and cumulative impact on agriculture. This argument is further supported as the drought of July 1999 to April 2002 (SPI −2.3, duration 34 months) receives similar levels of documentary coverage to that of 1979–1983 and July 2014–2015 (SPI −2.8; 18 months but extends beyond the end of the record) which also receives more detailed descriptions.
Documentary accounts often identify that droughts begin in the spring months, but the SPI results suggest that deficits often appear in the previous late summer (e.g. 1968–1969 and 1999–2002 droughts), suggesting that the impacts of the previous dry summer and/or autumn are not particularly noted within the documentary accounts, and it is only when the impacts are felt that the consequences are noted. Analysis of the seasonal precipitation to the seasonal ENSO3.4 series shows no significant correlations, but annual minimum SPI has a significant (95 % level) correlation with ENSO3.4 summer (p=0.0168) and autumn (p=0.0228) for the period 1906–2015. This may be explained by the accumulated SPI-12 which reflects a long-term deficit resulting in the severest elements of the drought materializing in summer/autumn; therefore, the correlation with summer and autumn ENSO3.4 is a reflection of a longer lagged drought accumulation process.
Our analysis capitalizes on the long-term instrumental and documentary accounts available for Shenyang and Liaoning Province in NE China by constructing homogenized precipitation (SPI) series for 1906–2015 and a long documentary drought series for 1200–2015. Previously documented notable droughts in the early 20th century (1907, 1916–1918, 1920–1921) are compared to the droughts of the last 2 decades (1999–2002 and 2014–2015), illustrating that these have comparable drought structures with duration potentially being more critical than the specific drought severity when considering the societal impacts. It illustrates that recent severe droughts (1999–2002 and 2014–2015), whilst notable, are not unusual within the region with several similar magnitude events in the early 20th century. Societally the most impactful droughts in the region occurred in the late 19th century (1883 and 1891) whilst appearing of comparable structure to those that occurred later (e.g. 1920–2021 and 2014–2015). However, the social and cultural circumstances of the late 19th century in the region resulted in more considerable social disruption and vulnerability. Reduced vulnerability to severe droughts is evident from the early 20th century as greater drought mitigation planning and central support are available (see responses to 1920–1921 and 2014–2015 droughts; Sect. 4.3). The relatively low number (one) of documentary accounts recording class 1 events reflects preferential recording of more notable events (classes 2–5). It remains challenging in any documentary analysis reconstructing climate as normal “mundane” conditions are often overlooked and therefore unrecorded. Further analysis is needed of the drought-rich phase identified around the start of the 16th century (Fig. 6c); whilst the impacts are not as prominent as those of the late 19th century, they are frequent and notable.
The calibration and augmentation of historical records with the instrumental series using the SPI present challenges. Whilst there appears to be a good agreement of drought classes 2–4, the probabilistic underpinning of the SPI inevitably ensures that some high-magnitude drought events are present (class 5). However, this is not necessarily reflected within the documentary sources for all drought types. The impact of the probabilistic SPI structure potentially over-recording class 5 events is mitigated to some degree by the application of a long precipitation series, in which the potential of such events to be recorded increases. Analysis of the documentary droughts in the late 19th century suggests that the duration is comparable to those of the early 20th century, with similar generating mechanisms, dry winter and/or spring followed by a hard drought in summer, and a duration often spanning multiple years. However, the impacts on the communities differ. The vulnerability of populations to drought changes notably over the study period, with the qualitative records and analysis capturing these changes. Therefore, where near the start of the recording period loss of life would have been more common, the same magnitude drought now does not result in loss of human life as resilience has increased. Our identification of a build-up period prior to the severest droughts (and their associated impacts) is notable, which is further reinforced by the significant relationship to summer and autumn ENSO3.4 and should be incorporated into future drought management plans, enabling the effective preparation of drought plans.
- -
Ming Shi, Zhi Di Liu, Wu Hang San, No. 10
- -
Ming Shi Lu Ying Zong Shi Lu, Vol. 192, No. 10
- -
Ming Shi Lu Shi Zong Shi Lu, Vol. 112, No. 41
- -
Ming Shi Lu Shi Zong Shi Lu, Vol. 353, No. 42
- -
Ming Shi Lu Shi Zong Shi Lu, Vol. 378
The precipitation series are available from Table 1 (NCAR, 1996). The second series (1961–2015) of daily precipitation was supplied by the National Disaster Reduction Centre of China, and data use and access were permitted through their involvement in project NE/P015484/1.
The supplement related to this article is available online at: https://doi.org/10.5194/cp-16-1917-2020-supplement.
LT undertook research, writing and analysis. NM, RC and HS supported LT in writing, data analysis and research approaches. NM, HS and RC were the PhD supervisors of LT at the University of Liverpool.
The authors declare that there is no conflict of interest.
This article is part of the special issue “Droughts over centuries: what can documentary evidence tell us about drought variability, severity and human responses?”. It is not associated with a conference.
Neil Macdonald and Rachel Gaulton were funded through NERC-GCRF (grant no. NE/P015484/1). LingYun Tang was supported by the China Scholarship Council studentship at the University of Liverpool and supervised by Neil Macdonald, Heather Sangster and Richard Chiverrell. We would like to thank the National Disaster Reduction Centre of China and the National Engineering Research Center for Information Technology in Agriculture for assistance within the DRIER-China project and data provision. We would also like to thank the four anonymous reviewers for their informed and thoughtful comments throughout.
This research has been supported by the NERC-GCRF (grant no. NE/P015484/1).
This paper was edited by Stefan Grab and reviewed by four anonymous referees.
Barker, L. J., Hannaford, J., Chiverton, A., and Svensson, C.: From meteorological to hydrological drought using standardised indicators, Hydrol. Earth Syst. Sci., 20, 2483–2505, https://doi.org/10.5194/hess-20-2483-2016, 2016.
Bavel, B. J. P., Curtis, D. R., Hannaford, M. J., Moatsos, M., Roosen, J., and Soens, T.: Climate and society in long-term perspective: Opportunities and pitfalls in the use of historical datasets, WIREs Clim Change, 10, e611, https://doi.org/10.1002/wcc.611, 2019.
Belal, A. A., El-Ramady, H. R., Mohamed, E. S., and Saleh, A. M.: Drought risk assessment using remote sensing and GIS techniques, Arab. J. Geosci., 7, 35–53, https://doi.org/10.1007/s12517-012-0707-2, 2014.
Black, A. R. and Law, F. M.: Development and utilization of a national web-based chronology of hydrological events/Développement et utilisation sur internet d'une chronologie nationale d'événements hydrologiques, Hydroogl. Sci. J., 49, 237–246, https://doi.org/10.1623/hysj.49.2.237.34835, 2004.
Bloomfield, J. P. and Marchant, B. P.: Analysis of groundwater drought building on the standardised precipitation index approach, Hydrol. Earth Syst. Sci., 17, 4769–4787, https://doi.org/10.5194/hess-17-4769-2013, 2013.
Bohle, H. G., Downing, T. E., and Michael, J.: Climate change and social vulnerability, Global Environmental Change, 4, 37–48, https://doi.org/10.1016/0959-3780(94)90020-5, 1994.
Bradley, R. S.: Book Review: A compendium of Chinese meteorological records of the last 3,000 years, The Holocene, 16, 621–622, https://doi.org/10.1177/095968360601600415, 2006.
Brázdil, R., Trnka, M., Dobrovolný, P., Chromá, K., Hlavinka, P., and Žalud, Z.: Variability of droughts in the Czech Republic, 1881–2006, Theor. Appl. Climatol., 97, 297–315, https://doi.org/10.1007/s00704-008-0065-x, 2009.
Brázdil, R., Možný, M., Klír, T., Řezníčková, L., Trnka, M., Dobrovolný, P., and Kotyza, O.: Climate variability and changes in the agricultural cycle in the Czech Lands from the sixteenth century to the present, Theor. Appl. Climatol., 136, 553–573, https://doi.org/10.1007/s00704-018-2508-3, 2018a.
Brázdil, R., Kiss, A., Luterbacher, J., Nash, D. J., and Řezníčková, L.: Documentary data and the study of past droughts: a global state of the art, Clim. Past, 14, 1915–1960, https://doi.org/10.5194/cp-14-1915-2018, 2018b.
Brázdil, R., Kiss, A., Řezníčková, L., and Barriendos, M.: Droughts in Historical Times in Europe, as Derived from Documentary Evidence, in: Palaeohydrology. Geography of the Physical Environment, edited by: Herget, J. and Fontana, A., Springer, Cham, 65–96, 2020.
De Châtel, F.: The Role of Drought and Climate Change in the Syrian Uprising: Untangling the Triggers of the Revolution, Middle Eastern Stud., 50, 521–535, https://doi.org/10.1080/00263206.2013.850076, 2014.
Chen, T., Xia, G., Wilson, L. T., Chen, W., and Chi, D.: Trend and Cycle Analysis of Annual and Seasonal Precipitation in Liaoning, China, Adv. Meteorol., 2016, 5170563, https://doi.org/10.1155/2016/5170563, 2016.
Chester, D. K., Duncan, A. M., and Sangster, H.: Human responses to eruptions of Etna (Sicily) during the late-Pre-Industrial Era and their implications for present-day disaster planning, J. Volcanol. Geoth. Res., 225–226, 65–80, https://doi.org/10.1016/j.jvolgeores.2012.02.017, 2012.
Cook, B. I., Smerdon, J. E., Seager, R., and Cook, E. R.: Pan-Continental Droughts in North America over the Last Millennium, J. Climate, 27, 383–397, https://doi.org/10.1175/JCLI-D-13-00100.1, 2014.
Cook, E. R., Seager, R., Kushnir, Y., Briffa, K. R., Büntgen, U., Frank, D., Krusic, P. J., Tegel, W., Schrier, G. Vander, Andreu-Hayles, L., Baillie, M., Baittinger, C., Bleicher, N., Bonde, N., Brown, D., Carrer, M., Cooper, R., Eùfar, K., DIttmar, C., Esper, J., Griggs, C., Gunnarson, B., Günther, B., Gutierrez, E., Haneca, K., Helama, S., Herzig, F., Heussner, K. U., Hofmann, J., Janda, P., Kontic, R., Köse, N., Kyncl, T., Levaniè, T., Linderholm, H., Manning, S., Melvin, T. M., Miles, D., Neuwirth, B., Nicolussi, K., Nola, P., Panayotov, M., Popa, I., Rothe, A., Seftigen, K., Seim, A., Svarva, H., Svoboda, M., Thun, T., Timonen, M., Touchan, R., Trotsiuk, V., Trouet, V., Walder, F., Wany, T., Wilson, R., and Zang, C.: Old World megadroughts and pluvials during the Common Era, Science Advances, 1, e1500561, https://doi.org/10.1126/sciadv.1500561, 2015.
Dai, A.: Drought under global warming: A review, WIREs Clim Change, 2, 45–65, https://doi.org/10.1002/wcc.81, 2011.
Delbiso, T. D., Rodriguez-Llanes, J. M., Donneau, A. F., Speybroeck, N., and Guha-Sapir, D.: Drought, conflict and children's undernutrition in Ethiopia 2000–2013: A meta-analysis, B. World Health Organ., 95, 94–102, https://doi.org/10.2471/BLT.16.172700, 2017.
Edwards, D. W.: The North China Famine of 1920–1921, with Special Reference to the West Chihli Area: Being the Report of the Peking United International Famine Relief Committee, Commercial Press works Limited, Peking, available at: https://www.worldcat.org/title/north-china-famine-of-1920-1921-with-special-reference-to-the-west-chihli-area-being-the-report-of-the-peking-united-international-famine-relief-committee/oclc/5452960 (last access: 10 April 2019), 1922.
EM-DAT: The Emergency Events Database, edited by: Guha-Sapir, D., EM-DAT Emerg. Events Database, Brussels, Belgium, available at: https://www.emdat.be/, last access: 6 August 2019.
Fuller, P.: “Barren Soil, Fertile Minds”: North China Famine and Visions of the “Callous Chinese” Circa 1920, Int. Hist. Rev., 33, 453–472, https://doi.org/10.1080/07075332.2011.595236, 2011.
Ge, Q.-S., Zheng, J.-Y., Hao, Z.-X., Zhang, P.-Y., and Wang, W.-C.: Reconstruction of Historical Climate in China: High-Resolution Precipitation Data from Qing Dynasty Archives, B. Am. Meteorol. Soc., 86, 671–680, https://doi.org/10.1175/bams-86-5-671, 2005.
Guttman, N. B.: Comparing the palmer drought index and the standardized precipitation index, J. Am. Water Resour. As., 34, 113–121, https://doi.org/10.1111/j.1752-1688.1998.tb05964.x, 1998.
Hanel, M., Rakovec, O., Markonis, Y., Máca, P., Samaniego, L., Kyselý, J., and Kumar, R.: Revisiting the recent European droughts from a long-term perspective, Scientific Reports, 8, 9499, https://doi.org/10.1038/s41598-018-27464-4, 2018.
Harvey-Fishenden, A., Macdonald, N., and Bowen, J. P.: Dry weather fears of Britain's early “industrial” canal network, Reg. Environ. Change, 19, 2325–2337, https://doi.org/10.1007/s10113-019-01524-5, 2019.
He, B., Lü, A., Wu, J., Zhao, L., and Liu, M.: Drought hazard assessment and spatial characteristics analysis in China, J. Geogr. Sci., 21, 235–249, https://doi.org/10.1007/s11442-011-0841-x, 2011.
He, X., Wada, Y., Wanders, N., and Sheffield, J.: Intensification of hydrological drought in California by human water management, Geophys. Res. Lett., 44, 1777–1785, https://doi.org/10.1002/2016GL071665, 2017.
Heim, R. R.: A review of twentieth-century drought indices used in the United States, B. Am. Meteorol. Soc., 1149-1166, 2002.
Homer-Dixon, T. F.: Environmental Scarcities and Violent Conflict: Evidence from cases, Int. Security, 19, 1–36, 1994.
Janku, A.: Drought and famine in northwest china: a late Victorian tragedy?, Journal of Chinese History, 2, 373–391, https://doi.org/10.1017/jch.2018.4, 2018.
Keenan, S. P. and Krannich, R. S.: The Social Context of Perceived Drought Vulnerability, Rural Sociol., 62, 69–88, https://doi.org/10.1111/j.1549-0831.1997.tb00645.x, 2010.
Kjeldsen, T. R., Macdonald, N., Lang, M., Mediero, L., Albuquerque, T., Bogdanowicz, E., Brazdil, R., Castellarin, A., David, V., Fleig, A., Gül, G. O., Kriauciuniene, J., Kohnová, S., Merz, B., Nicholson, O., Roald, L. A., Salinas, J. L., Sarauskiene, D., Šraj, M., Strupczewski, W., Szolgay, J., Toumazis, A., Vanneuville, W., Veijalainen, N., and Wilson, D.: Documentary evidence of past floods in Europe and their utility in flood frequency estimation, J. Hydrol., 517, 963–973, https://doi.org/10.1016/j.jhydrol.2014.06.038, 2014.
Kreibich, H., Blauhut, V., Aerts, J. C. J. H., Bouwer, L. M., Van Lanen, H. A. J., Mejia, A., Mens, M., and Van Loon, A. F.: How to improve attribution of changes in drought and flood impacts, Hydrolog. Sci. J., 64, 1–18, https://doi.org/10.1080/02626667.2018.1558367, 2019.
Lennard, A. T., Macdonald, N., Clark, S., and Hooke, J. M.: The application of a drought reconstruction in water resource management, Hydrol. Res., 47, 646–659, https://doi.org/10.2166/nh.2015.090, 2016.
Li, B. and Meng, Q.: China Meteorological Disasters Ceremony (Liaoning volume), China Meteorological Press, Beijing, 2005.
Li, J., Ren, G. Y., Ren, Y. Y., and Zhang, L.: Effect of data homogenization on temperature trend estimation and urban bias at Shenyang Station, Transactions of Atmospheric Sciences, 37, 297–303, 2014.
Li, L. M.: Fighting Famine in North China State, Market, and Environmental Decline, 1690s–1990s, Stanford University Press, Stanford, 2007.
Li, T.: The Mongol Yuan Dynasty and the Climate, 1260–1360, in: The Crisis of the 14th Century, De Gruyter, Berlin, 153–168, 2019.
Li, Y., Strapasson, A., and Rojas, O.: Assessment of El Niño and La Niña impacts on China: Enhancing the Early Warning System on Food and Agriculture, Weather and Climate Extremes, 27, 100208, https://doi.org/10.1016/J.WACE.2019.100208, 2019.
Liang, L., Li, L., and Liu, Q.: Precipitation variability in Northeast China from 1961 to 2008, J. Hydrol., 404, 67–76, https://doi.org/10.1016/j.jhydrol.2011.04.020, 2011.
Lloyd-Hughes, B.: The impracticality of a universal drought definition, Theor Appl Climatol., 117, 607–611, https://doi.org/10.1007/s00704-013-1025-7, 2014.
Lloyd-Hughes, B. and Saunders, M. A.: A drought climatology for Europe, Int. J. Climatol., 22, 1571–1592, https://doi.org/10.1002/joc.846, 2002.
Loorbach, D., Kemp, R., Wilson, S., et al.: At Risk: natural hazards, people's vulnerability and disasters, Challenges, 33, 1–5, https://doi.org/10.1080/10417946809371961, 2011.
Mckee, T. B., Doesken, N. J., and Kleist, J.: The relationship of drought frequency and duration to time scales, in: Eighth Conference on Applied Climatology, 17–22 January 1993, Anaheim, California, 179–184, available at: https://www.droughtmanagement.info/literature/AMS_Relationship_Drought_Frequency_Duration_Time_Scales_1993.pdf (last access: 13 August 2018), 1993.
Mechler, R. and Bouwer, L. M.: Understanding trends and projections of disaster losses and climate change: is vulnerability the missing link?, Clim. Change, 133, 23–35, https://doi.org/10.1007/s10584-014-1141-0, 2015.
Meng, J.: Shenyang Chronicles, Integrated volume one, Shenyang Publishing House, Shenyang, 1989.
Mishra, A. K. and Singh, V. P.: A review of drought concepts, J. Hydrol., 391, 202–216, https://doi.org/10.1016/j.jhydrol.2010.07.012, 2010.
Moreira, E. E., Coelho, C. A., Paulo, A. A., Pereira, L. S., and Mexia, J. T.: SPI-based drought category prediction using loglinear models, J. Hydrol., 354, 116–130, https://doi.org/10.1016/J.JHYDROL.2008.03.002, 2008.
Nash, D. J., Pribyl, K., Klein, J., Neukom, R., Endfield, G. H., Adamson, G. C. D., and Kniveton, D. R.: Seasonal rainfall variability in southeast Africa during the nineteenth century reconstructed from documentary sources, Clim. Change, 134, 605–619, https://doi.org/10.1007/s10584-015-1550-8, 2016.
National Standards of People's Republic of China: Grades of meteorological drought, GB/T 20481-201, 26 pp., 2017.
NCAR (Carbon Dioxide Information Analysis Center/Environmental Sciences Division/Oak Ridge National Laboratory/U. S. Department of Energy): Two Long-Term Instrumental Climatic Data Bases of the People's Republic of China, Research Data Archive at the National Center for Atmospheric Research, Computational and Information Systems Laboratory, Boulder, CO, available at: https://rda.ucar.edu/datasets/ds578.5/ (last access: 10 December 2018), 1996.
Noone, S., Broderick, C., Duffy, C., Matthews, T., Wilby, R. L., and Murphy, C.: A 250-year drought catalogue for the island of Ireland (1765–2015), Int. J. Climatol., 37, 239–254, https://doi.org/10.1002/joc.4999, 2017.
Office of State Flood Control and Drought Relief, Bureau of Hydrology and Water Resources Survey of Liaoning Province: Liaoning Flood and Drought Disaster, Shenyang, 1999.
Palmer, W. C.: Meteorological Drought, Washington, DC, available at: https://www.ncdc.noaa.gov/temp-and-precip/drought/docs/palmer.pdf (last access: 7 August 2018), 1965.
Parry, S., Hannaford, J., Lloyd-Hughes, B., and Prudhomme, C.: Multi-year droughts in Europe: analysis of development and causes, Hydrol. Res., 43, 689, https://doi.org/10.2166/nh.2012.024, 2012.
Pfister, C.: The vulnerability of past societies to climatic variation: a new focus for historical climatology in the twenty-first century, Clim. Change, 100, 25–31, https://doi.org/10.1007/s10584-010-9829-2, 2010.
Pu, Z.: Extraordinary drought in Liaoning Province during 2000, Liaoning Science and Technology Publishing House, Shenyang, 2001.
Rayner, N. A., Parker, D. E., Horton, E. B., Folland, C. K., Alexander, L. V., Rowell, D. P., Kent, E. C., and Kaplan, A.: Global analyses of sea surface temperature, sea ice, and night marine air temperature since the late nineteenth century, J. Geophys. Res., 108, 4407, https://doi.org/10.1029/2002JD002670, 2003.
Sangster, H., Jones, C., and Macdonald, N.: The co-evolution of historical source materials in the geophysical, hydrological and meteorological sciences: Learning from the past and moving forward, Prog. Phys. Geog., 42, 61–82, https://doi.org/10.1177/0309133317744738, 2018.
Savitzky, A. and Golay, M. J. E.: Smoothing and Differentiation of Data by Simplified Least Squares Procedures, Anal. Chem., 36, 1627–1639, https://doi.org/10.1021/ac60214a047, 1964.
Schubert, S. D., Suarez, M. J., Pegion, P. J., Koster, R. D., and Bacmeister, T.: On the Cause of the 1930s Dust Bowl, Science, 303, 1855–1859, https://doi.org/10.1126/science.1095048, 2004.
Shengjing Times: Drought, Issue 6080, p. 4, 1st July 1920.
Shenyang Municipal People's Government Local Records Office: Shenyang chronicle (volume eight), Shenyang, 1998.
Shenyang Municipal People's Government Local Records Office (1994–2011): Shenyang chronicles, Shenyang, 2011.
Stagge, J. H., Tallaksen, L. M., Gudmundsson, L., Van Loon, A. F., and Stahl, K.: Candidate Distributions for Climatological Drought Indices (SPI and SPEI), Int. J. Climatol., 35, 4027–4040, https://doi.org/10.1002/joc.4267, 2015.
Sun, Y.: 2014 China Drought and Drought Relief Operations, China Flood Drought Manag., 25, 21–24, 2015.
Tan, X.: Historical materials of Drought Archives in the Qing Dynasty., China Book Publishing House, Beijing., 2013.
Teklu, T., Von Braun, J., and Zaki, E.: Drought and famine relationships in Sudan: Policy implications, Food and Nutrition Bulletin, IFPRI report, 14, 1–3, 1992.
Todd, B., Macdonald, N., Chiverrell, R. C., Caminade, C., and Hooke, J. M.: Severity, duration and frequency of drought in SE England from 1697 to 2011, Clim. Change, 121, 673–687, 2013.
Trnka, M., Hayes, M., Jurečka, F., Bartošová, L., Anderson, M., Brázdil, R., Brown, J., Camarero, J., Cudlín, P., Dobrovolný, P., Eitzinger, J., Feng, S., Finnessey, T., Gregorič, G., Havlik, P., Hain, C., Holman, I., Johnson, D., Kersebaum, K., Ljungqvist, F., Luterbacher, J., Micale, F., Hartl-Meier, C., Možný, M., Nejedlik, P., Olesen, J., Ruiz-Ramos, M., Rötter, R., Senay, G., Vicente-Serrano, S., Svoboda, M., Susnik, A., Tadesse, T., Vizina, A., Wardlow, B., Žalud, Z., and Büntgen, U.: Priority questions in multidisciplinary drought research, Clim. Res., 75, 241–260, https://doi.org/10.3354/cr01509, 2018.
van Lanen, H. A. J.: Drought propagation through the hydrological cycle, in: Climate Variability and Change–Hydrological Impacts, Proceedings of the Fifth FRIEND World Conference, Havana, Cuba, November 2006, IAHS Publ. 308, 122–127, 2006.
Van Loon, A. F., Stahl, K., Di Baldassarre, G., Clark, J., Rangecroft, S., Wanders, N., Gleeson, T., Van Dijk, A. I. J. M., Tallaksen, L. M., Hannaford, J., Uijlenhoet, R., Teuling, A. J., Hannah, D. M., Sheffield, J., Svoboda, M., Verbeiren, B., Wagener, T., and Van Lanen, H. A. J.: Drought in a human-modified world: reframing drought definitions, understanding, and analysis approaches, Hydrol. Earth Syst. Sci., 20, 3631–3650, https://doi.org/10.5194/hess-20-3631-2016, 2016.
Vicente-Serrano, S. M., Beguería, S., López-Moreno, J. I., Vicente-Serrano, S. M., Beguería, S., and López-Moreno, J. I.: A Multiscalar Drought Index Sensitive to Global Warming: The Standardized Precipitation Evapotranspiration Index, J. Climate, 23, 1696–1718, https://doi.org/10.1175/2009JCLI2909.1, 2010.
Vicente-Serrano, S. M., Lopez-Moreno, J.-I., Beguería, S., Lorenzo-Lacruz, J., Sanchez-Lorenzo, A., García-Ruiz, J. M., Azorin-Molina, C., Morán-Tejeda, E., Revuelto, J., Trigo, R., Coelho, F., and Espejo, F.: Evidence of increasing drought severity caused by temperature rise in southern Europe, Environ. Res. Lett., 9, 044001, https://doi.org/10.1088/1748-9326/9/4/044001, 2014.
Wang, F.: Spring Drought Report of Liaoning Province in 2001, Liaoning Science and Technology Publishing House, Shenyang, 2002.
Wang, M. and Pu, W.: History of Ancient Traffic in Northeast China and Northeast Asia, Liaoning People's Publishing House, Shenyang, 2016.
Wang, P. K., Lin, K. H. E., Liao, Y. C., Liao, H. M., Lin, Y. S., Hsu, C. T., Hsu, S. M., Wan, C. W., Lee, S. Y., Fan, I. C., Tan, P. H., and Ting, T. T.: Construction of the reaches climate database based on historical documents of China, Scientific Data, 5, 180288, https://doi.org/10.1038/sdata.2018.288, 2018.
Wang, Y.: Causes of summer drought in Liaoning Province in 2014 and countermeasures', China Flood Drought Manag., 24, 9–11, 2014.
Wang, Y., Zhao, W., Zhang, Q., and Yao, Y.: Characteristics of drought vulnerability for maize in the eastern part of Northwest China, Scientific Reports volume 9, 964, https://doi.org/10.1038/s41598-018-37362-4, 2019.
White, G. F.: Natural hazards, local, national, global, Oxford University Press, Oxford, 1974.
Wilhelm, B., Ballesteros Cánovas, J. A., Macdonald, N., Toonen, W. H. J., Baker, V., Barriendos, M., Benito, G., Brauer, A., Corella, J. P., Denniston, R., Glaser, R., Ionita, M., Kahle, M., Liu, T., Luetscher, M., Macklin, M., Mudelsee, M., Munoz, S., Schulte, L., St. George, S., Stoffel, M., and Wetter, O.: Interpreting historical, botanical, and geological evidence to aid preparations for future floods, WIREs Water, 6, e1318, https://doi.org/10.1002/wat2.1318, 2018.
Wilhite, D. A. (Ed.): Drought as a Natural Hazard: Concepts and Definitions, chap. 1, in: Drought: A Global Assessment, Routledge, London, Vol. I, 3–18, 2000.
Wilhite, D. A. and Glantz, M. H.: Understanding: the Drought Phenomenon: The Role of Definitions, Water Int., 10, 111–120, https://doi.org/10.1080/02508068508686328, 1985.
Wittfogel, K. A.: Meteorological Records from the Divination Inscriptions of Shang, Geogr. Rev., 30, 110–133, https://doi.org/10.2307/210452, 1940.
Wolski, P.: How severe is Cape Town's “Day Zero” drought?, Significance, 15, 24–27, https://doi.org/10.1111/j.1740-9713.2018.01127.x, 2018.
World Meteorological Organization (WMO): Standardized Precipitation Index User Guide, (M. Svoboda, M. Hayes and D. Wood), WMO-No. 1090, Geneva, available at: http://www.droughtmanagement.info/literature/WMO_standardized_precipitation_index_user_guide_en_2012.pdf (last access: 9 August 2019), 2012.
Yan, J. H., Liu, H. L., Hao, Z. X., Zhang, X. Z., and Zheng, J. Y.: Climate extremes revealed by Chinese historical documents over the middle and lower reaches of the Yangtze river in winter 1620, Advances in Climate Change Research, 5, 118–122, https://doi.org/10.1016/j.accre.2014.11.001, 2014.
Yan, W.: The historical memory of Shenyang place names all the way from ancient times, Chinese Place Names, 9, 31–33, 2012.
Yang, J., Friedman, E., Guo, J., and Mosher, S.: Tombstone: The Great Chinese Famine, 1958–1962, Farrar, Straus and Giroux, available at: https://books.google.co.uk/books?id=nadqrYU10eMC&redir_esc=y (last access: 19 July 2019), 2012.
Zaidman, M. D., Rees, H. G., and Young, A. R.: Spatio-temporal development of streamflow droughts in north-west Europe, Hydrol. Earth Syst. Sci., 6, 733–751, https://doi.org/10.5194/hess-6-733-2002, 2002.
Zhang, D.: A compendium of Chinese meteorological records of the last 3,000 years, Jiangsu Education Publishing House, Nanjing, China, 2004.
Zhang, D.: A Compendium of Chinese Meteorological Records of the Last 3000 Years, Phoenix House Ltd., Jiangsu, China, 2013 (in Chinese).
Zhang, H., Werner, J. P., García-Bustamante, E., González-Rouco, F., Wagner, S., Zorita, E., Fraedrich, K., Jungclaus, J. H., Ljungqvist, F. C., Zhu, X., Xoplaki, E., Chen, F., Duan, J., Ge, Q., Hao, Z., Ivanov, M., Schneider, L., Talento, S., Wang, J., Yang, B., and Luterbacher, J.: East Asian warm season temperature variations over the past two millennia, Scientific Reports, 8, 7702, https://doi.org/10.1038/s41598-018-26038-8, 2018.
Zhang, J., Chen, H., and Zhang, Q.: Extreme drought in the recent two decades in northern China resulting from Eurasian warming, Clim. Dynam., 52, 2885–2902, https://doi.org/10.1007/s00382-018-4312-2, 2019.
Zhang, L., Wu, P., Zhou, T., Xiao, C., Zhang, L., Wu, P., Zhou, T., and Xiao, C.: ENSO Transition from La Niña to El Niño Drives Prolonged Spring–Summer Drought over North China, J. Climate, 31, 3509–3523, https://doi.org/10.1175/JCLI-D-17-0440.1, 2018.
Zhang, P., Cheng, H., Edwards, R. L., Chen, F., Wang, Y., Yang, X., Liu, J., Tan, M., Wang, X., Liu, J., An, C., Dai, Z., Zhou, J., Zhang, D., Jia, J., Jin, L., and Johnson, K. R.: A test of climate, sun, and culture relationships from an 1810-year Chinese cave record, Science, 322, 940–942, https://doi.org/10.1126/science.1163965, 2008a.
Zhang, S. F., Su, Y. S., Song, D. D., Zhang, Y. Y., Song, H. Z., and Gu, Y.: China historical drought 1949–2000, Hohai University Press, Nanjing, 2008b.
Zhao, H.: Xuan Tu Tai Shou Kao Lv, Historiography, 2, 89–93, 2006.
Zheng, J., Wang, W. C., Ge, Q., Man, Z., and Zhang, P.: Precipitation variability and extreme events in eastern China during the past 1500 years, Terr. Atmos. Ocean. Sci., 17, 579–592, https://doi.org/10.3319/TAO.2006.17.3.579(A), 2006.
Zou, D.: Shenyang chronicles 1986–2005, Shenyang Publishing House, Shenyang, Vol. 1, 2010.