the Creative Commons Attribution 4.0 License.
the Creative Commons Attribution 4.0 License.
 | 10 Jul 2020
Reconstructions of droughts in Germany since 1500 – combining hermeneutic information and instrumental records in historical and modern perspectives
Rüdiger Glaser
Michael Kahle
The present article deals with the reconstruction of drought time series in Germany since 1500. The reconstructions are based on historical records from the virtual research environment Tambora (tambora.org, 2018) and official instrumental records. The historical records and recent data were related to each other through modern index calculations, drought categories and their historical equivalents.
Historical and modern written documents are also taken into account to analyze the climatic effects and consequences on the environment and society. These pathways of effects are derived and combined with different drought categories.
The derived historical precipitation index (HPI) is correlated with the standardized precipitation index (SPI). Finally, a historical drought index (HDI) and a historical wet index (HWI) are derived from the basic monthly precipitation index (PI) from 1500 onward. Both are combined for the historical humidity index (HHI). On this basis, the long-term development of dryness and drought in Germany since 1500, as well as medium-term deviations of drier and wetter periods and individual extreme events, is presented and discussed.
- Article
(4267 KB) - Full-text XML
- BibTeX
- EndNote


In Central Europe, exceptionally extreme droughts such as in 2018, 2015 and 2003 have occurred quite often in recent years (Erfurt et al., 2019; Blauhut et al., 2015, 2016). The comparatively dense sequence raises the question of the extent to which this is another indicator of climate change. The overall damage adds up to 8 billion dollars, with agriculture and forestry being primarily affected. Ongoing droughts also have negative consequences on water balance and water supply, ecology, the economy, and society. Over recent years, health issues, as well as the impacts on infrastructure and transportation, have been discussed (Bachmair et al., 2016; Stagge et al., 2015a; Van Dijk et al., 2013).
In addition to many climatological, ecological and social specifications, long-term reconstructions of droughts are helpful for a better, more holistic understanding. They contribute significantly to answering questions about long-term trends, accumulations, recurrence times and the variability of extreme events. There is also evidence of societal contextualization, especially the impacts on and responses of the environment and societies which have changed fundamentally through time (Erfurt et al., 2019).
Droughts are generally referred to as periods of extremely dry weather that persist long enough to cause a severe deficit in the water balance which in turn causes environmental and social impacts and damage (Wilhite, 2000; Erfurt et al., 2019). From a statistical point of view, a drought is an exceptional event with a rare recurrence probability (Benestad, 2003). According to a widely used scheme, droughts are subdivided into four types that reflect their chronological development. A meteorological drought describes a period of considerable precipitation deficit usually in comparison with a reference period. High air temperatures and wind speeds, intensive solar radiation, and cloudless skies can aggravate the precipitation deficit (Wilhite, 2000). With a continued duration, the amount of soil water available for plants is reduced with negative effects on plant growth and harvest yields. In this case, we speak of an agricultural drought (Bernhofer et al., 2015). If the drought continues to progress, reduced surface runoff, sinking water levels and ultimately sinking groundwater levels occur – a so-called hydrological drought. Lastly, extremely low groundwater levels or baseline flows are referred to as groundwater droughts. Additionally, the term “socio-economic drought” is used when it comes to impacts on people and the environment. The degree of severity depends on the assets, adjustment options and resilience of the affected society (Wilhite, 2000; McKee et al., 1993).
Droughts can be defined numerically according to very different criteria, which result in a large number of indices. They differ in the type of input data, temporal and spatial coverage, and the consequences for different sectors. While the input data used for meteorological droughts are temperature and precipitation, assessments of hydrological droughts are based on gauging data, groundwater levels and runoff. The timeframes range from days to weeks and months to years (Bernhofer et al., 2015). Similarly, the size of the study area varies according to the question.
Common drought indices include the standardized precipitation index (SPI), the standardized precipitation–evapotranspiration index (SPEI) and the Palmer Drought Severity Index (PDSI). In the US, the PDSI is the most common drought index, which is also used as the basis for the US Drought Monitor (Palmer, 1965; McKee et al., 1993; Vicente-Serrano et al., 2010; Zargar et al., 2011; Svoboda et al., 2012). The German Drought Monitor (Dürremonitor Deutschland) represents the current monthly status of the soil in five drought categories (Zink et al., 2016; DWD, 2019). Moreover, drought assessments also examine ecological and social consequences (Stahl et al., 2016).
The strengths and weaknesses of the SPI are widely discussed in the literature (Briffa et al., 1994; Cook et al., 2015). Cook et al. (2015) and Mikšovský et al. (2019), for example, used the more complex self-calibrated PDSI (scPDSI), which needs, inter alia, soil water information and additional temperature data. The present study is based on the SPI because of its wide distribution, simple calculation and ability to integrate historical events.
Numerous studies on droughts with an explicitly historical perspective have been presented in recent years, for example by Nash and Grab (2010), Gil-Guirado et al. (2016), Brazdil et al. (2018, 2019), and Erfurt et al. (2019), implementing a wide range of content and methodological aspects. The spectrum ranges from analyses of outstanding individual years (Wetter et al., 2014) and the derivation of regional time series in different climatic zones (Noone et al., 2017; Kiss, 2017; Dobrovolný et al., 2018; Nash et al., 2019) to a focus on drought effects (Glaser et al., 2017).
The aim of the present contribution is the reconstruction of long-term drought time series in Germany since 1500 based on written records. For this purpose, a rating scheme was developed in order to correlate recent parameters and criteria of drought valuations with historical ones. For this purpose, various drought indices and drought categories were derived and evaluated. The long-term development was assessed, particularly the question of the extent to which the current developments differ from the previous phases.
The analysis is based on two main comprehensive data sets. The first data set – available from the virtual research environment Tambora (tambora.org, 2018; Riemann et al., 2016; Glaser et al., 2018) – consists of written documents related to weather, climate, and the impacts on and consequences for the environment and society of Central Europe. The second, modern data set comprises official precipitation data for Germany from 1881 onward and is provided by the German Weather Service (DWD, 2019b).
The approximately 330 000 historical records from Tambora (tambora.org, 2018) for Central Europe are taken from weather diaries, chronicles, pamphlets, official reports and newspapers. Other media such as flood marks, hunger stones, pictures and lyrics supplement these. The 330 000 coded records from Tambora (tambora.org, 2018) are represented as blue dots in Fig. 1, while the red dots represent the 54 000 records indicating precipitation and specific information regarding dryness and droughts. Additionally, the green dots indicate the 12 600 records describing the impacts and consequences of dryness, drought and lack of precipitation. Such descriptions include water shortages, low water levels of larger rivers, fish deaths, forest fires, emergency slaughters, crop failures and prayers for rain. In total, the information covers large parts of Central Europe. The southwestern and the central, as well as the eastern, parts of Germany are particularly well depicted but also the larger river systems such as Main, Rhine and Elbe. Additionally, the spatial distribution concentrates around the cultural, political, economic and religious centers such as Nuremberg, Cologne, Leipzig, Erfurt, Hamburg and Mainz, as well as other larger cities and monasteries. The coastline is also well represented, specifically the harbor locations like Hamburg, Lübeck and Rostock. Temporal coverage is very good with information for every month since 1500. As expected, average and inconspicuous months are less documented than more extreme ones.
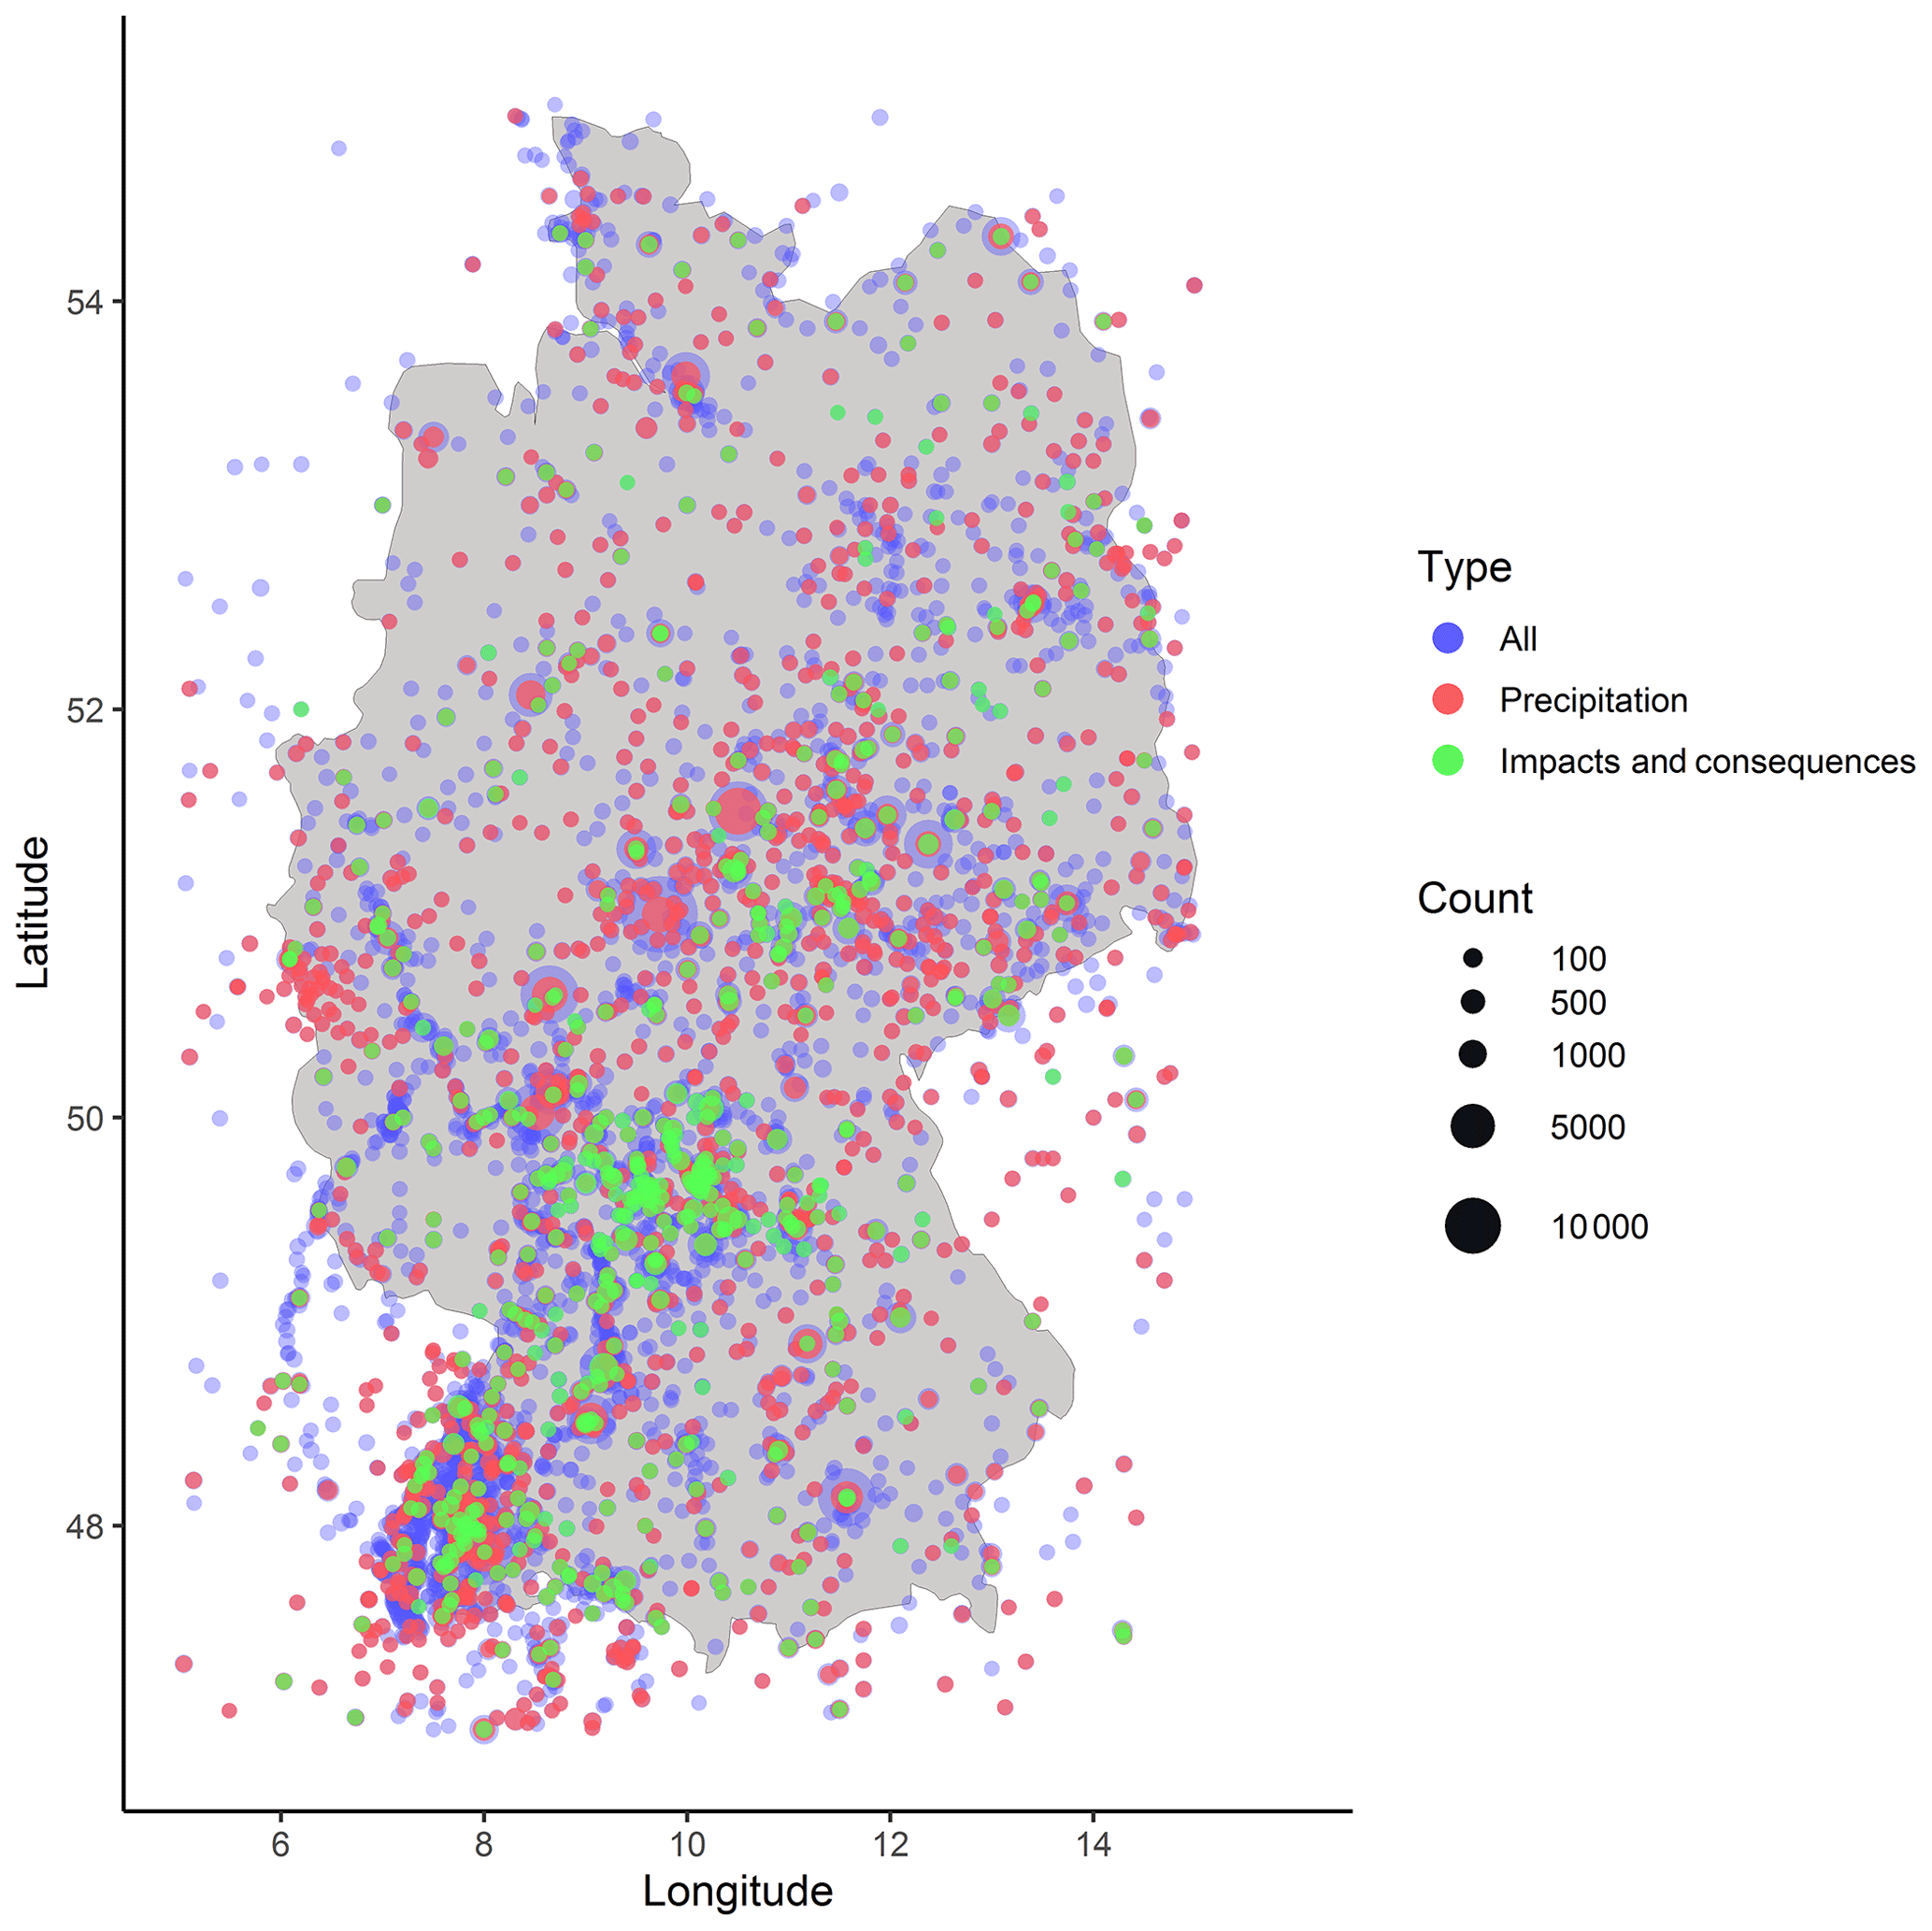
Figure 1Spatial distribution of all records referring to Central Europe from Tambora (tambora.org, 2018) since 1500 (blue), precipitation, dryness and drought records (red), and impacts and consequences (green).
All records from Tambora (tambora.org, 2018) are numerically coded, comprising spatial, temporal and content aspects. In addition to the coded events, the original text quotes are also included in the database so that the overall context and the coding can be traced for each record.
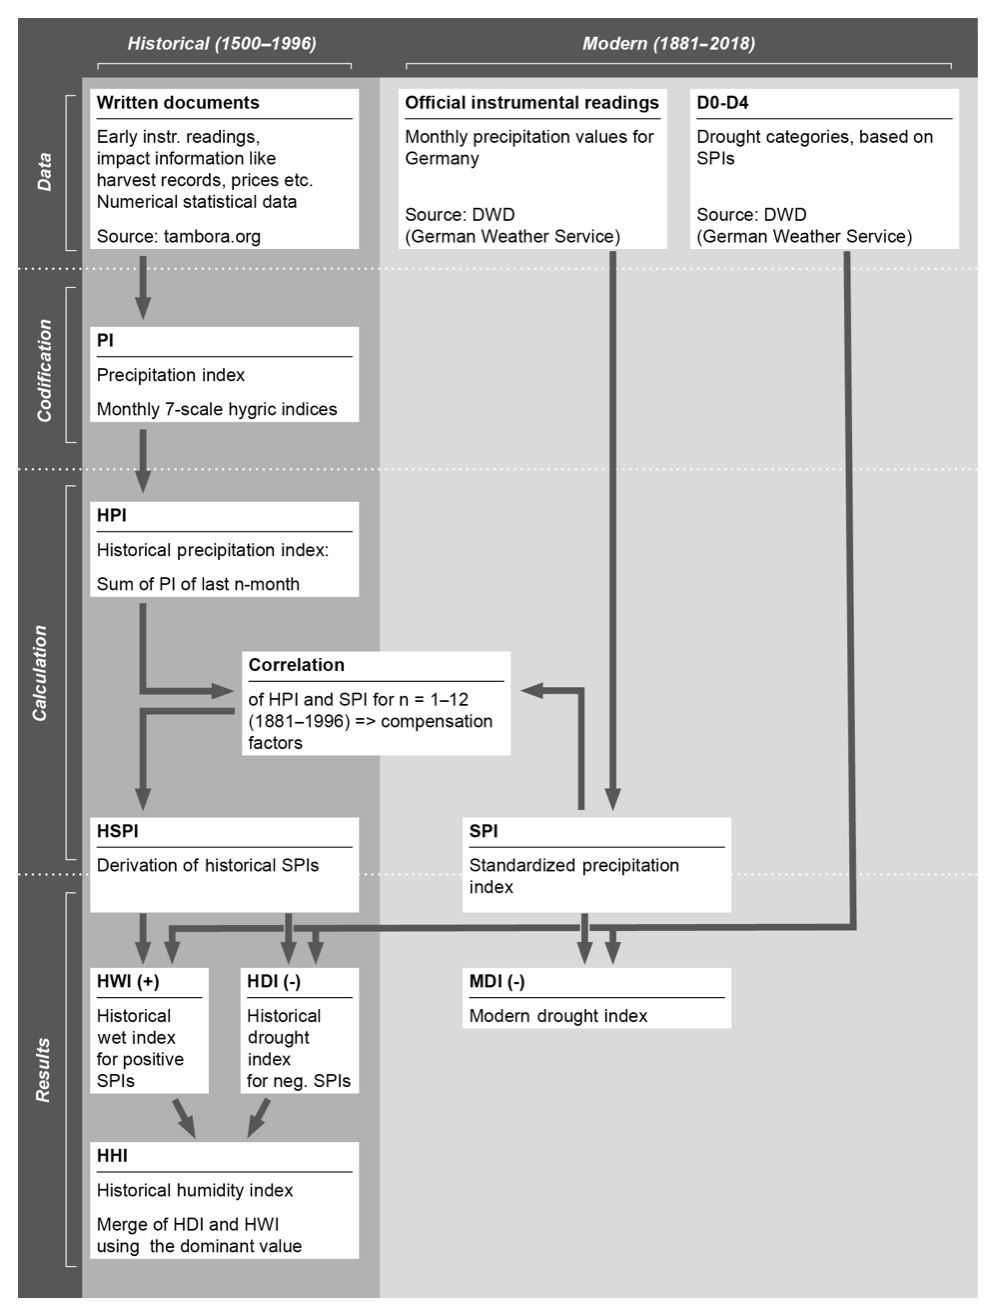
Figure 2Conceptual design of the analysis, illustrating the workflow and the single steps from which the specific indices and their relations are derived.
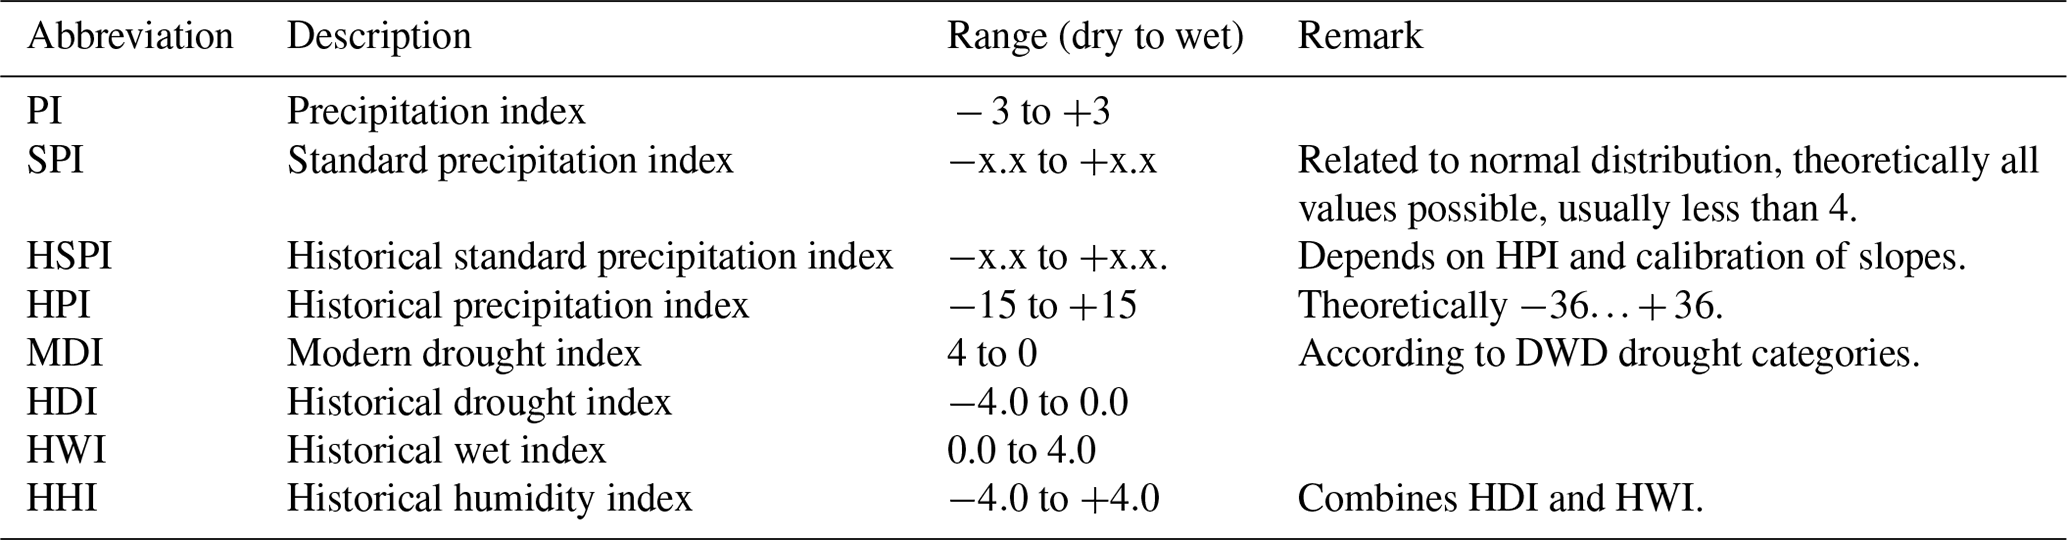
The second, modern data set used for the analysis consists of the official precipitation data for Germany from 1881 onward. These values, monthly precipitation measurements in millimeters, were recorded, averaged and provided by the DWD (Deutscher Wetterdienst, the official German Weather Service, 2019b) from the national official network stations, which represent the area of modern-day Germany. This study also draws upon the official drought categories D0–D4, their classification and their definitions based on SPIs by the DWD (2019). The relation between D0 and D4 and the relevant SPIs are indicated in Table 1. The relation is based on duration and intensity defined via different thresholds.
The conceptual design of the analysis is given in Fig. 2. It illustrates the single steps and the workflow as a whole. Each individual step is described in the following subchapters in detail.
3.1 Derivation of the monthly precipitation index from 1500 onward
The precipitation indices (PIs) were derived from the written evidence of the Tambora sources via semantic profiles, a method well established in historical climatology (Glaser, 1991, 1996, 2013; Glaser and Riemann, 2009; Pfister, 1999; Brazdil et al., 2005). Therefore, direct hygric indications and the descriptions of impacts and consequences are hierarchically ordered according to their intensity and assigned to the appropriate index value. A seven-scale index scheme, ranging from −3 to +3 with index 0 representing the average situation, has proven to be appropriate for the classification of historical records (Glaser, 1991, 1996, 2013; Glaser and Riemann, 2009).
The hierarchical class assignment and its typical indicators for the negative precipitation indices −1 to −3 are presented as follows.
Index −1 is indicated by descriptions of the beginning of a rainfall deficit. There are often indications of higher damage relating to the harvest of rain-sensitive products such as hay, vegetables and other garden products.
Index −2 relates to a longer duration of a lack of precipitation, prolonged heat and dryness. Average crop losses for main crops are reported, as well as low water levels in smaller bodies of water and reduced spring fills. Heat stress on plants, premature leaf discoloration and the death of plant parts are observed, as well as dry cracks in soils, occasional forest fires and the impairment of infrastructure related to shipping and water mills, for example.
Index −3 represents extreme dryness revealing a chain of effects: after a prolonged period of dryness and heat, the agrarian consequences include severe crop losses and even harvest failures, as well as emergency slaughters due to fodder shortages. If the dryness lasts for weeks, several months or even seasons, there are integrating effects like low water levels in greater lakes, ponds and larger river systems, as well as the drying up of springs and wells. In addition, reports of excessive water shortage and the appearance of “hunger stones” are common. Ecological impacts include visible heat stress on the vegetation, premature leaf discoloration and the withering of plants; dry cracks in soils, dust veils and the effects of wind erosion are indicated. There are diverse descriptions of a shift in the phenological phases, e.g., early flowering, ripening and harvest but also expressions like “wine of the century” and reports of forest fires and fish deaths. The impairment of infrastructure, especially the termination of shipping and the failure of mills, is frequently mentioned. The direct consequences for human health are also documented, e. g. through indications of heat stress, increased death rates, the outbreak of epidemics and hunger crises due to a lack of food. In addition, the reports include price increases and speculations.
Authorities' reactions range from restrictions and regulations on water access to the declaration of a state of emergency. Societal reactions like supplications, processions, pilgrimages, and increasing irrational explanations and interpretations are quite common. The sources also report begging, moving around in order to seek food and protests, theft, looting, robbery, and social excesses. These descriptions allow us to draw conclusions about the development of droughts during the preceding months. In many cases, the exact dates of meteorological droughts are indicated by the name day of saints.
The indexing process is similar to modern classifications and definitions of drought categories. Such modern drought categories also take into account the descriptions of impacts and societal consequences and reactions (McKee et al., 1993; NDMC, 2018).
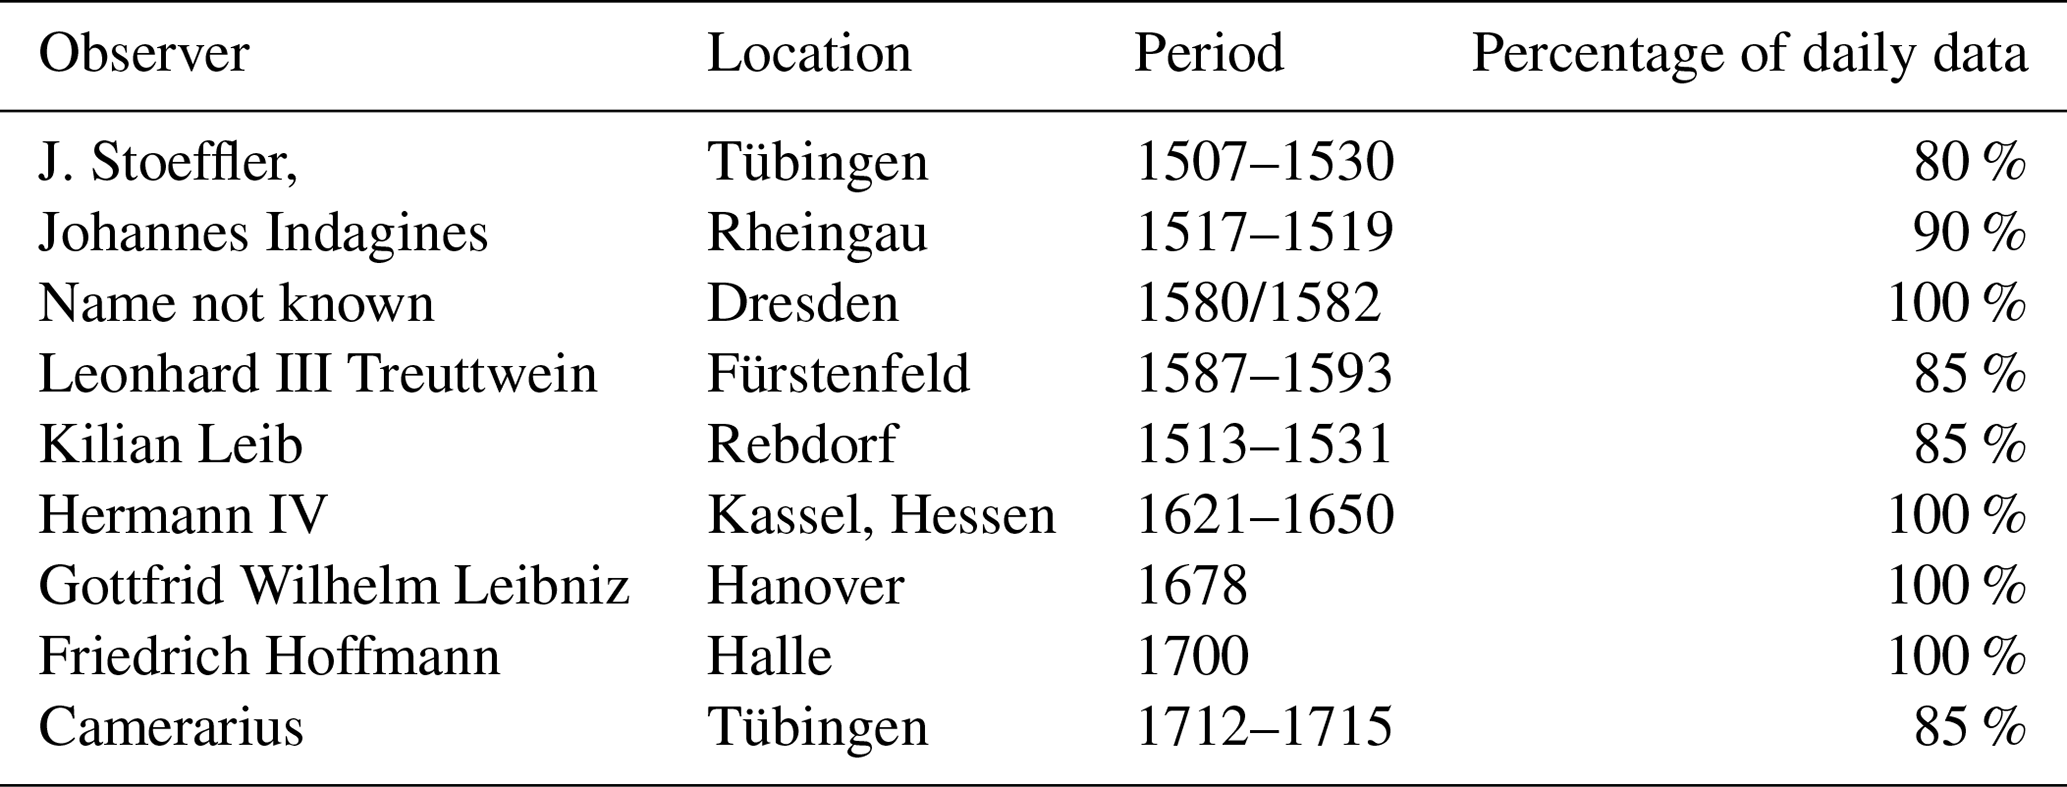
Weather diaries with daily records exist for more than 60 years from the period 1500 to 1800 and contain precipitation days (Lenke, 1960; Klemm, 1964, 1967; Glaser and Gudd, 1996; Glaser, 1996, 2013). These records are compared with modern precipitation data on a monthly scale, enabling a comparison of numerical rainfall data with the classified written evidence, which serves as an additional verification and validation of the index levels.
Table 2Selected observers, location and periods with daily weather entries 1500–1800.
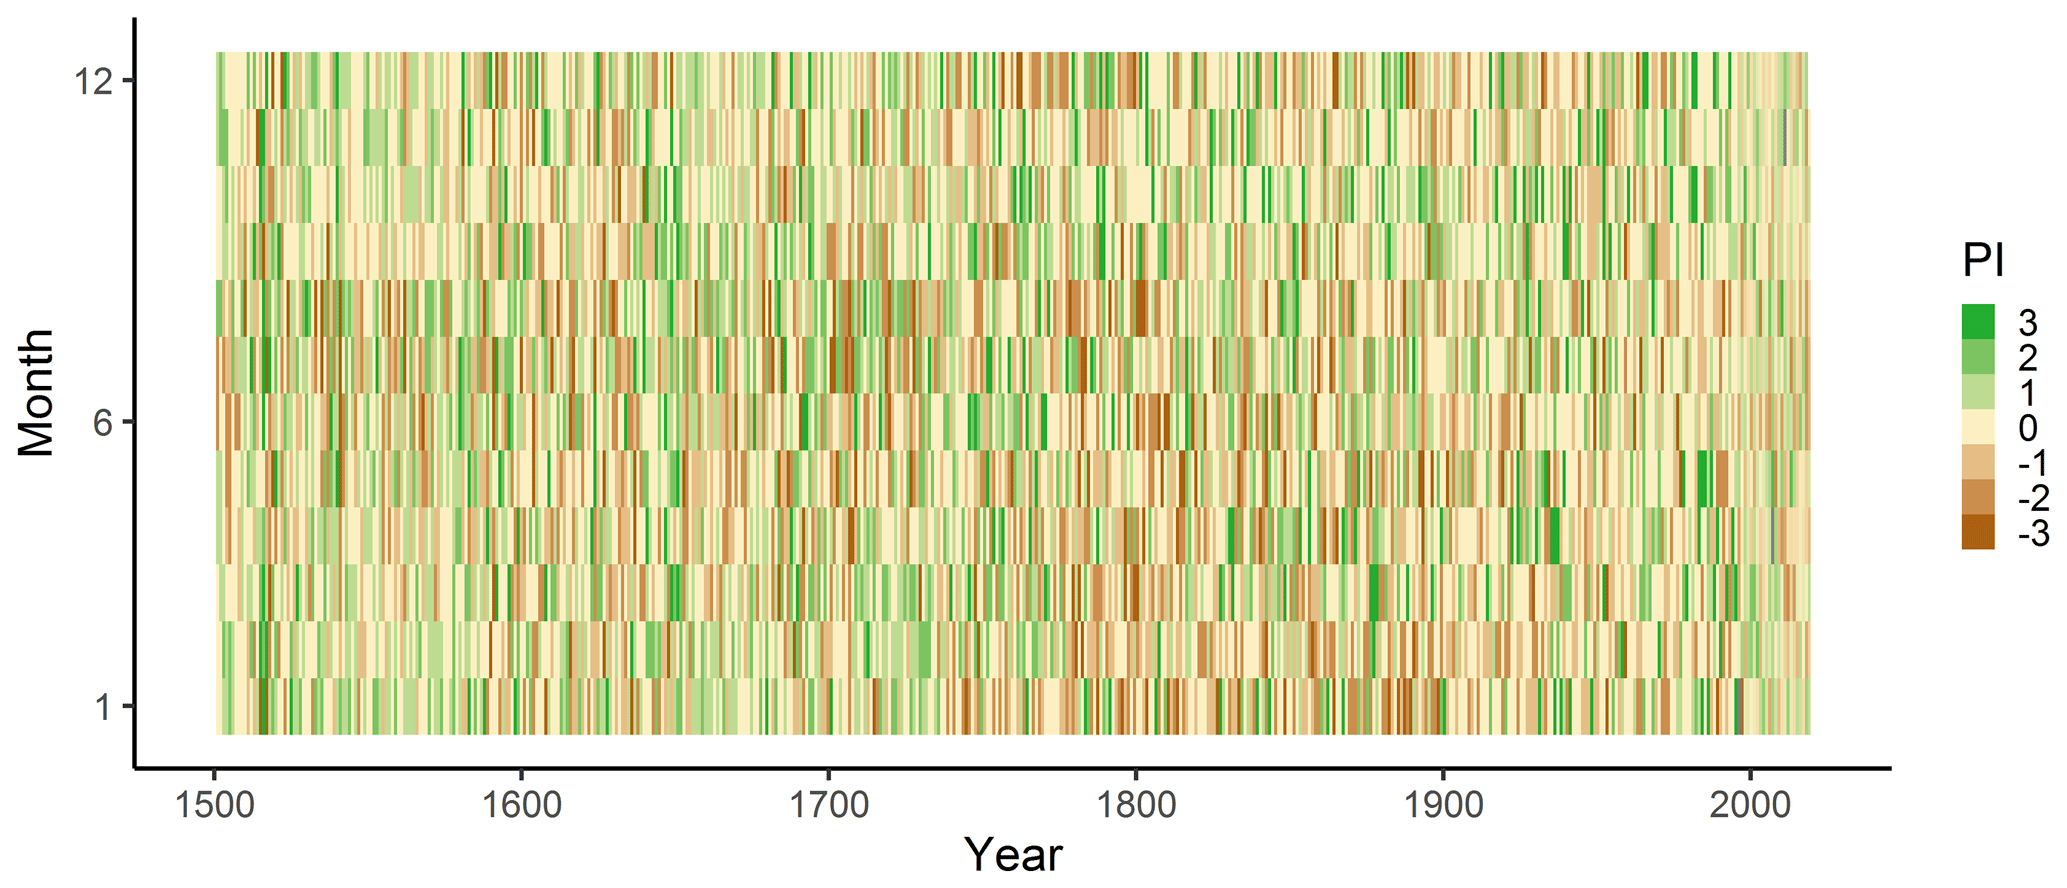
The positive hygric index corresponds to the humid and wet situations and is derived in the same manner. The summary of the monthly PI for Germany from 1500 onward is given in Fig. 3. The monthly PI reveals a differentiated picture of drier and wetter periods since 1500. The data are available from Glaser and Kahle (2019).
3.2 Derivation of historical pathways and drought categories and their mapping to modern definitions
The consequences and effects of drought on the environment and society recorded in historical sources – here referred to as pathways – resemble the structure and classification schemes used in modern drought classifications (Bernhofer et al., 2015; National Drought Mitigation Center, 2020; DWD, 2019a). A precipitation deficit is followed by a specific pathway. It first appears on the agricultural, then the hydrological and finally the socio-economic level – a development reflected by modern drought definitions (Nash et al., 2019; Erfurt et al., 2019).
These time- and intensity-related chains of effects can be derived from the historical sources as characteristic pathways. First of all, the absence of rain, the first signs of dryness and the beginning of a drought are usually described very precisely in historical sources. Often these are provided with time information, especially the duration, beginning and end of drought effects. Very often information is given on the phenological phases, particularly the prematurity of flowering but also field cropping and harvest dates (Freiburger Zeitung, 1834). With increasing drought, the consequences for agriculture like crop damage and crop failures, especially in rain-sensitive horticultural products and hay, are described. As the drought progresses, both the number of descriptions and their differentiation increase, including emergency slaughters for lack of food and the use of emergency reserves. At this stage, descriptions of the water balance also appear frequently: low water levels in water bodies, subsidence of spring discharges and drying up of small wells. Effects on the environment, such as forest fires, fish dying, algae blooms and various forms of soil degradation like deflation and dry cracks, complete the picture (Brooks and Glasspole, 1922; DWD, 1947; Dürr, 1986). The explanations are now also supplemented by indications of infrastructural problems, particularly regarding low water levels and the operation of mills. Health consequences are also recorded, including an increased mortality following the outbreak of epidemics, often due to poor water quality. Harvest losses lead to price increases and subsequently to famine (Nees and Kehrer, 2002). Religious rites such as prayer services for rain or processions but also official measures such as water rationing are taken. If the drought persists, the conditions described become more acute. In the historical context, especially after famine crises and epidemics, there are social excesses such as looting, robbery, persecution of minorities and excluded groups, and migration movements (Glaser et al., 2017, 2018). Fortunately, these are lacking in the modern context in Europe after 1950. However, extreme droughts in the postwar period between 1947 and 1949 were also accompanied by protests and strikes as a result of the special circumstances (DWD, 1947a; Erfurt et al., 2019; Brazdil et al., 2016).
These chains of effects reflecting the duration of a drought period are understood as pathways. Their grades were also classified as drought categories (see last column of Table 3). As these are very similar to descriptions of the consequences and implications of modern classifications, it is possible to parallelize them on a hermeneutical basis.
3.3 Determination of modern standardized precipitation index and mapping of recent drought categories
The modern standardized precipitation index (SPI) was calculated from the official precipitation values for Germany for 1881–2018 provided by the DWD's Climate Data Center (2019) using the package “SCI” (Gudmundsson and Stagge, 2016; Stagge et al., 2015b, 2016). The different SPIs were calculated for the corresponding time periods of 1 to 12 months as SPI1 to SPI12.
The drought categories D0–D4, the characterization of droughts and the duration, and the description of the consequences were also taken from the scheme of the DWD (DWD, 2018) (see Table 1, columns 1–4).
3.4 Derivation of the historical precipitation index
The derivation of the historical precipitation index (HPI) is based on the monthly precipitation index (PI). We calculated the HPI as the sum of the PIs of the corresponding number of the relevant months. This was done for time windows from 1 to 12 months in order to map the accumulative effects of dryness and lack of rainfall analogous with the SPI. For example, HPI3 of June results from the sum of the PIs from April to June. We also included positive values for humid and wet conditions.
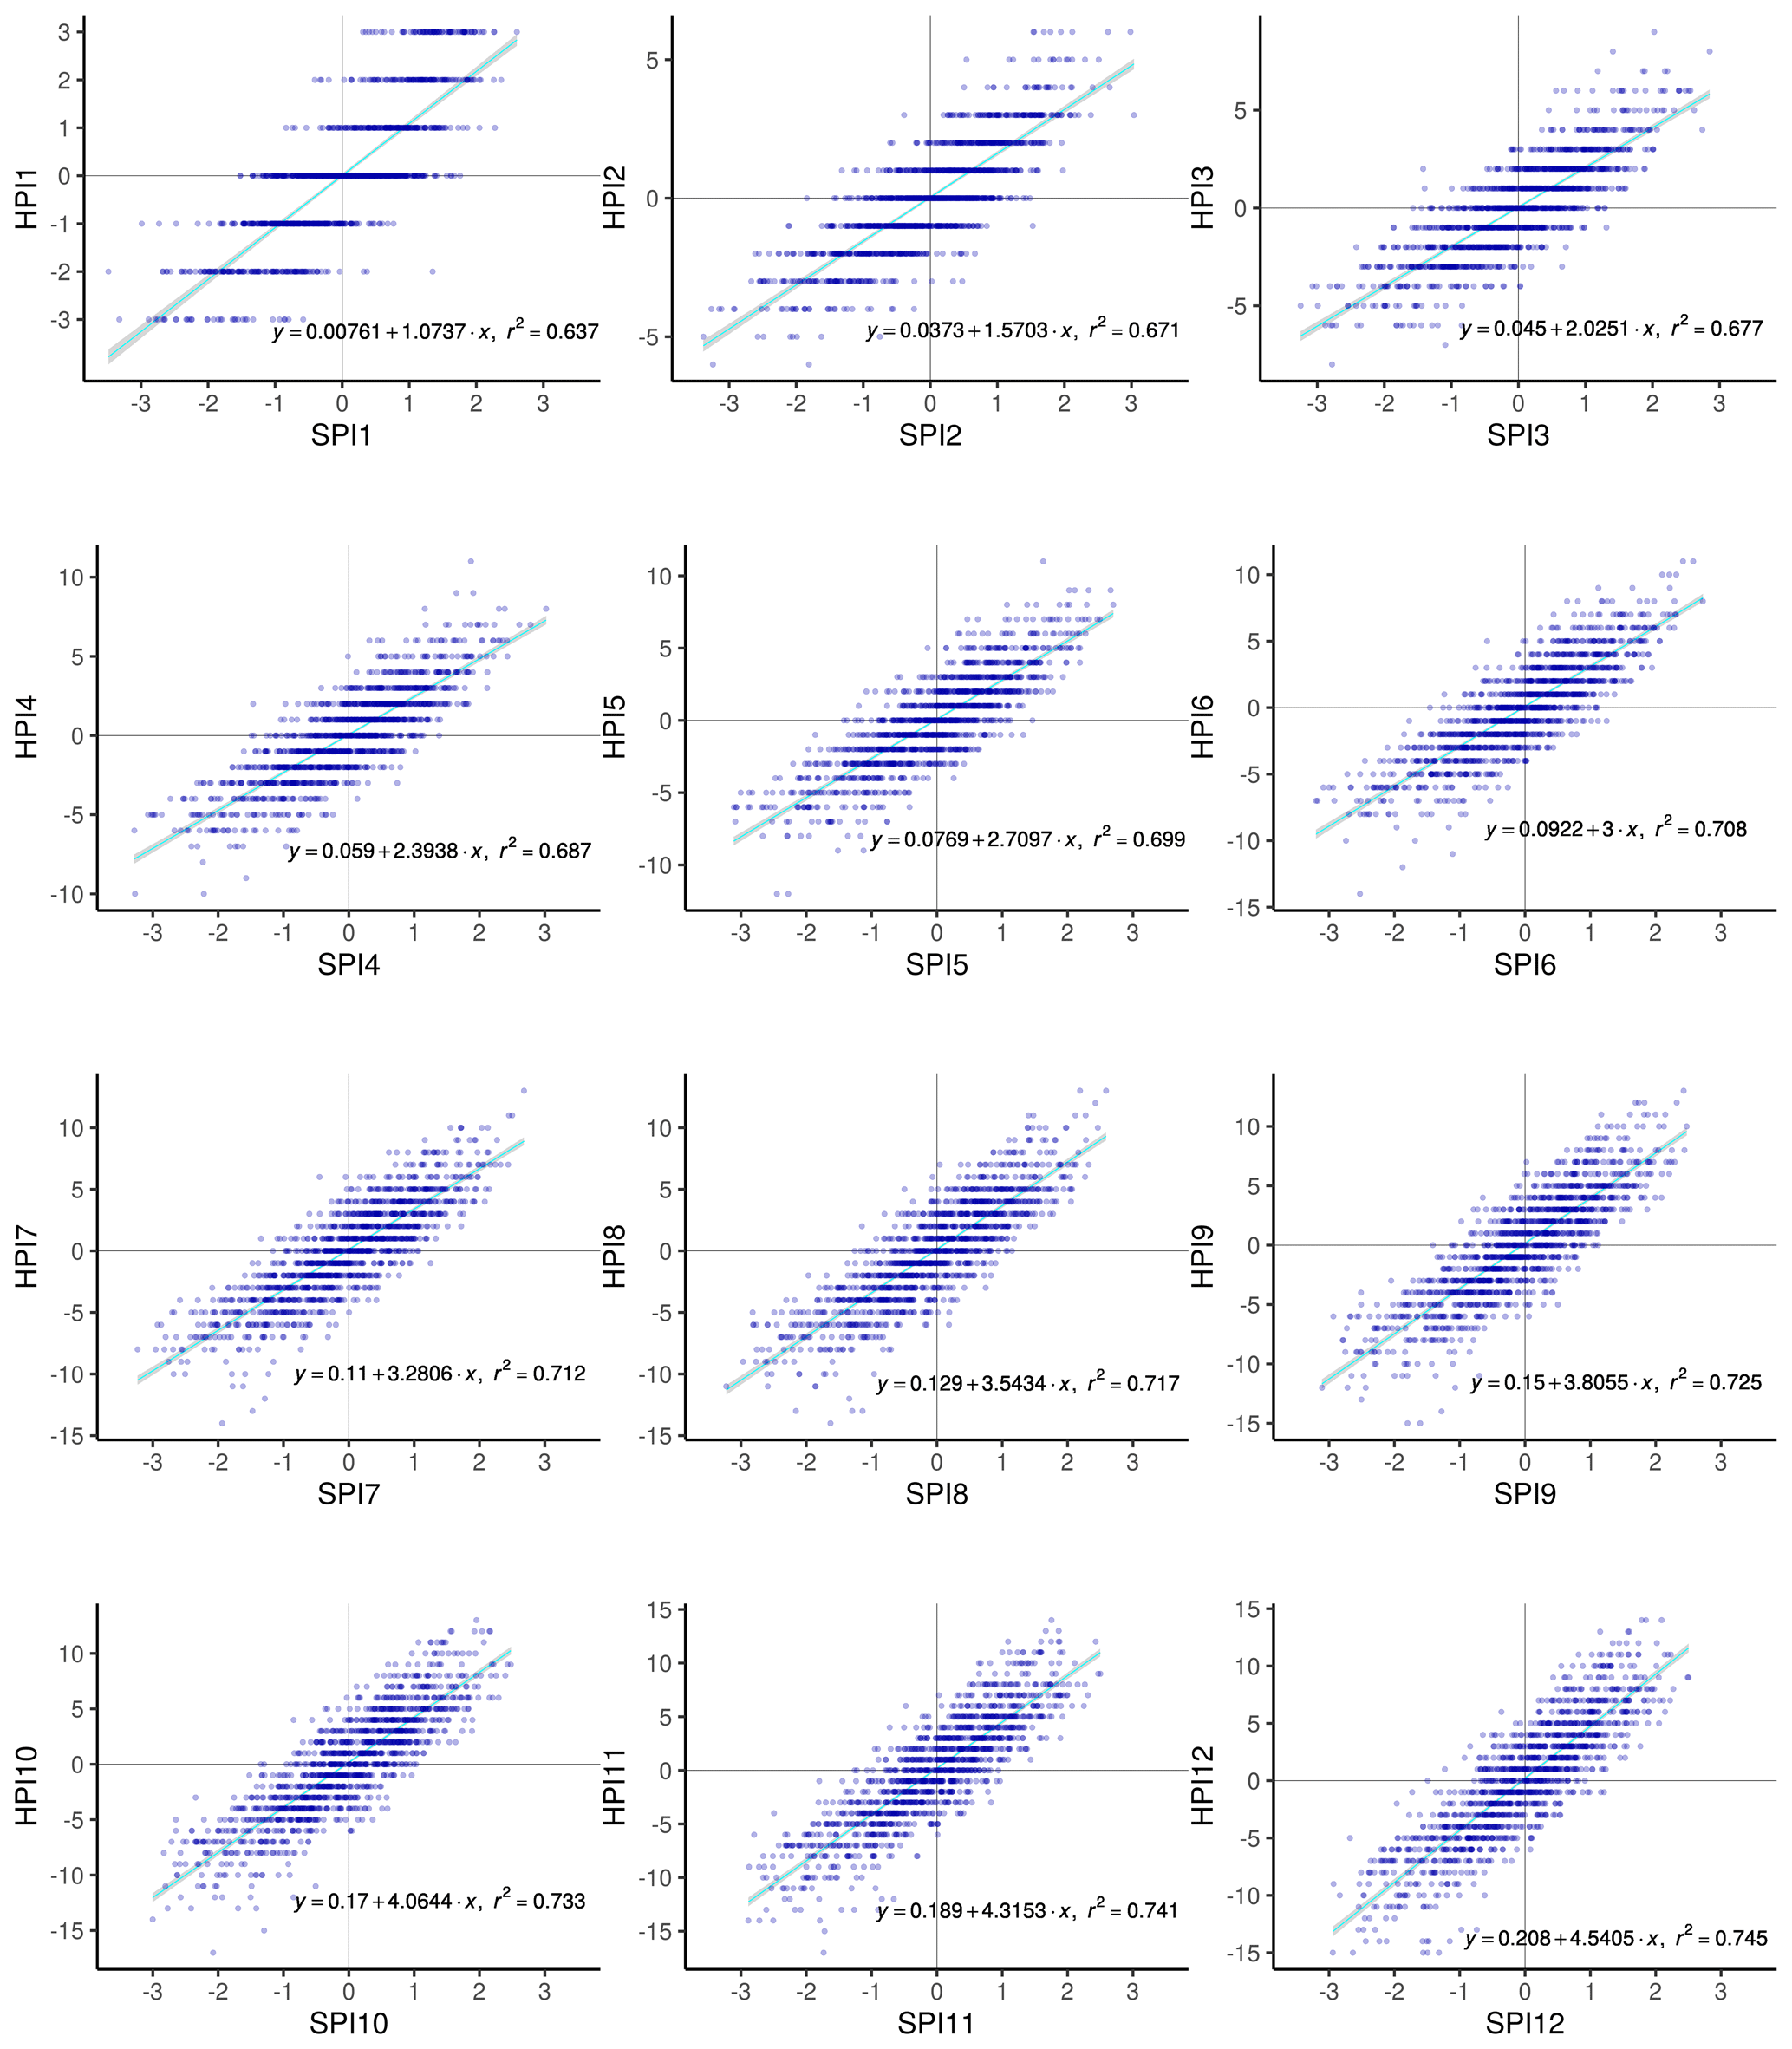
Figure 4Strength and shape of the relationship between SPI and HPI for 1881–1996 for a duration of 1 to 12 months.
3.5 Correlation of the historical precipitation index with the modern SPI
To compare the HPI with the modern SPI, a correlation analysis for the overlapping period 1881–1996 was applied. The results show a very high correlation of 0.65 to 0.74 between SPI and HPI. The two parameters (HPI versus SPI) are highly correlated. The strength of the statistical relationship and its shape are shown in Fig. 4. There is also a relation between the specific slope and the duration. Therefore, we introduced a duration-dependent scale factor.
To integrate the duration effect, this derived scale factor was used. The comparison of the accumulated values allows for the identification of a factor dependent on the number of months, which we used to adjust the scaling (Fig. 5).
We solved the equation and applied the following inverse function to map the class boundaries given in SPI values (see Table 1, column 1) to HPI values (Table 1, column 5).
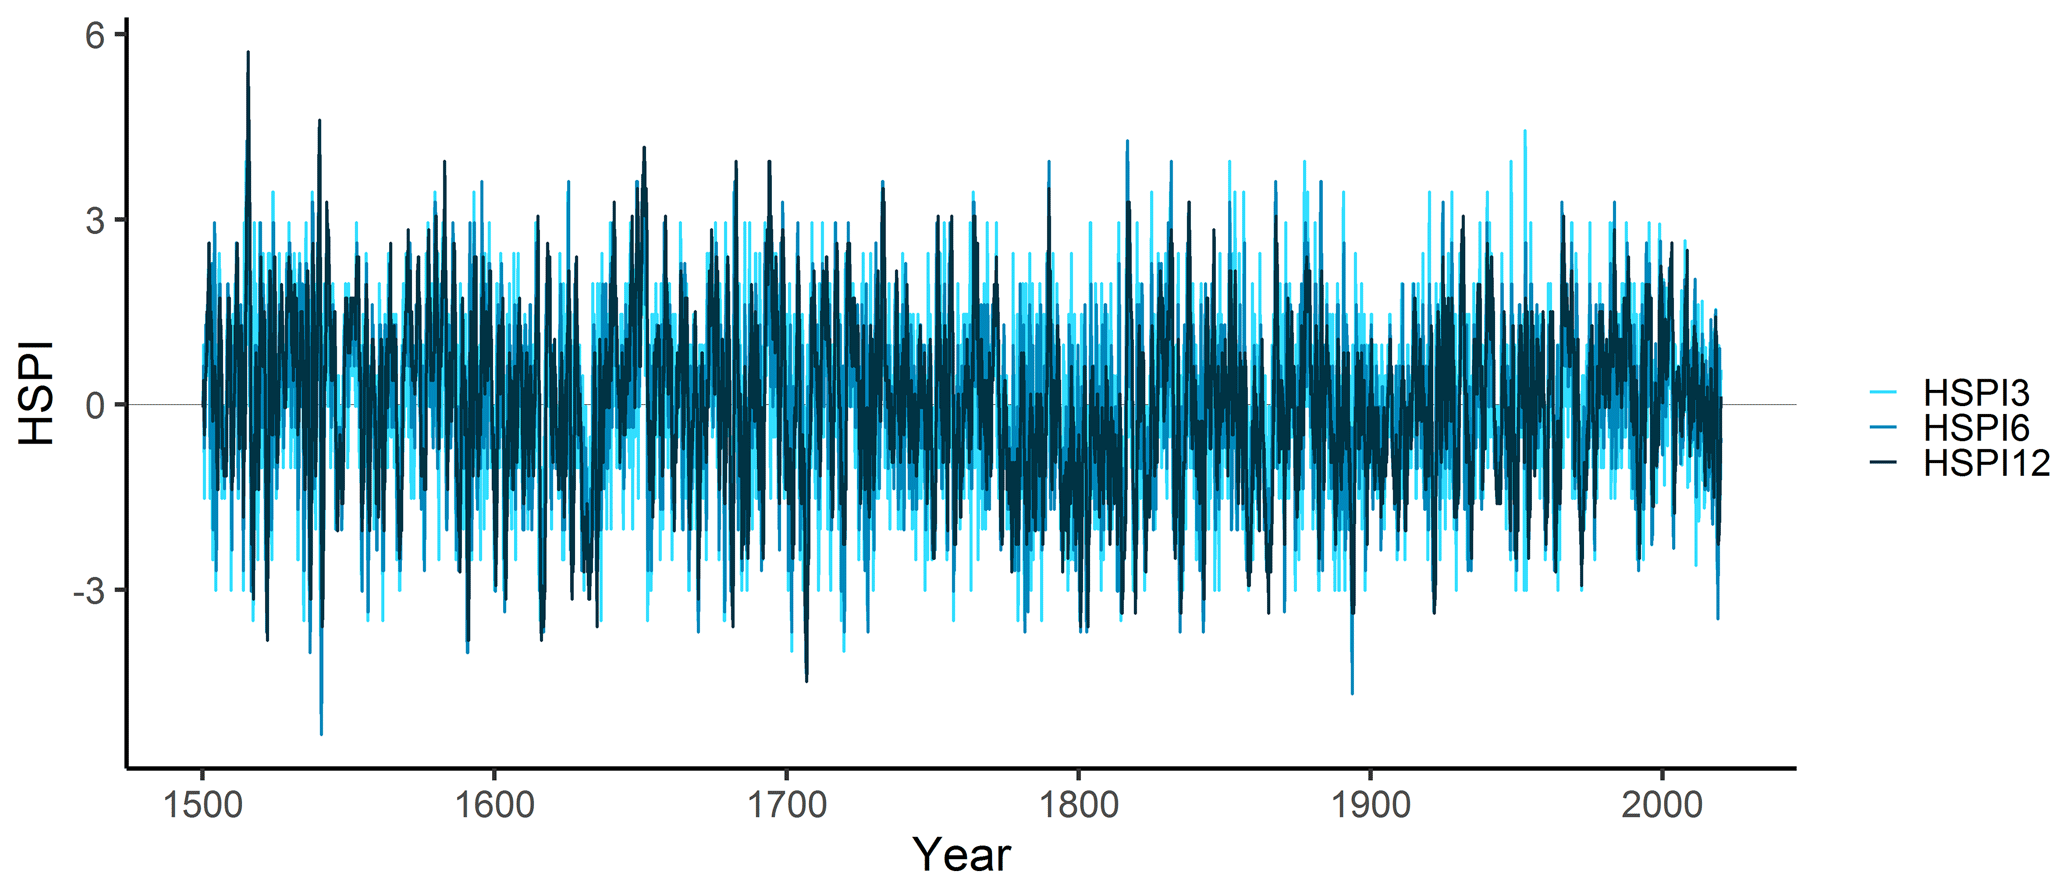
3.6 Derivation of HSPI time series from 1500 onward
In a further step, the scale factors were applied to the historical precipitation index (HPI) from 1500 onward to derive the historical SPIs (HSPIs). Examples of the transformed HSPIs are shown as HSPI3, HSPI6 and HSPI12 (Fig. 6).
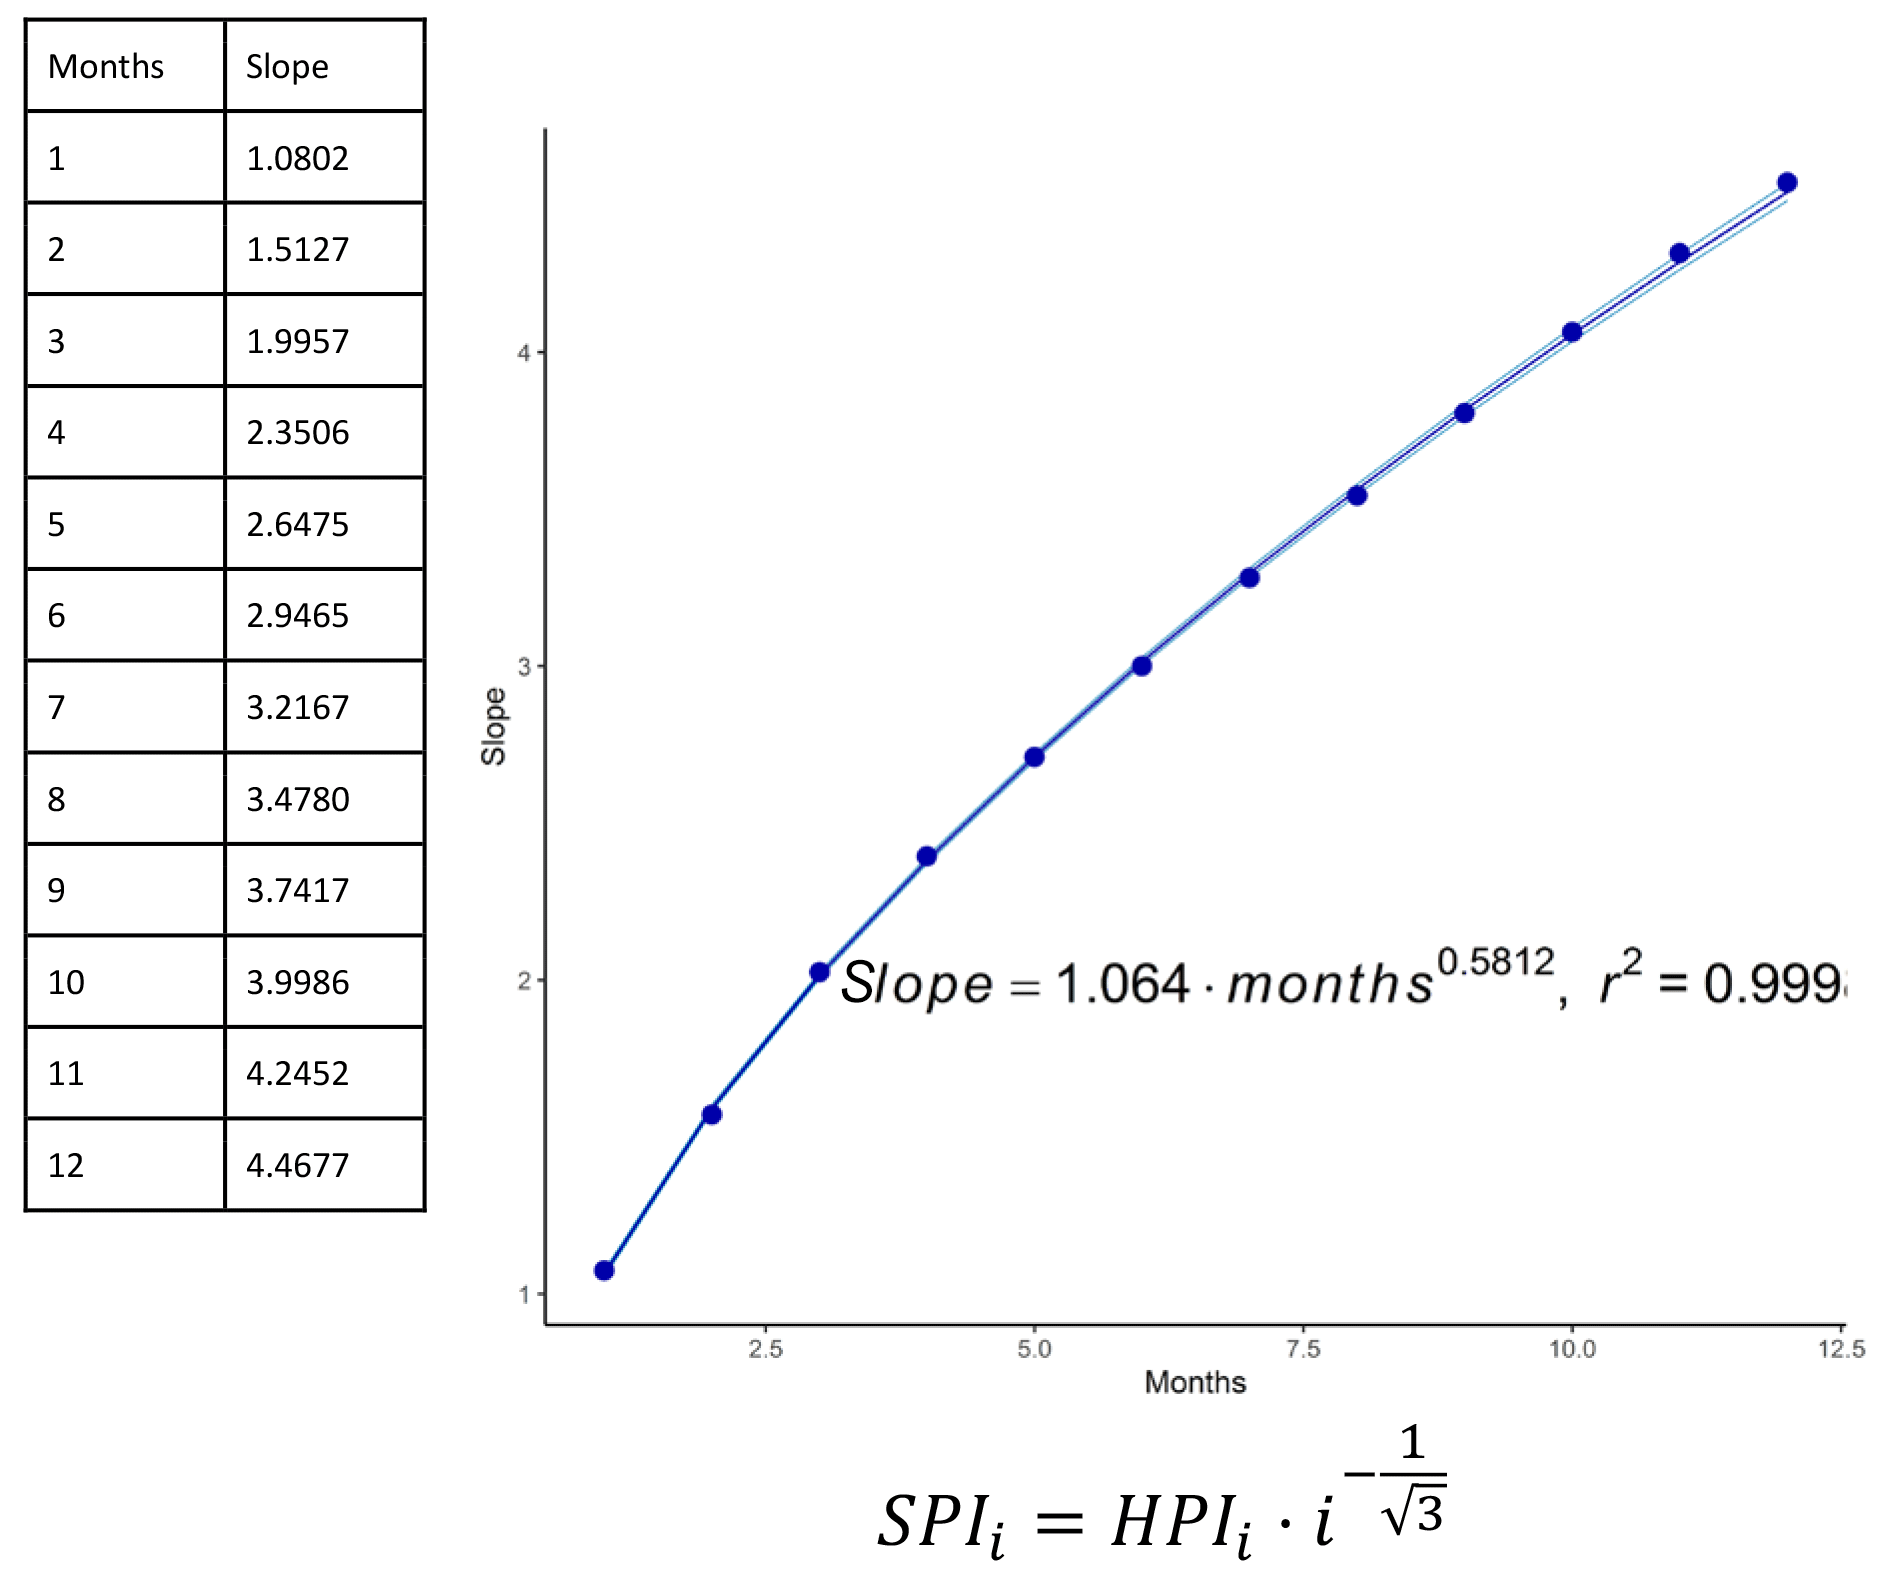
Figure 5Duration and scale factors of the relationship between SPI and HPI for a duration of 1 to 12 months.
3.7 Derivation of the historical drought index and comparison with the modern drought index
For the determination of the historical drought index (HDI), we stepwise interpolated the classes linearly defined in Table 1 using the negative SPIs with different durations (Fig. 7). These were compared with the modern drought index (MDI) of the DWD for the calibration phase 1881–1996. The correlation of r2=0.48 underlines the strength of the relationship between the two variables. We also used this approach to calculate the last 500 years.
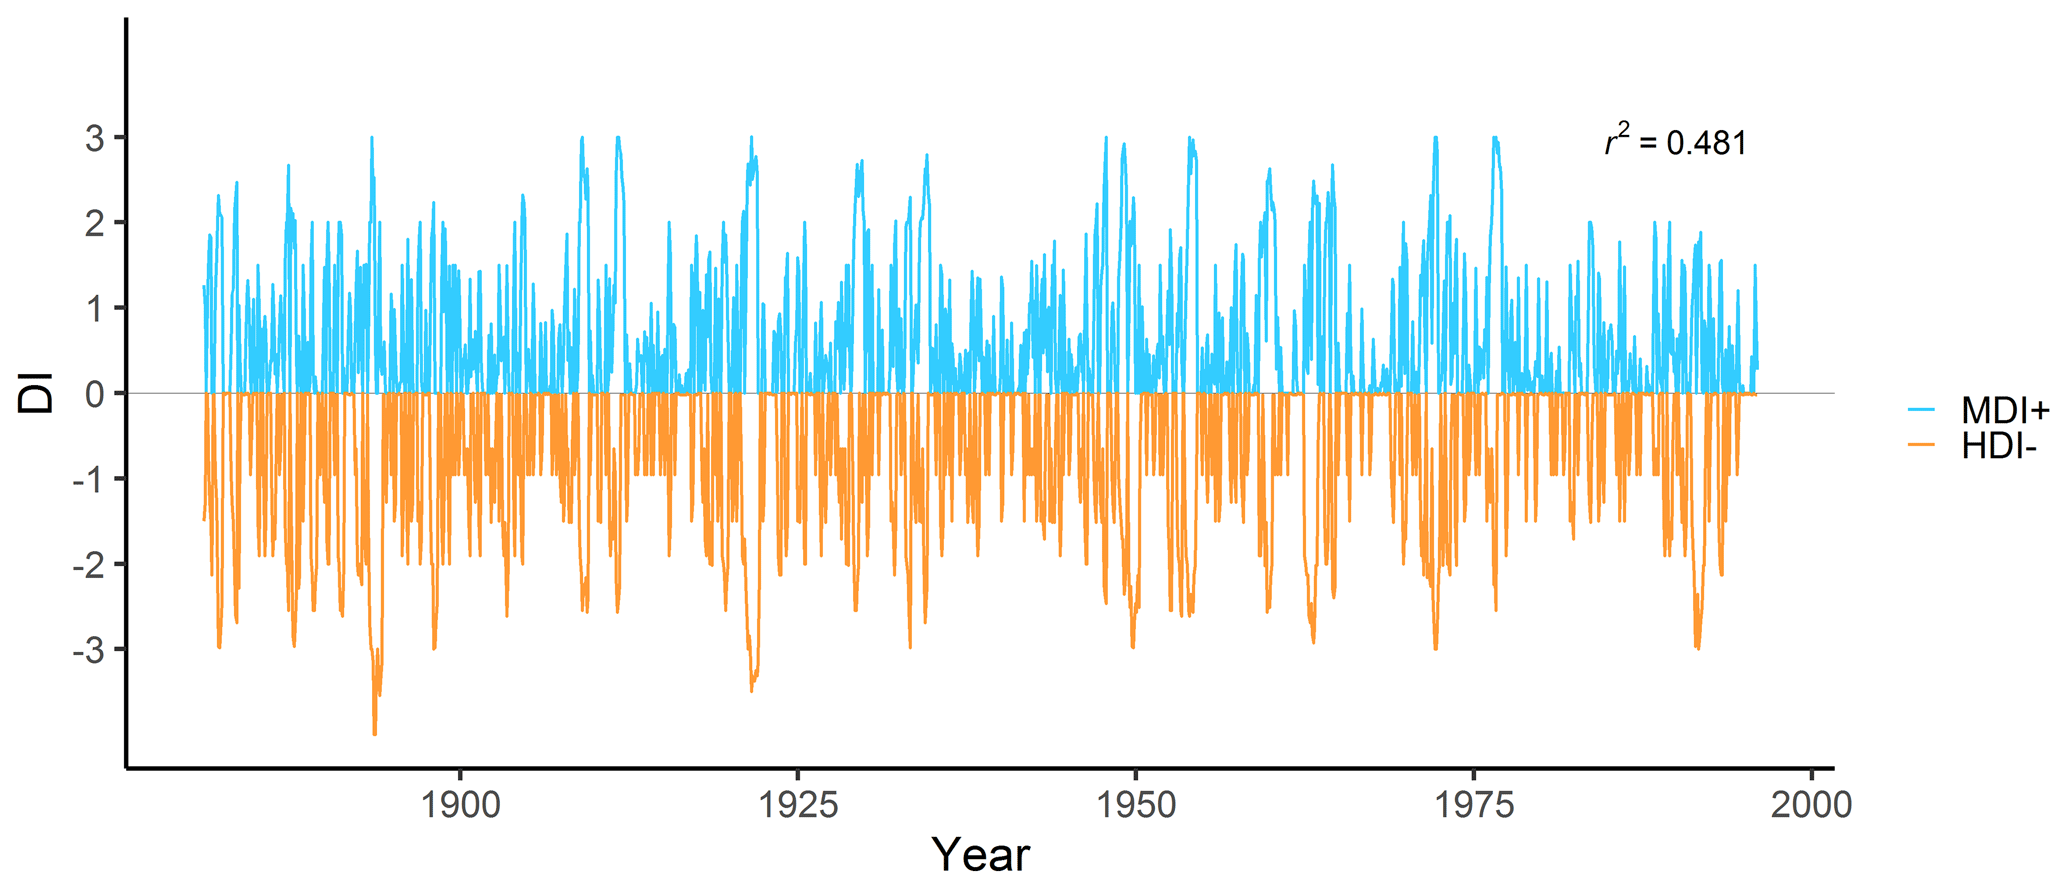
Figure 7Comparison of the historical drought index (HDI) and the modern drought index (MDI) for Germany 1881–1991.
3.8 Synopsis of SPI, HPI, and numerical and hermeneutic drought categories
To synthesize and compare the different numerical indices, drought categories and hermeneutic classifications, we compiled the modern SPI, the historical and modern drought categories (HDI and MDI), duration classes, recent descriptions, and the HPI, as well as the historical description of consequences and impacts, in Table 3.
The starting point is the parameters and criteria used in the drought severity classification (NDCM, 2018) or the drought index of the German Weather Service (DWD, 2018). These include drought indices derived from measured data such as the SPI, as well as the assessment of the severity of droughts in the form of drought categories. These follow the criteria used in the general drought classifications of an agricultural, hydrological and socio-economic drought and include information on duration. In addition, we described the effects and consequences in short text blocks.
Table 3Synopsis of SPI and HPI and numerical and hermeneutic drought categories.
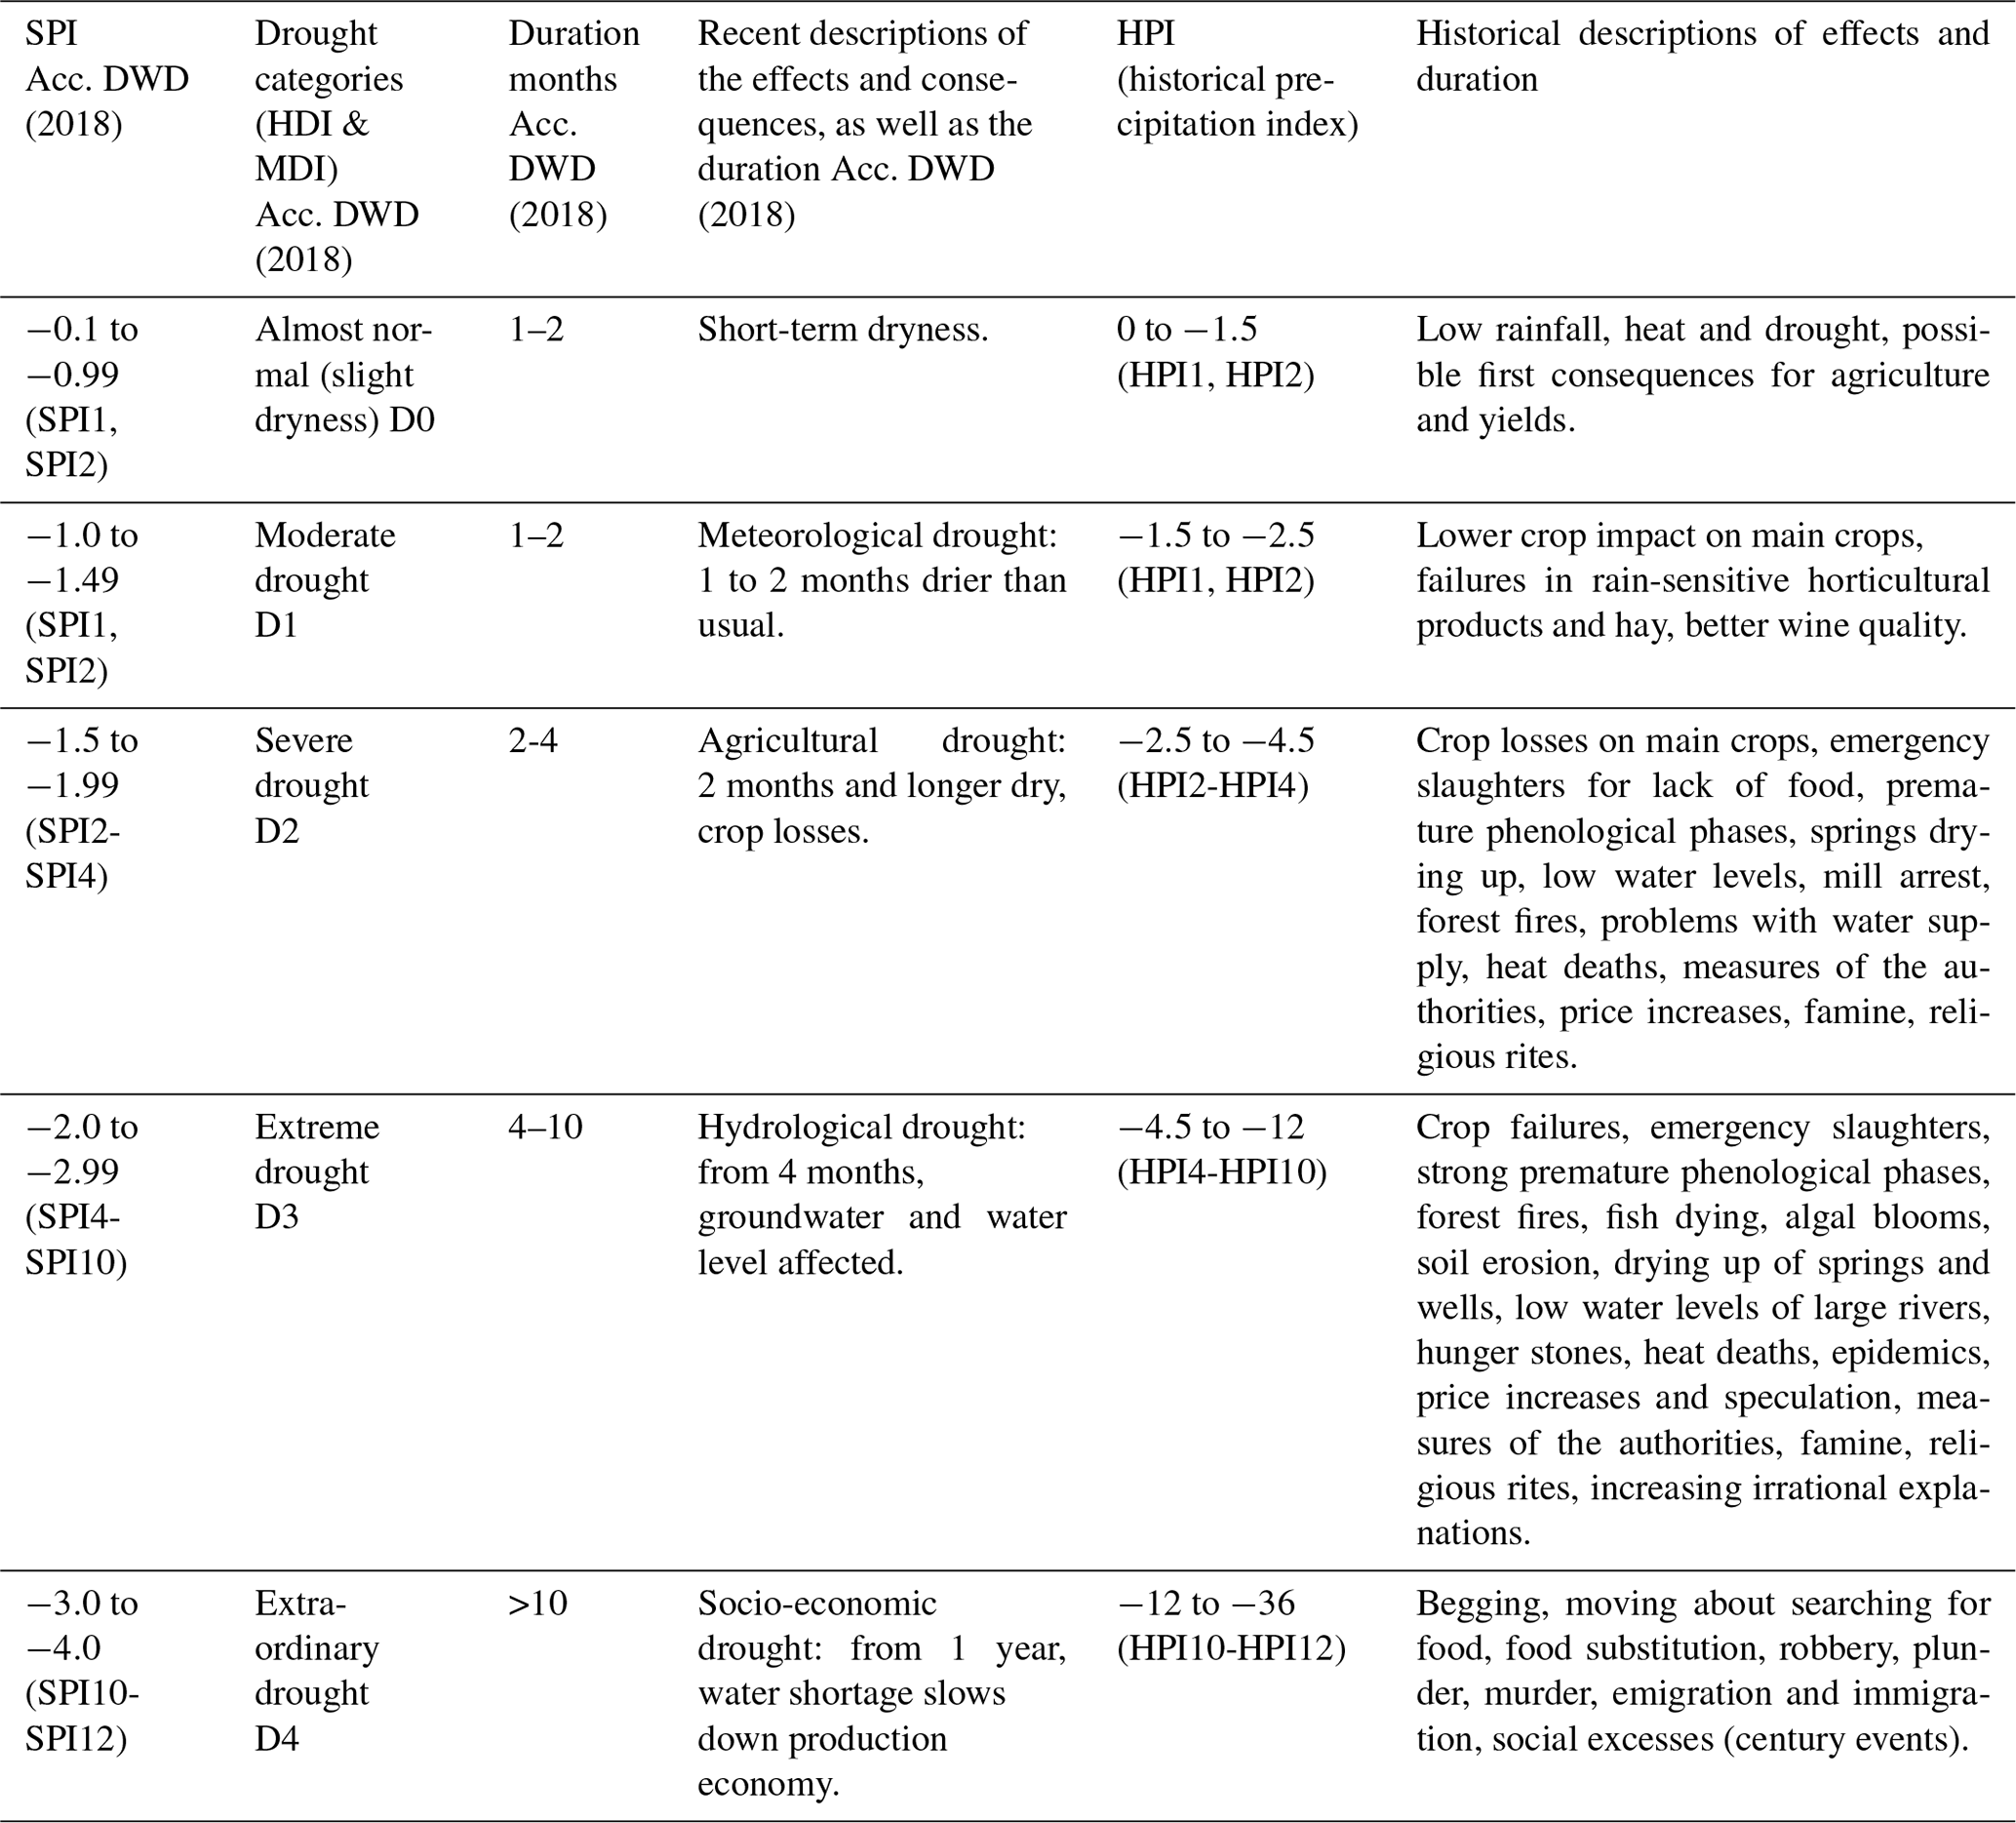
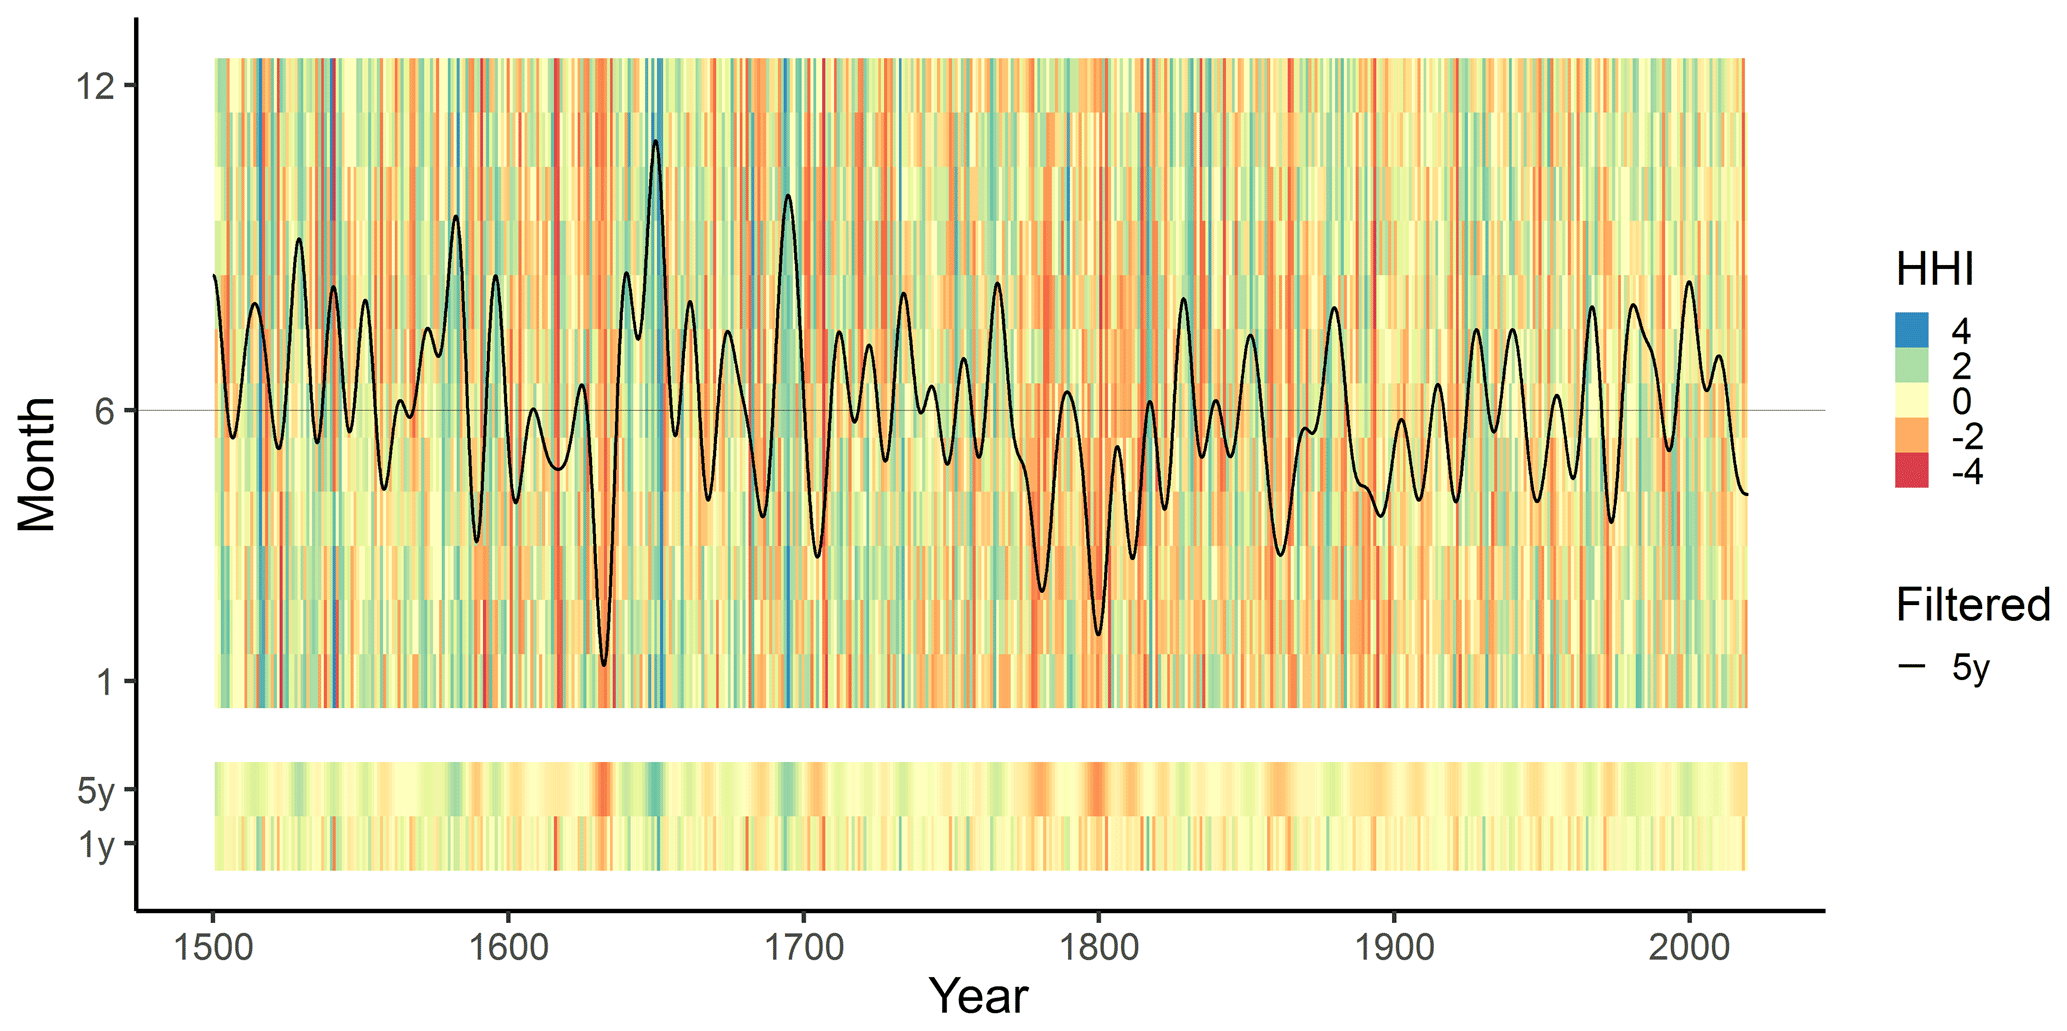
Figure 8Historical humidity index (HHI) for Germany since 1500. The upper part represents the monthly HHI from January to December for each year and the overlaid 5-year low-pass filter (black line). The lower part indicates the low-pass values represented as colored scheme for 5 years and 1 year.
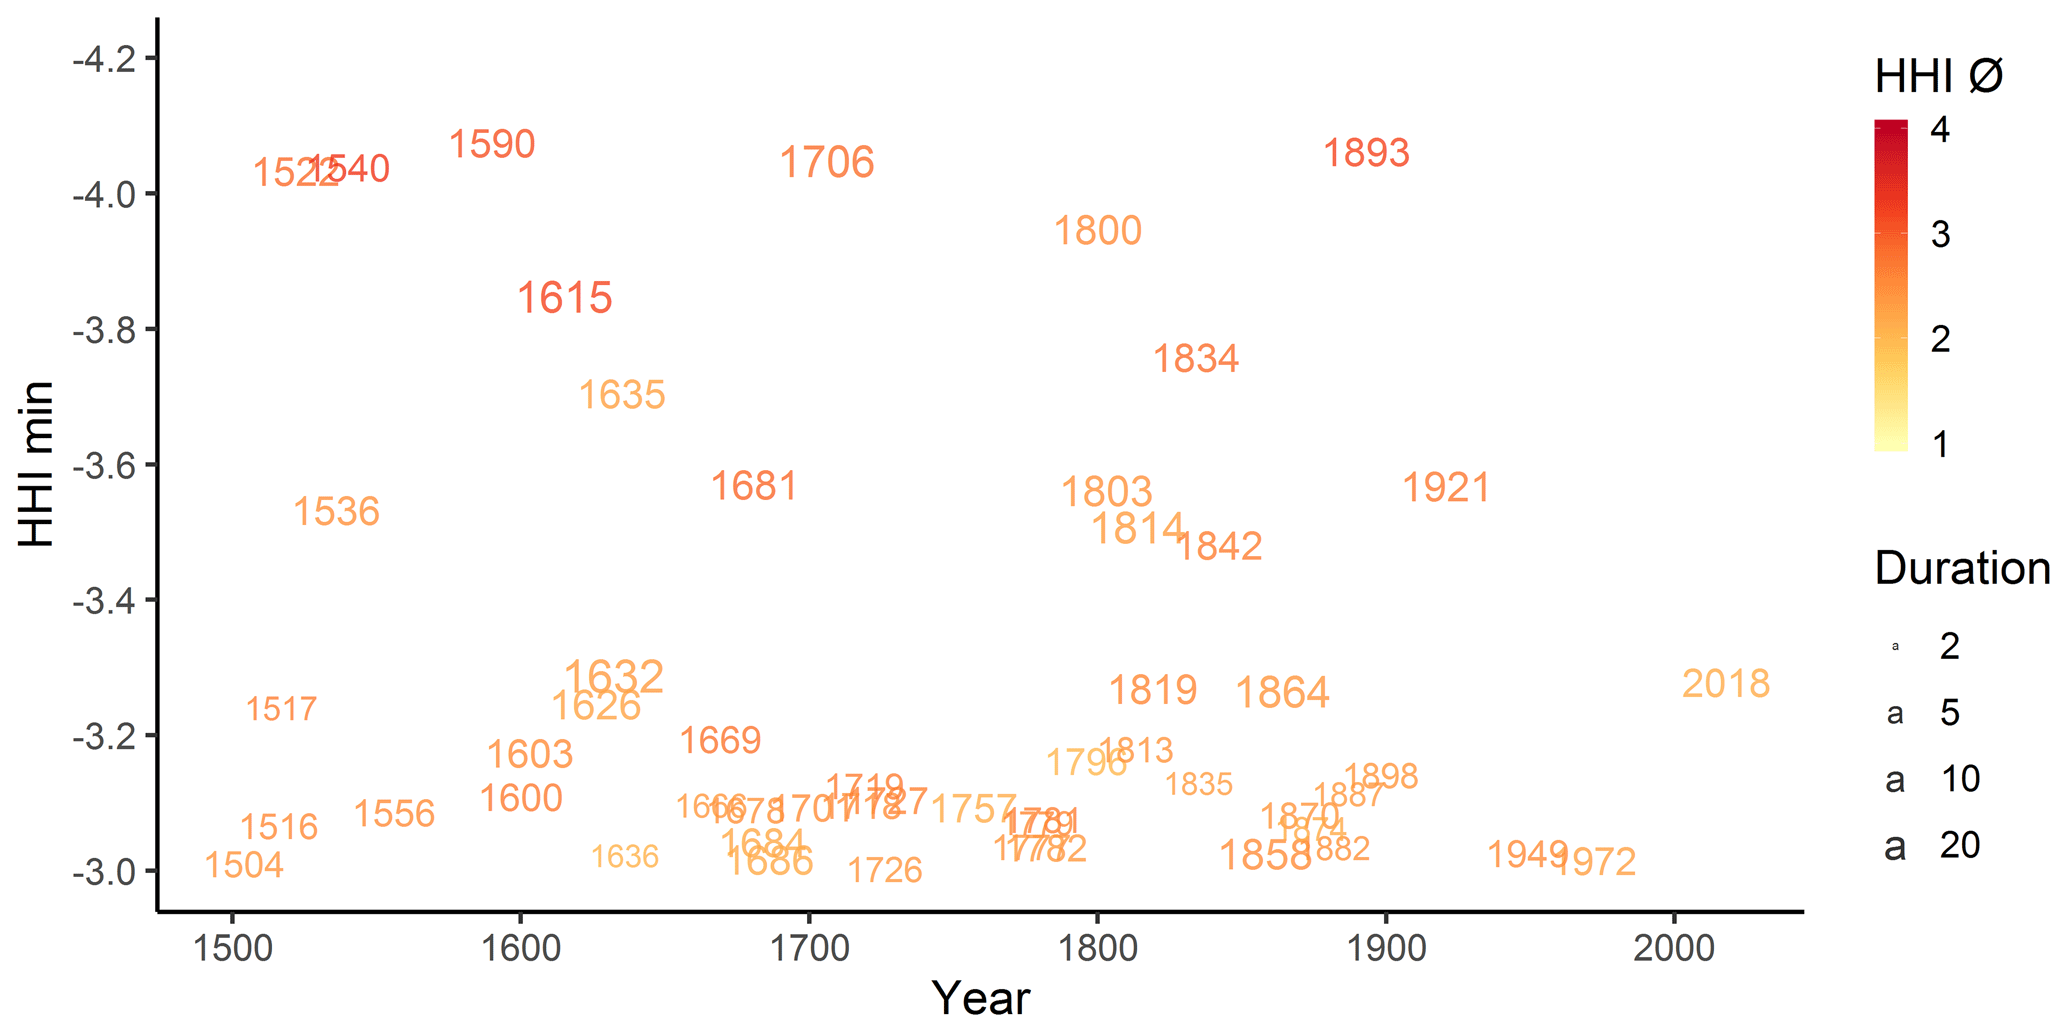
Figure 9“Yearcloud” of classified years since 1500. The average intensity is reflected by the color scheme and duration (month) by font size.
This table is of manifold uses for cross validation and comparisons of modern and historical indices, as well as comparisons of hermeneutic descriptions with numerical indices, shortcut calculations and conversions.
3.9 Derivation of the historical wet index and historical humidity index
To include not only dryness and drought aspects, humidity has also been considered in the analysis by including the positive hygric indices as a historical wet index (HWI). Its derivation was analogous to the class boundaries of the drought categories. The dominating effects of the HDI and the HWI are combined into the historical humidity index (HHI). The monthly results are shown in Fig. 8, along with the frequency-filtered signals for 1 and 5 years (Fig.8).
3.10 Identification of extreme drought years from 1500 onward
To identify and quantify the most outstanding extreme droughts over the centuries, we compiled the different years according to the strength or intensity of the derived indices. All months with an HHI below the value −0.5 were selected, and periods of consecutive dry months were clustered. For each of these periods, the minimum HHI value, its sum, and its beginning, end, and duration, as well as the HHI average, were calculated. As usual in such compilations, the rankings of the top century events vary somewhat according to the different indices and categories and their underlying calculations – weighting duration and intensities in different ways (see also Erfurt et al., 2019).
In addition to the calculations, the chains of effects extracted from the written hermeneutic evidence were used to confirm extreme events. These are characterized by detailed evidence emphasizing strong impacts on agriculture, forestry, water cycle and water supply, as well as socio-economic effects like rising prices and famine. Additionally, ecological effects were considered, e.g., wildfires, algae bloom, fish deaths and soil erosion. There is also evidence of societal contextualization, especially of a society's coping and adaptation strategies, which reveal their vulnerability and resilience capacity.
These aspects have changed through the ages. In the agrarian feudal age, societies coped with drought very differently than during the industrialization period when, for instance, migration became an option. There was also a great shift in the past 100 years; while the extremely vulnerable societies during and in the aftermath of the First World War and Second World War were severely affected by droughts, the consequences could be coped with in the modern episodes of 2003 and 2018 (Erfurt et al., 2019).
In this paper we describe a conceptual and methodological approach for analyzing drought events for Germany since 1500 based on written documents from the virtual research environment Tambora (tambora.org, 2018), and we derived precipitation indices using hermeneutic approaches and pathway analysis. Different homogeneous index-based reconstructions of monthly and yearly drought time series for Germany since 1500 are presented which connect historical and modern times. This helps to interpret the long-term development and to compare drought events across centuries.
The reconstructed monthly HHI e.g. clearly reveals the annual structures of dryness and wetness. It allows easy identification of dry months and longer periods of dryness and droughts. In total, the synopsis reveals the generally high variability of dryness and wetness through time. Additionally, the time series clearly show that not only summer but also winter precipitation deficits occur. Springtime and autumn had also been affected. In this context, it is noticeable that in comparison to the analysis of summer droughts, comparatively few studies on spring, autumn or winter droughts are available. The same can be stated for the humidity aspect.
To highlight the medium-term development, a 5-year frequency low-pass filter was applied. It emphasizes a somewhat higher variability in the first 150 years (1500 until 1650), including a very remarkable contrast between the dry period 1630–1635 and the moist phase 1646–1651, which was followed by a negative trend until 1700. This represents the most striking medium-term change of the last 500 years. The moist phase 1692–1696 and the dry period 1740–1744 are also remarkable variations. Also, towards the end of the 18th century, very dry periods occurred during the 1770s and the 1790s. In addition, more dry months occurred in the period 1750–1911 than in the period after 1911. In the last few decades, no significant trends have occurred except for the most recent accumulation of extremes.
Even if the derived HHI shows some remarkable changes and a high variability on the 5-year scale, there is a remarkable stability of the annual humidity as expressed by the HSPI in the long-term 500-year perspective. In contrast, there are remarkable shifts and seasonal trends on the longer scale; for instance, winter humidity has increased while summer precipitation has decreased slightly during the last 150 years. There are also sections with comparable seasonal shifts and trends like an increase in winter humidity between 1590 and 1725 and in summer humidity between 1540 and 1690, as well a decrease in winter humidity between 1725 and 1800.
In order to further interpret the internal structure of this time series, a fast Fourier transformation was applied to the historical humidity index 1500–2018. This results in striking recurrence cycles at 22, 37 and 58 years. The same results can be found in the underlying indices, e.g., the HSPI.
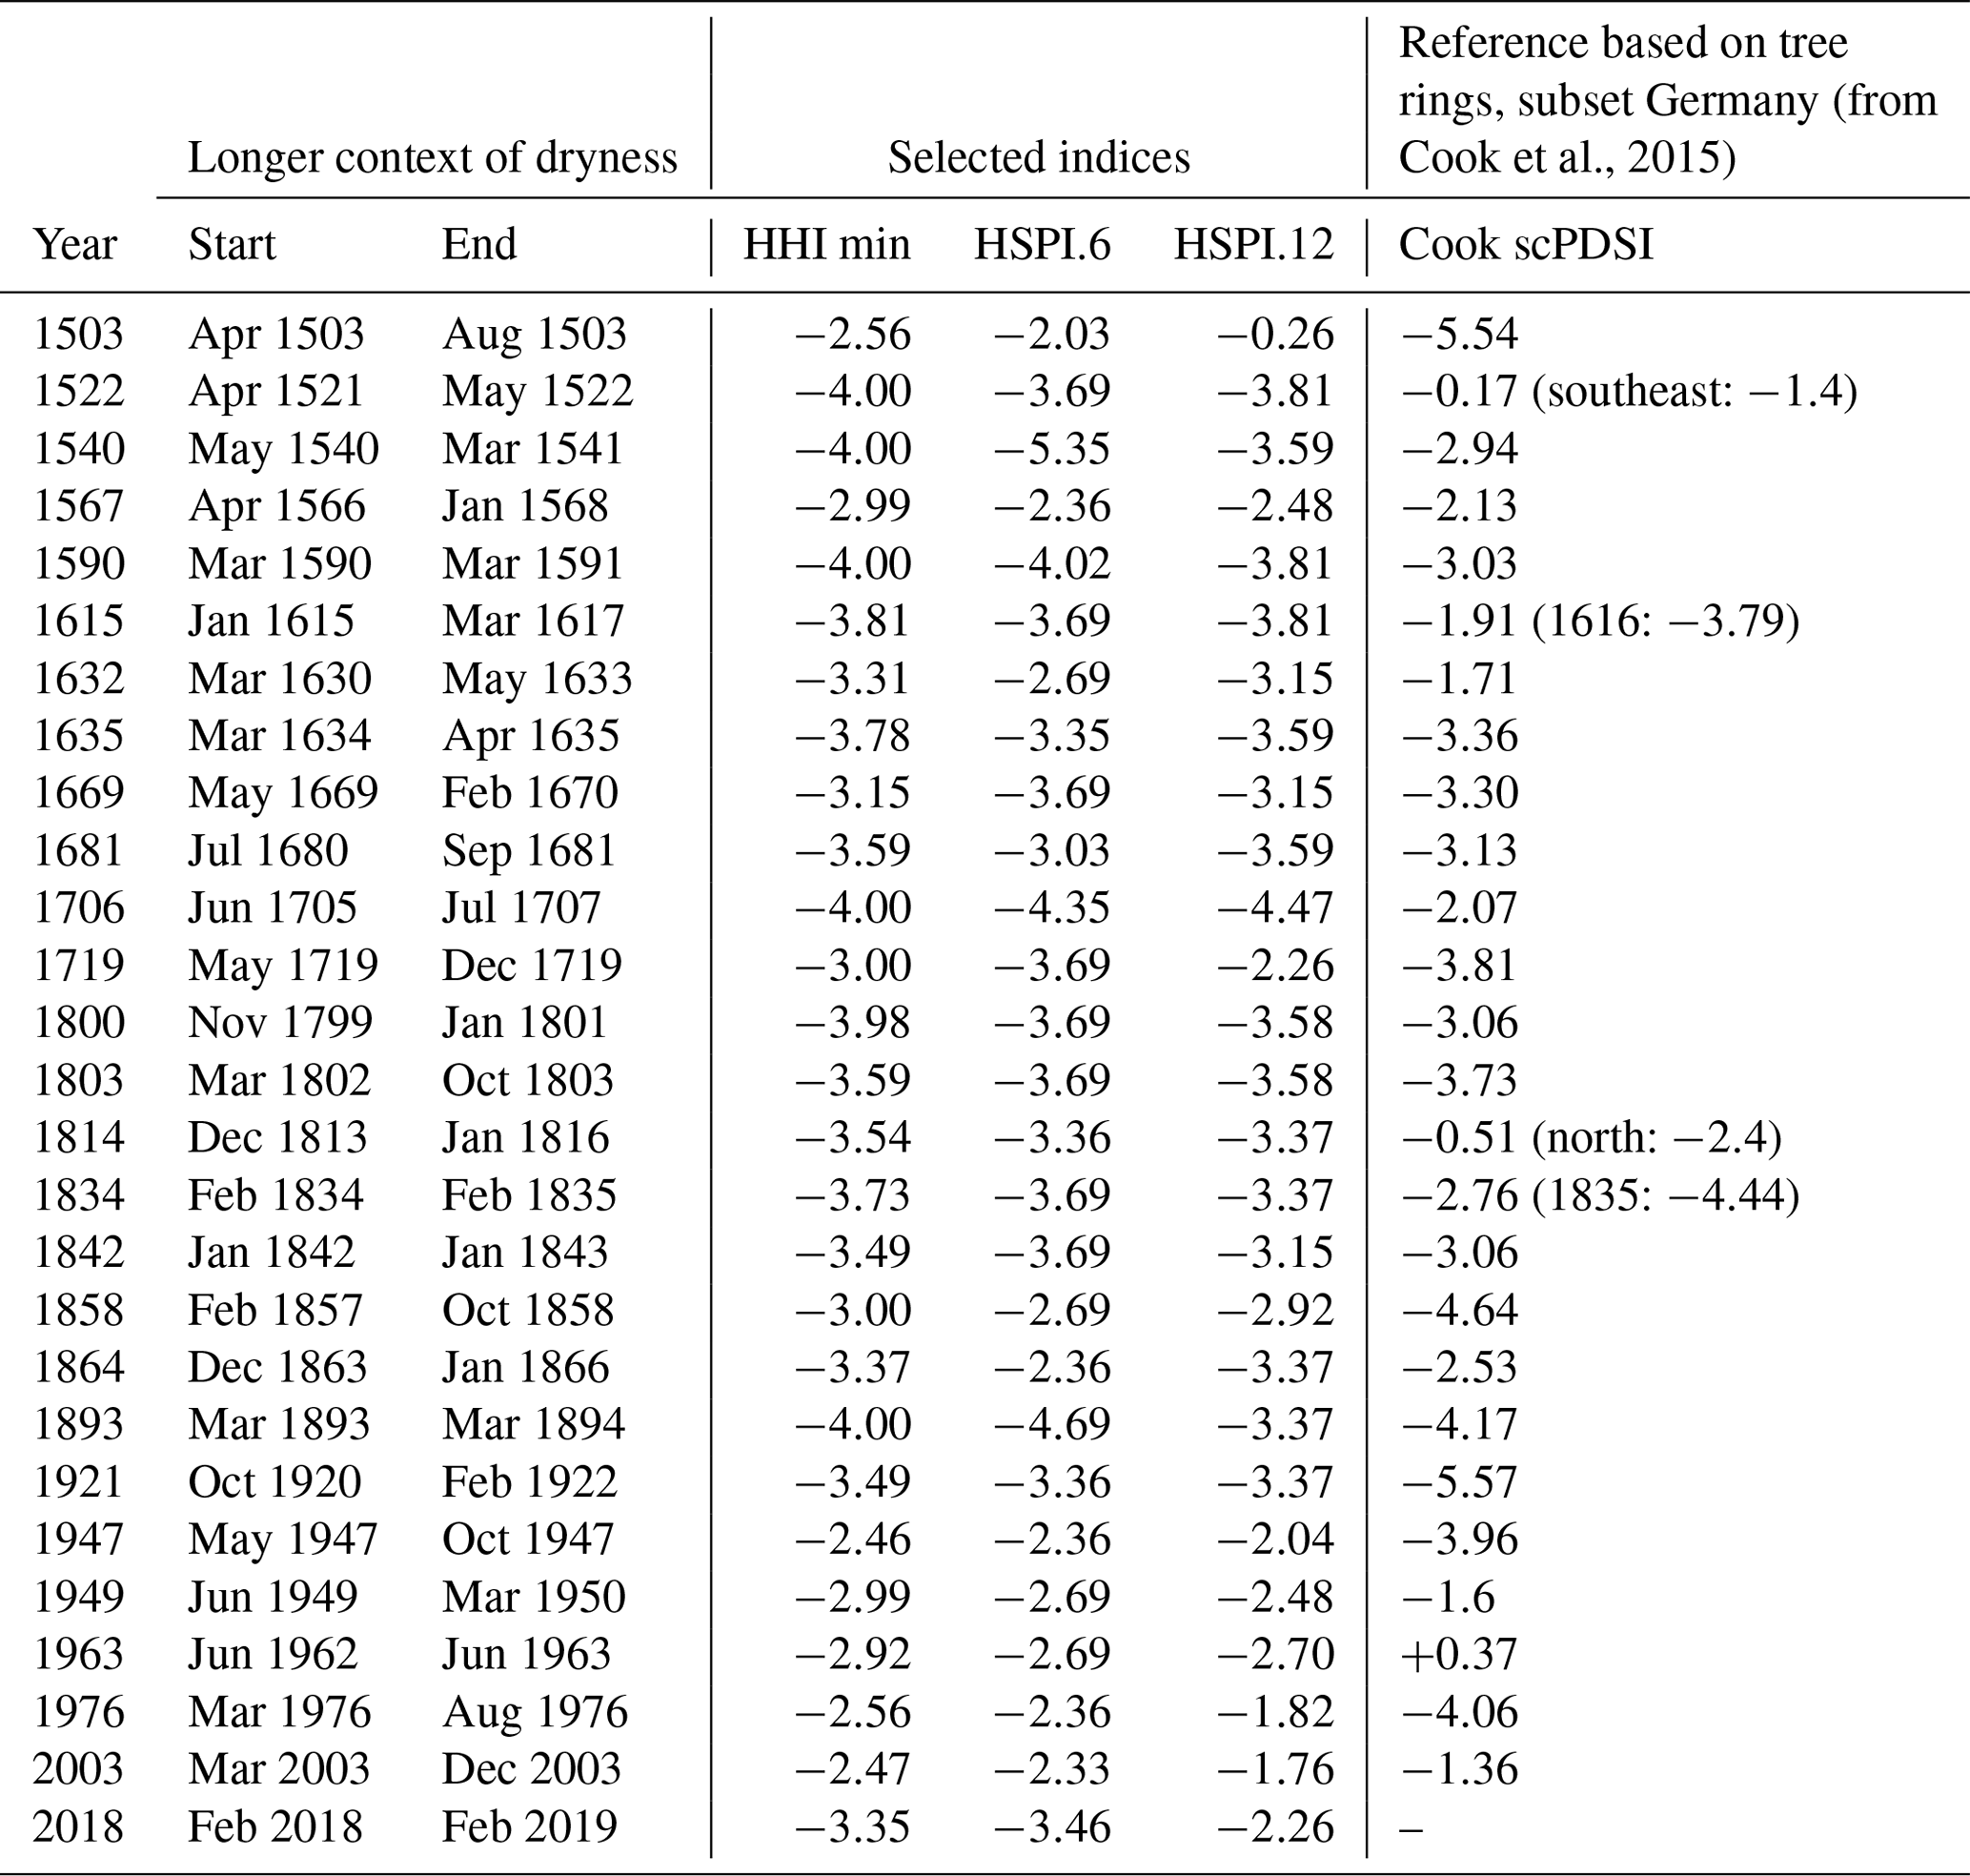
As can be seen, outstanding drought events have appeared in all centuries since 1500. These are in general represented by a particularly large number and higher differentiation of sources. One example is the drought year 1540, when 41 % of the 123 sources refer to agriculture, 17 % to water, 11 % to health, 10 % to forest fires, 8 % to soil, and 8 % to environmental and ecosystem issues. Other outstanding drought events are the 16th century droughts of 1503, 1522, 1567 and 1590. In the 17th century, 1615, 1632, 1635, 1669 and 1681 were described as exceptionally dry. The same can be stated for 1706 and 1719 during the 18th century. In the 19th century, the years 1800, 1803, 1834, 1842, 1858, 1864 and 1893 have been detected as drought years. For the 20th century, this was the case in 1921, 1947, 1949, 1963 and 1976. Finally, in the 21st century, there were drought events in 2003 and 2018 as can be seen in Table 4.
Table 4Table of outstanding drought periods since 1500 for Germany in relation to different indices.
To visualize the outstanding single drought years, we also derived a “yearcloud” of classified years from 1500 onward. It supports the comparison of the related extreme droughts to minor ones through time, especially between the modern and historical period.
The conceptual and methodological approach of this article using precipitation indices is well established in the research field of historical climatology (Glaser, 1991, 1996, 2013; Nash and Grab, 2010; Glaser and Riemann, 2009; Pfister, 1999; Brazdil et al., 2005, 2018). The analysis is based on written documents which were evaluated after a critical source analysis including hermeneutic principles (Glaser, 1991, 1996, 2013). Most of the written documents are part of the virtual research environment Tambora (tambora.org, 2018). There are a number of further comparable databases available which also provide such data like the NOAA paleoclimatology datasets (https://www.ncdc.noaa.gov/data-access/paleoclimatology-data/datasets/historical, last access: 7 July 2020), Old Weather (https://oldweather.org, last access: 7 July 2020), Pediflood (Barriendos et al., 2014), ICOADS (Woodruff et al., 2011), CLIWOC (García-Herrera et al., 2005), https://euroclimhist.ch (last access: 7 July 2020), EDII (Stahl et al., 2016) and REACHES 21 (Wang et al., 2018). As a standard in all of these databases, all records are numerically coded, comprising spatial, temporal and content aspects like from Tambora (tambora.org, 2018).
In a first step, a seven-scale index scheme was applied to deduce a monthly precipitation index. The derivation of such indices is also a fundamental step in historical climatology research (Brazdil et al., 2005). In addition to monthly precipitation indices, many long-term paleoclimate reconstructions of precipitation, dryness and drought refer to indices like SPI, SPEI, PDSI and scPDSI (Bradzil et al., 2013; Dobrovolny et al., 2015, 2018; Erfurt et al., 2019). Some approaches are based on dendrological data series (Briffa et al., 2009, 1994; Büntgen et al., 2010, 2011; Cook et al., 2015) or follow a multi-proxy approach (Dobrovolny et al., 2018). Many of these elaborations relate to different regions and have a distinct temporal resolution. Some refer to the whole of Europe (Spinoni et al., 2015; Cook et al., 2015), many refer to the neighboring Czech lands (Bradzil et al., 2013; Dobrovolny et al., 2015, 2018), while Erfurt et al. (2019) have worked on southwestern Germany, a subarea of Central Europe. Many papers refer to the summer or the springtime situation or the vegetation period, whereas some are based on yearly resolution. On the other side, Cook et al. (2015) model soil conditions and humidity and temperature effects based on dendrological data sets. They present high-resolution data, which sometimes look to be differentiated because of the aspects of the spatial dimensions of droughts. In the Central European climatological context, droughts can be regarded as large-scale phenomena. Dobrovolny et al. (2018) follow a multi-proxy approach, while Erfurt et al. (2019) take early instrumental readings into account. Such differences in the methodological approach might explain differences in the resulting trends and developments through time, as well as the rankings of the most outstanding events.
The long-term development and structures of the presented historical humidity index for Germany since 1500 are very similar to those of the precipitation reconstructions of Dobrovolny et al. (2015) and Mikšovský et al. (2019), which were also reconstructed for the neighboring Czech lands based on documentary and instrumental data. There are some coincidences like the exceptional increase in 1630–1650 in the SPI time series, developed by Mikšovský et al. (2019), as well as the negative trend of 1650–1700 with the dry period of 1692–1696. Also, the dry episodes of 1770–1780 are well represented, as well as the long-term trend of 1850–1820. Other ones like the 1790s are less exposed. There are also correspondences between the moist periods in the 1690s and the 1940s. Most of the described periods also appeared in the precipitation reconstructions of Dobrovolny et al. (2015). There is also the striking 1630–1650 increase, the decrease between 1650 and 1700, and the very dry period around the 1860s and at the end of the 18th century, especially 1775–1785, as well as the long-term increase between 1850 and 1920. While these go in parallel, other periods show an inverse development. Quite remarkable is the precipitation increase over the last decades.
With the presented approach it is possible to derive not only summer droughts but also droughts occurring in other seasons and over longer periods – even multiyear droughts can be identified. It also allows the derivation of winter droughts, something which is less focused on in the literature. An exception is, for example, Pfister et al. (2006) with the analysis of hydrological winter droughts of the last 450 years in the Upper Rhine area.
Concerning the correlation of the derived long-term trends in droughts with the temperature increase in the global warming trend, which is a major modern topic (Erfurt et al., 2019; Blauhut et al., 2016; Stahl et al., 2016), the results show that there is no comparable outstanding development to the anthropogenic temperature trend over the last 200 years. This also corresponds to the findings of Sheffield et al. (2012), Spinoni et al. (2015), and also of Noone et al. (2017) for Ireland. According to their analyses, drought frequency is increasing in southern Europe, with a reverse trend observed in northern Europe. Our study of Germany shows a remarkable long-term stability. The measured increase in drought events over the last decades must be regarded as normal from the long-term perspective. The historical variability is higher than the modern fluctuations since the 1950s. This is a remarkable statement for the long-term evaluation of precipitation fluctuations especially in the context of the modern climate change debate, and it underlines the importance of long-term reconstructions.
In general, the method itself is transferable whenever the relevant regions allow the application of the SPIs. The results and conclusions presented in this article refer to the spatial outline of modern Germany, which shows homogeneity for this approach. In difference to modern drought indices derived from instrumental records, multi-proxy approaches or dendrological data sets, the approaches related to historical climatology directly take into account the descriptions of impacts and societal consequences and reactions. Such a classification of hygric indications, as well as the descriptions of impacts and consequences, is here referred to as pathways.
The pathways are strongly coupled with the intensity and duration of the precipitation deficit. The agrarian, then the hydrological and finally the socio-economic consequences are presented in a progressing chain of effects. Structurally, they correspond to today's drought definitions and classifications. The descriptions of impacts and consequences and the derived pathways of historical events are in most cases comparable to recent events (Erfurt et al., 2019; Blauhut et al., 2016; Glaser et al., 2016, 2017, 2018; Brazdil et al., 2016, 2019 or Nash et al., 2019). Therefore, a parallelization is possible.
These statements apply to the pathways themselves but not to resilience and the underlying adaptation strategies. Obviously, these have developed over the centuries due to changes in social structures, assets and technical possibilities (Glaser et al., 2018; Camenisch and Rohr, 2018, Camenisch et al., 2016). In the historical context, for example, water-driven mills played a key role in food security. Due to a lack of water, horse mills or hand mills were set into operation. In today's context, on the other hand, the lower energy production of hydropower plants, or the shutdown of nuclear power plants due to low water or high water temperatures, plays a major role (DWD, 1947; BNN, 1947, 1949; Erfurt et al., 2019). In addition, within the historical period, i.e., before the establishment of the official measuring network in 1881, the social and technical possibilities and structures changed. From 1800 onward, the dominant agricultural and feudal structures were gradually replaced by the industrial revolution, which also involved new possibilities for adaptation, e.g., improved infrastructure, better technical equipment such as pumps, more expertise, and better hygiene and social welfare measures. The striking emigration waves of the 19th century from Germany to North America, which were also triggered by drought events, can be seen as another new adaptation option (Glaser et al., 2017). Additional innovations were the advent of the insurance industry (Kiermayr-Bühn, 2009) and institutional reactions in the modern age, understood as governance. Examples are the DWD's establishment of the heat warning system in 2005 as a result of the extremely hot summer of 2003 (Matzarakis, 2016) with its unexpectedly large number of heat deaths and the implementation of a new 2019 drought index after the extreme year of 2018 (DWD, 2019).
Nonetheless, there are many similarities between the recent and historical pathways. This enables the direct comparison of historically derived indices and classified descriptions with current assessments of drought categories and classifications according to NDMC (2018) and the German Weather Service (DWD, 2018, 2019).
The comprehensive data collections and derived time series also enable us to identify outstanding and correspondingly well-documented extreme drought events, as given in the 1-year filtered time series (see Fig. 8 and Table 4). Such compilations and rankings are quite common (e.g. Noone et al., 2017) but differ depending on the selected parameters and chosen indicators.
One well-known example is the extreme drought of 1540 (Wetter et al., 2014). The classification of 1540, its intensity and duration, caused a long and controversial discussion between the dendroclimatological community and the historical climatology community. With the presented approach we can underline the outstanding drought situation of 1540. Other ones like the extremes of 1522, 1590, 1615 and 1706 have already been described by Glaser (2013). Furthermore, the exceptional droughts during the 19th century like 1834 have been studied by Erfurt et al. (2019), and 1842 has been analyzed by Brazdil et al. (2019) in the European context. The specific situation of 1921 has also been outlined by Erfurt et al. (2019) and Brooks and Glasspoole (1922), as well as the more recent drought of 2003 described by Hémon et al. (2003) and Poumadère (2005) for France and Koppe and Jendritzky (2014), Glaser et al. (2018), and Erfurt et al. (2019) for Germany. Some identified droughts had their focus on other regions like 1503 in Hungary (Kiss et al., 2017) or 1976 in Great Britain (Doornkamp et al., 1980). Overall, such rankings are widespread. Depending on the weighting and methodological approaches, the drought catalog rankings vary somewhat for each year. In this sense a quite reasonable number of identified single drought events can be cross validated by existing research results, while other ones like the identified drought of 1893 can be added. Only contemporary papers point to this extreme year for England and parts of the continent (Lowe, 1893; Brodie, 1894).
The comparison of the identified extremes with the ones modeled by Cook et al. (2015) also shows the specific effects of trees. While e.g. 1615 is indicated as having a longer drought in the written documents, the dendro-signal peaks first in the following year 1616. The same can be stated for 1834/1835 (see Table 4).
Increasingly there is also the question of social impacts and long-term developments, especially regarding the effects of climate changes on human history. Such questions are usually answered using multiproxy approaches (Brazdil et al., 2019; Büntgen et al., 2010, 2011). In how far the methodical and content-related insights presented in this study can be integrated into these questions will be the subject of future analyses.
Historical reconstructions can contribute to the question of whether the recent extreme droughts, such as in 2018, 2015 and 2003, must be seen as another indicator of climate change. The given results show that the recent development of precipitation alone is still within the historical variability.
All data relevant for this study are available in the virtual research environment tambora.org via Temperature and Hygric Indices for Central Europe since AD 1500 https://doi.org/10.6094/tambora.org/2019/c493/csv.zip (Glaser and Kahle, 2019) https://www.tambora.org/index.php/grouping/event/list?g[cid]=493 (last access: 9 July 2020). The algorithms developed and used for this study are accessible via climdata/drought2019: Reconstructions of Droughts in Germany since 1500 https://doi.org/10.5281/zenodo.3405167 (Kahle and Glaser, 2019a). Additional visualisation is available via Droughts in Germany 1500–2019 https://doi.org/10.5446/45188 (Kahle and Glaser, 2019c) and https://doi.org/10.5446/45191 (Kahle and Glaser, 2019b).
RG performed the data research and the indexing process, RG and MK integrated the data into the Tambora collection, MK provided the calculations and the figures, and both developed the concept of this study and wrote the final paper.
The authors declare that they have no conflict of interest.
This article is part of the special issue “Droughts over centuries: what can documentary evidence tell us about drought variability, severity and human responses?”. It is not associated with a conference.
This study was carried out within the interdisciplinary research project DRIeR. We thank all participants for their collaboration and discussion.
This research has been supported by the Ministry of Science, Research and Art of Baden-Württemberg (Water Research Network, DRIeR).
This paper was edited by Günter Blöschl and reviewed by two anonymous referees.
Bachmair, S., Svensson, C., Hannaford, J., Barker, L. J., and Stahl, K.: A quantitative analysis to objectively appraise drought indicators and model drought impacts, Hydrol. Earth Syst. Sci., 20, 2589–2609, https://doi.org/10.5194/hess-20-2589-2016, 2016.
Badische Neueste Nachrichten (BNN): 53 Tropentage im Sommer 1947: Seit 100 Jahren kein Sommer so heiß und trocken wie 1947, Edition from 4 October 1947, available at: https://digital.blb-karlsruhe.de/blbz/periodical/pageview/4707190 (last access: 8 April 2019), 1947.
Badische Neueste Nachrichten (BNN): Absinken der Grundwasserstände. Teilweise wurden die Tiefstände des Dürresommers 1947 übertroffen, Edition from 19 September 1949, available at: https://digital.blb-karlsruhe.de/blbz/periodical/zoom/4711580 (last access: 8 April 2019), 1949.
Barriendos, M., Ruiz-Bellet, J. L., Tuset, J., Mazón, J., Balasch, J. C., Pino, D., and Ayala, J. L.: The ”“Prediflood” database of historical floods in Catalonia (NE Iberian Peninsula) AD 1035–2013, and its potential applications in flood analysis, Hydrol. Earth Syst. Sci., 18, 4807–4823, https://doi.org/10.5194/hess-18-4807-2014, 2014.
Benestad, R. E.: How often can we expect a record event?, Clim. Res., 25, 3–13, 2003.
Bernhofer, C., Hänsel, S., Schaller, A., and Pluntke, T.: Charakterisierung von meteorologischer Trockenheit, in: Landesamt für Umwelt, Landwirtschaft und Geologie (LfULG)-Schriftenreihe 7, 2015.
Blauhut, V., Gudmundsson, L., and Stahl, K.: Towards pan-European drought risk maps. Quantifying the link between drought indices and reported drought impacts, Environ. Res. Lett., 10, 14008, https://doi.org/10.1088/1748-9326/10/1/014008, 2015.
Blauhut, V., Stahl, K., Stagge, J. H., Tallaksen, L. M., De Stefano, L., and Vogt, J.: Estimating drought risk across Europe from reported drought impacts, drought indices, and vulnerability factors, Hydrol. Earth Syst. Sci., 20, 2779–2800, https://doi.org/10.5194/hess-20-2779-2016, 2016.
Brázdil, R., Pfister, C., Wanner, H., von Storch, H., and Luterbacher, J.: Historical climatology in Europe – the state of the art, Clim. Change, 70, 363–430, https://doi.org/10.1007/s10584-005-5924-1, 2005.
Brázdil, R., Dobrovolný, P., Trnka, M., Kotyza, O., Řezníčková, L., Valášek, H., Zahradníček, P., and Štěpánek, P.: Droughts in the Czech Lands, 1090–2012 AD, Clim. Past, 9, 1985–2002, https://doi.org/10.5194/cp-9-1985-2013, 2013.
Brázdil, R., Raška, P., Trnka, M., Zahradníček, P., Valášek, H., Dobrovolný, P., Řezníčková, L., Treml, P., and Stachoň, Z.: The Central European drought of 1947: causes and consequences, with particular reference to the Czech Lands, Clim. Res., 70, 161–178, https://doi.org/10.3354/cr01387, 2016.
Brázdil, R., Kiss, A., Luterbacher, J., Nash, D. J., and Řezníčková, L.: Documentary data and the study of past droughts: a global state of the art, Clim. Past, 14, 1915–1960, https://doi.org/10.5194/cp-14-1915-2018, 2018.
Brázdil, R., Demarée, G. R., Kiss, A., Dobrovolný, P., Chromá, K., Trnka, M., Dolák, L., Řezníčková, L., Zahradníček, P., Limanowka, D., and Jourdain, S.: The extreme drought of 1842 in Europe as described by both documentary data and instrumental measurements, Clim. Past, 15, 1861–1884, https://doi.org/10.5194/cp-15-1861-2019, 2019.
Briffa, K. R., Jones, P. D., and Hulme, M.: Summer moisture variability across Europe, 1892–1991: An analysis based on the Palmer drought severity index, Int. J. Climatol., 14, 475–506, https://doi.org/10.1002/joc.3370140502, 1994.
Briffa, K. R., van der Schrier, G., and Jones, P. D.: Wet and dry summers in Europe since 1750: evidence of increasing drought, Int. J. Climatol., 29, 1894–1905, https://doi.org/10.1002/joc.1836, 2009.
Brodie, F. J.: The great drought of 1893, and its attendant meteorological phenomena, Q. J. Roy. Meteor. Soc., 20, 1–30, https://doi.org/10.1002/qj.4970208901, 1894.
Brooks, C. E. P. and Glasspoole, J.: The drought of 1921, Q. J. Roy. Meteor. Soc., 48, 139–168, https://doi.org/10.1002/qj.49704820205, 1922.
Büntgen, U., Trouet, V., Frank, D., Leuschner, H. H., Friedrichs, D., Luterbacher, J., and Esper, J.: Tree-ring indicators of German summer drought over the last millennium, Quaternary Sci. Rev., 29, 1005–1016, https://doi.org/10.1016/j.quascirev.2010.01.003, 2010.
Büntgen, U., Brázdil, R., Heussner, K.-U., Hofmann, J., Kontic, R., Kyncl, T., Pfister, C., Chromá, K., and Tegel, W.: Combined dendro-documentary evidence of Central European hydroclimatic springtime extremes over the last millennium, Quaternary Sci. Rev., 30, 3947–3959, https://doi.org/10.1016/j.quascirev.2011.10.010, 2011.
Camenisch, C. and Rohr, C.: When the weather turned bad. The research of climate impacts on society and economy during the Little Ice Age in Europe. An overview, Cuadernos de Investigación Geográfica, 44, 99–114, https://doi.org/10.18172/cig.3395, 2018.
Camenisch, C., Keller, K. M., Salvisberg, M., Amann, B., Bauch, M., Blumer, S., Brázdil, R., Brönnimann, S., Büntgen, U., Campbell, B. M. S., Fernández-Donado, L., Fleitmann, D., Glaser, R., González-Rouco, F., Grosjean, M., Hoffmann, R. C., Huhtamaa, H., Joos, F., Kiss, A., Kotyza, O., Lehner, F., Luterbacher, J., Maughan, N., Neukom, R., Novy, T., Pribyl, K., Raible, C. C., Riemann, D., Schuh, M., Slavin, P., Werner, J. P., and Wetter, O.: The 1430s: a cold period of extraordinary internal climate variability during the early Spörer Minimum with social and economic impacts in north-western and central Europe, Clim. Past, 12, 2107–2126, https://doi.org/10.5194/cp-12-2107-2016, 2016.
Cook, E. R., Seager, R., Kushnir, Y., Briffa, K. R., Büntgen, U., Frank, D., Krusic, P. J., Tegel, W., van der Schrier, G., Andreu-Heyles, L., Bailie, M., Baittinger, C., Bleicher, N., Bonde, N., Brown, D., Carrer, M., Cooper, R., Čufar, K., Dittmar, C., Esper, J., Griggs, C., Gunnarson, B., Günther, B., Gutierrez, E., Haneca, K., Helama, S., Herzig, F., Heussner, K.-U., Hofmann, J., Janda, P., Kontic, R., Köse, N., Kyncl, T., Levanič, T., Linderholm, H., Manning, S., Melvin, T. M., Miles, D., Neuwirth, B., Nicolussi, K., Nola, P., Panayotov, M., Popa, I., Rothe, A., Seftigen, K., Seim, A., Svarva, H., Svoboda, M., Thun, T., Timonen, M., Touchan, R., Trotsiuk, V., Trouet, V., Walder, F., Ważny, T., Wilson, R., and Zang, C.: Old World megadroughts and pluvials during the Common Era, Sci. Adv., 1, e150061, https://doi.org/10.1126/sciadv.1500561, 2015.
DWD (Deutscher Wetterdienst in der US-Zone): Bericht der Alliierten. Zusammenfassende Übersicht der Dürreschäden im Sommer 1947, Bad Kissingen, 1947.
DWD (Deutscher Wetterdienst): Standardized Precipitation Index SPI, available at: https://www.dwd.de/DE/fachnutzer/landwirtschaft/dokumentationen/allgemein/spierlaeuterungen.pdf?__blob=publicationFile&v=1 (last access: 4 February 2019), 2018.
DWD: Das Hitzewarnsystem des Deutschen Wetterdienstes und seine Relevanz für die menschliche Gesundheit, available at: https://www.researchgate.net/publication/311262480_Das_Hitzewarnsystem_des_Deutschen_Wetterdienstes_DWD_und_seine_Relevanz_fur_die_menschliche_Gesundheit, last access: 14 August 2019a.
DWD: Climate Data Center, available at: https://opendata.dwd.de/climate_environment/CDC/regional_averages_DE/monthly/precipitation/ (last access: 7 January 2020), 2019b.
Dobrovolný, P., Brázdil, R., Trnka, M., Kotyza, O., and Valášek, H.: Precipitation reconstruction for the Czech Lands, AD 1501–2010, Int. J. Climatol., 35, 1–14, https://doi.org/10.1002/joc.3957, 2015.
Dobrovolný, P., Brázdil, R., Trnka, M., Rybníček, M., Kolář, T., Možný, M., Kyncl, T., and Büntgen, U.: A 500-year multi-proxy drought reconstruction for the Czech Lands, Clim. Past Discuss., https://doi.org/10.5194/cp-2018-160, 2018.
Doornkamp, J. C., Gregory, K. J., and Burn, A. S. (Eds.): Atlas of Drought in Britain 1975–76, London, 82 pp., 1980.
Dürr, F.: Chronik der Stadt Heilbronn, 741–1895, Unchanged reprint of the 2nd edition of 1926, Stadtarchiv, Heilbronn, 1986.
Erfurt, M., Glaser, R., and Blauhut, V.: Changing impacts and societal responses to drought in southwestern Germany since 1800, Reg. Environ. Change, 19, 1–13, https://doi.org/10.1007/s10113-019-01522-7, 2019.
Freiburger Zeitung: Freiburg 1784–1943, Edition from 20 July 1834, available at: https://fz.ub.uni-freiburg.de/show/fz.cgi?cmd=showpic&ausgabe=01&day=20&year=1834&month=07&project=3&anzahl=4 (last access: 8 April 2019), 1834.
García-Herrera, R., Können, G. P., Wheeler, D. A., Prieto, M. R., Jones, P. D., and Koek, F. B.: CLIWOC: a climatological database for the World's oceans 1750–1854, Climatic Change, 73, 1–12, 2005.
Glaser R: Klimarekonstruktion für Mainfranken, Bauland und Odenwald anhand direkter und indirekter Witterungsdaten seit 1500, Akademie der Wissenschaften und der Literatur, Paläoklimaforschung, No. 5, 175 pp., 1991 (in German).
Glaser, R: Data and Methods of Climatological Evaluation in Historical Climatology, Hist. Soc. Res., 21, 56–88, 1996.
Glaser, R.: Klimageschichte Mitteleuropas. 1200 Jahre Wetter, Klima, Katastrophen, 3rd edn., Primus, Darmstadt, 2013.
Glaser, R. and Gudd, M.: Aussagepotentiale historischer Witterungstagebücher – Das Jahr 1700 im Spiegel der Aufzeichnungen von Friedrich Hoffmann aus Halle – Erdkunde 50/4, University of Bonn, 328–340, 1996.
Glaser, R. and Kahle, M.: Monthly Temperature and Hygric Indices for Central Europe since AD 1500, Freidok, 193, https://doi.org/10.6094/tambora.org/2019/c493/csv.zip, 2019.
Glaser, R. and Riemann, D.: A thousand-year record of temperature variations for Germany and Central Europe based on documentary data, J. Quaternary Sci., 24, 437–449, 2009.
Glaser, R., Kahle, M., and Hologa, R.: The tambora.org data series edition, Freidok, 1, 1–6, https://doi.org/10.6094/tambora.org/2016/seriesnotes.pdf, 2016.
Glaser, R., Himmelsbach, I., and Bösmeier, A.: Climate of migration? How climate triggered migration from southwest Germany to North America during the 19th century, Clim. Past, 13, 1573–1592, https://doi.org/10.5194/cp-13-1573-2017, 2017.
Glaser, R., Riemann, D., Vogt, S., and Himmelsbach, I.: Long- and Short-Term Central European Climate Development in the Context of Vulnerability, Food Security, and Emigration, edited by: Leggewie, C. and Mauelshagen, F., Climate Change and Cultural Transition in Europe, Clim. Cult., 4, 85–118, 2018.
Gil-Guirado, S., Espín-Sánchez, J.-A., and Prieto, M. R.: Can we learn from the past? Four hundred years of changes in adaption to floods and droughts. Measuring the vulnerability in two Hispanic cities, Clim. Change, 139, 183–200, https://doi.org/10.1007/s10584-016-1768-0, 2016.
Gudmundsson, L. and Stagge, J. H.: SCI: Standardized Climate Indices such as SPI, SRI or SPEIR package version 1.0-2, 216.
Hémon, D., Jougla, E., and Clavel, J. : Surmortalité liée à la canicule d'août 2003 en France, in: Institut de veille sanitaire, Bulletin épidémiologique hebdomadaire. Impact sanitaire de la vague de chaleur d'août 2003 premiers résultats des travaux à mener, 45–46, 212–225, 2003.
Kahle, M. and Glaser R.: climdata/drought2019: Reconstructions of Droughts in Germany since 1500, Zenodo, https://doi.org/10.5281/zenodo.3405167, 2019a.
Kahle, M. and Glaser R.: Droughts in Germany 1500–2019 – Drought and Wetness showing Precipitation Index (PI), TIB AV-Portal, https://doi.org/10.5446/45191, 2019b.
Kahle, M. and Glaser R.: Droughts in Germany 1500–2019 – Drought Periods showing Precipitation Index (PI), TIB AV-Portal, https://doi.org/10.5446/45189, 2019c.
Kiermayr-Bühn, S.: Leben mit dem Wetter. Klima, Alltag und Katastrophe in Süddeutschland seit 1600, WBG, 158 pp., 2009.
Kiss, A.: Droughts and low water levels in late Medieval Hungary II: 1361, 1439, 1443–4, 1455, 1473, 1480, 1482(?), 1502–3, 1506: Documentary versus tree-ring (OWDA) evidence, J. Environ. Geogr., 10, 43–56, https://doi.org/10.1515/jengeo-2017-0012, 2017.
Klemm, F.: Über die meteorologischen Beobachtungen des Abtes Leonhard III. Treuttwein im Zisterzienserkloster Fürstenfeld von 1587–1593, Meteorol. Rundsch., 17, 139–143, 1964.
Klemm, F.: Über die meteorologischen Beobachtungen des Priors Kilian Leib im Augustinerchorherrenstift Rebdorf in der Zeit vom 22.4.1513–31.12.1531, Meteorol. Rundsch., 20, 72–77, 1967.
Koppe, C. and Jendritzky, G.: Die Auswirkungen von thermischen Belastungen auf die Mortalität, in: Warnsignal Klima: Gefahren für Pflanzen, Tiere und Menschen, edited by: Lozán, J. L., Grassl, H., Karbe, L., and Jendritzky, G., 2nd edn., available at: http://www.klima-warnsignale.uni-hamburg.de/wp-content/uploads/2014/03/koppe_jendritzky.pdf, (last access: 13 December 2018), 2014.
Lenke, W.: Klimadaten von 1621–1650 nach Beobachtungen des Landgrafen Hermann IV. von Hessen, Ber. d. Dt. Wetterd, Nr. 63, 3–51, 1960.
Lowe, E.: The Drought and Heat of 1893, Nature, 48, 437, https://doi.org/10.1038/048437a0, 1893.
Matzarakis, A.: Das Hitzewarnsystem des Deutschen Wetterdienstes (DWD) und seine Relevanz für die menschliche Gesundheit – Umweltmeteorologie, Gefahrstoffe – Reinhaltung der Luft, DWD, 76, 457–460, 2016.
McKee, T. B., Doesken, N. J., and Kleist, J.: The relationship of drought frequency and duration to time steps, in: Preprints, 8th Conference on Applied Climatology, 17–22 January 1993, Anaheim, CA, USA, 179–184, 1993.
Mikšovský, J., Brázdil, R., Trnka, M., and Pišoft, P.: Long-term variability of drought indices in the Czech Lands and effects of external forcings and large-scale climate variability modes, Clim. Past, 15, 827–847, https://doi.org/10.5194/cp-15-827-2019, 2019.
Nash, D. J. and Grab, S. W.: A sky of brass and burning winds, Documentary evidence of rainfall variability in the kingdom of Lesotho, southern Africa, 1824–1900, Clim. Change, 101, 617–653, 2010.
Nash, D. J., Klein, J., Endfield, G. H., Pribyl, K., Adamson, G. C. D., and Grab, S. W.: Narratives of nineteenth century drought in southern Africa in different historical source types, Clim. Change, 6, 467–485, https://doi.org/10.1007/s10584-018-2352-6, 2019.
National Drought Mitigation Center (NDMC): U.S. Drought Monitor, University of Nebraska-Lincoln, USA, available at: https://droughtmonitor.unl.edu/About/AbouttheData/DroughtClassification.aspx, last access: 7 July 2020.
Nees, G. and Kehrer, H.: Alzenauer Wetterchronik. Die interessantesten Wetterereignisse in Alzenau, im Kahlgrund und am Untermain von 265 bis 1999, Keim, Weil der Stadt, 2002.
Noone, S., Broderick, C., Duffy, C., Matthews, T., Wilby, R. L., and Murphy, C.: A 250-year drought catalogue for the island of Ireland (1765–2015), Int. J. Climatol., 37, 239–254, https://doi.org/10.1002/joc.4999, 2017.
Palmer, W. C.: Meteorological Drought, Office of Climatology Research Paper 45, U.S. Weather Bureau, Washington, USA, 1965.
Pfister, C.: Wetternachhersage, 500 Jahre Klimavariationen und Naturkatastrophen (1496–1995), Paul Haupt, Bern, Stuttgart, Wien, 1999.
Pfister, C., Weingartner, R., and Luterbacher, J.: Hydrological winter droughts over the last 450 years in the upper rhine basin: A methodological approach, Hydrol. Sci. Spec. Issue Hist. Hydrol., 51, 966–985, 2006.
Poumadère, M., Mays, C., Le Mer, S., and Blong, R.: The 2003 heat wave in France: dangerous climate change here and now, Risk. Anal., 25, 1483–1494, 2005.
Riemann, D., Glaser, R., Kahle, M., and Vogt, S.: The CRE tambora.org – new data and tools for collaborative research in climate and environmental history, Geosci. Data J., 2, 63–77, https://doi.org/10.1002/gdj3.30, 2015.
Sheffield, J., Wood, E. F., and Roderick, M. L.: Little change in global drought over the past 60 years, Nature, 491, 435–438, https://doi.org/10.1038/nature11575, 2012.
Spinoni, J., Naumann, G., Vogt, J., and Barbosa, P.: European drought climatologies and trends based on a multi-indicator approach, Global Planet. Change, 127, 50–57, https://doi.org/10.1016/j.gloplacha.2015.01.012, 2015.
Stagge, J. H., Rizzi, J., Tallaksen, L. M., and Stahl, K.: Future meteorological drought: Projections of regional climate models for Europe, DROUGHT-R&SPI Technical Report No. 25, 2015a.
Stagge, J. H., Tallaksen, L. M., Gudmundsson, L., van Loon, A., and Stahl, K.: Candidate Distributions for Climatological Drought Indices (SPI and SPEI), 2015, Int. J. Climatol., 35, 4027–4040, https://doi.org/10.1002/joc.4267, 2015b.
Stagge, J. H., Tallaksen, L. M., Gudmundsson, L., van Loon, A., and Stahl, K.: Response to comment on “Candidate Distributions for Climatological Drought Indices (SPI and SPEI)”, Int. J. Climatol., 36, 2132–2138, https://doi.org/10.1002/joc.4564, 2016.
Stahl, K., Kohn, I., Blauhut, V., Urquijo, J., De Stefano, L., Acácio, V., Dias, S., Stagge, J. H., Tallaksen, L. M., Kampragou, E., Van Loon, A. F., Barker, L. J., Melsen, L. A., Bifulco, C., Musolino, D., de Carli, A., Massarutto, A., Assimacopoulos, D., and Van Lanen, H. A. J.: Impacts of European drought events: insights from an international database of text-based reports, Nat. Hazards Earth Syst. Sci., 16, 801–819, https://doi.org/10.5194/nhess-16-801-2016, 2016.
Svoboda, M., Hayes, M., and Wood, D.: Standardized Precipitation index, User guide, World Meteorological Organization, Geneva, 2012.
tambora.org: About tambora.org, available at: https://www.tambora.org/index.php/site/page?view=about, last acces: 28 January 2018.
Van Dijk, A. I. J. M., Beck, H. E., Crosbie, R. S., Jeu, R. A. M. de, Liu, Y. Y., Podger, G. M., Timbal, B., and Viney, N. R.: The Millennium Drought in southeast Australia (2001–2009): Natural and human causes and implications for water resources, ecosystems, economy, and society, Water Resour. Res., 49, 1040–1057, https://doi.org/10.1002/wrcr.20123, 2013.
Vicente-Serrano, S. M., Beguería, S., and López-Moreno, J. I.: A Multiscalar Drought Index Sensitive to Global Warming: The Standardized Precipitation Evapotranspiration Index, J. Climate, 23, 1696–1718, https://doi.org/10.1175/2009JCLI2909.1, 2010.
Wang, P. K., Lin, K.-H. E., Liao, Y. C., Liao, H. M., Lin, Y. S., Hsu, C. T., Hsu, S. M., Wan, C. W., Lee, S. Y., Fan, I. C., Tan, P. H., and Ting, T. T.: Construction of the REACHES 21 climate database based on historical documents of China, Sci. Data, 5, 180288, https://doi.org/10.1038/sdata.2018.288, 2018.
Wetter, O., Pfister, C., Werner, J. P., Zorita, E., Wagner, S., Seneviratne, S. I., Herget, J., Grünewald, U., Luterbacher, J., Alcoforado, M.-J., Barriendos, M., Bieber, U., Brázdil, R., Burmeister, K. H., Camenisch, C., Contino, A., Dobrovolný, P., Glaser, R., Himmelsbach, I., Kiss, A., Kotyza, O., Labbé, T., Limanówka, D., Litzenburger, L., Nordli, Ø., Pribyl, K., Retsö, D., Riemann, D., Rohr, C., Siegfried, W., Söderberg, J., and Spring, J.-L.: The year-long unprecedented European heat and drought of 1540 – a worst case, Clim. Change, 125, 349–363, https://doi.org/10.1007/s10584-014-1184-2, 2014.
Wilhite, D. A.: Drought as a Natural Hazard: Concepts and Definitions, in: Drought, A global assessment, edited by: Wilhite, D. A., Routledge, London, 2000.
Woodruff, S. D., Worley, S. J., Lubker, S. J., Freeman, J. E., Berry, D. I., Brohan, P., Kent, E. C., Reynolds, R. W., Smith, S. R., and Wilkinson, C.: ICOADS Release 2.5: extensions and enhancements to the surface marine meteorological archive, Int. J. Climatol., 31, 951–967, 2011.
Zargar, A., Sadiq, R., Naser, B., and Khan, F. I.: A review of drought indices, Environ. Rev., 19, 333–349, https://doi.org/10.1139/A11-013, 2011.
Zink, M., Samaniego, L., Kumar, R., Thober, S., Mai, J., Schäfer, D., and Marx, A.: The German drought monitor, Environ. Res. Lett., 11, 074002, https://doi.org/10.1088/1748-9326/11/7/074002, 2016.