the Creative Commons Attribution 4.0 License.
the Creative Commons Attribution 4.0 License.
 | 09 Jun 2020
Can morphological features of coccolithophores serve as a reliable proxy to reconstruct environmental conditions of the past?
Ulf Riebesell
Lennart Thomas Bach
Morphological changes in coccoliths, tiny calcite platelets covering the outer surface of coccolithophores, can be induced by physiological responses to environmental changes. Coccoliths recovered from sedimentary successions may therefore provide information on paleo-environmental conditions prevailing at the time when the coccolithophores were alive. To calibrate the biomineralization responses of ancient coccolithophore to environmental changes, studies often compared the biological responses of living coccolithophore species with paleo-data from calcareous nannofossils. However, there is uncertainty whether the morphological responses of living coccolithophores are representative of those of the fossilized ancestors. To investigate this, we exposed four living coccolithophore species (Emiliania huxleyi, Gephyrocapsa oceanica, Coccolithus pelagicus subsp. braarudii, and Pleurochrysis carterae) that have been evolutionarily distinct for hundreds of thousands to millions of years, to a range of environmental conditions (i.e., changing light intensity, Mg∕Ca ratio, nutrient availability, temperature, and carbonate chemistry) and evaluated their responses in coccolith morphology (i.e., size, length, width, malformation). The motivation for this study was to test if there is a consistent morphological response of the four species to changes in any of the tested abiotic environmental factors. If this was the case, then this could suggest that coccolith morphology can serve as a paleo-proxy for that specific factor because this response is conserved across species that have been evolutionary distinct over geological timescales. However, we found that the four species responded differently to changing light intensity, Mg∕Ca ratio, nutrient availability, and temperature in terms of coccolith morphology. The lack of a common response reveals the difficulties in using coccolith morphology as a paleo-proxy for these environmental drivers. However, a common response was observed under changing seawater carbonate chemistry (i.e., rising CO2), which consistently induced malformations. This commonality provides some confidence that malformations found in the sedimentary record could be indicative of adverse carbonate chemistry conditions.
- Article
(4203 KB) - Full-text XML
-
Supplement
(1095 KB) - BibTeX
- EndNote


Coccolithophores are calcifying marine phytoplankton and are among the most important calcifiers in the ocean (Tyrrell and Young, 2009). They produce single calcitic platelets named coccoliths and nannoliths. Due to their ability to calcify, coccolithophores played an important role in rock-formation during the Jurassic and Cretaceous as well as through the Cenozoic (e.g., Erba, 2006). They are directly affected by environmental drivers such as temperature, salinity, nutrient concentration, light, and carbonate chemistry that can modify physiological rates and morphology of certain taxa (e.g., Paasche, 1998; Riebesell et al., 2000; Langer et al., 2006; Trimborn et al., 2007; Zondervan et al., 2007; Rosas-Navarro et al., 2016). Due to their sensitivities to environmental changes fossil remains of coccolithophores (coccoliths and nannoliths) have often been used as paleo-proxies to reconstruct past physical and chemical conditions in the surface ocean of local or global significance (e.g., Erba, 1994; Lees et al., 2005; Tiraboschi et al., 2009; Erba et al., 2010, 2019; Lübke and Mutterlose, 2016; Faucher et al., 2017a; S1 in the Supplement). To calibrate the biomineralization responses of ancient coccolithophorid algae to climatic changes, studies often compared the biological responses of living coccolithophore species with paleo-data from calcareous nannofossils (Table 1).
Table 1Compilation of papers documenting morphological (malformation) or morphometrical variations in calcareous nannofossils. We considered papers that compared shape and size variations in calcareous nannoplankton in the fossil record with biological responses of living coccolithophores from culture experiments. Papers are organized in alphabetic order; the following information is given: authors, analyzed species, morphological and morphometrical variations, environmental parameter/s considered for the detected alteration, age, and investigated cores/sections.

The primary goal of our study was to understand if physiological experiments with contemporary species are a valid tool to predict responses of ancient coccolithophores to environmental change in the geological record. The assumption that modern species respond identically to environmental change as ancient species did is implicit in many studies (e.g., Giraud et al., 2006; Erba et al., 2010; Faucher et al., 2017a, Table 1) but, to the best of our knowledge, has not been explored in depth. To test this assumption, we did a series of identical stress test experiments with four selected modern species that have been evolutionarily distinct for hundreds of thousands to millions of years (Fig. 1). Our hypothesis was as follows: in the case that coccolith morphology responses to a changing environmental driver are similar in the four species, this could be indicative of a response pattern that was physiologically conserved over geological timescales because the species were evolutionarily separated for so long. In other words, if species conserve a similar response to certain types of environmental change for geological timescales, despite very different evolutionary trajectories, then this would strengthen our confidence that responses recorded for modern species also apply for the geological past.
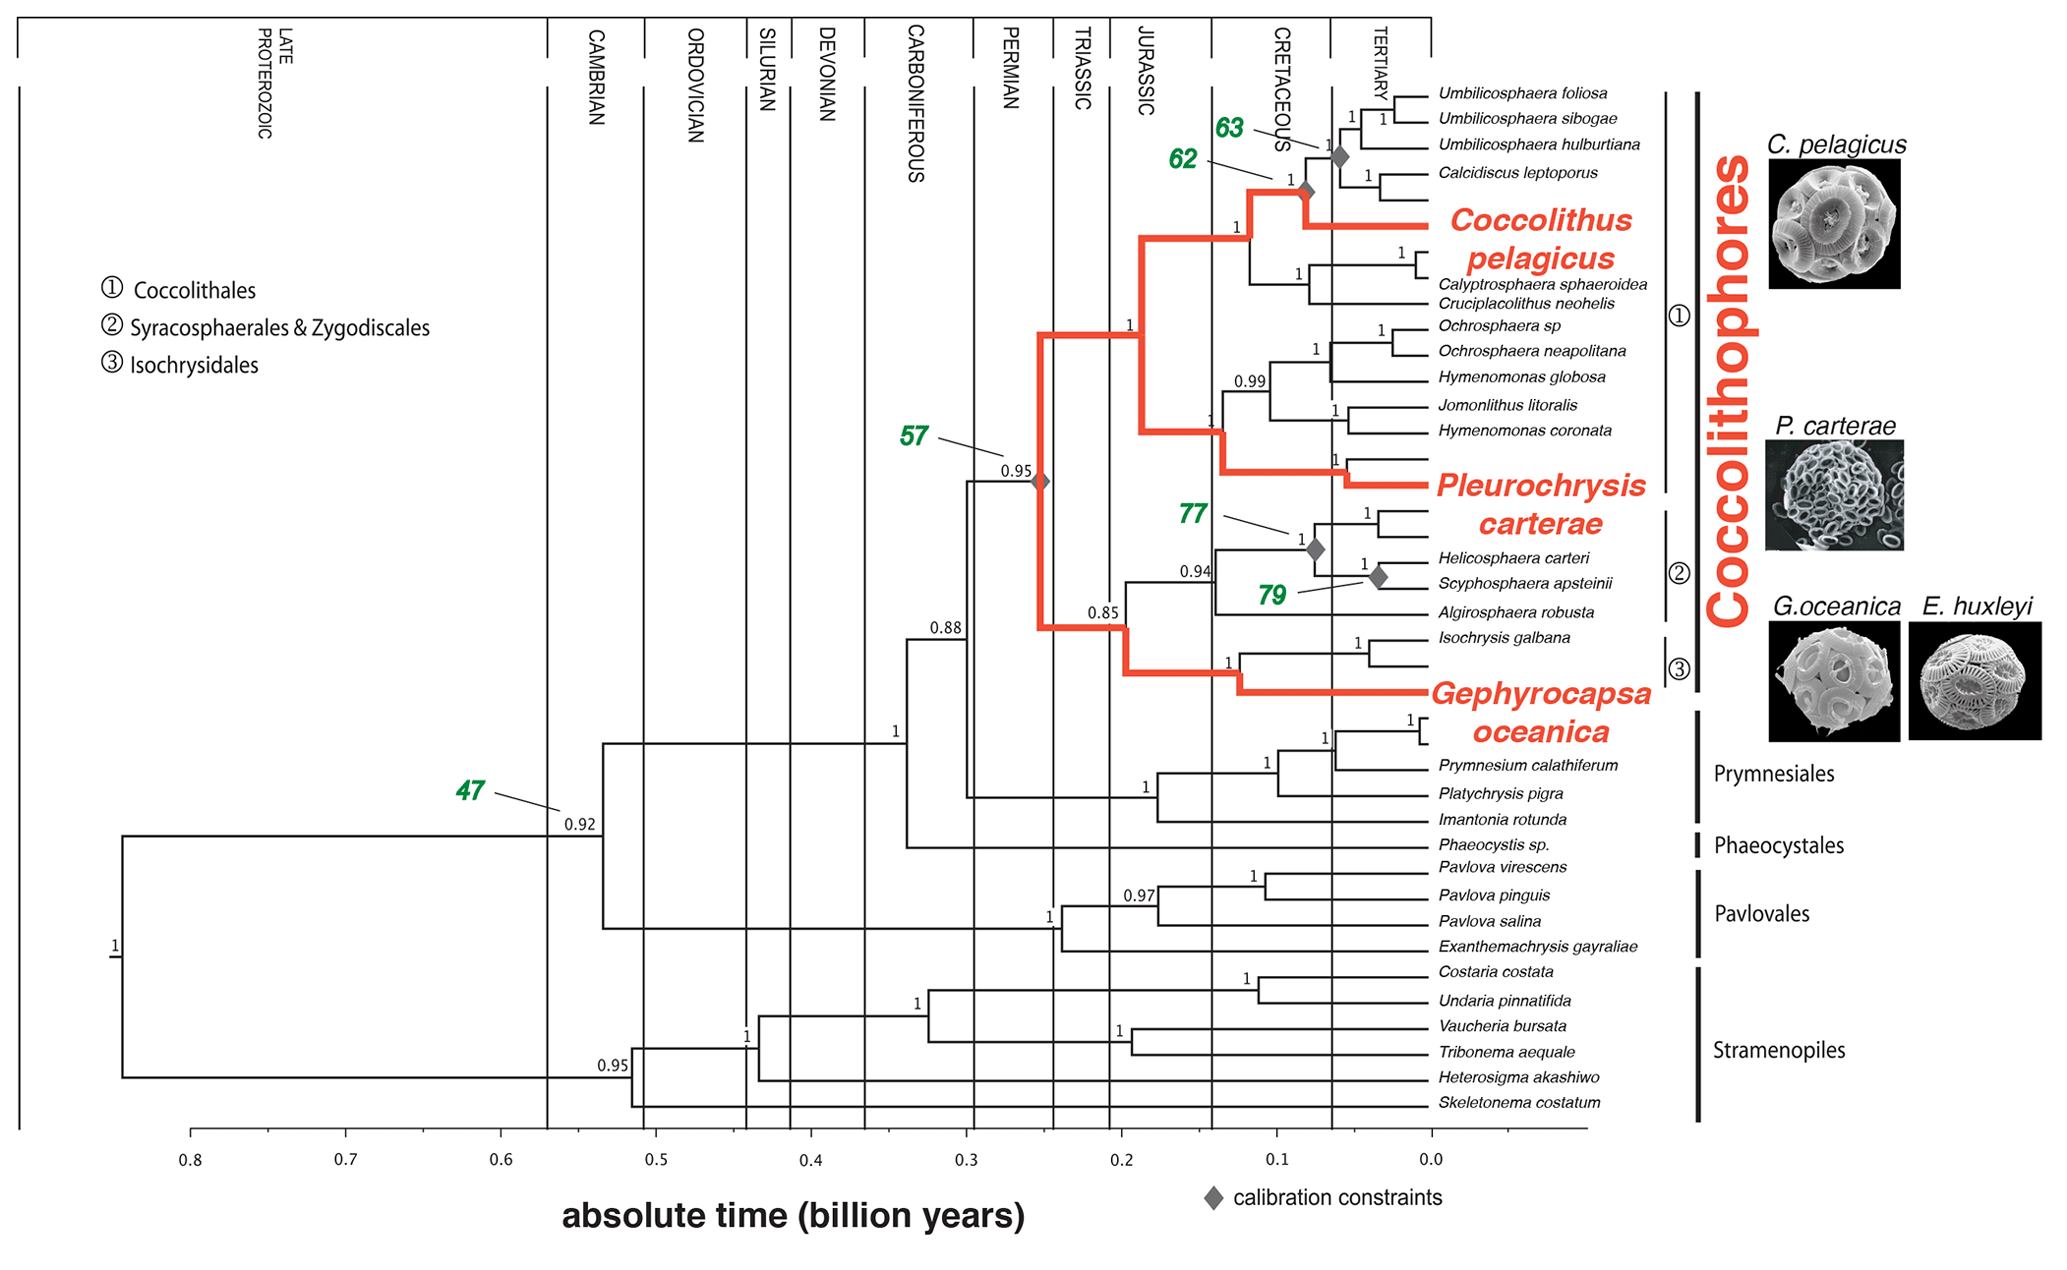
Figure 1Phylogeny and divergence times of the Haptophytes, modified from Liu et al. (2010). Time is indicated in billion years. The species selected for this study are shown in red. The nodes represent following divergence episodes. The number in green represents specific nodes: node 47: Exanthemachrysis gayraliae and Helicosphaera carteri; node 57: Coccolithus pelagicus and H. carteri; node 62: C. pelagicus and Umbilicosphaera hulburtiana; node 63: Calcidiscus leptoporus and Umbilicosphaera foliosa; node 77: Coronosphaera mediterranea and Scyphosphaera apsteinii; and node 79: H. carteri and S. apsteinii. Numbers are related to calculated divergence times. For further information see Liu et al. (2010).
Indeed, there is considerable uncertainty when trying to reconstruct paleo-environmental conditions based on coccolith morphology. This in itself is not surprising considering that there are millions of years of evolution between the time when the fossil coccolithophores lived and when the physiological experiments were done (Bown, 2005; De Vargas et al., 2007). Moreover, for the fossil record, it is extremely difficult to disentangle the individual factor(s) that drove changes in coccolith morphology. Therefore, it is unsurprising that studies occasionally come to different conclusions about what environmental factor drove a morphological change in the paleo-record. For example, Erba et al. (2010), detected the reduction in size and variation in shape of some nannofossil species during a time of excess volcanogenic CO2 emissions. They explained their trend with detrimental carbonate chemistry conditions based on physiological incubation studies by Riebesell et al. (2000) who found decreasing calcification rates under increasing CO2. Conversely, Bornemann and Mutterlose (2006) explained decreasing coccolith size with decreasing sea surface temperature, a conclusion that was also based on incubation experiments with living coccolithophore species (Renaud and Klaas, 2001; Renaud et al., 2002).
In order to investigate our hypothesis outlined above, we selected four different coccolithophore species: Emiliania huxleyi (morphotype R), Gephyrocapsa oceanica, Coccolithus pelagicus subsp. braarudii, and Pleurochrysis carterae. According to “molecular-clock-data”, they are evolutionarily distinct since the Triassic or the Jurassic (with the exception of G. oceanica and E. huxleyi, which diverged ∼290 Kya; Liu et al., 2010; Bendif et al., 2014). We present data on how coccolith size and morphology change in response to a suite of different environmental drivers and explore whether there is a common response to any of these drivers among the different species. Afterwards, we discuss if morphological features of coccoliths have the potential to serve as paleo-proxies.
2.1 Experimental setup
Five experiments are presented in this study with a similar design. Every experiment tested the influence of one abiotic parameter on four different coccolithophore species which were cultured individually (i.e., in separate bottles). The tested abiotic factors were as follows: light intensity, nutrient limitations (N or P limitations), Mg∕Ca ratio, temperature, and carbonate chemistry. Monospecific cultures of the coccolithophores Emiliania huxleyi (strain RCC 1216, from the Tasmanian sea), Gephyrocapsa oceanica (strain RCC 1303, from the French coast of the Atlantic Ocean), Coccolithus pelagicus subsp. braarudii (strain PLY182G; it will be called hereafter C. braarudii, from the English Channel, Atlantic Ocean), and Pleurochrysis carterae (unknown strain number, coastal species) were grown in artificial seawater (Kester et al., 1967) under dilute batch culture conditions (LaRoche et al., 2010). The artificial seawater medium was enriched with 64 µmol kg−1 nitrate, 4 µmol kg−1 phosphate to avoid nutrient limitations with the exception of the nutrient limitation experiment (see Sect. 2.1.3). In all experiments we added f∕8 concentrations of vitamins and trace metals (Guillard and Ryther, 1962), 10 nmol kg−1 of SeO2 (Danbara and Shiraiwa, 1999), and 2 mL kg−1 of natural North Sea water to provide potential nutrients which were not added with the nutrient cocktail (Bach et al., 2011). The medium was sterile-filtered (0.2 µm). The carbonate chemistry was adjusted with aeration for 24 h using a controlled CO2 gas mixing system reaching the treatment levels of fCO2 400 µatm (total alkalinity, TA, 2302 µmol kg−1) with the exception of the carbonate chemistry experiment (see Sect. 2.1.5).
The medium was then transferred into 0.5 L Nalgene™ bottles. Cultures were incubated in a thermo-constant climate chamber (Rubarth Apparate GmbH) at a constant temperature of 15 ∘C, (with the exception of the temperature experiment; see Sect. 2.1.4), with a 16 : 8 (hour : hour) light / dark cycle, at a photon flux density of 150 µmol photons m−2 s−1 (with the exception of the light experiment; see Sect. 2.1.1). Before the beginning of the experiments, coccolithophore cultures were acclimated for about 7–10 generations to each of the experimental conditions. Cultures were in the exponential growth phase at the initiation of the experiments (also in the nutrient limitation experiment; see Sect. 2.1.3). All culture bottles were manually and carefully rotated three times a day, each time with 20 rotations in order to reduce sedimentation bias. Final samples were taken when cells were exponentially growing (except for nutrient limitation experiments; see Sect. 2.1.3) but cell numbers were still low enough to limit their influence on the chemical conditions of the growth medium. Sampling was conducted at the same time for every experiment to avoid changes in cell diameter/volume, which develop in light–dark cycles due to the synchrony of the cell cycle (Müller et al., 2012; Sheward et al., 2017).
2.1.1 Specifics in the light experiment
The light setup was adjusted to test the response of the four species to a gradient of photon flux densities (PFD). Because light intensities are difficult to replicate we chose a gradient design in this experiment at the expense of replication (Cottingham et al., 2005). Therefore, the light was set to the highest possible intensity in the light chamber, and the bottles were placed at different positions so that 12 different PFDs were established (50, 100, 150, 200, 250, 300, 350, 400, 450, 500, 550, 600 µmol photons m−2 s−1). Light intensities were measured at every treatment position in the light chamber, using a Li-250A light meter (Li-Cor, Heinz Walz GmbH, Effeltrich).
2.1.2 Specifics in the Mg∕Ca experiment
This experiment was designed to test the physiological response of coccolithophore algae to changing [Ca2+] while keeping [Mg2+] constant at the modern seawater value. In the control, the Mg∕Ca ratio was set to simulate the modern ocean values () with mmol L−1 and [ mmol L−1. The low-Mg∕Ca treatments were set by increasing [Ca2+] to 25 and 50 mmol L−1, respectively. The control and both treatments were replicated three times.
2.1.3 Specifics in the nutrient experiment
Batch cultures were grown under N or P limitations. For N limitation, all cultures were run into N limitation during the acclimation phase, but care was taken that this occurred at low cell densities so that the chemical conditions in the seawater (apart from nutrients) remained largely unaffected. During the main experiment, cell concentrations were counted every other day, and 0.14 pmol N per cell (as NaNO3) was added to the medium when cultures reached the stationary phase (i.e., they stopped dividing). The same was done in P limitation experiments except that 0.01 pmol P per cell (as NaH2PO4) was added when reaching the stationary phase. As control, we used exponentially growing cells which were replete in both N and P. Nutrient concentrations were not measured, but limitations were assured by measuring and comparing growth rates which were much lower than in the nutrient replete controls. Controls and both treatments were replicated three times.
2.1.4 Specifics in the temperature experiment
The experiments were carried out in two temperature-controlled light chambers in order to test the response of the coccolithophores to increased temperature. Batch cultures were grown at 15 and 22.5 ∘C. Both temperature treatments were replicated three times.
2.1.5 Specifics in the carbonate chemistry experiment
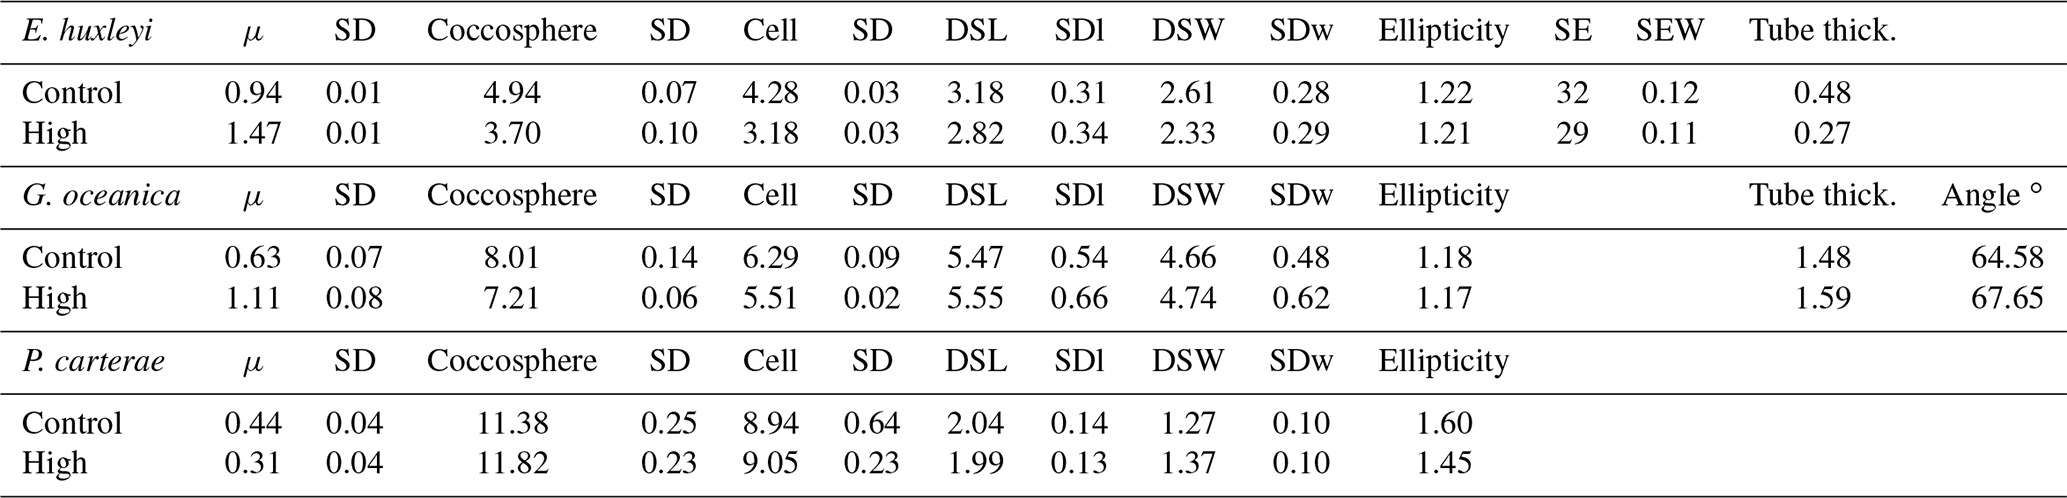
In the ocean acidification (OA) treatment, TA was kept constant (2348 µmol kg−1), whereas fCO2 was increased to 1020.5 µatm. In the Cretaceous scenario1 (CS1) treatment, fCO2 was kept constant at 1020.5 µatm, while TA was increased to 3729 µmol kg−1. In the Cretaceous scenario2 (CS2) treatment, fCO2 was increased up to 3061 µatm and TA up to 4978 µmol kg−1. Carbonate chemistry parameters (pHf – free scale, , , CO2) were calculated using the program CO2SYS (Pierrot et al., 2006) from measured TA and calculated estimated dissolved inorganic carbon (DIC), temperature, salinity, and [PO4], and the dissociation constants determined by Roy et al. (1993). In the OA, CS1, and CS2 treatments, DIC and TA levels were adjusted by adding calculated amounts of Na2CO3 (Merck, Suprapur quality and dried for 12 h at 500 ∘C) and hydrochloric acid (3.571 mol L−1, certified by Merck) following Gattuso et al. (2010).
Samples for pH and TA analyses were taken at the beginning and at the end of the experiments. Samples were filtered (0.7 µm) and stored at 4 ∘C until measurements that were performed within 2 d for pH measurements and 14 d for TA. pH was measured spectrophotometrically with Varian Cary 100 in 10 cm cuvette at 25 ∘C as described in Dickson et al. (2007) and then recalculated to in situ temperature (15 ∘C) using CO2SYS as is described by Schulz et al. (2017). Every sample was measured three times. Samples for TA were measured in duplicate with a Metrohm 862 Compact Titrosampler device following Dickson (2003). TA data were accuracy controlled with certified reference material (A. Dickson, La Jolla, CA).
2.2 Cell abundance, coccosphere, and cell size
Samples for cell abundance were taken at the end of the experiment with the exception of the nutrient experiments where samples were taken every second day. Incubation bottles were turned to resuspend all cells and to obtain a homogenous suspension of the cells before sampling. Cell numbers were immediately measured three times without addition of preservatives using a Beckman Multisizer Coulter counter. After the abundance measurements, samples were acidified with 0.1 mmol L−1 HCl to dissolve all free and attached coccoliths and subsequently measured another three times each in order to obtain cell diameters and volumes (Müller et al., 2012).
2.3 Scanning electron microscopy (SEM)
Samples for SEM analysis were filtered by gravity onto polycarbonate filters (0.2 µm pore size). For every sample, 5–10 mL of water was used. Filters were subsequently dried at 60 ∘C for 2 d. Samples were sputtered with gold–palladium. SEM analysis was performed at the Earth Sciences department of the University of Milan with SEM Cambridge Stereoscan 360. All pictures were taken with the same magnification (5000×), and the scale bar given on SEM pictures was used for calibration. For every experiment, in all treatments and replicates, 50 specimens for each species were analyzed. For every coccolith, the length (DSL) and the width (DSW) of the coccolith distal shield were manually measured using the public domain program Fiji distributed by ImageJ software (Schindelin et al., 2012). For E. huxleyi, the inner tube thickness, the number of distal shield elements, and the distal shield elements thickness were also measured. For G. oceanica the tube thickness and the bridge orientations were measured. Moreover, the presence of malformations was quantified by visual inspection (Fig. 2): morphologies were grouped following Langer et al. (2006, 2010) categories.
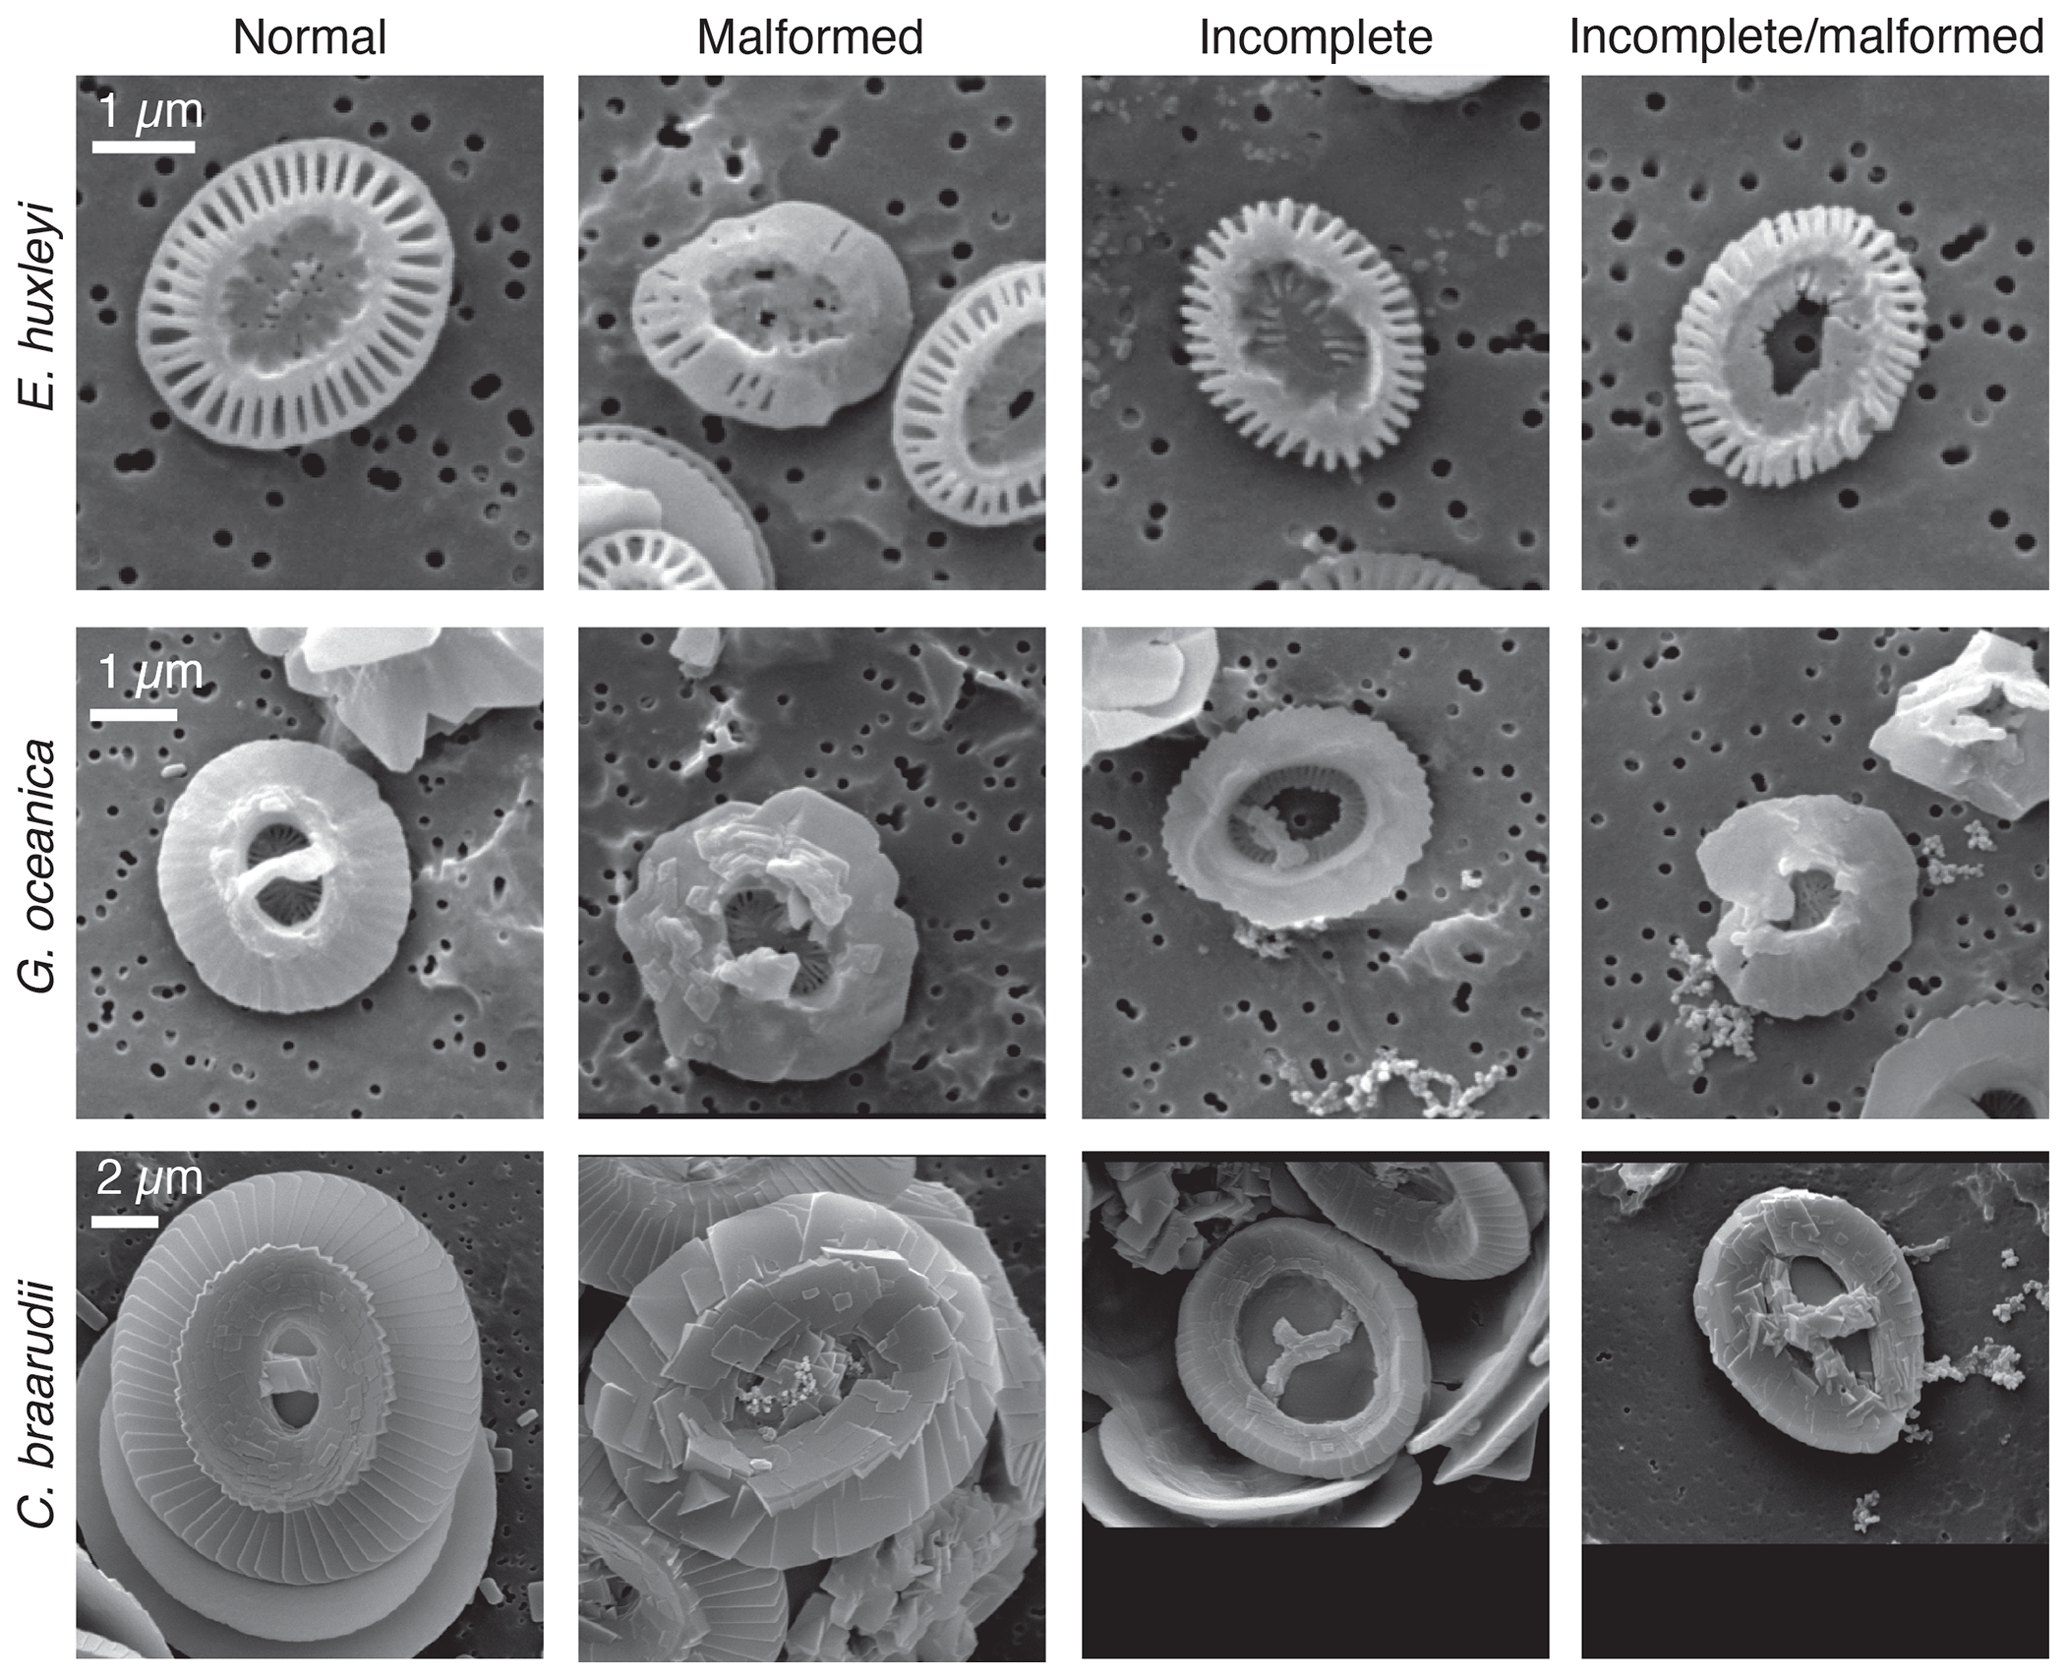
Figure 2Examples of different morphological categories: normal, malformed, incomplete, and incomplete/malformed for E. huxleyi, G. oceanica and C. braarudii.
2.4 Statistics
Data were tested for normality and homogeneity of variances (Bartlett and Fligner–Killeen tests). To test the null hypothesis that differences in growth rates and sizes among treatments are the same, the average values of parameters from triplicate cultures were compared between treatments. A one-way analysis of variance was used to determine the statistical significance of the main effect of the different parameters tested on the variables. A Tukey post-hoc test was used to assess whether differences between treatments or control were statistically significant. Statistical treatments of data were performed using R software. Statistical significance was accepted for p<0.05. For the light experiment, a nonlinear regression was used to explore the relationship between light and coccolithophore parameters (growth and sizes).
3.1 Light
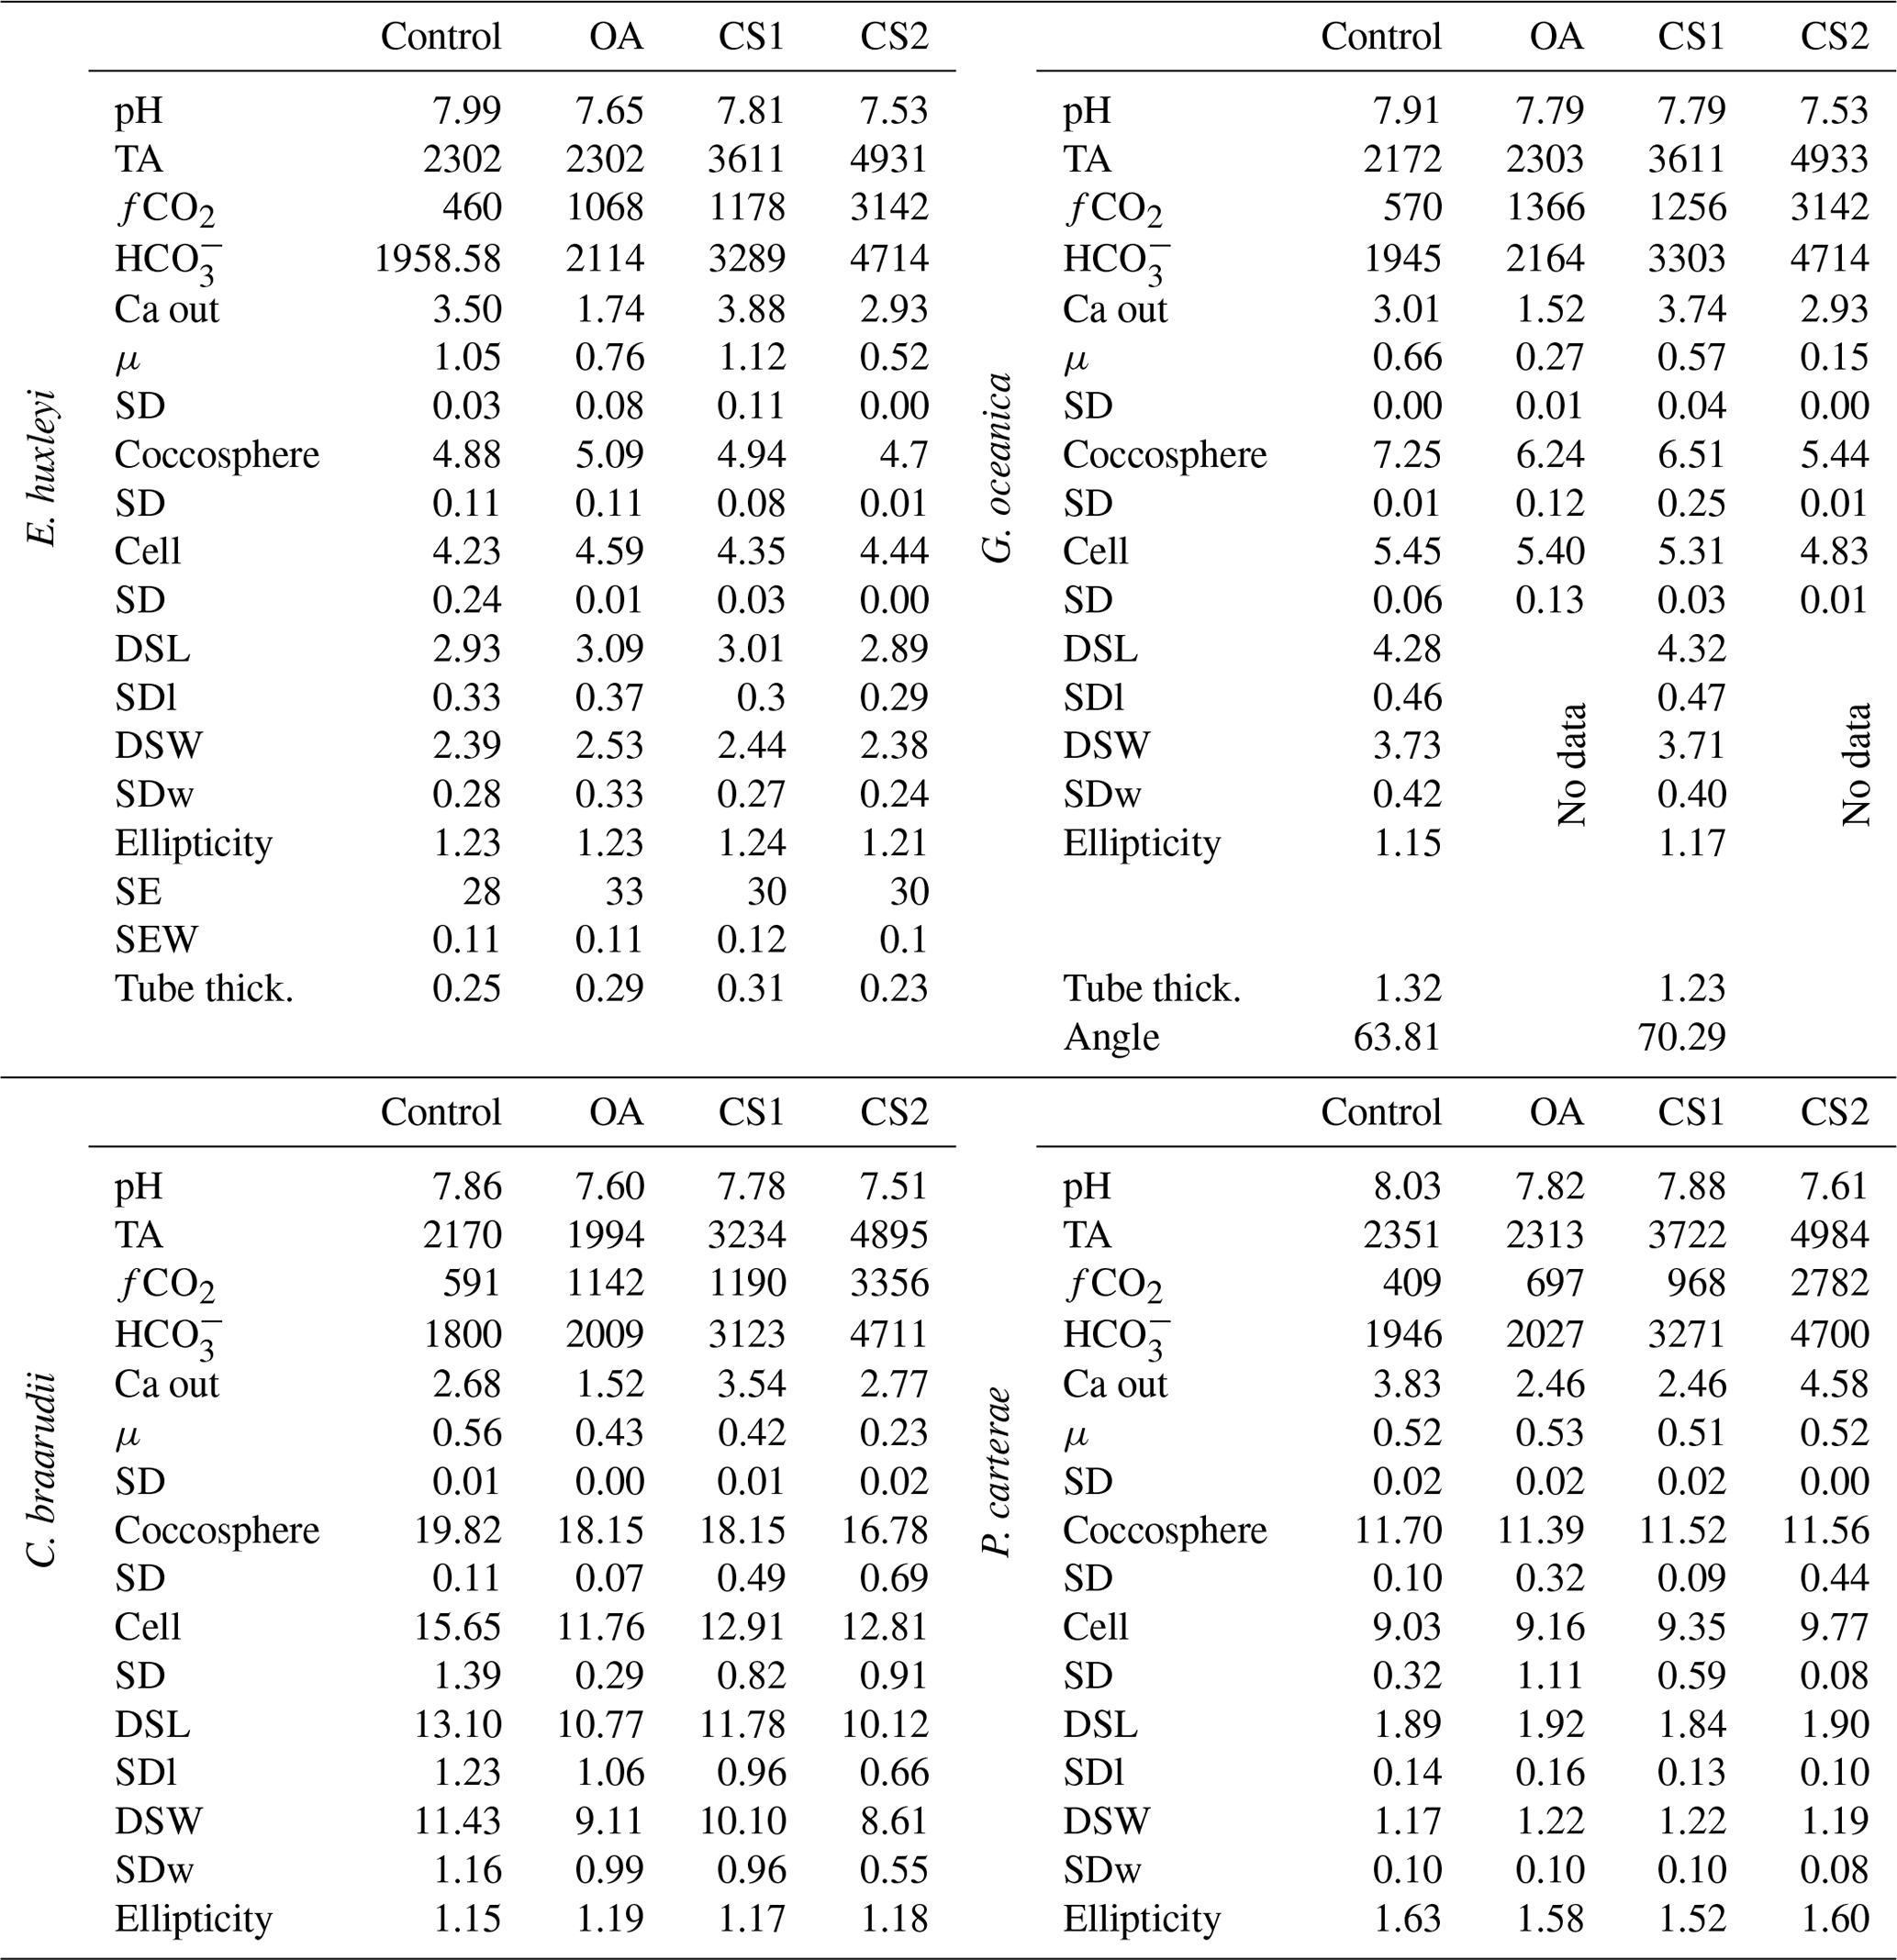
In the four species selected, coccolithophore, cell, and coccolith sizes did not show any distinct trend with variable light intensity. Data are reported in Table 2. Emiliania huxleyi coccoliths were less elliptical with light intensities above 400 µmol photons m−2 s−1 and characterized by a higher number of distal shield elements with light intensities above 400 µmol photons m−2 s−1. Gephyrocapsa oceanica and C. braarudii coccolith size and shape did not change with light intensity. Finally, P. carterae coccoliths were less elliptical only at irradiances of 350 µmol photons m−2 s−1. (Fig. 3; Plate S1). Malformed coccoliths increased in percentage only in E. huxleyi at 500 µmol photons m−2 s−1 and in G. oceanica at 200 µmol photons m−2 s−1 (Fig. 4).
Table 2Light experiments data. Growth rate (μ, in cells d−1); coccosphere and cell diameters (in µm); coccolith morphometric analyses were performed on 50 specimens for every treatment for the following: average of coccolith distal shield length (DSL; in µm) and coccolith distal shield width (DSW; in µm); ellipticity (DSL/DSW); average E. huxleyi distal shield elements number (SE) and average distal shield elements width (in µm; SEW); average E. huxleyi inner tube thickness (in µm; tube thick.); G. oceanica tube thickness (in µm; tube thick.); G. oceanica bridge angle (angle ∘). For G. oceanica and P. carterae, data from 150 and 200 µmol photons m−2 s−1 are missing due to errors in light intensity inside the light cabinet; SD: standard deviation. SDl and SDw refer to DSL and DSW standard deviation.
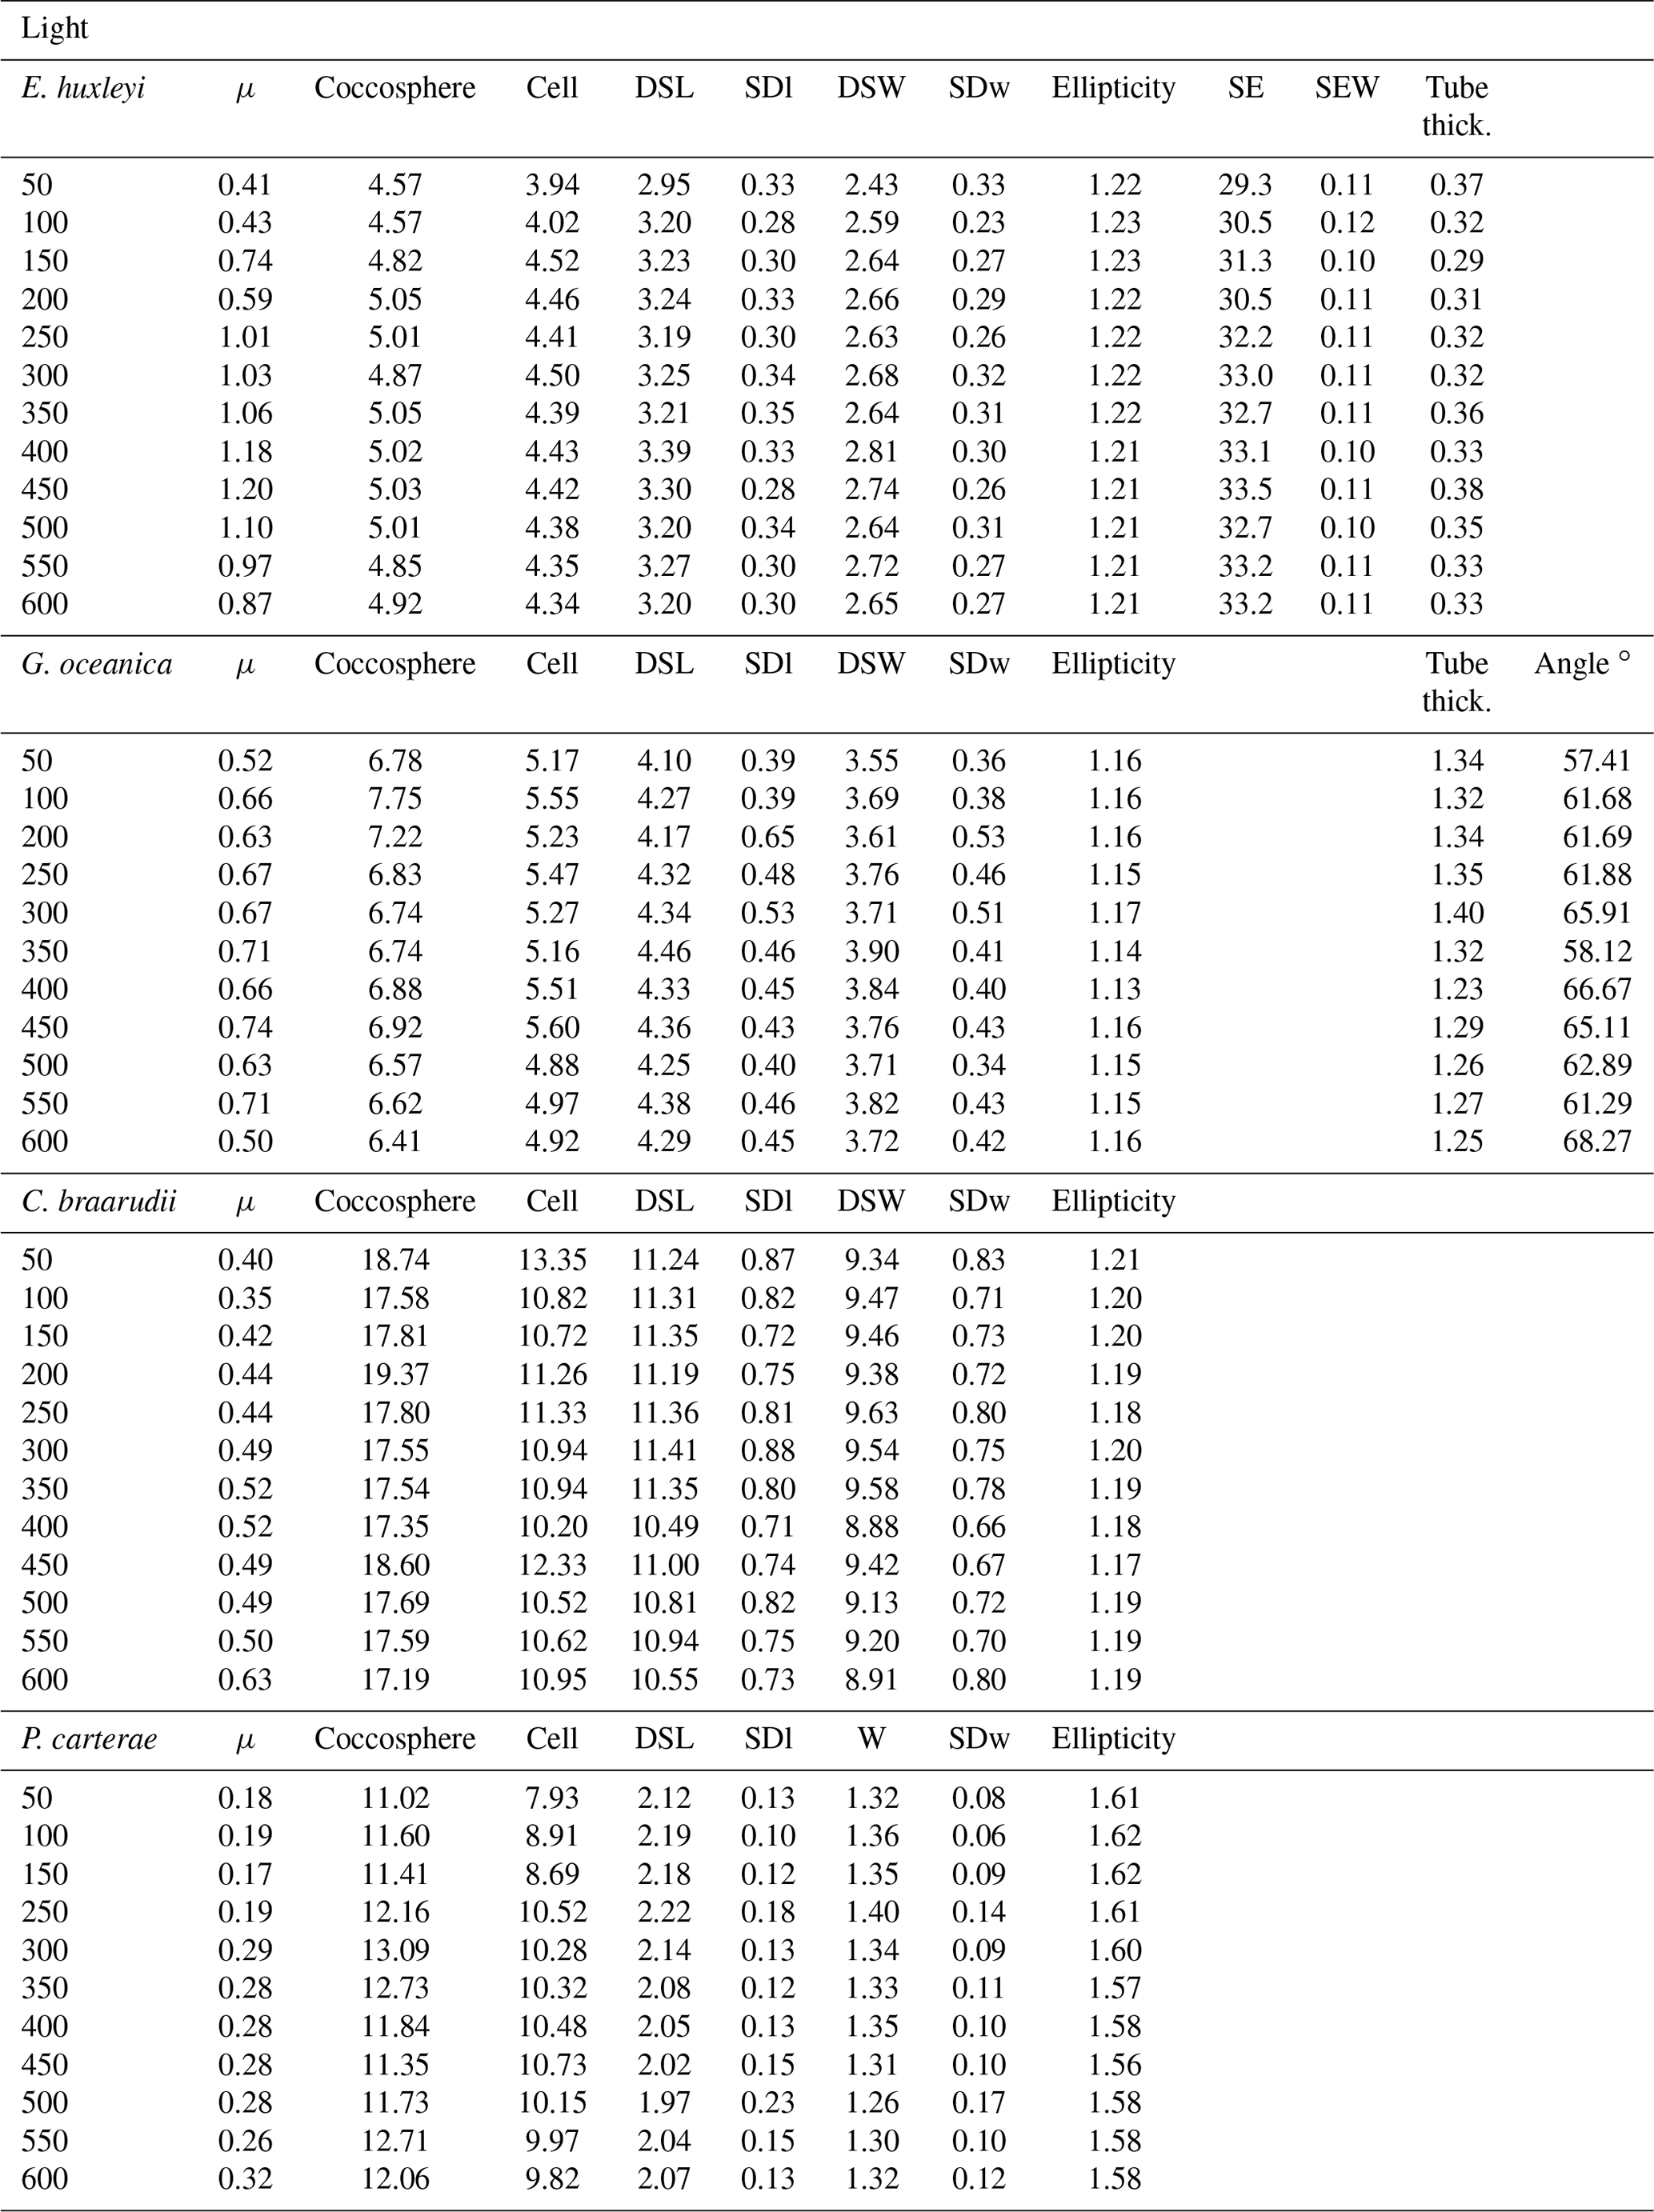
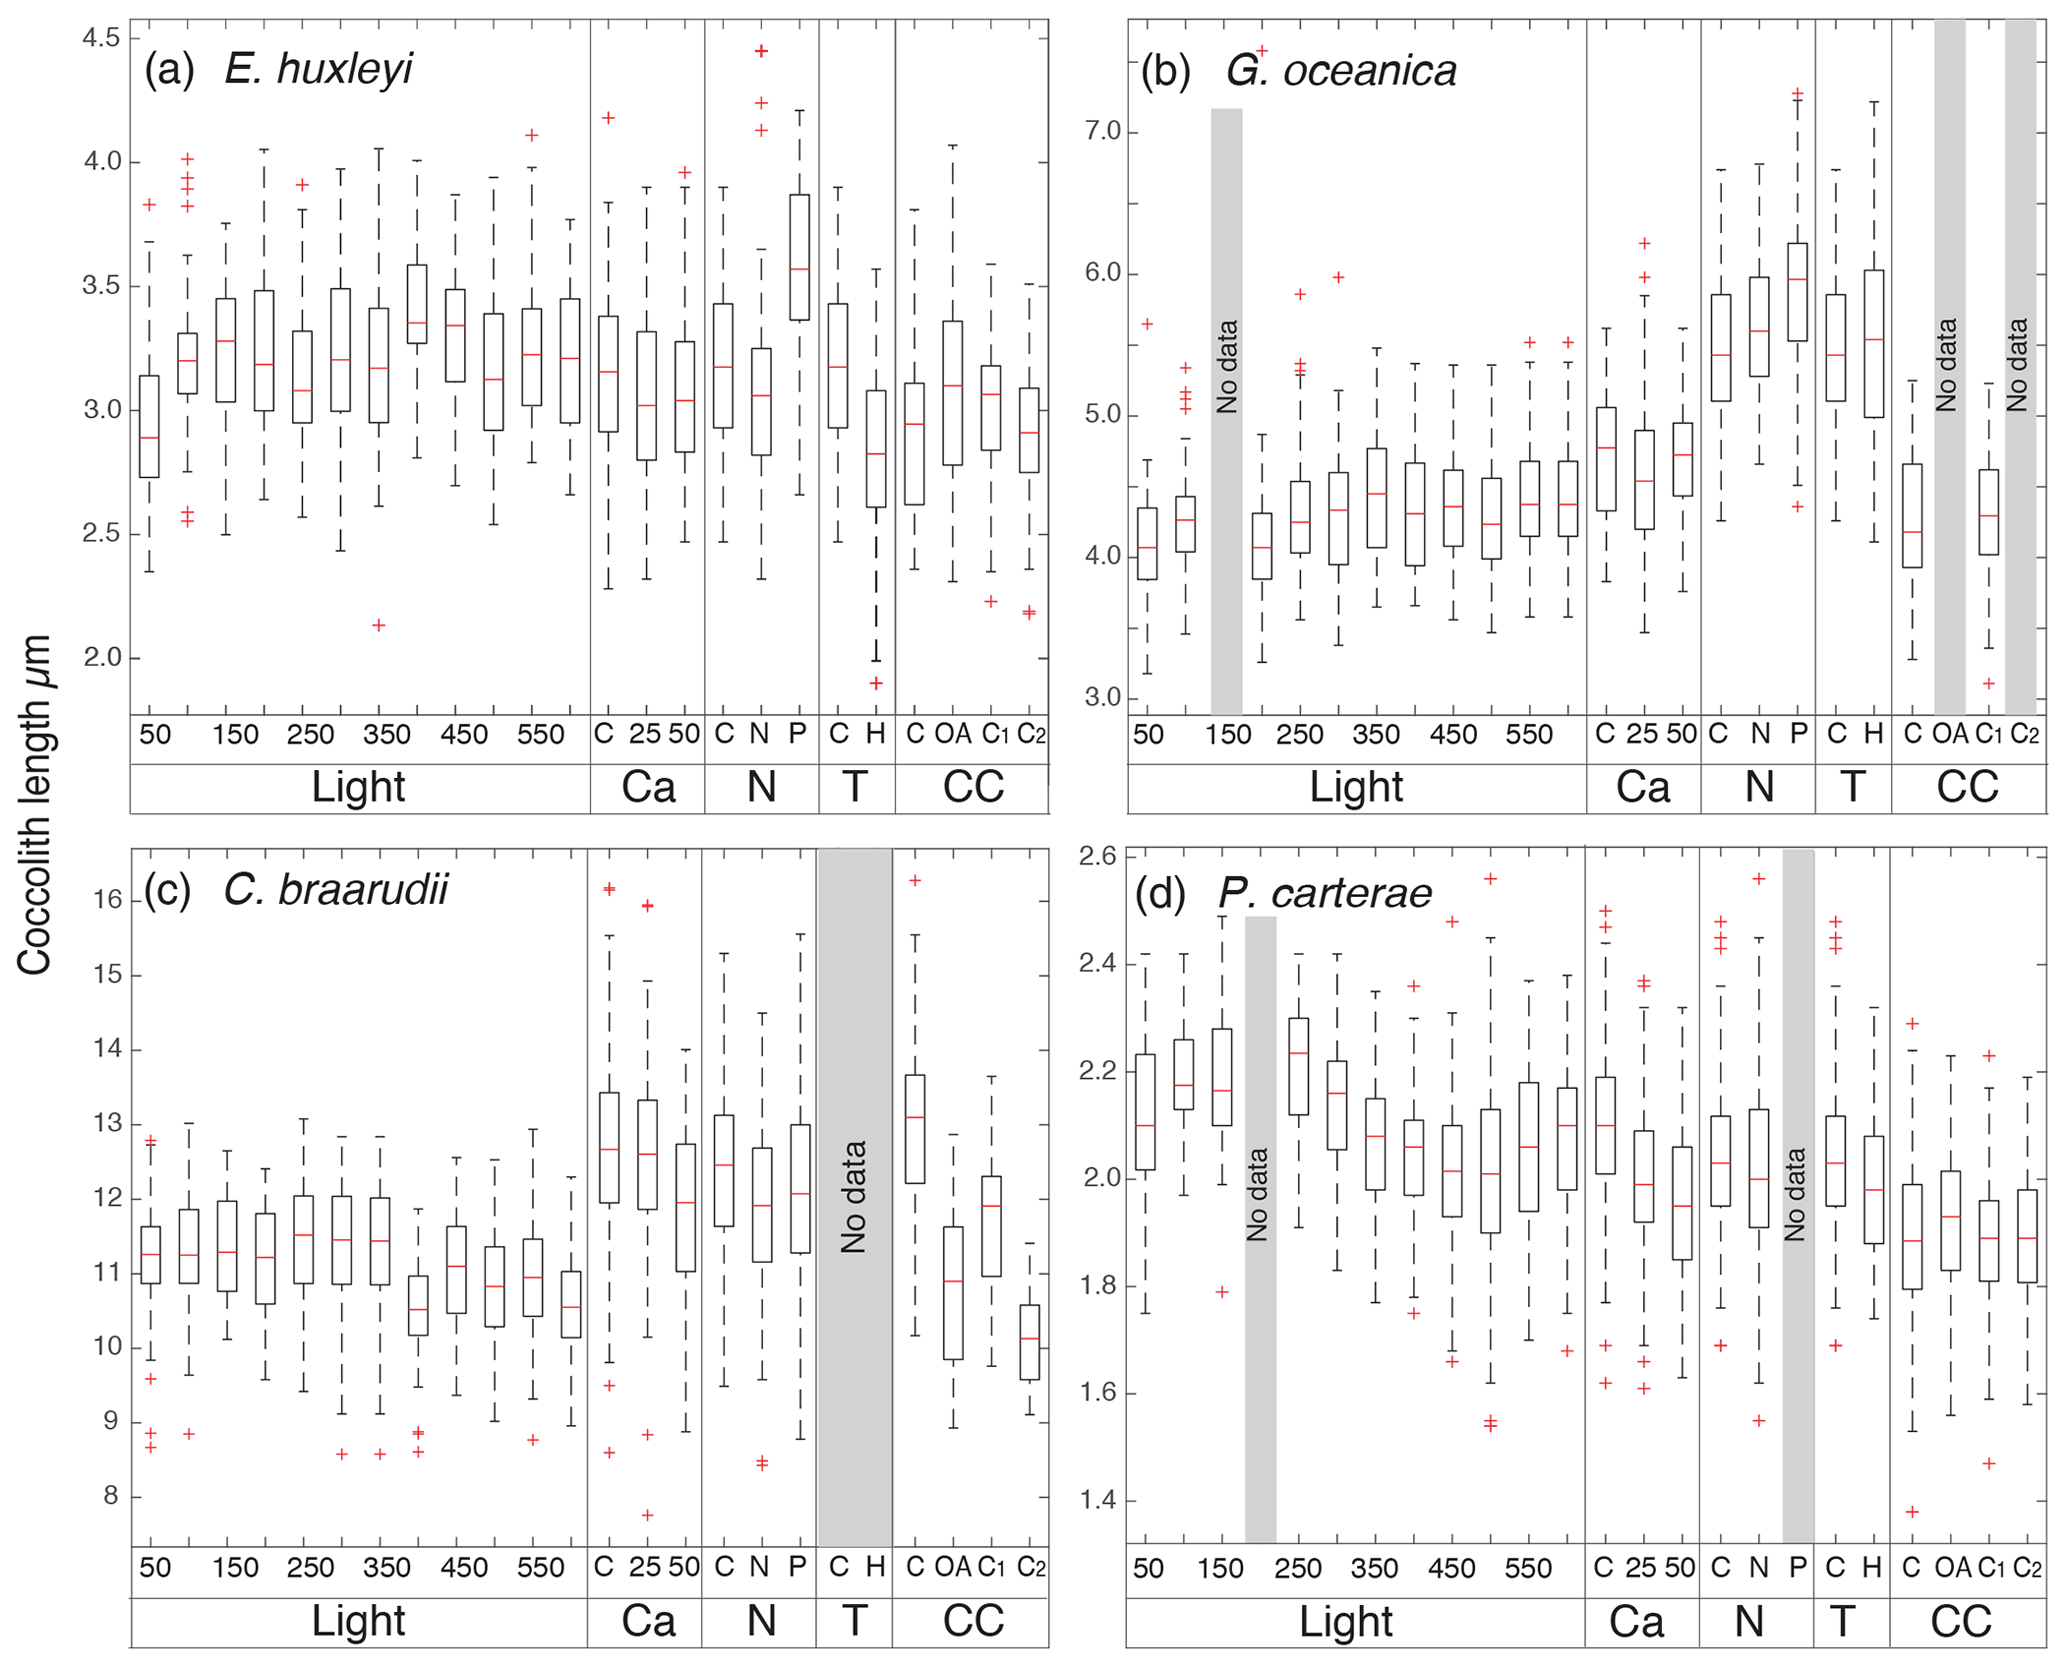
Figure 3Box plots of coccolith length from the different experiments. In (a) E. huxleyi; (b) G. oceanica; (c) C. braarudii; (d) P. carterae. C: control treatment for every experiment. Light: experiment with 12 different light intensities from 50 to 600 µm photons m−2 s−1; Ca: calcium manipulation experiment; 25, mmol L−1; 50, mmol L−1. N: nutrient limitation experiment, N: nitrogen-limited condition; P: phosphate-limited condition. T: temperature experiment; H is for 22.5 ∘C; CC: carbonate chemistry experiment; theoretical CO2 values: C: 400 ppm; OA, ocean acidification: 1000 ppm; C1, Cretaceous scenario1: 1000 ppm; C2 Cretaceous scenario2: 3000 ppm (for further information see Sects. 2.1.5 and 3.5). The tops and bottoms of each “box” are the 25th and 75th percentiles of the samples respectively. The red line in the middle of each box is the median. The whiskers, extending above and below each box, represent the furthest observations. Observations beyond the whisker length are marked as outliers (red cross). For the light experiment, 50 specimens were considered for every treatment. For Mg∕Ca experiment (Ca), nutrient experiment (N), temperature (T), and carbonate chemistry manipulations (CC) experiments, every box plot represents 150 measurements in total (50 measurements for each replicate). The Light experiment was performed in December 2013; the Ca experiment was performed in June 2014; the N experiment was performed in December 2017; the T experiment was performed in October 2017; the CC experiment was performed in August 2014.
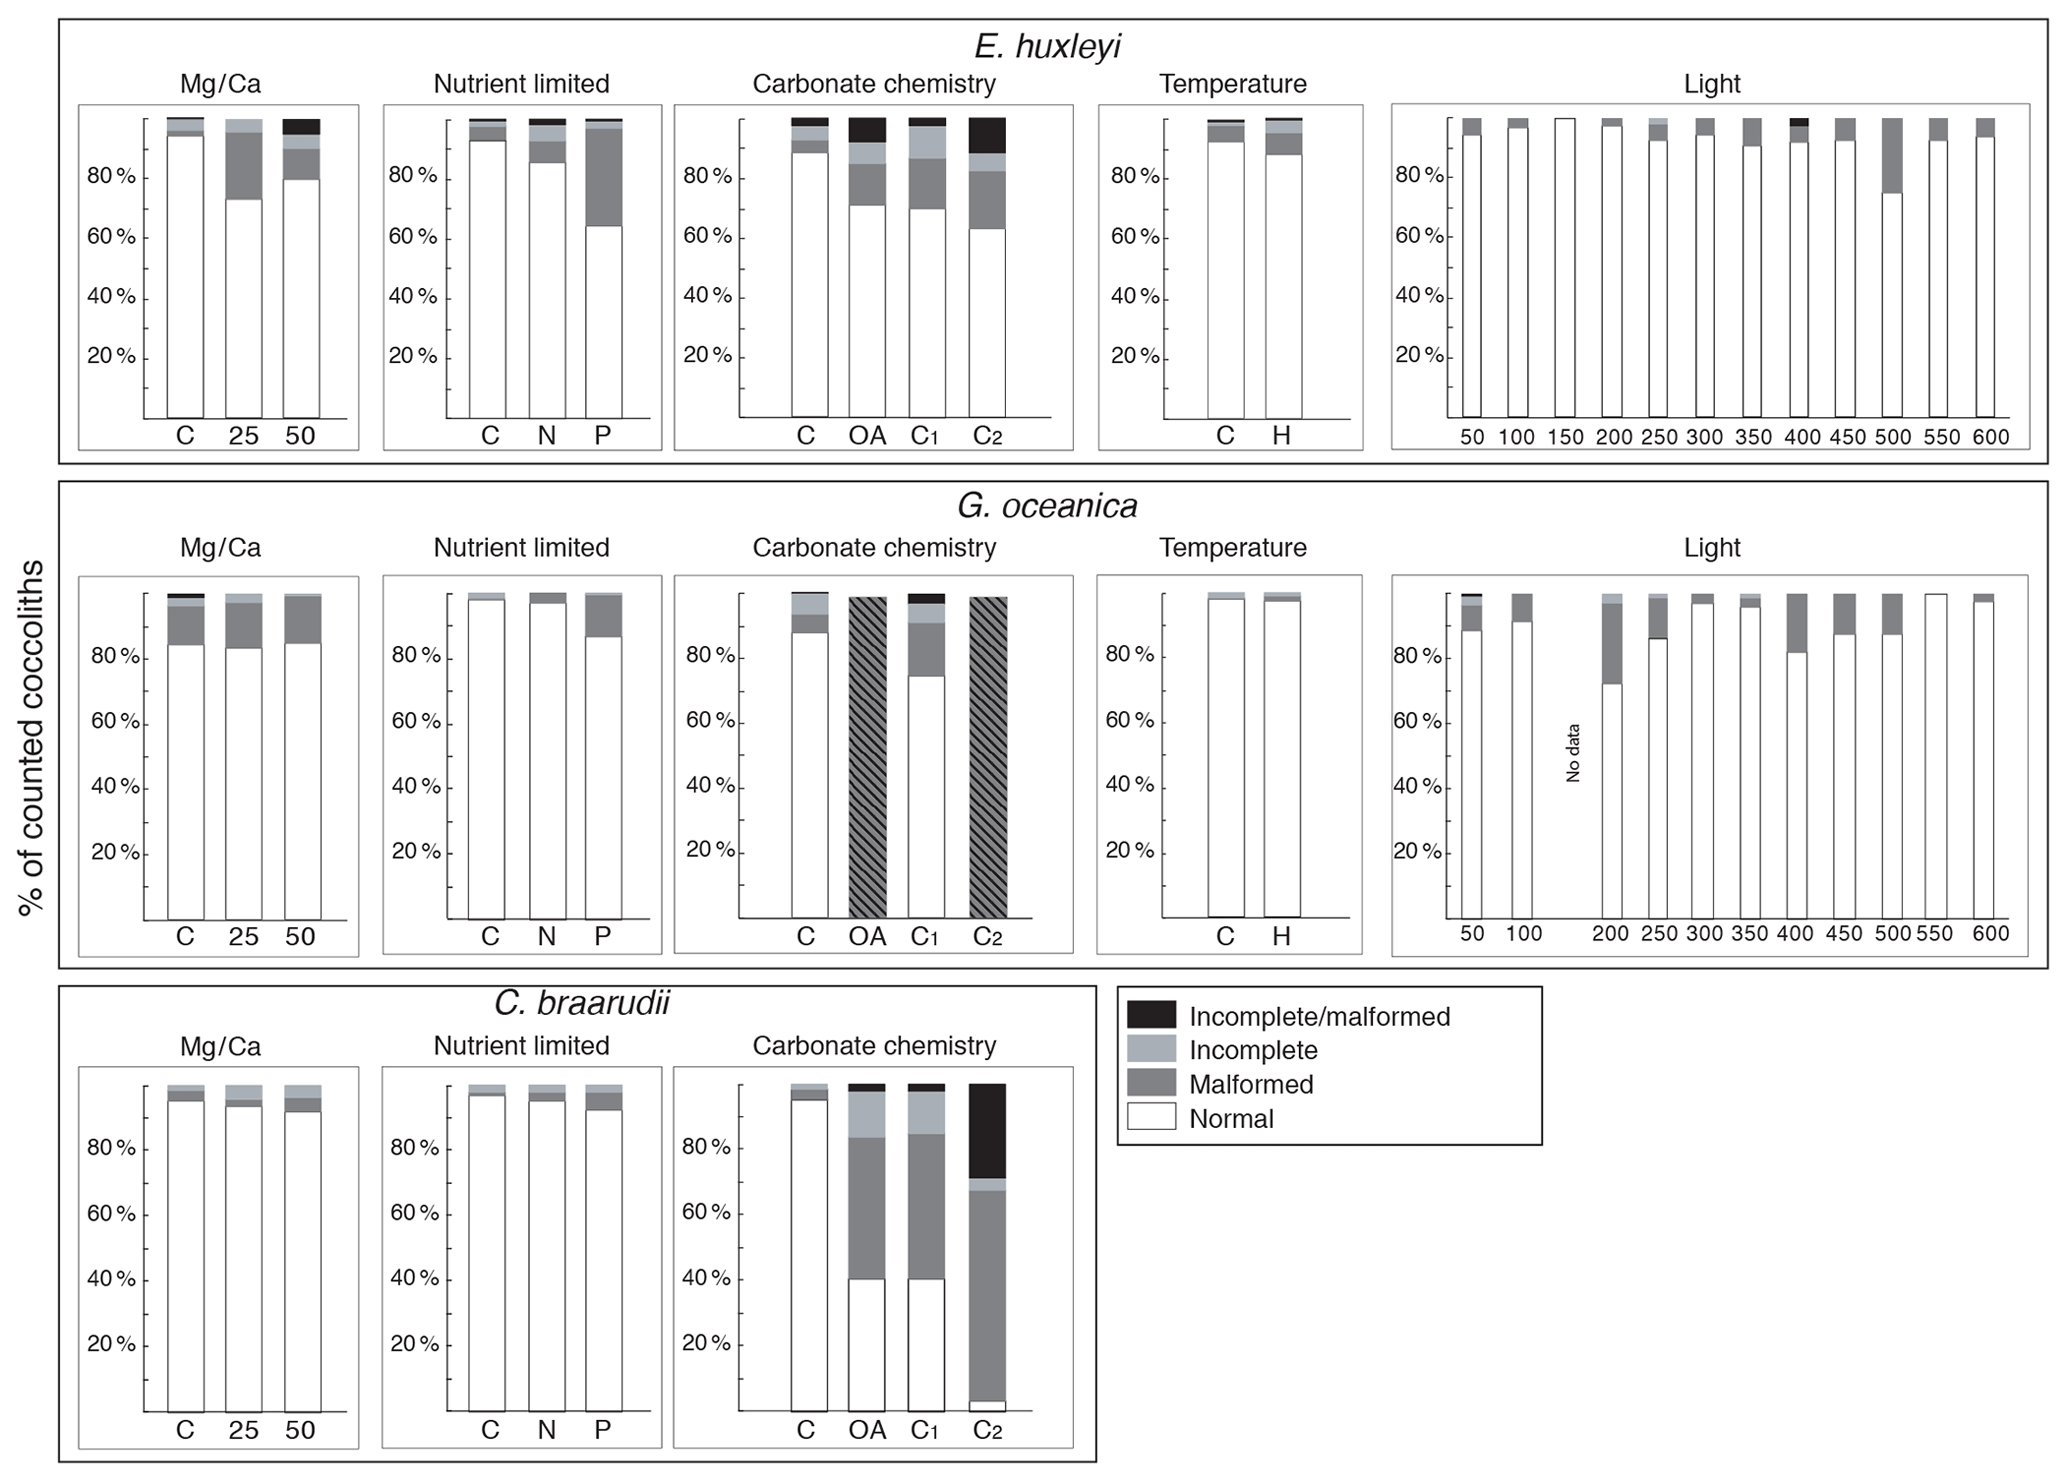
Figure 4Percentage of normal, malformed, incomplete, and incomplete/malformed coccoliths versus experiments. The experiments displayed represent Mg∕Ca, nutrient limitation, carbonate chemistry, temperature, and light intensity manipulations. C. braarudii did not survive at high temperature (22.5 ∘C), and no malformations were observed under the different light intensities tested; therefore, percentage of malformations are not represented for these experiments for this species. Furthermore, no malformation was observed for P. carterae, and percentages are not shown. C: control treatment. Mg∕Ca: calcium manipulation experiment; 25, mmol L−1; 50, mmol L−1. Nutrient limited: nutrient limitation experiment; N: nitrogen-limited condition; P: phosphate-limited condition. Temperature experiment; H is for 22.5 ∘C; carbonate chemistry experiment; theoretical CO2 values: C: 400 ppm; OA, ocean acidification: 1000 ppm; C1, Cretaceous scenario1: 1000 ppm; C2 Cretaceous scenario2: 3000 ppm. Light: 12 different light intensities from 50 to 600 µm photons m−2 s−1. For every treatment and for every replicate 100 specimens were considered.
3.2 Mg∕Ca
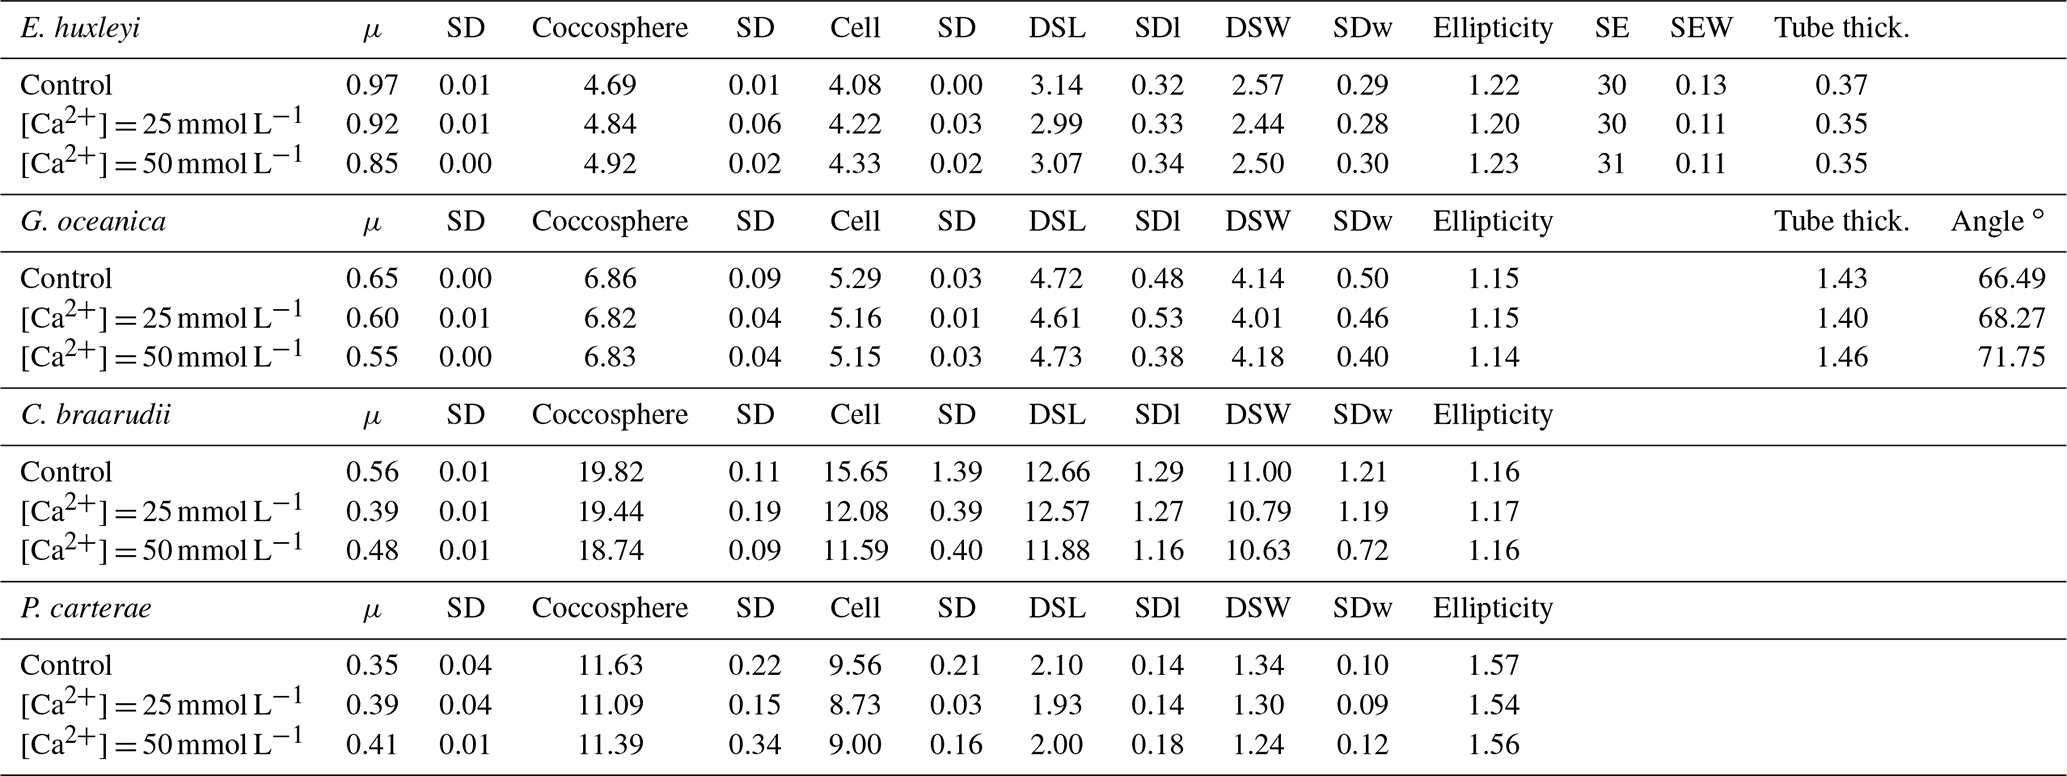
Emiliania huxleyi coccosphere and cell sizes were influenced by changes in seawater [Ca2+]. Elevating seawater [Ca2+] to ≈25 and 50 mmol L−1 resulted in a significant increase in the coccosphere and cell diameters (p<0.05). Increased [Ca2+] concentrations impacted G. oceanica, C. braarudii, and P. carterae cell sizes with a reduction in size in comparison to [Ca2+] of 9.8 mmol L−1, when seawater [Ca2+] was elevated to ≈25 and 50 mmol L−1. Gephyrocapsa oceanica and P. carterae coccosphere diameters were unaffected, while the C. braarudii coccosphere was smaller when grown under [Ca2+] of 50 mmol L−1 (Table 3). Emiliania huxleyi, G. oceanica, and C. braarudii coccolith sizes were not affected by changing [Ca2+]. Pleurochrysis carterae coccoliths were smaller at the highest [Ca2+] concentrations than in the control (Fig. 3; Table 3). Emiliania huxleyi produced a higher percentage of malformed and/or incomplete coccoliths with increasing calcium concentrations (Fig. 4; Plate S2), while no increased malformation was observed in the other species.
Table 3Mg∕Ca experiment data. Data presented are the average of three replicates. Growth rate (μ; in cells d−1); coccosphere and cell diameters (in µm); coccolith morphometric analyses were performed on 50 specimens for every treatment and for every replicate. Data represent the average of three replicates: average of coccolith distal shield length (DSL; in µm) and coccolith distal shield width (DSW; in µm); ellipticity (DSL/DSW) diameter; average E. huxleyi distal shield elements number (SE) and average distal shield elements width (in µm; SEW); average E. huxleyi inner tube thickness (in µm; tube thick.) and G. oceanica bridge angle (angle ∘); SD: standard deviation. SDl and SDw refer to DSL and DSW standard deviation.
3.3 Nutrient limitation
Emiliania huxleyi and C. braarudii coccospheres were larger under P limitation than under N limitation and the control. Gephyrocapsa oceanica coccospheres were larger under N limitation than under P limitation and the control. Pleurochrysis carterae coccospheres were larger under N limitation compared to the control. Cell size remained unaffected in E. huxleyi by nutrient limitation. Gephyrocapsa oceanica cells and C. braarudii cells were larger under P limitation compared to the control and N limitation. Pleurochrysis carterae cells were larger under N limitation compared to the control (Table 4).
Table 4Nutrient-limited condition experiment data. Data presented are the average of three replicates. Growth rate (μ; in cells d−1); coccosphere and cell diameters (in µm); coccolith morphometric analyses were performed on 50 specimens for every treatment and for every replicate. Data represent the average of three replicates: average of coccolith distal shield length (DSL; in µm) and coccolith distal shield width (DSW; in µm); ellipticity (DSL/DSW) diameter; average E. huxleyi distal shield elements number (SE) and average distal shield elements width (in µm; SEW); average E. huxleyi inner tube thickness (in µm; tube thick.) and G. oceanica bridge angle (angle ∘); SD: standard deviation. SDl and SDw refer to DSL and DSW standard deviation.

Emiliania huxleyi and G. oceanica coccoliths were larger under P limitation, while there was no significant difference between N limitation and the control. Emiliania huxleyi coccoliths had a higher number of distal shield elements under P limitations, while the inner tube was thinner in N- and P-limited treatments compared to the control. Gephyrocapsa oceanica produced thicker inner tubes under N and P limitation. Coccolithus braarudii was less elliptical under P limitation, and P. carterae was less elliptical under N limitation. Furthermore, E. huxleyi and G. oceanica produced relatively more malformed coccoliths under P limitation (Fig. 4). Coccolithus braarudii and P. carterae coccolith sizes remained unaffected with no sign of malformations by nutrient limitation (Fig. 3; Plate S3).
3.4 Temperature
Emiliania huxleyi and G. oceanica coccospheres and cell sizes were smaller at 22.5 ∘C. Pleurochrysis carterae coccosphere and cell sizes remained unaffected (Table 5). Emiliania huxleyi coccoliths were smaller at high temperatures. Furthermore, E. huxleyi had less distal shield elements and a thinner inner tube when grown at 22.5 ∘C. Gephyrocapsa oceanica and P. carterae coccolith size remained largely unaffected by changing temperature, but G. oceanica produced thicker inner tubes under high temperature. Pleurochrysis carterae coccoliths were less elliptical when grown at 22.5 ∘C (Fig. 3; Table 5; Plate S3). Coccolithus braarudii did not survive at conditions of 22.5 ∘C.
Table 5Temperature experiment data. Data presented are the average of three replicates. Growth rate (μ; in cells d−1); coccosphere and cell diameters (in µm); coccolith morphometric analyses were performed on 50 specimens for every treatment and for every replicate. Data represent the average of three replicates: average of coccolith distal shield length (DSL; in µm) and coccolith distal shield width (DSW; in µm); ellipticity (DSL/DSW) diameter; average E. huxleyi distal shield elements number (SE) and average distal shield elements width (in µm; SEW); average E. huxleyi inner tube thickness (in µm; tube thick.) and G. oceanica bridge angle (angle ∘). C. braarudii did not grow at 22.5 ∘C, and therefore, any data are presented; SD: standard deviation. SDl and SDw refer to DSL and DSW standard deviation.
3.5 Carbonate chemistry parameters
Emiliania huxleyi coccospheres and cells were the largest in the OA treatment and smallest in the CS2 treatment. Gephyrocapsa oceanica and C. braarudii coccospheres were the largest in the control and smallest in CS2 treatment. Gephyrocapsa oceanica cell size was lower in the CS2 treatment than in the control, as well as the OA and CS1 treatments. The cell size of C. braarudii was smaller in the OA, CS1, and CS2 treatments compared to the control. Pleurochrysis carterae coccosphere and cell size were unaffected by changing carbonate chemistry (Table 6).
Table 6Carbonate chemistry experiment data. Data presented are the average of three replicates. Growth rate (μ; in cells d−1); coccosphere and cell diameters (in µm); coccolith morphometric analyses were performed on 50 specimens for every treatment and for every replicate. The following data represent the average of three replicates: average of coccolith distal shield length (DSL; in µm) and coccolith distal shield width (DSW; in µm); ellipticity (DSL/DSW) diameter; average E. huxleyi distal shield elements number (SE) and average distal shield elements width (in µm; SEW); average E. huxleyi inner tube thickness (in µm; tube thick.) and G. oceanica bridge angle (angle ∘). Carbon chemistry speciation calculated as the mean of start and end values of measured pH and TA are given. SD: standard deviation. SDl and SDw refer to DSL and DSW standard deviation.
Emiliania huxleyi formed significantly bigger coccoliths in the OA treatment compared to the control and the CS2 treatment (Fig. 3; Table 6). Furthermore, the inner tubes were thicker in the OA and CS1 treatments compared to the control and the CS2 treatments. Malformations were 20 % more frequent in the OA, CS1, and CS2 treatments than in the control (Fig. 4; Plate S4). Gephyrocapsa oceanica generated a high number of malformed coccoliths in the OA and CS2 treatments. For G. oceanica, under OA and CS2 conditions, morphometric analyses were not performed because a large majority of the coccoliths were extremely malformed, and it was not possible to measure the shape of the specimens (Fig. 2). In the CS1 treatment, coccoliths were slightly smaller compared to the control with a thinner inner tube. Coccolithus braarudii coccoliths were smaller in the OA and CS2 treatments compared to the control and the CS1. In the OA and CS1 treatments, 40 % of the C. braarudii coccoliths were malformed, and ∼10 % were incomplete. In the CS2 treatment, 97% of coccoliths were malformed or incomplete. Pleurochrysis carterae coccolith size remained unaffected by carbonate chemistry variations, but coccoliths are less elliptical under OA, CS1, and CS2 compared to the control.
Coccolithophores started to calcify in the late Triassic, and this biological innovation appeared in a period of strong climatic and biotic pressure (De Vargas et al., 2007). The earliest coccoliths had very simple morphologies and small sizes (2–3 µm; Bown et al., 2004). Calcareous nannoplankton underwent a major diversification in the Mesozoic and Paleocene where many new morphologies occurred. The appearance of new coccolith shapes followed the main geological events, at the Cretaceous/Paleogene (K/Pg) boundary, and the Paleocene/Eocene (P/E) boundary, and these big reorganizations suggest that certain kinds of morphologies might have been no longer advantageous for coccolithophore algae under the new ecological circumstances. The evolution of calcareous nannoplankton through ∼220 Ma documents a remarkable morphological diversity within the group, and in the last 30 Ma there has been a loss of species that produced large and heavily calcified coccoliths but an increase in the modern community of coccolith architectures (Bown et al., 2004). The cause of this impressive number of structures is unknown, but there might be a reason connected to the function of coccoliths for the different species to produce such different shapes ranging from protection against excess sun light and/or against grazing (Monteiro et al., 2016). Accordingly, coccolith morphologies are likely only indirectly linked to physical or chemical conditions such as temperature or CO2 but may rather reflect their adaptation to a specific, yet-unknown ecological function (Aloisi, 2015). If morphological changes in coccoliths are the result of a physiological response to environmental variations (e.g., CO2, nutrient, temperature), coccoliths recovered from marine sediments could potentially conserve paleo-environmental information prevailing when the coccolithophore was alive (Aloisi, 2015). Indeed, many studies of geological records calibrated biomineralization responses of ancient species to environmental drivers with experiments with modern species (e.g., Bornemann et al., 2006; Erba et al., 2010; Suchéras-Marx et al., 2010; Linnert and Mutterlose, 2012; O'Dea et al., 2014; Lübke et al., 2015; Gibbs et al., 2016; Faucher et al., 2017a, b; Table 1). Calibrating paleo-responses with observations from living species depends on the assumption that coccolithophores conserved a certain response to certain environmental parameters over geological timescales. However, fossils and living coccolithophores diverged a long time ago and have a different genetic background, and therefore, calcareous nannoplankton in the past and nowadays did and do not necessarily act in the same way to external stress. Furthermore, morphology may not only depend on abiotic environmental conditions but could perhaps also be the result of evolutionary development induced through ecological interactions. For example, if a coccolithophore genotype which forms larger coccoliths is better suited to protect a cell against prevalent grazers, then these genotypes will likely proliferate, whereas related genotypes forming smaller variants could eventually go extinct. The geological record would not easily allow us to distinguish if morphological changes are caused by physiological or ecological drivers as it is difficult enough to reconstruct abiotic paleo-environmental conditions but almost impossible to unravel relevant processes in the food web of the geologic past. Therefore, the fundamental question we asked ourselves was whether morphological features observed in living coccolithophores under specific environmental parameters could help to build reliable proxies for abiotic paleo-environmental conditions.
Overall, none of the five tested variables induced a consistent response of coccolith size and shape across all four species. For example, under high CO2, E. huxleyi formed larger coccoliths, while C. braarudii formed smaller coccoliths. Interestingly, our observation of inconsistent responses among species to various environmental drivers is in line with observations from the fossil record. There are several observations where just some of the prevailing species showed changes in morphology during intervals characterized by extreme climatic conditions even though all species were exposed to environmental stress. For example, dwarf specimens were recorded for Biscutum constans in all Mesozoic episodes characterized by abnormal conditions, during intervals of extreme volcanic activity (e.g., during Oceanic Anoxic Events 1a, 1b, and 2; Bornemann et al., 2006; Erba et al., 2010, 2019; Lübcke et al., 2015; Faucher et al., 2017a). In conclusion, the inconsistency of morphological responses to changing environmental drivers observed in both our experiments and the geological record suggests that morphological responses of living species cannot be used as analogues for morphological changes in extinct species.
The exception in our dataset is the observed responses in malformation to changes in carbonate chemistry where some consistency was noted among the four tested species. Malformations are generally considered as an evidence of errors during intracellular coccolith formation so that a disturbance of coccolithogenisis conserved in a malformation could be the consequence of a direct (i.e., physiological) impact. Indeed, malformations are unlikely to be the consequence of an evolutionary (i.e., ecological) adaptation to environmental stress because there seems to be no obvious ecological advantage of producing malformed coccoliths. The high degree of malformation when coccolithophores were grown under high CO2 concentrations provides some evidence that at least this response variable could be used as paleo-proxy for episodes of acute carbonate chemistry perturbations.
In the fossil record, there are several examples of intervals characterized by high abundances of malformed specimens, linked to the low calcite saturation state of the ocean (Jiang and Wise, 2006; Raffi and De Bernardi, 2008; Agnini et al., 2007; Erba et al., 2010; Bralower and Self Trail, 2016). Different authors argued for high CO2 influence on causing these malformations during the Mesozoic OAEs, Paleocene-Eocene Thermal Maximum (PETM) and Eocene Thermal Maximum 2. All these intervals were characterized by excess CO2 concentrations and/or slightly reduced pH. Malformations were expressed in different ways: they were represented by variation in ellipticity of coccoliths (Erba et al., 2010), asymmetry (Agnini et al., 2007), irregular arrangement and length of their rays, and diminished calcification in some nannoliths (Jiang and Wise, 2006; Mutterlose et al., 2007; Raffi and De Bernardi, 2008; Bralower and Self Trail, 2016). The short stratigraphic ranges where these malformations occurred, during the core of major ocean perturbations, indicated that pH played a role in inducing the production of these aberrant specimens (Mutterlose et al., 2007; Erba et al., 2010). There is still not a clear explanation of why only some species of calcareous nannoplankton were producing aberrant specimens, and there is not a general consensus on the role of carbonate chemistry in coccolithophore biomineralization (Gibbs et al., 2010, 2016). However, a recent work provides a plausible explanation of what might have happened during the PETM. Here, only some species moved and inhabited the deep part of the photic zone, to possibly refuge from stressful warm and eutrophic conditions of the surface water, but had to deal with lower saturation conditions that induced malformations in these taxa (Bralower and Self Trail, 2016).
The increase in the percentage of malformed coccoliths observed in our experiments could suggest a more global occurrence of malformation in modern coccolithophore species under low pH. However, it is important to bear in mind that in the geological record critical intervals characterized by excess CO2 concentrations lasted for some tens or hundreds of thousands of years, whereas our experiments lasted a few generations (days). Thus, environmental stress on geological timescales may still be long enough for coccolithophores to adapt, which can occur within months to years (Lohbeck et al., 2012; Bach et al., 2018). It also needs to be kept in mind that even if the four coccolithophore species tested here showed similar morphological responses to changing environmental drivers, it cannot be excluded that this resulted from convergent evolution. Indeed, restriction on biological conditions and adaptation to particular habitats can produce widespread convergence as convergent evolution is often a consequence of adaptation to a similar niche (Arbuckle et al., 2014). Therefore, we want to point out that convergent morphological developments could represent similar adaptations of different species to abiotic parameters that occurred multiple times separate from each other.
According to the data provided in this study we report the following results: (1) sizes and morphologies of the four tested species change differently in response to temperature, light, nutrient, and Mg∕Ca variations. In some cases, there were opposing reactions among species under the same abiotic stress; (2) a high number of malformations were detected when coccolithophores were grown under excess CO2, and this response occurred in all species tested here.
Overall, there is no support for the suitability of coccolith morphometry to serve as proxy for temperature, light, nutrient, and Mg∕Ca conditions of the past. However, coccolith malformations could perhaps be useful indicators for carbonate chemistry stress. Indeed, it will be crucial to evaluate whether malformations remain over a long time period or if coccolithophores have and had an adaptive potential towards extreme carbonate chemistry conditions that might rapidly eliminate malformation in some generations.
Data presented in the paper are available in the Supplement. Further information can be accessed by contacting the corresponding author (giulia.faucher@unimi.it).
The supplement related to this article is available online at: https://doi.org/10.5194/cp-16-1007-2020-supplement.
GF, LTB, and UR developed the paper concept. GF and LTB conceived and designed the experiments. GF performed the experiments and analyzed the data. All authors contributed to the writing and discussion of the paper.
The authors declare that they have no conflict of interest.
We are indebted to the editor, Erin McClymont, and Mariem Saavedra-Pellitero and an anonymous reviewer for their fruitful comments that greatly improved the quality of this paper. A special note of thank goes to Elisabetta Erba for sharing ideas and huge support. We acknowledge Agostino Rizzi for assistance during the never-ending SEM analyses.
This research was funded through MIUR-PRIN 2011 (Ministero dell'Istruzione, dell'Università e della Ricerca–Progetti di Ricerca di Interesse Nazionale) for Elisabetta Erba (grant no. PRIN 2017RX9XXXY) and through SIR-2014 (Ministero dell'Istruzione, dell'Università e della Ricerca–Scientific Independence of young researchers) for Cinzia Bottini (grant no. SIR-2014 RBSI14UU81).
This paper was edited by Erin McClymont and reviewed by Mariem Saavedra-Pellitero and one anonymous referee.
Agnini, C., Muttoni, G., Kent, D. V., and Rio, D.: Eocene biostratigraphy and magnetic stratigraphy from Possagno, Italy: The calcareous nannofossil response to climate variability, Earth Planet. Sc. Lett., 241, 815–830, https://doi.org/10.1016/j.epsl.2005.11.005, 2006.
Agnini, C., Fornaciari, E., Rio, D., Tateo, F., Backman, J., and Giusberti, L.: Responses of calcareous nannofossil assemblages, mineralogy and geochemistry to the environmental perturbations across the Paleocene/Eocene boundary in the Venetian Pre-Alps, Mar. Micropaleontol., 63, 19–38, https://doi.org/10.1016/j.marmicro.2006.10.002, 2007.
Aloisi, G.: Covariation of metabolic rates and cell size in coccolithophores, Biogeosciences, 12, 4665–4692, https://doi.org/10.5194/bg-12-4665-2015, 2015.
Arbuckle, K., Bennett, C. M., and Speed, M. P.: A simple measure of the strength of convergent evolution, Methods Ecol. Evol., 5, 685–693, https://doi.org/10.1111/2041-210X.12195, 2014.
Bach, L. T., Riebesell, U., and Schulz, K. G.: Distinguishing between the effects of ocean acidification and ocean carbonation in the coccolithophore Emiliania huxleyi, Limnol. Oceanogr., 56, 2040–2050, https://doi.org/10.4319/lo.2011.56.6.2040, 2011.
Bach, L. T., Lohbeck, K. T., Reusch, T. B., and Riebesell, U.: Rapid evolution of highly variable competitive abilities in a key phytoplankton species, Nature Ecology and Evolution, 2, 611, https://doi.org/10.1038/s41559-018-0474-x, 2018.
Bendif, E. M., Probert, I., Carmichael, M., Romac, S., Hagino, K., and De Vargas, C.: Genetic delineation between and within the widespread coccolithophore morpho-species Emiliania huxleyi and Gephyrocapsa oceanica (Haptophyta), J. Phycol., 50, 140–148, https://doi.org/10.1111/jpy.12147, 2014.
Bornemann, A. and Mutterlose J.: Size analyses of the coccolith species Biscutum constans and Watznaueria barnesiae from the Late Albian “Niveau Breistroffer”(SE France): taxonomic and palaeoecological implications, Geobios, 39, 599–615, https://doi.org/10.1016/j.geobios.2005.05.005, 2006.
Bornemann, A., Aschwer, U., and Mutterlose, J.: The impact of calcareous nannofossils on the pelagic carbonate accumulation across the Jurassic–Cretaceous boundary, Palaeogeogr. Palaeocl., 199, 187–228, https://doi.org/10.1016/S0031-0182(03)00507-8, 2003
Bown P. R.: Calcareous nannoplankton evolution: a tale of two oceans, Micropaleontology, 51, 299–308, 2005.
Bown, P. R., Lees, J. A., and Young, J. R.: Calcareous nannoplankton evolution and diversity through time, in: Coccolithophores, edited by: Thierstein, H. R. and Young, J. R., Springer Berlin Heidelberg, Germany, 481–508, 2004.
Bralower, T. J. and Self-Trail, J. M.: Nannoplankton malformation during the Paleocene-Eocene Thermal Maximum and its paleoecological and paleoceanographic significance, Paleoceanography, 31, 1423–1439, https://doi.org/10.1002/2016PA002980, 2016.
Cottingham, K. L., Lennon, J. T., and Brown, B. L.: Knowing when to draw the line: designing more informative ecological experiments, Front. Ecol. Environ., 3, 145–152, https://doi.org/10.1890/1540-9295(2005)003[0145:KWTDTL]2.0.CO;2, 2005.
Danbara, A. and Shiraiwa, Y.: The requirement of selenium for the growth of marine coccolithophorids, Emiliania huxleyi, Gephyrocapsa oceanica and Helladosphaera sp. (Prymnesiophyceae), Plant Cell. Physiol., 40, 762–766, https://doi.org/10.1093/oxfordjournals.pcp.a029603, 1999.
De Vargas, C., Aubry, M. P., Probert, I. A. N., and Young, J.: Origin and evolution of coccolithophores: from coastal hunters to oceanic farmers, in: Evolution of primary producers in the sea, edited by: Falkowski, P. and Knoll, A., Academic Press, Amsterdam, 251–285, 2007.
Dickson, A. G., Afghan, J. D., and Anderson, G. C.: Reference materials for oceanic CO2 analysis: a method for the certification of total alkalinity, Mar. Chem., 80, 185–197, https://doi.org/10.1016/S0304-4203(02)00133-0, 2003.
Dickson, A. G., Sabine, C. L., and Christian, J. R. (Eds.): Guide to best practices for ocean CO2 measurements, North Pacific Marine Science Organization, Sidney, British Columbia, 2007.
Erba, E.: Nannofossils and superplumes: the early Aptian “nannoconid crisis”, Paleoceanography, 9, 483–501, https://doi.org/10.1029/94PA00258, 1994.
Erba, E.: The first 150 million years history of calcareous nannoplankton: biosphere–geosphere interactions, Palaeogeogr. Palaeocl., 232, 237–250, https://doi.org/10.1016/j.palaeo.2005.09.013, 2006.
Erba, E., Bottini, C., Weissert, H. J., and Keller, C. E.: Calcareous nannoplankton response to surface-water acidification around Oceanic Anoxic Event 1a, Science, 329, 428–432, https://doi.org/10.1126/science.1188886, 2010.
Erba, E., Bottini, C., Faucher, G., Gambacorta, G., and Visentin, S.: The response of calcareous nannoplankton to Oceanic Anoxic Events: The Italian pelagic record, B. Soc. Paleontol. Ital., 58, 51–71, 2019.
Faucher, G., Erba, E., Bottini, C., and Gambacorta, G.: Calcareous nannoplankton response to the latest Cenomanian Oceanic Anoxic Event 2 perturbation, Rivista Italiana di Paleontologia e Stratigrafia (Research In Paleontology and Stratigraphy), 123, 159–176, 2017a.
Faucher, G., Hoffmann, L., Bach, L. T., Bottini, C., Erba, E., and Riebesell, U.: Impact of trace metal concentrations on coccolithophore growth and morphology: laboratory simulations of Cretaceous stress, Biogeosciences, 14, 3603–3613, https://doi.org/10.5194/bg-14-3603-2017, 2017b.
Ferreira, J., Mattioli, E., and van de Schootbrugge, B: Palaeoenvironmental vs. evolutionary control on size variation of coccoliths across the Lower-Middle Jurassic, Palaeogeogr. Palaeocl., 465, 177–192, https://doi.org/10.1016/j.palaeo.2016.10.029, 2017.
Fraguas, Á. and Young, J. R.: Evolution of the coccolith genus Lotharingius during the Late Pliensbachian-Early Toarcian interval in Asturias (N Spain). Consequences of the Early Toarcian environmental perturbations, Geobios, 44, 361–375, https://doi.org/10.1016/j.geobios.2010.10.005, 2011.
Gattuso, J. P., Lee, K., Rost, B., and Schulz, K.: Approaches and tools to manipulate the carbonate chemistry, in: Guide to Best Practices for Ocean Acidification Research and Data Handling, edited by: Riebesell, U., Fabry, V. J., Hansson, L., and Gattuso, J.-P., Brussels, Publication Office of the European Union, 41–52, 2010.
Gibbs, S. J., Stoll, H. M., Bown, P. R., and Bralower, T. J.: Ocean acidification and surface water carbonate production across the Paleocene–Eocene thermal maximum, Earth Planet. Sc. Lett., 295, 583–592, https://doi.org/10.1016/j.epsl.2010.04.044, 2010.
Gibbs, S. J., Bown, P. R., Ridgwell, A., Young, J. R., Poulton, A. J., and O'Dea, S. A.: Ocean warming, not acidification, controlled coccolithophore response during past greenhouse climate change, Geology, 44, 59–62, https://doi.org/10.1130/G37273.1, 2016.
Giraud, F., Pittet, B., Mattioli, E., and Audouin, V.: Paleoenvironmental controls on the morphology and abundance of the coccolith Watznaueria britannica (Late Jurassic, southern Germany), Mar. Micropaleontol., 60, 205–225, https://doi.org/10.1016/j.marmicro.2006.04.004, 2006.
Guillard, R. R. L. and Ryther, J. H.: Studies of marine planktonic diatoms: I. Cyclotella nana Hustedt, and Detonula confervacea (CLEVE) Gran, Can. J. Microbiol., 8, 229–239, 1962.
Jiang, S. and Wise Jr., S. W.: Surface-water chemistry and fertility variations in the tropical Atlantic across the Paleocene/Eocene Thermal Maximum as evidenced by calcareous nannoplankton from ODP Leg 207, Hole 1259B, Revue de micropaléontologie, 49, 227–244, https://doi.org/10.1016/j.revmic.2006.10.002, 2006.
Kester, D. R., Duedall, I. W., Connors, D. N., and Pytkowicz, R. M.: Preparation of artificial seawater, Limnol. Oceanogr., 12, 176–179, 1967.
Langer, G., Geisen, M., Baumann, K. H., Kläs, J., Riebesell, U., Thoms, S., and Young, J. R.: Species-specific responses of calcifying algae to changing seawater carbonate chemistry, Geochem. Geophy. Geosy., 7, Q09006, https://doi.org/10.1029/2005GC001227, 2006.
Langer, G., De Nooijer, L. J., and Oetjen, K.: On the role of the cytoskeleton in coccolith morphogenesis: the effect of cytoskeleton inhibitors, J. Phycol., 46, 1252–1256, https://doi.org/10.1111/j.1529-8817.2010.00916.x, 2010.
LaRoche, J., Rost, B., and Engel, A.: Bioassays, batch culture and chemostat experimentation, in: Guide for best practices in ocean acidification research and data reporting, edited by: Riebesell, U., Fabry, V. J., Hansson, L., and Gattuso, J.-P., Luxembourg, Publications Office of the European Union 81–94, 2010.
Lees, J. A., Bown, P. R., and Mattioli, E.: Problems with proxies? Cautionary tales of calcareous nannofossil paleoenvironmental indicators, Micropaleontology, 51, 333–343, https://doi.org/10.2113/gsmicropal.51.4.333, 2005.
Linnert, C. and Mutterlose, J.: Biometry of Cenomanian–Turonian placoliths: a proxy for changes of fertility and surface-water temperature?, Lethaia, 46, 82–97, https://doi.org/10.1111/j.1502-3931.2012.00323.x, 2012.
Liu, H., Aris-Brosou, S., Probert, I., and De Vargas, C.: A time line of the environmental genetics of the haptophytes, Mol. Biol. Evol., 27, 161–176, https://doi.org/10.1093/molbev/msp222, 2010.
Lohbeck, K. T., Riebesell, U., and Reusch, T. B.: Adaptive evolution of a key phytoplankton species to ocean acidification, Nat. Geosci., 5, 346, https://doi.org/10.1038/ngeo1441, 2012.
Lübke, N. and Mutterlose, J.: The impact of OAE 1a on marine biota deciphered by size variations of coccoliths, Cretaceous Res., 61, 169–179, https://doi.org/10.1016/j.cretres.2016.01.006, 2016.
Lübke, N., Mutterlose, J., and Bottini, C.: Size variations of coccoliths in Cretaceous oceans, a result of preservation, genetics and ecology?, Mar. Micropaleontol., 117, 25–39, https://doi.org/10.1016/j.marmicro.2015.03.002, 2015.
Mattioli, E., Pittet, B., Young, J. R., and Bown, P. R.: Biometric analysis of Pliensbachian-Toarcian (Lower Jurassic) coccoliths of the family Biscutaceae: intra-and interspecific variability versus palaeoenvironmental influence, Mar. Micropaleontol., 52, 5–27, https://doi.org/10.1016/j.marmicro.2004.04.004, 2004a.
Mattioli, E., Pittet, B., Palliani, R., Röhl, H. J., Schmid-Röhl, A., and Morettini, E.: Phytoplankton evidence for the timing and correlation of palaeoceanographical changes during the early Toarcian oceanic anoxic event (Early Jurassic), J. Geol. Soc., 161, 685–693, https://doi.org/10.1144/0016-764903-074, 2004b.
Mattioli, E., Pittet, B., Petitpierre, L., and Mailliot, S.: Dramatic decrease of pelagic carbonate production by nannoplankton across the Early Toarcian anoxic event (T-OAE), Global Planet. Change, 65, 134–145, https://doi.org/10.1016/j.gloplacha.2008.10.018, 2009.
Monteiro, F. M., Bach, L. T., Brownlee, C., Bown, P., Rickaby, R. E., Poulton, A. J., Tyrrel, T., Beaufort, L., Dutkiewicz, S., Gibbs, S., Gutowska, M. A., Lee, R., Riebesell, U., Young, J., and Ridgwell, A.: Why marine phytoplankton calcify, Sci. Adv., 2, e1501822, https://doi.org/10.1126/sciadv.1501822, 2016.
Müller, M. N., Beaufort, L., Bernard, O., Pedrotti, M. L., Talec, A., and Sciandra, A.: Influence of CO2 and nitrogen limitation on the coccolith volume of Emiliania huxleyi (Haptophyta), Biogeosciences, 9, 4155–4167, https://doi.org/10.5194/bg-9-4155-2012, 2012.
Mutterlose, J., Linnert, C., and Norris, R.: Calcareous nannofossils from the Paleocene–Eocene Thermal Maximum of the equatorial Atlantic (ODP Site 1260B): evidence for tropical warming, Mar. Micropaleontol., 65, 13–31, https://doi.org/10.1016/j.marmicro.2007.05.004, 2007.
O'Dea, S. A., Gibbs, S. J., Bown, P. R., Young, J. R., Poulton, A. J., Newsam, C., and Wilson, P. A.: Coccolithophore calcification response to past ocean acidification and climate change, Nat. Commun., 5, 5363, https://doi.org/10.1038/ncomms6363, 2014.
Paasche, E.: Roles of nitrogen and phosphorus in coccolith formation in Emiliania huxleyi (Prymnesiophyceae), European J. Phycol., 33, 33–42, https://doi.org/10.1080/09670269810001736513, 1998.
Pierrot, D., Lewis, E., and Wallace, D.W.R: MS Excel Program Developed for CO2 System Calculations. ORNL/CDIAC-105a, Carbon Dioxide Information Analysis Center, Oak Ridge National Laboratory, U.S. Department of Energy, Oak Ridge, Tennessee, https://doi.org/10.3334/CDIAC/otg.CO2SYS_XLS_CDIAC105a, 2006.
Raffi, I. and De Bernardi, B.: Response of calcareous nannofossils to the Paleocene–Eocene Thermal Maximum: observations on composition, preservation and calcification in sediments from ODP Site 1263 (Walvis Ridge – SW Atlantic), Mar. Micropaleontol., 69, 119–138, https://doi.org/10.1016/j.marmicro.2008.07.002, 2008.
Renaud, S. and Klaas, C.: Seasonal variations in the morphology of the coccolithophore Calcidiscus leptoporus off Bermuda (N. Atlantic), J. Plankton Res., 23, 779–795, https://doi.org/10.1093/plankt/23.8.779, 2001
Renaud, S., Ziveri, P., and Broerse, A. T.: Geographical and seasonal differences in morphology and dynamics of the coccolithophore Calcidiscus leptoporus, Mar. Micropaleontol., 46, 363–385, https://doi.org/10.1016/S0377-8398(02)00081-6, 2002.
Riebesell U., Zondervan I., Rost B., Tortell P. D., Zeebe R. E., and Morel, F. M.: Reduced calcification of marine plankton in response to increased atmospheric CO2, Nature, 407, 364–367, https://doi.org/10.1038/35030078, 2000.
Rosas-Navarro, A., Langer, G., and Ziveri, P.: Temperature affects the morphology and calcification of Emiliania huxleyi strains, Biogeosciences, 13, 2913–2926, https://doi.org/10.5194/bg-13-2913-2016, 2016.
Roy, R. N., Roy, L. N., Vogel, K. M., Porter-Moore, C., Pearson, T., Good, C. E., Millero, F. J., and Campbell, D. M.: The dissociation constants of carbonic acid in seawater at salinities 5 to 45 and temperatures 0 to 45 ∘C, Mar. Chem., 44, 249–267, https://doi.org/10.1016/0304-4203(93)90207-5, 1993.
Schindelin, J., Arganda-Carreras, I., Frise, E., Kaynig, V., Longair, M., Pietzsch, T., Rueden, C., Saalfeld, S., Schmid, B., Tinevez, J., Y., White, D. J., Hartenstein, V., Eliceiri K., Tomancak, P., and Cardona, A.: Fiji: an open-source platform for biological-image analysis, Nat. Mehods, 9, 676–682, https://doi.org/10.1038/nmeth.2019, 2012.
Schulz, K. G., Bach, L. T., Bellerby, R. G. J., Bermúdez, R., Büdenbender, J., Boxhammer, T., Czerny, J., Engel., A., Ludwig, A., Meyerhöfer, M., Larsen, A., Paul, A. J., Sswat, Michael, and Riebesell, U.: Phytoplankton blooms at increasing levels of atmospheric carbon dioxide: experimental evidence for negative effects on prymnesiophytes and positive on small picoeukaryotes, Front. Mar. Sci., 4, 1–18, https://doi.org/10.3389/fmars.2017.00064, 2017.
Sheward, R. M., Poulton, A. J., Gibbs, S. J., Daniels, C. J., and Bown, P. R.: Physiology regulates the relationship between coccosphere geometry and growth phase in coccolithophores, Biogeosciences, 14, 1493–1509, https://doi.org/10.5194/bg-14-1493-2017, 2017.
Suan, G., Mattioli, E., Pittet, B., Mailliot, S., and Lécuyer, C.: Evidence for major environmental perturbation prior to and during the Toarcian (Early Jurassic) oceanic anoxic event from the Lusitanian Basin, Portugal, Paleoceanography, 23, PA1202, https://doi.org/10.1029/2007PA001459, 2008.
Suan, G., Mattioli, E., Pittet, B., Lécuyer, C., Suchéras-Marx, B., Duarte, L. V., Philippe, M., Reggiani, L., and Martineau, F.: Secular environmental precursors to Early Toarcian (Jurassic) extreme climate changes, Earth Planet. Sc. Lett., 290, 448–458, https://doi.org/10.1016/j.epsl.2009.12.047, 2010.
Suchéras-Marx, B., Mattioli, E., Pittet, B., Escarguel, G., and Suan, G.: Astronomically-paced coccolith size variations during the early Pliensbachian (Early Jurassic), Palaeogeogr. Palaeocl., 295, 281–292, https://doi.org/10.1016/j.palaeo.2010.06.006, 2010.
Tiraboschi, D., Erba, E., and Jenkyns, H. C.: Origin of rhythmic Albian black shales (Piobbico core, central Italy): Calcareous nannofossil quantitative and statistical analyses and paleoceanographic reconstructions, Paleoceanography and Paleoclimatology, 24, PA2222, https://doi.org/10.1029/2008PA001670, 2009.
Tremolada, F., De Bernardi, B., and Erba, E.: Size variations of the calcareous nannofossil taxon Discoaster multiradiatus (Incertae sedis) across the Paleocene–Eocene thermal maximum in ocean drilling program holes 690B and 1209B, Mar. Micropaleontol., 67, 239–254, https://doi.org/10.1016/j.marmicro.2008.01.010, 2008.
Trimborn, S., Langer, G., and Rost, B.: Effect of varying calcium concentrations and light intensities on calcification and photosynthesis in Emiliania huxleyi, Limnol. Oceanogr., 52, 2285–2293, https://doi.org/10.4319/lo.2007.52.5.2285, 2007.
Tyrrell, T. and Young, J. R.: Coccolithophores, in: Encyclopedia of Ocean Sciences, edited by: Steele, J. H., Turekian, K. K., and Thorpe, S. A., Academic Press, San Diego, 3568–3576, 2009.
Wulff, L., Mutterlose, J., and Bornemann, A.: Size variations and abundance patterns of calcareous nannofossils in mid Barremian black shales of the Boreal Realm (Lower Saxony Basin), Mar. Micropaleontol., 156, 101853, https://doi.org/10.1016/j.marmicro.2020.101853, 2020.
Zondervan I.: The effects of light, macronutrients, trace metals and CO2 on the production of calcium carbonate and organic carbon in coccolithophores – a review, Deep-Sea Res. Pt. II, 54, 521–537, https://doi.org/10.1016/j.dsr2.2006.12.004, 2007.