the Creative Commons Attribution 4.0 License.
the Creative Commons Attribution 4.0 License.
 | 19 Dec 2019
Two types of North American droughts related to different atmospheric circulation patterns
Angela-Maria Burgdorf
Stefan Brönnimann
Jörg Franke
Proxy-based studies suggest that the southwestern USA is affected by two types of summer drought, often termed Dust Bowl-type droughts and 1950s-type droughts. The spatial drought patterns of the two types are distinct. It has been suggested that they are related to different circulation characteristics, but a lack of observation-based data has precluded further studies. In this paper, we analyze multi-annual summer droughts in North America back to 1600 in tree-ring-based drought reconstructions and in a global, monthly three-dimensional reconstruction of the atmosphere. Using cluster analysis of drought indices, we confirm the two main drought types and find a similar catalog of events as previous studies. These two main types of droughts are then analyzed with respect to 2 m temperatures (T2m), sea-level pressure (SLP), and 500 hPa geopotential height (GPH) in boreal summer. 1950s-type droughts are related to a stronger wave train over the Pacific–North American sector than Dust Bowl-type droughts, whereas the latter show the imprint of a poleward-shifted jet and establishment of a Great Plains ridge. The 500 hPa GPH patterns of the two types differ significantly not only over the contiguous United States and Canada but also over the extratropical North Atlantic and the Pacific. Dust Bowl-type droughts are associated with positive GPH anomalies, while 1950s-type droughts exhibit strong negative GPH anomalies. In comparison with 1950s-type droughts, the Dust Bowl-type droughts are characterized by higher sea-surface temperatures (SSTs) in the northern North Atlantic. Results suggest that atmospheric circulation and SST characteristics not only over the Pacific but also over the extratropical North Atlantic affect the spatial pattern of North American droughts.
- Article
(7128 KB) - Full-text XML
-
Supplement
(6291 KB) - BibTeX
- EndNote


Since the turn of the 21st century, prolonged drought events have afflicted large parts of North America, predominantly the southwestern United States (Seager, 2007; Weiss et al., 2009; Cayan et al., 2010; Seager and Vecchi, 2010; Seager and Hoerling, 2014). In recent years, exceptionally severe droughts struck California (Griffin and Anchukaitis, 2014; Seager et al., 2014a, 2015), the Great Plains (Hoerling et al., 2012, 2014; Livneh and Hoerling, 2016), and the Texas–northern Mexican region (Seager et al., 2014b). However, drought conditions are a regular feature of the climate in the western United States and have repeatedly affected the region in the past (e.g., Cook et al., 2007; Seager et al., 2009). A particularly strong multi-annual drought event in the instrumental record period was the decadal-scale Dust Bowl drought, which coincided with the Great Depression and had tremendous economic and social effects (Worster, 1979). Proxy data provide evidence that even longer and more severe drought periods, so-called “megadroughts”, have occurred in the past (e.g., Woodhouse and Overpeck, 1998; Cook et al., 2007, 2010, 2016; Stahle et al., 2007). Severe droughts in the paleoclimate record include decadal to multidecadal droughts during medieval times (∼ AD 900 to ∼ AD 1300), characterized by not only persistent aridity but also increased temperatures over western North America (Woodhouse and Overpeck, 1998; Cook et al., 2004; Woodhouse et al., 2010).
In light of greenhouse gas-induced global warming, this temperature–drought relationship (with the concurrence of increasing aridity and rising temperatures) is alarming, and climate model simulations suggest a possible increase in drought frequency and duration in the 21st century (Seager et al., 2007; Cayan et al., 2010; Seager and Vecchi, 2010; Dai, 2013; Cook et al., 2014a, 2015, 2018a; Ault et al., 2016). In order to be able to cope with the challenges associated with the projected increase in aridity and thus drought risk in the future, it is important to better understand the dynamics behind multi-annual drought events in the western United States. Since severe multi-annual droughts are limited in the era of observation-based climate data, analyses have to be extended into the reconstruction era. Reconstructions based on proxy data, however, are mostly restricted to interpretations as surface temperature and moisture. Here we analyze past drought periods in a three-dimensional reconstruction that is based on data assimilation.
During the last decade, considerable progress has been achieved in isolating the mechanisms behind multi-annual droughts in the western USA. Both proxy-based studies (Woodhouse and Overpeck, 1998; McCabe et al., 2004; Routson et al., 2016) and model simulations suggest that oceanic forcing by both the Pacific and to lesser degree the Atlantic acts as a trigger (e.g., Schubert et al., 2004a, b, 2009; Seager, 2007; Cook et al., 2008; Kushnir et al., 2010; Seager et al., 2015; Baek et al., 2019). In particular, a cool Pacific and a warm Atlantic, especially in their tropical regions, are conducive to droughts such as the 1930s Dust Bowl drought, demonstrating a combined impact of both ocean basins (McCabe et al., 2004; Schubert et al., 2004b, 2009; Feng et al., 2008; Kushnir et al., 2010). However, the roles of individual ocean basins remain less clear. For the period of instrumental sea-surface temperature (SST) observations after 1856, a persistent La Niña-type SST pattern during all prolonged droughts is found, as well as a cold Indian Ocean during most of them (Seager et al., 2005; Herweijer et al., 2006; Seager, 2007). The contribution of the Atlantic Ocean is shown to be only minor. In contrast, Nigam et al. (2011) find a key role of the Atlantic SST in their observation-based analysis of 20th century drought and wet periods in the Great Plains. A significant influence of North Atlantic SSTs variations on multi-decadal droughts in the continental USA is also found by Enfield et al. (2001). While the general setting of a cool Pacific and warm Atlantic is overall sufficient to produce drought conditions in AMIP-type model simulations, strong droughts require further mechanisms such as land-surface feedback or the effect of dust (see Schubert et al., 2004b; Cook et al., 2008, 2009, 2013, 2014b). Furthermore, studies have shown that droughts are strongly influenced by internal atmospheric variability of the climate system unrelated to oceanic forcings or a combination thereof (e.g., Hoerling et al., 2009; Seager and Hoerling, 2014; Cook et al., 2018b; Baek et al., 2019).
Considering this complex interplay of oceanic forcings, internal atmospheric variability, and feedback mechanisms, it is apparent that not all North American droughts are alike. Fye et al. (2003) analyzed tree-ring-based multi-annual drought reconstructions and found two different types of drought based on their spatial pattern: Dust Bowl-type droughts and 1950s-type droughts. These distinct spatial patterns possibly suggest different underlying dynamics of the atmospheric circulation leading to prolonged drought events. Woodhouse et al. (2009) analyzed two types of drought with respect to the associated 500 hPa geopotential height fields and found evidence for both tropical and extratropical influences. Their study was based on severe single-year droughts and restricted to the 1949–2003 period. Further, they focused on atmospheric circulation during December through March to represent conditions of the cold season. Analyzing a large sample of droughts with respect to upper-level atmospheric circulation was not hitherto possible and thus only droughts in the instrumental record period have so far been analyzed, mostly focusing on the Dust Bowl drought. Hemispheric and global upper-level fields were reconstructed by Griesser et al. (2010) back to 1881 and used to study upper-level circulation during the Dust Bowl drought (Brönnimann et al., 2009, 2012), but not a larger set of droughts. The Twentieth Century Reanalysis V2c (Compo et al., 2011) extends back to 1851 and was used to study the heat waves associated with the Dust Bowl drought (Cowan et al., 2017) and the Atlantic imprint on droughts in the USA (Nigam et al., 2011).
Here we follow up on this work and further analyze the two types of multi-annual drought suggested by Fye et al. (2003) in a new monthly global three-dimensional reconstruction back to 1600 (Franke et al., 2017a), which allows a focus on atmospheric circulation. We analyze the imprint of the two types of drought in different fields and find that they differ significantly in their imprint over the contiguous United States and the extratropical North Atlantic.
The paper is organized as follows. Section 2 describes the data sets used (reconstructions and reanalyses) as well as the methods. Analyses of droughts during the past 400 years are presented in Sect. 3. Additionally, we analyze the most recent drought, namely 2000–2015, which was excluded from previous statistical analyses. In Sect. 4 we discuss the results in the light of possible oceanic forcing. Finally, conclusions are drawn in Sect. 5.
2.1 Data sets used
Droughts in our study are addressed using the Living Blended Drought Atlas version 1 (LBDAv1; Cook et al., 2010). This data set is an updated version of the North American Drought Atlas (NADA; Cook et al., 1996, 1999, 2004) and provides annual values of the summer (June–August, JJA) Palmer Drought Severity index (PDSI) for the past 2 millennia based on tree ring reconstructions. The reconstruction includes 1845 tree ring chronologies and covers the North American continent at a spatial resolution of . This allows for a regionally better characterization of drought variability compared to the NADA. The LBDAv1 is highly consistent with the global hydroclimate reconstruction (PHYDA) that reconstructs the PDSI at ∼2∘ resolution, based on a multi-proxy approach (Steiger et al., 2018). The comparison of PDSI fields from the LBDAv1 and PHYDA confirmed the very good agreement of the two PDSI products. Because no significant differences exist between the two data sets over the southwestern USA, we decided to use the LBDA due to its higher resolution and in order to stay consistent with the work of Fye et al. (2003).
For comparison with Fye et al. (2003) and due to the availability of the reconstruction data set EKF400 (see below) we restricted the analysis to the post-1600 period for PDSI and atmospheric circulation. In order to include droughts in the 21st century we used the Palmer Modified Drought index (PMDI) from the Living Blended Drought Atlas version 2 (LBDAv2; Cook et al., 2010). While the LBDAv1 ends in 2005, the LBDAv2 has been updated until 2017. It is based on the LBDAv1 (Cook et al., 2010) and calculates a PMDI by recalibrating the PDSI using Global Historical Climatology Network (GHCN) 5 km instrumental data and a kernel density distribution method. The LBDAv2 is furthermore limited to the contiguous USA compared to North America in the LBDAv1, which is why version 2 is only used for the 21st century drought. This latest drought, ca. 2000–2015, is too recent to be statistically analyzed according to our definitions (see below) but is briefly addressed as a separate event. To ensure a consistent drought detection metric we had to scale the LBDAv2 (PMDI) to the LBDAv1 (PDSI; see below).
To address fields of atmospheric circulation we analyzed 500 hPa geopotential height (GPH), sea-level pressure (SLP), air temperature 2 m above ground (T2m), and circulation indices from the EKF400 data set (Franke et al., 2017a). T2m and SST from the model input are almost identical, which justifies the use of T2m also over the ocean. EKF400 is a global, monthly, three-dimensional reconstruction based on an offline assimilation of early instrumental data, documentary data, and proxies (tree ring width, late wood density) into an initial condition ensemble of 30 global model simulations using an ensemble Kalman filter assimilation technique. The data set is given at a resolution of 4∘ and covers the period 1603–2004. The model is constrained, among other forcings, with annual sea-surface temperature reconstructions from Mann et al. (2009), to which we have added intra-annual, ENSO-related variability (see Bhend et al., 2012, for a method description). In this study, we analyze the ensemble mean. While the PHYDA data set offers reconstructed global T2m fields for the boreal growing season of June through August (JJA) at a ∼2∘ resolution, it does not include further atmospheric variables. We therefore limit our analysis of the atmospheric circulation contributing to long-term summer droughts to the EKF400 reconstruction. However, we offer a comparison of surface temperature composites for the four most recent drought periods in EKF400, PHYDA, and furthermore in Berkeley Earth (Rohde et al., 2013a, b), HadCRUT4.6 (Morice et al., 2012), and 20CRv2c (Compo et al., 2011) in the Supplement (Fig. S7). The reconstructions are generally in good agreement with the observations, but some differences remain.
In order to analyze drought dynamics of droughts in the 21st century we use the ERA-Interim reanalysis at a spatial resolution (Dee et al., 2011), which has been updated to summer 2018.
The circulation indices analyzed are the Pacific–North American (PNA) pattern (Wallace and Gutzler, 1981) and the latitude of the zonal mean subtropical jet over North America (i.e., the latitude of the maximum zonal mean zonal wind at 200 hPa as in Brönnimann et al. (2015), but restricted to 120 to 60∘ W). For the PNA index, monthly anomaly time series were standardized based on the 1901–2000 reference period. All analyses are performed using the ensemble mean of 30 members as well as using the best member, i.e., choosing for each warm season the member that best reproduces a global set of 34 high-quality tree-ring width chronologies (Brönnimann, 2015). The best member minimizes the cost function Eq. (1):
with y denoting the tree ring width, H[x] the tree ring width as modeled by the Vaganov–Shashkin Lite tree ring model (Breitenmoser et al., 2014), and R the corresponding error covariance matrix determined by using instrumental data in the 20th century (see Breitenmoser et al., 2014, for details). In contrast to the ensemble mean, whose variance decreases back in time, the best member has a stable variance over time.
Note that the SSTs used to drive the model that formed the basis of the assimilation exhibit suppressed interannual variability as compared to decadal variability (Franke et al., 2013). For instance, indices of El Niño and of the Pacific Decadal Oscillation (PDO) are very similar. Since the focus of this paper is on multi-annual drought, defined by means of a 5-year filter (see below), the suppression of interannual variability does not markedly affect our results (given the similarity between El Niño and PDO indices in the SSTs underlying our assimilation, we refer to a “negative PDO/La Niña” in this paper).
2.2 Methods
Our starting point is the paper by Fye et al. (2003), which was based on a previous version of a PDSI reconstruction with a spatial resolution, derived from 426 tree-ring chronologies (Cook et al., 1996, 1999). We first reproduced their analysis using the LBDAv1 (Cook et al., 2010) which has improved areal coverage and spatial resolution. The agreement between the two data sets was generally good, although clear deviations were found for some of the drought periods, pointing to the need for re-classifying the drought events using LBDAv1.
All multi-annual droughts found in our preliminary analysis and those documented by Fye et al. (2003) primarily affect the Great Plains and the southwestern United States. For that reason, we decided to subset our domain in order to even better capture the spatial signal of droughts in this particular drought-prone area. In doing so, our detection method revealed, in addition to the pervious drought catalog, further multi-annual drought periods that are very prominent in the relevant domain but remain disguised when looking at the entirety of North America. We thus concentrated our drought classification on the region 22–52∘ N and 130–85∘ E, a domain that includes, beside the Great Plains and the southwestern United States, prominent drought regions in the Mississippi Valley, northern Mexico, and the southern Canadian Great Plains. It however excludes the East Coast and the tropical South as well as Alaska and most of Canada.
For the definition of drought periods, we proceeded in the following way: first, an index for the surface area affected by drought (PDSI ; following Fye et al., 2003) for every time step (summer) was calculated. The index was then filtered with a 5-year moving average, as the focus is on multi-year droughts. Years with >33 % of surface area affected by drought were then selected. These years are considered “drought years”. Five or more drought years in succession are defined as drought periods. Single years with a smaller percentage than 33 % in between continuous drought years are included in the drought period. This resulted in a list of 17 drought periods for the period 1600–2005, which is displayed in Table 1 (see Table S1 in the Supplement).
Table 1Drought periods since 1600 based on clustering with LBDAv1, drought duration, and attribution to cluster.
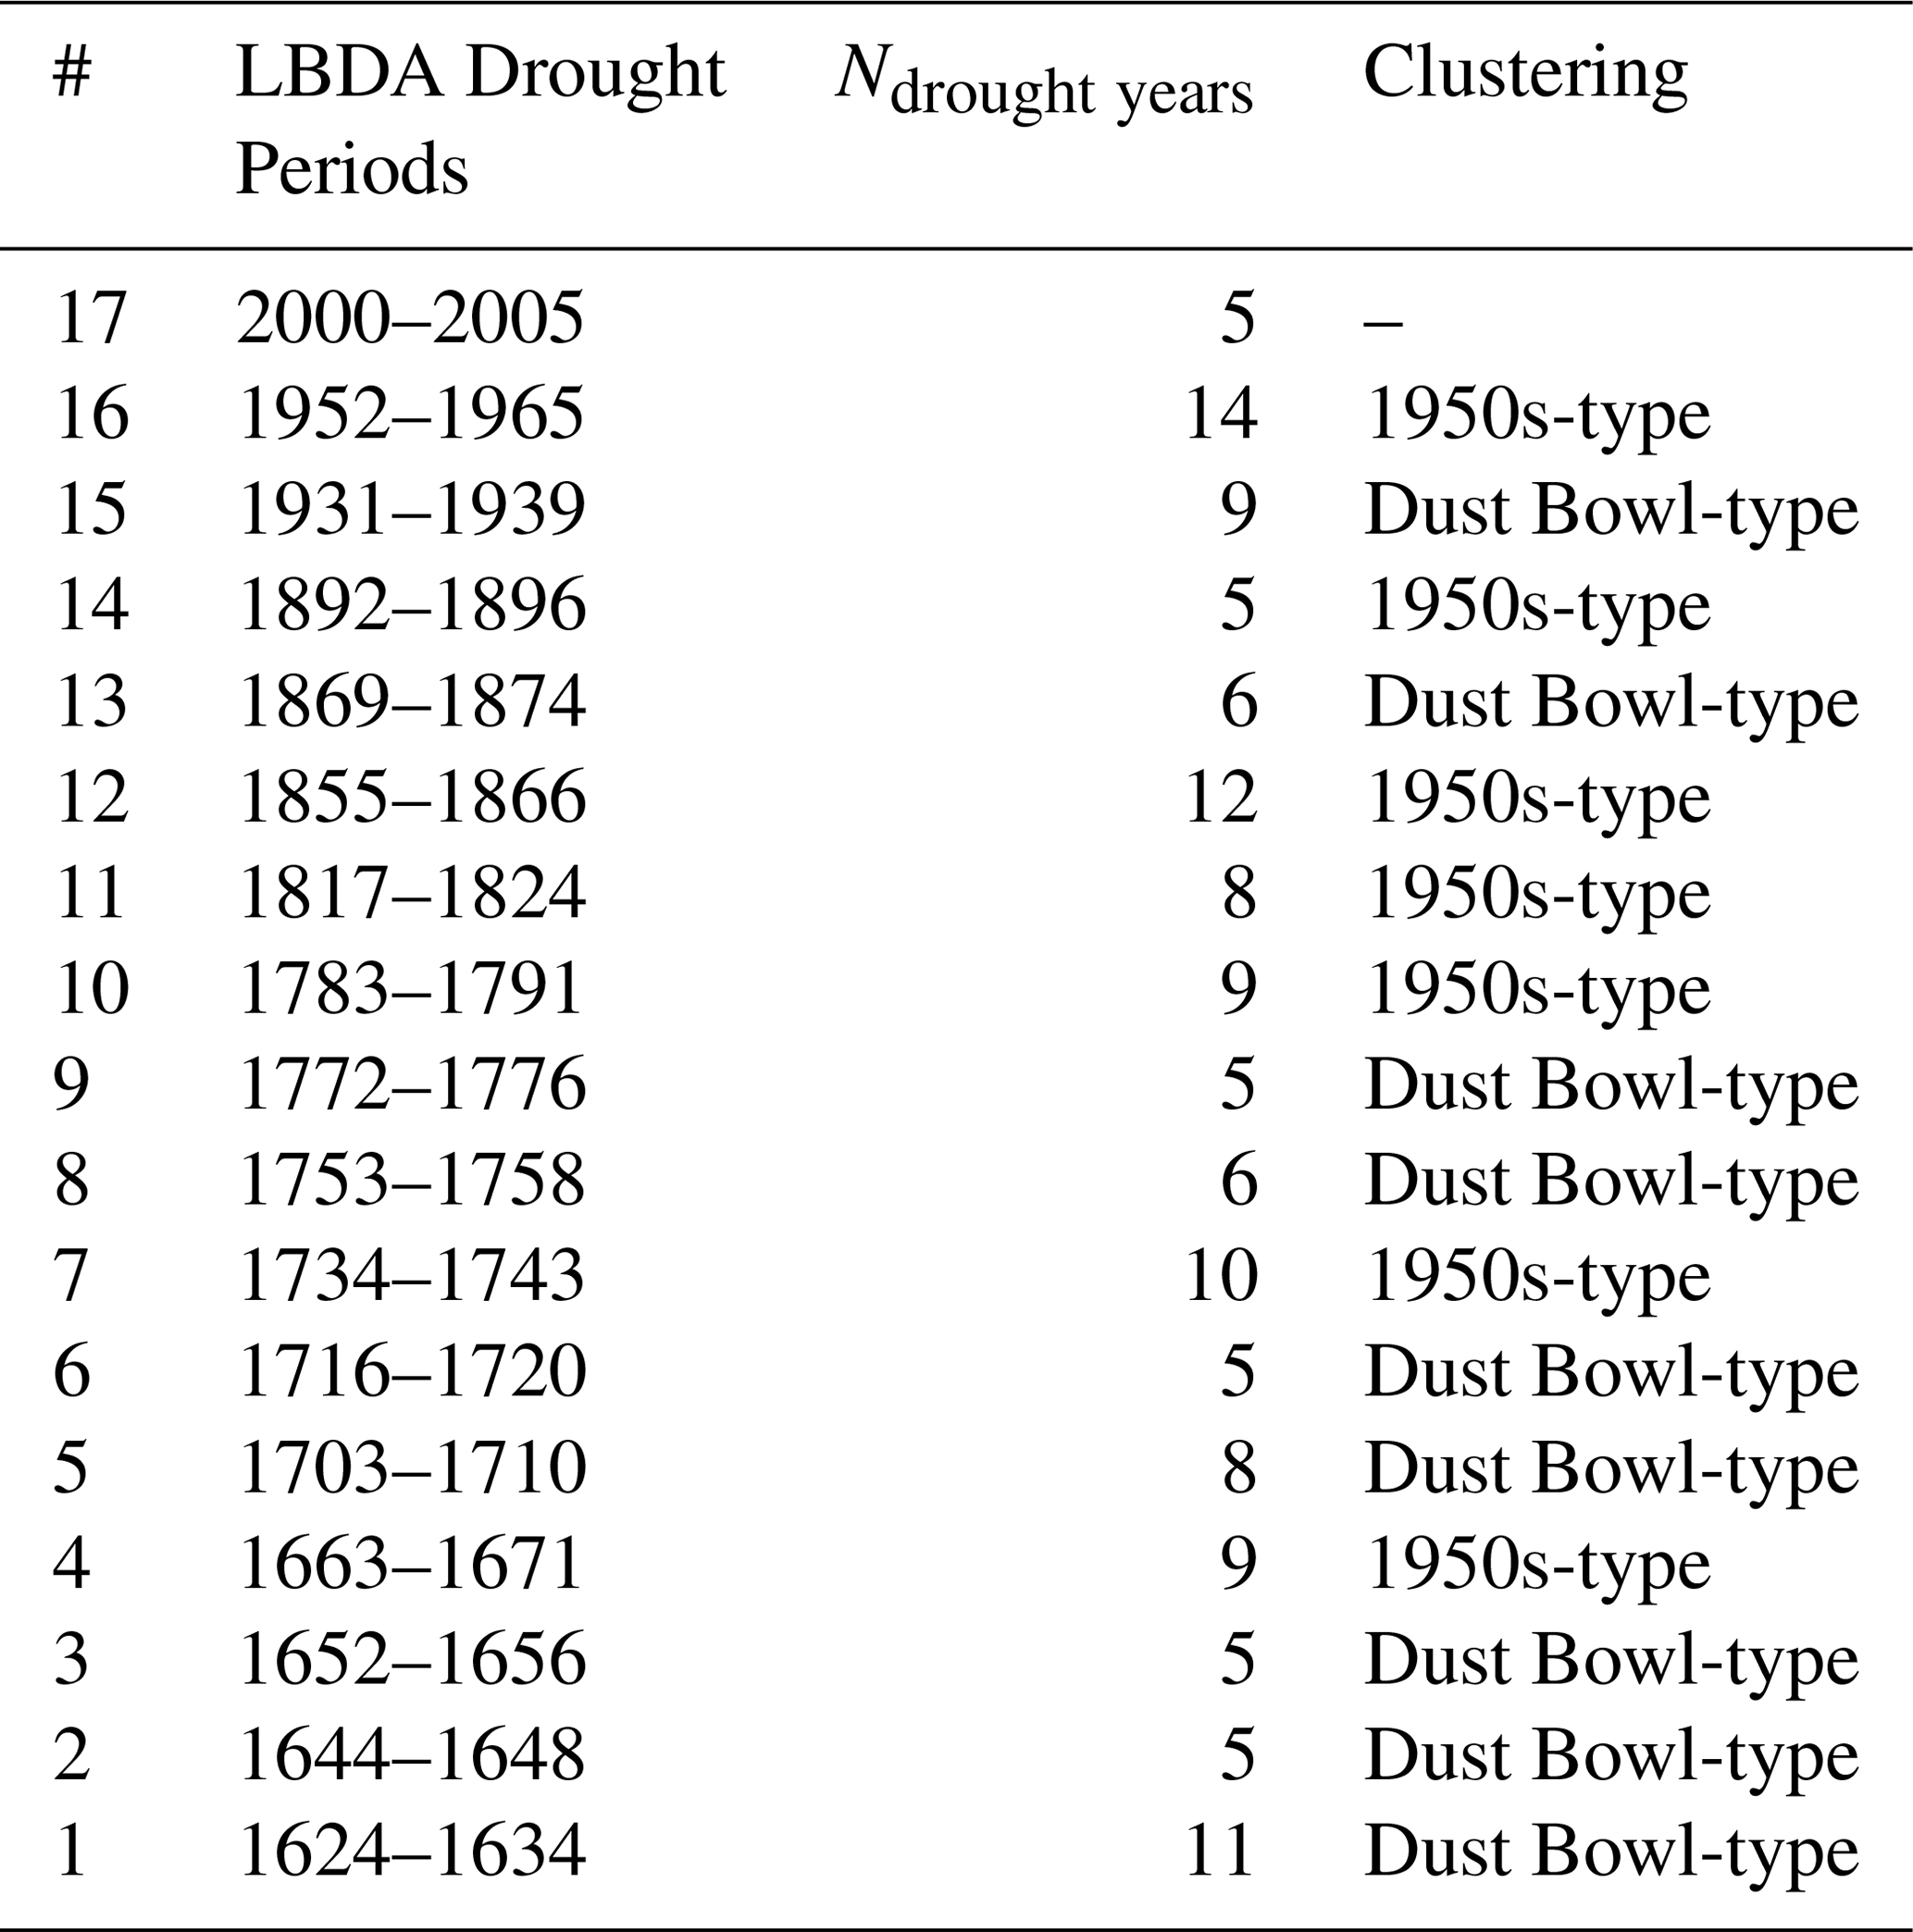
In a next step, the spatial patterns of the drought periods were clustered. The clustering was based on the fields of time-averaged PDSI per drought period in LBDAv1. The individual drought periods were weighted with the square root of their length in years; furthermore, grid cells were area weighted. The sample size of 17 drought periods is quite sensitive to the cluster numbers, the chosen spatial and temporal domain, and the clustering approach itself. Limiting the clustering to two clusters resulted in a robust classification of the droughts and is furthermore consistent with the literature (e.g., Fye et al., 2003; see Figs. S1 and S2 in the Supplement for the PDSI pattern of the individual droughts). In terms of the clustering method, we chose a combined approach of hierarchical clustering (Ward's minimum variance method) and k-means clustering. Ward's method was used to determine the cluster centers, which were then used as a starting point for the k-means clustering (see Figs. S3 and S4). With this combined method, the resulting clustering affiliations for the droughts are identical to the hierarchical clustering, pointing to the robustness of the clustering.
The turn-of-the-century drought was excluded from the clustering analysis due to limited data availability (LBDAv1 only covers the years up to 2005, whereas drought conditions in the southwestern USA continued into the 2010s). Using LBDAv2, which ends in 2017 (due to the different areal extent and spatial resolution, the data set had to be fitted to the LBDA using regression), our definition detects a drought from 2000 to 2015. Interestingly, its spatial pattern correlates negatively with both drought types which indicates that it is potentially characteristic of an alternative drought type (Fig. S5). We therefore excluded the most recent drought, henceforth called 21st century drought, from the clustering and statistical analyses, and instead analyzed it independently.
For the analysis of climate fields, each drought period was first expressed relative to a reference period that comprised 5 years before and 5 years after the drought period. Then we calculated composites for the types of drought events for different seasons. In the following, we focus on the summer-mean (JJA) fields of 500 hPa GPH, SLP, and T2m. We compared the ±5-year composites approach to the simpler approach of using anomalies from the long-term mean, which resulted in qualitatively similar patterns for the case of SLP (Fig. S6). However, using a common climatology is not a good option for variables that have strong centennial trends such as T2m and GPH. For these variables, spurious signals may appear as our drought sample is small and the two types of droughts are not equally distributed over time, so they will be aliased by global warming trends.
The anomalies of the individual composites as well as their differences were tested using a non-parametric Wilcoxon–Mann–Whitney test.
Plotting the first two principal components of the PDSI during the drought periods well separates two distinct clusters, explaining 23.3 % and 17.2 % of the total variance respectively (Fig. S4). A comparison with Fye et al. (2003) reveals that our approach tends to depict more drought periods than theirs, but 11 (perhaps 12) out of our 16 periods can be attributed to corresponding periods in Fye et al. (2003), though the length differs (see Table S1). Among these 11 (12) droughts, 8 (9) were classified in the same cluster as in Fye et al. (2003) if we term our first cluster Dust Bowl-type droughts and our second cluster 1950s-type droughts (see Table S1). We therefore kept that nomenclature. Fye et al. (2003) use a different clustering method which could explain part of the difference in the classification. We find four (five) drought periods that are not classified by Fye et al. (2003) whereas they find two droughts that our analysis does not capture. Out of the 11 (12) drought periods, three are assigned to opposite clusters in our study compared to Fye et al. (2003): we found the 1772–1776 and the 1869–1874 droughts to be Dust Bowl-type droughts while Fye et al. (2003) depict them as 1950s-type droughts. In their study, however, the duration of these two droughts is double in length compared to ours, which could serve as an explanation as to the different classification. The third drought that is classified differently is the Civil War Drought of the 1850s and 1860s where the duration of the drought is coincident in both two studies apart from 1 year. It appears that the drought changes its character within the drought period from La Niña to El Niño conditions, which could possibly explain this discrepancy. There are three major differences between our study and Fye et al. (2003): first, Fye et al. (2003) use the first version of gridded summer PDSI reconstruction (Cook et al., 1996, 1999), which is a less sophisticated version of the LBDAv1. Second, we use a different drought detection metric, and third, they use the entire domain over the contiguous USA whereas we focus on a subsetted drought-prone domain. Given the methodological differences between Fye et al. (2003) and our study, it is remarkable how similar both drought catalog and clustering results are, pointing to their robustness.
Figure 1 shows averaged PDSI values of two clustered drought types (a–c). There are distinct differences visible between the two types of drought. While both the Dust Bowl-type and 1950s-type affect the midwestern and southwestern United States, Dust Bowl-type droughts stretch far into the Pacific Northwest, whereas 1950s-type droughts stretch down into Mexico. The difference between the Dust Bowl-type and 1950s-type (nine and seven droughts, respectively) shows that these two features are statistically significant (Fig. 1c). A clear NW–SE dipole arises.
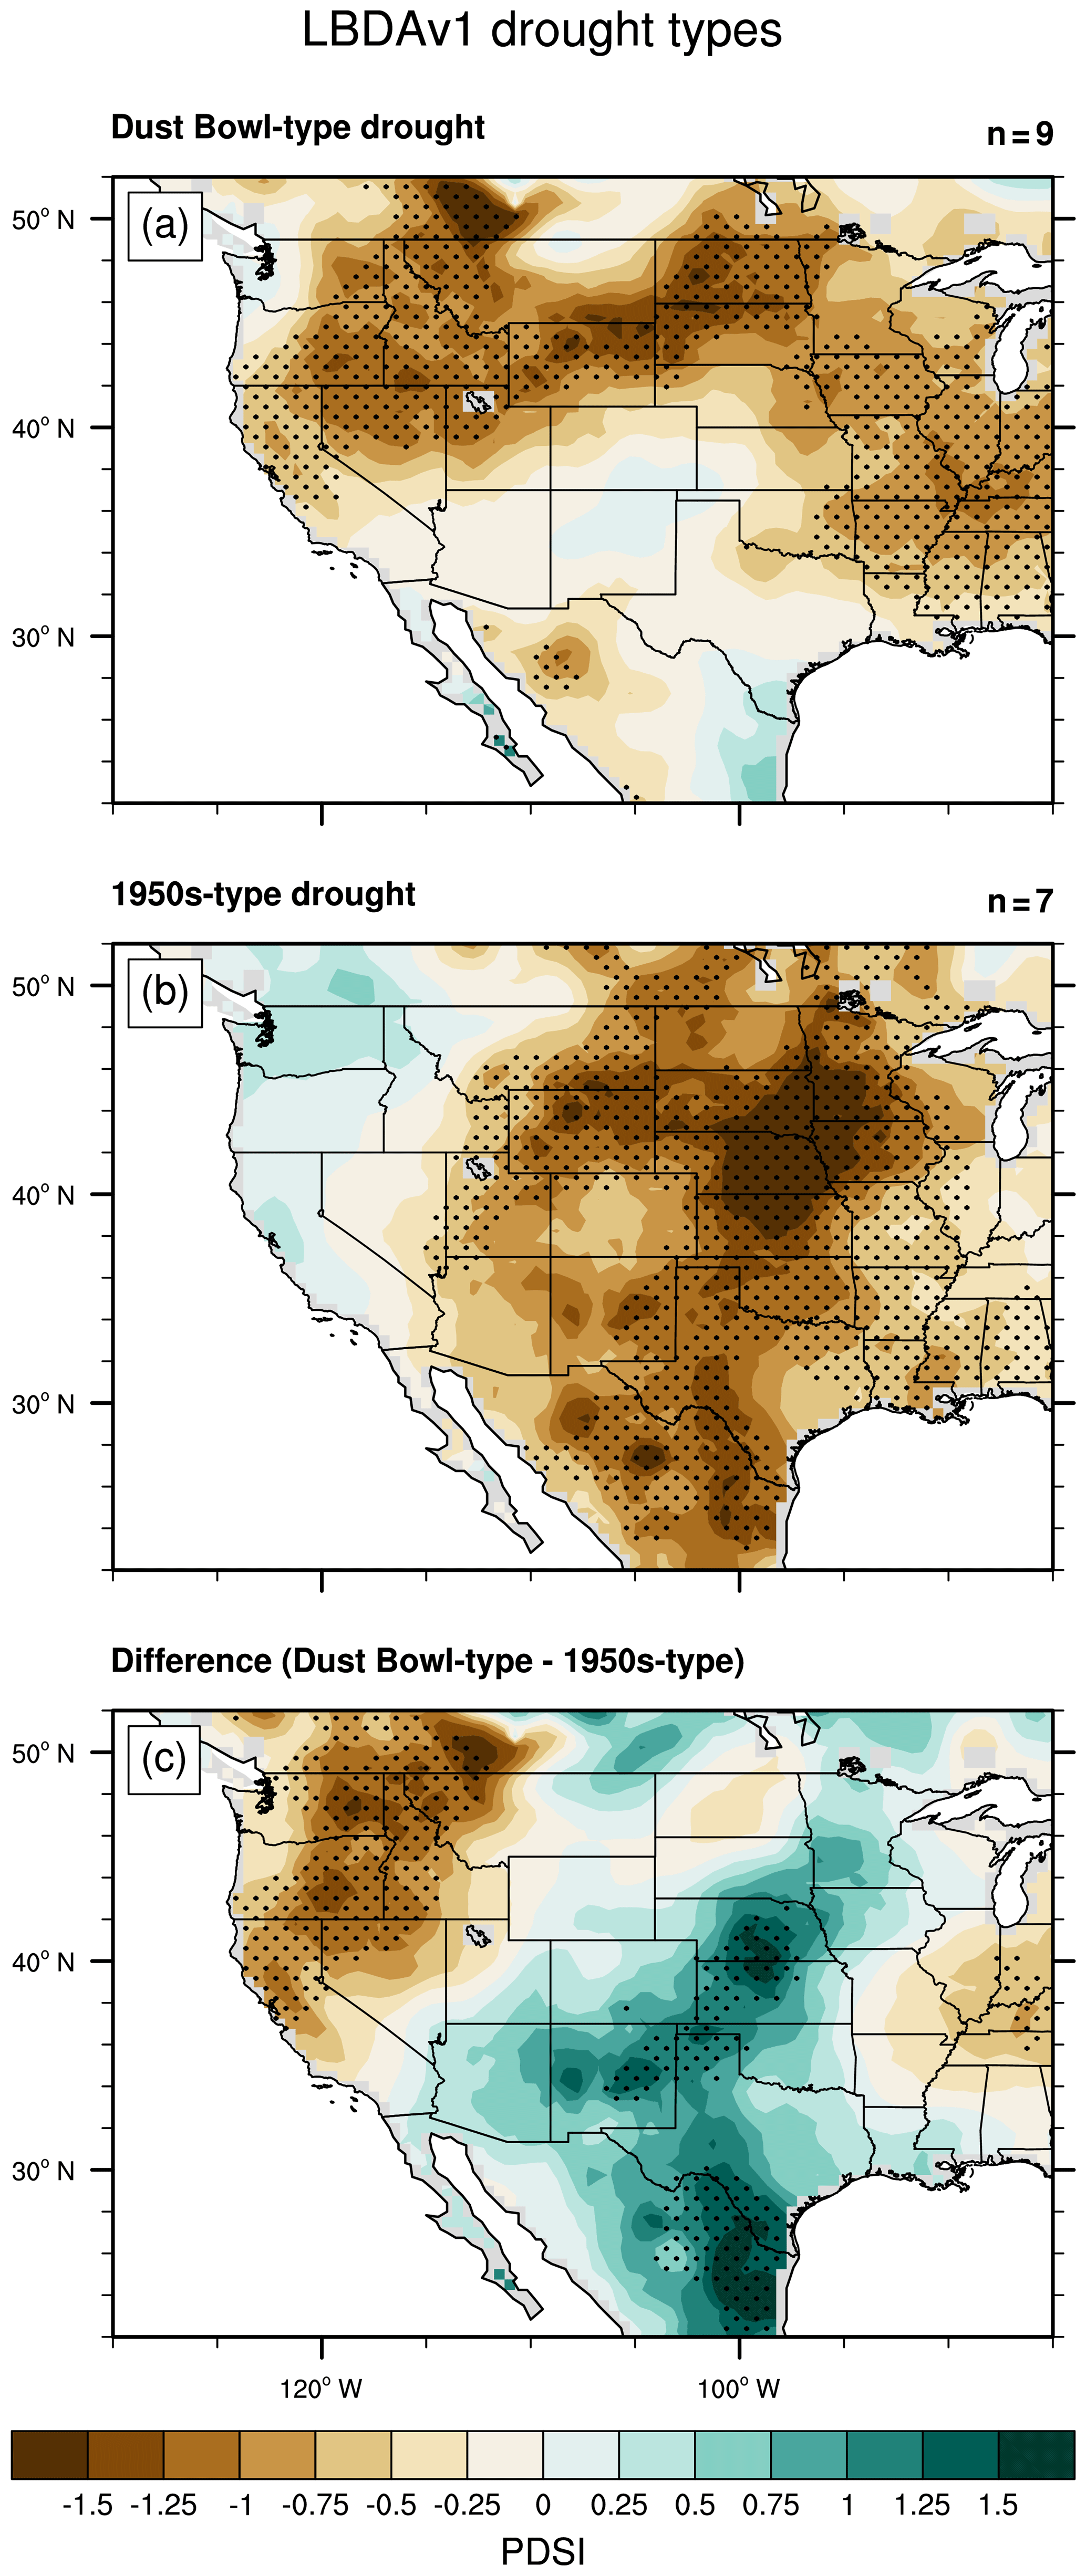
Figure 1Averaged PDSI values from LBDAv1 for Dust Bowl-type droughts (a) and 1950s-type droughts (b) since 1600. The difference between Dust Bowl and 1950s types is shown in (c). Stippling indicates significance at the 95 % level based on a non-parametric Wilcoxon–Mann–Whitney test.
In order to investigate potential differences in atmospheric circulation associated with the different spatial pattern of the two drought types, we performed a composite analysis in EKF400, namely in the 500 hPa GPH, SLP, and T2m anomaly fields.
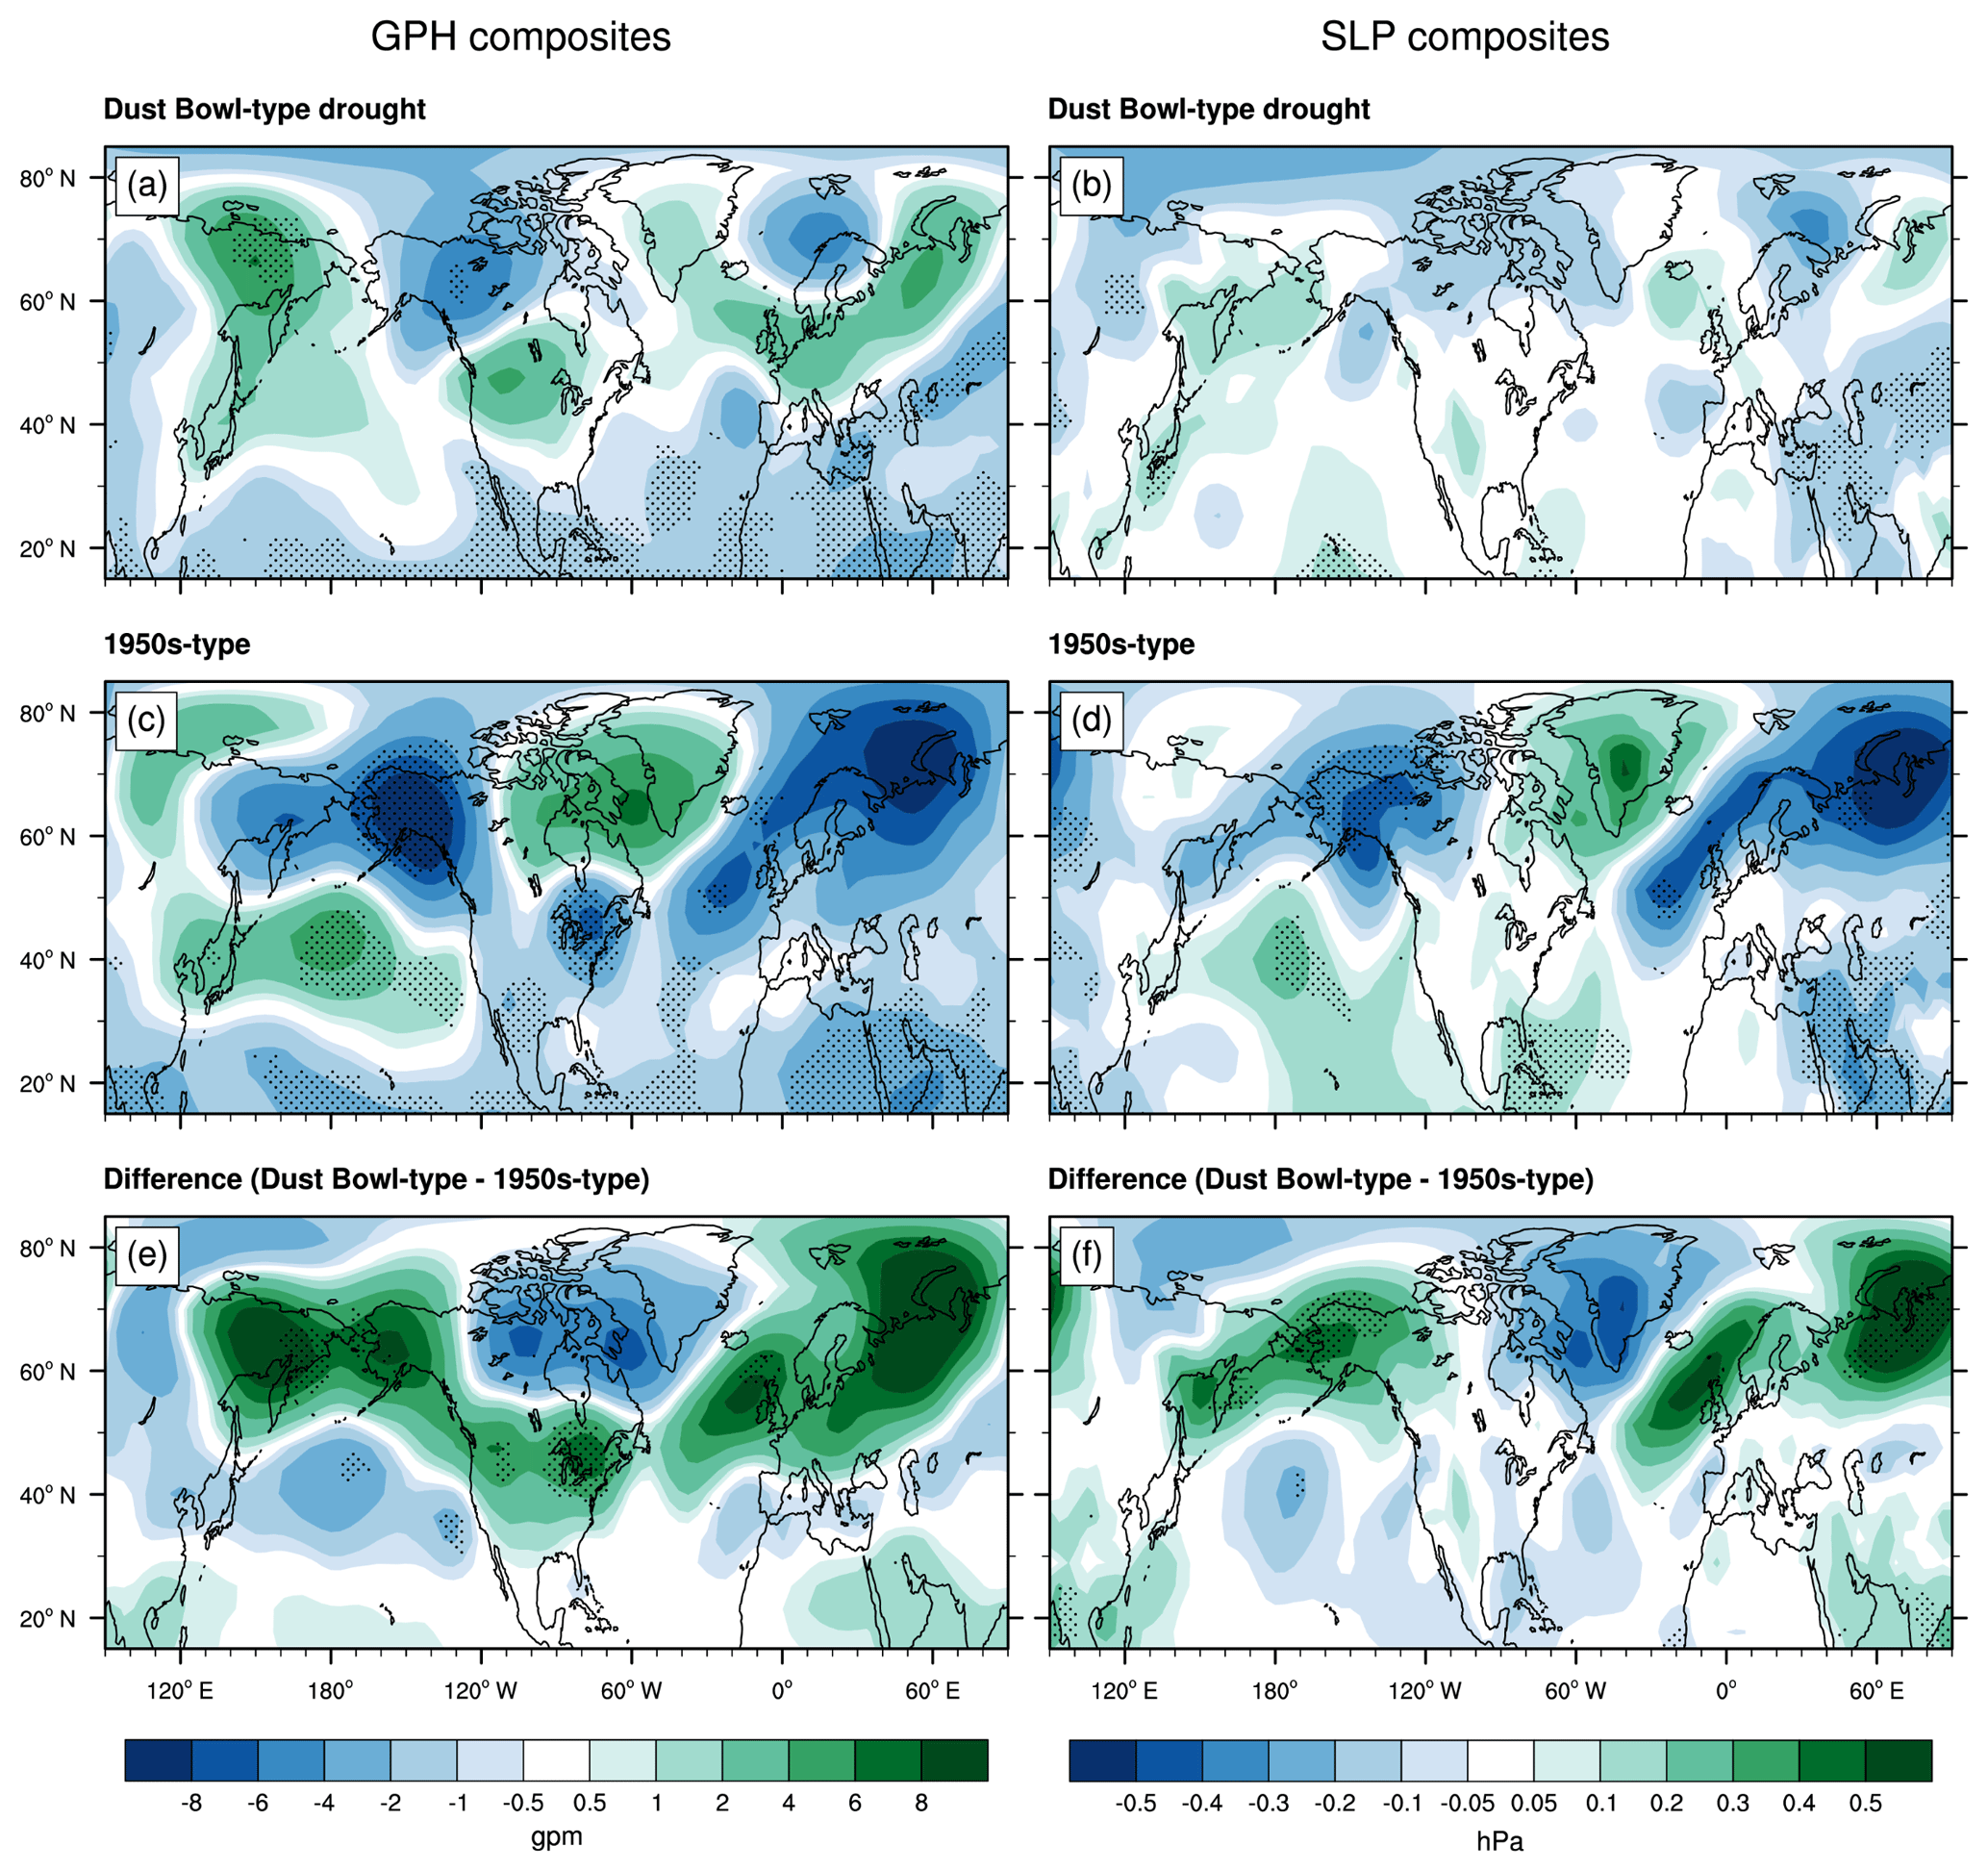
Figure 2Composites of 500 hPa geopotential height anomalies (a, c, e) and sea-level pressure anomalies (b, d, f) from EKF400 for Dust Bowl-type droughts (a, b), 1950s-type droughts (c, d), and their difference (e, f). Stippling indicates significance (p<0.05) based on a non-parametric Wilcoxon–Mann–Whitney test.
The results for boreal summer show that Dust Bowl-type and 1950s-type droughts are markedly different, particularly at 500 hPa GPH (Fig. 2a, c, e). Only the former exhibits a clear “Great Plains ridge” (see Namias, 1982) (a), whereas the 1950s-type drought displays negative anomalies over large parts of North America (c). The difference field shows a band of positive anomalies stretching from Alaska and the Pacific Northwest across the continent and the Atlantic towards northern Europe and Scandinavia (e). Over Alaska, the Northwest, the Great Lakes Region, and the northern North Atlantic, the differences are statistically significant. Moreover, there are significant positive anomalies in the extratropical Pacific.
Both types of droughts have a weaker SLP imprint (Fig. 2b, d, f). The signal resembles the 500 hPa GPH fields, especially north of 50∘ N. Significant differences between the two drought types are located across Alaska and the central northern Pacific.
In order to address the circulation on a global scale, we also analyzed the position of the zonal mean subtropical jet at 200 hPa (maximum of zonal mean zonal wind; see Brönnimann et al., 2015) for the two drought types both in the ensemble mean and the best member (Fig. 3). Dust Bowl-type droughts are associated with an anomalous northward shift of the jet over North America, while during 1950s-type droughts, the jet is shifted slightly further south relative to the preceding and following 5-year periods. According to a heteroscedastic t test, the differences in the jet position between the two drought types are significant (p=0.013) for the ensemble mean (for the best member analysis, p=0.032).
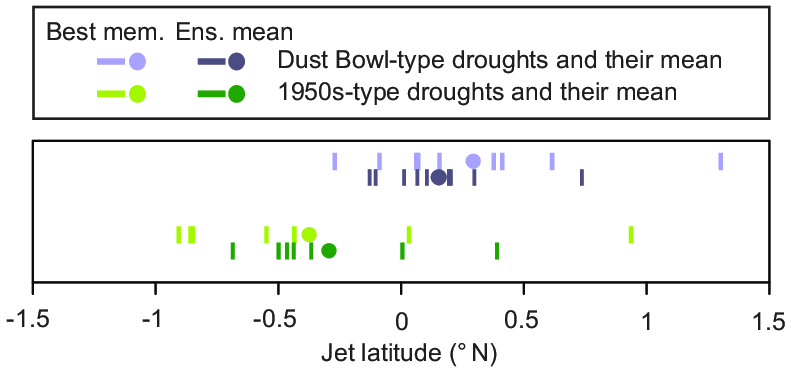
Figure 3Changes in the position of the subtropical jet over North America for Dust Bowl-type droughts (purple) and 1950s-type droughts (green). Anomalies are relative to the preceding and following 5-year period of the drought. Lines indicate individual drought periods, the circles indicates the drought-type means.
Summer droughts in the United States are often associated with precipitation deficits in winter and spring (e.g., Weiss et al., 2009). While we performed our analysis for the preceding winter (December–January–February) and spring (March–April–May) seasons as well, we do not include the results here. This is because, over North America, EKF400 is based on mostly tree-ring proxy data until the mid-19th century. Therefore, outside of the growing season, the reconstruction essentially reflects an atmospheric model simulation.
The composites for T2m reveal that both types of events are clearly accompanied by a negative PDO/La Niña signature in the Pacific (Fig. 4), where cool surface temperatures along the western coast of North America in a horseshoe shaped pattern surround a core of warmer surface waters in the central North Pacific. However, larger differences appear over the contiguous USA as well as over the Atlantic. Dust Bowl-type droughts are 0.1–0.5 ∘C warmer over the USA and southern Canada than 1950s-type droughts (relative to their corresponding references), with largest differences in the Great Lakes region and the Pacific Northwest. Over central and northern Canada, on the other hand, 1950s-type droughts are markedly warmer (0.1–0.4 ∘C) compared to Dust Bowl-type droughts. The temperature differences between the two drought events are not significant over the Pacific though the negative PDO is less pronounced for Dust Bowl cases. In contrast, the signal over the Atlantic differs between the two drought types. Dust Bowl-type droughts exhibit positive anomalies in the extratropical North Atlantic (the region of the North Atlantic current) and significantly warmer temperatures in the Barents Sea. Note that the 5 years preceding and following the drought periods were used as a reference. In the presence of slowly varying SSTs, this means that part of the signature of low-frequency modes such as the Atlantic Multidecadal Oscillation (AMO) might be missing (see Sect. 4).
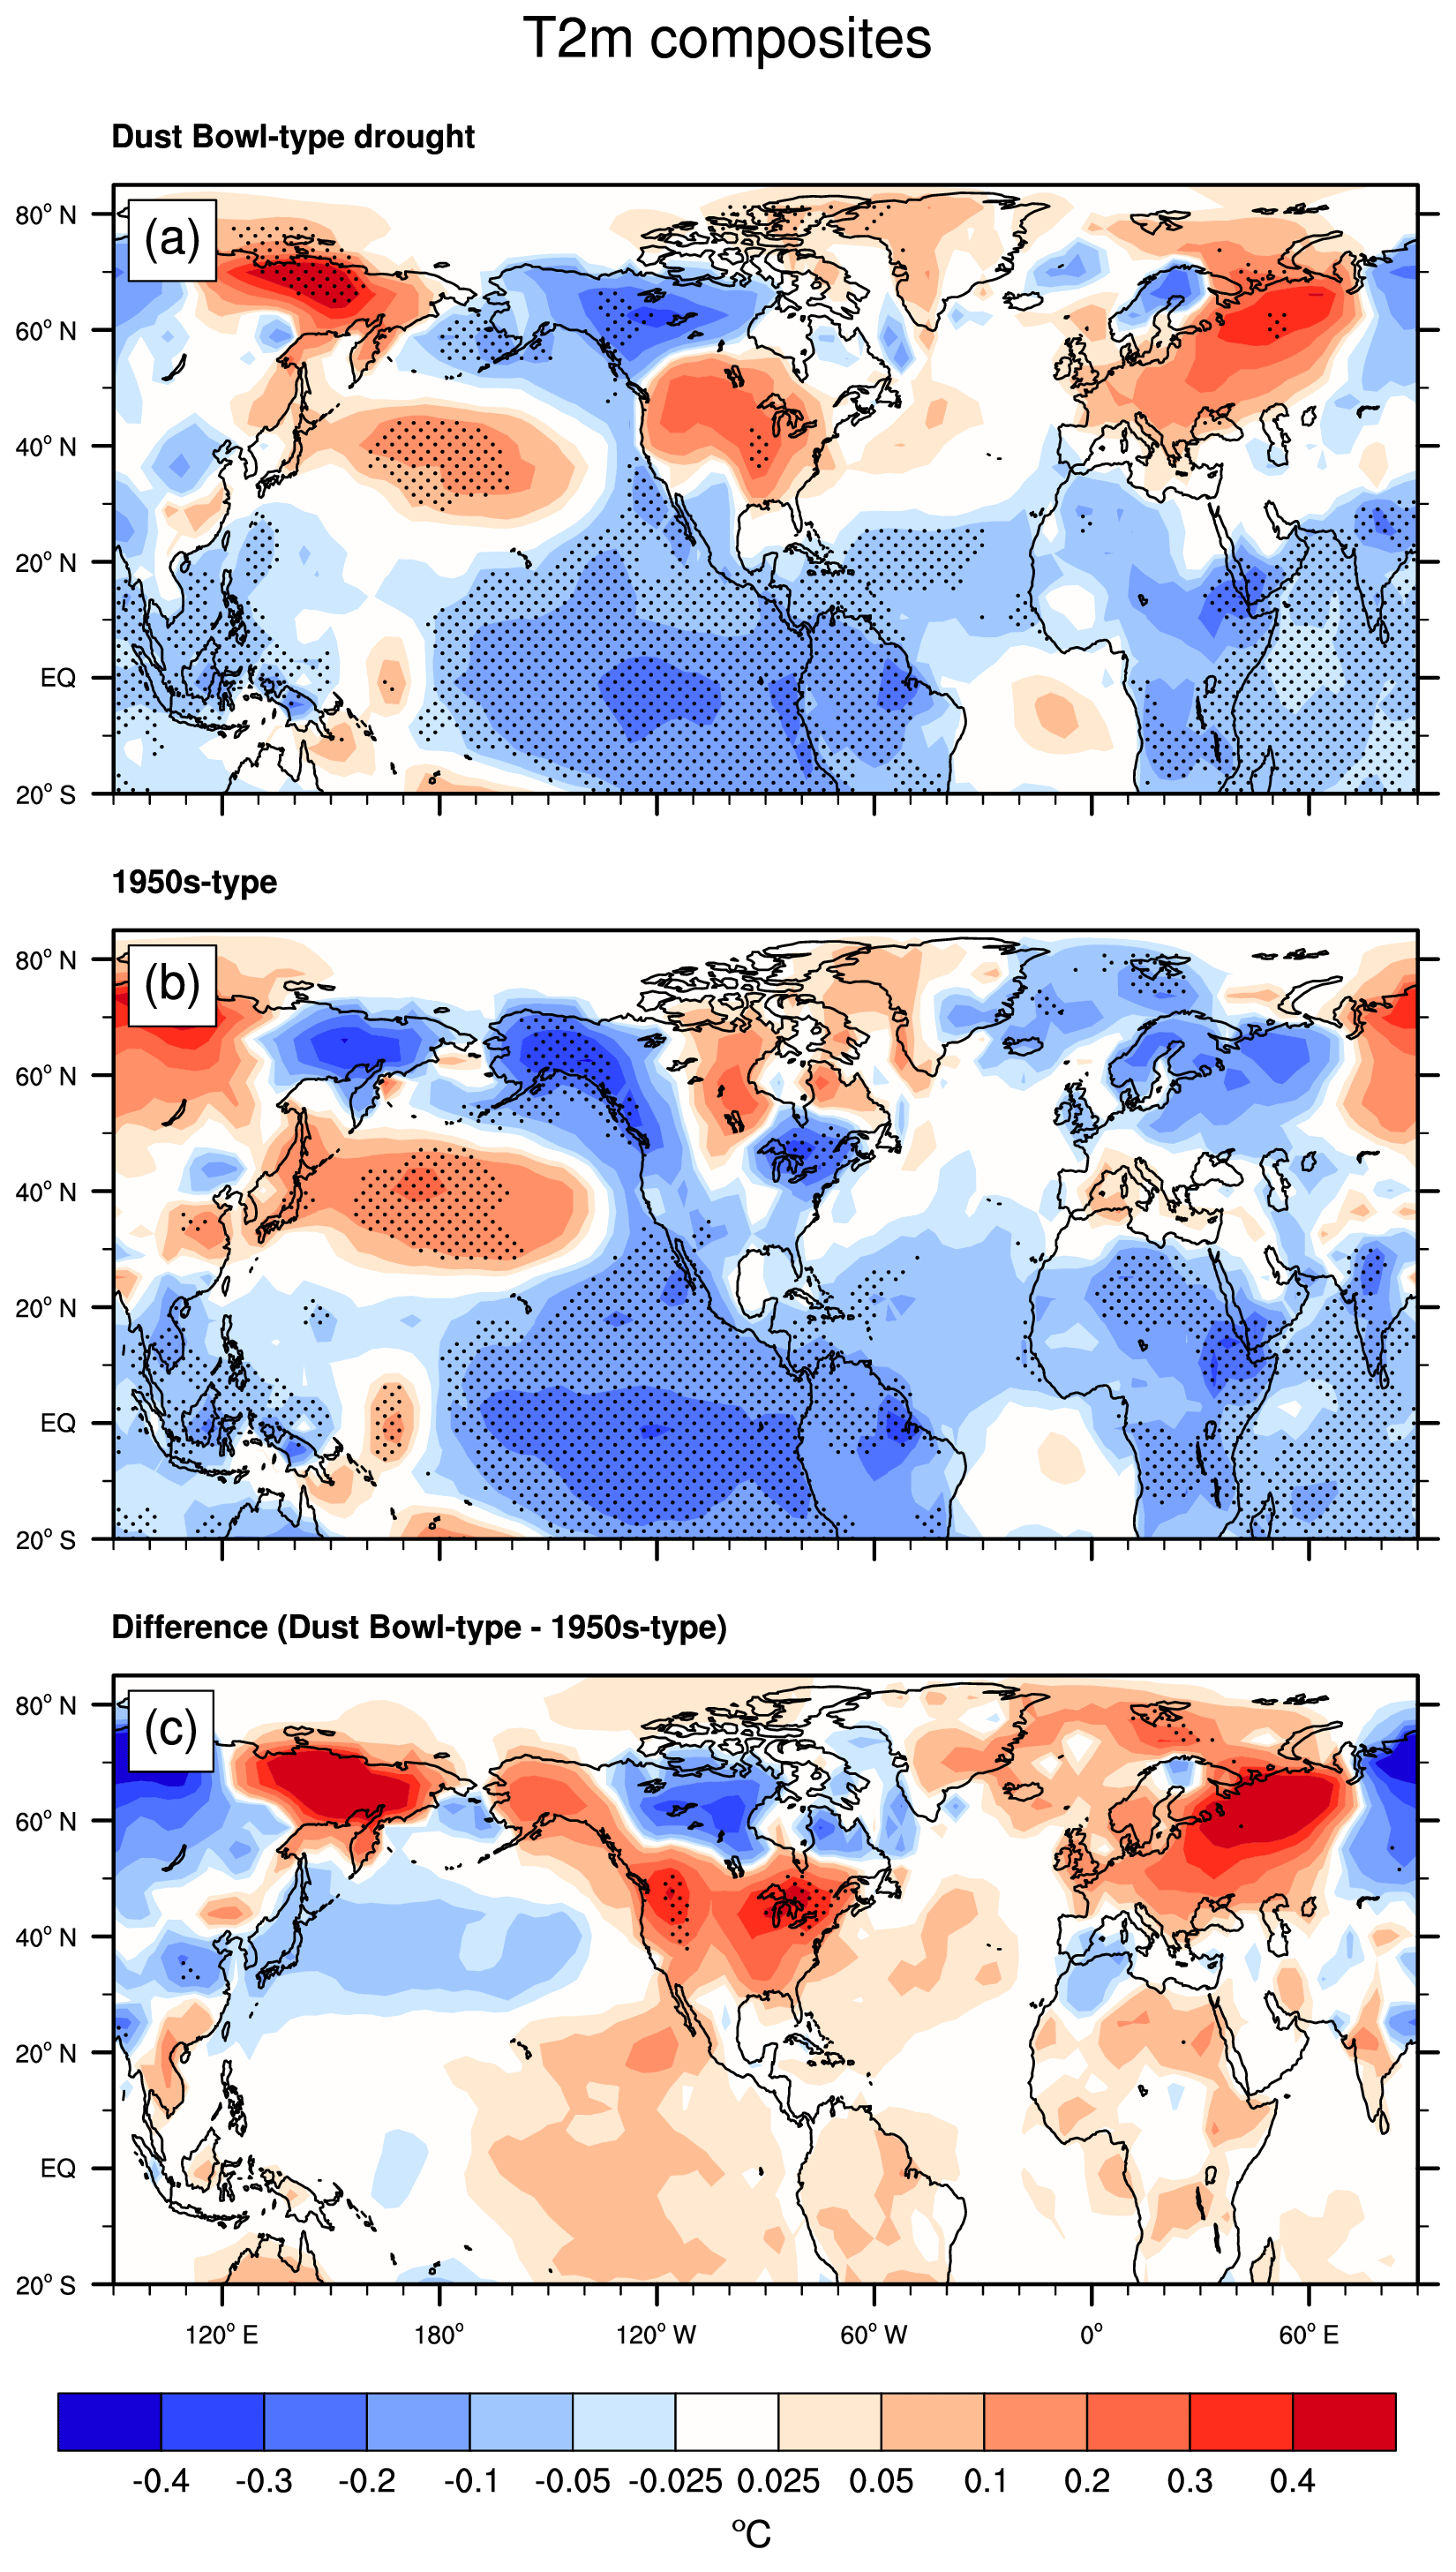
Figure 4Composites of 2 m temperature from EKF400 for Dust Bowl-type droughts (a), 1950s-type droughts (b), and their difference (c). Stippling indicates significance (p<0.05) based on a non-parametric Wilcoxon–Mann–Whitney test.
The latest multi-annual drought we include in the composite analyses is the 1950s drought. As mentioned before, the 21st century drought from 2000–2015 classified based on the LBDAv2 was excluded from previous analyses since its pattern correlated negatively with the two drought types.
Figure 5a shows the spatial pattern (PMDI) of the 21st century drought. The drought pattern is characterized by a pronounced dipole consisting of drought conditions in the West, especially the southwestern United States and wet conditions over the Midwest.

Figure 5The 21st century drought (2000–2015) in the PMDI of the LBDAv2 (a), composites relative to the preceding 5-year period and the following 3-year period (only 2016–2018 available) of 2 m temperature (T2m) (b), 500 hPa geopotential height (GPH) (c), and sea-level pressure (SLP) (d) from the ERA-Interim reanalysis.
Composite fields of 500 hPa GPH (Fig. 5c) and SLP (Fig. 5d) of the 21st century drought exhibits strong positive anomalies in high latitudes and over Greenland and in contrast, strong negative anomalies over the northeastern Atlantic. These large-scale composite patterns differ strongly from the composites of the Dust Bowl-type and 1950s-type drought; nevertheless the dipole Greenland–northeastern Atlantic resembles the 1950s-type drought. The T2m composite (Fig. 5b) shows a negative PDO/La Niña signature in the Pacific but also a warm equatorial Pacific, i.e., an El Niño signature. In the far north, more precisely over Greenland and the Arctic Archipelago, the turn-of-the-century drought is characterized by a strong warming signal (0.2–1.5 ∘C). While the GPH and SLP fields, if anything, resemble the 1950s-type drought, the surface temperature field with above normal temperatures in the western USA corresponds with the Dust Bowl-type.
Droughts in the USA have been shown to be closely linked to SST anomalies (e.g., Hoerling, 2003; McCabe et al., 2004; Schubert et al., 2004b, a; Seager, 2007). Both types of drought exhibit generally negative SST anomalies over the tropical Pacific similar to a negative PDO/La Niña mode. This is consistent with the above-mentioned studies. However, not all La Niña-type (or negative PDO) events lead to drought; the pronounced 1972–1975 event did not, for instance (e.g., Seager and Hoerling, 2014). Pu et al. (2016) argue that the drought development in La Niña years requires anomalous warming over the tropical North Atlantic in spring. Nigam et al. (2011) find that a positive phase of the AMO favors droughts in North America. In fact, their GPH pattern for positive AMO phases in summer is very similar to the anomalies found for the Dust Bowl drought (Brönnimann et al., 2012). There appear to be differences in Atlantic temperatures between the two drought types (Fig. 4), which could be related to modes of Atlantic multi-decadal variability such as the AMO or the North Atlantic Oscillation (NAO)-coupled variability of the gyre circulation as discussed in the literature (i.e., warming in the Gulf Stream and the Greenland, Iceland, and Norwegian seas, but cooling in between; Curry and McCartney, 2001; Eden and Jung, 2001; Sun et al., 2015; Wills et al., 2019).
Differences between the two drought types appear most significantly in the 500 hPa GPH composites. The pattern for 1950s-type droughts exhibits a clear wave pattern, which however does not project well onto the PNA pattern, which is usually defined for winter only. The pattern for Dust Bowl-type droughts is more zonally symmetric and the wave imprint is weaker. At the same time, a poleward shift of the subtropical jet is found. Upper-air observations and reconstructions for the Dust Bowl drought indicate a poleward-shifted jet over North America (Brönnimann et al., 2009) and the development of a Great Plains ridge (Namias, 1982). The composite of the Dust Bowl-type droughts corresponds well with these findings.
The wave pattern at 500 hPa GPH over the North Pacific for 1950s-type droughts might be an indication that the relation to Pacific SSTs is stronger. Both types of drought are related to a negative PNA index in the preceding winter and spring period (not shown). There has been some debate as to what extent SST variability modes such as ENSO modify the mode itself or merely excite a “fixed” pattern (Straus and Shukla, 2002), but a negative PNA index is expected in La Niña winters. Skillful reconstruction of 500 hPa GPH in winter would be necessary to determine whether the difference between the two drought types only emerges in spring and summer or already in the preceding winter. The results of Woodhouse et al. (2009) suggest the latter.
The poleward shift of the jet, in the zonal average, has also been shown to be related to SSTs (Staten et al., 2018). Again, both the Atlantic and Pacific might contribute. In particular, a negative PDO/La Niña-like pattern over the Pacific has been shown to conduce to tropical expansion (Allen et al., 2014). Moreover, Atlantic SSTs were demonstrated to play a role in the form of a positive (negative) AMO for a poleward (equatorward) shift of the zonal mean jet (Brönnimann et al., 2015). It is thus not surprising that Dust Bowl-type droughts, with a warmer extratropical North Atlantic, have a more poleward-shifted jet, although SST differences in the North Atlantic are not significant.
In all, this suggests that the two patterns of North American droughts emerge from slightly different combinations of Atlantic and Pacific influences, which operate via a Pacific wave train and a poleward shift of the jet, respectively. Atmospheric circulation and SSTs over both ocean basins, the Pacific and the extratropical North Atlantic, shape drought development in North America.
Seager (2007) analyzed the turn-of-the-century drought (1998–2004) and argued that it started with strong La Niña conditions (1998/99, which is not yet part of our drought definition due to the 5-year moving average), which subsequently weakened and gave rise to a second phase (after 2002) with even slight El Niño conditions. Seager (2007) noted that the turn-of-the-century might not yet be over. It did indeed persist and was predominantly characterized by La Niña conditions interrupted by weak El Niño phases. It ultimately ended with the strong El Niño of 2015/16.
Our analysis shows that the 21st century drought exhibited a markedly different spatial pattern that can be attributed to neither the Dust Bowl- nor the 1950s drought type. While drought conditions in the last 2 decades have been studied extensively, the focus has been on specific regions and exceptionally severe events like the 2011–2014 California Drought (Griffin and Anchukaitis, 2014; Seager et al., 2014a, 2015). Here we analyze the atmospheric circulation in summer (JJA) from 2000 to 2015 and find a distinct pattern in both the 500 hPa height and SLP fields. Recent drought events often are found to be associated and amplified with anomalously warm temperatures (e.g., Griffin and Anchukaitis, 2014). The surface temperature fields show warmer-than-usual temperatures in the southwestern United States as well as a strong warming signal over the Arctic Archipelago, Greenland, and the northern North Atlantic.
Here, we have demonstrated that both the spatial pattern and atmospheric circulation of the 21st century drought differ considerably compared to 16 multi-annual drought periods in the past 5 centuries. This highlights the likelihood of global warming contributing to the complex drought dynamics, not only amplifying drought duration and severity (Seager and Vecchi, 2010; Woodhouse et al., 2010; Cook et al., 2015, 2018a) but possibly changing the character of droughts in the future.
The new global three-dimensional climate reconstruction EKF400 allows for the first time to study atmospheric circulation during a sufficiently large number of prolonged dry spells in a climate reconstruction. We find two distinct drought types over North America that differ with respect to atmospheric circulation and SSTs. While the 1950s-type droughts exhibit a wave-train pattern over the Pacific–North American sector, the Dust Bowl-type droughts show the imprint of a poleward-shifted jet and a Great Plains ridge. SSTs exhibit a negative PDO/La Niña-like pattern in the Pacific for both types, but slightly stronger for 1950s-type droughts, whereas the Dust Bowl-type droughts show a stronger warming of the Atlantic. Differences in SSTs (which are not significant) and differences in atmospheric circulation (which are significant) are consistent with each other and with the literature.
Results suggest that atmospheric circulation and SST characteristics over both the Pacific and the extratropical North Atlantic affect the spatial pattern of North American droughts, leading to two main drought types. Given the possible increase of droughts in a future climate, deepening our understanding of drought mechanisms in North America is important. Further refined reconstruction of past hydroclimate could help.
Clustering was performed with the following R packages: hclust{stats} and kmeans{stats}.
The R code for the subtropical jet position has been published as a supplement to Brönnimann et al. (2015).
The data sets used in this study are listed below.
-
EKF400 (Franke et al., 2017b)
-
ERA-Interim (Dee et al., 2011)
-
LBDAv1, LBDAv2 (Cook et al., 2010)
-
PHYDA (Steiger, 2018; Steiger et al., 2018)
-
20CRv2c (Compo et al., 2011)
-
Berkeley Earth (Rohde et al., 2013a, b)
-
HadCRUT4.6 (Morice et al., 2012)
The supplement related to this article is available online at: https://doi.org/10.5194/cp-15-2053-2019-supplement.
SB had the initial idea for this paper. AMB performed most of the analysis and figure designs with contribution of SB. JF provided the reanalysis data and assisted with interpreting the results. AMB and SB drafted the manuscript in consultation with JF. All authors provided critical feedback and helped shape the manuscript.
The authors declare that they have no conflict of interest.
This research was supported by funding from the European Research Council (ERC) under the European Union's Horizon 2020 research and innovation program as well as the Swiss National Science Foundation. We furthermore thank our editor and reviewers for their valuable feedback that helped to improve our paper.
This research has been supported by the European Commission, H2020 Research Infrastructures (PALAEO-RA – A Palaeoreanalysis To Understand Decadal Climate Variability (787574)) and the Swiss National Science Foundation RE-USE (project no. 162668).
This paper was edited by Alberto Reyes and reviewed by Robert Jnglin Wills and one anonymous referee.
Allen, R. J., Norris, J. R., and Kovilakam, M.: Influence of anthropogenic aerosols and the Pacific Decadal Oscillation on tropical belt width, Nat. Geosci., 7, 270–274, https://doi.org/10.1038/ngeo2091, 2014.
Ault, T. R., Mankin, J. S., Cook, B. I., and Smerdon, J. E.: Relative impacts of mitigation, temperature, and precipitation on 21st-century megadrought risk in the American Southwest, Science Advances, 2, e1600873, https://doi.org/10.1126/sciadv.1600873, 2016.
Baek, S. H., Smerdon, J. E., Seager, R., Williams, A. P., and Cook, B. I.: Pacific Ocean Forcing and Atmospheric Variability Are the Dominant Causes of Spatially Widespread Droughts in the Contiguous United States, J. Geophys. Res.-Atmos., 124, 2507–2524, https://doi.org/10.1029/2018JD029219, 2019.
Bhend, J., Franke, J., Folini, D., Wild, M., and Brönnimann, S.: An ensemble-based approach to climate reconstructions, Clim. Past, 8, 963–976, https://doi.org/10.5194/cp-8-963-2012, 2012.
Booth, B. B. B., Dunstone, N. J., Halloran, P. R., Andrews, T., and Bellouin, N.: Aerosols implicated as a prime driver of twentieth-century North Atlantic climate variability, Nature, 484, 228–232, https://doi.org/10.1038/nature10946, 2012.
Breitenmoser, P., Brönnimann, S., and Frank, D.: Forward modelling of tree-ring width and comparison with a global network of tree-ring chronologies, Clim. Past, 10, 437–449, https://doi.org/10.5194/cp-10-437-2014, 2014.
Brönnimann, S.: Climatic Changes Since 1700, Springer International Publishing, Cham, 2015.
Brönnimann, S., Stickler, A., Griesser, T., Ewen, T., Grant, A. N., Fischer, A. M., Schraner, M., Peter, T., Rozanov, E., and Ross, T.: Exceptional atmospheric circulation during the “Dust Bowl”, Geophys. Res. Lett., 36, L08802, https://doi.org/10.1029/2009GL037612, 2009.
Brönnimann, S., Griesser, T., and Stickler, A.: A gridded monthly upper-air data set from 1918 to 1957, Clim. Dynam, 38, 475–493, https://doi.org/10.1007/s00382-010-0940-x, 2012.
Brönnimann, S., Fischer, A. M., Rozanov, E., Poli, P., Compo, G. P., and Sardeshmukh, P. D.: Southward shift of the northern tropical belt from 1945 to 1980, Nat. Geosci., 8, 969–974, https://doi.org/10.1038/ngeo2568, 2015.
Cayan, D. R., Das, T., Pierce, D. W., Barnett, T. P., Tyree, M., and Gershunov, A.: Future dryness in the southwest US and the hydrology of the early 21st century drought, P. Natl. Acad. Sci., 107, 21271–21276, https://doi.org/10.1073/pnas.0912391107, 2010.
Compo, G. P., Whitaker, J. S., Sardeshmukh, P. D., Matsui, N., Allan, R. J., Yin, X., Gleason, B. E., Vose, R. S., Rutledge, G., Bessemoulin, P., Brönnimann, S., Brunet, M., Crouthamel, R. I., Grant, A. N., Groisman, P. Y., Jones, P. D., Kruk, M. C., Kruger, A. C., Marshall, G. J., Maugeri, M., Mok, H. Y., Nordli, Ø., Ross, T. F., Trigo, R. M., Wang, X. L., Woodruff, S. D., and Worley, S. J.: The Twentieth Century Reanalysis Project, Q. J. Roy. Meteor. Soc., 137, 1–28, https://doi.org/10.1002/qj.776, 2011.
Cook, B. I., Miller, R. L., and Seager, R.: Dust and sea surface temperature forcing of the 1930s “Dust Bowl” drought, Geophys. Res. Lett., 35, L08710, https://doi.org/10.1029/2008GL033486, 2008.
Cook, B. I., Miller, R. L., and Seager, R.: Amplification of the North American “Dust Bowl” drought through human-induced land degradation, P. Natl. Acad. Sci., 106, 4997–5001, https://doi.org/10.1073/pnas.0810200106, 2009.
Cook, B. I., Seager, R., Miller, R. L., and Mason, J. A.: Intensification of North American Megadroughts through Surface and Dust Aerosol Forcing, J. Climate, 26, 4414–4430, https://doi.org/10.1175/JCLI-D-12-00022.1, 2013.
Cook, B. I., Smerdon, J. E., Seager, R., and Coats, S.: Global warming and 21stcentury drying, Clim. Dynam., 43, 2607–2627, https://doi.org/10.1007/s00382-014-2075-y, 2014a.
Cook, B. I., Seager, R., and Smerdon, J. E.: The worst North American drought year of the last millennium: 1934, Geophys. Res. Lett., 41, 7298–7305, https://doi.org/10.1002/2014GL061661, 2014b.
Cook, B. I., Ault, T. R., and Smerdon, J. E.: Unprecedented 21st century drought risk in the American Southwest and Central Plains, Science Advances, 1, e1400082, https://doi.org/10.1126/sciadv.1400082, 2015.
Cook, B. I., Cook, E. R., Smerdon, J. E., Seager, R., Williams, A. P., Coats, S., Stahle, D. W., and Díaz, J. V.: North American megadroughts in the Common Era: Reconstructions and simulations, WIREs Clim Change, 7, 411–432, https://doi.org/10.1002/wcc.394, 2016.
Cook, B. I., Mankin, J. S., and Anchukaitis, K. J.: Climate Change and Drought: From Past to Future, Current Climate Change Reports, 4, 164–179, https://doi.org/10.1007/s40641-018-0093-2, 2018a.
Cook, B. I., Park Williams, A., Mankin, J. S., Seager, R., Smerdon, J. E., and Singh, D.: Revisiting the leading drivers of Pacific coastal drought variability in the contiguous United States, J. Climate, 31, 25–43, https://doi.org/10.1175/JCLI-D-17-0172.1, 2018b.
Cook, E. R., Meko, D. M., Stahle, D. W., and Cleaveland, M. K.: Tree-ring reconstructions of past drought across the conterminous United States: tests of a regression method and calibration/verification results, in: Proceedings of the International Conference, Radiocarbon, edited by: Dean, J. S., Meko, D. M., and Swetnam, T. W., University of Arizona, Tuscon, 155–169, 1996.
Cook, E. R., Meko, D. M., Stahle, D. W., and Cleaveland, M. K.: Drought reconstructions for the continental United States, J. Climate, 12, 1145–1163, https://doi.org/10.1175/1520-0442(1999)012<1145:DRFTCU>2.0.CO;2, 1999.
Cook, E. R., Woodhouse, C. A., Eakin, C. M., Meko, D. M., and Stahle, D. W.: Long-Term Aridity Changes in the Western United States, Science, 306, 1015–1018, https://doi.org/10.1126/science.1102586, 2004.
Cook, E. R., Seager, R., Cane, M. A., and Stahle, D. W.: North American drought: Reconstructions, causes, and consequences, Earth-Sci. Rev., 81, 93–134, https://doi.org/10.1016/j.earscirev.2006.12.002, 2007.
Cook, E. R., Seager, R., Heim, R. R., Vose, R. S., Herweijer, C., and Woodhouse, C. A.: Megadroughts in North America: placing IPCC projections of hydroclimatic change in a long-term palaeoclimate context, J. Quaternary Sci., 25, 48–61, https://doi.org/10.1002/jqs.1303, 2010.
Cowan, T., Hegerl, G. C., Colfescu, I., Bollasina, M., Purich, A., and Boschat, G.: Factors contributing to record-breaking heat waves over the great plains during the 1930s Dust Bowl, J. Climate, 30, 2437–2461, https://doi.org/10.1175/JCLI-D-16-0436.1, 2017.
Curry, R. G. and McCartney, M. S.: Ocean Gyre Circulation Changes Associated with the North Atlantic Oscillation, J. Phys. Oceanogr., 31, 3374–3400, https://doi.org/10.1175/1520-0485(2001)031<3374:OGCCAW>2.0.CO;2, 2001.
Dai, A.: Increasing drought under global warming in observations and models, Nat. Clim. Change, 3, 52–58, https://doi.org/10.1038/nclimate1633, 2013.
Dee, D. P., Uppala, S. M., Simmons, A. J., Berrisford, P., Poli, P., Kobayashi, S., Andrae, U., Balmaseda, M. A., Balsamo, G., Bauer, P., Bechtold, P., Beljaars, A. C. M., van de Berg, L., Bidlot, J., Bormann, N., Delsol, C., Dragani, R., Fuentes, M., Geer, A. J., Haimberger, L., Healy, S. B., Hersbach, H., Hólm, E. V., Isaksen, L., Kållberg, P., Köhler, M., Matricardi, M., McNally, A. P., Monge-Sanz, B. M., Morcrette, J.-J., Park, B.-K., Peubey, C., de Rosnay, P., Tavolato, C., Thépaut, J.-N., and Vitart, F.: The ERA-Interim reanalysis: configuration and performance of the data assimilation system, Q. J. Roy. Meteor. Soc., 137, 553–597, https://doi.org/10.1002/qj.828, 2011.
Eden, C. and Jung, T.: North Atlantic Interdecadal Variability: Oceanic Response to the North Atlantic Oscillation (1865–1997), J. Climate, 14, 676–691, https://doi.org/10.1175/1520-0442(2001)014<0676:NAIVOR>2.0.CO;2, 2001.
Enfield, D. B., Mestas-Nuñez, A. M., and Trimble, P. J.: The Atlantic Multidecadal Oscillation and its relation to rainfall and river flows in the continental U.S., Geophys. Res. Lett., 28, 2077–2080, https://doi.org/10.1029/2000GL012745, 2001.
Feng, S., Oglesby, R. J., Rowe, C. M., Loope, D. B., and Hu, Q.: Atlantic and Pacific SST influences of medieval drought in North America simulated by the Community Atmospheric Model, J. Geophys. Res., 113, D11101, https://doi.org/10.1029/2007JD009347, 2008.
Franke, J., Frank, D., Raible, C. C., Esper, J., and Brönnimann, S.: Spectral biases in tree-ring climate proxies, Nat. Clim. Change, 3, 360–364, https://doi.org/10.1038/nclimate1816, 2013.
Franke, J., Brönnimann, S., Bhend, J., and Brugnara, Y.: A monthly global paleo-reanalysis of the atmosphere from 1600 to 2005 for studying past climatic variations, Scientific Data, 4, 170076, https://doi.org/10.1038/sdata.2017.76, 2017a.
Franke, J., Brönnimann, S., Bhend, J., and Brugnara, Y.: Ensemble Kalman Fitting Paleo-Reanalysis Version 1 (EKF400_v1), World Data Center for Climate at Deutsches Klimarechenzentrum, https://doi.org/10.1594/WDCC/EKF400{_}v1, 2017b.
Fye, F. K., Stahle, D. W., and Cook, E. R.: Paleoclimatic analogs to twentieth-century moisture regimes across the United States, B. Am. Meteorol. Soc., 84, 901–909, https://doi.org/10.1175/BAMS-84-7-901, 2003.
Griesser, T., Brönnimann, S., Grant, A., Ewen, T., Stickler, A., and Comeaux, J.: Reconstruction of global monthly upper-level temperature and geopotential height fields back to 1880, J. Climate, 23, 5590–5609, https://doi.org/10.1175/2010JCLI3056.1, 2010.
Griffin, D. and Anchukaitis, K. J.: How unusual is the 2012–2014 California drought?, Geophys. Res. Lett., 41, 9017–9023, https://doi.org/10.1002/2014GL062433, 2014.
Herweijer, C., Seager, R., and Cook, E. R.: North American droughts of the mid to late nineteenth century: A history, simulation and implication for Mediaeval drought, Holocene, 16, 159–171, https://doi.org/10.1191/0959683606hl917rp, 2006.
Hoerling, M., Quan, X. W., and Eischeidi, J.: Distinct causes for two principal U.S. droughts of the 20th century, Geophys. Res. Lett., 36, L19708, https://doi.org/10.1029/2009GL039860, 2009.
Hoerling, M. P.: The Perfect Ocean for Drought, Science, 299, 691–694, https://doi.org/10.1126/science.1079053, 2003.
Hoerling, M. P., Eischeid, J. K., Quan, X. W., Diaz, H. F., Webb, R. S., Dole, R. M., and Easterling, D. R.: Is a transition to semipermanent drought conditions imminent in the U.S. great plains?, J. Climate, 25, 8380–8386, https://doi.org/10.1175/JCLI-D-12-00449.1, 2012.
Hoerling, M. P., Eischeid, J., Kumar, A., Leung, R., Mariotti, A., Mo, K., Schubert, S. D., and Seager, R.: Causes and predictability of the 2012 great plains drought, B. Am. Meteorol. Soc., 95, 269–282, https://doi.org/10.1175/BAMS-D-13-00055.1, 2014.
Kushnir, Y., Seager, R., Ting, M., Naik, N., and Nakamura, J.: Mechanisms of Tropical Atlantic SST Influence on North American Precipitation Variability, J. Climate, 23, 5610–5628, https://doi.org/10.1175/2010JCLI3172.1, 2010.
Livneh, B. and Hoerling, M. P.: The Physics of Drought in the U.S. Central Great Plains, J. Climate, 29, 6783–6804, https://doi.org/10.1175/JCLI-D-15-0697.1, 2016.
Mann, M. E., Woodruff, J. D., Donnelly, J. P., and Zhang, Z.: Atlantic hurricanes and climate over the past 1,500 years, Nature, 460, 880–883, https://doi.org/10.1038/nature08219, 2009.
McCabe, G. J., Palecki, M. A., and Betancourt, J. L.: Pacific and Atlantic Ocean influences on multidecadal drought frequency in the United States, P. Natl. Acad. Sci. USA, 101, 4136–4141, https://doi.org/10.1073/pnas.0306738101, 2004.
Morice, C. P., Kennedy, J. J., Rayner, N. A., and Jones, P. D.: Quantifying uncertainties in global and regional temperature change using an ensemble of observational estimates: The HadCRUT4 data set, J. Geophys. Res., 117, D08101, https://doi.org/10.1029/2011JD017187, 2012.
Namias, J.: Anatomy of Great Plains Protracted Heat Waves (especially the 1980 U.S. summer drought), Mon. Weather Rev., 110, 824–838, https://doi.org/10.1175/1520-0493(1982)110<0824:AOGPPH>2.0.CO;2, 1982.
Nigam, S., Guan, B., and Ruiz-Barradas, A.: Key role of the Atlantic Multidecadal Oscillation in 20th century drought and wet periods over the Great Plains, Geophys. Res. Lett., 38, L16713, https://doi.org/10.1029/2011GL048650, 2011.
Pu, B., Fu, R., Dickinson, R. E., and Fernando, D. N.: Why do summer droughts in the Southern Great Plains occur in some La Niña years but not others?, J. Geophys. Res.-Atmos., 121, 1120–1137, https://doi.org/10.1002/2015JD023508, 2016.
Rohde, R., Muller, R. A., Jacobsen, R., Muller, E., Perlmutter, S., Rosenfeld, A., Wurtele, J., Groom, D. and Wickham, C.: A New Estimate of the Average Earth Surface Land Temperature Spanning 1753 to 2011, Geoinfor. Geostat.: An Overview, 1, 1–7, https://doi.org/10.4172/2327-4581.1000101, 2013a.
Rohde, R., Muller, R., Jacobsen, R., Perlmutter, S., Rosenfeld, A., Wurtele, J., Curry, J., Wickham, C. and Mosher, S.: Berkeley Earth Temperature Averaging Process, Geoinfor. Geostat.: An Overview, 1, 1–13, https://doi.org/10.4172/2327-4581.1000103, 2013b.
Routson, C. C., Woodhouse, C. A., Overpeck, J. T., Betancourt, J. L., and McKay, N. P.: Teleconnected ocean forcing of Western North American droughts and pluvials during the last millennium, Quaternary Sci. Rev., 146, 238–250, https://doi.org/10.1016/j.quascirev.2016.06.017, 2016.
Schubert, S., Gutzler, D., Wang, H., Dai, A., Delworth, T., Deser, C., Findell, K., Fu, R., Higgins, W., Hoerling, M., Kirtman, B., Koster, R., Kumar, A., Legler, D., Lettenmaier, D., Lyon, B., Magana, V., Mo, K., Nigam, S., Pegion, P., Phillips, A., Pulwarty, R., Rind, D., Ruiz-Barradas, A., Schemm, J., Seager, R., Stewart, R., Suarez, M., Syktus, J., Ting, M., Wang, C., Weaver, S., and Zeng, N.: A U.S. CLIVAR Project to Assess and Compare the Responses of Global Climate Models to Drought-Related SST Forcing Patterns: Overview and Results, J. Climate, 22, 5251–5272, https://doi.org/10.1175/2009JCLI3060.1, 2009.
Schubert, S. D., Suarez, M. J., Pegion, P. J., Koster, R. D., and Bacmeister, J. T.: Causes of Long-Term Drought in the U.S. Great Plains, J. Climate, 17, 485–503, https://doi.org/10.1175/1520-0442(2004)017<0485:COLDIT>2.0.CO;2, 2004a.
Schubert, S. D., Suarez, M. J., Pegion, P. J., Koster, R. D., and Bacmeister, J. T.: On the Cause of the 1930s Dust Bowl, Science, 303, 1855–1859, https://doi.org/10.1126/science.1095048, 2004b.
Seager, R.: The Turn of the Century North American Drought: Global Context, Dynamics, and Past Analogs, J. Climate, 20, 5527–5552, https://doi.org/10.1175/2007JCLI1529.1, 2007.
Seager, R. and Hoerling, M. P.: Atmosphere and ocean origins of North American droughts, J. Climate, 27, 4581–4606, https://doi.org/10.1175/JCLI-D-13-00329.1, 2014.
Seager, R. and Vecchi, G. A.: Greenhouse warming and the 21st century hydroclimate of southwestern North America, P. Natl. Acad. Sci. USA, 107, 21277–21282, https://doi.org/10.1073/pnas.0910856107, 2010.
Seager, R., Kushnir, Y., Herweijer, C., Naik, N., and Velez, J.: Modeling of Tropical Forcing of Persistent Droughts and Pluvials over Western North America: 1856–2000, J. Climate, 18, 4065–4088, https://doi.org/10.1175/JCLI3522.1, 2005.
Seager, R., Ting, M., Held, I., Kushnir, Y., Lu, J., Vecchi, G., Huang, H.-P., Harnik, N., Leetmaa, A., Lau, N.-C., Li, C., Velez, J., and Naik, N.: Model Projections of an Imminent Transition to a More Arid Climate in Southwestern North America, Science, 316, 1181–1184, https://doi.org/10.1126/science.1139601, 2007.
Seager, R., Tzanova, A., and Nakamura, J.: Drought in the Southeastern United States: Causes, variability over the last millennium, and the potential for future hydroclimate change, J. Climate, 22, 5021–5045, https://doi.org/10.1175/2009JCLI2683.1, 2009.
Seager, R., Hoerling, M. P., Schubert, S. D., Wang, H., Lyon, B., and Nakamura, J.: Causes and Predictability of the 2011–14, California Drought Assessment Report, NOAA, 2014a.
Seager, R., Goddard, L., Nakamura, J., Henderson, N., and Lee, D. E.: Dynamical Causes of the 2010/11 Texas–Northern Mexico Drought, J. Hydrometeorol., 15, 39–68, https://doi.org/10.1175/JHM-D-13-024.1, 2014b.
Seager, R., Hoerling, M. P., Schubert, S. D., Wang, H., Lyon, B., Kumar, A., Nakamura, J., and Henderson, N.: Causes of the 2011-14 California drought, J. Climate, 28, 6997–7024, https://doi.org/10.1175/JCLI-D-14-00860.1, 2015.
Stahle, D. W., Fye, F. K., Cook, E. R., and Griffin, R. D.: Tree-ring reconstructed megadroughts over North America since A.D. 1300, Clim. Change, 83, 133–149, https://doi.org/10.1007/s10584-006-9171-x, 2007.
Staten, P. W., Lu, J., Grise, K. M., Davis, S. M., and Birner, T.: Re-examining tropical expansion, Nat. Clim. Change, 8, 768–775, https://doi.org/10.1038/s41558-018-0246-2, 2018.
Steiger, N. J.: Paleo Hydrodynamics Data Assimilation product (PHYDA), Zenodo, https://doi.org/10.5281/zenodo.1198817, 2018.
Steiger, N. J., Smerdon, J. E., Cook, E. R., and Cook, B. I.: A reconstruction of global hydroclimate and dynamical variables over the Common Era, Sci. Data, 5, 180086, https://doi.org/10.1038/sdata.2018.86, 2018.
Straus, D. M. and Shukla, J.: Does ENSO Force the PNA?, J. Climate, 15, 2340–2358, https://doi.org/10.1175/1520-0442(2002)015<2340:DEFTP>2.0.CO;2, 2002.
Sun, C., Li, J., and Jin, F.-F.: A delayed oscillator model for the quasi-periodic multidecadal variability of the NAO, Clim. Dynam., 45, 2083–2099, https://doi.org/10.1007/s00382-014-2459-z, 2015.
Wallace, J. M. and Gutzler, D. S.: Teleconnections in the Geopotential Height Field during the Northern Hemisphere Winter, Mon. Weather Rev., 109, 784–812, https://doi.org/10.1175/1520-0493(1981)109<0784:TITGHF>2.0.CO;2, 1981.
Weiss, J. L., Castro, C. L., and Overpeck, J. T.: Distinguishing pronounced droughts in the southwestern united states: Seasonality and effects of warmer temperatures, J. Climate, 22, 5918–5932, https://doi.org/10.1175/2009JCLI2905.1, 2009.
Wills, R. C. J., Armour, K. C., Battisti, D. S., and Hartmann, D. L.: Ocean–Atmosphere Dynamical Coupling Fundamental to the Atlantic Multidecadal Oscillation, J. Climate, 32, 251–272, https://doi.org/10.1175/JCLI-D-18-0269.1, 2019.
Woodhouse, C. A. and Overpeck, J. T.: 2000 Years of Drought Variability in the Central United States, B. Am. Meteorol. Soc., 79, 2693–2714, https://doi.org/10.1175/1520-0477(1998)079<2693:YODVIT>2.0.CO;2, 1998.
Woodhouse, C. A., Russell, J. L., and Cook, E. R.: Two Modes of North American Drought from Instrumental and Paleoclimatic Data, J. Climate, 22, 4336–4347, https://doi.org/10.1175/2009JCLI2705.1, 2009.
Woodhouse, C. A., Meko, D. M., MacDonald, G. M., Stahle, D. W., and Cook, E. R.: A 1,200-year perspective of 21st century drought in southwestern North America, P. Natl. Acad. Sci. USA, 107, 21283–21288, https://doi.org/10.1073/pnas.0911197107, 2010.
Worster, D.: Dust Bowl: The Southern Plains in the 1930s, Oxford University Press, Oxford, 1979.