the Creative Commons Attribution 4.0 License.
the Creative Commons Attribution 4.0 License.
 | 15 Aug 2018
Response of Pinus sylvestris var. mongolica to water change and drought history reconstruction in the past 260 years, northeast China
Liangjun Zhu
Qichao Yao
David J. Cooper
Shijie Han
We present a 260-year annual Palmer drought severity index (PDSI) reconstruction based on a tree-ring width chronology of Scots pine (Pinus sylvestris var. mongolica) from four sample sites in the central Daxing'an Mountains, northeast China. The reconstruction equation explained 38.2 % of the variance of annual PDSI in the calibration period from 1911 to 2010. Our reconstruction confirmed the local historical documents and other nearby hydroclimate reconstructions. Drought in the 1920s–1930s was more severe in the Daxing'an Mountains than in the surrounding areas. A slight moisture increase was identified in the study area, while a warm–dry pattern was found in the west-central Mongolian Plateau (mildly drier) and its transition zones: the west-central Mongolian Plateau (severely drier). Overall, the variation of drought in the Daxing'an Mountains and its relationship with surrounding areas may be affected by the Pacific or Atlantic oscillations (e.g., ENSO, PDO, AMO, NAO and SNAO), which can affect the Asian monsoon, change the local temperature and precipitation, and lead to drought.
- Article
(7466 KB) - Full-text XML
-
Supplement
(739 KB) - BibTeX
- EndNote


Drought as one of the major natural disasters is being more frequently influenced by climate change in the world (Cook et al., 2010; Dai, 2011, 2013; Davi et al., 2006; Li et al., 2016). Severe droughts can threaten agriculture and human social activities, and also have a devastating impact on human lives and the survival of native and domestic plants and animals (Cook et al., 2010; Dong et al., 2013; Shen, 2008; Sun, 2007). Drought is one of the most severe and frequent natural disasters in China, especially in semi-arid and arid regions (Bao et al., 2015; Chen et al., 2015; Cook et al., 2010; Dong et al., 2013; Liang et al., 2006; Shen, 2008; Sun and Liu, 2013; Xu, 1998). For example, the drought in the 1920s affected almost all of northern China, accompanied by severe economic and social losses (Dong et al., 2013; Liang et al., 2006; Shen, 2008; Sun, 2007). Recent studies indicate a trend of increasing drought frequency, persistence and severity due to global warming in many regions of the world (Bao et al., 2015; Cook et al., 2010; Dai, 2011, 2013; Schrier et al., 2013). A rapid and pronounced warming accompanied by a decrease in precipitation has occurred in China, especially in high-latitude and high-altitude regions (Bao et al., 2015; Chen et al., 2015; Cook et al., 2010; Dai, 2013; Sun and Liu, 2013; Zhu et al., 2017), leading to severe and prolonged drought in recent decades, such as from 1999 to 2002 (Bao et al., 2015; Liu et al., 2009; Shen, 2008).
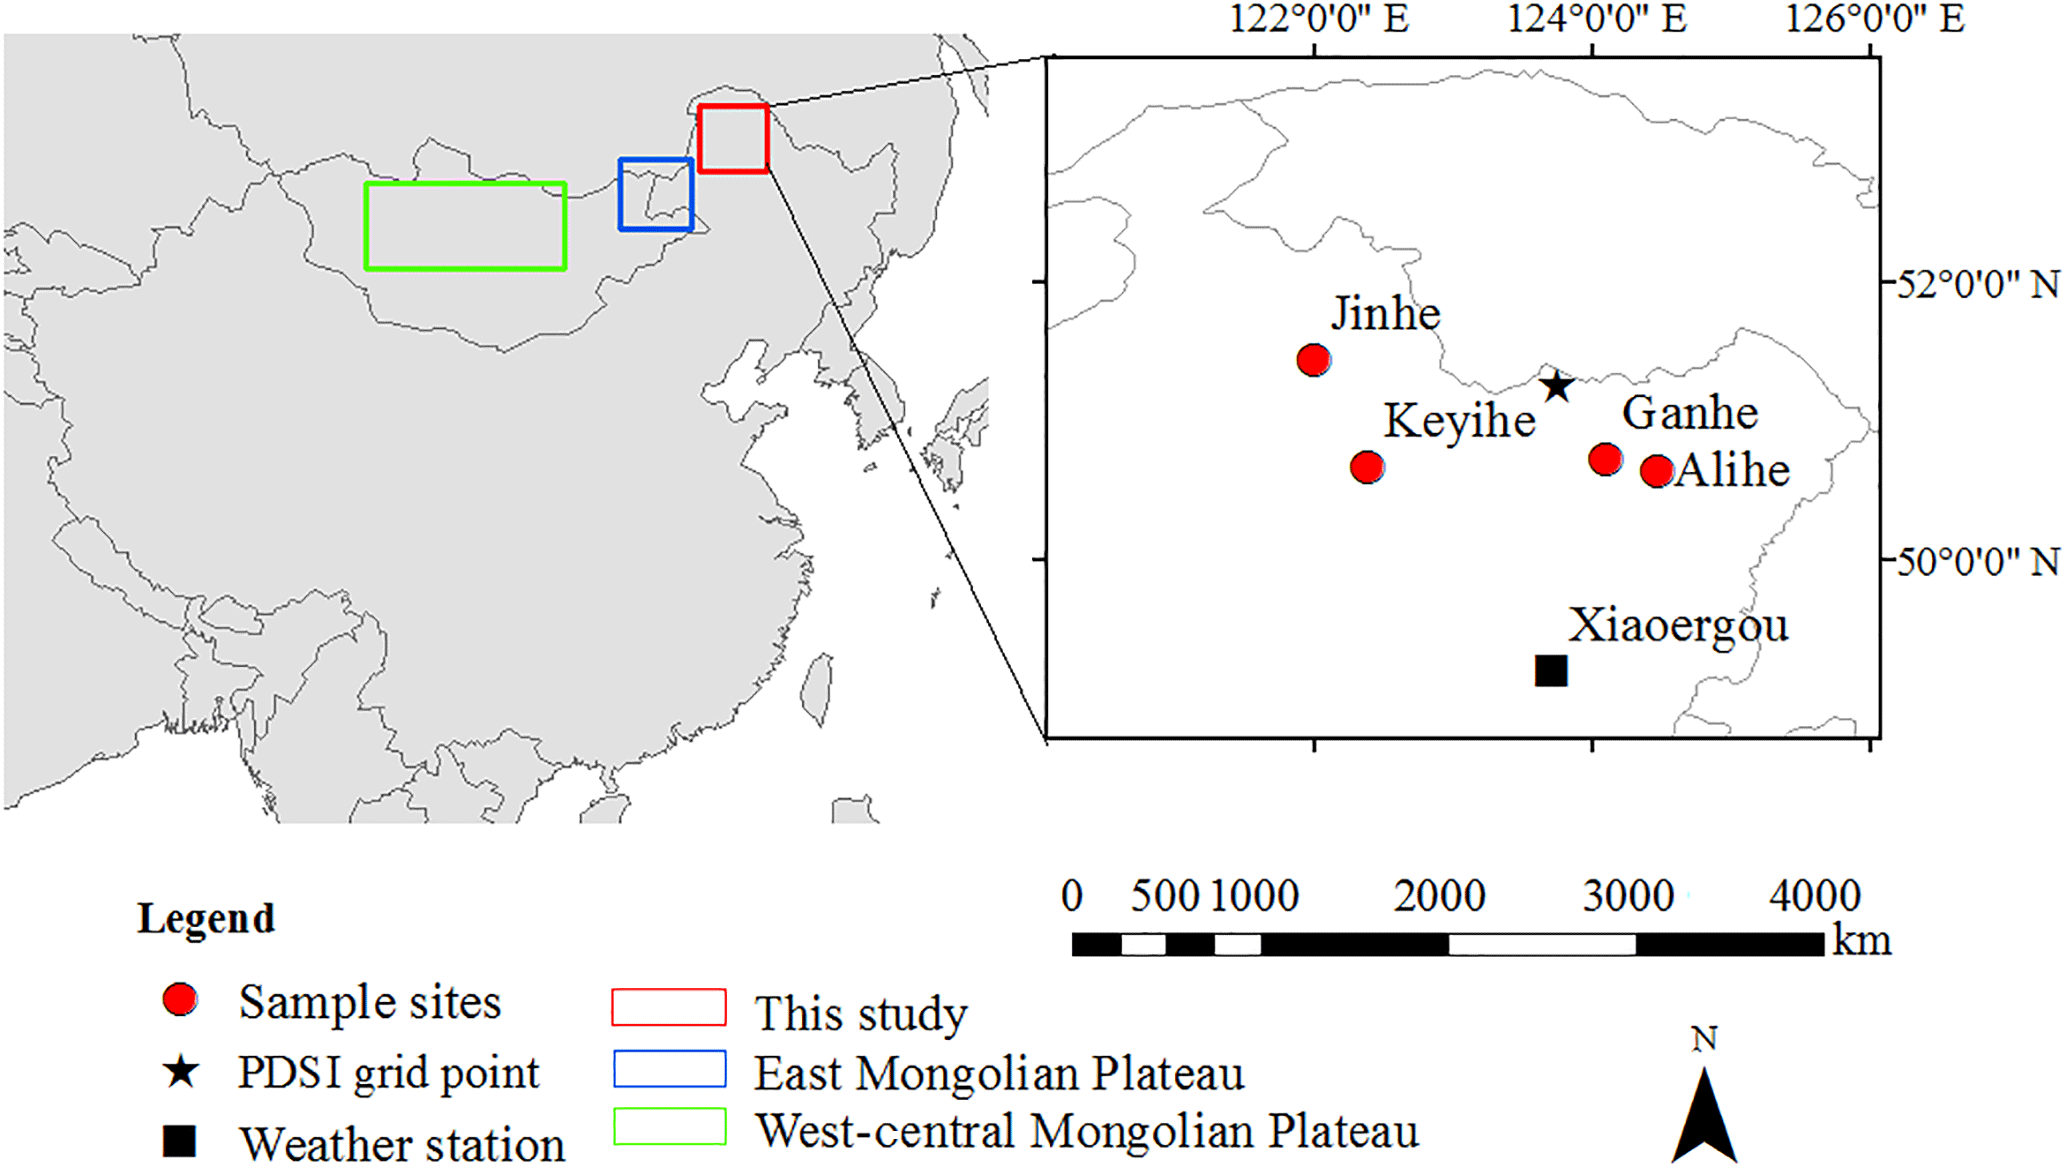
Figure 1Sampling sites and weather station distribution map. The red circles, star and black square are the sampled sites, Palmer drought severity index (PDSI) grid point and the weather station, respectively. The red box represents the northern Daxing'an Mountains (this study). The blue and green boxes represent the east and west-central Mongolian Plateau, respectively.
The Daxing'an Mountains in northeast China are a transition area from semi-humid climate in the east to more arid conditions in the west (Bao et al., 2015; Zhao et al., 2002). The Asian monsoon system directly affects the occurrence, intensity and severity of droughts and floods (Bao et al., 2015; Cook et al., 2010; Liang et al., 2006; Wang et al., 2013, 2005; Zhao et al., 2002) that have devastating effects on human society and economy as well as natural ecosystems (Sun, 2007; Xu, 1998). For example, the drought in 2009 affected 81 million people in northeast China and more than 720 000 ha of farmland suffered from water shortages (http://www.chinadaily.com.cn/cndy/2009-08/13/content_8562996.htm, last access: 20 May 2017). In addition, drought in the Daxing'an Mountains, especially in spring or early summer, often leads to a high risk of forest wildfires and increases the occurrence of large wildfires (Sun, 2007). The fire caused by drought in the northern Daxing'an Mountains in May 1987 killed over 200 people and burned ∼17 000 km2 of land (Sun, 2007; Yao et al., 2017).
To better characterize current drought conditions and project those of the future, an improved understanding of past drought variability and potential forcing mechanisms is necessary. However, the shorter meteorological records in the Daxing'an Mountains that only started in the 1950s limited our understanding of the long-term regime of past droughts. Tree rings can serve as an important high-resolution proxy for long-term drought reconstructions (Cook et al., 2010; Dai, 2011; Pederson et al., 2013), and several hydroclimate reconstructions (Bao et al., 2015; Lv and Wang, 2014; Wang and Lv, 2012) have been conducted in northern China. Cook et al. (2010) also reconstructed the June–July–August Dai Palmer drought severity index (PDSI) in 534 grid points (Monsoon Asia Drought Atlas, MADA) in monsoon-affected Asia using 327 tree-ring width chronologies. However, some disagreement occurs between the MADA and the tree-ring-based local drought reconstructions and instrumental drought data, especially in eastern Asia, which might be an insufficient tree-ring datum in eastern Asia used in MADA (Li et al., 2015; Liu et al., 2017). Additional drought reconstructions in eastern Asia are needed to gain a more thorough understanding of the variability in the Asian monsoon. Many researchers use the PDSI, calculated from a water balance equation, incorporating air temperature and precipitation, to estimate drought periodicity and intensity (Bao et al., 2015; Cook et al., 2010; Dai, 2011; Sun and Liu, 2013). Here, we present a 260-year reconstruction of annual PDSI using tree-ring chronologies from the Daxing'an Mountains to identify the timing of droughts and their correlation with eastern Mongolian Plateau climate as well as their potential forcing mechanisms.
Table 1Site description and statistical characteristic of the Pinus sylvestris var. mongolica dendrochronologies in the Daxing'an Mountains.
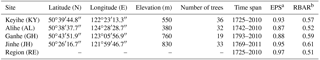
a Expressed population signal statistic. b RBAR is the mean correlation coefficient between all tree-ring series used in a chronology.
2.1 Study area
The Daxing'an Mountains, in northeast Inner Mongolia and the northwest Heilongjiang Province, form an important natural geographic divide between the Pacific Ocean and the northwestern semi-arid inland area (Fig. 1). It is known to be a transition zone from the semi-humid to semi-arid region or from monsoon to non-monsoon climates (Zhao et al., 2002). The summer monsoons from the southeast are blocked by the mountains and cannot penetrate further to the northwest. The western region is more arid, and the eastern region is wetter. Summer weather is clarified by periodic incursions of warm, humid air masses from low-latitude oceans, while dry and cold air in winter air masses invade from high latitudes.

Figure 2Monthly total precipitation (P) and mean temperature (T) at the Xiaoergou meteorological station (1957–2014) (a) and grid data (1901–2014) (b); the annual total precipitation (c), the annual mean temperature (d) and PDSI (e). The dashed line indicates the linear fitting values.
This study was conducted in high-latitude forests in the Daxing'an Mountains, northeast China. The forests are dominated by Dahurian larch (Larix gmelinii Rupr.) and Scots pine (Pinus sylvestris L. var. mongolica Litv.). Soils are predominantly brown coniferous and dark-brown forest peat (Xu, 1998). Meteorological data were collected from stations nearest our sample sites (Xiaoergou station; Table S1 in the Supplement). The annual mean temperature ranges from −2.6 to 2.0 ∘C. The coldest and hottest months are January (−39.5 ∘C) and July (32.8 ∘C), respectively. Annual precipitation ranges from 289 to 1000 mm (average 500 mm) with high interannual variations. Rain from June to August accounts for 68 % of total annual precipitation (Fig. 2). The relative humidity is low except for the growing season. Severe drought occurs frequently, especially in spring and early summer, and leads to high fire risk. This region has the highest average annual burned area in China (Sun, 2007).
2.2 Tree-ring data
Tree-ring cores were sampled from four Scots pine-dominated sites that are rarely disturbed in the central Daxing'an Mountains in May 2011 and 2012. Each sampled tree was selected to avoid the influence of identifiable stand disturbances (including animal and human disturbance, windstorm, snow and fire damage) and any obvious abnormal growth. The distance between sample sites is more than 100 km (Fig. 1). A total of 120 cores were obtained from living old trees at breast height (approximately 1.3 m) (Table 1) using a 5.15 mm diameter increment borer (500 mm length, two screws, Haglöf Sweden, Längsele, Sweden). All cores were dried, mounted, surfaced and cross-dated following standard techniques of dendrochronology (Cook and Kairiukstis, 1990; Fritts, 1976). Ring widths were measured with a precision of 0.001 mm using a Velmex measuring system (Velmex, Inc., Bloomfield, NY, USA).
The quality of cross-dating and measurement was evaluated using the COFECHA program (Holmes, 1983). Two cores with weak correlation to the master chronology were excluded from further analysis. Successively, the age-related trends were removed by fitting a cubic smoothing spline with a 50 % frequency response cut-off at two-thirds of the series length using the ARSTAN program (Cook and Kairiukstis, 1990). The tree-ring index was calculated as the ratio of the observed value to the estimated growth curves. Autocorrelation was removed by autoregressive modeling, and the site chronology was calculated using a bi-weighted robust mean (Cook and Kairiukstis, 1990).
Four chronologies have high values of standard deviation, mean sensitivity, mean series correlation and agreement within population. They reflect high interannual variation and a strong common signal and are excellent proxies for regional climate. Since the four chronologies fit well (Table 2), we merged all samples to develop a single robust regional chronology (Fig. S1 in the Supplement). Running RBAR (mean correlation between series) and EPS (expressed population signal) statistics were calculated using a 51-year interval of the chronology with a 25-year overlap to assess confidence in the chronology. RBAR averages variance among ring width series in a chronology, which estimates chronology signal strength (Cook and Kairiukstis, 1990). EPS estimates the degree to which the chronology represents a hypothetical chronology based on a finite number of trees that match a hypothetically perfect chronology; EPS values greater than 0.85 are generally considered an acceptable threshold for a reliable chronology (Wigley et al., 1984). The regional chronology spanned the period from 1725 to 2010, and the reliable interval (EPS>0.85) was 1751–2010 corresponding to eight trees (Fig. S1).
Table 2Five-chronology correlation matrix over the common period (1793–2010).
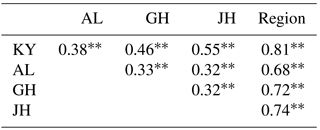
* – p<0.05, – p<0.01. The site codes are identical to those in Table 1.
2.3 Climate and statistical analyses
Climate data were obtained from the National Meteorological Information Center (http://data.cma.cn/, last access: 1 May 2016). The weather station nearest to the sample sites is Xiaoergou (Table S1 and Fig. 1), about 70–91 km away. Large-scale climate data (e.g., El Niño–Southern Oscillation, ENSO, Atlantic Multidecadal Oscillation, AMO; Pacific Decadal Oscillation, PDO; North Atlantic Oscillation, NAO) and high-resolution gridded climate data (Table S1; e.g., gridded temperature, precipitation and drought indices) were downloaded from http://climexp.knmi.nl/ (last access: 30 May 2017). Pearson correlation analysis was conducted to estimate climate–growth relationships. The gridded climate dataset is much longer and has higher homogeneity and coherency than station data (Fig. 2); the gridded monthly total precipitation from the Climatic Research Unit (CRU) Global Precipitation Climatology Centre (GPCC) (Schneider et al., 2015) and mean temperature (CRU TS3.23; Jones and Harris, 2013) nearest to our sites were used for climate response analyses. In addition, the nearby gridded monthly PDSI data from Dai (2011) (Dai-PDSI hereafter) were used to assess the effects of drought. Correlation analyses between the regional chronology and monthly climatic records were calculated from the previous July to the current July.
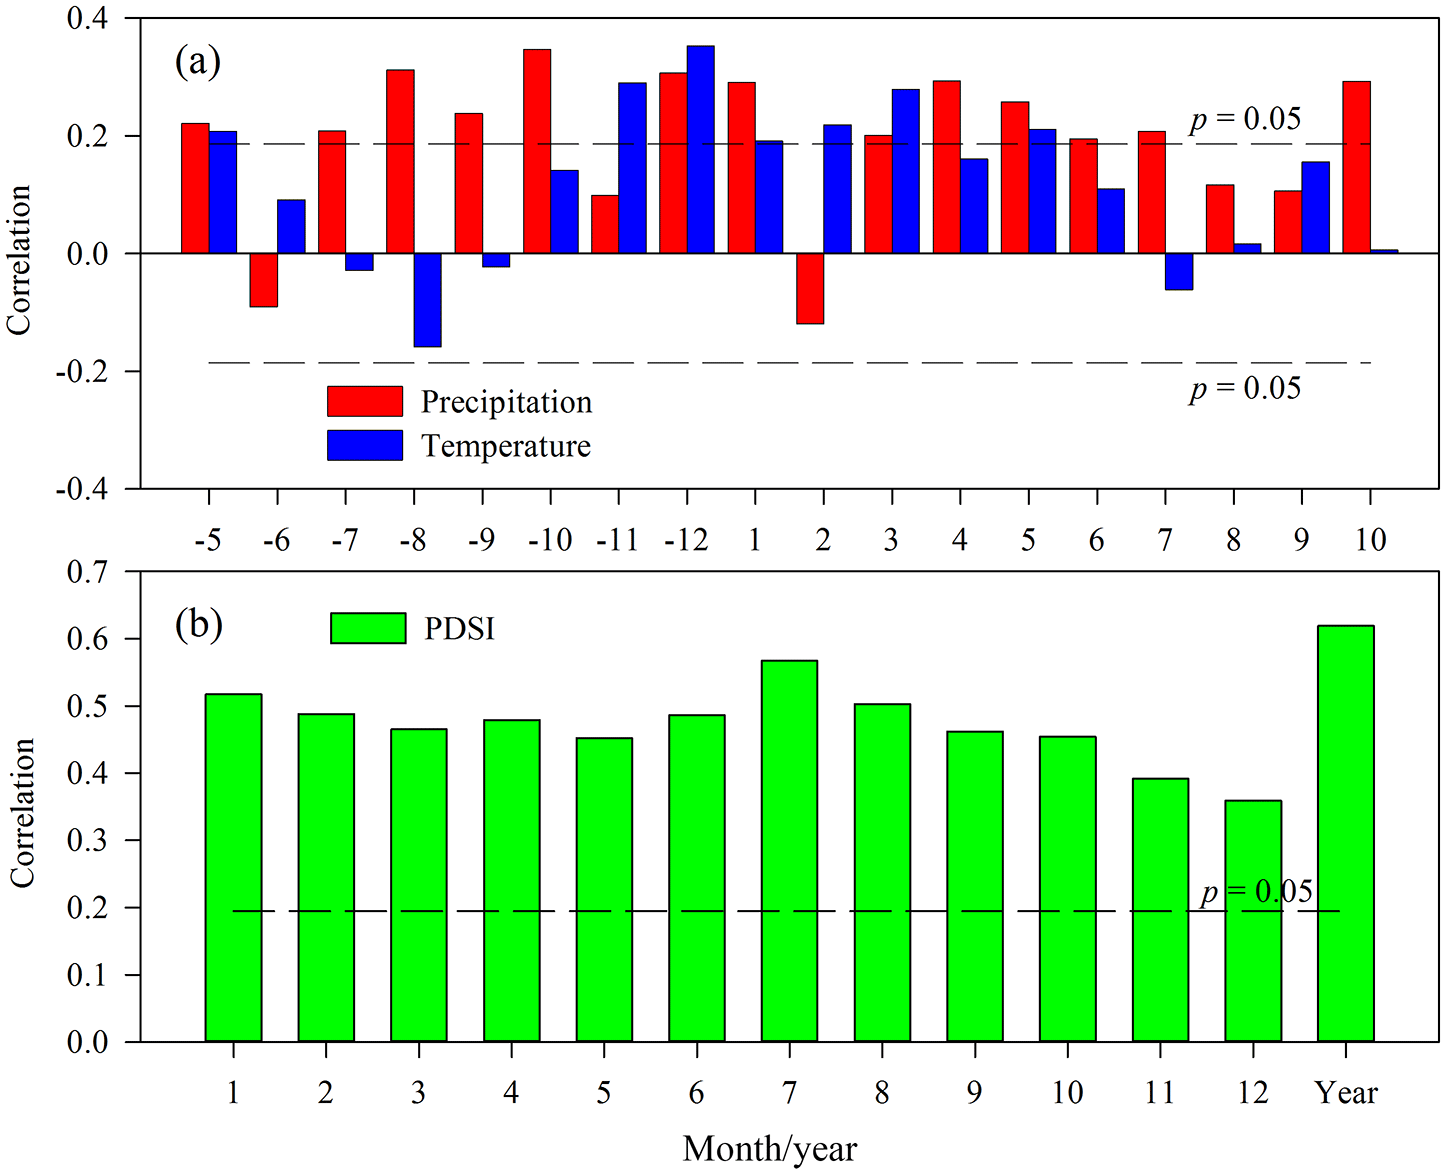
Figure 3Pearson correlation coefficients between tree-ring index of Pinus sylvestris var. mongolica and the monthly total precipitation, mean temperature (a) and Dai-PDSI (b). Significant correlations (p<0.05) are indicated by above or below the 95 % confidence line (dashed line). The minus sign (“−”) in the abscissa represents the previous year; for example, “−7” represents the previous July.
A linear regression model was used to reconstruct the drought variation, and a traditional split-period calibration and verification method was applied to examine the model fitness (Fritts, 1976). Statistical parameters included the R2, sign test (ST), reduction of error (RE), coefficient of efficiency (CE), product means test (PMT) and root mean square error (RMSE) (Cook and Kairiukstis, 1990; Fritts, 1976). Spatial correlation of the measured and reconstructed drought variables with regional gridded CRU-PDSI (Schrier et al., 2013) was performed to examine the spatial representativeness of our reconstruction using the Royal Netherlands Meteorological Institute (KNMI) climate explorer. Local historical drought data recorded in “Meteorological disasters dictionary of China” (Shen, 2008; Sun, 2007) were used to verify our PDSI reconstruction.
We also carried out the superposed epoch analysis (SEA) between the nearby forest fire events and the drought series to further validate the accuracy of our reconstruction because seasonal or annual droughts are usually a key factor of forest fire severity in the Daxing'an Mountains (Shen, 2008; Sun, 2007). Two regional forest fire chronologies (Mengkeshan and Pangu) reconstructed by tree-ring scars in nearby forests were used (Yao et al., 2017). The SEA was carried out using the software package FHAES V2.0.0 (https://www.frames.gov/partner-sites/fhaes/download-fhaes/, last access: 5 March 2016). In addition, the consistency between our reconstruction and other local drought-related time series including the gridded Standardized Precipitation-Evapotranspiration Index (SPEI), Monsoon Asia Drought Atlas (MADA) from Cook et al. (2010) (Cook-PDSI, hereafter) and self-calibrating PDSI from Schrier et al. (2013) (scPDSI, hereafter) was detected using Pearson correlation analysis. We also compared our reconstruction with the nearby tree-ring-based hydroclimatic reconstructions (the December–March precipitation reconstruction of the A'li River (AR) in the Daxing'an Mountains from Lv and Wang (2014), the April–August SPEI reconstruction of the Hulun Buir (HB) steppe on the east edge of the Mongolian Plateau in the western Daxing'an Mountains (Bao et al., 2015) and the tree-ring-based streamflow reconstruction of the Selenga River (SR) from Davi et al. (2006) in the Mongolian Plateau, Mongolia) to assess the reliability of reconstruction by filtering and moving correlations.
To identify spatiotemporal patterns of drought variation in northeast Asia and their relationship with our reconstructed drought series, we analyzed the correlations between our series and other four hydroclimatic reconstruction series in the Daxing'an Mountains and the Mongolian Plateau (Fig. 1). To better visualize the comparison, all series described above were standardized using Z scores and smoothed with a 21-year moving average to highlight low-frequency drought signals.
To evaluate the extreme dry and wet years in the historical period, we defined extreme dry and wet years with the annual PDSI value being lower or higher than average ±1.5 standard deviation. We assessed the multi-year dry–wet periods based on the intensity (average departure values from the long-term mean) and magnitude (cumulative departure values from the long-term mean).
Table 3Calibration and verification statistics of the PDSI reconstruction.
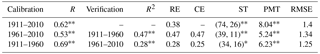
* – p<0.05, – p<0.01. RE: reduction of error, CE: coefficient of efficiency, ST: sign test, PMT: product means test, RMSE: root mean square error.
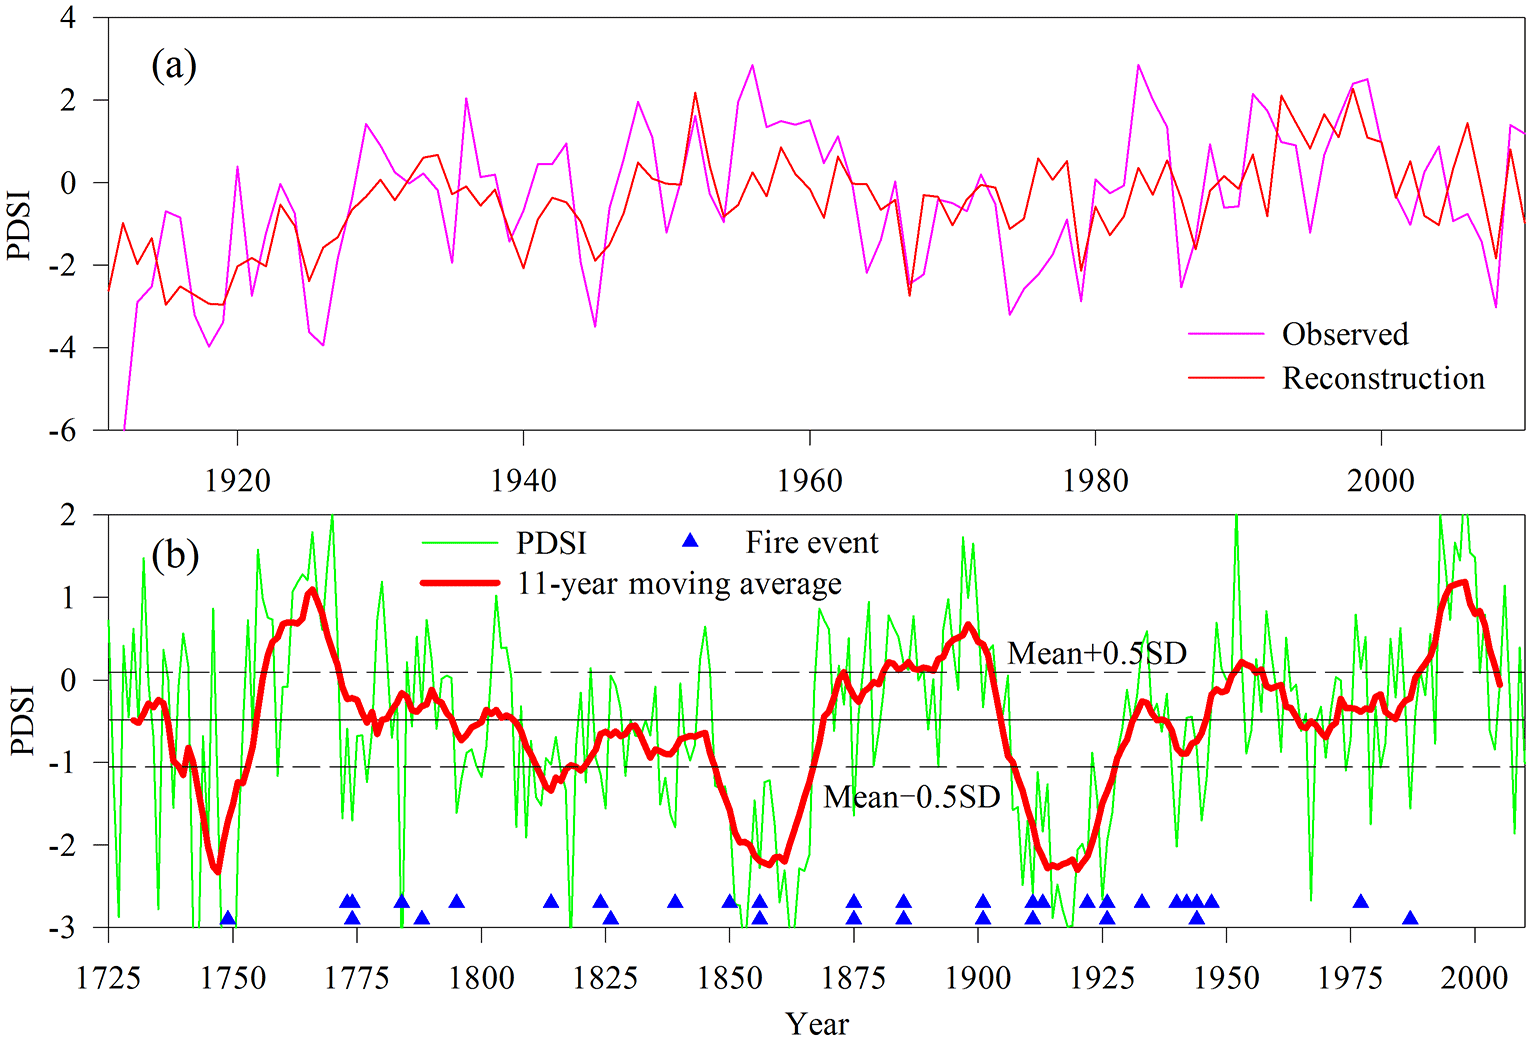
Figure 4The reconstruction PDSI series in the Daxing'an Mountains, northeast China. (a) Comparison of the observed (pink line) and reconstructed (red line) annual PDSI during the calibration period (1911–2010). (b) The reconstruction series of annual PDSI, plotted annually from 1725 to 2010 (green line), along with a smoothed 11-year moving average (red bold line); blue-filled triangles indicate a forest fire in nearby area reconstructed from tree-ring fire scars in Mengkeshan (higher) and Pangu (lower), northern Daxing'an Mountains.
A spectral analysis was applied to identify the periodicity of dry–wet variation and possible effects of large-scale climate using the multi-taper method (MTM) (Mann and Lees, 1996). To further confirm the linkage between large-scale climate and regional drought, we analyzed their relationship with Pearson correlation analysis. Teleconnections between the reconstructed drought series and the global sea surface temperature () were carried out to verify the potential drivers of large-scale climate, such as ENSO, PDO and AMO, on local drought. To explore the linkages between the reconstructed Dai-PDSI extreme events and atmospheric circulation patterns in Asia, the National Centers for Environmental Prediction (NCEP) climate data (Kalnay et al., 1996) were used to create January–December composite anomaly maps of the sea surface temperatures (SSTs), the 200 hPa geopotential height and vector wind in the wettest 10 years and driest 10 years during the period 1948–2010.
3.1 Tree growth–climate relationships
The radial growth of Scots pine was significantly (p<0.05) positively correlated with precipitation in all months except the previous November and current February (Fig. 3a) and temperature from the previous November to current May (except for the current April) (Fig. 3a). The highest Pearson correlation coefficients occurred in October precipitation (R=0.35, p<0.05) and the previous December mean temperature (R=0.35, p<0.05). Radial growth of Scots pine in the Daxing'an Mountains was influenced by both precipitation and temperature simultaneously, but the effects of precipitation were stronger, revealing the annual precipitation sensitivity of Scots pine during the last century (Fig. 3a). Furthermore, we calculated the correlation between the tree-ring index and Dai-PDSI (common period of 1901–2010), which takes into account temperature and precipitation (Dai, 2011). Significant (p<0.05) positive correlations between tree rings and PDSI were found in all months from the previous July to the current July (Fig. 3b). The correlation between tree growth and annual (January–December) average PDSI showed the highest correlation coefficient (R=0.62, p<0.0001, n=110) among all seasonal PDSI compositions. The results confirmed that water availability had a significant limiting influence on Scots pine growth in the last century (Fig. 3).
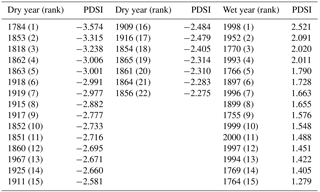
Table 4Reconstructed extreme dry–wet years and annual PDSI of the Daxing'an Mountains.
3.2 PDSI reconstruction
The linear model for PDSI reconstruction is
where Dt is the annual PDSI and It is the tree-ring index at year t. The split calibration–verification test showed that the explained variances were high during the two calibration periods (1911–1960 and 1961–2010). The statistics of R, R2, ST and PMT are all significant at p<0.05, which indicated that the model was reliable (Table 3). The most rigorous tests, RE and CE, were also positive for both verification periods (Cook and Kairiukstis, 1990; Fritts, 1976) (Table 3). For the calibration period (1911–2010), the reconstruction explained 38.2 % of the PDSI variation (37.6 % after accounting for the loss of degrees of freedom). These results suggest that the linear model is robust for PDSI reconstruction.
Table 5The long-term droughts and pluvial in the central Daxing'an Mountains during the last 260 years.
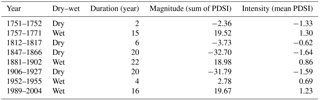
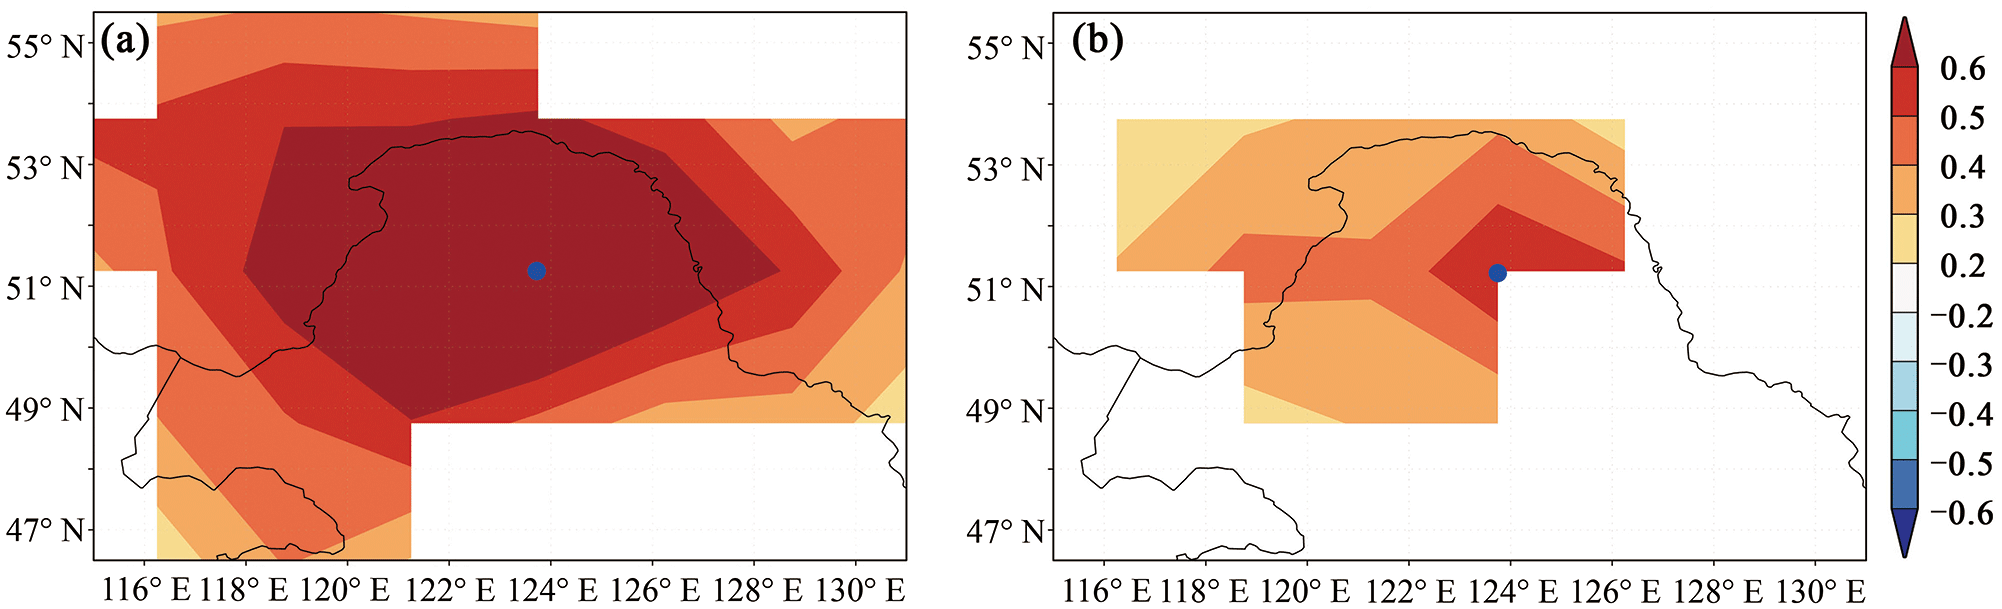
Figure 5Spatial correlation fields between (a) the instrumental and (b) reconstructed annual Dai-PDSI for the Daxing'an Mountains and the regional Dai-PDSI during the period 1911–2010 (http://climexp.knmi.nl/, last access: 30 May 2017). The blue circle is the reconstructed PDSI grid.
The instrumental and reconstructed PDSIs of the central Daxing'an Mountains have similar trends and are parallel to each other during the calibration period (Fig. 4). However, the reconstructed PDSI did not capture the magnitude of extreme dry or wet conditions. Spatial correlation analysis showed that the instrumental and reconstructed PDSIs had a strong and similar spatial correlation pattern with the northeast Asia gridded Dai-PDSI (Fig. 5).
3.3 Historical PDSI variability
The reconstructed annual PDSI with an 11-year moving average exhibited a mean of 0.48 and a standard deviation (SD) of ±1.15 during the past 260 years (Fig. 4b). Reconstruction of the annual PDSI displayed strong interannual- to decadal-scale variability throughout the period 1751–2010. During the last 260 years, there were 22 extreme dry years (accounting for 8.5 %) and 15 extreme wet years (5.8 %) (Table 4). Most extreme dry years occurred in the 19th (12 years, accounting for 48 %) and 20th centuries (9 years, accounting for 36 %), and most extreme wet years occurred in the 20th century (9 years, accounting for 60 %). Among the extreme years, 1784, 1853, 1818, 1862 and 1863 were the five driest years, and 1998, 1952, 1770, 1993 and 1766 were the five wettest years (Table 4). We also found that many extreme dry or wet years occurred in succession, for example, 1862 and 1863.
Compared with the severe single-year droughts, multi-year droughts had a greater effect on tree growth, and we defined the dry and wet periods as those when the 11-year moving average PDSI was more than 0.5 SD from the mean for at least 2 consecutive years. Four dry periods, 1751–1752, 1812–1817, 1847–1866 and 1908–1927, and four wet periods 1757–1771, 1881–1902, 1952–1955 and 1989–2004 were identified (Table 5). The dry periods of 1847–1866 and 1906–1927 were the longest, spanning 20 years, while the longest wet period, from 1881–1902, lasted for 22 years (Table 5). The multi-year drought in 1847–1866 was the most serious due to the long duration and intensity, and the period 1906–1927 was the second most significant drought (Table 5). Wet periods in 1757–1771 and 1989–2004 were the most remarkable in terms of their intensity and duration (Table 5).
Spectral analysis revealed that the historical PDSI variation in the Daxing'an Mountains showed several significant (95 % or 99 % confidence level) periodicities at 46.5–78.7 (99 %), 12, 5–6 (99 %) and 2–3 (99 %) years, which corresponded to significant cycle peaks presented in Fig. 6.
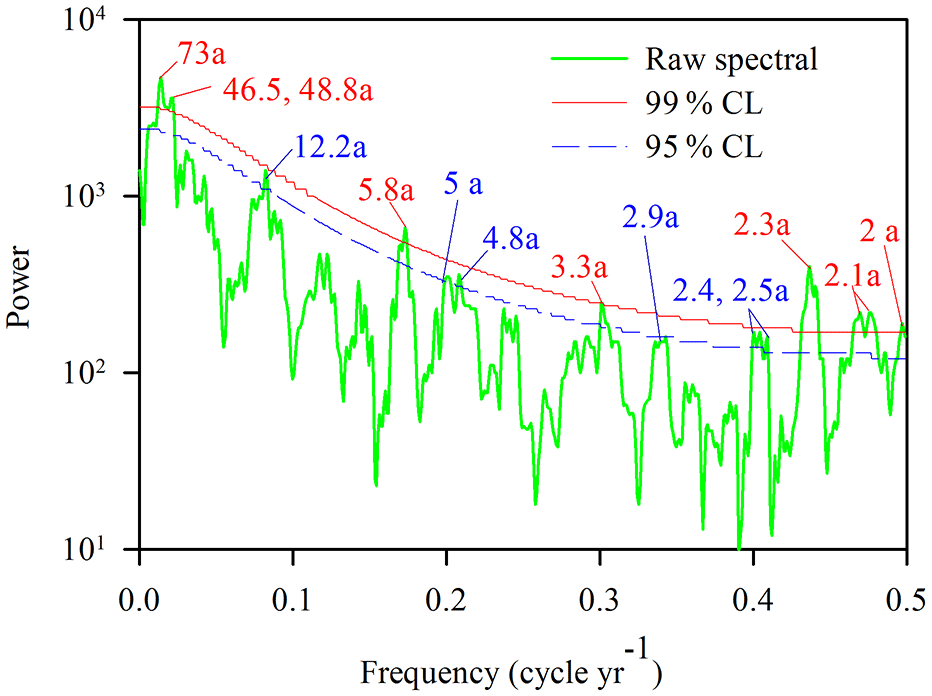
Figure 6Multi-taper method power spectrum of the reconstructed PDSI during the period 1751–2010. The 95 % and 99 % confidence levels relative to red noise are shown and the numbers refer to the significant period in years.
4.1 Climate–growth relationship
Scots pine is an drought-tolerant species and drought stress is thought to be the main climate factor limiting its radial growth in semi-arid or semi-humid regions, such as in the Mongolian Plateau and western Daxing'an Mountains (Bao et al., 2015; Davi et al., 2006; Liu et al., 2009; Pederson et al., 2013). Previous dendroclimatic studies from these regions suggest that radial growth of Scots pine is sensitive to humidity, precipitation or drought (e.g., PDSI, SPEI), and most analyses have reconstructed hydroclimatic history (Bao et al., 2015; Liu et al., 2009). In these areas, the radial growth of Scots pine usually has a typical climate (drought) response pattern with positive tree growth response to increasing precipitation and a negative response to increasing temperature (Bao et al., 2015; Davi et al., 2006; Liu et al., 2009). This typical drought response pattern is usually found in other drought or wetness tree-ring reconstructions (Li et al., 2016; Liu et al., 2017). In this study, the correlation between tree-ring index and monthly precipitation and temperature revealed that the radial growth of Scots pine was mainly limited by water, which is consistent with the physiological characteristics of tree species living in semi-arid regions. A significant positive relationship between the tree-ring index and PDSI in all months supported moisture as the main limiting factor of Scots pine radial growth (Fig. 3b).
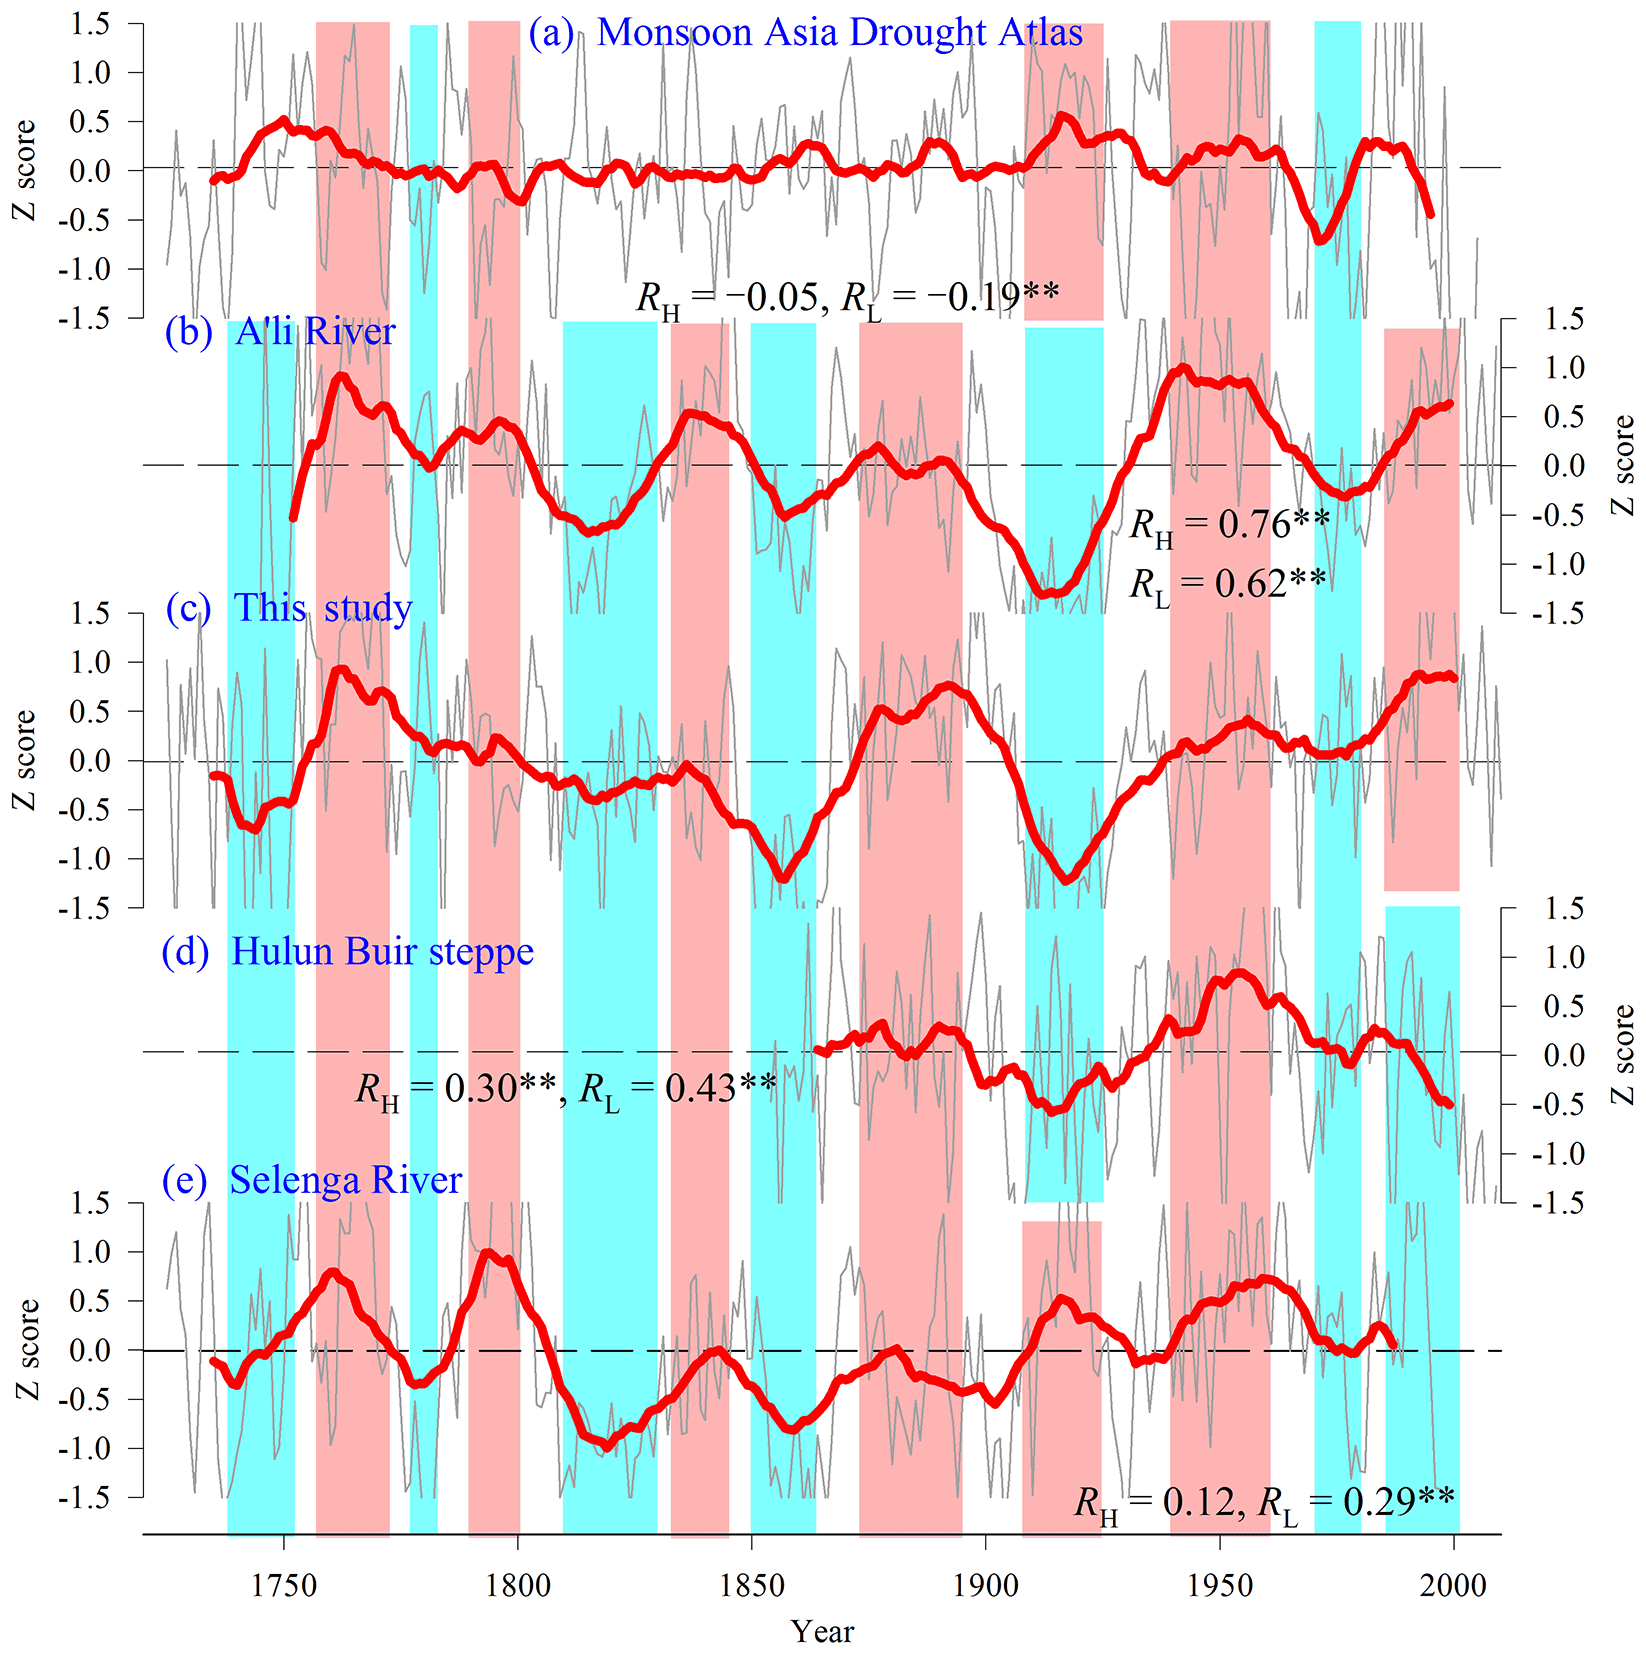
Figure 7Comparisons of (a) the drought reconstruction derived from the Monsoon Asia Drought Atlas (MADA; Cook et al., 2010), (b) the winter precipitation reconstruction of the A'li River in northeastern China (AR; Lv and Wang, 2014), (c) the mean annual PDSI reconstruction in the Daxing'an Mountains (TS; in this study), (d) the April–August SPEI reconstruction of the Hulun Buir steppe in eastern Mongolian Plateau (HB; Bao et al., 2015) and (e) the April–October streamflow reconstruction of the Selenga River in northeastern Mongolia (SR; Davi et al., 2006). All above series were standardized using Z scores (high frequency) and then smoothed with a 21-year moving average (low frequency; red bold line). Blue and red shade areas represent a consistent period of drought and wetness, respectively. Correlation coefficients between our reconstruction series and other series in low (RL) and high (RH) frequency are shown on the diagram. p<0.01.
The drought response was also found in Dahurian larch (Wang and Lv, 2012), another important conifer tree species in the study area. However, the typical drought response to temperature was not obvious, and the radial growth of Scots pine was not significantly negatively correlated with the growing season (July–September) temperature (Fig. 3a). On the contrary, a significant positive response of radial growth to the non-growing season temperature was found. It is possible that higher winter temperatures could protect dormant buds from frost damage (Chen et al., 2012). The positive correlation with spring temperature could be due to earlier and larger snow melting, which supplies the spring soil water, and eventually stimulates tree growth (Hollesen et al., 2015; Zhu et al., 2017). This unusual drought response pattern might be due to the relatively humid climate and the northern latitude of our study sites, where the positive effect of temperature was greater than the negative effect resulting from drought stress (Wang and Song, 2011). Similar drought response patterns were also found in tree-ring-based drought reconstructions in the middle Qilian Mountains (Sun and Liu, 2013) and the Tian Shan Mountains of western China (Chen et al., 2015).
4.2 Comparison with regional records
We used the local historical document records to verify our PDSI reconstruction for the timing of extreme dry years or periods. During the last 260 years, 60.1 % (13∕22) of extreme dry years were noted in historical documents (Shen, 2008; Sun, 2007). Tree rings cannot fully record the continuous drought events (years) resulting in a limited percentage or correspondence. For example, only 1861 was recorded in our reconstruction during the extreme drought period (1860–1865). Thus, some severe drought events affect radial tree growth in some but not all years (Fritts, 1976). In addition, the lag response of radial growth to climate (drought) might have a great contribution to unrecorded extreme drought events (Fritts, 1976). For example, the local historical documents recorded the dry years of 1817 and 1855 that showed narrower rings or as an extreme dry event in the following year. Two multi-year droughts recorded in tree rings, 1847–1866 and 1908–1927, can both be identified in historical documents (Shen, 2008; Sun, 2007). Moreover, the SEA between our reconstructed drought series and forest wildfire history revealed that a significant drop of PDSI values occurred during the year of the forest fire in Mengkeshan and Pangu (Fig. S2 in the Supplement), further validating the accuracy of our reconstruction.
Spatial correlation analysis indicated a strong pattern between our reconstruction and gridded scPDSI in northeast Asia (Fig. 7), and our reconstruction also represented drought/wet variations in surrounding geographic regions. During the common periods, our reconstruction shared a similar dry–wet fluctuation with precipitation of the A'li River (Wang and Lv, 2012) and SPEI of the Hulun Buir steppe (Bao et al., 2015) both in the low and high frequency (Fig. 7b–d). Significant (p<0.05) correlations among them were found in low and high frequency and some common dry–wet periods, highlighted in Fig. 7, which confirmed that our drought reconstruction could account for the most dry–wet variations in the Daxing'an Mountains.
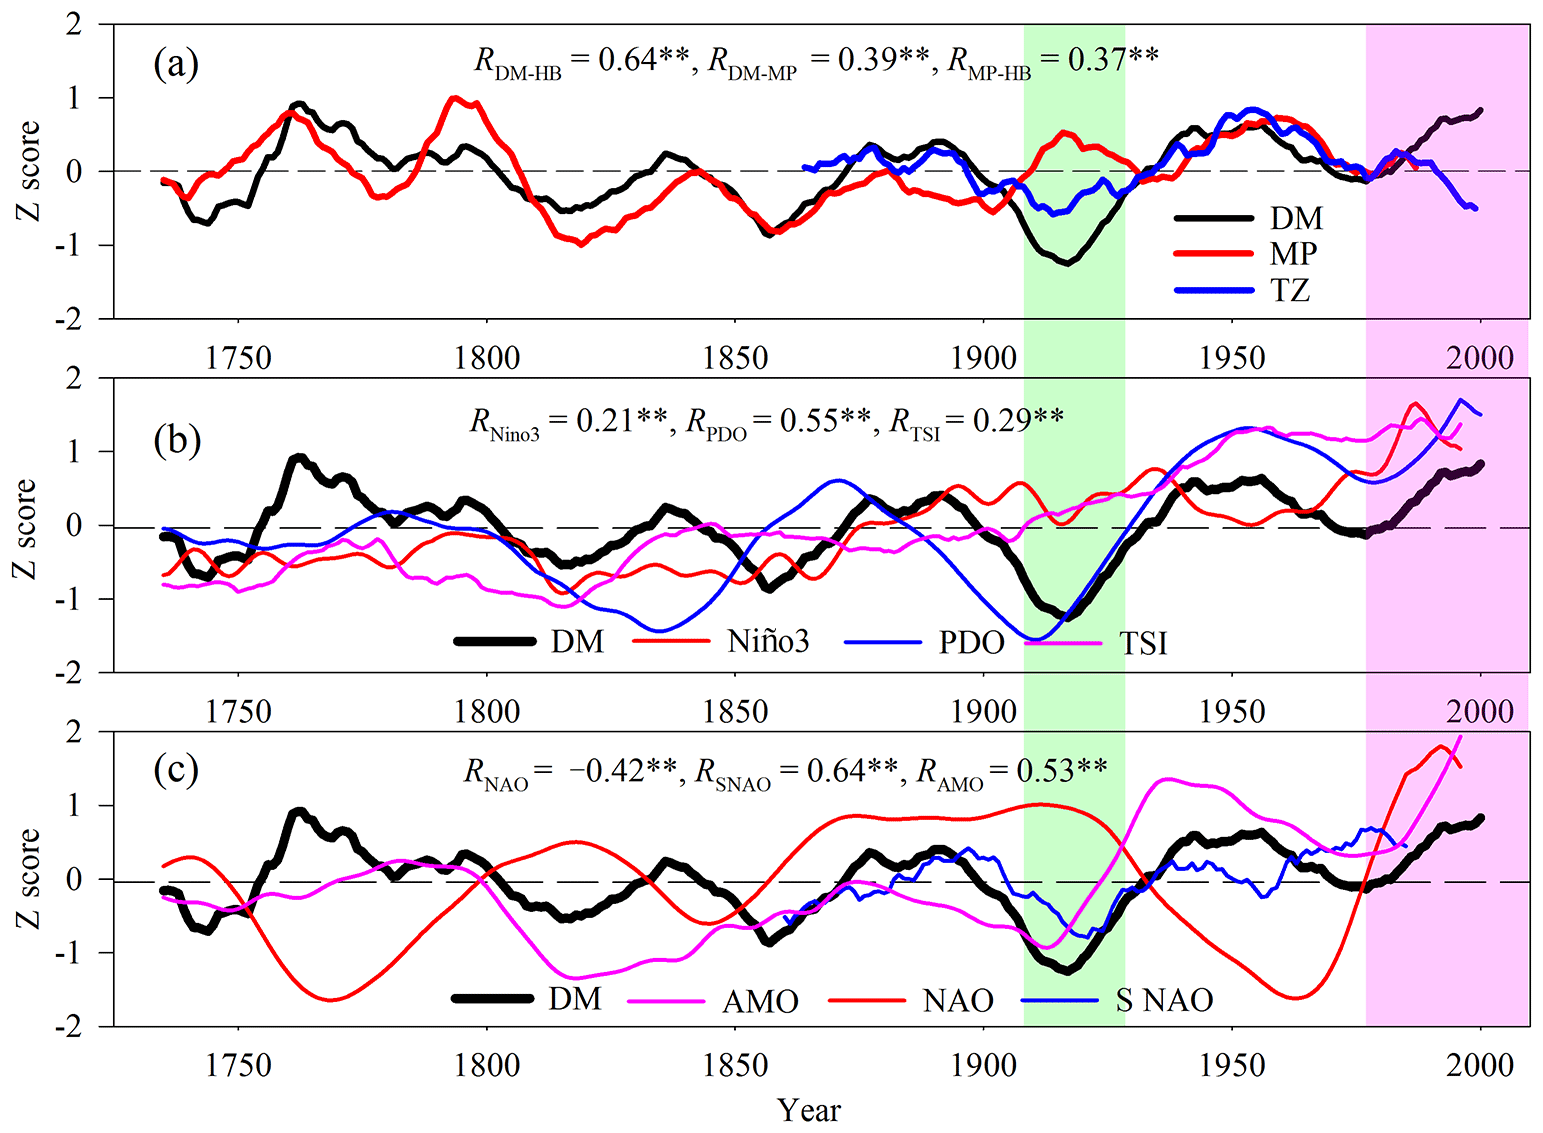
Figure 8Comparisons of the drought reconstruction and other large-scale climate oscillations. (a) The dry–wet changes in the Daxing'an Mountains (DM, the average of our reconstruction and the precipitation reconstruction of the A'li River), the Mongolian Plateau (MP, the streamflow reconstruction of the Selenga River) as well as their transition zones (TZ, the SPEI reconstruction of the Hulun Buir steppe); (b) the drought reconstruction in the Daxing'an Mountains (DM), the Pacific Decadal Oscillation (PDO) and the Niño3 index reconstruction from Mann et al. (2009) (Niño3) as well as the total solar irradiance (TSI) reconstruction from IPCC AR5; (c) the drought reconstruction in the Daxing'an Mountains (DM), the Atlantic Multidecadal Oscillation (AMO) reconstruction from Mann et al. (2009), the multi-decadal winter North Atlantic Oscillation (NAO) reconstruction by Trouet et al. (2009) and the summer NAO based on the 20C reanalysis sea-level pressure reconstruction (SNAO). All above series were standardized using Z scores and then smoothed with a 21-year moving average to highlight low-frequency drought signals. Significant correlation coefficients ( p<0.01) are listed in the figure.
It is important to note that our drought reconstruction and the MADA by Cook et al. (2010) from the same PDSI grid showed a complete opposite trend (; p < 0.01) in low frequency (Fig. 7). Negative correlations between the MADA and the SPEI (; p=0.03) and scPDSI (; p=0.236), positive correlations between our drought reconstruction and the SPEI (RL=0.95; p<0.01) and scPDSI (RL=0.807; p<0.01) were also found, although it had a seasonal difference with our drought reconstruction. These imply that the MADA by Cook et al. (2010) might be inaccurate or even reversed in the timing of dry–wet variations in the Daxing'an Mountains. Similar divergence of tree-ring-based drought reconstruction between the MADA and individual sampling sites was also found by Li et al. (2015) from Guancen Mountain and Liu et al. (2017) from central Inner Mongolia. The insufficient spatiotemporal distribution of tree-ring networks, especially in eastern China, used in MADA might be the main reason for this divergence/inaccuracy (Cook et al., 2010; Li et al., 2015; Liu et al., 2017). Therefore, our drought reconstruction is necessary to improve our understanding of the east Asian monsoon climate variability.
Table 6Correlation coefficients between the large-scale climate indices (AMO, PDO, NAO, SNAO, TSI and Niño3) and the local annual mean temperature, total precipitation and instrumental Dai-PDSI, as well as the Z score of dry–wet variation in the Daxing'an Mountains (DMZscore).
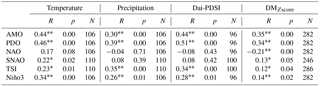
Note: AMO, PDO, NAO, SNAO, TSI and Niño3 indicate the Atlantic Multidecadal Oscillation reconstruction from Mann et al. (2009), the Pacific Decadal Oscillation reconstruction from Mann et al. (2009), the multi-decadal winter North Atlantic Oscillation reconstruction from Trouet et al. (2009), the summer NAO based on the 20C reanalysis sea-level pressure reconstruction (SNAO), the total solar irradiance reconstruction from IPCC AR5 and the Niño3 reconstruction from Mann et al. (2009), respectively. All the above data were downloaded from http://climexp.knmi.nl/ (last access: 30 May 2017). * p<0.05, p<0.01.
On a larger spatial scale, the streamflow reconstruction of Selenga River in the west-central Mongolian Plateau from Davi et al. (2006) presented a significant positive correlation with our drought reconstruction in low frequency (RL=0.29; p<0.01) during the full periods. Our reconstructed PDSI also displayed some common variation trends for dry–wet periods with the reconstructed streamflow variations from the Selenga River (Davi et al., 2006), especially at the decadal scale. These relationships suggest that there are common drivers affecting dry–wet variations of the Daxing'an Mountains and the west-central Mongolian Plateau, although there might be some discordance. Among those differences, the most obvious one is the completely different dry–wet variation trends among the Daxing'an Mountains (wetter), the west-central Mongolian Plateau (mild drier) as well as their transition zones, the east Mongolian Plateau (Hulun Buir steppe; drier) since the late 1970s (Fig. 8a). Similar results were also found by Dai (2013), which presented a different dry–wet pattern under global warming using observations and models. In the Tibetan Plateau, Li et al. (2016) found moisture increases related to rapid warming (warm–wet). Although the reason for this divergence should be further studied, it might be related to the different response to the phase shift (negative to positive) of the PDO in 1976 and 1977 (Ma, 2007; Wang et al., 2014). Ma (2007) found that the positive PDO phase usually corresponds to the drought period with warming and less precipitation, while the negative PDO phase often matches the wet period with low temperature and more precipitation. Simultaneously, the drought trend caused by the persistent significant warming in semi-arid or semi-humid regions might be more serious than in humid regions (Dai, 2013). In addition, a different record of severe drought that occurred over a large geographic area in northern Asia during the 1920s–1930s, has been reported by many other studies in north China (Bao et al., 2015; Chen et al., 2015; Liang et al., 2006; Liu et al., 2009). As indicated by the tree-ring series, the drought event during the 1920s–1930s in the Daxing'an Mountains was more severe than on the east Mongolian Plateau (the Hulun Buir steppe), which was consistent with the result by Dong et al. (2013). The drought, however, was not found in the west-central Mongolian Plateau (the Selenga River). On the contrary, it was very wet at that time (Fig. 8). Different spatial patterns of severe drought over northeast Asia might be associated with the intensity and scope of the strong ENSO during this period (Dong et al., 2013).
4.3 Linkages to the Pacific and Atlantic oceans
Spectral analysis revealed that several significant cycles existed in our drought series (Fig. 6). The significant high-frequency 2.0- to 5.8-year periodicities were within the 2- to 7-year cycles of ENSO (Li et al., 2013), so the drought variations in the Daxing'an Mountains might be related to ENSO. Similarly, the local dry–wet changes related to ENSO have been confirmed by other tree-ring-based hydroclimatic reconstructions in northeast China (Bao et al., 2015; Lv and Wang, 2014; Wang and Lv, 2012), northwest China (Chen et al., 2015; Sun and Liu, 2013) and the Mongolian Plateau (Davi et al., 2006). A strong connection appears between our reconstruction and annual SSTs over the Pacific Ocean, especially near the Equator, the north Pacific, as well as the east and west coasts of the Pacific Ocean (Fig. S3). The significant positive correlation between the Niño3 index and the dry–wet index in both low and high frequencies (Table 6, Fig. 8b) also confirmed the potential links between ENSO and the dry–wet variations in the Daxing'an Mountains. Although the mechanisms need to be further studied, the close relationship between the oscillatory changes of North Atlantic SST and the Asian monsoon have been demonstrated (Zuo et al., 2013). ENSO might indirectly influence dry–wet changes in the Daxing'an Mountains by affecting the local climate (Shuai et al., 2016). Wang et al. (2013) found that the ENSO could potentially drive or affect the Asian monsoon, which in turn affects temperature and precipitation to drive local drought variations, as a possible driving mechanism (Fig. 9). Significant positive correlations between the Niño3 index and local climate (temperature and precipitation) further confirm our inference (Table 6).

Figure 9Spatial correlations between the annual east Asian monsoon index and the local (a) temperature, (b) precipitation and (c) scPDSI from 1948 to 2010.
The 12-year cycle indicated that dry–wet changes in the Daxing'an Mountains might be influenced by solar activity (Shindell et al., 1999). Several previous studies have demonstrated that solar activity can influence the local dry–wet variations (Chen et al., 2015; Hodell et al., 2001; Sun and Liu, 2013). In northeastern China, Hong et al. (2001) also found the signals of solar activity in a 6000-year record of drought and precipitation. Significant positive correlations between the total solar irradiance (TSI; reconstruction from IPCC AR5) and the dry–wet index in the Daxing'an Mountains in low and high frequencies, and between the TSI and the local climate (temperature and precipitation), further confirmed a possible relationship between solar activity and local drought (Table 6, Fig. 8b). Wang et al. (2005) found a potential link between the Asian monsoon and solar changes. Dry–wet changes in the Daxing'an Mountains might be driven by the Asian monsoon which is influenced by solar activities (Fig. 9).
Cycles of 46.5–48.8 years might be related to the PDO since it coincided with the 50- to 70-year cycle of PDO (Macdonald and Case, 2005). This was verified by the strong connection between our drought reconstruction and annual SSTs over the Pacific Ocean (Fig. S3). The cycles/signals of PDO widely exist in most tree-ring-based drought reconstructions (Bao et al., 2015; Chen et al., 2015; Sun and Liu, 2013; Wang and Lv, 2012), and many studies have confirmed that PDO can influence drought conditions in China (Bao et al., 2015; Cook et al., 2010; Ma, 2007). The potential linkages between the PDO and local drought in the Daxing'an Mountains is further confirmed by the significant positive correlations between the PDO index (Mann and Lees, 1996) and the dry–wet index in low and high frequencies (Table 6, Fig. 8b). The positive/warm phase of PDO usually corresponds to the dry period, while the negative/cold phase corresponds to the wet period (Ma, 2007). For example, the severe drought in the 1920s–1930s corresponds to the PDO negative phase. Significant positive correlations between the PDO index and local climate (Fig. 9) suggest that the PDO might affect the dry–wet changes in the Daxing'an Mountains by regulating the intensity or location of the Asian monsoon (Bao et al., 2015; Cook et al., 2010; Ma, 2007). Similar results were found in a nearby tree-ring-based drought reconstruction (Bao et al., 2015).
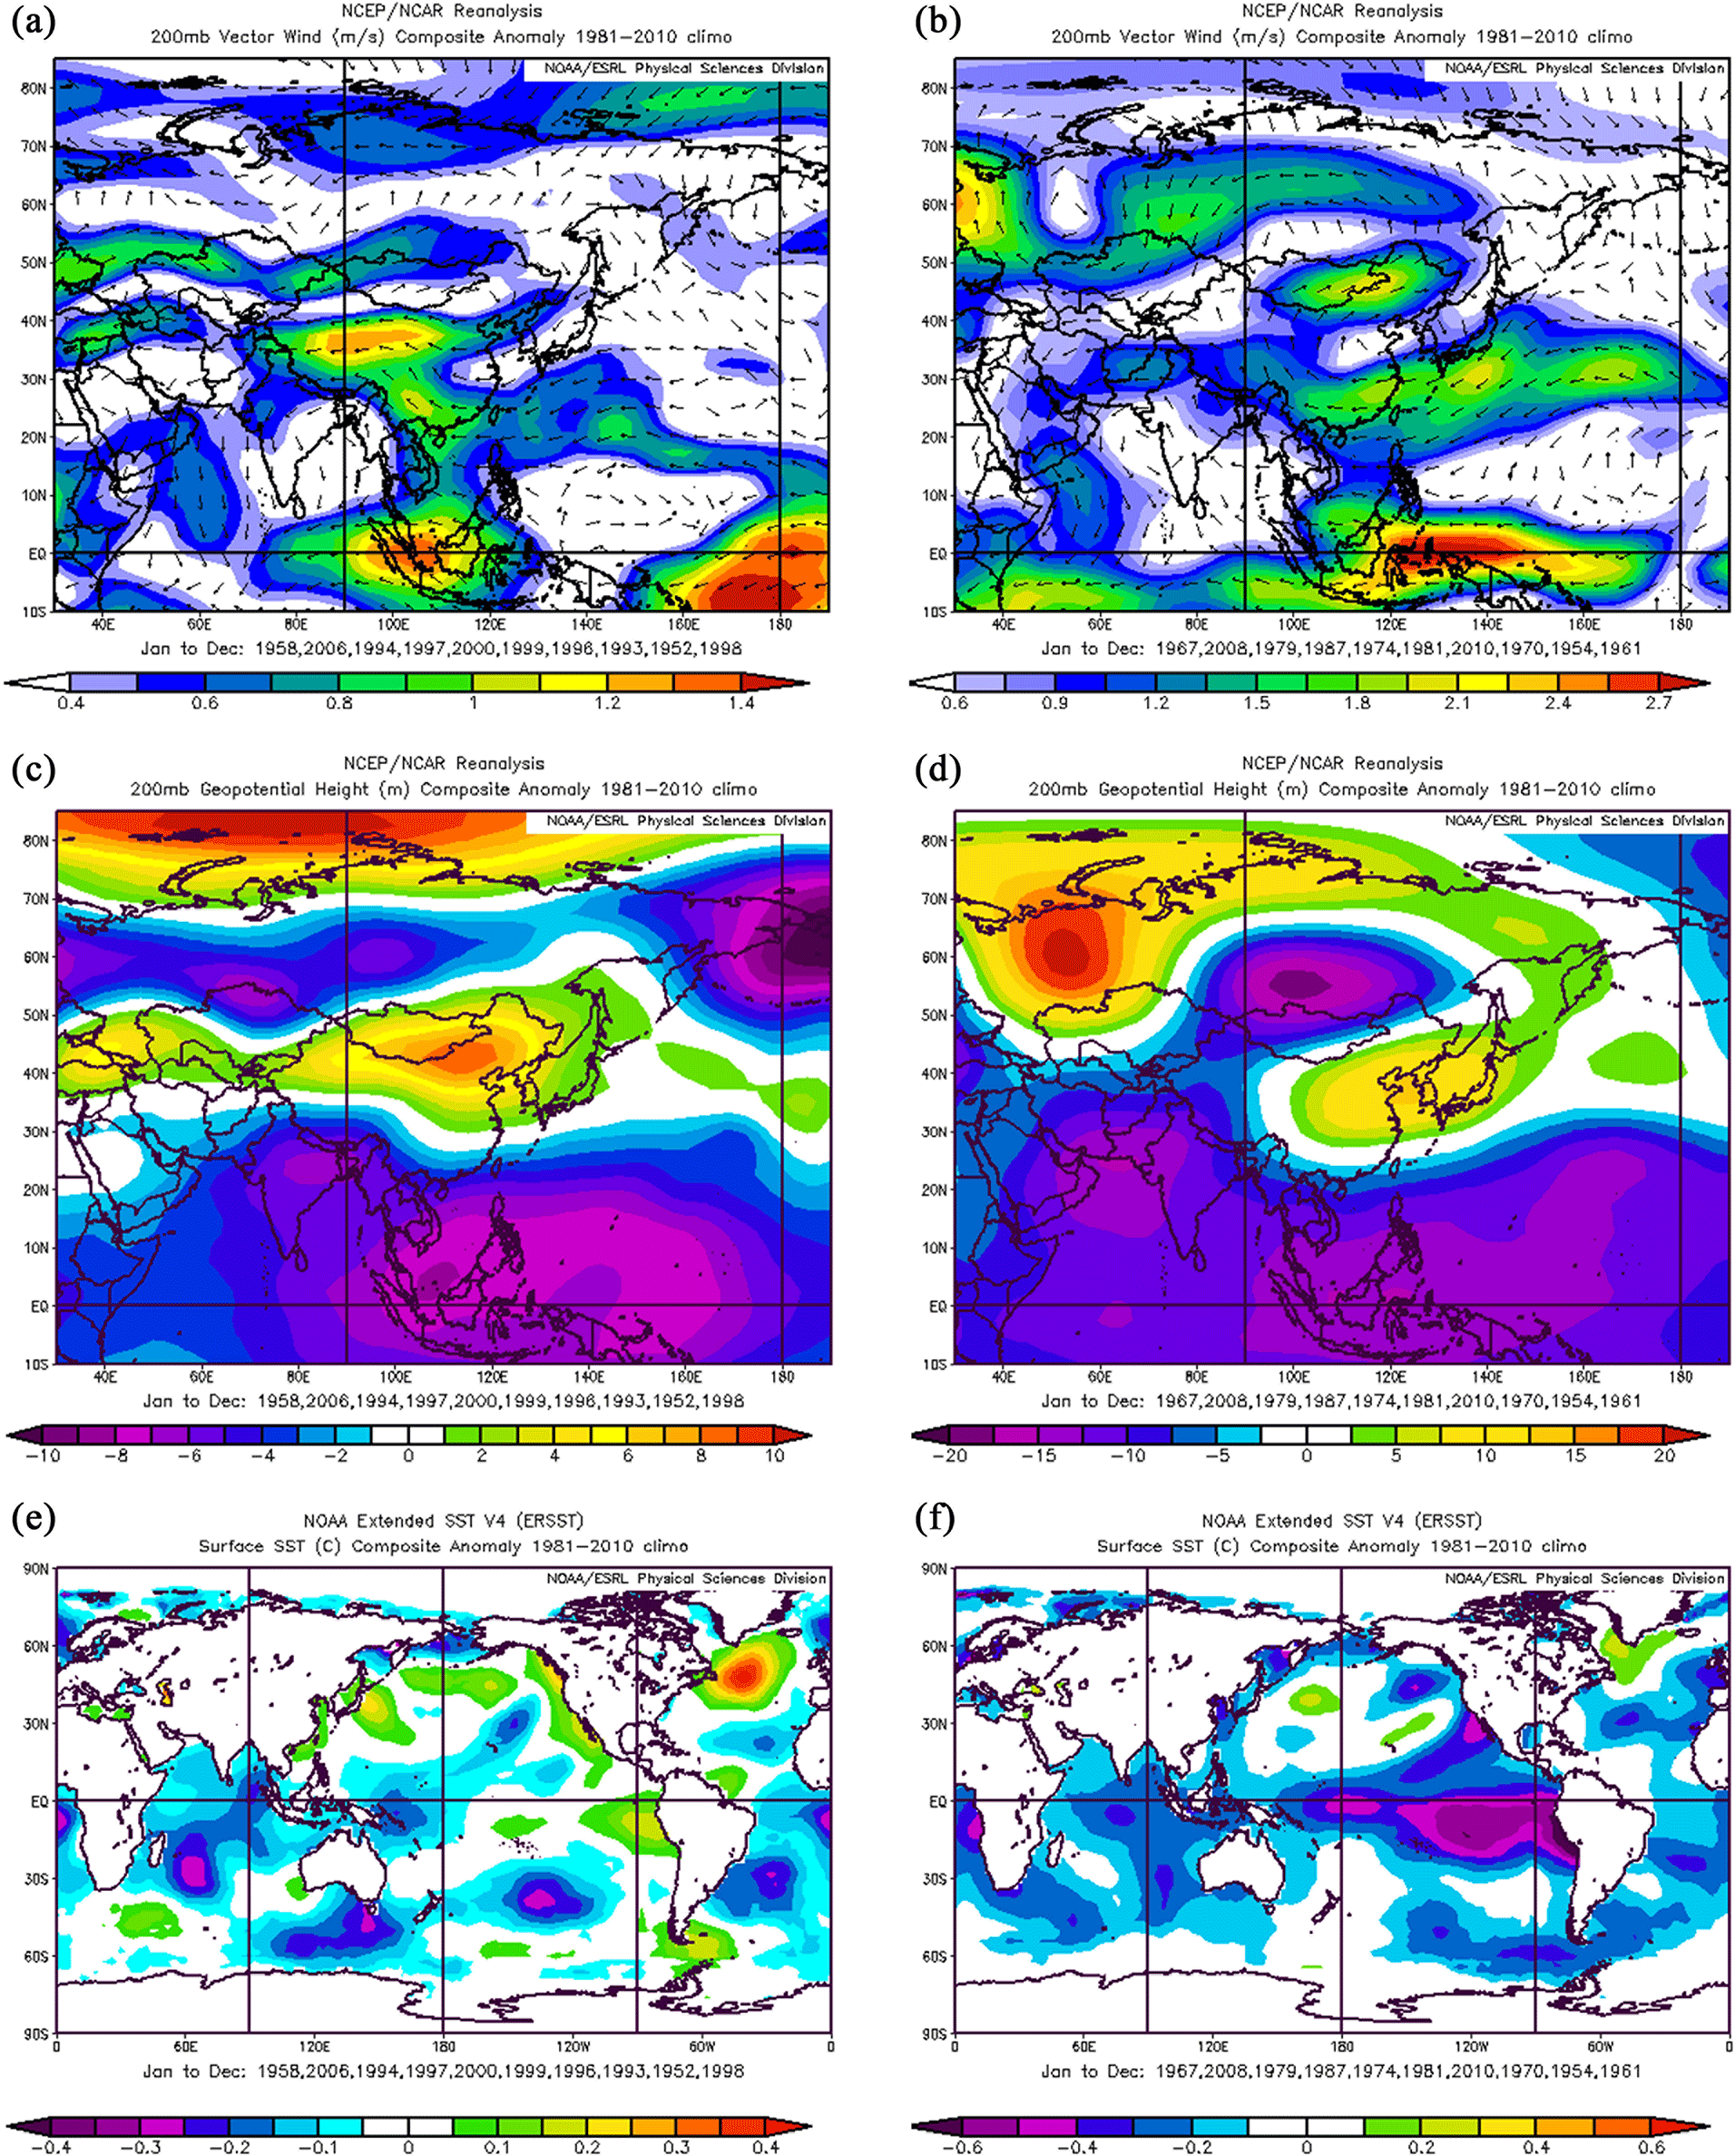
Figure 10Composite anomaly maps of the 200 hPa vector wind and geopotential height, and the SSTs (from January to December) for the 10 wettest (a, b, e) and 10 driest (c, d, f) years of the Dai-PDSI reconstruction during the period 1948–2010.
The 73-year drought cycle might be derived from oscillatory changes in the North Atlantic SST (Knudsen et al., 2011). Spatial correlations between our drought series and annual SSTs also show a strong teleconnection across the Atlantic Ocean (Fig. S3), which further confirmed potential linkages between the North Atlantic SSTs and dry–wet changes in the Daxing'an Mountains. Although our research area is far from the Atlantic, some studies have confirmed that large-scale climate oscillations in the Atlantic Ocean (such as the Atlantic Multidecadal Oscillation (AMO) and North Atlantic Oscillation (NAO), as well as summer NAO (SNAO)) could affect local climate and tree growth in China (Bates, 2007; Linderholm et al., 2011, 2013; Sun et al., 2008; Wang et al., 2011). Most tree-ring drought reconstructions also found the signals of oscillatory changes correlated with the North Atlantic SSTs (e.g., AMO, NAO and SNAO), such as in the Daxing'an Mountains (Lv and Wang, 2014; Wang and Lv, 2012), eastern Mongolian Plateau (Bao et al., 2015; Liu et al., 2009), west-central Mongolia (Davi et al., 2006) and northwest China (Chen et al., 2015; Sun and Liu, 2013). Furthermore, we also identified a significant negative–positive correlation between the dry–wet change in the Daxing'an Mountains and the AMO, NAO and SNAO index both in low and high frequency (Table 6, Fig. 8c). The strong AMO signal (Wang et al., 2011) and teleconnections with SNAO (Linderholm et al., 2013) also have been found in tree-ring widths of Scots pine in northeast China and east-central Siberia during the last 400 years. These studies all confirmed that oscillatory changes in the North Atlantic SST (e.g., AMO, NAO and SNAO) could drive dry–wet changes in the Daxing'an Mountains. Although its mechanism needs to be further studied, the close relationship between the oscillatory changes in the North Atlantic SST and the Asian monsoon has been demonstrated. Recent studies have shown that the AMO (Wang et al., 2013), NAO (Feng and Hu, 2008) and SNAO (Linderholm et al., 2011) all could drive or affect the Asian monsoon. In this study, although only the AMO index was significantly correlated with local climate (Table 6, Fig. 8c), it also confirmed that the oscillatory changes in the North Atlantic SST, especially the AMO, could drive wet–dry changes in the Daxing'an Mountains by influencing the Asian monsoon (Bao et al, 2015; Chen et al., 2015; Cook et al., 2010; Li et al., 2015; Linderholm et al., 2011; Sun et al., 2008).
Previous studies have found that drought variation in northeast Asia may be associated with Asian monsoon activity (Bao et al., 2015; Chen et al., 2015; Cook et al., 2010; Li et al., 2015; Linderholm et al., 2011; Sun et al., 2008). In wet years, the strengthened southerlies and easterlies entered inland China associated with a positive pattern over northeast Asia and some negative height-anomaly centers in west Russia and south Asia as well as the Indian and north Pacific oceans, which strengthened the westerly circulation (Fig. 10a, c). In dry years, however, strengthened southerlies and southwesterlies entered northeast China associated with a positive pattern over east Asia and western Russia, and some negative height-anomaly centers in southern Russia and south Asia as well as the Indian and south Pacific oceans (Fig. 10a, c).
The composite of 200 hPa geopotential height of the most humid 10 years (positive anomaly) in the central-north Daxing'an Mountains is opposite to that of the most arid 10 years (negative anomaly) (Fig. 10c, d). Positive and negative SST anomalies were also found in the western and northern Pacific Ocean during the wettest and driest years (Fig. 10e, f). In the wet years, abundant moisture is transported from the Pacific Ocean through Mongolian Plateau to the Daxing'an Mountains via the strong east Asian monsoon's southeasterly moisture flux joined with a strong westerly circulation (Fig. 10a). This negative anomaly combined with positive SST in the western and northern Pacific Ocean led to an enhanced dry jet (southwesterlies) across/toward the Daxing'an Mountains (Fig. 10b, c, e). Several studies have reported that the dry and wet variations in northeast Asia are strongly linked with the Asian monsoon and SSTs in the Pacific and Atlantic oceans (Bao et al., 2015; Chen et al., 2015; Cook et al., 2010; Li et al., 2015; Linderholm et al., 2011). In addition, the potential evaporation pattern in the Daxing'an Mountains is extremely low in the wettest years, and it also supports the above remote-connection assumptions (Fig. S4).
We developed a 260-year (1751 to 2010) tree-ring chronology of Scots pine (Pinus sylvestris L. var. mongolica Litv.) from four sample sites in the central Daxing'an Mountains, northeast China. Radial growth of Scots pine was mainly limited by water availability (R=0.62, p<0.01). A 260-year dry–wet change history was reconstructed, and the reconstruction equation explained 38.2 % of the PDSI variance for the period of 1911–2010. Four dry and wet periods were found in the past 260 years, respectively. The extreme dry years in our reconstruction series are consistent with the local historical document records. Our reconstruction series revealed the dry–wet changes in the Daxing'an Mountains and also was the representative of the dry–wet changes in the west-central Mongolian Plateau, especially at the decadal scale. Droughts during the 1920s–1930s in the Daxing'an Mountains were more severe than in surrounding areas. In addition, the reconstruction series showed that the Daxing'an Mountains have been getting warm and wet since the late 1970s. This is not in line with the situation in the Mongolian Plateau, especially in the transition zones. Our reconstruction also suggests that the MADA by Cook et al. (2010) may not be accurate in the Daxing'an Mountains likely due to the insufficient spatiotemporal distribution of the tree-ring data in this area. Overall, drought variability in the central Daxing'an Mountains and its relationship with the surrounding areas might be driven by climate oscillations of the Pacific and Atlantic oceans (e.g., ENSO, PDO, AMO, NAO and SNAO). These large-scale climate oscillations affect the Asian monsoon and then lead to dry and wet changes in the Daxing'an Mountains.
The PDSI reconstruction in the central Daxing'an Mountains will be uploaded to NOAA, and all the data published in this study will be available for non-commercial scientific purposes.
The supplement related to this article is available online at: https://doi.org/10.5194/cp-14-1213-2018-supplement.
For this article, XW and SH initiated the study, LZ and QY performed field sampling and data preprocessing, LZ performed statistical analyses and wrote the manuscript, DJC and SH wrote partial discussion and revised the whole manuscript, and XW performed partial analyses and produced figures.
The authors declare that they have no conflict of interest.
This research was supported by the Key Project of the China National Key
Research and Development Program (2016YFA0600800), the National Natural
Science Foundation of China (nos. 41471168 and 31770490), the Program for
Changjiang Scholars and Innovative Research Team in University (IRT-15R09)
and the Fundamental Research Funds for the Central Universities
(2572016AA32). We also thank Yongxian Lu and Lei Zhang of Northeast Forestry
University for their assistance in the field.
Edited by: Nathalie Combourieu Nebout
Reviewed by: two
anonymous referees
Bao, G., Liu, Y., Liu, N., and Linderholm, H. W.: Drought variability in eastern Mongolian Plateau and its linkages to the large-scale climate forcing, Clim. Dynam., 44, 717–733, 2015.
Bates, G. T.: Influence of the Atlantic multidecadal oscillation on the winter climate of East China, Adv. Atmos. Sci., 24, 126–135, 2007.
Chen, F., Yuan, Y., Wei, W., Yu, S., and Zhang, T.: Tree ring-based winter temperature reconstruction for Changting, Fujian, subtropical region of Southeast China, since 1850: linkages to the Pacific Ocean, Theor. Appl. Climatol., 109, 141–151, 2012.
Chen, F., Yuan, Y., Wei, W., Yu, S., Zhang, T., Shang, H., Zhang, R., Qin, L., and Fan, Z.: Tree-ring recorded hydroclimatic change in Tienshan mountains during the past 500 years, Quaternary Int., 358, 35–41, 2015.
Cook, E. R. and Kairiukstis, L. A.: Methods of dendrochronology: applications in the environmental sciences, Kluwer Academic Publishers, Dordrecht, 394 pp., 1990.
Cook, E. R., Anchukaitis, K. J., Buckley, B. M., D'Arrigo, R. D., Jacoby, G. C., and Wright, W. E.: Asian monsoon failure and megadrought during the last millennium, Science, 328, 486–489, 2010.
Dai, A.: Characteristics and trends in various forms of the Palmer Drought Severity Index during 1900–2008, J. Geophys. Res.-Atmos., 116, D12115, https://doi.org/10.1029/2010JD015541, 2011.
Dai, A.: Increasing drought under global warming in observations and models, Nat. Clim. Change, 3, 52–58, 2013.
Davi, N., Jacoby, G., Curtis, A., and Baatarbileg, N.: Extension of Drought Records for Central Asia Using Tree Rings: West-Central Mongolia, J. Climate, 19, 288–299, 2006.
Dong, A., Wang, J., and Li, Y.: The Disaster and Causes of Serious Drought in Seven Provinces of Northern China in 1920, J. Arid Meteorol., 31, 750–755, 2013.
Feng, S. and Hu, Q.: How the North Atlantic Multidecadal Oscillation may have influenced the Indian summer monsoon during the past two millennia, Geophys. Res. Lett., 35, L01707, https://doi.org/10.1029/2007GL032484, 2008.
Fritts, H. C.: Tree rings and climate, Elsevier, Amsterdam, the Netherland, 1976.
Hodell, D. A., Brenner, M., Curtis, J. H., and Guilderson, T.: Solar forcing of drought frequency in the Maya lowlands, Science, 292, 1367–1370, 2001.
Hollesen, J., Buchwal, A., Rachlewicz, G., Hansen, B. U., Hansen, M. O., Stecher, O., and Bo, E.: Winter warming as an important co-driver for Betulanana growth in western Greenland during the past century, Glob. Change Biol., 21, 2410–2423, 2015.
Holmes, R. L.: Computer-assisted quality control in tree-ring dating and measurement, Tree-Ring Bulletin, 43, 69–78, 1983.
Hong, Y., Wang, Z., Jiang, H., Lin, Q., Hong, B., Zhu, Y., Wang, Y., Xu, L., Leng, X., and Li, H.: A 6000-year record of changes in drought and precipitation in northeastern China based on a δ13C time series from peat cellulose, Earth Planet. Sc. Lett., 185, 111–119, 2001.
Jones, P. and Harris, I.: CRU TS3. 20: Climatic Research Unit (CRU) Time-Series (TS) Version 3.20 of High Resolution Gridded Data of Month-by-Month Variation in Climate (January 1901–December 2011), Clim. Res. Unit Data, 10:D0E1585D-3417, 2013.
Kalnay, E., Kanamitsu, M., Kistler, R., Collins, W., Deaven, D., Gandin, L., Iredell, M., Saha, S., White, G., Woollen, J., Zhu, Y., Leetmaa, A., Reynolds, B., Chelliah, M., Ebisuzaki, W., Higgins, W., Janowiak, J., Mo, K. C., Ropelewski, C., Wang, J., Jenne, R., and Joseph, D.: The NCEP/NCAR 40-Year Reanalysis Project, B. Am. Meteorol. Soc., 77, 437–472, https://doi.org/10.1175/1520-0477(1996)077<0437:TNYRP>2.0.CO;2, 1996.
Knudsen, M. F., Seidenkrantz, M.-S., Jacobsen, B. H., and Kuijpers, A.: Tracking the Atlantic Multidecadal Oscillation through the last 8,000 years, Nat. Commun., 2, 178, https://doi.org/10.1038/ncomms1186, 2011.
Li, J., Xie, S., Cook, E. R., Morales, M. S., Christie, D. A., Johnson, N. C., Chen, F., D'Arrigo, R., Fowler, A. M., and Gou, X.: El Niño modulations over the past seven centuries, Nat. Clim. Change, 3, 822–826, 2013.
Li, J., Shi, J., Zhang, D., Yang, B., Fang, K., and Yue, P.: Moisture increase in response to high-altitude warming evidenced by tree-rings on the southeastern Tibetan Plateau, Clim. Dynam., 48, 649–660, 2016.
Li, Q., Liu, Y., Song, H., Yang, Y., and Zhao, B.: Divergence of tree-ring-based drought reconstruction between the individual sampling site and the Monsoon Asia Drought Atlas: an example from Guancen Mountain, Sci. Bull., 60, 1688–1697, 2015.
Liang, E., Liu, X., Yuan, Y., Qin, N., Fang, X., Lei, H., Zhu, H., Wang, L., and Shao, X.: The 1920S drought recorded by tree rings and historical documents in the semi-arid and arid areas of northern China, Climatic Change, 79, 403–432, 2006.
Linderholm, H. W., Ou, T., Jeong, J. H., Folland, C. K., Gong, D., Liu, H., Liu, Y., and Chen, D.: Interannual teleconnections between the summer North Atlantic Oscillation and the East Asian summer monsoon, J. Geophys. Res.-Atmos., 116, D13107, https://doi.org/10.1029/2010JD015235, 2011.
Linderholm, H. W., Seim, A., Ou, T., Jeong, J.-H., Liu, Y., Wang, X., Bao, G., and Folland, C.: Exploring teleconnections between the summer NAO (SNAO) and climate in East Asia over the last four centuries-A tree-ring perspective, Dendrochronologia, 31, 297–310, 2013.
Liu, Y., Bao, G., Song, H., Cai, Q., and Sun, J.: Precipitation reconstruction from Hailar pine (Pinus sylvestris var. mongolica) tree rings in the Hailar region, Inner Mongolia, China back to 1865 AD, Palaeogeogr. Palaeocl., 282, 81–87, 2009.
Liu, Y., Zhang, X., Song, H., Cai, Q., Li, Q., Zhao, B., Liu, H., and Mei, R.: Tree-ring-width-based PDSI reconstruction for central Inner Mongolia, China over the past 333 years, Clim. Dynam., 48, 867–879, 2017.
Lv, S. and Wang, X. C.: Growth-climate response and winter precipitation reconstruction of Pinus sylvestris var. mongolicain A'li River of Greater Khingan Range, Journal of Northeast Normal University (Natural Science Edition), 46, 110–116, 2014.
Ma, Z.: The interdecadal trend and shift of dry/wet over the central part of North China and their relationship to the Pacific Decadal Oscillation (PDO), Chinese Sci. Bull., 52, 2130–2139, 2007.
Macdonald, G. M. and Case, R. A.: Variations in the Pacific Decadal Oscillation over the past millennium, Geophys. Res. Lett., 32, 93–114, 2005.
Mann, M. E. and Lees, J. M.: Robust estimation of background noise and signal detection in climatic time series, Climatic Change, 33, 409–445, 1996.
Mann, M. E., Zhang, Z., Rutherford, S., Bradley, R. S., Hughes, M. K., Shindell, D., Ammann, C., Faluvegi, G., and Ni, F.: Global signatures and dynamical origins of the Little Ice Age and medieval climate anomaly, Science, 326, 1256–1260, 2009.
Pederson, N., Leland, C., Nachin, B., Hessl, A., Bell, A., Martin-Benito, D., Saladyga, T., Suran, B., Brown, P., and Davi, N. K.: Three centuries of shifting hydroclimatic regimes across the Mongolian Breadbasket, Agr. Forest Meteorol., 178, 10–20, 2013.
Schneider, U., Becker, A., Finger, P., Meyer-Christoffer, A., Rudolf, B., and Ziese, M.: GPCC full data reanalysis version 7.0 at 0.5: monthly land-surface precipitation from rain-gauges built on GTS-based and historic data, FD_M_V6_050, https://doi.org/10.5676/DWD_GPCC/FD_M_V7_050, 2015.
Schrier, G., Barichivich, J., Briffa, K. R., and Jones, P. D.: A scPDSI-based global data set of dry and wet spells for 1901–2009, J. Geophys. Res.-Atmos., 118, 4025–4048, 2013.
Shen, J.: Meteorological disasters dictionary of China, in: Inner Mongolia, China Meteorological Press, Beijing, 2008 (in Chinese).
Shindell, D., Rind, D., Balachandran, N., Lean, J., and Lonergan, P.: Solar cycle variability, ozone, and climate, Science, 284, 305–308, 1999.
Shuai, J., Zhang, Z., Tao, F., and Shi, P.: How ENSO affects maize yields in China: understanding the impact mechanisms using a process-based crop model, Int. J. Climatol., 36, 424–438, 2016.
Sun, J. and Liu, Y.: Drought variations in the middle Qilian Mountains, northeast Tibetan Plateau, over the last 450 years as reconstructed from tree rings, Dendrochronologia, 31, 279–285, 2013.
Sun, J., Wang, H., and Yuan, W.: Decadal variations of the relationship between the summer North Atlantic Oscillation and middle East Asian air temperature, J. Geophys. Res.-Atmos., 113, D15107, https://doi.org/10.1029/2007JD009626, 2008.
Sun, Y.: Meteorological disasters dictionary of China, in: Heilongjiang, China Meteorological Press, Beijing, China, 2007.
Trouet, V., Esper, J., Graham, N. E., Baker, A., Scourse, J. D., and Frank, D. C.: Persistent positive North Atlantic Oscillation mode dominated the medieval climate anomaly, Science, 324, 78–80, 2009.
Wang, B., Liu, J., Kim, H.-J., Webster, P. J., Yim, S.-Y., and Xiang, B.: Northern Hemisphere summer monsoon intensified by mega-El Niño/southern oscillation and Atlantic multidecadal oscillation, P. Natl. Acad. Sci. USA, 110, 5347–5352, 2013.
Wang, X. and Lv, S.: Tree-ring reconstructions of January-March streamflow in the upper Nenjiang River since 1804, China, Arid Land Geography, 4, 537–544, 2012.
Wang, X. and Song, L.: Climate-tree growth relationships of Pinus sylvestris var. mongolica in the northern Daxing'an Mountains, China, Chinese Journal of Plant Ecology, 35, 294–302, 2011.
Wang, X., Brown, P. M., Zhang, Y., and Song, L.: Imprint of the Atlantic multidecadal oscillation on tree-ring widths in Northeastern Asia since 1568, PLoS ONE, 6, e22740, https://doi.org/10.1371/journal.pone.0022740, 2011.
Wang, X., Li, Z., and Ma, K.: Decreased sensitivity of tree growth to temperature in Southeast China after the 1976/'77 regime shift in Pacific climate, Sains Malays., 43, 9–19, 2014.
Wang, Y., Cheng, H., Edwards, R. L., He, Y., Kong, X., An, Z., Wu, J., Kelly, M. J., Dykoski, C. A., and Li, X.: The Holocene Asian monsoon: links to solar changes and North Atlantic climate, Science, 308, 854–857, 2005.
Wigley, T. M., Briffa, K. R., and Jones, P. D.: On the average value of correlated time series, with applications in dendroclimatology and hydrometeorology, J. Clim. Appl. Meteorol., 23, 201–213, 1984.
Xu, H.: Daxing'an Mountains Forests in China, Science Press, Beijing, China, 1998.
Yao, Q., Brown, P. M., Liu, S., Rocca, M. E., Trouet, V., Zheng, B., Chen, H., Li, Y., Liu, D., and Wang, X.: Pacific-Atlantic Ocean influence on wildfires in northeast China (1774 to 2010), Geophys. Res. Lett., 44, 1025–1033, 2017.
Zhao, H., Zhao, X., Zhang, T., and Zhou, R.: Boundary line on agro-pasture zigzag zone in north China and its problems on eco-environment, Adv. Earth Sci., 17, 739–747, 2002.
Zhu, L., Li, Z., Zhang, Y., and Wang, X.: A 211-year growing season temperature reconstruction using tree-ring width in Zhangguangcai Mountains, Northeast China: linkages to the Pacific and Atlantic Oceans, Int. J. Climatol., 37, 3145–3153, 2017.
Zuo, J., Li, W., Sun, C., Xu, L., and Ren, H.: Impact of the North Atlantic sea surface temperature tripole on the East Asian summer monsoon, Adv. Atmos. Sci., 30, 1173–1186, 2013.