the Creative Commons Attribution 4.0 License.
the Creative Commons Attribution 4.0 License.
 | 02 Mar 2026
Drivers of the δ18O changes in Indian Summer Monsoon precipitation between the Last Glacial Maximum and pre-industrial period
Govindasamy Bala
Jesse Nusbaumer
In this study, we investigate the changes in water isotope ratios in the Indian summer monsoon precipitation (δ18Oprecip) during the Last Glacial Maximum (LGM, ∼ 21 ka Before Present) compared to the pre-industrial (PI) period, and the mechanisms driving these changes, using a general circulation model with water isotope and novel water vapor source-tagging capabilities.
During the LGM, the model simulates a substantial reduction (15 %) in monsoon precipitation over the Indian subcontinent, consistent with proxy records. This drying in LGM is associated with reduced atmospheric water vapor, a thermodynamic response to cooling, while the westerly circulation, a dynamics response, is strengthened over parts of the subcontinent. Additionally, zonal temperature gradients between a relatively less-cooled tropical Western Pacific Ocean and Indian subcontinent lead to anomalous subsidence over the Indian region, enhancing the drying. Water vapor source tagging shows that while the four dominant moisture sources for the monsoon (South Indian Ocean, Arabian Sea, Indian land recycling, and Central Indian Ocean) remained the same, their contributions were reduced during the LGM. The δ18Oprecip values over the Indian monsoon region are enriched by approximately 1 ‰ in the LGM simulation, and we find that this enrichment was not driven by the local amount effect. A decomposition analysis shows that the enrichment was primarily caused by reduced contributions from distant, isotopically depleted water vapor sources and secondarily by reduced rainout during moisture transport from the Indian Ocean.
These findings have important implications for paleoclimate reconstructions, suggesting that δ18O records from the Indian region could be indicators of broad-scale atmospheric circulation rather than being direct proxies for local precipitation amount.
- Article
(2375 KB) - Full-text XML
-
Supplement
(3867 KB) - BibTeX
- EndNote


The Indian summer monsoon (ISM) system, occurring during the months of June–September, is one of the major climate features in the world. It sustains the livelihoods of more than a billion people in the subcontinent by contributing almost 80 % of the annual precipitation in the region. Monsoons were historically viewed as regional sea breezes driven by differential heating of land and sea. However, they are now understood as interconnected components of a global monsoon system, driven by the migration of Intertropical Convergence Zone (ITCZ), influencing tropical and subtropical precipitation (Gadgil, 2003; Geen et al., 2020).
Recent decades have seen increasing ISM intensification, characterized by more frequent extreme rainfall events and increased variability, likely due to anthropogenic climate change (Krishnan et al., 2016, 2020; Chen et al., 2020; Wang et al., 2020; Katzenberger et al., 2021; Kong et al., 2022; Mukherjee et al., 2024). However, there is considerable uncertainty in these future projections (Krishnan et al., 2020). Even small changes in the monsoon patterns can adversely affect the annual rainfall (∼ 10 % reduction in the ISM precipitation from the mean is classified as drought; Shewale and Kumar, 2005), hence, it is important to understand the changes and variability in the monsoon rainfall. Paleoclimate studies using climate archives and proxy records provide crucial constraints for reducing uncertainties in future climate projections (Lohmann et al., 2020; Rehfeld et al., 2020; Tierney et al., 2020a; Brovkin et al., 2021; Kageyama et al., 2024). They are useful to understand the sensitivity of the monsoon systems to climate factors such as changes in greenhouse gases (GHG), orbital parameters, continental ice sheets, and Sea Surface Temperature (SST).
The Last Glacial Maximum-LGM, about 23 000 to 19 000 years before present, is a period of high interest in climate change studies. LGM presents a valuable case study for understanding how the Earth's climate system responded to reduced CO2, presence of the Laurentide ice sheets and ice-sheet topography, and orbital forcing. The abundance of proxy-climate records for this period facilitates comparisons between proxy data and models. Climate records from the Indian Summer Monsoon region such as, water isotope records from sedimentary cores and speleothems (Contreras-Rosales et al., 2014; Sinha et al., 2015; Kathayat et al., 2016; Liu et al., 2021) indicate that LGM was characterised by a weaker Indian Summer Monsoon. Climate modeling studies suggest that the general reduction in precipitation over the globe during the LGM is mainly due to the cooling driven by lower greenhouse gas concentrations and the expansion of ice sheets (Broccoli and Manabe, 1987, 2008; Yanase and Abe-Ouchi, 2007; Tharammal et al., 2013; Kageyama et al., 2021; McGee, 2020; Seltzer et al., 2024). Further, the associated cooler sea surface temperatures in the tropics during the LGM (MARGO Project Members, 2009; Tierney et al., 2020b) likely influenced the strength of the monsoon circulation, weakening the precipitation.
Stable isotopes of water undergo temperature-dependent fractionation during phase changes. The resulting variations in the ratios of heavy to light isotopes (δ-values) serve as powerful tracers of hydrological and atmospheric processes (Galewsky et al., 2016; Dee et al., 2023; Bailey et al., 2025). Records of water isotopes in the climate archives such as speleothems, tree rings, and sediment records are one of the major proxies in reconstructing the Indian monsoon precipitation (Yadava et al., 2004; Maher, 2008; Contreras-Rosales et al., 2014; Sinha et al., 2015; Kathayat et al., 2016). To interpret these climate records, the amount effect (Dansgaard, 1964), which is the observed inverse relationship between the ratio of oxygen isotopes in precipitation (δ18Oprecip) and the amount of precipitation in the tropical regions, is used. The amount effect is related to depletion of water vapor of heavier isotopes during intense precipitation events, especially in convectively active tropical monsoon regions (Lee and Fung, 2008; Risi et al., 2008; Tharammal et al., 2017). However, the local precipitation amount is not the only factor that determines the isotopic composition of precipitation in the tropics. It is also influenced by other factors such as, relative contributions of moisture from various water vapor sources, atmospheric circulation, and upstream convection (Breitenbach et al., 2010; Lewis et al., 2010; Pausata et al., 2011; Sjolte and Hoffmann, 2014; Zhu et al., 2017; Tabor et al., 2018; Hu et al., 2019; Konecky et al., 2019; Tharammal et al., 2023; Chakraborty et al., 2025). This complexity leads to considerable uncertainty in interpreting δ18O records from the ISM region. Further, uncertainties remain in inferring the water isotope proxy records due to low data resolution and sparse coverage.
While proxy records have been used to study past changes in the Indian monsoon (Yadava et al., 2004; Sinha et al., 2015; Dutt et al., 2015; Kathayat et al., 2016; Kaushal et al., 2018), climate model studies focussed on the Indian monsoon precipitation and water isotope ratios during the LGM are largely lacking. Recent advancements in climate models equipped with water isotope tracers in their hydrology, along with the capabilities of tracking the evaporative water (Brady et al., 2019) will enable us to find the climatic factors affecting the δ18Oprecip of monsoon precipitation, and also differentiate the moisture sources and their effects on the δ18Oprecip (Hu et al., 2019; He et al., 2021; Kathayat et al., 2021; Tharammal et al., 2023). Therefore, applying these novel modeling techniques to resolve the drivers of δ18Oprecip change in the Indian region during the LGM is a key research gap that this study aims to fill.
In this study, we examine the mechanisms behind the changes in the monsoon precipitation and water isotope ratios in the ISM region during the LGM using a climate model with water isotope and novel water vapor source-tagging capabilities. We will analyse the responses of water isotopes in precipitation, and moisture sources to the glacial climate, and importantly, identify the major physical processes influencing the changes in the isotopic ratios of precipitation. We will analyse the relative importance of the “amount effect” compared to changes in moisture source and transport in influencing the δ18Oprecip values during the LGM.
The paper is structured as follows: in Sect. 2, we introduce the model simulations and methods. Section 3 includes the assessment of model performance under the PI climate, analysis of changes in the monsoon, water vapor sources, and isotope ratios of precipitation in the LGM simulation. Section 4 includes a discussion of the results and main conclusions of the study.
2.1 Climate Model
Our study uses the Community Earth System Model, CESM version 1.2 with water isotope tracking capabilities (iCESM; Brady et al., 2019) from the National Center for Atmospheric Research (NCAR) for the climate simulations. Atmospheric and land components of the iCESM are isotopic versions of the Community Atmosphere Model CAM version 5.3 and Community Land Model CLM version 4, respectively. The sea-ice model in the iCESM is Los Alamos Sea Ice Model version 4 (CICE4), which is run in prescribed sea ice mode for the simulations presented here. The isotope tracking in the model is facilitated with the inclusion of a parallel hydrologic cycle for the water isotope tracers in the iCESM. It follows the water isotope ratios, fluxes, and isotopic fractionations on phase changes in the components of the hydrologic cycle.
iCESM has proven successful in reproducing the present global distribution of isotopes in precipitation (Brady et al., 2019). Further, the model includes a tagging feature for the evaporated water and can be used to track the sources of water vapor for precipitation in a sink region. The model was successfully used in several studies to reconstruct the past and present climate and isotope ratios in precipitation, and to track the sources of water vapor in various tropical regions (Tabor et al., 2018; Hu et al., 2019; He et al., 2021; Windler et al., 2020; Tharammal et al., 2023)
2.2 Experiments
We conducted two time-slice simulations for the current study, (a) the pre-industrial (PI) control experiment and (b) the LGM simulation, with prescribed SSTs, sea ice extent, and prescribed ocean surface isotopic ratios.
The isotopic composition of meteoric water is represented by the delta (δ) value in permil (‰) units in the paper, denoting the relative abundance of the ratio of heavy isotope to the light isotope in a sample with respect to a geochemical standard (VSMOW-Vienna Standard Mean Ocean Water).
Accordingly, δ18O is . R is the ratio of heavy to the light isotope, 18O 16O. RVSMOW is the standard isotope ratio.
For the PI simulation, the orbital conditions, GHG, SST, sea ice extent, and aerosol boundary conditions are set at the year 1850. The GHG and orbital boundary conditions of the experiments are given in Table S1 in the Supplement. The SST and sea ice fraction data for the PI experiment are derived from the corresponding coupled CESM simulation (Zhu and Poulsen, 2021). A uniform sea-surface δ18O of 0.5 ‰ is prescribed for the control simulation. This is an approximate value based on present-day observations and is close to the observed surface values of the tropical and subtropical oceans (Hoffmann and Heimann, 1997; LeGrande and Schmidt, 2006; Lee and Fung, 2008).
For the LGM simulation, we follow the Paleoclimate Modelling Intercomparison Protocol version 4 (PMIP4; Kageyama et al., 2021), and the GHG, orbital parameters, land-sea mask, and surface topography are set to 21 ka BP conditions. The ice sheet extent and topography for the LGM experiment (Fig. S1a) are derived from the ICE-6G ice sheet reconstructions by Peltier et al. (2015). The coastlines for the LGM experiment are adapted from the ICE-6G reconstruction and represent a lowering of sea level by 120 m during the LGM (Lambeck et al., 2014). The SST and sea ice fraction for the LGM simulation (Fig. S1b, c) are obtained from the CESM coupled LGM simulation (Zhu and Poulsen, 2021). The formation of large continental ice sheets during the LGM led to enrichment of heavier isotopes in the seawater oxygen isotope ratios (ice-volume effect; Lambeck, 2000). It is widely accepted that the sea surface water isotope ratios during the LGM were approximately 1 ‰ enriched compared to the pre-industrial values (Duplessy et al., 2002; Sima et al., 2006). We represent this in the LGM simulation by prescribing a uniform sea surface enrichment of water isotopes by 1 ‰ for δ18O, compared to the PI value.
Further, to identify the effects of water vapor sources on the monsoon precipitation and water isotopes during the LGM, we tag the evaporated vapor from 17 ocean and land regions in and around the ISM region in both the PI and the LGM experiments (tagged regions are shown in Fig. S2a). The simulations are run for 30 years, and the last 20 years are used for the analysis.
2.3 Monsoon circulation indices and moisture budget analysis
2.3.1 Monsoon circulation indices
Strength of the monsoon circulation can be estimated using various indices (Li et al., 2024). We calculate the monsoon circulation strength in PI and LGM simulations using the following six indices selected to capture both circulation changes and water vapor transport related to the monsoon precipitation. The geographical domains used for the estimation of these indices are shown in Fig. S2b.
-
The Somali jet index (Boos and Emanuel, 2009), which is calculated as the square root of twice the domain mean kinetic energy () of the 850 hPa horizontal wind over the region, [5° S–20° N, 50–70° E].
-
The hydrological index, following (Fasullo and Webster, 2003), calculated by averaging the Vertically Integrated Moisture Transport (VIMT) in the Indian Ocean-Arabian Sea region, [20° S–30° N, 40–100° E]. VIMT is the total horizontal movement of water vapor in a vertical column of the atmosphere, and we calculate the term from the surface up to 300 hPa.
Magnitude of VIMT is,
Where P is atmospheric pressure, g is gravity, q is the specific humidity, and V is the wind vector with zonal and meridional components u and v.
-
Mid-tropospheric temperature gradient (ΔTT), defined as the tropospheric temperature difference between a northern region and a southern region in the larger monsoon domain (Xavier et al., 2007). ΔTT signifies the cross-equatorial temperature gradient, and the onset of the ISM is defined as the time when ΔTT changes from negative to positive.
-
The vertical shear of zonal winds, following (Webster and Yang, 1992), calculated as the difference between 200 and 850 hPa zonal winds (U200 − U850), averaged over the region 10–30° N, 50–95° E.
-
The meridional shear of the 850 hPa zonal wind (barotropic shear, ) over the region 10–26° N, 70–90° E that indicates magnitude of the cyclonic shear of the low-level monsoon circulation.
-
Various studies (Xue et al., 2003; Kripalani et al., 2007; Vidya et al., 2020; Azhar et al., 2023) highlight a strong dependence of ISM circulation strength on the sea level pressure difference between the Mascarene High in the Southern Indian Ocean (MH; 20–40° S, 45–100° E) and the wider ISM region (10–35° N, 45–100° E). Therefore, this sea level pressure difference is also treated as an ISM index for this study.
2.3.2 Moisture budget calculations
To understand the mechanisms driving the changes in monsoon precipitation, we conducted a moisture budget analysis based on the framework of (Chou and Lan, 2012). In this analysis, the net precipitation over a region (Precipitation − Evaporation, P−E) is balanced by the vertically integrated moisture flux convergence in steady state conditions.
This convergence term is then decomposed into contributions from vertically integrated horizontal advection- the transport of water vapor q by horizontal winds, , and vertical advection- the transport of moisture by vertical atmospheric motion , such that:
The angle brackets denote pressure, mass-weighted vertical integration. u, v, and ω are the zonal, meridional, and vertical wind components.
A further decomposition of the advection terms into thermodynamic and dynamic components to differentiate the contributions from the changes in water vapor and circulation (e.g. Chou et al., 2009; Chou and Lan, 2012) was not performed, as it is beyond the scope of this study.
2.4 Decomposition of δ18Oprecip changes
To diagnose the mechanisms driving the changes in precipitation-weighted δ18Oprecip in the ISM region between the LGM and PI simulations, we perform a decomposition analysis following the framework of Tabor et al. (2018). Using our water vapor tagging results, this method expresses the total change in precipitation-weighted δ18Oprecip (δ18Op in the equations below) in the ISM domain as the sum of contributions from each of the 17 tagged source regions.
where δ18O is the isotopic ratio of precipitation at the ISM domain of water vapor source i, and () is the relative contribution of precipitation from source i to the total precipitation at the ISM domain.
Further, the decomposition method isolates two primary effects on the change in each δ18O between LGM and PI: (1) contributions from changes in the isotopic composition of each source tag between LGM and PI (First term on the right in Eq. 5), and (2) the effect of changes in the relative precipitation contribution from the water vapor sources (Second term on the right in Eq. 5).
For each tag, the first term on the right can further be decomposed to three isotopic effects: (i) the source effect, due to changes in δ18O of water vapor at the source region, (ii) rainout effect, the changes in δ18O of source tags due to changes in rainouts on the path, and (iii) condensation effect, the enrichment of δ18O at the sink during condensation from the ambient vapor. The three terms are calculated as:
δ18O and δ18O are the isotope ratios of water vapor at 850 hPa (representing low level vapor, also level of monsoon low-level jet) of each tag at their source and at the Indian sink, respectively.
Hence, we can quantitatively assess the driving mechanisms responsible for the difference in total precipitation δ18Oprecip between the LGM and PI climates.
3.1 PI control simulation
3.1.1 Monsoon in the PI control climate
The model successfully simulates both the annual cycle and the summer monsoon (mean of June–July–August–September, JJAS) precipitation, also the south westerly winds over the ISM domain (8–30° N and 65–88° E; Fig. 1). The summer monsoon precipitation accounts for approximately 80 % of the total annual precipitation, in agreement with the GPCP observational data (Adler et al., 2018). However, the iCESM overestimates the summer monsoon precipitation by ∼ 20 % (Fig. 1c). This wet bias has been reported in previous studies that used the CESM model (e.g. Pathak et al., 2019; Hanf and Annamalai, 2020) and they attribute this bias to factors such as, model resolution, biases in simulated circulation, and convective parameterizations.
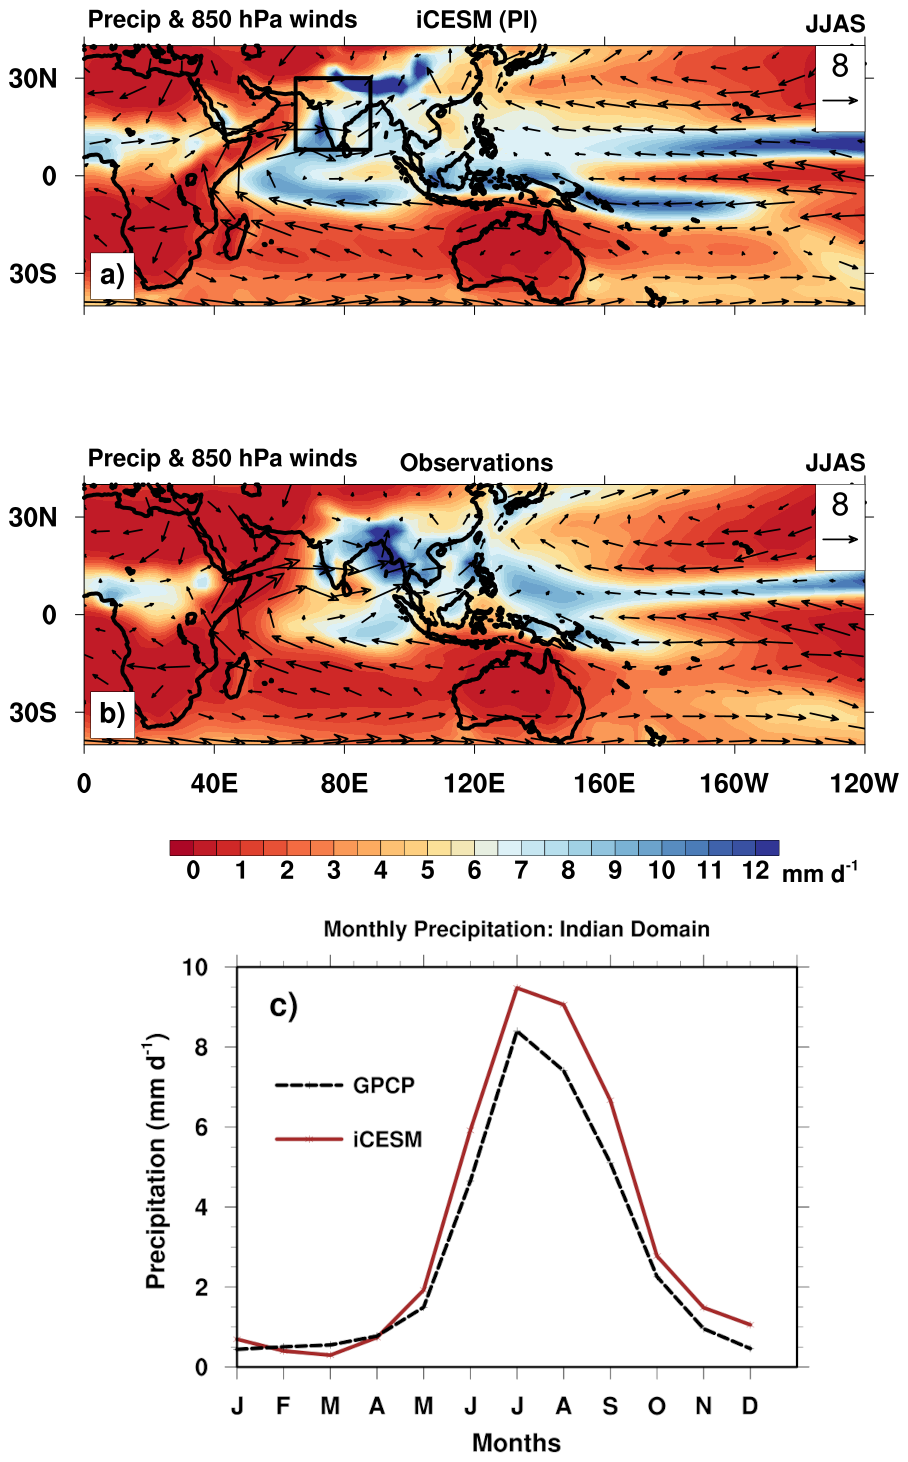
Figure 1Model-simulated and observed precipitation (shaded, mm d−1) and 850 hPa winds (vectors in m s−1, reference vectors are shown in the panels) for the summer monsoon season (mean of June–July–August–September – JJAS). Panel (a) shows the simulated JJAS mean precipitation and 850 hPa winds from the iCESM Pre-Industrial (PI) simulation. Panel (b) shows the corresponding JJAS long-term mean precipitation from GPCP (Adler et al., 2018) and 850 hPa winds from ERA5 reanalysis (1980–2000; Hersbach et al., 2020). Panel (c) shows the monthly mean precipitation averaged over the land grid cells in the Indian domain (8–30° N, 65–88° E); black box in panel (a), comparing the iCESM simulation with GPCP observations.
3.1.2 Water isotopes in the PI monsoon precipitation
The domain mean water isotope ratio of precipitation (precipitation weighted, δ18Oprecip, Fig. 2a) over the ISM region during the JJAS season in the PI simulation is −7 ‰. This is considerably more negative than the mean of −3.7 ‰ calculated from the available GNIP observational data over the domain (Fig. 2a). A likely reason for the more negative δ18Oprecip values simulated in the ISM region is the wet bias in the model (Fig. 1c) and consequent depletion of the heavier isotopes, as also suggested by previous studies using isotope-enabled CAM and iCESM models (Nusbaumer et al., 2017; Tharammal et al., 2017, 2023). It should be noted, however, that while the simulated domain-mean δ18Oprecip shows a negative bias, the spatial pattern compares well with several GNIP stations across India. However, a lack of wider observational networks and continuous monitoring of seasonal δ18Oprecip values hinder a comprehensive comparison of the observations and our simulation.
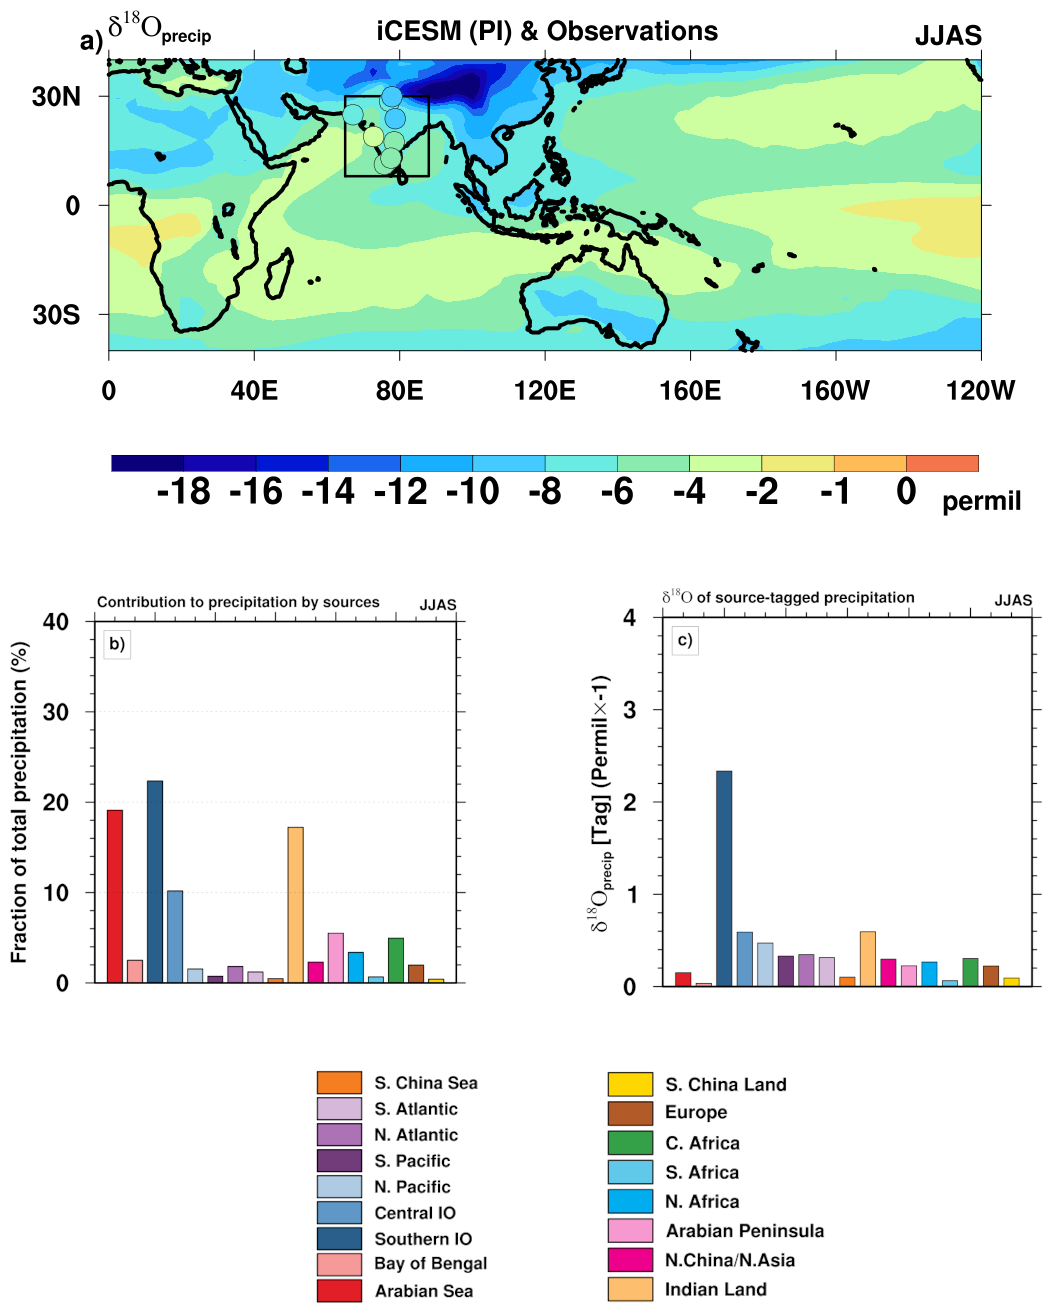
Figure 2Isotopic composition of precipitation (δ18Oprecip) for the Indian summer monsoon season in the pre-industrial (PI) simulation, shown along with relative contribution of precipitation from the tagged sources, and their δ18O values in precipitation (weighted by relative contribution of precipitation). Panel (a) shows the mean JJAS δ18Oprecip (shading, in permil [‰]). The filled circles in the Indian domain (8–30° N, 65–88° E); shown in black box in panel (a) represent long-term JJAS mean observational data from Global Network of Isotopes in Precipitation (GNIP) stations. Panel (b) shows the relative contribution (, in %) of precipitation to the Indian summer monsoon domain from 17 tagged water vapor source regions. Panel (c) shows the δ18Oprecip of tagged precipitation from the 17 different source regions that contribute to the Indian monsoon precipitation. The y-axis values in panel (c) are multiplied by −1 for visualization purposes (units of −‰).
In the PI simulation, the linear regression analysis between the JJAS mean δ18Oprecip values and the precipitation amount show a moderate amount effect in the ISM region (−0.22 ‰ (mm d−1)−1 slope of the spatial amount effect, the square of the Pearson correlation coefficient r2 0.37, Fig. S3). The moderate strength of this relationship, which is physically related to rainout during heavy rainfall and convective events (Lee and Fung, 2008; Risi et al., 2008; Tharammal et al., 2017), suggests that factors other than local precipitation amount also strongly influence the simulated δ18Oprecip values. These may include large-scale circulation, upstream convection, or the effects of water vapor sources with differing isotope signatures (Risi et al., 2008; Pausata et al., 2011; Tharammal et al., 2023), as discussed in the following section.
3.1.3 Water vapor sources and their effect on δ18Oprecip in the PI climate
We used source water tagging to identify the primary water vapor sources for ISM precipitation in the PI simulation. Our simulation shows that the 17 tagged source regions (Fig. S2) contribute approximately 96 % of the total JJAS precipitation (Fig. 2b). Four major sources – the South Indian Ocean (SIO) and Central Indian Ocean – CIO (22 % and 10 % respectively), Arabian Sea (19 %), and Indian land recycling (17 %), together account for ∼ 68 % of the total precipitation. The Bay of Bengal (BOB) contributes only ∼ 3 % to the ISM precipitation. These results are consistent with previous water vapor tracking studies in the ISM domain using Lagrangian models (e.g. Gimeno et al., 2010, 2012; Ordóñez et al., 2012; Pathak et al., 2014; Dey and Döös, 2021) and present-day results using the iCESM model (Tharammal et al., 2023).
The precipitation contribution-weighted sum of δ18O of all the 17 tags at the sink (−6.7 ‰, based on Eq. 4) explains ∼ 95 % of the domain mean δ18Oprecip in the ISM region (−7 ‰, cf. Sect. 3.1.2), which validates our source-tagging framework (Eq. 4, Fig. 2c). The results show substantial differences in the isotope signatures between the major sources, mainly influenced by transport distance. For instance, while the Arabian Sea and SIO contribute comparably to JJAS precipitation (19 % and 22 %, respectively), their water isotopic signatures in precipitation (δ18O) greatly differ. The Arabian Sea source is relatively enriched (−0.1 ‰ mean over the ISM region), whereas the SIO has much depleted δ18O values of −2.5 ‰ (Fig. 2c). This is likely due to the larger distance of the SIO source from the ISM sink region and consequent depletion of the vapor during condensation and rainouts in the path. Similarly, the evapotranspiration from the ISM land domain, recycling source, contributes 17 % to the total precipitation, and the δ18O values of recycling are comparatively enriched (−0.6 ‰), likely due to being the local source of vapor. Hence, we suggest that the isotopic composition of ISM precipitation is sensitive to the relative contributions of these dominant water vapor sources and their isotopic signatures.
3.2 Global climate response in the LGM simulation
In the LGM simulation, the annual global mean surface temperature cooled by 6.75 °C compared to the PI (Fig. S4a). While this cooling is consistent with coupled CESM simulations (−6.8 °C; Zhu et al., 2017; Tierney et al., 2020b), it is greater in magnitude than the PMIP4 multi-model mean (Kageyama et al., 2021). The cooling is more pronounced over the Laurentide ice sheets and in the polar regions, due to ice sheet albedo feedback and polar amplification. This leads to an asymmetry in the annual cooling between the two hemispheres, with Northern Hemisphere (NH) cooling (−7.5 °C) exceeding that of the Southern Hemisphere (SH; −6.0 °C) (ΔTS = 1.4 °C). This interhemispheric asymmetry in cooling is smaller than previous modeling studies that found values more than 3 °C (Broccoli, 2000). The simulated cooling in the high latitude ocean regions (∼ 5 to 6 °C, Fig. S1a) agrees well with the proxy-reconstructions (MARGO Project Members 2009). However, the model simulates colder SSTs in the tropics compared to the MARGO and GLOMAP reconstructions as noted by previous studies (∼ 3 °C in CESM simulations versus ∼ 1.5 °C; Tierney et al., 2020b).
Globally, the annual mean precipitation reduces by ∼ 12 % (Fig. S4b) in the LGM, consistent with proxy records and modeling studies including the PMIP4 LGM simulations (Bartlein et al., 2011; Yan et al., 2016; DiNezio et al., 2018; Kageyama et al., 2021). This reduction corresponds to a global hydrological sensitivity of ∼ 1.8 % °C−1 of cooling, and is close to the estimated thermodynamic increase in global precipitation of 2 % per unit increase in temperature (Trenberth, 2011). Despite the reduction in global mean precipitation, an increase in precipitation is simulated in some regions such as, tropical Pacific, parts of N. America, and South Africa, and these patterns are also found in the PMIP4 simulations (Kageyama et al., 2021).
Furthermore, we find that the position of the annual mean Intertropical Convergence Zone (ITCZ), defined as the median of zonal precipitation (20° S–20° N; McGee et al., 2014; Devaraju et al., 2015), shifts northward by 1.2° in the LGM simulation. This finding contrasts with the southward shift of ITCZ in the LGM reported in many of the PMIP4 models (Wang et al., 2023), but is consistent with results from CESM2 (Zhu et al., 2022; Lofverstrom and Zhu, 2023) as also reported in Wang et al. (2023). Lofverstrom and Zhu (2023) attribute this possible bias in the LGM ITCZ shift to biases in the CESM's cloud microphysics. It is likely that the simulated northward displacement of the ITCZ in the LGM in our simulation is due to a robust increase in precipitation over the northern tropical Pacific, coupled with widespread drying in the Southern Hemisphere tropical regions (Fig. S4b).
3.3 Indian summer monsoon precipitation during the LGM
The LGM simulation shows a substantial reduction in the Indian summer monsoon precipitation (Fig. 3), characterized by widespread drying over India, SE Asia, and Arabian Peninsula region. The precipitation amount is reduced by ∼ 15 % over the ISM domain, which is notable since a precipitation deficit exceeding 10 % from the long-term mean is considered drought conditions in India (Shewale and Kumar, 2005). The ISM precipitation responses in the LGM simulation are broadly consistent with both monsoon proxy-records and previous climate model simulations (Yan et al., 2016; Kageyama et al., 2021). The large-scale drying is primarily due to regional and global cooling in both annual and summer means (Figs. S4a and S5a) and generally reduced evaporation from the tropical oceans (Fig. S5b). These patterns are linked to decreased atmospheric humidity and reduced column-integrated precipitable water (reduction of 25.2 % over the ISM domain, Fig. S6). However, the drying during the summer monsoon season is not uniform across the region. Increased precipitation is simulated in the east part of India and the Bay of Bengal (Fig. 3). As this increase cannot be explained by the precipitable water anomalies in the LGM (Fig. S6), it is likely driven by changes in atmospheric circulation.
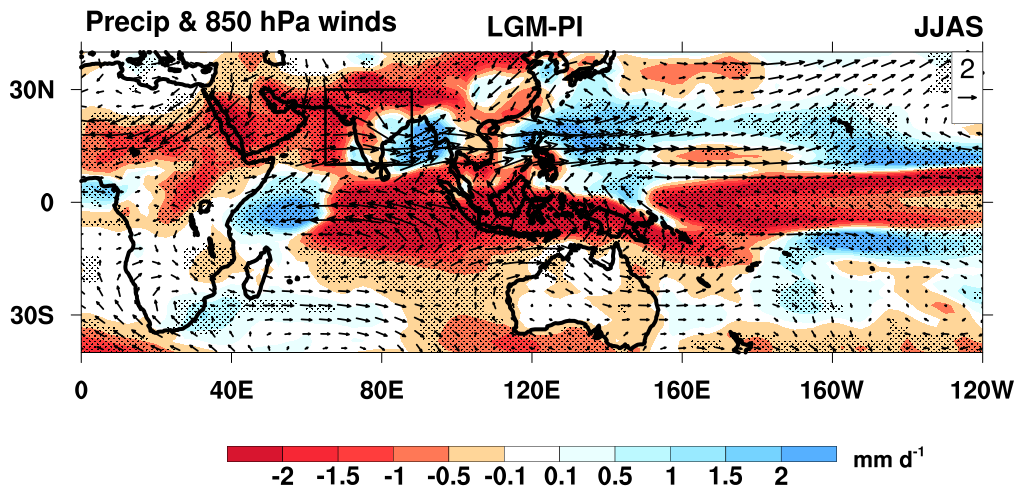
Figure 3The simulated differences in JJAS mean precipitation (shaded, in mm d−1) and low-level winds (850 hPa, vectors shown in m s−1) between the pre-industrial and the Last Glacial Maximum (LGM) simulations, shown as LGM-PI. The Indian domain is shown in black box. Regions where the anomalies are statistically significant at the 95 % confidence level are stippled. Significance level is estimated using a Student's t test from a sample of 20 annual means from the control and LGM simulations.
Monsoon circulation changes in the LGM and moisture budget
A regional intensification of the low-level westerly winds is simulated across the central and southern parts of India and the Bay of Bengal (Figs. 3 and S7b). This regional intensification of the monsoon circulation is captured by several monsoon circulation indices used in this study- an increased vertical shear of zonal winds, strengthening of the Somali Jet, and enhanced barotropic shear (Fig. 4b, d, f, respectively). We suggest the enhanced westerly circulation in parts of the monsoon region, especially the Somali jet, is influenced by a stronger Mascarene high in the Southern Indian Ocean (Figs. 4e and S8b) that enhances the pressure gradient between the Indian land and the Southern Indian Ocean by ∼ 2 mbar (Figs. S8b and 4e). The strengthened Mascarene high is likely associated with the sea ice extension and cooling in the Southern Indian Ocean during the LGM (Fig. S1b, c). This agrees with the positive relationship between the ISM circulation and pressure gradient between the Indian monsoon region and the Mascarene high, suggested by several previous studies (Kripalani et al., 2007; Vidya et al., 2020; Azhar et al., 2023). However, the tropospheric temperature gradient (ΔTT), shows a weakening by 2.5 % in the LGM. This indicates a weaker thermal forcing of the monsoon, likely due to enhanced cooling in the northern box used for the estimation of ΔTT (Figs. S2b and S5a), in the LGM simulation.
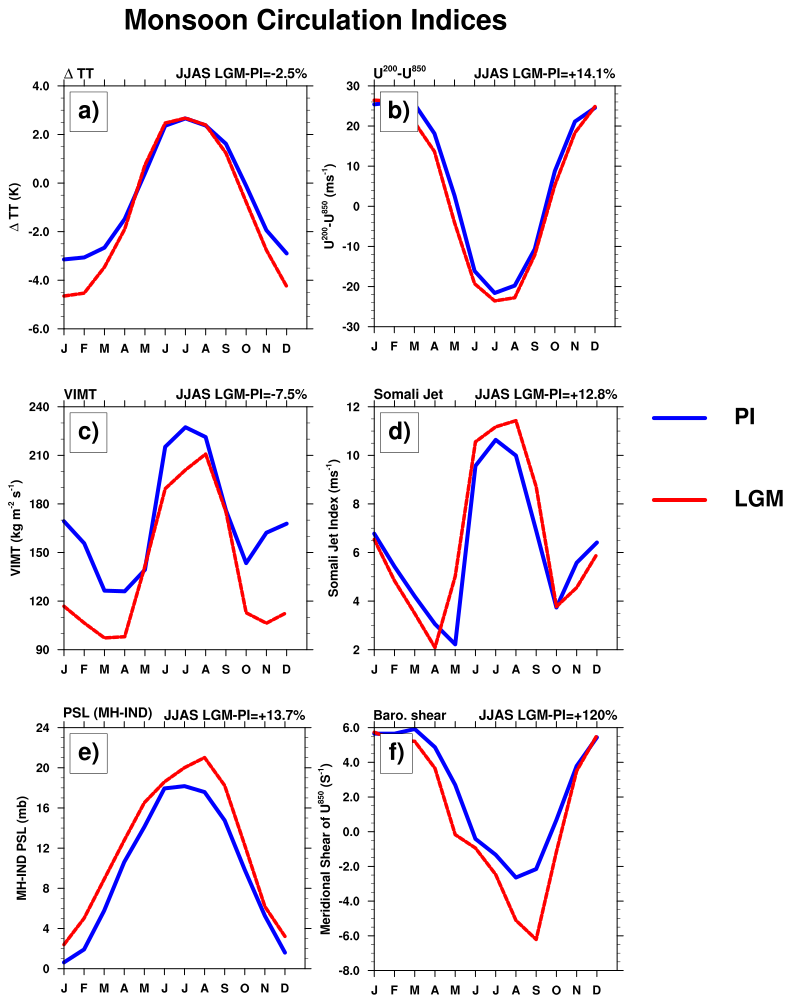
Figure 4Monsoon circulation indices calculated from the monthly means of PI and LGM simulations. The geographical areas for the calculations are shown in Fig. S2b. JJAS mean values of differences between LGM and PI as (LGM-PI) in % is shown in the right top of each panel. Panel (a) shows the tropospheric temperature gradient (ΔTT) between the northern box (10–35° N, 30–110° E) and the southern box (15° S–10° N, 30–110° E). Panel (b) shows the vertical shear of zonal winds (u in m s−1) calculated as the change between U850 and U200 (U850 − U200) averaged over the region (10–30° N, 50–95° E). Panel (c) shows the hydrological index, calculated by averaging the Vertically Integrated Moisture Transport (VIMT) in the Indian Ocean-Arabian Sea region, 20° S–30° N, 40–100° E. Panel (d) shows Somali jet speed index, calculated as the square root of twice the area-averaged kinetic energy of 850 hPa horizontal winds over the region (5° S–20° N, 50–70° E). Panel (e) shows the mean sea-level pressure difference between the Mascarene high (MH; 20–40° S, 45–100° E) and the wider Indian summer monsoon region (10–35° N, 45–100° E). Panel (f) shows the barotropic shear estimated over 10–26° N, 70–90° E.
We also calculated corresponding monsoon indices from the coupled iCESM model results for the LGM and PI simulations (Fig. S9: Tierney et al., 2020b; Zhu and Poulsen, 2021). The coupled model results, except for ΔTT index, are largely consistent with our fixed-SST iCESM simulations, with the indices indicating a strengthened Somali jet, enhanced barotropic shear, an intensified Mascarene High, reduced VIMT, and enhanced vertical shear of the zonal winds in the LGM simulation. The ΔTT estimated from the coupled simulation shows an opposite response compared to the iCESM results, although the magnitude of the response in both is small (−2 % in iCESM versus +5 % in the coupled simulation).
Although the strengthening of the westerlies dominates over most of the monsoon domain, a weakening of the low-level (850 hPa) westerly circulation and wind speeds towards land is simulated over the Northern Arabian Sea (Figs. 3 and S7b). This is driven by substantially weakened land-ocean thermal (Fig. S5a, larger cooling over the land) and pressure gradients (Fig. S8b; Roxy et al., 2015; Weldeab et al., 2022). Surface cooling over the Indian subcontinent (domain mean −4.5 °C; Table S2) in the LGM is approximately 1 °C greater than the sea surface temperature cooling in the neighbouring Arabian Sea, which is consistent with the lower heat capacity of land, leading to more pronounced cooling and enhanced surface pressure over land.
The indices related to monsoon circulation (vertical shear of zonal winds, Somali jet speed index, pressure gradient between MH and ISM regions that characterize dynamical responses (Fig. 4)) show a general strengthening of the monsoon circulation by ∼ 12 %–15 % in the LGM simulation, compared to the PI. The barotropic index shows an even larger percentage change between LGM and PI of > 100 %. However, the index related to water vapor content and its transport (the monsoon hydrological index and Vertically Integrated Moisture Transport VIMT that characterize thermodynamical responses; Figs. 4c and S10; Fasullo et al. 2003) shows a reduction by 7.5 %, along with a reduction of column-integrated precipitable water over the ISM region by ∼ 25 % (Fig. S6). This shows that the reduction in the ISM precipitation in the LGM simulation is mainly due to the thermodynamic response to the cooling (reduced water vapor in the atmosphere), despite an enhanced dynamical response (circulation changes).
To understand the drivers of the regional precipitation changes, we analysed the surface moisture budget (net precipitation, P−E), decomposing it into contributions from horizontal and vertical advection of moisture (Sect. 2.3; Chou and Lan, 2012). The analysis (Fig. 5) shows that the drying over most parts of the ISM domain is primarily driven by the reduction in horizontal moisture advection (Fig. 5b), reflecting both reduced atmospheric humidity and weakened moisture transport. Further, the vertical advection term (Fig. 5c) also contributes to drying over north and west regions in India, indicating suppressed upward motion in this region. This is due to both the reduction in the moisture availability, and reduced transport as discussed before. In contrast, the increased precipitation in eastern part of India and BOB in the LGM is caused by enhanced moisture convergence and vertical advection (Fig. 5c) linked to the intensified monsoon westerlies in that region. We note that these results for the advection terms include both dynamic and thermodynamic responses (Chou and Lan 2012) and delineating them is out of the scope of this paper.
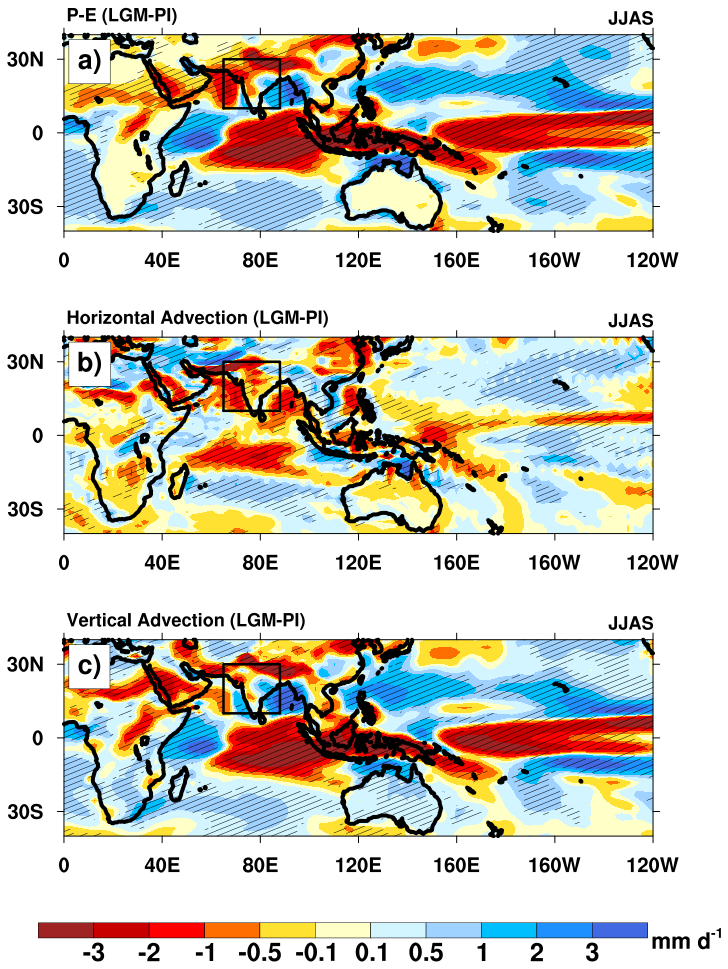
Figure 5Changes in the JJAS mean atmospheric moisture budget between the LGM and the PI simulations, shown as LGM-PI. The panels show the components of the vertically integrated moisture budget anomaly: Panel (a) shows anomalies in precipitation minus evaporation (P−E). Panel (b) shows anomaly in horizontal water vapor advection (). Panel (c) shows anomaly in vertical water vapor advection (). V is the horizontal wind, q specific humidity, p atmospheric pressure, and ω pressure velocity. The Indian monsoon domain is shown in black boxes in the panels. All panels have the units of mm d−1. The hatching shows regions where the anomalies are statistically significant at the 95 % confidence level. Significance level is estimated using a Student's t test from a sample of 20 annual means from the control and LGM simulations.
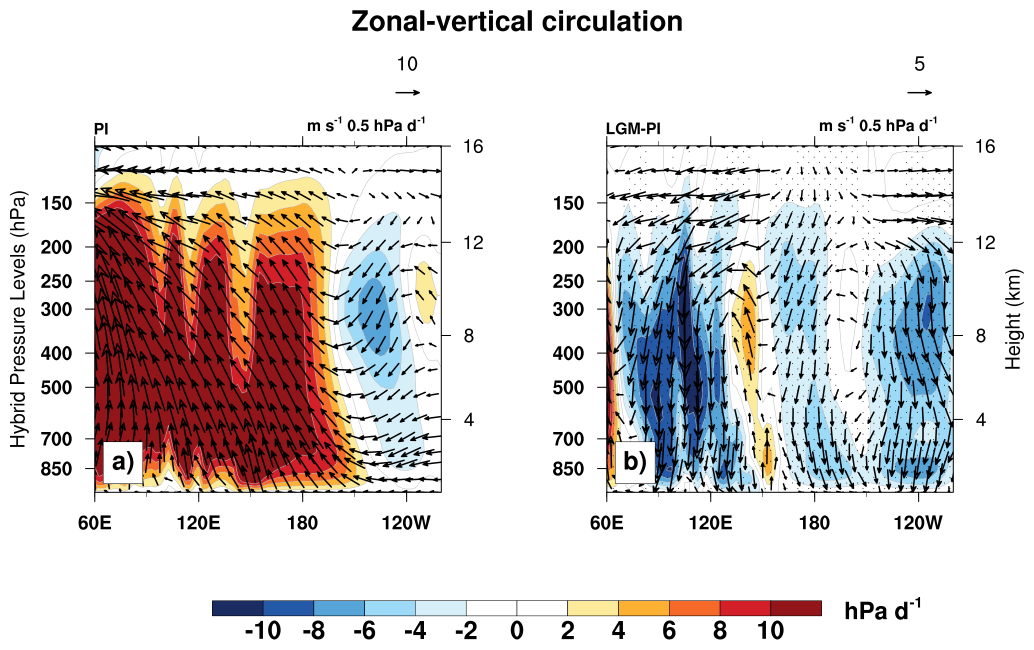
Figure 6The tropical zonal circulation during the JJAS season, averaged between 10° S and 10° N. Panel (a) shows the circulation in the PI control simulation, and the right panel (b) shows the anomalies between the LGM and PI simulations (as LGM-PI). In both panels, shading represents the vertical pressure velocity (−ω), where blue shading indicates downward motion and red shading indicates upward motion. The vectors show the zonal-vertical circulation, composed of zonal wind (u, in m s−1) and vertical pressure velocity (−ω), with the ω scaled by 0.5 hPa d−1 for visualization. The reference vectors are shown in the top right of the panels. The stippling in panel (b) shows regions where the anomalies are statistically significant at the 95 % confidence level. Significance level is estimated using a Student's t test from a sample of 20 annual means from the control and LGM simulations.
The ISM precipitation reductions are also associated with large-scale zonal temperature gradients between a cold tropical western Pacific Ocean and a relatively colder Indian subcontinent (Fig. S5a). This leads to anomalous updrafts over the western Pacific, and increased subsidence over the Indian region (Figs. 6b and S11b, d). The relationship between a warmer W. Pacific and drying over the Indian region is discussed in previous studies (Annamalai et al., 2013). Furthermore, the Western tropical Pacific is ∼ 1.5 °C warmer compared to the Central and Eastern tropical Pacific in the LGM simulation (Fig. S5a). This intensifies the Pacific Walker circulation further and enhances the subsidence and drying over the Eastern Pacific and the Indian subcontinent in the LGM. We suggest this large-scale circulation response enhanced the drying over India in the LGM simulation.
3.4 Monsoon water vapor sources under glacial conditions
In the LGM simulation, the major four sources – SIO, Arabian Sea, recycling, and CIO – remain unchanged (23 %, 21 %, 19 %, and 10 % contributions to total precipitation, respectively) and their relative contributions change by less than 4 % compared to the PI (Fig. 7b). However, the absolute amount of moisture from each source decreases by 10 %–14 % (Fig. 7a). This reduction is primarily driven by reduced evaporative fluxes over the source regions (up to ∼ 50 % from the PI values; Fig. S5b, Table S2) and a general weakening of the moisture transport (Fig. S8b). The reduction in horizontal advection term over the ISM region in the moisture budget (Fig. 5b) corroborates with these results. This suggests that changes in atmospheric circulation and cooling of sea surface temperatures during the LGM significantly impacted the availability and transport of moisture to the Indian monsoon region.
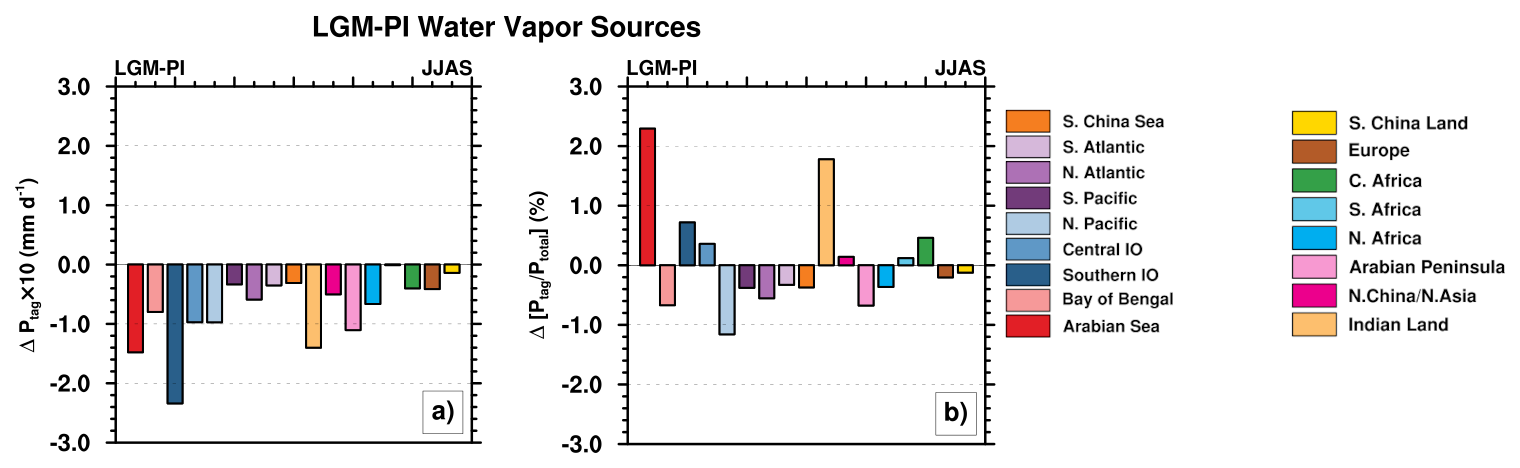
Figure 7Changes in the precipitation contribution from 17 tagged moisture source regions to the Indian monsoon domain's JJAS mean precipitation between the LGM and the PI simulations. The source regions corresponding to each bar are identified in the legend. Panel (a) shows the absolute difference in precipitation contribution from each source region (ΔPtag). The values are shown in mm d−1 and have been scaled up by a factor of 10 for visualization. Panel (b) shows the difference in the relative contribution of each source to the total precipitation at the Indian monsoon domain (), shown as a percentage (%).
3.5 δ18Oprecip in the LGM
Globally, the LGM simulation shows a strong depletion in annual mean δ18Oprecip values (by 5 ‰ to > 10 ‰) over the high latitudes and continental ice sheets (Fig. S4c). This is mainly due to the “temperature effect”, as the cooling in the LGM leads to a stronger Rayleigh distillation process (Galewsky et al., 2016). Previous studies (Broccoli and Manabe, 2008; Tharammal et al., 2013; Kageyama et al., 2021; Zhu and Poulsen, 2021) have shown that reduced GHG and consequent cooling, changes in circulation, and both topography and albedo of the ice sheets contribute to this depletion in the high latitudes. In the following text, we discuss the changes in δ18Oprecip over the ISM region during the JJAS season.
In contrast to the high latitudes, considerable enrichment of δ18Oprecip (1 ‰–4 ‰) over tropical regions including the Indian Ocean, Southeast Asia, and ISM regions (mean enrichment of 0.9 ‰ over the ISM domain) is simulated in the JJAS season (Fig. 8). This simulated enrichment is in agreement with the proxy data records from the South Asian summer monsoon region and climate model simulations (Hoffmann and Heimann, 1997; Tiwari et al., 2011; Liu et al., 2014; Jiang et al., 2015; Kathayat et al., 2016; Kaushal et al., 2018).
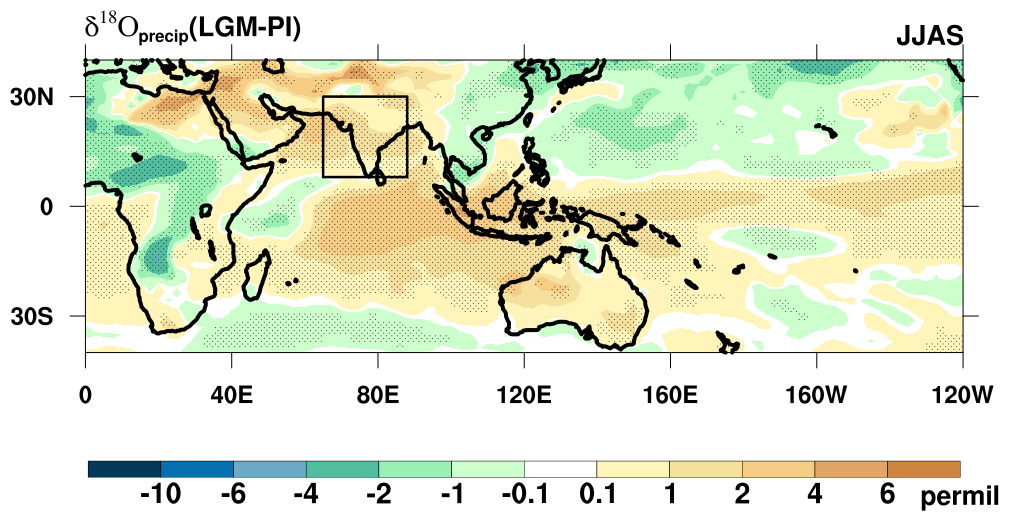
Figure 8The anomalies of JJAS mean precipitation weighted δ18Oprecip in permil between the LGM and PI simulations as LGM-PI. The Indian monsoon domain is shown in a black box in the plot. Regions where the anomalies are statistically significant at the 95 % confidence level are stippled. Significance level is estimated using a Student's t test from a sample of 20 annual means from the PI control and LGM simulations.
The JJAS mean amount effect in the LGM (spatial slope −0.24 ‰ (mm d−1)−1, r2 = 0.30, Fig. S3) is moderate and similar to that in the PI simulation. Importantly, the linear regression analysis (Fig. S3) shows that there is no significant correlation between the changes in precipitation (ΔP) and the changes in δ18Oprecip between the LGM and PI simulations (temporal slope of amount effect, Δδ18O, slope −0.09 ‰ (mm d−1)−1, r2 = 0.07). Hence, the LGM enrichment in the ISM region cannot be explained by the amount effect, and the results indicate the influence of other factors such as changes in water vapor sources and atmospheric circulation.
3.6 Drivers of monsoon δ18Oprecip changes: Perspectives from source tagging
To diagnose the physical processes responsible for the changes in the monsoon δ18Oprecip during the LGM, we conducted a decomposition analysis of the JJAS mean LGM-PI δ18Oprecip anomalies, following (Tabor et al., 2018). Details of the calculations are given in Sect. 2.4. Using the results from water tagging experiments, we separated the anomalies (LGM-PI) in the δ18Oprecip of each source tag (Δδ18O) into 4 components: (1) effects of changes in source vapor δ18O (Δδ18Osource), (2) effects of changes in rainout during transport (Δδ18Orainout), (3) effects of changes during condensation over the Indian monsoon domain (Δδ18Ocondensation), and, (4) effects of changes in the relative contributions of each source to total precipitation over India (shown in Fig. 9a–d).
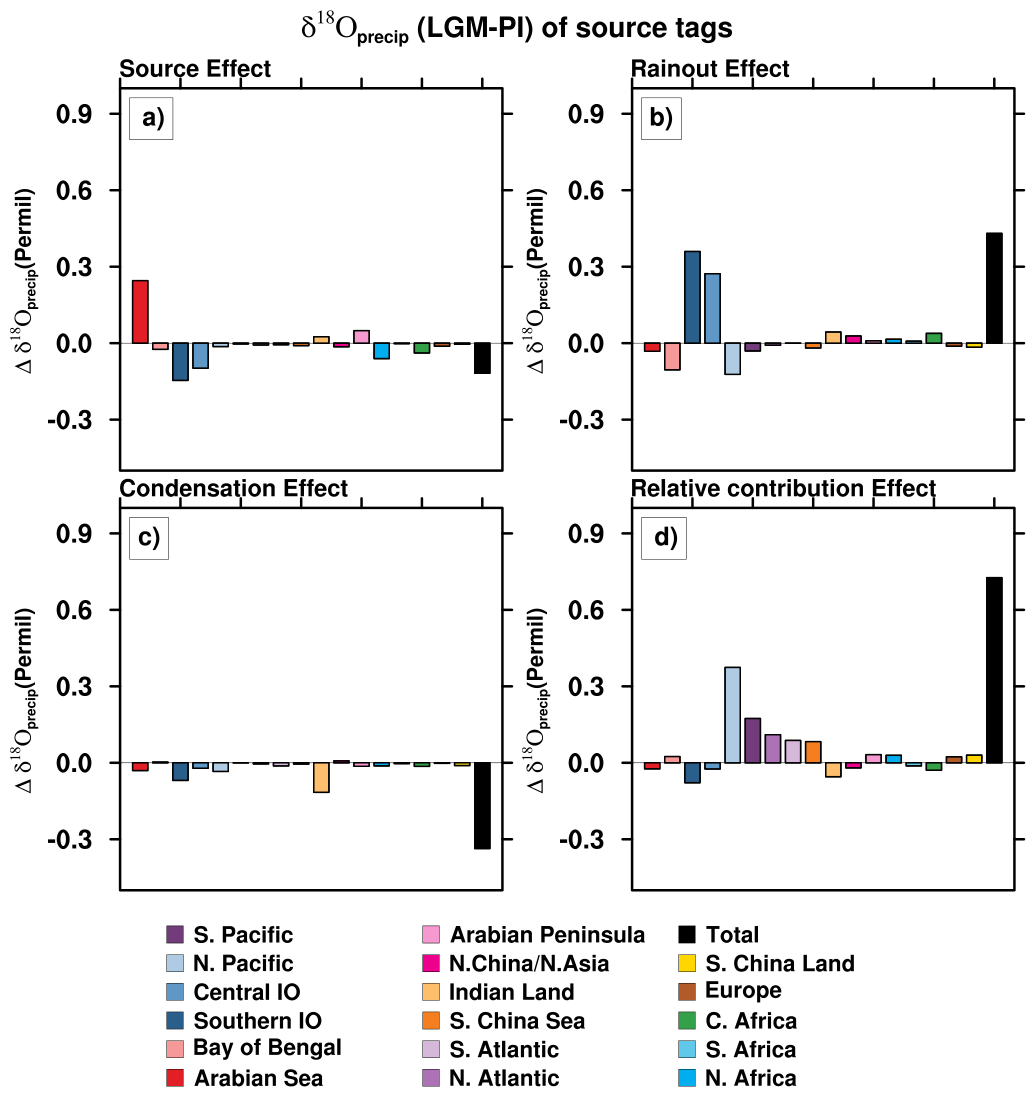
Figure 9Decomposition of the change in JJAS mean precipitation δ18O (Δδ18Oprecip) for the Indian monsoon domain between the LGM and PI simulations. All values are in permil (‰). The Δδ18Oprecip is divided into contributions from 17 tagged moisture source regions, shown in the legend. The decomposition separates the total anomaly into four primary physical processes for each tag. Panel (a) shows the Source Effect: Changes in the δ18O of water vapor at its evaporative source. Panel (b) shows the Rainout Effect: Changes in isotopic composition due to rainout during atmospheric transport from the source region to the ISM domain. Panel (c) shows the Condensation Effect: Changes in the isotopic fractionation during the conversion of water vapor to precipitation over the monsoon region. Panel (d) shows the Precipitation Relative Contribution Effect: Changes in δ18Oprecip for each tag resulting from shifts in the relative contribution of precipitation from different source regions.
The analysis shows that the dominant contributor to the positive anomalies in the δ18Oprecip values over the ISM domain is the change in the relative contribution of the water vapor sources, which accounts for an enrichment of +0.6 ‰ (Fig. 9d). This is caused by a reduction in the relative contribution from remote and depleted water vapor sources – North and South Pacific, Atlantic, and South China Sea (Fig. 9d). The second largest positive contribution is from the Rainout Effect (+0.4 ‰ in total, Fig. 9b). This is driven by a weaker rainout along transport pathways from major water vapor sources – Southern and Central Indian Ocean, due to a weaker circulation in many parts of the Indian Ocean, and overall reduced rainfall in the LGM. In contrast, the Source Effect (effects of changes in source vapor δ18O, Fig. 9a) provides a small net negative contribution, as a positive contribution from the Arabian Sea is offset by negative effects from other source regions (Fig. 9a). The positive effect from the Arabian Sea source is likely due to a localized increase in evaporation (Fig. S5b) in contrast to other sources where evaporation was generally reduced, and also the prescribed 1 ‰ global ocean surface enrichment in the LGM simulation.
The condensation term, which represents the local enrichment of the precipitation at the sink during the phase transition of vapor to precipitation, produces a negative net contribution (Fig. 9c). This suggests that the isotopic enrichment of precipitation on condensation was weaker in the LGM compared to the PI. This finding also confirms that the amount effect is not a primary driver of the LGM enrichment. If a strong amount effect existed, the reduced LGM precipitation should have produced a positive condensation term. The negative contribution from the condensation term, therefore, agrees with our previous analysis showing no significant temporal correlation between changes in ISM precipitation and isotopes (Sect. 3.5; Fig. S3) in the LGM. The condensation term in our framework reflects the isotopic enrichment in precipitation relative to ambient vapor. A negative response for the effect suggests a weaker enrichment during condensation in the LGM, likely related to reduced convection and condensation, also potentially lower fractionation efficiency under the cooler and drier LGM conditions. Furthermore, cold conditions can reduce re-evaporation of precipitation (Worden et al., 2007), a process that usually leads to a more isotope enriched precipitation. However, these aspects warrant further investigation in future studies.
The present study used a water isotope, water tagging-enabled general circulation model to investigate the Indian summer monsoon precipitation and isotope responses under glacial conditions. Our simulations show a 15 % reduction of monsoon precipitation over the Indian domain. Our study shows that the reduction in Indian monsoon precipitation is mainly due to the effects of global cooling and reduced humidity (due to reduced CO2 and the presence of continental ice-sheets; Kageyama et al., 2021). The LGM drying over the Indian subcontinent was enhanced by a Walker-like circulation response, driven by zonal temperature gradients between the less-cooled Western Pacific and the cooler Indian subcontinent, which created anomalous subsidence over the Indian region.
The reduction in the summer monsoon precipitation in the LGM simulation is consistent with climate models and proxy records of monsoon precipitation (Jiang et al., 2015; Yan et al., 2016; Cao et al., 2019; Liu et al., 2021; Wang et al., 2023). The simulated northward shift of the ITCZ in our iCESM results, likely due to increased tropical North Pacific precipitation, conflicts with the southward shift simulated by several other models (Wang et al., 2023). This discrepancy points to uncertainties in climate simulations and suggests that more studies are required to assess the representation of tropical ocean-atmosphere interactions under the glacial climate conditions.
We also note that the low-level circulation responses in the LGM simulation (enhanced cyclonic barotropic shear with enhanced westerly anomalies over Southern India, and easterlies over the northern latitudes) is consistent with the climate model responses in future warming scenarios (Menon et al., 2013). Menon et al. (2013) find that under the RCP8.5 scenario, CMIP5 models project a weaker low level cyclonic monsoon circulation with enhanced westerly anomaly over northern India and easterly anomaly over the south, despite a simulated increase in the monsoon precipitation. Thus, our results are consistent with monsoon responses in future warming scenarios, such that in the colder LGM conditions, the monsoon precipitation is reduced due to thermodynamic response to cooling, while the dynamical response characterized by monsoon circulation indices in general is intensified.
A key contribution of this study is the novel application of water vapor source-tagging to the LGM climate simulation, which shows that the major water vapor sources for the Indian monsoon were unchanged between the pre-industrial and LGM climates. Our study finds that isotopic ratio of precipitation is enriched by ∼ 1 ‰ over the ISM domain during the LGM, which is in agreement with speleothem proxy records from Mawmluh (Dutt et al., 2015) and Bittoo caves (Kathayat et al., 2016) in North India. Our analysis confirms the amount effect (Dansgaard, 1964) was not the primary driver for this enrichment, as we find no significant correlation between the changes in precipitation and δ18Oprecip from the PI to the LGM. Instead, our decomposition analysis using water vapor tagging finds that the simulated LGM enrichment is due to a reduced relative contribution from distant, isotopically depleted moisture sources and decreased rainout from Indian Ocean sources. A key component of the enrichment in δ18Oprecip is the reduction in Pacific moisture contribution in the LGM, which is highly isotopically depleted. Our decomposition analysis shows that the reduction in the relative contribution from the North Pacific alone contributes approximately +0.4 ‰ enrichment (Fig. 9d). This reduced Pacific moisture contribution also reflects the circulation response in the LGM. The enhanced Walker-like circulation, together with the enhanced westerlies intensify convection over the western Pacific and weaken moisture transport from the Northern Pacific into South Asia.
The results are in agreement with studies by Tabor et al. (2018) and Hu et al. (2019) who find the importance of different water vapor sources for the South Asian and East Asian monsoon δ18Oprecip values. Our results imply that δ18O changes recorded in speleothems and marine sediments from the Indian monsoon region during the LGM should be interpreted primarily as indicators of changes in moisture sources and their relative contributions and large-scale circulation, rather than as direct proxies for local monsoon precipitation intensity. We suggest δ18O in paleoclimate archives is better considered as an integrated representation of changes in hydrological cycle, rather than a direct measure of local rainfall amount. This also shows that combining proxy archives with isotope-enabled climate model simulations is crucial for accurately interpreting past monsoon changes.
We note that our study has a few limitations. The version of the CESM model we used has high climate sensitivity and overestimates the LGM global cooling (Zhu et al., 2022), an issue attributed to its cloud parameterization. However, we suggest that these biases do not affect our key results, as the model is able to both successfully capture the present-day monsoon circulation, and isotopic distribution. The model is also able to simulate the isotopic enrichment found in proxy records during the LGM. Further, we use a single model, with prescribed SSTs and prescribed surface ocean water isotope ratios because of the cost of computation when we utilize the water-tagging capabilities of the model. Future work should employ fully coupled Earth system models within a multi-model framework to investigate ocean-atmosphere-isotope feedback and test the robustness of these results.
In conclusion, this study disentangles the drivers of Indian monsoon precipitation and its isotopic signature during the LGM. The results highlight that the isotopic composition of precipitation in the Indian monsoon region is a complex signal integrating changes in circulation, changes in relative contribution of water vapor sources, and upstream rainout processes. These findings underscore the importance of considering moisture source and transport history when interpreting paleoclimate isotope records from the Indian monsoon and other tropical monsoon regions.
The datasets supporting this study are available from Zenodo at https://doi.org/10.5281/zenodo.18791301 (Tharammal, 2026).
The supplement related to this article is available online at https://doi.org/10.5194/cp-22-427-2026-supplement.
TT: Conceptualization, Funding acquisition, Methodology, Investigation, Formal analysis, Visualization, Writing – Original Draft. GB: Methodology, Analysis, Writing – Review & Editing. JN: Methodology, Model software, Analysis, Writing – Review & Editing.
The contact author has declared that none of the authors has any competing interests.
Publisher's note: Copernicus Publications remains neutral with regard to jurisdictional claims made in the text, published maps, institutional affiliations, or any other geographical representation in this paper. The authors bear the ultimate responsibility for providing appropriate place names. Views expressed in the text are those of the authors and do not necessarily reflect the views of the publisher.
TT is supported by the DST-INSPIRE Faculty Fellowship awarded by the Department of Science and Technology, India and Anusandhan National Research Foundation (ANRF) Early Career Research Grant. We acknowledge Jiang Zhu (NCAR) for providing the boundary conditions for the simulations, and we would like to thank Dr. André Paul for discussions during the initial stages of this research. We acknowledge the high-performance computing support from the Supercomputer Education and Research Centre (SERC), Indian Institute of Science, Bangalore. All the figures in the manuscript were created with NCL (NCAR Command Language Version 6.6.2, http://www.ncl.ucar.edu/, last access: 20 December 2025). The authors thank the editor and two anonymous referees for their careful review and insightful comments, which substantially improved the manuscript.
This research was supported by the Department of Science and Technology (DST), Ministry of Science and Technology, India, through the DST-INSPIRE Faculty Fellowship (grant no. IFA21-EAS 95) and the Anusandhan National Research Foundation (ANRF) Early Career Research Grant (grant no. ANRF/ECRG/2024/005479/EAS), both awarded to TT.
This paper was edited by Zhongshi Zhang and reviewed by two anonymous referees.
Adler, R. F., Sapiano, M., Huffman, G. J., Wang, J., Gu, G., Bolvin, D., Chiu, L., Schneider, U., Becker, A., Nelkin, E., Xie, P., Ferraro, R., and Shin, D.-B.: The Global Precipitation Climatology Project (GPCP) Monthly Analysis (New Version 2.3) and a Review of 2017 Global Precipitation, Atmosphere, 9, https://doi.org/10.3390/atmos9040138, 2018.
Annamalai, H., Hafner, J., Sooraj, K. P., and Pillai, P.: Global warming shifts the monsoon circulation, drying South Asia, J. Clim., 26, 2701–2718, https://doi.org/10.1175/jcli-d-12-00208.1, 2013.
Azhar, S. S. A., Chenoli, S. N., Samah, A. A., Kim, S.-J., and Murukesh, N.: The mechanism linking the variability of the Antarctic sea ice extent in the Indian Ocean sector to Indian summer monsoon rainfall, Clim. Dyn., 60, 2665–2685, https://doi.org/10.1007/s00382-022-06466-z, 2023.
Bailey, A., Noone, D., Dee, S., Nusbaumer, J., Conroy, J., Stevenson, S., and Atwood, A.: Toward a process-oriented understanding of water in the climate system: recent insights from stable isotopes, Environ. Res.: Climate, 4, 012002, https://doi.org/10.1088/2752-5295/ada17b, 2025.
Bartlein, P. J., Harrison, S. P., Brewer, S., Connor, S., Davis, B. A. S., Gajewski, K., Guiot, J., Harrison-Prentice, T. I., Henderson, A., Peyron, O., Prentice, I. C., Scholze, M., Seppä, H., Shuman, B., Sugita, S., Thompson, R. S., Viau, A. E., Williams, J., and Wu, H.: Pollen-based continental climate reconstructions at 6 and 21 ka: a global synthesis, Clim. Dyn., 37, 775–802, https://doi.org/10.1007/s00382-010-0904-1, 2011.
Boos, W. R. and Emanuel, K. A.: Annual intensification of the Somali jet in a quasi-equilibrium framework: Observational composites, Q. J. R. Meteorol. Soc., 135, 319–335, https://doi.org/10.1002/qj.388, 2009.
Brady, E. C., Stevenson, S., Bailey, D. A., Liu, Z., Noone, D., Nusbaumer, J., Otto-Bliesner, B. L., Tabor, C., Tomas, R., Wong, T., Zhang, J., and Zhu, J.: The connected isotopic water cycle in the Community Earth System Model version 1, J. Adv. Model. Earth Syst., 11, 2547–2566, https://doi.org/10.1029/2019MS001663, 2019.
Breitenbach, S. F. M., Adkins, J. F., Meyer, H., Marwan, N., Kumar, K. K., and Haug, G. H.: Strong influence of water vapor source dynamics on stable isotopes in precipitation observed in Southern Meghalaya, NE India, Earth Planet. Sci. Lett., 292, 212–220, https://doi.org/10.1016/j.epsl.2010.01.038, 2010.
Broccoli, A. J.: Tropical cooling at the Last Glacial Maximum: An atmosphere–mixed layer ocean model simulation, J. Climate, 13, 951–976, https://doi.org/10.1175/1520-0442(2000)013<0951:TCATLG>2.0.CO;2, 2000.
Broccoli, A. J. and Manabe, S.: The influence of continental ice, atmospheric CO2, and land albedo on the climate of the last glacial maximum, Clim. Dyn., 1, 87–99, https://doi.org/10.1007/bf01054478, 1987.
Broccoli, A. J. and Manabe, S.: The effects of the Laurentide ice sheet on North American climate during the last glacial maximum, Géogr. Phys. Quat., 41, 291–299, https://doi.org/10.7202/032684ar, 2008.
Brovkin, V., Brook, E., Williams, J. W., Bathiany, S., Lenton, T. M., Barton, M., DeConto, R. M., Donges, J. F., Ganopolski, A., McManus, J., Praetorius, S., de Vernal, A., Abe-Ouchi, A., Cheng, H., Claussen, M., Crucifix, M., Gallopín, G., Iglesias, V., Kaufman, D. S., Kleinen, T., Lambert, F., van der Leeuw, S., Liddy, H., Loutre, M.-F., McGee, D., Rehfeld, K., Rhodes, R., Seddon, A. W. R., Trauth, M. H., Vanderveken, L., and Yu, Z.: Past abrupt changes, tipping points and cascading impacts in the Earth system, Nat. Geosci., 14, 550–558, https://doi.org/10.1038/s41561-021-00790-5, 2021.
Cao, J., Wang, B., and Ma, L.: Attribution of global monsoon response to the Last Glacial Maximum forcings, J. Clim., 32, 6589–6605, https://doi.org/10.1175/jcli-d-18-0871.1, 2019.
Chakraborty, S., Sarkar, A., Datye, A., Praveen, V., Deb Burman, P. K., Shivamurthy, Y., Samal, N., Saha, S. K., Yadava, M. G., Chattopadhyay, R., Trivedi, N., Trivedi, R. K., and Sharma, A.: Precipitation isotopes and monsoon dynamics in the core monsoon zone of India, Sci. Rep., 15, 6761, https://doi.org/10.1038/s41598-025-88640-x, 2025.
Chen, Z., Zhou, T., Zhang, L., Chen, X., Zhang, W., and Jiang, J.: Global land monsoon precipitation changes in CMIP6 projections, Geophys. Res. Lett., 47, https://doi.org/10.1029/2019gl086902, 2020.
Chou, C. and Lan, C.-W.: Changes in the annual range of precipitation under global warming, J. Clim., 25, 222–235, https://doi.org/10.1175/jcli-d-11-00097.1, 2012.
Chou, C., Neelin, J. D., Chen, C.-A., and Tu, J.-Y.: Evaluating the “rich-get-richer” mechanism in tropical precipitation change under global warming, J. Clim., 22, 1982–2005, https://doi.org/10.1175/2008jcli2471.1, 2009.
Contreras-Rosales, L. A., Jennerjahn, T., Tharammal, T., Meyer, V., Lückge, A., Paul, A., and Schefuß, E.: Evolution of the Indian summer monsoon and terrestrial vegetation in the Bengal region during the past 18 ka, Quat. Sci. Rev., 102, 133–148, https://doi.org/10.1016/j.quascirev.2014.08.010, 2014.
Dansgaard, W.: Stable isotopes in precipitation, Tell'Us, 16, 436–468, https://doi.org/10.1111/j.2153-3490.1964.tb00181.x, 1964.
Dee, S., Bailey, A., Conroy, J. L., Atwood, A., Stevenson, S., Nusbaumer, J., and Noone, D.: Water isotopes, climate variability, and the hydrological cycle: recent advances and new frontiers, Environ. Res.: Climate, 2, 022002, https://doi.org/10.1088/2752-5295/accbe1, 2023.
Devaraju, N., Bala, G., and Modak, A.: Effects of large-scale deforestation on precipitation in the monsoon regions: remote versus local effects, P. Natl. Acad. Sci. USA, 112, 3257–3262, https://doi.org/10.1073/pnas.1423439112, 2015.
Dey, D. and Döös, K.: Tracing the Origin of the South Asian Summer Monsoon Precipitation and Its Variability Using a Novel Lagrangian Framework, J. Clim., 34, 8655–8668, https://doi.org/10.1175/JCLI-D-20-0967.1, 2021.
DiNezio, P. N., Tierney, J. E., Otto-Bliesner, B. L., Timmermann, A., Bhattacharya, T., Rosenbloom, N., and Brady, E.: Glacial changes in tropical climate amplified by the Indian Ocean, Sci. Adv., 4, eaat9658, https://doi.org/10.1126/sciadv.aat9658, 2018.
Duplessy, J.-C., Labeyrie, L., and Waelbroeck, C.: Constraints on the ocean oxygen isotopic enrichment between the Last Glacial Maximum and the Holocene: Paleoceanographic implications, Quat. Sci. Rev., 21, 315–330, https://doi.org/10.1016/s0277-3791(01)00107-x, 2002.
Dutt, S., Gupta, A. K., Clemens, S. C., Cheng, H., Singh, R. K., Kathayat, G., and Edwards, R. L.: Abrupt changes in Indian summer monsoon strength during 33,800 to 5500 years B.P., Geophys. Res. Lett., 42, 5526–5532, https://doi.org/10.1002/2015gl064015, 2015.
Fasullo, J. and Webster, P. J.: A hydrological definition of Indian monsoon onset and withdrawal, J. Clim., 16, 3200–3211, https://doi.org/10.1175/1520-0442(2003)016<3200a:ahdoim>2.0.co;2, 2003.
Gadgil, S.: The Indian Monsoon and Its Variability, Annu. Rev. Earth Planet. Sci., 31, 429–467, https://doi.org/10.1146/annurev.earth.31.100901.141251, 2003.
Galewsky, J., Steen-Larsen, H. C., Field, R. D., Worden, J., Risi, C., and Schneider, M.: Stable isotopes in atmospheric water vapor and applications to the hydrologic cycle, Rev. Geophys., 54, 809–865, https://doi.org/10.1002/2015rg000512, 2016.
Geen, R., Bordoni, S., Battisti, D. S., and Hui, K.: Monsoons, ITCZs, and the concept of the global monsoon, Rev. Geophys., 58, https://doi.org/10.1029/2020rg000700, 2020.
Gimeno, L., Drumond, A., Nieto, R., Trigo, R. M., and Stohl, A.: On the origin of continental precipitation, Geophys. Res. Lett., 37, https://doi.org/10.1029/2010gl043712, 2010.
Gimeno, L., Stohl, A., Trigo, R. M., Dominguez, F., Yoshimura, K., Yu, L., Drumond, A., Durán-Quesada, A. M., and Nieto, R.: Oceanic and terrestrial sources of continental precipitation, Rev. Geophys., 50, https://doi.org/10.1029/2012rg000389, 2012.
Hanf, F. S. and Annamalai, H.: Systematic Errors in South Asian Monsoon Precipitation: Process-Based Diagnostics and Sensitivity to Entrainment in NCAR Models, J. Clim., 33, 2817–2840, https://doi.org/10.1175/JCLI-D-18-0495.1, 2020.
He, C., Liu, Z., Otto-Bliesner, B. L., Brady, E. C., Zhu, C., Tomas, R., Clark, P. U., Zhu, J., Jahn, A., Gu, S., Zhang, J., Nusbaumer, J., Noone, D., Cheng, H., Wang, Y., Yan, M., and Bao, Y.: Hydroclimate footprint of pan-Asian monsoon water isotope during the last deglaciation, Sci. Adv., 7, https://doi.org/10.1126/sciadv.abe2611, 2021.
Hersbach, H., Bell, B., Berrisford, P., Hirahara, S., Horányi, A., Muñoz-Sabater, J., Nicolas, J., Peubey, C., Radu, R., Schepers, D., Simmons, A. J., Soci, C., Abdalla, S., Abellan, X., Balsamo, G., Bechtold, P., Biavati, G., Bidlot, J.-R., Bonavita, M., De Chiara, G., Dahlgren, P., Dee, D. P., Diamantakis, M., Dragani, R., Flemming, J., Forbes, R., Fuentes, M., Geer, A. J., Haimberger, L., Healy, S. B., Hogan, R. J., Hólm, E. V., Janisková, M., Keeley, S., Laloyaux, P., Lopez, P., Radnoti, G., de Rosnay, P., Rozum, I., Vamborg, F., Villaume, S., and Thépaut, J.-N.: The ERA5 global reanalysis, Q. J. Roy. Meteorol. Soc., 146, 1999–2049, https://doi.org/10.1002/qj.3803, 2020.
Hoffmann, G. and Heimann, M.: Water isotope modeling in the Asian monsoon region, Quatern. Int., 37, 115–128, https://doi.org/10.1016/1040-6182(96)00004-3, 1997.
Hu, J., Emile-Geay, J., Tabor, C., Nusbaumer, J., and Partin, J.: Deciphering oxygen isotope records from Chinese speleothems with an isotope-enabled climate model, Paleoceanogr. Paleocl., 34, 2098–2112, https://doi.org/10.1029/2019pa003741, 2019.
Jiang, D., Tian, Z., Lang, X., Kageyama, M., and Ramstein, G.: The concept of global monsoon applied to the last glacial maximum: A multi-model analysis, Quat. Sci. Rev., 126, 126–139, https://doi.org/10.1016/j.quascirev.2015.08.033, 2015.
Kageyama, M., Harrison, S. P., Kapsch, M.-L., Lofverstrom, M., Lora, J. M., Mikolajewicz, U., Sherriff-Tadano, S., Vadsaria, T., Abe-Ouchi, A., Bouttes, N., Chandan, D., Gregoire, L. J., Ivanovic, R. F., Izumi, K., LeGrande, A. N., Lhardy, F., Lohmann, G., Morozova, P. A., Ohgaito, R., Paul, A., Peltier, W. R., Poulsen, C. J., Quiquet, A., Roche, D. M., Shi, X., Tierney, J. E., Valdes, P. J., Volodin, E., and Zhu, J.: The PMIP4 Last Glacial Maximum experiments: preliminary results and comparison with the PMIP3 simulations, Clim. Past, 17, 1065–1089, https://doi.org/10.5194/cp-17-1065-2021, 2021.
Kageyama, M., Braconnot, P., Chiessi, C. M., Rehfeld, K., Ait Brahim, Y., Dütsch, M., Gwinneth, B., Hou, A., Loutre, M.-F., Hendrizan, M., Meissner, K., Mongwe, P., Otto-Bliesner, B., Pezzi, L. P., Rovere, A., Seltzer, A., Sime, L., and Zhu, J.: Lessons from paleoclimates for recent and future climate change: opportunities and insights, Front. Clim., 6, https://doi.org/10.3389/fclim.2024.1511997, 2024.
Kathayat, G., Cheng, H., Sinha, A., Spötl, C., Edwards, R. L., Zhang, H., Li, X., Yi, L., Ning, Y., Cai, Y., Lui, W. L., and Breitenbach, S. F. M.: Indian monsoon variability on millennial-orbital timescales, Sci. Rep., 6, 24374, https://doi.org/10.1038/srep24374, 2016.
Kathayat, G., Sinha, A., Tanoue, M., Yoshimura, K., Li, H., Zhang, H., and Cheng, H.: Interannual oxygen isotope variability in Indian summer monsoon precipitation reflects changes in moisture sources, Commun. Earth Environ., 2, 1–10, https://doi.org/10.1038/s43247-021-00165-z, 2021.
Katzenberger, A., Schewe, J., Pongratz, J., and Levermann, A.: Robust increase of Indian monsoon rainfall and its variability under future warming in CMIP6 models, Earth Syst. Dynam., 12, 367–386, https://doi.org/10.5194/esd-12-367-2021, 2021.
Kaushal, N., Breitenbach, S., Lechleitner, F., Sinha, A., Tewari, V., Ahmad, S. M., Berkelhammer, M., Band, S., Yadava, M., Ramesh, R., and Henderson, G.: The Indian summer monsoon from a speleothem δ18O perspective – A review, Quaternary, https://doi.org/10.3390/QUAT1030029, 2018.
Konecky, B. L., Noone, D. C., and Cobb, K. M.: The influence of competing hydroclimate processes on stable isotope ratios in tropical rainfall, Geophys. Res. Lett., 46, 1622–1633, https://doi.org/10.1029/2018gl080188, 2019.
Kong, Y., Wu, Y., Hu, X., Li, Y., and Yang, S.: Uncertainty in projections of the South Asian summer monsoon under global warming by CMIP6 models: Role of tropospheric meridional thermal contrast, Atmos. Ocean. Sci. Lett., 15, 100145, https://doi.org/10.1016/j.aosl.2021.100145, 2022.
Kripalani, R. H., Oh, J. H., Kulkarni, A., Sabade, S. S., and Chaudhari, H. S.: South Asian summer monsoon precipitation variability: Coupled climate model simulations and projections under IPCC AR4, Theor. Appl. Climatol., 90, 133–159, https://doi.org/10.1007/s00704-006-0282-0, 2007.
Krishnan, R., Sabin, T. P., Vellore, R., Mujumdar, M., Sanjay, J., Goswami, B. N., Hourdin, F., Dufresne, J.-L., and Terray, P.: Deciphering the desiccation trend of the South Asian monsoon hydroclimate in a warming world, Clim. Dyn., 47, 1007–1027, https://doi.org/10.1007/s00382-015-2886-5, 2016.
Krishnan, R., Sanjay, J., Gnanaseelan, C., Mujumdar, M., Kulkarni, A., and Chakraborty, S. (Eds.): Assessment of climate change over the Indian region: A Report of the Ministry of Earth Sciences (MoES), Government of India, Springer, Singapore, https://doi.org/10.1007/978-981-15-4327-2, 2020.
Lambeck, K.: Global ice volumes at the Last Glacial Maximum and early Lateglacial, Earth Planet. Sci. Lett., 181, 513–527, https://doi.org/10.1016/s0012-821x(00)00223-5, 2000.
Lambeck, K., Rouby, H., Purcell, A., Sun, Y., and Sambridge, M.: Sea level and global ice volumes from the Last Glacial Maximum to the Holocene, P. Natl. Acad. Sci. USA, 111, 15296–15303, https://doi.org/10.1073/pnas.1411762111, 2014.
Lee, J.-E. and Fung, I.: “Amount effect” of water isotopes and quantitative analysis of post-condensation processes, Hydrol. Process., 22, 1–8, https://doi.org/10.1002/hyp.6637, 2008.
LeGrande, A. N. and Schmidt, G. A.: Global gridded data set of the oxygen isotopic composition in seawater, Geophys. Res. Lett., 12, https://doi.org/10.1029/2006GL026011, 2006.
Lewis, S. C., LeGrande, A. N., Kelley, M., and Schmidt, G. A.: Water vapour source impacts on oxygen isotope variability in tropical precipitation during Heinrich events, Clim. Past, 6, 325–343, https://doi.org/10.5194/cp-6-325-2010, 2010.
Li, X., Wang, L., Zhong, S., and Liu, L.: Comparative analysis of indices in capturing the onset and withdrawal of the South Asian Summer Monsoon, Environ. Res. Commun., 6, 031007, https://doi.org/10.1088/2515-7620/ad352b, 2024.
Liu, S., Ye, W., Chen, M.-T., Pan, H.-J., Cao, P., Zhang, H., Khokiattiwong, S., Kornkanitnan, N., and Shi, X.: Millennial-scale variability of Indian summer monsoon during the last 42 kyr: Evidence based on foraminiferal Mg/Ca and oxygen isotope records from the central Bay of Bengal, Palaeogeogr. Palaeoclimatol. Palaeoecol., 562, 110112, https://doi.org/10.1016/j.palaeo.2020.110112, 2021.
Liu, Z., Wen, X., Brady, E. C., Otto-Bliesner, B., Yu, G., Lu, H., Cheng, H., Wang, Y., Zheng, W., Ding, Y., Edwards, R. L., Cheng, J., Liu, W., and Yang, H.: Chinese cave records and the East Asia Summer Monsoon, Quat. Sci. Rev., 83, 115–128, https://doi.org/10.1016/j.quascirev.2013.10.021, 2014.
Lofverstrom, M. and Zhu, J.: Tropical precipitation woes in the Community Earth System Model version 2, Geophys. Res. Lett., 50, https://doi.org/10.1029/2023gl104416, 2023.
Lohmann, G., Butzin, M., Eissner, N., Shi, X., and Stepanek, C.: Abrupt climate and weather changes across time scales, Paleoceanogr. Paleocl., 35, https://doi.org/10.1029/2019pa003782, 2020.
Maher, B. A.: Holocene variability of the East Asian summer monsoon from Chinese cave records: a re-assessment, Holocene, 18, 861–866, https://doi.org/10.1177/0959683608095569, 2008.
MARGO Project Members: Constraints on the magnitude and patterns of ocean cooling at the Last Glacial Maximum, Nat. Geosci., 2, 127–132, https://doi.org/10.1038/ngeo411, 2009.
McGee, D.: Glacial-interglacial precipitation changes, Ann. Rev. Mar. Sci., 12, 525–557, https://doi.org/10.1146/annurev-marine-010419-010859, 2020.
McGee, D., Donohoe, A., Marshall, J., and Ferreira, D.: Changes in ITCZ location and cross-equatorial heat transport at the Last Glacial Maximum, Heinrich Stadial 1, and the mid-Holocene, Earth Planet. Sci. Lett., 390, 69–79, https://doi.org/10.1016/j.epsl.2013.12.043, 2014.
Menon, A., Levermann, A., Schewe, J., Lehmann, J., and Frieler, K.: Consistent increase in Indian monsoon rainfall and its variability across CMIP-5 models, Earth Syst. Dynam., 4, 287–300, https://doi.org/10.5194/esd-4-287-2013, 2013.
Mukherjee, S. K., Dey Choudhury, A., and Krishnan, R.: Heavy-Precipitating Mid-Tropospheric Cyclonic Systems of the Indian Summer Monsoon in a Warming Climate, EGU General Assembly 2024, Vienna, Austria, 14–19 April 2024, EGU24-268, https://doi.org/10.5194/egusphere-egu24-268, 2024.
Nusbaumer, J., Wong, T. E., Bardeen, C., and Noone, D.: Evaluating hydrological processes in the Community Atmosphere Model Version 5 (CAM5) using stable isotope ratios of water, J. Adv. Model. Earth Syst., 9, 949–977, https://doi.org/10.1002/2016MS000839, 2017.
Ordóñez, P., Ribera, P., Gallego, D., and Peña-Ortiz, C.: Major moisture sources for Western and Southern India and their role on synoptic-scale rainfall events, Hydrol. Process., 26, 3886–3895, https://doi.org/10.1002/hyp.8455, 2012.
Pathak, A., Ghosh, S., and Kumar, P.: Precipitation Recycling in the Indian Subcontinent during Summer Monsoon, J. Hydrometeorol., 15, 2050–2066, https://doi.org/10.1175/JHM-D-13-0172.1, 2014.
Pathak, R., Sahany, S., Mishra, S. K., and Dash, S. K.: Precipitation Biases in CMIP5 Models over the South Asian Region, Sci. Rep., 9, 9589, https://doi.org/10.1038/s41598-019-45907-4, 2019.
Pausata, F. S. R., Battisti, D. S., Nisancioglu, K. H., and Bitz, C. M.: Chinese stalagmite δ18O controlled by changes in the Indian monsoon during a simulated Heinrich event, Nat. Geosci., 4, 474–480, https://doi.org/10.1038/ngeo1169, 2011.
Peltier, W. R., Argus, D. F., and Drummond, R.: Space geodesy constrains ice age terminal deglaciation: The global ICE-6G_C (VM5a) model, J. Geophys. Res.-Sol. Ea., 120, 450–487, https://doi.org/10.1002/2014jb011176, 2015.
Rehfeld, K., Hébert, R., Lora, J. M., Lofverstrom, M., and Brierley, C. M.: Variability of surface climate in simulations of past and future, Earth Syst. Dynam., 11, 447–468, https://doi.org/10.5194/esd-11-447-2020, 2020.
Risi, C., Bony, S., Vimeux, F., Jouzel, J., Frankenberg, C., Worden, J., and Meijer, H. A. J.: Influence of convective processes on the isotopic composition (δ18O and δD) of precipitation and water vapor in the tropics: 2. Physical interpretation of the amount effect, J. Geophys. Res.-Atmos., 113, D19306, https://doi.org/10.1029/2008JD009943, 2008.
Roxy, M. K., Ritika, K., Terray, P., Murtugudde, R., Ashok, K., and Goswami, B. N.: Drying of Indian subcontinent by rapid Indian Ocean warming and a weakening land-sea thermal gradient, Nat. Commun., 6, 1–10, https://doi.org/10.1038/ncomms8423, 2015.
Seltzer, A. M., Davidson, P. W., Shackleton, S. A., Nicholson, D. P., and Khatiwala, S.: Global ocean cooling of 2.3 °C during the Last Glacial Maximum, Geophys. Res. Lett., 51, https://doi.org/10.1029/2024gl108866, 2024.
Shewale, M. P. and Kumar, S.: Climatological features of drought incidences in India, India Meteorological Department (IMD), Pune, India, https://imdpune.gov.in/Reports/drought.pdf (last access: 26 February 2026), 2005.
Sima, A., Paul, A., Schulz, M., and Oerlemans, J.: Modeling the oxygen-isotopic composition of the North American Ice Sheet and its effect on the isotopic composition of the ocean during the last glacial cycle, Geophys. Res. Lett., 33, https://doi.org/10.1029/2006gl026923, 2006.
Sinha, A., Kathayat, G., Cheng, H., Breitenbach, S. F. M., Berkelhammer, M., Mudelsee, M., Biswas, J., and Edwards, R. L.: Trends and oscillations in the Indian summer monsoon rainfall over the last two millennia, Nat. Commun., 6, 6309, https://doi.org/10.1038/ncomms7309, 2015.
Sjolte, J. and Hoffmann, G.: Modelling stable water isotopes in monsoon precipitation during the previous interglacial, Quat. Sci. Rev., 85, 119–135, https://doi.org/10.1016/j.quascirev.2013.12.006, 2014.
Tabor, C. R., Otto-Bliesner, B. L., Brady, E. C., Nusbaumer, J., Zhu, J., Erb, M. P., Wong, T. E., Liu, Z., and Noone, D.: Interpreting precession-driven δ18O variability in the South Asian monsoon region, J. Geophys. Res., 123, 5927–5946, https://doi.org/10.1029/2018jd028424, 2018.
Tharammal, T.: Dataset for the publication: Drivers of the δ18O changes in Indian Summer Monsoon precipitation between the Last Glacial Maximum and pre-industrial period, Zenodo [data set], https://doi.org/10.5281/zenodo.18791301, 2026.
Tharammal, T., Paul, A., Merkel, U., and Noone, D.: Influence of Last Glacial Maximum boundary conditions on the global water isotope distribution in an atmospheric general circulation model, Clim. Past, 9, 789–809, https://doi.org/10.5194/cp-9-789-2013, 2013.
Tharammal, T., Bala, G., and Noone, D.: Impact of deep convection on the isotopic amount effect in tropical precipitation, J. Geophys. Res., 122, 1505–1523, https://doi.org/10.1002/2016jd025555, 2017.
Tharammal, T., Bala, G., and Nusbaumer, J. M.: Sources of water vapor and their effects on water isotopes in precipitation in the Indian monsoon region: a model-based assessment, Sci. Rep., 13, 708, https://doi.org/10.1038/s41598-023-27905-9, 2023.
Tierney, J. E., Poulsen, C. J., Montañez, I. P., Bhattacharya, T., Feng, R., Ford, H. L., Hönisch, B., Inglis, G. N., Petersen, S. V., Sagoo, N., Tabor, C. R., Thirumalai, K., Zhu, J., Burls, N. J., Foster, G. L., Goddéris, Y., Huber, B. T., Ivany, L. C., Kirtland Turner, S., Lunt, D. J., McElwain, J. C., Mills, B. J. W., Otto-Bliesner, B. L., Ridgwell, A., and Zhang, Y. G.: Past climates inform our future, Science, 370, https://doi.org/10.1126/science.aay3701, 2020a.
Tierney, J. E., Zhu, J., King, J., Malevich, S. B., Hakim, G. J., and Poulsen, C. J.: Glacial cooling and climate sensitivity revisited, Nature, 584, 569–573, https://doi.org/10.1038/s41586-020-2617-x, 2020b.
Tiwari, M., Singh, A. K., and Ramesh, R.: High-resolution monsoon records since last glacial maximum: A comparison of marine and terrestrial paleoarchives from south Asia, J. Geol. Res., 2011, 1–12, https://doi.org/10.1155/2011/765248, 2011.
Trenberth, K. E.: Changes in precipitation with climate change, Clim. Res., 47, 123–138, https://doi.org/10.3354/cr00953, 2011.
Vidya, P. J., Ravichandran, M., Subeesh, M. P., and Chatterjee, S.: Global warming hiatus contributed weakening of the Mascarene High in the Southern Indian Ocean, Sci. Rep., 10, 3988, https://doi.org/10.1038/s41598-020-59964-7, 2020.
Wang, B., Biasutti, M., Byrne, M., Castro, C., Chang, C.-P., Cook, K., Fu, R., Grimm, A., Ha, K., Hendon, H., Kitoh, A., Krishnan, R., Lee, J., Li, J., Liu, J., Moise, A., Pascale, S., Roxy, M., Seth, A., Sui, C., Turner, A., Yang, S., Yun, K., Zhang, L., and Zhou, T.: Monsoons climate change assessment, Bull. Am. Meteorol. Soc., 102, E1–E19, https://doi.org/10.1175/bams-d-19-0335.1, 2020.
Wang, T., Wang, N., and Jiang, D.: Last glacial maximum ITCZ changes from PMIP3/4 simulations, J. Geophys. Res., 128, https://doi.org/10.1029/2022jd038103, 2023.
Webster, P. J. and Yang, S.: Monsoon and ENSO: Selectively interactive systems, Q. J. Roy. Meteorol. Soc., 118, 877–926, https://doi.org/10.1002/qj.49711850705, 1992.
Weldeab, S., Rühlemann, C., Ding, Q., Khon, V., Schneider, B., and Gray, W. R.: Impact of Indian Ocean surface temperature gradient reversals on the Indian Summer Monsoon, Earth Planet. Sci. Lett., 578, 117327, https://doi.org/10.1016/j.epsl.2021.117327, 2022.
Windler, G., Tierney, J. E., Zhu, J., and Poulsen, C. J.: Unraveling glacial hydroclimate in the Indo-pacific warm pool: Perspectives from water isotopes, Paleoceanogr. Paleocl., 35, https://doi.org/10.1029/2020pa003985, 2020.
Worden, J., Noone, D., Bowman, K., and Tropospheric Emission Spectrometer Science Team and Data contributors: Importance of rain evaporation and continental convection in the tropical water cycle, Nature, 445, 528–532, https://doi.org/10.1038/nature05508, 2007.
Xavier, P. K., Marzin, C., and Goswami, B. N.: An objective definition of the Indian summer monsoon season and a new perspective on the ENSO–monsoon relationship, Q. J. Roy. Meteorol. Soc., 133, 749–764, https://doi.org/10.1002/qj.45, 2007.
Xue, F., Wang, H., and He, J.: Interannual variability of Mascarene high and Australian high and their influences on summer rainfall over East Asia, Chin. Sci. Bull., 48, 492–497, https://doi.org/10.1007/bf03183258, 2003.
Yadava, M. G., Ramesh, R., and Pant, G. B.: Past monsoon rainfall variations in peninsular India recorded in a 331-year-old speleothem, Holocene, 14, 517–524, https://doi.org/10.1191/0959683604hl728rp, 2004.
Yan, M., Wang, B., and Liu, J.: Global monsoon change during the Last Glacial Maximum: a multi-model study, Clim. Dyn., 47, 359–374, https://doi.org/10.1007/s00382-015-2841-5, 2016.
Yanase, W. and Abe-Ouchi, A.: The LGM surface climate and atmospheric circulation over East Asia and the North Pacific in the PMIP2 coupled model simulations, Clim. Past, 3, 439–451, https://doi.org/10.5194/cp-3-439-2007, 2007.
Zhu, J. and Poulsen, C. J.: Last Glacial Maximum (LGM) climate forcing and ocean dynamical feedback and their implications for estimating climate sensitivity, Clim. Past, 17, 253–267, https://doi.org/10.5194/cp-17-253-2021, 2021.
Zhu, J., Liu, Z., Brady, E., Otto-Bliesner, B., Zhang, J., Noone, D., Tomas, R., Nusbaumer, J., Wong, T., Jahn, A., and Tabor, C.: Reduced ENSO variability at the LGM revealed by an isotope-enabled Earth system model, Geophys. Res. Lett., 44, 6984–6992, https://doi.org/10.1002/2017gl073406, 2017.
Zhu, J., Otto-Bliesner, B. L., Brady, E. C., Gettelman, A., Bacmeister, J. T., Neale, R. B., Poulsen, C. J., Shaw, J. K., McGraw, Z. S., and Kay, J. E.: LGM paleoclimate constraints inform cloud parameterizations and equilibrium climate sensitivity in CESM2, J. Adv. Model. Earth Syst., 14, https://doi.org/10.1029/2021ms002776, 2022.