the Creative Commons Attribution 4.0 License.
the Creative Commons Attribution 4.0 License.
 | 28 Feb 2025
Assessing the most severe subsistence crisis of the 18th century in the northwest of the Iberian Peninsula: a climatological perspective
José González-Cao
Nicolás G. deCastro
Juan J. Taboada
José M. Vaquero
Moncho Gómez-Gesteira
The analysis of climate variability over centuries reveals how environmental forces shaped society and helps contextualize modern climate trends and future projections. The persistent and heavy rains across several regions of the eastern Atlantic in 1768–1769 triggered the last and most severe agricultural crisis in Galicia and northern Portugal, leading to high mortality. The atmospheric conditions of this historical episode were analyzed using the EKF400v2 paleo-reanalysis dataset, which spans from the 18th century to the early 21st century. From June 1768 to May 1769, the rainfall anomaly in Galicia and northern Portugal was positive in 11 out of 12 months. Although the rainfall in northern Portugal appeared less intense than in Galicia, June 1768 had the highest positive rain anomaly of the century, and September 1768 had the second-highest. This excess precipitation agrees with the occurrence of pro-Serenitate rogations and written testimonies indicating an unusually high number of rainy days between June 1768 and May 1769. The atmospheric synoptic patterns for the rainiest months show negative anomalies in both sea level pressure and 500 hPa geopotential height in the northeastern Atlantic. These patterns are associated with troughs in the northeastern Atlantic that induce the formation of surface low-pressure systems and hinder the eastward progression of anticyclones into the region, resulting in more frequent episodes of rain and cold than usual.
- Article
(1203 KB) - Full-text XML
- BibTeX
- EndNote


The climate and weather conditions play a fundamental role in human health and in the development and evolution of societies, configuring some of their characteristics (Lamb, 1995; Pfister and Wanner, 2021). The impacts of climate and weather states on societies are complex and interconnected, affecting various aspects of human life. Seasonal variations and their extreme patterns condition the daily lives of individuals, determining clothing, house construction, food production and consumption, water resources, and social wellbeing, among others. When frequent deviations from the normal climatic pattern occur, illnesses, economic losses, and even deaths can result. Climate variability and extreme weather events can affect agricultural productivity and food availability (White et al., 2018a). Droughts, floods, and storms can damage crops and livestock, leading to food shortages and insecurity, particularly in vulnerable regions with limited access to resources (IPCC, 2019).
In recent decades, the scientific community has become aware of the importance of going back in time to deepen our understanding of the climate, as longer data records lead to more reliable and consistent interpretations of climate (Degroot et al., 2021). Analyzing climate behavior over centuries allows us to investigate how environmental forces have historically shaped various sectors of society, analyzing the vulnerabilities generated in different socioeconomic sectors, such as agriculture, transportation, and energy, as well as the resilience and adaptability of society to weather anomalies and climatic dynamics (Ljungqvist et al., 2021; Pfister and Wanner, 2021). Given the absence of reliable local or regional details in climate projections for precipitation and changes in extreme events, identifying similar patterns from the pre-industrial era could aid in understanding the mechanisms underlying future extreme hydrometeorological events (e.g., Diodato et al., 2019, 2020). Famines are often attributed to the interplay of climate-related and societal stressors within a framework of pre-existing environmental and social vulnerabilities (Slavin, 2016). Research on famine crises in medieval and early modern Europe provides a valuable, largely unexplored archive of societies that faced challenges akin to those of today (Ljungqvist et al., 2024). Examining the famines of the “Little Ice Age” (1300–1850) offers key insights into human–environment interactions, advancing our understanding of how past societies managed natural challenges and strengthening the foundation for future decision-making (Collet and Schuh, 2018; Wanner et al., 2022).
The analysis of historical climatic processes predating the industrial era is a highly challenging task, as it involves handling datasets of diverse origins, including instrumental data from in situ measurements and non-instrumental data obtained from proxies such as ecclesiastical rogations or written testimonies found in letters, diaries, and reports (Brönnimann, 2015; White et al., 2018b). Additionally, these datasets often vary in terms of reliability, completeness, and spatial coverage, further complicating the analysis and interpretation of historical climate patterns. The complexity of this task is compounded by the need to carefully validate and reconcile disparate sources of historical climate data, ensuring consistency and accuracy in the analysis. Furthermore, interpreting historical climate records requires a deep understanding of the context in which the data were collected, including social, cultural, and environmental factors that may have influenced observations and recording practices over time. Despite these challenges, studying historical climatic processes offers valuable insights into long-term climate variability and helps contextualize modern climate trends and future projections (White et al., 2018b; Pfister and Wanner, 2021).
Paleo-climatic reconstructions and modeling approaches (Trigo et al., 2004; Moravec et al., 2019) have been employed over the past 2 decades to analyze climate history, primarily focusing on droughts and rainfall patterns across Europe (Murphy et al., 2020; Diodato et al., 2020; Vicente-Serrano et al., 2020; Noone et al., 2017, 2016; Spraggs et al., 2015; Brázdil et al., 2015; Todd et al., 2013; Potop et al., 2014) and on drying trends in the Mediterranean region (Nicault et al., 2008). Additionally, historical documentary data have enabled a millennium-long reconstruction of damaging hydrological events across Italy and the broader Mediterranean, revealing 674 events from 800 to 2017 (Diodato et al., 2019). In particular, numerous historical studies on the Iberian Peninsula have primarily focused on droughts (Domínguez-Castro et al., 2008, 2012, 2021; Bravo-Paredes et al., 2020), with relatively limited attention to extreme rainfall events (Domínguez-Castro et al., 2015). Thus, most of the studies linked to excess rain refer to flood-linked events (see, among others, Gonzalez-Cao et al., 2021; Fernandez-Novoa et al., 2023, 2024; Beneyto et al., 2020; Benito et al., 2021; and Peña et al., 2022). Note that, according to the Köppen classification (Köppen, 1884), much of the southern and Mediterranean Iberian Peninsula experiences a temperate climate with hot, dry summers (Csa). In contrast, the northwestern Iberian Peninsula and the western coast of Portugal are classified as having a temperate climate with warm, dry summers (Csb) (see AEMET-IM, 2011, for further details). Annual precipitation is highly variable across the Iberian Peninsula (AEMET-IM, 2011). The highest precipitation levels, exceeding 2000 mm, occur in the mountainous regions of Serra do Gerês in northeastern continental Portugal and in areas near the “Rias Baixas” in southwestern Galicia (northwest of the Iberian Peninsula). Conversely, the lowest annual rainfall, below 300 mm, is found in the southeast of Spain.
Multiple records highlight the connection between excessive rainfall and crop losses throughout history leading to famine both across Europe (Alfani and Ó Gráda 2017; White et al., 2018a; Ljungqvist et al., 2023; Ljungqvist et al., 2024; Slavin, 2016) and more regionally in Ireland (Ó Gráda, 2017), Great Britain (Hoyle, 2017), France (Béaur and Chevet, 2017), Spain (Pérez Moreda, 2017), and northern Portugal (Amorim et al., 2017; Silva, 2019), among others. Particularly in Galicia, the biennium of 1768–1769 was characterized by incessant and heavy rains, resulting in the last and most significant agricultural crisis due to crop losses (Mejide-Pardo, 1965; Labrada, 1804; González-Fernández, 2000; Losada-Sanmartín, 2008; Martínez-Rodríguez, 2017), leading to a persistent famine that claimed human lives (Martín-García, 2001; Losada-Sanmartín, 2008; Silva, 2019). This situation, which historically occurred several times, gave rise to a saying that “in Galicia, hunger comes swimming” (Fernandez-Cortizo, 2005). The same author analyzes the Galician subsistence crisis during the 17th and 18th centuries, identifying that over 67 % of the rogations during these centuries were attributed to an excess of precipitation. A similar situation was observed in northern Portugal (Silva, 2019). However, famine was not observed in the rest of the Iberian Peninsula, as documented by multiple sources of data collected in Table 3.2 of Pérez Moreda (2017), which accounts for epidemics, death, and famines occurring on the Iberian Peninsula from 1500–1800, showing the years of excess mortality and famine in 60 small towns across Castile, Aragon, and Extremadura.
Regions described above are included in the Atlantic Arc region, which refers to a geographical area encompassing the western and northern coastal regions of Europe that border the Atlantic Ocean (https://cpmr-atlantic.org/, last access: 20 February 2025). The Atlantic Arc encompasses the region III (Celtic Sea) and region IV (Bay of Biscay and the Iberian coast) of the OSPAR Maritime Area (https://oap.ospar.org/en/ospar-assessments/quality-status-reports/qsr-2023/synthesis-report/introduction/, last access: 20 February 2025). This area, which typically includes countries such as Portugal, Spain, France, the United Kingdom, and Ireland, is characterized by its proximity to the Atlantic Ocean and shares similar climatic, environmental, and economic characteristics due to this coastal influence.
The objective of this study is to analyze the atmospheric conditions in the Atlantic Arc from June 1768 to May 1769, which precipitated the most severe agricultural crisis in Galicia and northern Portugal in the 18th century, resulting in high mortality. To achieve this, precipitation and atmospheric pressure data obtained from a paleo-reanalysis dataset spanning from the 18th century to the early 21st century will be utilized. Current climate data generated by ERA5 and precipitation data from a precipitation gauge at Santiago de Compostela will be used to corroborate that the synoptic conditions observed during that biennium are reproduced in the present day.
2.1 Identification of the 1768–1769 event
The intense and persistent rainfall event of 1768–1769, which led to a famine in Galicia and northern Portugal, resulting in human casualties in excess due to the complete devastation of crops, was identified through various sources of information with diverse characteristics and locations. In any case, historical sources verified that the event impacted not only the Atlantic coast of the Iberian Peninsula but also the entire Atlantic Arc. However, in other regions, the event did not have as severe consequences on contemporary society as it did in Galicia and northern Portugal.
There are multiple sources confirming the biennium 1768–1769 as extraordinarily rainy in the Atlantic European region (red points in Fig. 1). Particularly in England, Barker (1771) identifies 1768 as 1 of the 3 rainiest years in the period from 1683 to 1771 in London (Rutlandshire). Clark (1999) analyzes the synoptic pattern preceding the major flood that occurred in Somerset on 1 September 1768. Additionally, Macdonald and Sangster (2017) include the 1768 floods in the historical flood list, although they did not attribute it significant importance.
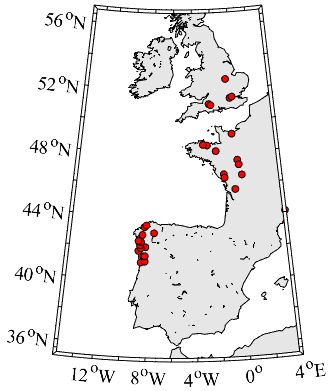
Figure 1Atlantic Arc region, encompassing Portugal, Spain, France, England, and Ireland. Red points indicate all instrumental or documentary testimony collected regarding the extraordinary rainy event of 1768–1769.
In France, there are both instrumental records and contemporary testimonies regarding the abundant rainfall in Bordeaux and in Vendée, particularly testimonies from the priest of La Limouzinière (Vendée), stating,
This year 1768 has been one of the rainiest that we have seen in living memory, the rains began in June and were almost continuous …
(Cette année 1768 a été une des plus pluvieuses qu'ont ait vu de mémoire d'homme, les pluyes ont commencées au mois de juin et ont été presque toujours continuelles …);
from the priest of Lairoux (Vendée), mentioning,
this year (1768) was remarkable for the abundance of water in the height of summer, which began to fall on the feast day of Saint Médard (June 8) …
(cette année (1768) fut remarquable par l'abondance des eaux au plus fort de l'été qui commencèrent à tomber la fete du dit Saint Médard (June 8) …);
and from the prior of Lasse (Maine-et-Loire), who wrote,
In the current year (1768), the rains have been so continuous that in the memory of men, they have never seen the like …
(Dans la présente année (1768) les pluies ont été si continues que de mémoires d'hommes on en avait vu de pareille …).
Finally, Le Roy Ladurie (2011) discusses the impact of climatic conditions on crops, stating,
From 1768 onwards, due to unfavorable weather conditions, too cool and/or too wet, poor harvests and the rise in grain prices became prevalent …
(À partir de 1768, en raison de circonstances météo défavorables, trop fraiches et/ou trop humides, les mauvaises récoltes et la hausse des prix frumentaires s'imposent …),
although it is also mentioned that its effect on mortality was smaller than that observed in 1740.
On the Iberian Peninsula, Font-Tullot (1988) identifies 1768 as a particularly rainy year in the Galico-Cantabrian region (northwest of Spain). In the specific case of Galicia, Pérez-Constanti (1925) compiles information from several doctors in Santiago de Compostela on 17 April 1769, who stated,
… since the month of May of last year 1768, until the present time, it has almost always been raining … as it did in the months of February, March, and April of this year …
(… desde el mes de Mayo del año pasado de 68, hasta el tiempo presente, está casi siempre lloviendo … como lo hizo en los meses de febrero, marzo y abril del presente año …).
The same doctors also remarked,
… it has been eighteen months since we have known the beneficial influences of the seasons, almost continuous rain and cold winds have confused summer, winter, autumn, and spring …
(van pasados diez y ocho meses que no hemos conocido los influjos saludables de las estaciones del año, casi continua lluvia y vientos fríos han confundido verano, invierno, otoño y primavera …).
The coincidence of these testimonies with the earlier ones described by the French priests is striking. Lastly, in northern Portugal, Silva (2019), through an annual precipitation index (Fig. 23 of his thesis), indicated that the end of summer and the fall of 1768 were characterized by high amounts of rain, serving the prelude to a severe agrarian crisis. Additionally, Amorim et al. (2017) identifies severe floods in the Porto region due to continuous rains in 1768–1769.
These specific climatic conditions were reflected in numerous ecclesiastical rogations “pro-Serenitate” held in various locations in Galicia and northern Portugal (Silva, 2019; González-Fernández, 2000; Losada-Sanmartín, 2008). These authors have referred to the crisis of 1768–1769 as one of the two most severe in the 18th century, accompanied by episodes of hunger and excess mortality throughout the region, as documented in numerous studies (Ávila la Cueva, 1852; Meijide-Pardo, 1965).
Other studies emphasize the impact of the extraordinary climatic conditions on cereal harvest (Pérez-Costanti, 1925; Meijide-Pardo, 1965; Martínez-Rodríguez, 2017), which is also reflected in tithe records (Eiras, 1990).
2.2 Databases
Historical data of precipitation, sea level pressure (SLP), and geopotential height (GPH) at 500 hPa at a monthly scale were obtained from the EKF400v2 paleo-reanalysis database with approximately 2° spatial resolution (Valler et al., 2022). According to these authors, the EKF400v2 utilizes atmospheric-only general circulation model simulations (CCC400). The 30 ensemble members were generated with the ECHAM5.4 general circulation model. These simulations are augmented by a significantly expanded observational network comprising early instrumental temperature and pressure data, documentary evidence, and proxy records derived from tree-ring width and density. Additionally, new types of observations, including monthly precipitation amounts, the frequency of wet days, and coral proxy records, have been incorporated into the assimilation process. In this version 2 system, the assimilation procedure has undergone methodological enhancements, notably the estimation of the background-error covariance matrix through a blending technique involving both time-dependent and climatological covariance matrices. The EKF400v2 model simulations cover the period from the beginning of 18th century to the beginning of the 21st century. For further details, the reader is referred to Valler et al. (2022).
Two additional long-term regional precipitation series were considered. For Ireland, the Island of Ireland 1711 (IoI_1711) series was used, providing continuous monthly precipitation data from 1711 to 2016 (Murphy et al., 2018a). The post-1850 series was constructed using quality-assured monthly precipitation records compiled by Noone et al. (2016), while the pre-1850 series was derived from instrumental and documentary sources compiled by the UK Met Office (Jenkinson et al., 1979). The monthly IoI series was accessed on PANGAEA (https://doi.org/10.1594/PANGAEA.887593; Murphy et al., 2018b). For Wales and England, the England and Wales Precipitation (EWP) series (Alexander and Jones, 2001; Simpson and Jones, 2014) were considered. These series represent an area-averaged precipitation record derived from five rainfall regions representing England and Wales. They provide a continuous monthly precipitation record from 1766 and are regularly updated by the UK Met Office (UKMO) Hadley Centre, from which monthly data were accessed (https://www.metoffice.gov.uk/hadobs/hadukp/, last access: 20 February 2025). Both datasets were combined by Murphy et al. (2020) to reconstruct and analyze monthly precipitation in England and Wales, Scotland, and Ireland and to reevaluate historical droughts over the period 1748–2000. Notably, the overlooked drought of 1765–1768, which impacted the British Isles, was identified as the most significant event in their 250-year reconstruction. This event can serve as a valuable benchmark for stress-testing current systems to ensure resilience.
In situ monthly precipitation data were obtained from precipitation gauges located at Lyndon and Cornwall in England and Bordeaux in France. The precipitation series at Lyndon spans from 1737 to 1770, while at Bordeaux it covers from 1751 to 1770 and in Cornwall it covers from 1767 to 1771. Moreover, the cumulative number of rainy days in Exeter, England, from 1755 to 1775 was obtained from Exeter weather diaries, accessible at https://digital.nmla.metoffice.gov.uk/IO_11c660bd-60c1-4d59-a079-64fdbdb20144 (last access: 20 February 2025).
Current daily precipitation data in Galicia were obtained from a rain gauge located at Santiago de Compostela (42°53′17′′ N, 8°24′30′′ W), available at https://www.aemet.es/es/datos_abiertos (last access: 20 February 2025). This rain gauge has the longest precipitation series in Galicia from 1944 to 2023. Additionally, monthly sea level pressure and geopotential height at 500 hPa were retrieved from the ERA5 database (https://doi.org/10.24381/cds.f17050d7; Hersbach et al., 2023) at a spatial resolution of 0.5°, covering the region from 60 to 25° N and from 5° E to 45° W for the period 1940–2023.
The cumulative annual precipitation for each month was calculated by considering the preceding 6 months and the subsequent 5 months relative to the month under study. The same methodology was applied for calculating the number of rainy days per month. This approach enables the determination of both the cumulative precipitation and the number of rainy days per year without relying on calendar years.
The precipitation anomaly was calculated using EKF400v2 data for the period of maximum cumulative rainfall from June 1768–May 1769, documented in the data sources described in the previous section, relative to the annual mean for the period 1755–1785 (Fig. 2). The precipitation anomaly reached values of 200 mm in French Brittany and southern England and values of approximately 150 mm in Galicia and northern Portugal, where typical annual precipitation ranges from 1000 to 1200 mm (AEMET-IM, 2011).

Figure 2Precipitation anomaly (mm) during the period of maximum cumulative rainfall (June 1768–May 1769) relative to the annual mean for the period 1755–1785.
3.1 Analyzing the historical persistent and heavy rainfall event
The cumulative annual precipitation provided by EKF400v2 data in Galicia (Fig. 3a) and northern Portugal (Fig. 3b) over the period 1755 to 1785 shows a peak during the final 6 months of 1768 and the initial 6 months of 1769, with values exceeding 1200 mm.
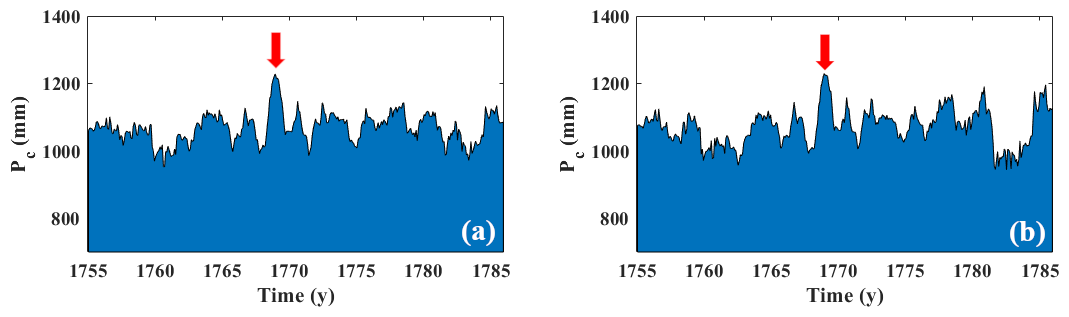
Figure 3Cumulative annual precipitation (mm) in Galicia (a) and northern Portugal (b). Data are obtained from the EKF400v2 paleo-reanalysis database. The red arrow marks the 1768–1769 precipitation peak.
This persistent and heavy rainfall event was also observed in neighboring regions such as Ireland (Fig. 4a), Wales and England (Fig. 4b), and Normandy and French Brittany (Fig. 4c), where similar peaks in cumulative precipitation occurred simultaneously.
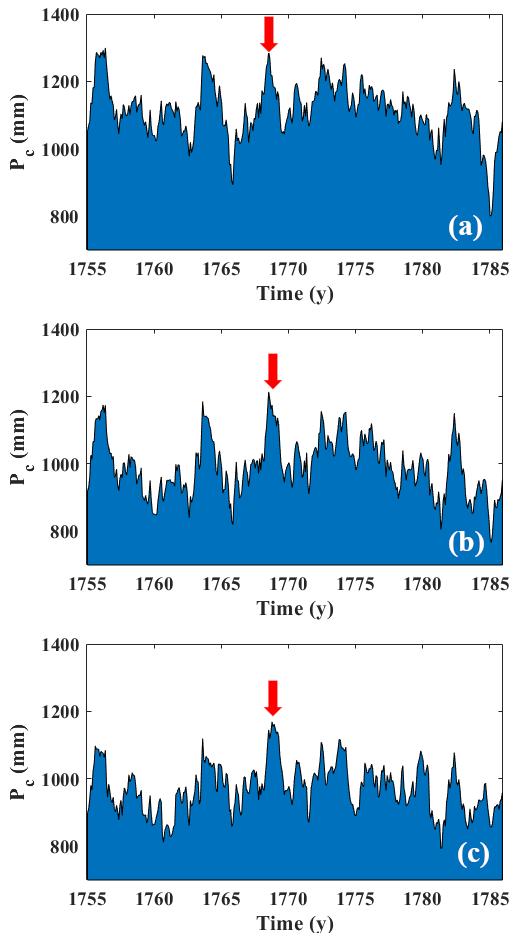
Figure 4Cumulative annual precipitation (mm) in Ireland (a), Wales and England (b), and Normandy and French Brittany (c). Data are obtained from the EKF400v2 paleo-reanalysis database. The red arrow marks the 1768–1769 precipitation peak.
Figure 4a illustrates the precipitation in Ireland for the decades just before and after the extreme rain event observed from mid-1768 to mid-1769 on the NW Iberian Peninsula. The drought period of 1765–1768, as analyzed by Murphy et al. (2020), immediately precedes the peak rainfall of 1768–1769. While the period 1768–1769 appears significantly rainy, it is comparable to other rainy events identified in preceding and subsequent decades. These findings align with those derived from Murphy's reconstructed database for Ireland, Murphy et al. (2020), as depicted in Fig. 5a.
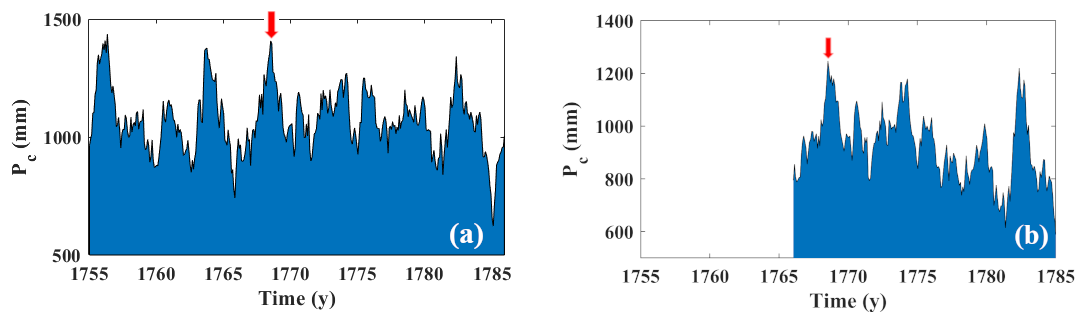
Figure 5Cumulative annual precipitation (mm) in Ireland (a) and Wales and England (b). Data are from Murphy et al. (2018a) for Ireland and from Alexander and Jones (2001) and Simpson and Jones (2014) for Wales and England. The red arrow marks the 1768–1769 precipitation peak.
In Wales and England (Fig. 4b), similarly to the case of Ireland, a peak in cumulative precipitation between 1768 and 1769 is observed following the drought of 1765–1768. Once again, the precipitation peak is comparable to that observed at the beginning of the decade. As was the case with Ireland, the results are comparable to those from the reconstructed database for Wales and England (Alexander and Jones, 2001; Simpson and Jones, 2014) used in Murphy et al. (2020), as depicted in Fig. 5b.
In France (Fig. 4c), it is also evident that the peak in cumulative precipitation spanning from 1768 to 1769 is the highest of the period under study (1755–1785), although it is not as pronounced as the peak identified in Galicia and northern Portugal.
Similar information can be obtained from local in situ precipitation gauges, such as those illustrated in Fig. 6 for Lyndon and Cornwall in England (Fig. 6a and b, respectively) and for Bordeaux in France (Fig. 6c).
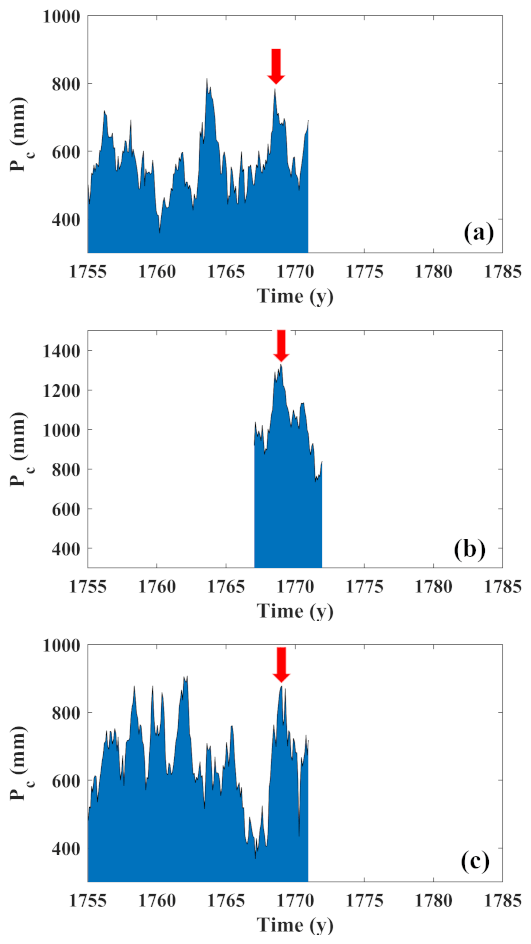
Figure 6Cumulative annual precipitation (mm) in (a) Lyndon (England), (b) Cornwall (England), and (c) Bordeaux (France). Data are derived from local in situ precipitation gauges. The red arrow marks the 1768–1769 precipitation peak.
In situ data corroborate the presence of a peak in rainfall at these locations between 1768 and 1769. Unfortunately, the limited duration of the precipitation series restricts our ability to gain a broader perspective.
In the same line, the cumulative number of rainy days calculated from in situ precipitation data at Exeter (England) from 1755 to 1775 demonstrates a notable positive anomaly of between 20 and 40 d between mid-1768 and mid-1769 (Fig. 7).
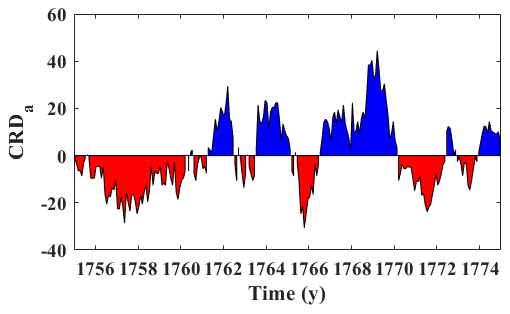
Figure 7Cumulative number of rainy days at Exeter (England). Data are derived from local in situ precipitation gauges.
The origin of this precipitation anomaly pattern can be analyzed in terms of the anomaly in SLP (Fig. 8a) and in GPH (Fig. 8b), for the region under study during the period from June 1768 to May 1769, relative to the annual mean for the period 1755–1785.
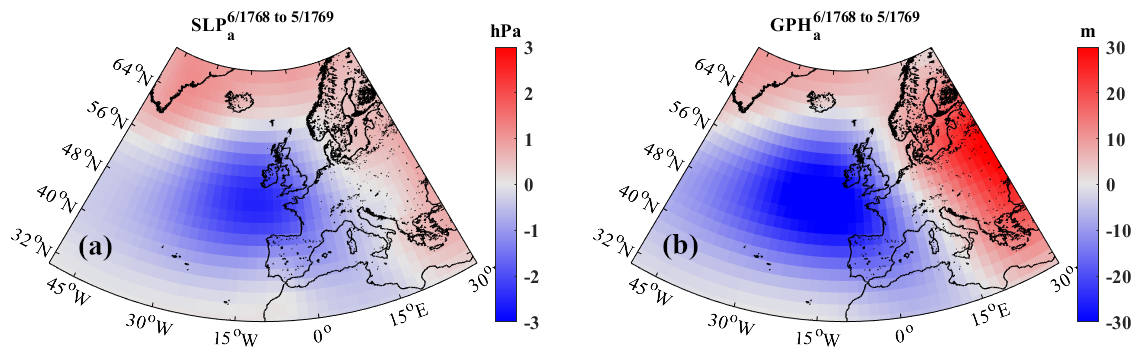
Figure 8(a) SLP anomaly (hPa) and (b) 500GPH anomaly (m) during the period June 1768—May 1769, relative to the annual mean for the period 1755–1785. Data are obtained from the EKF400v2 paleo-reanalysis database.
Both panels depict a negative anomaly minimum of approximately 3 hPa in the SLP (Fig. 8a) and of 30 m in the GPH (Fig. 8b), locating the area of strongest anomaly (negative) in the Bay of Biscay and covering the westernmost part of Europe inside the low-anomaly area.
3.2 Analyzing current persistent and heavy rainfall events
After identifying the synoptic conditions that led to the extraordinary rainfall during the period June 1768 to May 1769, the next step will be to analyze whether similar patterns have been observed over the past 80 years, during which abundant instrumental records facilitate the identification of unusual rainfall events. Considering that documentary records point out the presence of incessant rains over the period 1768–1769, the number of rainy days per month was calculated from 1944 to 2023 using data from the Santiago de Compostela rain gauge. A day was considered rainy when at least 1 mm of precipitation was collected (AEMET-IM, 2011). The number of days corresponding to the mean and the 50th (median), 90th, and 95th percentiles is shown in Table 1. Note that Santiago de Compostela was one of the places most affected by the 1768–1769 rainfall and has one of longest meteorological series in the area of study, which makes it an optimal candidate to analyze how current patterns can be related to those obtained almost 3 centuries ago.
Table 1Number of days corresponding to the mean and the 50th (median), 90th, and 95th percentiles of rainiest days per month from 1944 to 2023 using data from the Santiago de Compostela rain gauge.
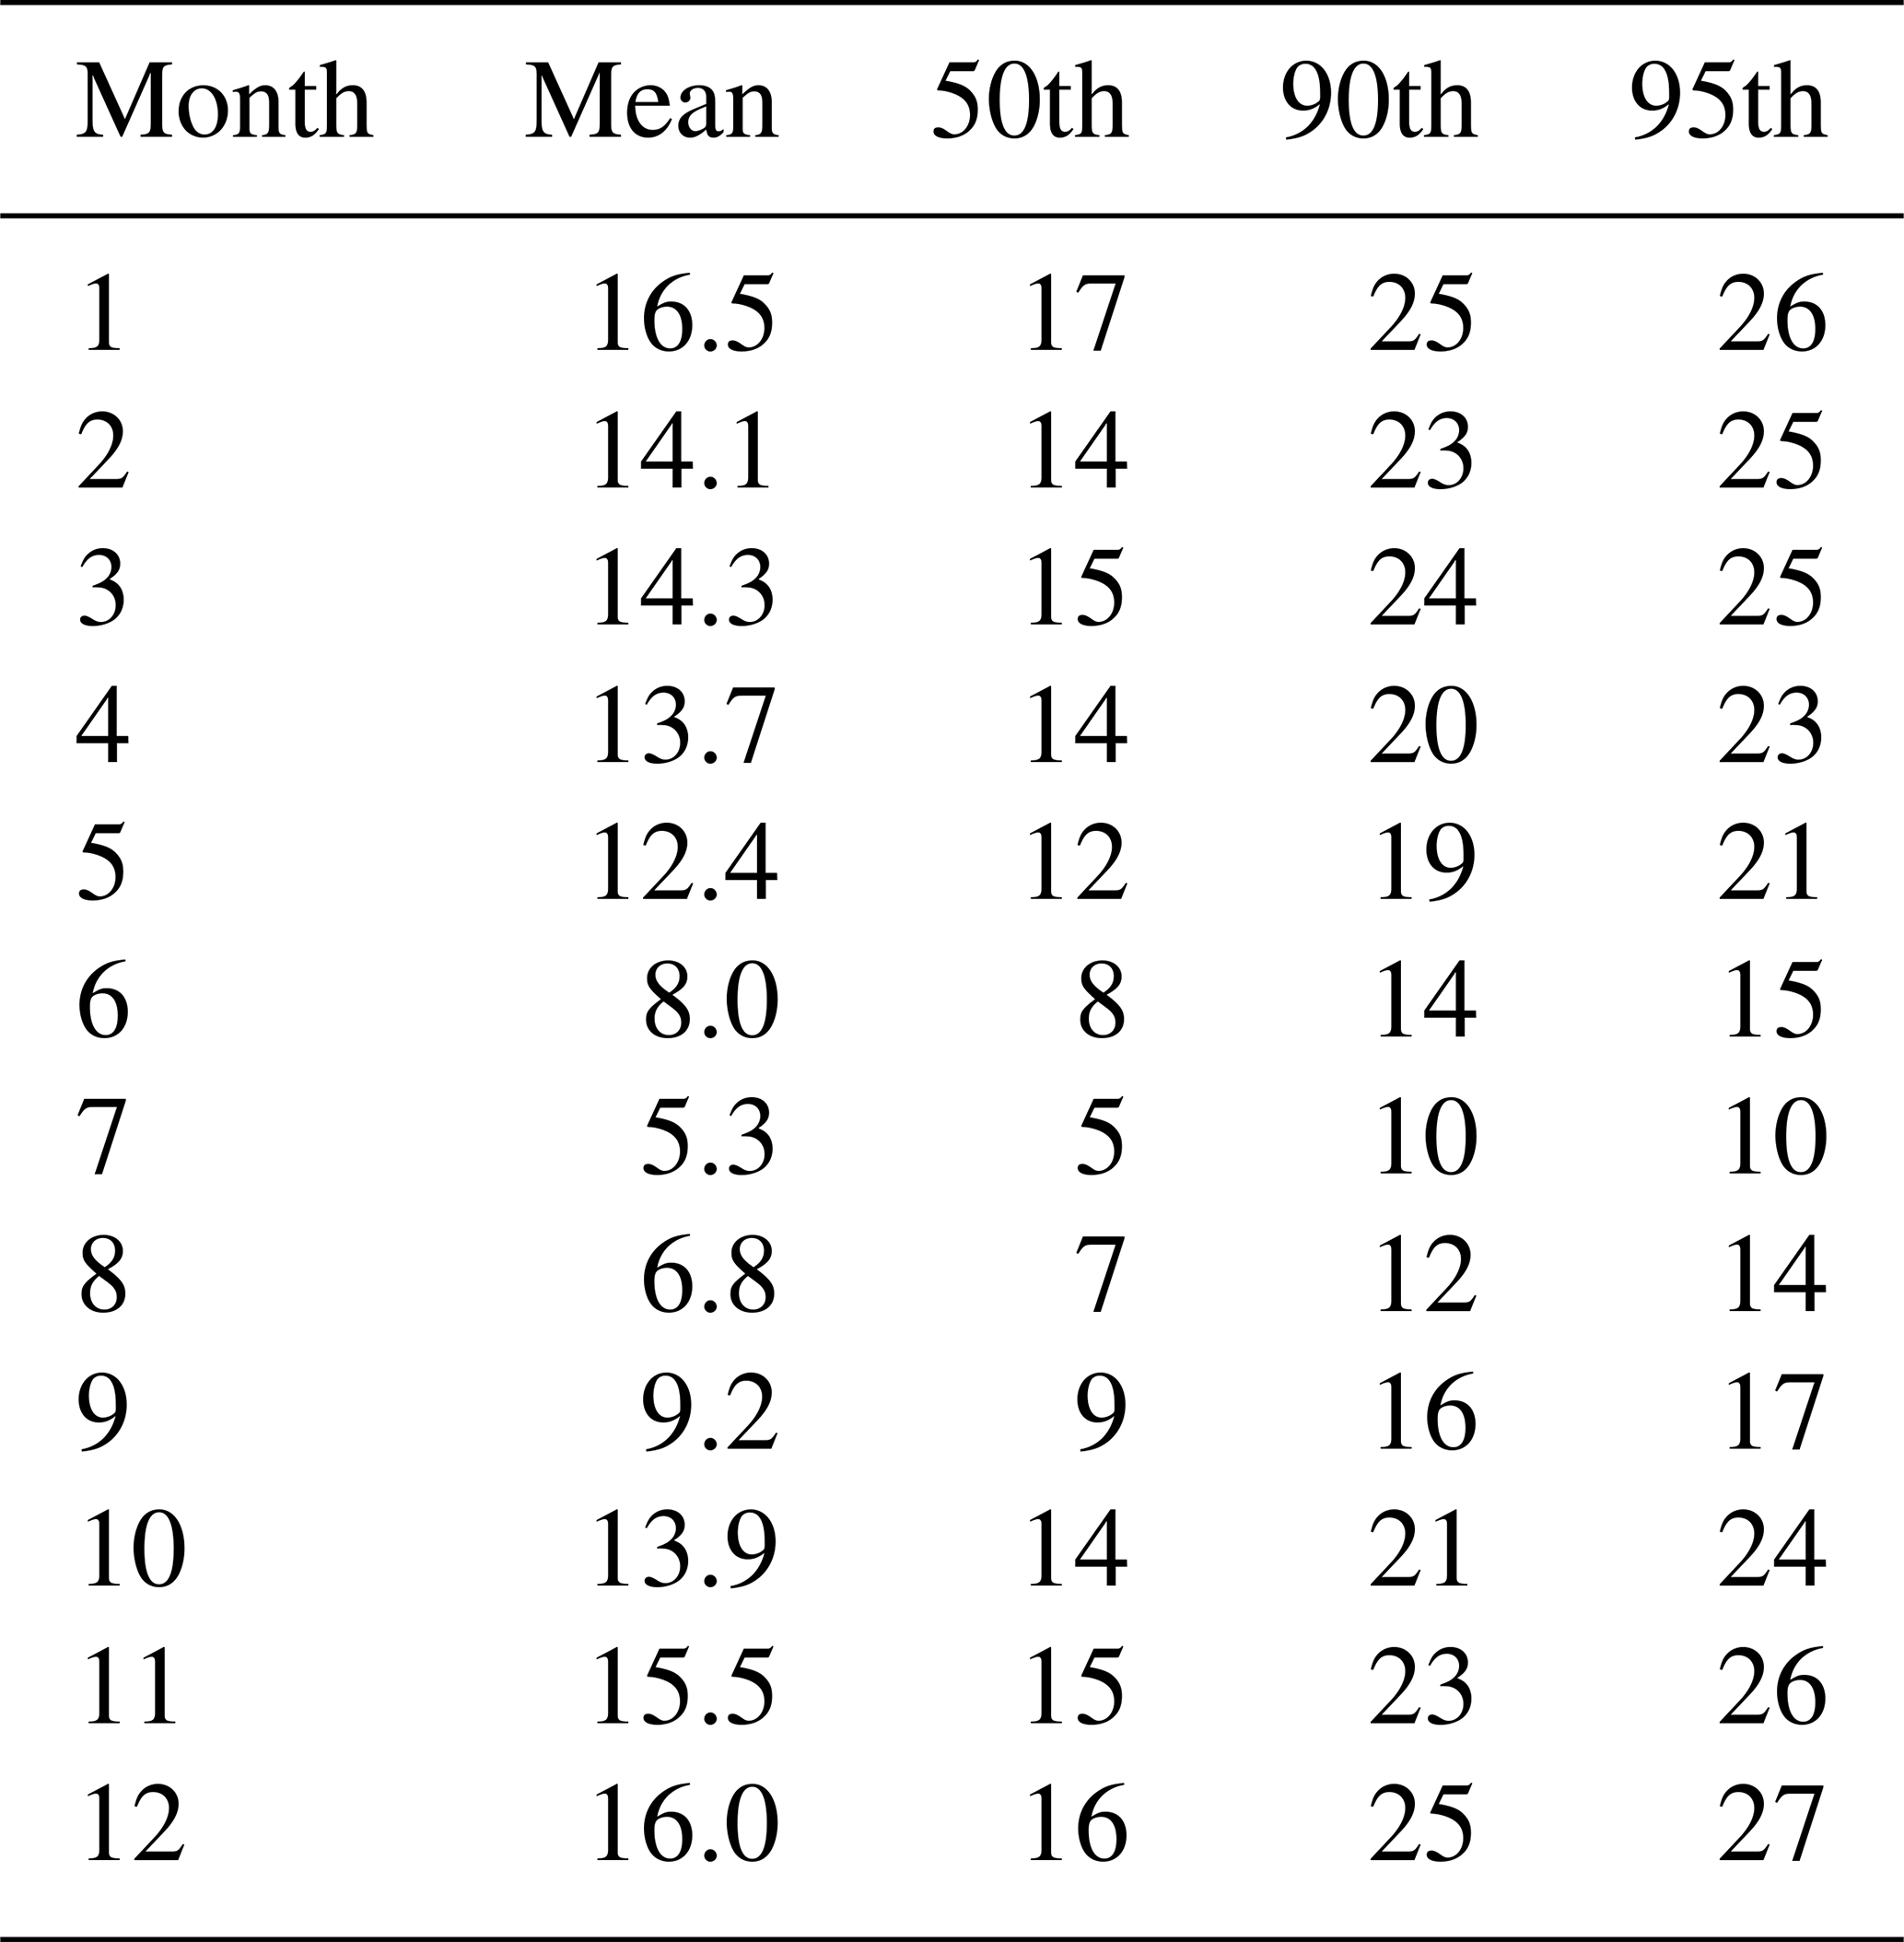
The 50th percentile serves as a reference to the number of rainy days per month in a normal year, while the 90th and 95th percentiles provide information on the number of rainy days per month in extreme years. In fact, the total number of days in Santiago de Compostela during a normal year (50th percentile) with precipitation equal to or greater than 1 mm is 146 d. This is similar to the value reported in the Iberian Climatic Atlas (AEMET-IM, 2011), which states that the highest number of days with precipitation equal to or greater than 1 mm (over 150 d) in the Iberian Peninsula occurs, among other regions, in the northeastern Galicia. Additionally, the 95th percentile is exceeded by 23 d of precipitation per month in 7 months, which include January to April and October to December (JFMAOND). In the summer months, the 95th percentile for June, July, and August is 15, 10, and 14 d, respectively.
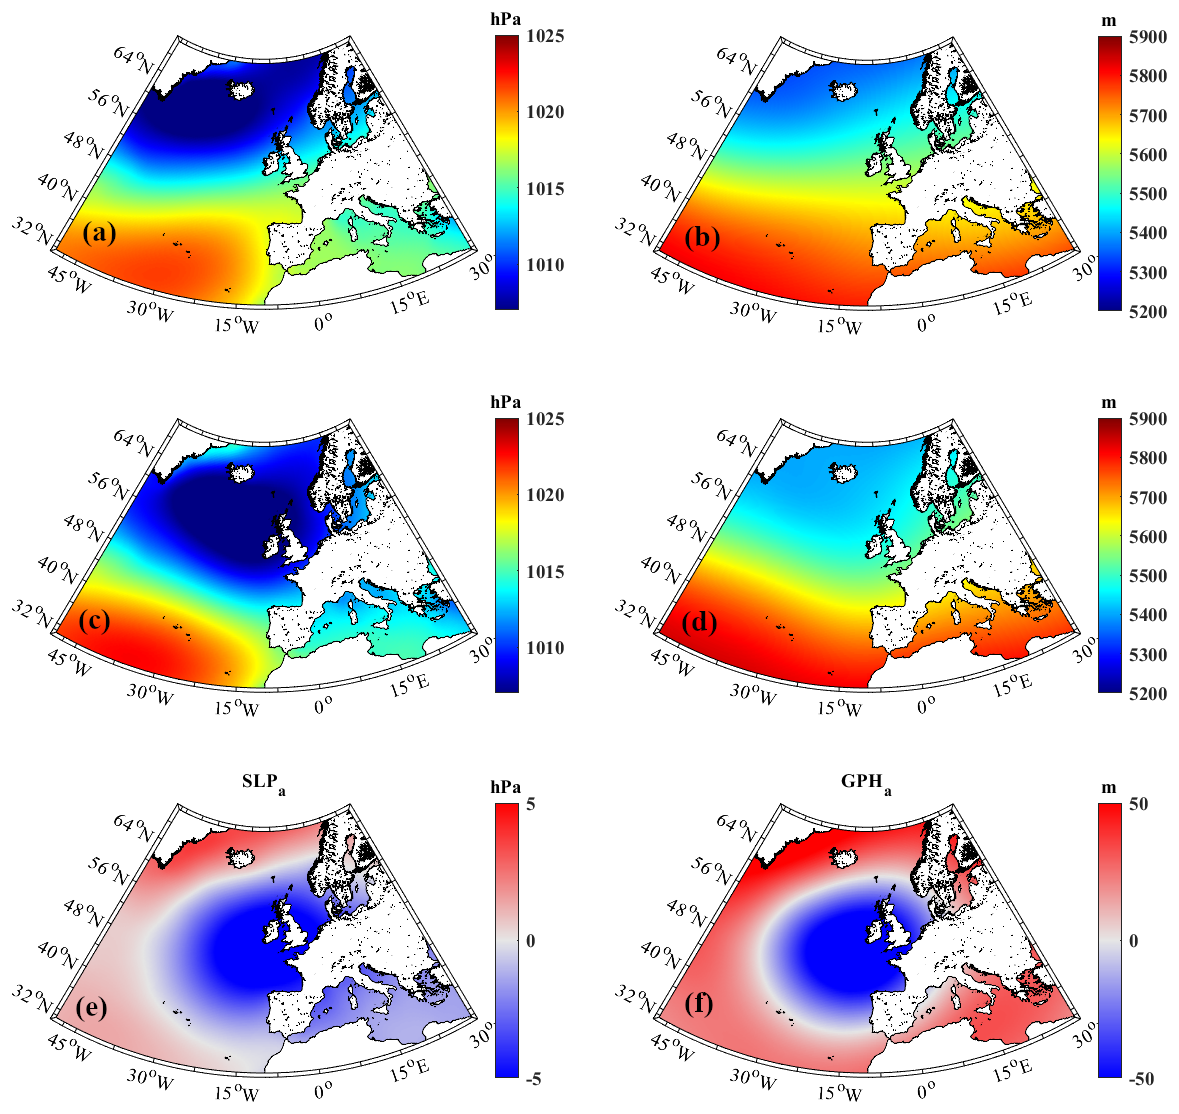
Figure 9(a) Annual SLP composite (hPa) from 1944 to 2023. (b) Annual GPH composite (m) from 1944 to 2023. (c) Annual SLP composite during the rainiest months (exceeding the 95th percentile for that month). (d) Annual GPH composite during the rainiest months (exceeding the 95th percentile of that month). (e) Annual SLP composite of anomalies, calculated as the difference between panels (c) and (a). (f) Annual GPH composite of anomalies, calculated as the difference between panels (d) and (b).
The precipitation observed during the rainiest months (95th) over the recent period 1944 to 2023 was analyzed using composite maps. Initially, the mean composite map for SLP and GPH was calculated from 1944 to 2023. Subsequently, the composite maps (SLP and GPH) for extreme rainy conditions were determined as follows: (i) the monthly 95th percentiles of the rainiest days presented in Table 1 served as threshold values; (ii) for each month, its composite maps were generated by averaging SLP or GPH only for the years when the number of rainy days in that month exceeded the threshold; and (iii) the monthly composite maps were then averaged to obtain the annual composite maps corresponding to rainy months. Finally, the mean annual composite map was subtracted from the rainy composite map to yield the anomaly. The mean composite from 1944 to 2023 and anomaly maps for SLP and GPH are illustrated in Fig. 9, with the left column representing SLP and the right column representing GPH. The mean composite map for SLP (Fig. 9a) was subtracted from the SLP composite map for rainy months (Fig. 9c) to obtain the SPL anomaly (Fig. 9e). Similarly, the GPH anomaly (Fig. 9f) was obtained by subtracting Fig. 9b from Fig. 9d.
The synoptic patterns shown in Fig. 9 are similar to the ones obtained during the 1768–1769 rainy event (Fig. 8) with the Iceland low anomaly low and displaced southeastward over the Bay of Biscay.
The period from June 1768 to May 1769 was characterized by incessant and heavy rains in the northwestern region of the Iberian Peninsula, resulting in the last and most significant agricultural crisis due to crop losses and leading to a persistent famine that claimed human lives. During these years, Spain was a country immersed in Bourbon reformism and, in particular, in the reforms led by King Charles III, which were characterized by enlightened ideas, as long as these did not endanger his absolute power and the traditional social order (enlightened absolutism). In 1766, a strong crisis occurred that triggered the so-called “Esquilache Riot”, largely motivated by a subsistence crisis as a result of a very sharp rise in the price of bread. This rise in the price of bread was motivated by a combination of poor harvests and the promulgation of a decree in 1765 that liberalized the grain market (Domínguez Ortiz, 2005).
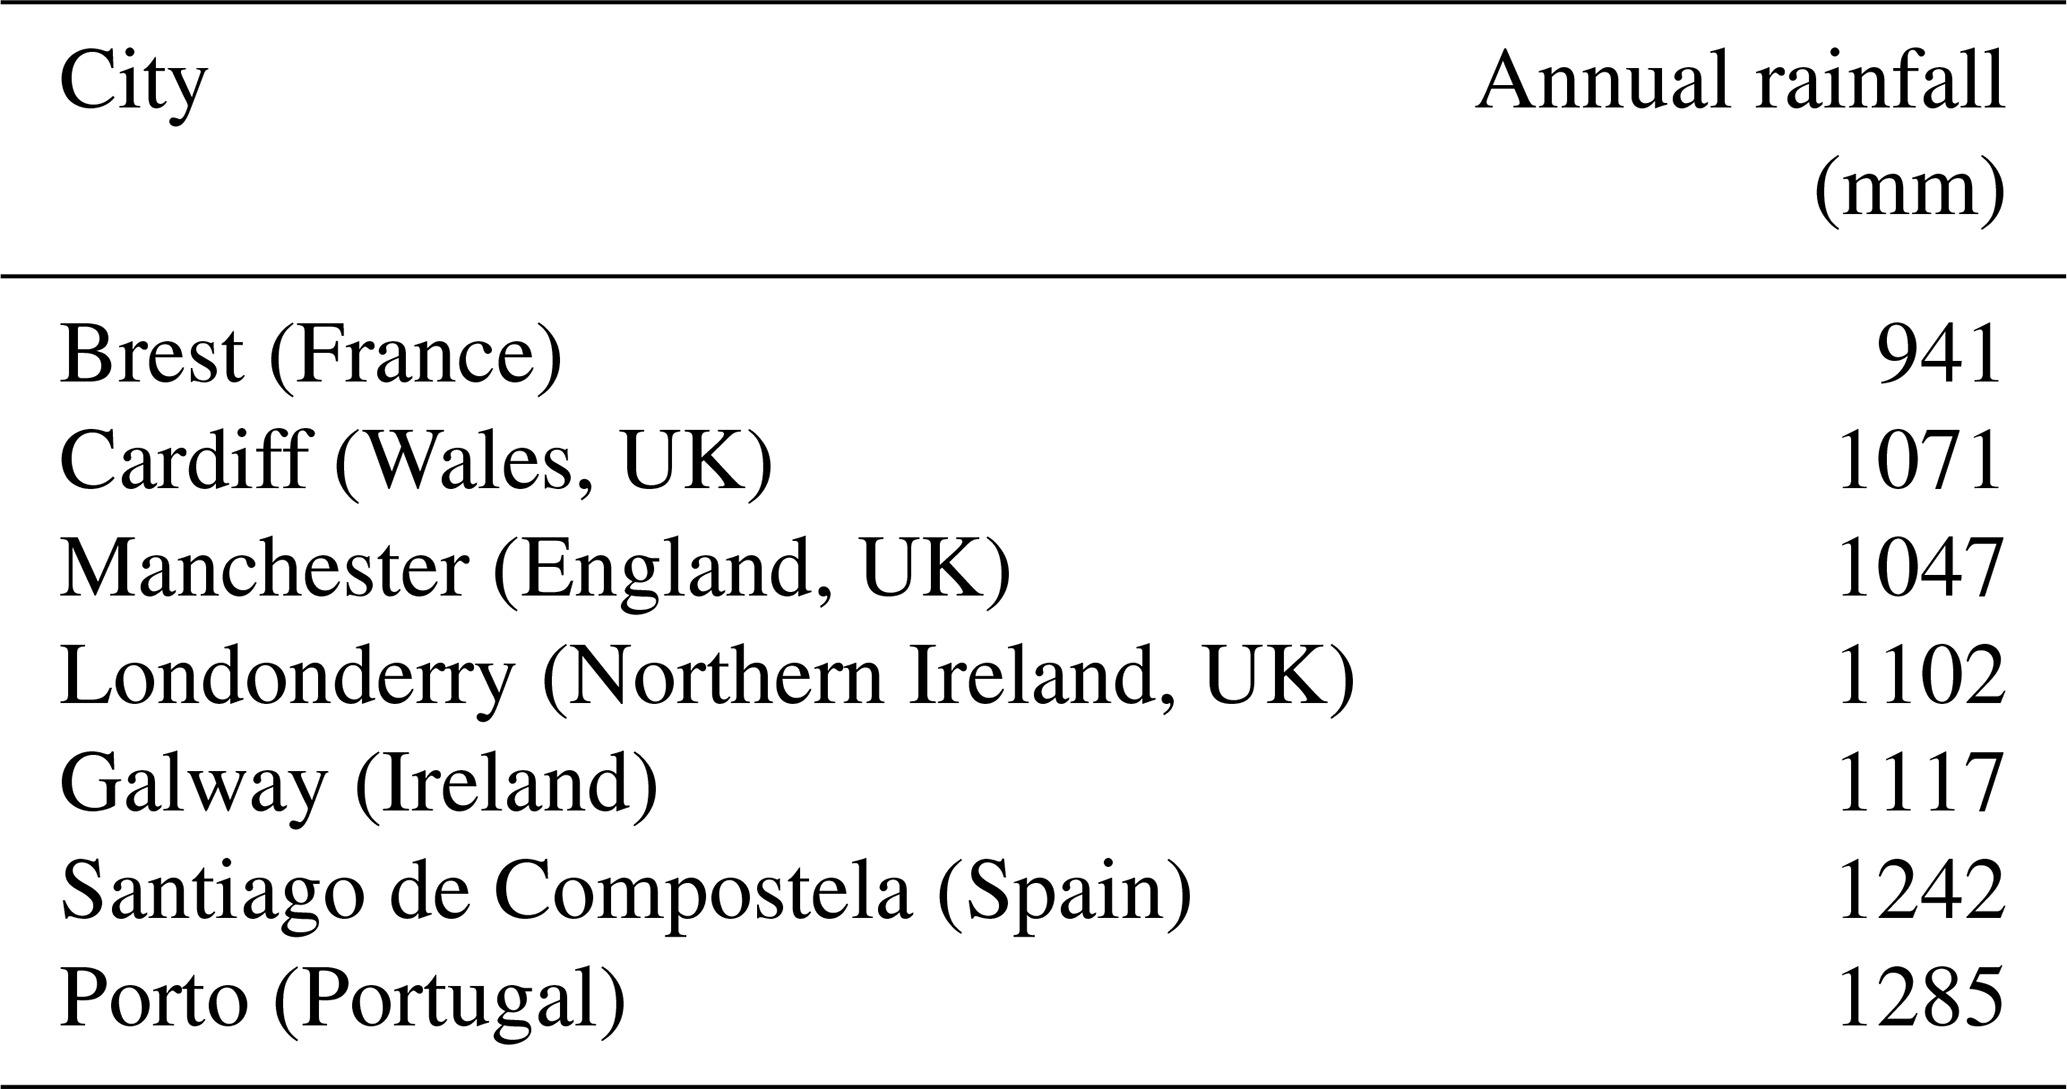
The poverty and low level of socioeconomic development in the northwestern region of the Iberian Peninsula were also contributing factors to the absence of instrumental measurements, which were already incipient at other European locations during the period of interest. The first instrumental readings of the weather in Galicia were located in Ferrol in 1788 (Domínguez-Castro et al., 2014). Additionally, the first instrumental meteorological readings in northern Portugal were made by Joao da Veiga in Lamego, from 1770 until 1784 (Alcoforado et al., 2012). This lack of instrumental information was partially mitigated by utilizing other documentary sources, such as rogation ceremonies, convent diaries, and letters, which allowed the categorization of meteorological events following the method proposed by Pfister (1984, 1992). The ecclesiastical rogations “pro-Serenitate” constitute a fundamental source of information used to characterize the historical rainy event in Galicia and northern Portugal (Fernandez-Cortizo, 2005; Silva, 2019), complementing the written testimonies previously described (Silva, 2019). In particular, the ecclesiastical rogation database corresponding to Santiago de Compostela, possibly the ground zero of the event in terms of deaths and socioeconomic impact, contains 283 rogation masses over the period 1670–1804 (approximately 2 per year), among which 70 were for rain (pro-Pluvia) and 181 were for fair weather (pro-Serenitate). This strongly contrasts with observations in other parts of the Iberian Peninsula, where pro-Serenitate rogations are less common (Domínguez-Castro et al., 2008, 2012, 2021; Bravo-Paredes et al., 2020) due to particular climate conditions that characterize the NW corner of the Iberian Peninsula. For comparison purposes, Table 2 exhibits the current annual precipitation levels at the most rainfall-prone locales within the Atlantic Arc, encompassing Santiago de Compostela (Spain) and Porto (Portugal), both situated within the designated area of interest.
Table 2Current annual rainfall at the rainiest locations in the Atlantic Arc averaged over the period 1991–2021. Source: https://es.climate-data.org/ (last access: 20 February 2025).
During the decade encompassing the event (from 1761 to 1770), 20 pro-Serenitate and 6 pro-Pluvia rogations were celebrated in Santiago, which aligns with the average during the longer period (1670–1804) mentioned above. However, the summer of 1768 stood out for the frequency of rogations for fair weather, with four ceremonies held in Santiago from June to August of that year. In Pontevedra, located 60 km south of Santiago, pro-Serenitate rogations occurred in May and September 1768 and May 1769. Similarly, rogations for fair weather were documented in Braga (northern Portugal) in September and October 1768 (Silva, 2019). The same author (refer to page 214) indicates that 1768 witnessed the highest number of pro-Serenitate rogative processions in the 17th–18th century for northern Portugal. Another noteworthy aspect highlighting the intensity of the 1768–1769 event is that, in the city of Santiago de Compostela during the historical record (1670–1804), pro-Serenitate rogations took place only on six occasions in 2 summer months of the same year, 1768 (June and August) being one of those years.
This high-precipitation event was not confined exclusively to this area of the Iberian Peninsula but extended to other areas of France, Wales, England, and Ireland, although, in these regions, it did not lead to agricultural and demographic crises. This may be attributed to the proactive measures taken in other areas such as France, following the “Great Winter” of 1709, where strategies like product substitution were adopted. As a result, wheat was replaced by less prized substitutes, such as buckwheat, rye, and chestnuts (Béaur and Chevet, 2017). The introduction of buckwheat in western France is believed to have contributed to the region's relatively mild impact during the great famines of the 18th century (Nassiet, 1998). Similarly, in the UK, some authors (Hoyle, 2017) suggest that the climatic variability of the early 18th century may have prompted the cultivation of root crops in fields as an emergency fodder crop. By the late 1720s, potatoes had become a common part of the diet among the poor. Nevertheless, there remains the possibility that famine was averted because potatoes, like oats, provided the option for people to switch to cheaper, albeit less desirable, foodstuffs during years of high prices. In Ireland, potato had become the base of the diet, as the popular saying stated,
potatoes in the morning, potatoes at noon; and if I rose at midnight, it would still be potatoes
(ditty prátaí ar maidin, prátaí um nóin; is dá n-éireoinn meánoíche, prátaía gheobhainn).
In Galicia and northern Portugal, all sources indicate a severe famine. To comprehend the diverse implications of the historical rainy event on the societies on these regions, it is imperative to understand the socioeconomic context of Galicia and northern Portugal at that time. One reason for the famine in this area stemmed from the predominant reliance on wheat and rye crops during that period. Traditionally, the most agriculturally productive regions of the Iberian Peninsula were the south and center, where Mediterranean agriculture thrived, particularly with the cultivation of wheat. Conversely, the north faced challenges due to its humid climate, which posed difficulties for staple crops, such as olive trees and vines, to adapt. The introduction of crops from the Americas significantly transformed the agricultural and commercial landscape. For the northern regions, the emergence of potatoes and corn provided a solution to their historical agricultural constraints. However, by 1768–1769, these new crops had not yet been widely adopted. Corn, native to the Americas, arrived in Europe around 1604, initially being cultivated in Cantabria (NW, Spain). Despite its early introduction, corn initially faced resistance and was primarily used as fodder. Similarly, the potato, encountered by Spanish conquistadors in the Andean regions in the mid-16th century, was initially disregarded as food and used primarily for animals and ornamental purposes until the early 18th century. Consequently, the widespread acceptance and culinary use of potatoes, as exemplified by the Spanish potato omelet, did not occur until the late 18th century, 1798 (López Linage, 2008). Table 3 provides details on the planting and harvesting seasons for various crops in the current area of interest.
Table 3Planting and harvesting periods for various crops are exemplified by the provinces of A Coruña and Pontevedra in Galicia, which were the most affected areas (https://www.mapa.gob.es/es/estadistica/temas/estadisticas-agrarias/01-calendariosiembra-nuevo-sencilla-1_tcm30-514260.pdf, 20 February 2025).
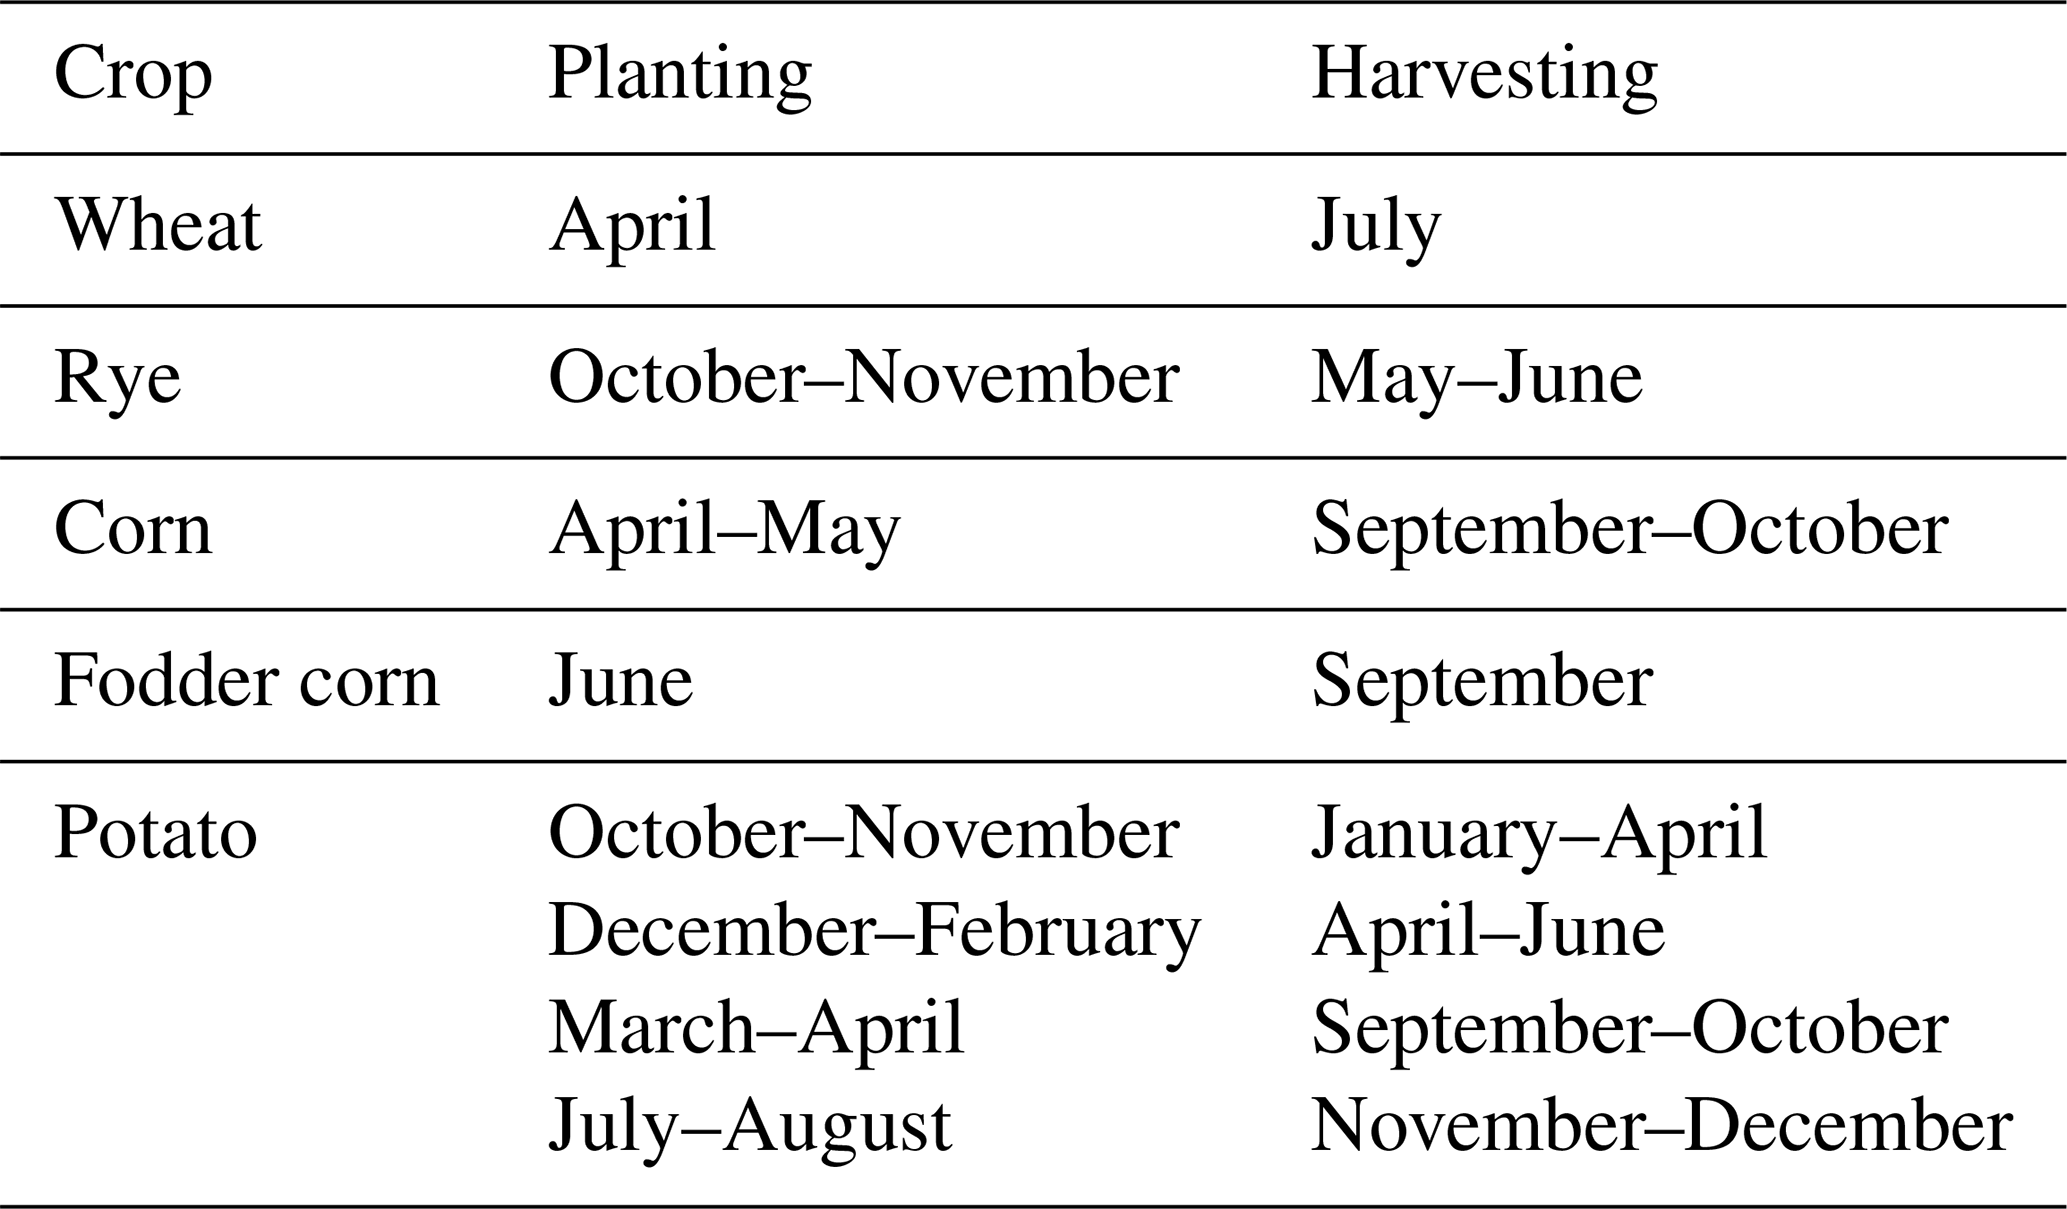
It is apparent that an agricultural system reliant exclusively on cereals (wheat and rye) is more prone to encountering subsistence crises in comparison to one integrating supplementary crops. Such a system, predominantly centered on wheat and rye, exhibits heightened vulnerability to heavy rainfall during late spring and early summer.
Nearly contemporary authors like Labrada (1804) highlight that it was the famines of 1768 and subsequent years that forced the poorest peasants to sow and eat potatoes, which were previously only consumed by pigs. Additionally, Meijide-Pardo (1965) recounts that the copious and continuous rains during the summer of 1768 ruined almost the entire wheat and rye crops in all the provinces existing in Galicia at that time. This situation worsened at the beginning of autumn when the corn harvest, which was the main resource in rural areas, failed. Consequently, by mid-May 1769, the price increase compared to that of the previous 3 years was 141 % for wheat, 181 % for rye, and 173 % for corn, highlighting that the aid of local authorities was less than expected (Martínez-Rodríguez, 2017). Furthermore, the situation was exacerbated due to the lack of repaired roads or adequate means of transportation to distribute foreign grain. All food transportation was carried out using rudimentary carts and horses. It should also be noted that some of the livestock were fed with grain, which led to a cascading effect. This agricultural crisis resulted in an influx of poor people, as documented by Ávila la Cueva (1852):
Since the beginning of the year 1769, there was a great famine due to the scarcity of grain resulting from the heavy rains of the previous year, from which countless poor people descended from the mountains to this City; many died of extreme necessity.
(desde principios del año de 1769, se padeció una muy grande hambre por la escasez de frutos de todos los granos que hubo en el año anterior a causa de las muchas llubias que sobrevinieron en él, de cuyas resultas bajaron de las montañas a esta Ciudad infinidad de pobres; murieron muchos de suma necesidad).
The mortality crisis that occurred as a result of this agricultural crisis in Galicia is also documented by Martín-García (2001), who states,
The famous crisis of 1768–1769 affected practically all of Galicia and had its prelude in the poor harvests of 1768, caused by incessant rains, which were the breeding ground for famines and epidemics.
(La famosa crisis de 1768–1769 castigó a la práctica totalidad de Galicia y tuvo su prólogo en las pésimas cosechas de 1768, provocadas por las incesantes lluvias, que fueron el caldo de cultivo de hambrunas y epidemias),
and by Silva (2019) in northern Portugal.
Data assimilation techniques have gained popularity in the field of climate reconstruction, as they estimate historical climate states by integrating observational data and model simulations. The EKF400v2 paleo-reanalysis database (Valler et al., 2022) spanning from the 18th century to the early 21st century enabled us to reconstruct the historical rainy event of 1768–1769. Rain anomalies relative to the century (1701–1800) can provide valuable insights into the singularity of the event.
In Galicia, during the period from June 1768 to May 1769, the rain anomaly was positive in 11 out of 12 months, with March 1769 being the only exception. Additionally, June 1768 exhibited the highest positive rain anomaly of the century, and September 1768 had the second-highest positive rain anomaly. These findings align well with the occurrence of pro-Serenitate rogations in Santiago de Compostela. Similarly, in northern Portugal, over the same period, the rain anomaly was also positive in 11 out of 12 months, with March 1769 being the only exception. However, the rain event appeared to be less intense, with only February 1769 presenting the second-highest positive anomaly of the century for that month and September 1768 corresponding to the fifth-highest positive anomaly. Furthermore, June 1768 had the highest positive rain anomaly of the century, and September 1768 had the second-highest positive rain anomaly. According to Silva (2019), rogation ceremonies took place in September and October 1768 in Braga (northern Portugal). The same author created a classification by assigning numerical values between 0 and ±1 to each season of the year, with +1 indicating an excess (rainy season), −1 indicating a deficit (dry season), and 0 indicating “normal” seasons. Consequently, the summer and autumn of 1768 and the spring of 1769 are classified with an index of 1.
Written testimonies indicate an unusually high number of rainy days between June 1768 and May 1769; however, the lack of instrumental historical data in Galicia and northern Portugal hinders our ability to estimate the number of rainy days. To discern the significance of an unusually high number of rainy days, the number of days corresponding to the 50th, 90th, and 95th percentiles of rainiest days per month were analyzed using data from the Santiago de Compostela rain gauge from 1944 to 2023. Remarkably, from the analysis of the current precipitation data, it is evident that, over an 80-year period, there were 3 natural years with more than 5 months experiencing precipitation exceeding the 90th percentile. These natural years include November 1950 to December 1950 and February, May, and August 1951; July, September, and November 1965 to January, February, April, and June 1966; and April, November, and December 2000 to January and March 2001. This fact clearly demonstrates that, using a limited record (only 80 years), the chances of having extreme rainy years, with several months experiencing a high number of rainy days, are not negligible. Additionally, the composite of the rainiest months, those that exceed the 95th percentile of that month, exhibits synoptic patterns similar to those obtained during the 1768–1769 rainy event. Synoptic patterns obtained from the ERA5 database for the wettest months (Fig. 8a and b) show negative anomalies in both SLP and 500GPH in the northeastern Atlantic. This type of anomaly is normally associated with a circulation in which the jet stream adopts a very meridional mode. These meridional modes exhibit greater persistence compared to the zonal ones. This persistence leads to the association with significant anomalies, as observed in this study. Regions situated within the colder sector of the circulation experience continuous influx of low-pressure systems traveling along the jet stream. This is evident in Fig. 8, particularly over the NW Iberian Peninsula, accounting for the notable surplus in rainy days. Conversely, areas farther east or west may experience prolonged periods of anticyclonic influence, resulting in reduced rainfall.
Figure 8a and b, depicting SLP and 500GPH data extracted from the EKF400v2 paleo-reanalysis database for the 1768–1769 rainy event, closely resemble those obtained from contemporary records (Fig. 9e and f). This similarity allows us to interpret the atmospheric circulation dynamics during this event. It is likely that a pronounced planetary circulation pattern, predominantly influenced by meridional modes in the Northern Hemisphere, contributed to the frequent occurrence of troughs in the northeastern Atlantic. These troughs, characterized by cold air in the mid- to upper-atmospheric layers, induce the formation of surface low-pressure systems. Additionally, they hinder the eastward progression of anticyclones into the region, resulting in more frequent episodes of rain and cold than usual.
Moreover, broadening the analysis to encompass other geographical regions on the map enables us to elucidate why this event primarily impacted areas in Portugal, northwestern Spain, parts of France, and the British Isles while sparing other regions in Europe. The trough depicted in Fig. 9c and f encompasses all the affected areas during this event. However, as elucidated in the preceding paragraph, regions lying beyond its influence are not subjected to the frequent arrival of low-pressure systems and thus remain unaffected by excessive rainfall. This is exemplified by the central and eastern regions of Spain.
The incessant and heavy rainfall in several regions of the Atlantic Arc (Ireland, England, France, Galicia, and northern Portugal) over the period June 1768–May 1769 precipitated the last and most severe agricultural crisis in Galicia and northern Portugal during the 18th century, resulting in high mortality. The atmospheric conditions that led to this historical episode were analyzed using the EKF400v2 paleo-reanalysis dataset, which spans from the 18th century to the early 21st century. The following main conclusions were obtained:
-
The rainfall anomaly in Galicia and northern Portugal from June 1768 to May 1769 was positive in 11 out of 12 months, with March 1769 being the only exception. Although the rainfall event in northern Portugal appeared to be less intense than in Galicia, June 1768 exhibited the highest positive rain anomaly of the century, and September 1768 had the second-highest positive rain anomaly.
-
This excess precipitation aligns well with the occurrence of pro-Serenitate rogations in Santiago de Compostela and Braga and with written testimonies indicating an unusually high number of rainy days between June 1768 and May 1769. Additionally, the excess mortality in 1769 and 1770, which is documented in different sources, highlights the unusual nature of the event.
-
The atmospheric synoptic patterns for the rainiest months show negative anomalies in both SLP and 500GPH in the northeastern Atlantic. These patterns are associated with a pronounced planetary circulation predominantly influenced by the meridional mode of the jet stream in the Northern Hemisphere. This circulation contributes to the frequent occurrence of troughs in the northeastern Atlantic, which induce the formation of surface low-pressure systems and hinder the eastward progression of anticyclones into the region, resulting in more frequent episodes of rain and cold than usual.
The data used in this study are available at https://www.wdc-climate.de/ui/q?hierarchy_steps_ss=EKF400 from the World Data Center for Climate (Valler et al., 2022). The main characteristics of the databases are described in Sect. 2.2.
MdC: conceptualization, methodology, formal analysis, writing (original draft and review), editing, elaboration of tables, and visualization. JGC: writing (review), editing, and formal analysis. NGdC: software, validation and comparison between different data sources, elaboration and revision of tables, and writing (review). JJT: writing (review), editing, and formal analysis. JMV: writing (review) and formal analysis. MGG: conceptualization, methodology, supervision, software, and graphing.
The contact author has declared that none of the authors has any competing interests.
Publisher's note: Copernicus Publications remains neutral with regard to jurisdictional claims made in the text, published maps, institutional affiliations, or any other geographical representation in this paper. While Copernicus Publications makes every effort to include appropriate place names, the final responsibility lies with the authors.
The authors would like to acknowledge funding from the Xunta de Galicia under grant no. ED431C 2021/44 (Grupos de Referencia Competitiva) and from the Interreg POCTEP program under grant no. RISC_PLUS (0031_RISC_PLUS_6_E).
The authors used ChatGPT-4 in an earlier version of this article order to improve language and readability. After using this tool/service, the authors reviewed and edited the content as needed and take full responsibility for the content of the publication.
This research has been supported by the Interreg North-West Europe (grant no. 0031_RISC_PLUS_6_E) and the Consellería de Cultura, Educación e Ordenación Universitaria, Xunta de Galicia (Grupos de Referencia Competitiva (grant no. ED431C 2021/44)).
This paper was edited by Hugues Goosse and reviewed by Fredrik Charpentier Ljungqvist and one anonymous referee.
AEMET-IM: Iberian Climate Atlas, Agencia Estatal de Meteorología, Instituto de Meteorologia de Portugal, https://www.aemet.es/documentos/es/conocermas/recursos_en_linea/publicaciones_y_estudios/publicaciones/Atlas-climatologico/Atlas.pdf (last access: 20 February 2025), 2011.
Alcoforado, M. J., Vaquero, J. M., Trigo, R. M., and Taborda, J. P.: Early Portuguese meteorological measurements (18th century), Clim. Past, 8, 353–371, https://doi.org/10.5194/cp-8-353-2012, 2012.
Alexander, L. V. and Jones, P. D.: Updated precipitation series for the U.K. and discussion of recent extremes, Atmos. Sci. Lett., 1, 142–150, https://doi.org/10.1006/asle.2001.0025, 2001.
Amorim, I., Sousa Silva, L. P., and Garcia, J. C.: As cheias do rio Douro no Porto (Portugal) do Século XVIII. Sémata: Ciencias Sociais E Humanidades, 29, https://doi.org/10.15304/s.29.4217, 2017.
Ávila la Cueva, F.: Historia Civil y Eclesiástica de la Ciudad de Tuy y su Obispado, ISBN: 84-87172-02-4, 1852.
Barker, T.: A Letter from Thomas Barker, Esq; Of Lyndon in Rutlandshire, to James West, Esq; Pres. R. S. concerning Observations of the Quantities of Rain Fallen at That Place for Several Years, Philosophical Transactions (1683–1775), 61, 221–226, 1771.
Béaur, G. and Chevet, J. M.: Chapter 4 France in Famines in European History, edited by: Alfani, G. and Ó Gráda, C., Cambridge University Press, ISBN 9781316841235, https://doi.org/10.1017/9781316841235, 2017.
Beneyto, C., Aranda, J. A., Benito, G., and Francés, F.: New Approach to Estimate Extreme Flooding Using Continuous Synthetic Simulation Supported by Regional Precipitation and Non-Systematic Flood Data, Water 12, 3174, https://doi.org/10.3390/w12113174, 2020.
Benito, G., Castillo, O., Ballesteros-Cánovas, J. A., Machado, M., and Barriendos, M.: Enhanced flood hazard assessment beyond decadal climate cycles based on centennial historical data (Duero basin, Spain), Hydrol. Earth Syst. Sci., 25, 6107–6132, https://doi.org/10.5194/hess-25-6107-2021, 2021.
Bravo-Paredes, N., Gallego, M. C., Domínguez-Castro, F., García, J. A., and Vaquero, J. M.: Pro-pluvia rogation ceremonies in Extremadura (Spain): Are they a good proxy of winter NAO?, Atmosphere, 11, 282, https://doi.org/10.3390/atmos11030282, 2020.
Brázdil, R., Trnka, M., Mikšovský, J., Řezníc¡ková, L., and Dobrovolný, P. Spring-summer droughts in the Czech Land in 1805–2012 and their forcings, Int. J. Climatol., 35, 1405–1421, 2015.
Brönnimann, S.: Climatic Changes Since 1700, Springer, https://doi.org/10.1007/978-3-319-19042-6, 2015.
Clark, C.: The Great Flood of 1768 at Bruton, Somerset, Weather, 54, 108–113, https://doi.org/10.1002/j.1477-8696.1999.tb06436.x, 1999.
Collet, D. and Schuh, M. (Eds.): Famines During the “Little Ice Age” (1300–1800): Socio-natural Entanglements in Premodern Societies, Springer, Berlin/Heidelberg, https://doi.org/10.1007/978-3-319-54337-6, 2018.
Degroot, D., Anchukaitis, k., Bauch, M., Burnham, J., Carnegy, F., Cui, J., de Luna, K., Guzowski, P., Hambrecht, G., Huhtamaa, H., Izdebski, A., Kleemann, K., Moesswilde, M., Neupane, N., Newfield, T., Pei, Q., Xoplaki, E., and Zappia, N.: Towards a rigorous understanding of societal responses to climate change, Nature, 591, 539–550, https://doi.org/10.1038/s41586-021-03190-2, 2021.
Diodato, N., Ljungqvist, F. C., and Bellocchi, G.: A millennium-long reconstruction of damaging hydrological events across Italy, Sci. Rep., 9, 9963, https://doi.org/10.1038/s41598-019-46207-7, 2019.
Diodato, N., Ljungqvist, F. C., and Bellocchi, G.: Fingerprint of climate change in precipitation aggressiveness across the central Mediterranean (Italian) area, Sci. Rep., 10, 22062, https://doi.org/10.1038/s41598-020-78857-3, 2020.
Domínguez-Castro, F., Santisteban, J. I., Barriendos, M., and Mediavilla, R.: Reconstruction of drought episodes for central Spain from rogation ceremonies recorded at the Toledo Cathedral from 1506 to 1900: A methodological approach, Global Planet. Change, 63, 230–242, https://doi.org/10.1016/j.gloplacha.2008.06.002, 2008.
Domínguez-Castro, F., Ribera, P., García-Herrera, R., Vaquero, J. M., Barriendos, M., Cuadrat, J. M., and Moreno, J. M.: Assessing extreme droughts in Spain during 1750–1850 from rogation ceremonies, Clim. Past, 8, 705–722, https://doi.org/10.5194/cp-8-705-2012, 2012.
Domínguez-Castro, F., Vaquero, J. M., Rodrigo, F. S., Farrona, A. M. M., Gallego, M. C., García-Herrera, R., Barriendos, M., and Sanchez-Lorenzo, A.: Early Spanish meteorological records (1780–1850), Int. J. Climatol., 34, 593–603, https://doi.org/10.1002/joc.3709, 2014.
Domínguez-Castro, F., Ramos, A. M., García-Herrera, R., and Trigo, R. M.: Iberian extreme precipitation 1855/1856: an analysis from early instrumental observations and documentary sources, Int. J. Climatol., 35, 142–153, https://doi.org/10.1002/joc.3973, 2015.
Domínguez-Castro, F., Alcoforado, M. J., Bravo-Paredes, N., Fernández-Fernández, M. I., Fragoso, M., Gallego, M. C., García Herrera, R., Garnier, E., Garza-Merodio, G., El Kenawy, A. M., Latorre, B., Noguera, I., Peña-Angulo, D., Reig-Gracia, F., Silva, L. P., Vaquero, J. M., and Vicente Serrano, S. M.: Dating historical droughts from religious ceremonies, the international pro pluvia rogation database, Scientific Data, 8, 186, https://doi.org/10.1038/s41597-021-00952-5, 2021.
Domínguez Ortiz, A.: Carlos III y la España de la Ilustración, Alianza Editorial, Madrid, ISBN 9788491044468, 2005.
Eiras, R. A.: Estudios sobre agricultura y población en la España Moderna, Santiago, ISBN 9788486728564, 1990.
Fernandez-Cortizo, C.: ?`En Galicia, el hambre entra nadando? Rogativas, clima y crisis de subsisytencias enla Galicia Litorat subocidental en los siglos XVI-XVIII. SÉMATA, Ciencias Sociais e Humanidades, 17, 259–298, http://hdl.handle.net/10347/4459 (last access: 20 February 2025), 2005.
Fernandez-Novoa, D., Gonzalez-Cao, J., Figueira, J. R., Catita, C., García-Feal, O., Gomez-Gesteira, M., and Trigo, R. M.: Numerical simulation of the deadliest flood event of Portugal: Unravelling the causes of the disaster, Sci. Total Environ., 896, 165092, https://doi.org/10.1016/j.scitotenv.2023.165092, 2023.
Fernández-Nóvoa, D., Ramos, A. M., González-Cao, J., García-Feal, O., Catita, C., Gómez-Gesteira, M., and Trigo, R. M.: How to mitigate flood events similar to the 1979 catastrophic floods in the lower Tagus, Nat. Hazards Earth Syst. Sci., 24, 609–630, https://doi.org/10.5194/nhess-24-609-2024, 2024.
Font Tullot, I.: Historia del Clima en España: Cambios climáticos y sus causas. Instituto Nacional de Meteorología, Madrid, ISBN 8450571782, ISBN 9788450571783, 1988.
Gonzalez-Cao, J., Fernandez-Novoa, D., García-Feal, O., Figueira, J. R., Vaquero, J. M., Trigo, R. M., and Gomez-Gesteira, M.: Numerical reconstruction of historical extreme floods: The Guadiana event of 1876, J. Hydrol., 599, 126292, https://doi.org/10.1016/j.jhydrol.2021.126292, 2021.
González-Fernández, M. A.: Las crisis de subsistencias y epidémicas en las villas de Vigo y Bouzas (1620–1890), Boletín del Instituto de Estudios Vigueses, 6, 87–105, 2000.
Hersbach, H., Bell, B., Berrisford, P., Biavati, G., Horányi, A., Muñoz Sabater, J., Nicolas, J., Peubey, C., Radu, R., Rozum, I., Schepers, D., Simmons, A., Soci, C., Dee, D., and Thépaut, J.-N.: ERA5 monthly averaged data on single levels from 1940 to present. Copernicus Climate Change Service (C3S) Climate Data Store (CDS) [data set], https://doi.org/10.24381/cds.f17050d7, 2023.
Hoyle, R.: Chapter 7 Britain in Famines in European History, edited by: Alfani, G. and Ó Gráda, C., Cambridge University Press, ISBN 9781316841235, https://doi.org/10.1017/9781316841235, 2017.
IPCC: Summary for Policymakers, in: Climate Change and Land: an IPCC special report on climate change, desertification, land degradation, sustainable land management, food security, and greenhouse gas fluxes in terrestrial ecosystems, edited by: Shukla, P. R., Skea, J., Calvo Buendia, E., Masson-Delmotte, V., Pörtner, H.-O., Roberts, D. C., Zhai, P., Slade, R., Connors, S., van Diemen, R., Ferrat, M., Haughey, E., Luz, S., Neogi, S., Pathak, M., Petzold, J., Portugal Pereira, J., Vyas, P., Huntley, E., Kissick, K., Belkacemi, M., and Malley, J., Cambridge University Press, https://www.ipcc.ch/srccl/ (last access: 20 February 2025), 2019.
Jenkinson, A. F., Shackleton, W., and Lawson, S.: Monthly and annual rainfall for Ireland, 1711–1977, UK Met Office Branch Memorandum 77, Meteorological Office, Bracknell, 1979.
Köppen, W.: Die Wärmezonen der Erde, nach der Dauer der heissen, gemässigten und kalten Zeit und nach der Wirkung der Wärme auf die organische Welt betrachtet (The thermal zones of the earth according to the duration of hot, moderate and cold periods and to the impact of heat on the organic world), Meteorol. Z., 1, 215–226, https://doi.org/10.1127/0941-2948/2011/105, 1884 (translated and edited by: Volken, E. and Brönnimann, S., Meteorol. Z., 20, 351–360, 2011).
Labrada, J. L.: Descripción económica del Reyno de Galicia, Ed. Galaxia, 1804.
Lamb, H. H.: Climate, History and the Modern World, 2nd edn., Routledge, London and New York, ISBN 9780415127349, ISBN 0415127343, 1995.
Le Roy Ladure, E.: Sur les fluctuations du climat de la France septentrionale et centrale depuis le XVIIe siècle, Academie des Sciences Morales et Politiques, ISBN 978-2213654249, 2011.
Ljungqvist, F. C., Seim, A., and Huhtamaa, H.: Climate and society in European history, Wiley Interdisciplin, Rev. Clim. Change, 12, e691, https://doi.org/10.1002/wcc.691, 2021.
Ljungqvist, F. C., Christiansen, B., Esper, J., Huhtamaa, H., Leijonhufvud, L., Pfister, C., Seim, A., Skoglund, M. K., and Thejll, P.: Climatic signatures in early modern European grain harvest yields, Clim. Past, 19, 2463–2491, https://doi.org/10.5194/cp-19-2463-2023, 2023.
Ljungqvist, F. C., Seim, A., and Collet, D.: Famines in medieval and early modern Europe – connecting climate and society, Wiley Interdisciplin. Rev. Clim. Change, 15, e859, https://doi.org/10.1002/wcc.859, 2024.
López Linage, J.: La patata en España. Historia y agroecología del tubérculo andino, Ministerio de Medio Ambiente y Medio Rural y Marino, ISBN 84-491-0855-1, 2008.
Losada-Sanmartín, M. L.: Chapter 6. Documentación histórica e clima en Historia da meteoroloxía e da climatoloxía de Galicia, edited by: Díaz-Fierros Viqueira, F., Consello da Cultura Galega, ISBN 978-84-96530-72-0, 2008.
Macdonald, N. and Sangster, H.: High-magnitude flooding across Britain since AD 1750, Hydrol. Earth Syst. Sci., 21, 1631–1650, https://doi.org/10.5194/hess-21-1631-2017, 2017.
Martin-García, A.: Ordinary and Extraordinary Death Rate in El Ferrol at the End of the Ancien Regime, Stud His Ha Mod., 23, 249–273, 2001.
Martínez-Rodríguez, E.: Santiago council and the crises of subsistences between 1741 and 1770, SÉMATA, Ciencias Sociais e Humanidades, 29, 219–237, 2017.
Meijide-Pardo, A.: El hambre de 1768–1769 en Galicia y la obra asistencial del estamento eclesiástico compostelano, Compostellanum: revista de la Archidiócesis de Santiago de Compostela, 10, 213–256, 1965.
Moravec, V., Markonis, Y., Rakovec, O., Kumar, R., and Hanel, M.: A 250-year European drought inventory derived from ensemble hydrologic modeling, Geophys. Res. Lett., 46, 5909–5917, https://doi.org/10.1029/2019GL082783, 2019.
Murphy, C., Broderick, C., Burt, T. P., Curley, M., Duffy, C., Hall, J., Harrigan, S., Matthews, T. K. R., Macdonald, N., McCarthy, G., McCarthy, M. P., Mullan, D., Noone, S., Osborn, T. J., Ryan, C., Sweeney, J., Thorne, P. W., Walsh, S., and Wilby, R. L.: A 305-year continuous monthly rainfall series for the island of Ireland (1711–2016), Clim. Past, 14, 413–440, https://doi.org/10.5194/cp-14-413-2018, 2018a.
Murphy, C., Broderick, C., Burt, T. P., Curley, M., Duffy, C., Hall, J., Harrigan, S., Matthews, T. K. R., Macdonald, N., McCarthy, G. D., McCarthy, M. P., Mullan, D., Noone, S., Osborn, T. J., Ryan, C., Sweeney, J., Thorne, P. W., Walsh, S., and Wilby, R. L.: Island of Ireland monthly rainfall series 1711–2016 (IoI_1711), PANGAEA [data set], https://doi.org/10.1594/PANGAEA.887593, 2018b.
Murphy, C., Wilby, R. L., Matthews, T., Horvath, C., Crampsie, A., Ludlow, F., Noone, S., Brannigan, J., Hannaford, J., McLeman, R., and Jobbova, E.: The forgotten drought of 1765–1768: Reconstructing and re-evaluating historical droughts in the British and Irish Isles, Int. J. Climatol., 40, 5329–5351, https://doi.org/10.1002/joc.6521, 2020.
Nassiet, M.: La diffusion du blé noir en France à l'époque moderne, Histoire et Sociétés Rurales, 9, 59–77, 1998.
Nicault, A., Alleaume, S., Brewer, S., Carrer, M., Nola, P., and Guiot, J.: Mediterranean drought fluctuation during the last 500 years based on tree-ring data, Clim. Dynam., 31, 227–245, https://doi.org/10.1007/s00382-007-0349-3, 2008.
Noone, S., Murphy, C., Coll, J., Matthews, T., Mullan, D., Wilby, R. L., and Walsh, S. Homogenization and analysis of anexpanded long-term monthly rainfall network for the Island ofIreland (1850–2010), Int. J. Climatol., 36, 2837–2853, https://doi.org/10.1002/joc.4522, 2016.
Noone, S., Broderick, C., Duffy, C., Matthews, T., Wilby, R. L., and Murphy, C.: A 250-year drought catalogue for the Island of Ireland (1765–2015), Int. J. Climatol., 37, 239–254, https://doi.org/10.1002/joc.4999, 2017.
Ó Gráda, C.: Chapter 8, Ireland in Famines in European History, edited by: Alfani, G. and Ó Gráda, C., Cambridge University Press, ISBN 9781316841235, https://doi.org/10.1017/9781316841235, 2017.
Peña, J. C., Balasch, J. C., Pino, D., Schulte, L., Barriendos, M., Ruiz-Bellet, J. L., Prohom, M., Tuset, J., Mazon, J., and Castelltort, X.: Low-Frequency Atmospheric Variability Patterns and Synoptic Types Linked to Large Floods in the Lower Ebro River Basin, J. Climate, 35, 2351–2371, https://doi.org/10.1175/JCLI-D-20-0394.1, 2022.
Pérez-Costanti, P.: Notas Viejas Galicianas, Vigo, ISBN 10: 8445307304/ISBN 13: 9788445307304, 1925.
Pérez Moreda, V.: Chapter 3, Spain in Famines in European History, edited by: Alfani, G. and Ó Gráda, C., Cambridge University Press, ISBN 9781316841235, https://doi.org/10.1017/9781316841235, 2017.
Pfister, C.: Das Klima der Schweiz von 1525–1860 und seine Bedeutung in der Geschichte von Bevolkerung und Landwirtschaft, Paul Haupt, Bern, ISBN 3258033196, 9783258033198, 1984.
Pfister, C.: Monthly temperature and precipitation patterns in Central Europe 1525–1979: quantifying documentary evidence on weather and its effects, in: Climate since A.D. 1500, edited by: Bradley, R. S. and Jones, P. D., Routledge, London/New York, 118–142, ISBN 9780203430996, 1992.
Pfister, C. and Wanner, H.: Climate and Society in Europe: The Last Thousand Years, Haupt Verlag, Bern, ISBN10: 3258082340, ISBN13: 978-3258082349, 2021.
Potop, V., Boroneant, C., Možný, M., Štepánek, P., and Skalák, P. Observed spatio temporal characteristics of drought on various time scales over The Czech Republic, Theor. Appl. Climatol., 115, 563–581, https://doi.org/10.1007/s00704-013-0908-y, 2014.
Silva, L. P.: O clima do Noroeste de Portugal (1600–1855): dos discursos aos impactos, thesis, Porto University, https://hdl.handle.net/10216/121851 (last access: 20 February 2025), 2019.
Simpson, I. R. and Jones, P. D.: Analysis of UK precipitation extremes derived from met office gridded data, Int. J. Climatol., 34, 2438–2449, https://doi.org/10.1002/joc.3850, 2014.
Slavin, P.: Climate and famines: A historical reassessment, Wiley Interdisciplin. Rev. Clim. Change, 7, 433–447, https://doi.org/10.1002/wcc.395, 2016.
Spraggs, G., Peaver, L., Jones, P., and Ede, P.: Re-construction of historic drought in the Anglian region (UK) over the period 1798–2010 and the implications for water resources and drought management, J. Hydrol., 526, 231–252, https://doi.org/10.1016/j.jhydrol.2015.01.015, 2015.
Todd, B., Macdonald, N., Chiverrell, R. C., Caminade, C., and Hooke, J. M.: Severity, duration and frequency of drought in SE England from 1697 to 2011, Climatic Change, 121, 673–687, https://doi.org/10.1007/s10584-013-0970-6, 2013.
Trigo, R. M., Pozo-Vázquez, D., Osborn, T. J., Castro-Díez, Y., Gámiz-Fortis, S., and Esteban-Parra, M. J.: North Atlantic Oscillation influence on precipitation, river flow and water resources in the Iberian Peninsula, Int. J. Climatol., 24, 925–944, https://doi.org/10.1002/joc.1048, 2004.
Valler, V., Franke, J., Brugnara, Y., and Brönnimann, S.: An updated global atmospheric paleo- reanalysis covering the last 400 years, Geosci. Data J., 9, 89–107, https://doi.org/10.1002/gdj3.121, 2022.
Valler, V., Franke, J., Brugnara, Y., and Brönnimann, S: An updated global atmospheric paleo-reanalysis covering the last 400 years, Geosci. Data J., 9, 89–107, https://doi.org/10.1002/gdj3.121, 2022 (data available at: https://www.wdc-climate.de/ui/q?hierarchy_steps_ss=EKF400, last access: 21 February 2025).
Vicente-Serrano, S. M., Domínguez-Castro, F., Murphy, C., Hannaford, J., Reig, F., Peña-Angulo, D., Tramblay, Y., Trigo, R. M., Mac Donald, N., Luna, M. Y., Mc Carthy, M., Van der Schrier, G., Turco, M., Camuffo, D., Noguera, I., García-Herrera, R., Becherini, F., Della Valle, A., Tomas-Burguera, M., and El Kenawy, A.: Long-term variability and trends in meteorological droughts in Western Europe (1851–2018), Int. J. Climatol., 41, E690–E717, https://doi.org/10.1002/joc.6719, 2020.
Wanner, H., Pfister, C., and Neukom, R.: The variable European Little Ice Age, Quaternary Sci. Rev., 287, 107531, https://doi.org/10.1016/j.quascirev.2022.107531, 2022.
White, S., Brooke, J., and Pfister, C.: Climate, Weather, agriculture, and food, in: The Palgrave Handbook of Climate History, edited by: White, S., Pfister, C., and Mauelshagen, F., Springer, Berlin/Heidelberg, 331–353, ISBN 978-1-137-43019-9, https://doi.org/10.1057/978-1-137-43020-5, 2018a.
White, S., Pfister, C., and Mauelshagen, F. (Eds.): The Palgrave Handbook of Climate History, Palgrave Macmillan, London, https://doi.org/10.1057/978-1-137-43020-5, 2018b.