the Creative Commons Attribution 4.0 License.
the Creative Commons Attribution 4.0 License.
 | 18 Feb 2025
Pollen-based climatic reconstructions for the interglacial analogues of MIS 1 (MIS 19, 11, and 5) in the southwestern Mediterranean: insights from ODP Site 976
Nathalie Combourieu-Nebout
Odile Peyron
Adele Bertini
Francesco Toti
Vincent Lebreton
Marie-Hélène Moncel
Pleistocene interglacials, specifically Marine Isotope Stages (MISs) 19, 11, and 5, have been suggested as analogues of MIS 1 due to similar solar forcing patterns, greenhouse gas concentrations, and sea levels. There has been substantial debate regarding which of these is the most suitable analogue and so far there has been no consensus, although what really emerges from recent work is the high variation in regional climate during these periods. One of the limiting factors in our understanding of these potential analogues is the fact that very few long sequences cover the entire duration of these interglacials at high resolution.
In this study, a multi-method approach is used to produce climatic reconstructions for MIS 19, 11, 5, and 1 using pollen data derived from a single long marine core from Ocean Drilling Program (ODP) Site 976. This represents the first study which attempts to use pollen-based climatic reconstructions to compare MIS 1 with its analogues, representing a necessary contribution to the debate with a focus on the relationships between vegetation and climate in the southwestern Mediterranean.
Three methods of quantitative climate reconstruction have been adopted: two more widely used methods, the modern analogue technique (MAT) and weighted-average partial least-squares (WAPLS) regression, and a more recent machine learning method known as boosted regression trees (BRTs). The reconstructions show consistent changes in temperature and precipitation during MIS 19, 11, 5, and 1, which correlate well with climatic changes observed in other regional and global proxies and highlight distinct climatic characteristics of each interglacial period in the southwestern Mediterranean. MIS 19 exhibits high variability and colder temperatures compared to subsequent interglacials and MIS 1. Conversely, MIS 11 displays warmer temperatures and greater stability, which makes it a useful analogue to understand prolonged interglacials, crucial when considering the anthropogenic impacts on the duration of warm climate during the Holocene. MIS 5 exhibits overall warmer conditions, and its higher temperature, coupled with fluctuations in solar forcing, makes it a less suitable MIS 1 analogue.
Although past interglacials do not offer direct predictions for the Holocene's future, they provide essential insights into Earth's responses to various forcing factors, serving as crucial benchmarks for understanding the Mediterranean's sensitivity to global changes.
- Article
(6819 KB) - Full-text XML
-
Supplement
(4540 KB) - BibTeX
- EndNote


The interglacials of the Pleistocene, particularly those of the past 1 Myr (1 million years) and specifically Marine Isotope Stages (MISs) 19 (ca. 795–755 ka BP), 11 (ca. 424–365 ka BP), and 5 (ca. 127–78 ka BP), have been the source of increasing attention over the past 2 decades because several of them have been suggested as analogues of the Holocene (e.g. Loutre and Berger, 2003; McManus et al., 2003; Tzedakis, 2010; Candy et al., 2014; Yin and Berger, 2015; Giaccio et al., 2015; Vavrus et al., 2018). Studying past interglacials can provide a framework to better evaluate the natural timing and duration of the Holocene, and examining the amplitudes and rates of climatic variability can give an indication of how the current interglacial may have been without anthropogenic interference and how it could evolve under the presence of humans (Loutre and Berger, 2003; Candy et al., 2014; Giaccio et al., 2015). Furthermore, studying past interglacials may help understand abrupt climate change and the impact of these events on ecosystems and human populations (Loutre and Berger, 2003; Nomade et al., 2019).
The selection of the interglacials MIS 19, 11, and 5 is mainly based on their similarities with MIS 1 in terms of astronomical configurations and greenhouse gas (GHG) concentrations (Yin and Berger, 2015). These interglacials are characterized by low eccentricity and similar precession patterns to MIS 1, small variation in insolation amplitudes, and elevated GHGs. However, the search for the best analogue has been a source of constant debate (Candy et al., 2014). Chiefly, the arguments have revolved around (1) the best alignment of the insolation patterns between each interglacial and MIS 1 and (2) the structure and duration of these interglacials compared with the Holocene (Candy et al., 2014; Past Interglacials Working Group of PAGES, 2016).
MIS 5, specifically substage 5e (ca. 128–116 ka BP) – equivalent to the Eemian (Kukla et al., 1997) – was the first interglacial considered as a modern analogue due to the high temperatures over most of the Northern Hemisphere (NH) and reduced ice sheets (Yin and Berger, 2015). However, the appropriateness of this interglacial was put in question by Loutre and Berger (2003) due to its disproportionally high-amplitude changes in insolation and shorter-lasting high CO2 concentrations compared to the Holocene.
Rather, Loutre and Berger (2003) considered MIS 11 to be closer to MIS 1. Specifically, the climatic optimum of MIS 11c (ca. 427–400 ka BP) has long been recognized as an analogue of the Holocene, owing to similar sea levels, elevated temperatures, reduced astronomical forcing, and high atmospheric CO2 concentrations (McManus et al., 2003; Desprat et al., 2005; Hes et al., 2022). This prolonged and stable period has received further attention because it occurred after one of the harshest glacial conditions of the past 1 Myr (Berger and Loutre, 2003; Raymo and Mitrovica, 2012; Oliveira et al., 2018), which had important implications for the rise of early hominid populations including the spread of Neanderthals and their traditions across Europe and the Mediterranean (Moncel et al., 2016; Blain et al., 2021; Sassoon et al., 2023). The suitability of MIS 11c as an analogue has been supported by several studies (e.g. Berger and Loutre, 2002, 2003; McManus et al., 2003; Olson and Hearty, 2009; Raymo and Mitrovica, 2012). Candy et al. (2014) pointed out that this interglacial matches the pattern of solar insolation of the Holocene more closely than any other interglacial of the past 500 kyr. However, other studies have questioned its reliability as analogue due to the unique anti-phasing between precession, insolation, and obliquity – with two precession peaks occurring during one obliquity cycle (Ruddiman, 2007; Tzedakis, 2010; Nomade et al. 2019; Tzedakis et al., 2022).
Other authors argue that MIS 19 has greater resemblance to the Holocene, owing to a closer phasing of obliquity and precession whereby the maximum obliquity is in phase with the minimum precession at the onset of both interglacials (Tzedakis, 2010). This has been supported by several records in the North Atlantic and Mediterranean (Pol et al., 2010; Tzedakis et al., 2012; Sánchez Goñi et al., 2016b; Giaccio et al., 2015; Nomade et al., 2019). This feature, along with a similar duration of the climatic optimum, similar mid-June insolation, and comparably elevated CO2 concentrations, has highlighted the viability of MIS 19 as a modern analogue. However, Tzedakis (2010) demonstrated important differences between the trends of GHG concentrations during MIS 19 and MIS 1 and the climatic structure of MIS 19. Furthermore, it was found that MIS 19c was generally colder than MIS 5e and MIS 11c (Jouzel et al., 2007) and therefore possibly less climatically comparable to the Holocene, especially in the Northern Hemisphere.
So far, there has been no consensus on which of these interglacials is the best MIS 1 analogue, and what really emerges from the literature is the high variation in regional climate during MIS 19, 11, and 5. For instance, the appropriateness of MIS 11 as an analogue was supported by McManus et al. (2003) in the North Atlantic and by Wang et al. (2023) in China, but it was found to be questionable in the Nordic Seas in the study by Bauch et al. (2000). This heterogeneity and lack of long cores makes it extremely important to compare these analogues with MIS 1 at a regional scale using high-resolution records with time frames that encapsulate the entire interglacials.
One region which can help shed some light on this debate is the Mediterranean due to its high sensitivity to climate change (Lionello and Scarascia, 2018). It is also an area which has been historically affected by anthropogenic pressures and is likely to be impacted by future warming and drought (Guiot and Cramer, 2016; MedECC, 2020; IPCC, 2022), making it imperative to understand the drivers of environmental and climate change across the basin so that we can develop a better framework to predict the trajectory of our current interglacial (Combourieu-Nebout et al., 2015). Moreover, several long cores are available for the Mediterranean region, such as the terrestrial records from Tenaghi Philippon (Pross et al., 2015; Koutsodendris et al., 2023), Lake Ohrid (Sadori et al., 2016; Wagner et al., 2019; Donders et al., 2021), and Padul (Ortiz et al., 2010; Camuera et al., 2018) and marine records from the Iberian Margin (e.g. Sánchez Goñi et al., 2016b, a). Some of these long pollen sequences allowed the quantitative reconstruction of past climate changes during MIS 11 (Kousis et al., 2018), MIS 5 (Sinopoli et al., 2019), and MIS 1 (Peyron et al., 2011; Camuera et al., 2021).
Recent palynological studies from Ocean Drilling Program (ODP) Site 976 in the Alboran Sea, southwestern Mediterranean, have yielded high-resolution pollen records for MIS 1 (Combourieu-Nebout et al., 2009, 2013; Dormoy et al., 2009), MIS 5 (Masson-Delmotte et al., 2005), MIS 11 (Sassoon et al., 2023), and MIS 19 (Toti et al., 2020a), providing a unique opportunity to investigate the regional suitability of these interglacials as analogues of MIS 1 using proxies from a single core. This study aims to provide quantitative estimates of past climate changes for each interglacial by implementing a robust multi-method approach (Peyron et al., 2017; Salonen et al., 2019; Robles et al., 2023) using pollen data derived from the long marine core of ODP Site 976. This approach enables a comparison of MIS 1 analogues and represents a necessary contribution to the debate on the links between vegetation and climate in the Mediterranean.
The objectives of this study are the following:
-
Reconstruct temperature and precipitation parameters during MIS 19, MIS 11, MIS 5, and MIS 1 using a pollen-based multi-method approach
-
Assess the reliability of multiple quantitative reconstruction methods
-
Compare climatic variability during the interglacials with local and global proxies
-
Evaluate the suitability of MIS 19, MIS 11, and MIS 5 as analogues of MIS 1 in the southwestern Mediterranean.
This study used pollen records derived from the marine core of the Ocean Drilling Program (ODP) Site 976 in the western Alboran Sea (36°12.3′ N 4°18.8′ W), collected in 1999 during leg 161 (Shipboard Scientific Party, 1996). This site (Fig. 1) is located about 110 km off the coast of the Strait of Gibraltar at a depth of 1108 m (Combourieu-Nebout et al., 1999, 2009; Gonzalez-Donoso et al., 2000). Due to its susceptibility to polar, tropical, and Atlantic influences, the Alboran Sea is extremely sensitive to climate changes on centennial and millennial scales, making it an ideal location to study climatic variability and interglacial comparisons Alonso et al., 1999; Combourieu-Nebout et al., 1999, 2002, 2009; Fletcher and Sánchez Goñi, 2008; Dormoy et al., 2009; Toti et al., 2020a; Bulian et al., 2022).
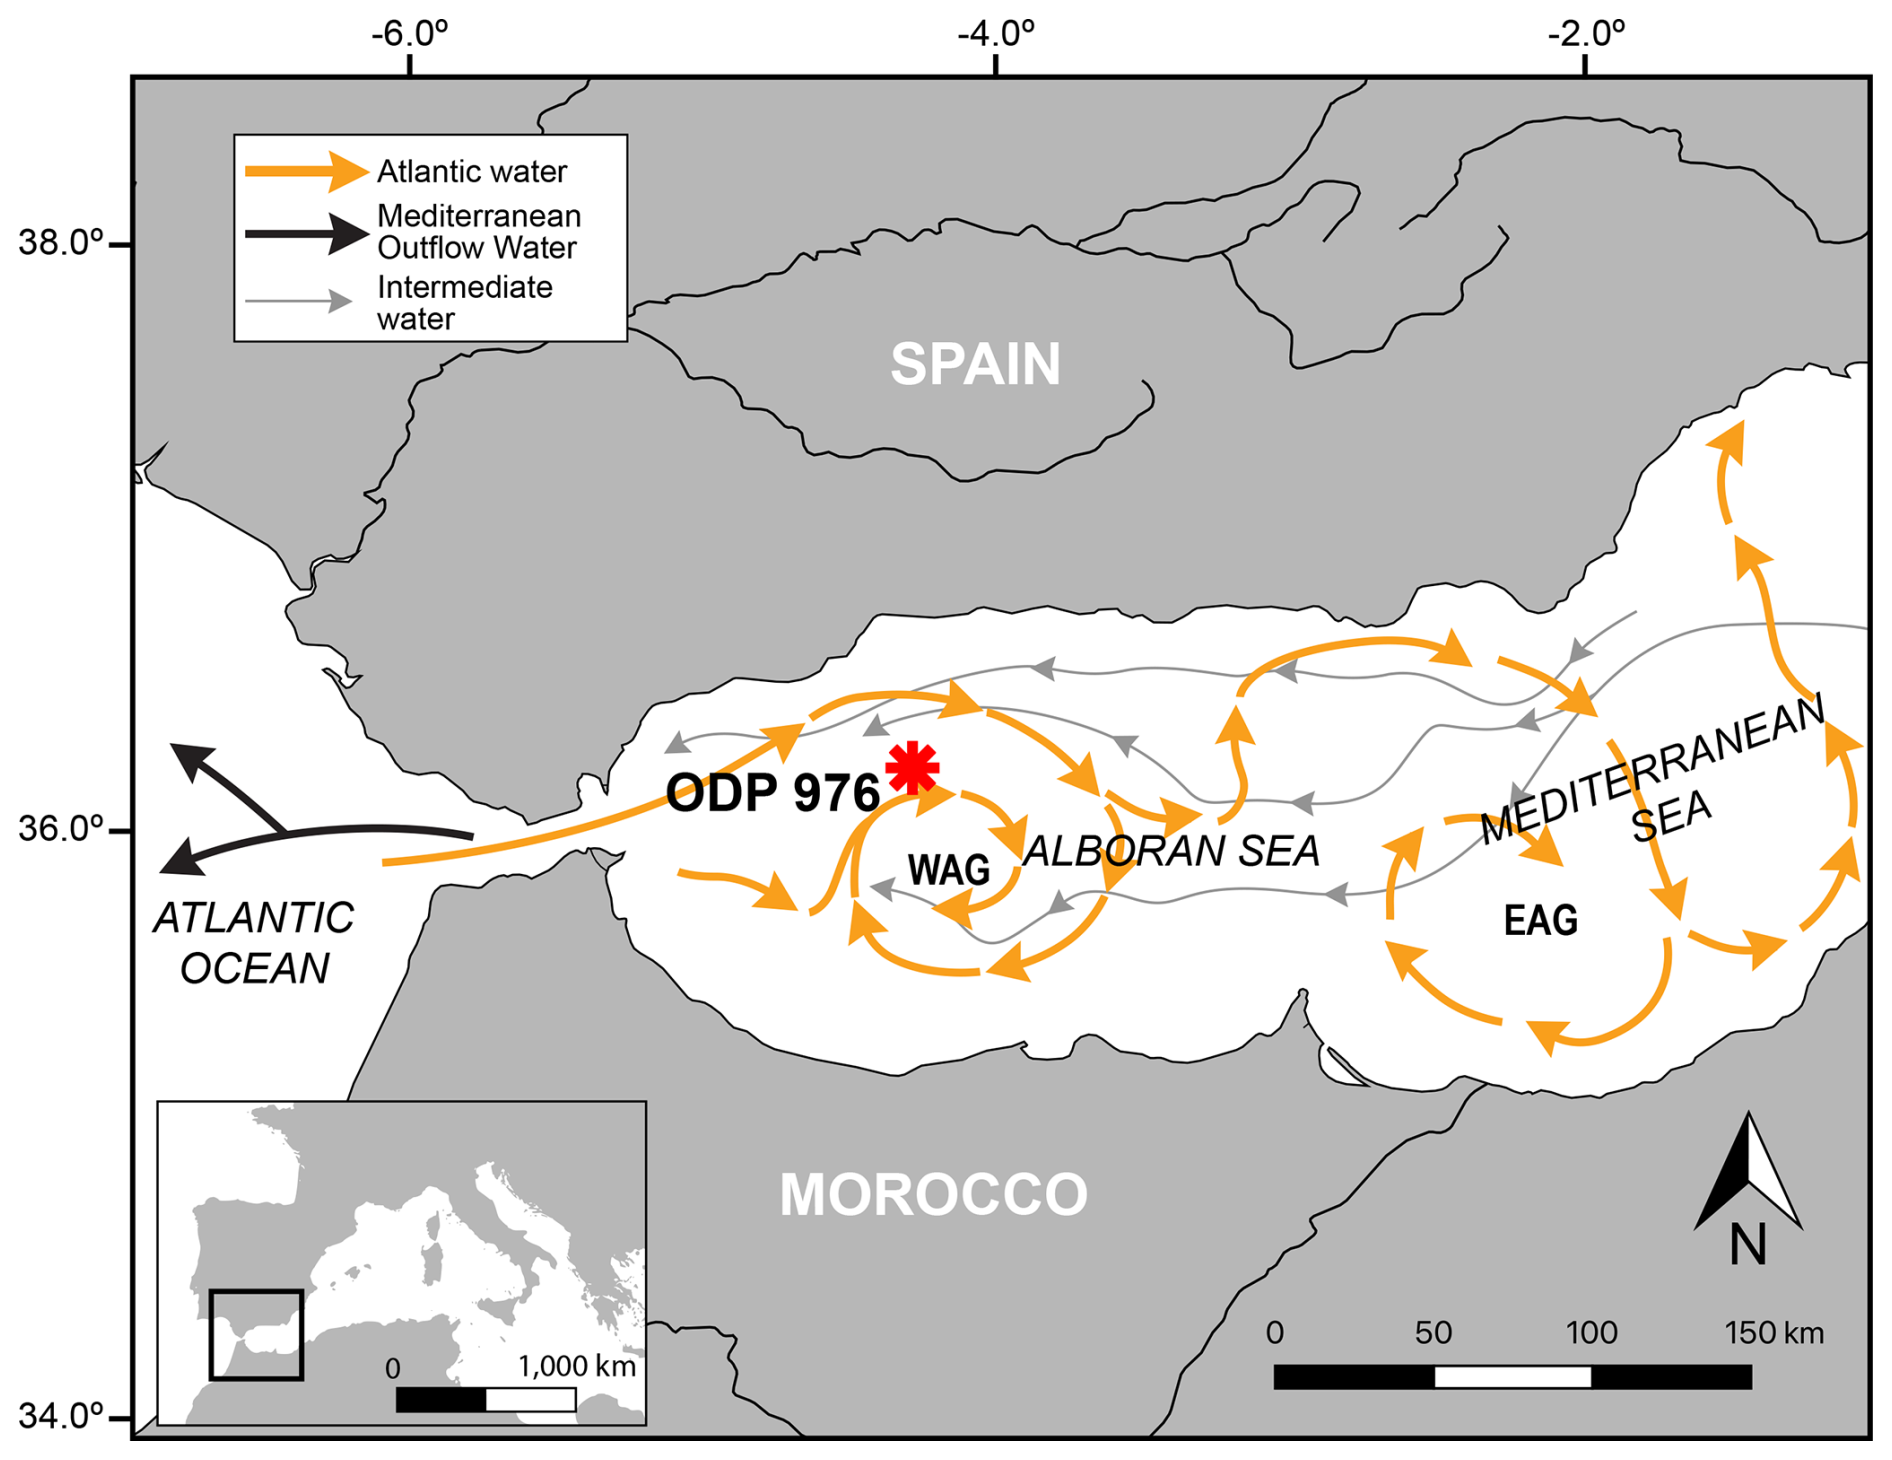
Figure 1Map showing the location of ODP Site 976 and the present-day surface and water circulation in the Alboran Sea (modified from Combourieu-Nebout et al., 1999).
The Alboran Sea measures 150 km in width and 350 km in length, forming a narrow extensional basin (Alonso et al., 1999) between the Mediterranean Sea to the east and the Atlantic Ocean to the west (Bulian et al., 2022). The northern coast of the basin borders Spain, while it borders Morocco to the south. Circulation in the Alboran Sea is influenced by the exchange of waters at the Strait of Gibraltar whereby low-salinity waters from the Atlantic enter the basin and high-salinity waters from the Mediterranean outflow into the ocean (Bulian et al., 2022). This results in the Eastern Alboran Gyre (EAG) and the Western Alboran Gyre (WAG) (Bulian et al., 2022), two anticyclonic gyres (Fig. 1).
This part of the Mediterranean is affected by the southern Azores cyclone, resulting in long, dry summers with mean temperatures typically exceeding 20 °C. In contrast, winters are mild and rainy, with temperatures ranging from 10 °C on the coast to −7 °C at higher elevations, resulting in an altitudinal gradient; annual precipitation is usually 400–1400 mm (Quézel and Médail, 2003; Grieser et al., 2006).
Vegetation cover is a function of an altitudinal gradient owing to the presence of the Moroccan Rif and Betic Cordillera (Quézel and Medail, 2003). The coast is dominated mainly by steppe with Lygeum, Artemisia, and Mediterranean taxa (e.g. Olea, Phillyrea, Pistacia, and Quercus ilex). Humid-temperate oak forest with Quercus deciduous and Ericaceae dominates the mid-altitudes. Higher elevations are mainly characterized by cold-temperate coniferous forests with Pinus and Abies. Although once more spread across the Mediterranean, Cedrus is only found now at higher elevations in Morocco (Ozenda, 1975; Barbero et al., 1981; Benabid, 1982; Rivas Martinez, 1982).
3.1 Fossil pollen datasets
The fossil pollen datasets used to run the pollen-based quantitative climatic reconstructions are all obtained from the ODP Site 976 marine record from the studies listed below. All records excluded Pinus due to its overrepresentation in marine samples (Heusser and Balsam, 1977; Naughton et al., 2007). The ages used in this study are in calendar ka (cal ka).
-
The pollen record for MIS 19 (Toti et al., 2020a) comprises 102 samples. The chronology was based on the initial age models from De Kaenel et al. (1999) and von Grafenstein et al. (1999). Samples were taken every 10 cm, yielding an average temporal resolution of 450 years between samples.
-
The pollen record for MIS 11 has a total of 141 samples (Sassoon et al., 2023). The chronology for the fossil pollen record is based on von Grafenstein et al. (1999). Age interpolation revealed a lowermost age of 433.868 ka BP at 118.8 m and an uppermost age of 356.456 ka BP at 98.85 m. The pollen record for MIS 11 has an almost consistent resolution of 10 cm, achieving average temporal resolutions of ca. 128 years between samples.
-
The MIS 5 record has 105 samples (Combourieu-Nebout et al., 2002; Masson-Delmotte et al., 2005). The chronology for this record was based on the age model by Combourieu-Nebout et al. (2002) but has been extended to 130 ka BP by correlation with deep-sea core MD95-2042 (Shackleton et al., 2003) and the NorthGRIP δ18O record (NorthGRIP, 2004). Samples were taken at an average resolution of 10 cm, yielding an average temporal resolution of 500 years between samples.
-
The record for MIS 1 was based on the uppermost 10 m of the ODP Site 976 core, with a total of 136 samples (Combourieu-Nebout et al., 2009). The chronology, based on calibrations by Bard (1998), Stuiver and Reimer (1993), and Stuiver et al. (1998), is built on 10 14C accelerator mass spectrometry (AMS) measurements on monospecific samples of Globigerina bulloides and Neogloboquadrina pachyderma, which revealed a lowermost age of 25 cal ka. The pollen analysis involved sampling at 10 cm intervals, with a higher resolution of 1–5 cm for the Bølling–Allerød and the early Holocene, yielding a resolution which varies from during the abrupt events to 200–500 years elsewhere.
Due to the use of different age models derived from various proxies, especially when comparing our records with other studies, as well as the use of different calibration methods, some records may appear misaligned in the figures with regard to age.
3.2 Pollen-based climate reconstruction methods
Three methods of climate reconstruction have been used to derive quantitatively changes in temperature and precipitation parameters for the ODP Site 976 pollen records: the modern analogue technique (MAT; Guiot, 1990), weighted-average partial least-squares regression (WAPLS; Ter Braak and Juggins, 1993), and boosted regression trees (BRTs; Salonen et al., 2014).
The MAT and WAPLS techniques have been effectively used for climate reconstructions across various Mediterranean areas and time periods based on terrestrial and marine pollen records (e.g. Cheddadi et al., 1998; Joannin et al., 2012; Mauri et al., 2015; Herzschuh et al., 2023). These results are often supported by other independent proxies, enhancing the reliability of these reconstructions. For instance, biomarker analysis from Tenaghi Philippon (Ardenghi et al., 2019) and Lake Matese (Robles et al., 2023) has provided insight into temperature and moisture variability that aligns with pollen-based climate reconstructions. Similarly, Lake Ohrid's pollen record corroborates shifts in centennial-scale vegetation dynamics and climate variability during MIS 11 (Kousis et al., 2018) and MIS 5 (Sinopoli et al., 2019; Koutsodendris et al., 2019), demonstrating convergence with independent climatic proxies. Further evidence from Lago di Pergusa in central Sicily highlights vegetation and climate shifts over the last 7000 years, with pollen data supporting findings from other proxies from the Mediterranean (Sadori et al., 2013). The multi-proxy approach implemented in these studies shows the reliability of MAT and WAPLS as robust methods for reconstructing past climate conditions.
The MAT technique involves applying information from the present-day environment to quantitatively reconstruct past climate derived from fossil assemblages (Chevalier et al., 2020). MAT functions by determining the degree of dissimilarity between past pollen assemblages and modern pollen data. By using squared-chord distance calculations, MAT selects a number of modern pollen data considered analogues for each fossil pollen assemblage to infer past climatic values (Guiot, 1990).
In contrast to the MAT, which is an “assemblage approach”, the WAPLS method is a true transfer function, meaning that it requires statistical calibration between the climate parameters and modern pollen assemblages (Chevalier et al., 2020). It is a regression method which supposes the unimodal relationship between pollen percentages and climate parameters.
In comparison to the other methods, BRT is a machine learning method developed for ecology (De'ath, 2007; Elith et al., 2008) and has recently been adopted for palaeoecology and palaeoclimatic reconstructions (Salonen et al., 2014). It uses random binary splitting and cross-validation to predict the relationship between climatic variables and pollen assemblages (Chevalier et al., 2020). In BRTs, great numbers of simple regression tree models are combined to produce a final model optimized for prediction using cross-validation for model building. This approach is promising for Mediterranean terrestrial records (d'Oliveira et al., 2023; Robles et al., 2023) but has never been tested on marine pollen records or indeed records of the mid-Pleistocene.
All three methods were calibrated using an updated version of the high-quality and taxonomically consistent modern pollen dataset (Peyron et al., 2013; Dugerdil et al., 2021) containing 3267 samples from European and Mediterranean regions. Pinus has been omitted because its overrepresentation in the Mediterranean pollen spectrum could mask climatically related signals from other taxa (Sinopoli et al., 2019).
In this study, we reconstructed the following climatic parameters: (1) mean annual temperature (TANN), (2) mean temperatures of the coldest month (Twin) and (3) warmest month (Tsum), (4) mean annual precipitation (PANN), (5) summer precipitation (Psum), and (6) winter precipitation (Pwin). The entire dataset includes the parameters for growing degree days above 5 °C (GDD5), the ratio of actual over potential evapotranspiration (AET PET), and further seasonal parameters including autumn and spring temperature and precipitation (Taut and Tspr, Paut, and Pspr, respectively). The studies by Combourieu-Nebout et al. (2009) and Dormoy et al. (2009), which implement pollen-based reconstructions for MIS 1 using pollen data from ODP Site 976, represent a crucial foundation for the present paper. While providing guidance, however, these previous studies only applied the MAT method; therefore, the application of new methods is necessary to enable the comparison with the results for the other Holocene analogues.
Quantitative reconstruction methods and reliability tests were carried out using established methods implemented in publicly available R packages. Specifically, the WAPLS and MAT methods were applied using the R package rioja (Juggins and Juggins, 2020), while the boosted regression tree (BRT) method was applied using the R package dismo (Hijmans et al., 2021). The reliability of pollen-inferred climate reconstruction methods was estimated trough bootstrapping cross-validation by calculating the correlation coefficient values between the variables (R2) and using the root mean square error (RMSE) criterion. Higher R2 and lower RMSE indicate greater validity of the reconstructed parameters. Loess smoothing of 0.2 was applied to the raw data in the plots to view the overall trends of the parameters.
4.1 Multi-method approach: reliability and differences between the methods
The temperature and precipitation reconstructions for the three methods yielded coherent results for the interglacials and interstadials investigated, reasonably aligning with trends observed in other regional climatic proxies (Sect. 4.2).
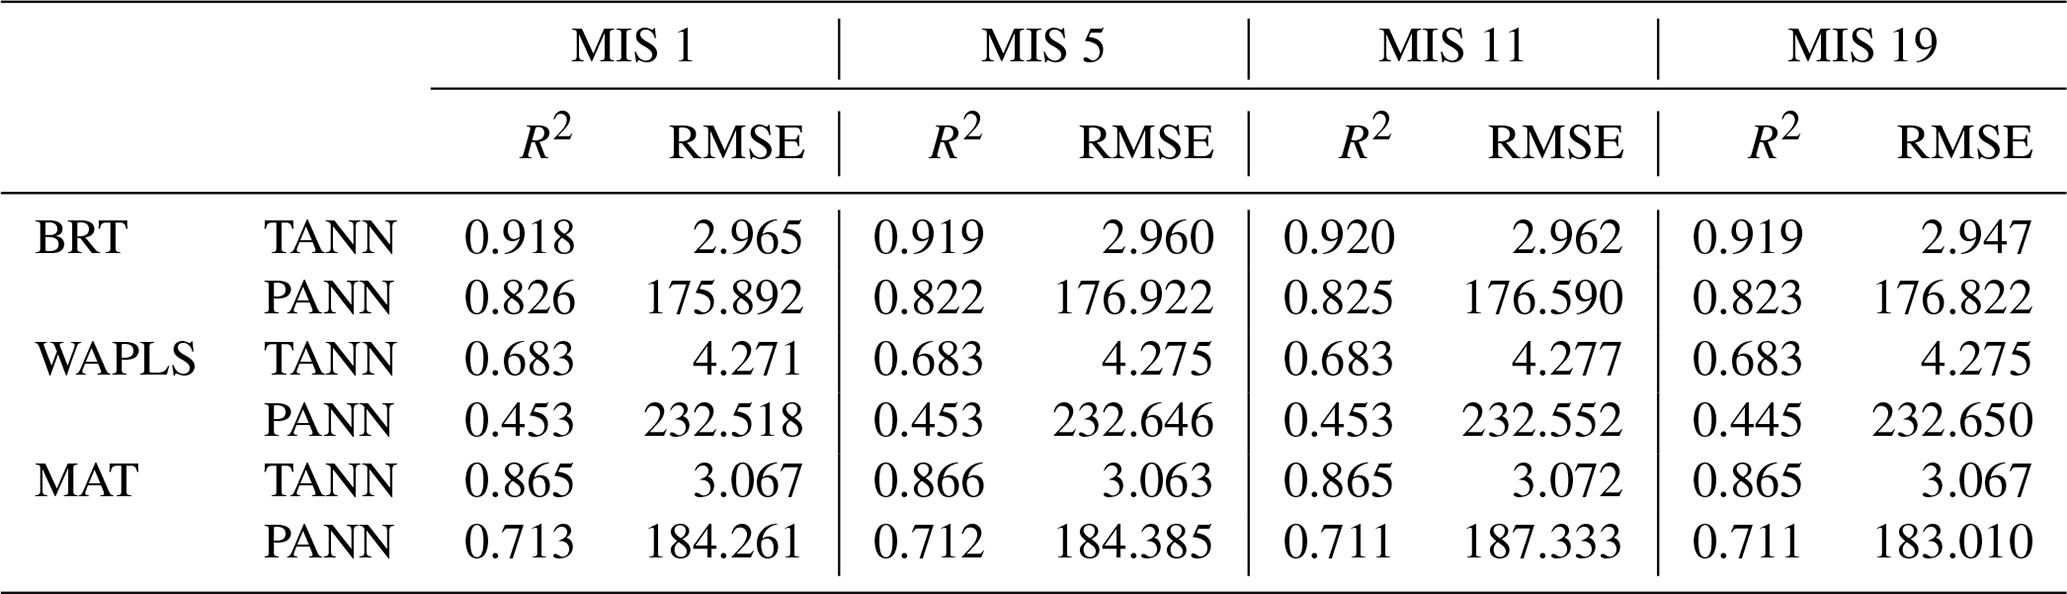
A comparison of the methods across the four interglacials based on the R2 and RMSE values reveals discrepancies in the performance trends. To exemplify these differences between methods, the R2 and RMSE results for TANN and PANN are shown in Table 1. Overall, the models reconstruct TANN more consistently than PANN, based on the significant difference between the RMSE values for these parameters across all MIS periods. BRT consistently demonstrates robust performance, with high R2 values ranging from 0.918 to 0.920 for TANN and 0.822 to 0.826 for PANN, alongside low RMSE values compared to the other methods. The MAT method, akin to BRT, shows strong performance with high R2 values ranging from 0.865 to 0.866 for TANN and slightly lower values of 0.711 to 0.713 for PANN, alongside comparatively low RMSE values. However, in comparison to BRT, the MAT method tends to have slightly lower R2 and higher RMSE, and there is a greater degree of fluctuation for the parameters reconstructed, which is interpreted as greater sensitivity to changes in the pollen assemblages. In contrast, WAPLS exhibits lower R2 values (ranging from 0.445 to 0.683) and higher RMSE values (ranging from 4.271 to 232.650) across both TANN and PANN parameters, indicating potentially poorer model performance compared to BRT and MAT. Notably, the BRT and MAT methods demonstrate greater consistency in performance across interglacials and parameters compared to WAPLS, suggesting their superior efficacy in reconstructing climatic parameters across different temporal periods.
The observed trends in performance of the methods for TANN and PANN are applicable across all parameters reconstructed (see the Supplement); BRT and MAT consistently exhibit strong performance characterized by high R2 values and low RMSE scores for all reconstructed parameters, while the WAPLS method has lower R2 values and higher RMSE scores across the board, suggesting a tendency toward less accurate reconstructions. These results were previously reported in other studies in regions outside the Mediterranean, which compare the reliability of these methods and which found that MAT and BRT are more reliable than WAPLS (Dugerdil et al., 2021; d'Oliveira et al., 2023).
Table 1R2 and RMSE results from the methods BRT, WAPLS, and MAT for selected parameters (TANN and PANN) for the interglacials analysed in this study.
4.2 Climatic reconstructions for each interglacial
4.2.1 MIS 20–19 (803–748 ka BP)
The reconstructions for MIS 20–19 show large-amplitude changes in temperature and precipitation (Fig. 2 and Table 2). During the period reconstructed for the MIS 20 glacial between 803–786 ka BP, results indicate a cold and dry climate, linked to the occurrence of steppe and semi-desertic taxa such as Artemisia, Amaranthaceae, and Ephedra (Toti et al., 2020a). Throughout MIS 20, TANN fluctuates around 4.7 °C, with PANN averaging approximately 460 mm, although there is a contrast between the periods 803–800 and 799–787 ka BP (Fig. 2 and Table 2). In the former period, PANN is around 600 mm and Pwin around 200 mm, while in the latter period PANN decreases to below 400 mm and Pwin to below 50 mm (Fig. S2 in the Supplement). The transition to harsher conditions during late MIS 20 (around 799 ka BP) was associated with colder conditions, as evidenced by palynological and foraminiferal records (Toti et al., 2020a). This corresponds to a shutdown of the Atlantic Meridional Overturning Circulation (AMOC) during that time (Cacho et al., 2000; Moreno et al., 2004). Maiorano et al. (2016) observed this in the Montalbano Jonico section (southern Italy) and referred to it as a Heinrich-type event (Med-HTIX) in analogy to those of the last termination (TI), and similarly the warm–cold episodes during TIX have been named the Bølling–Allerød-like (Med-BATIX) and Younger Dryas-like (Med-YDTIX) events (Maiorano et al., 2016).
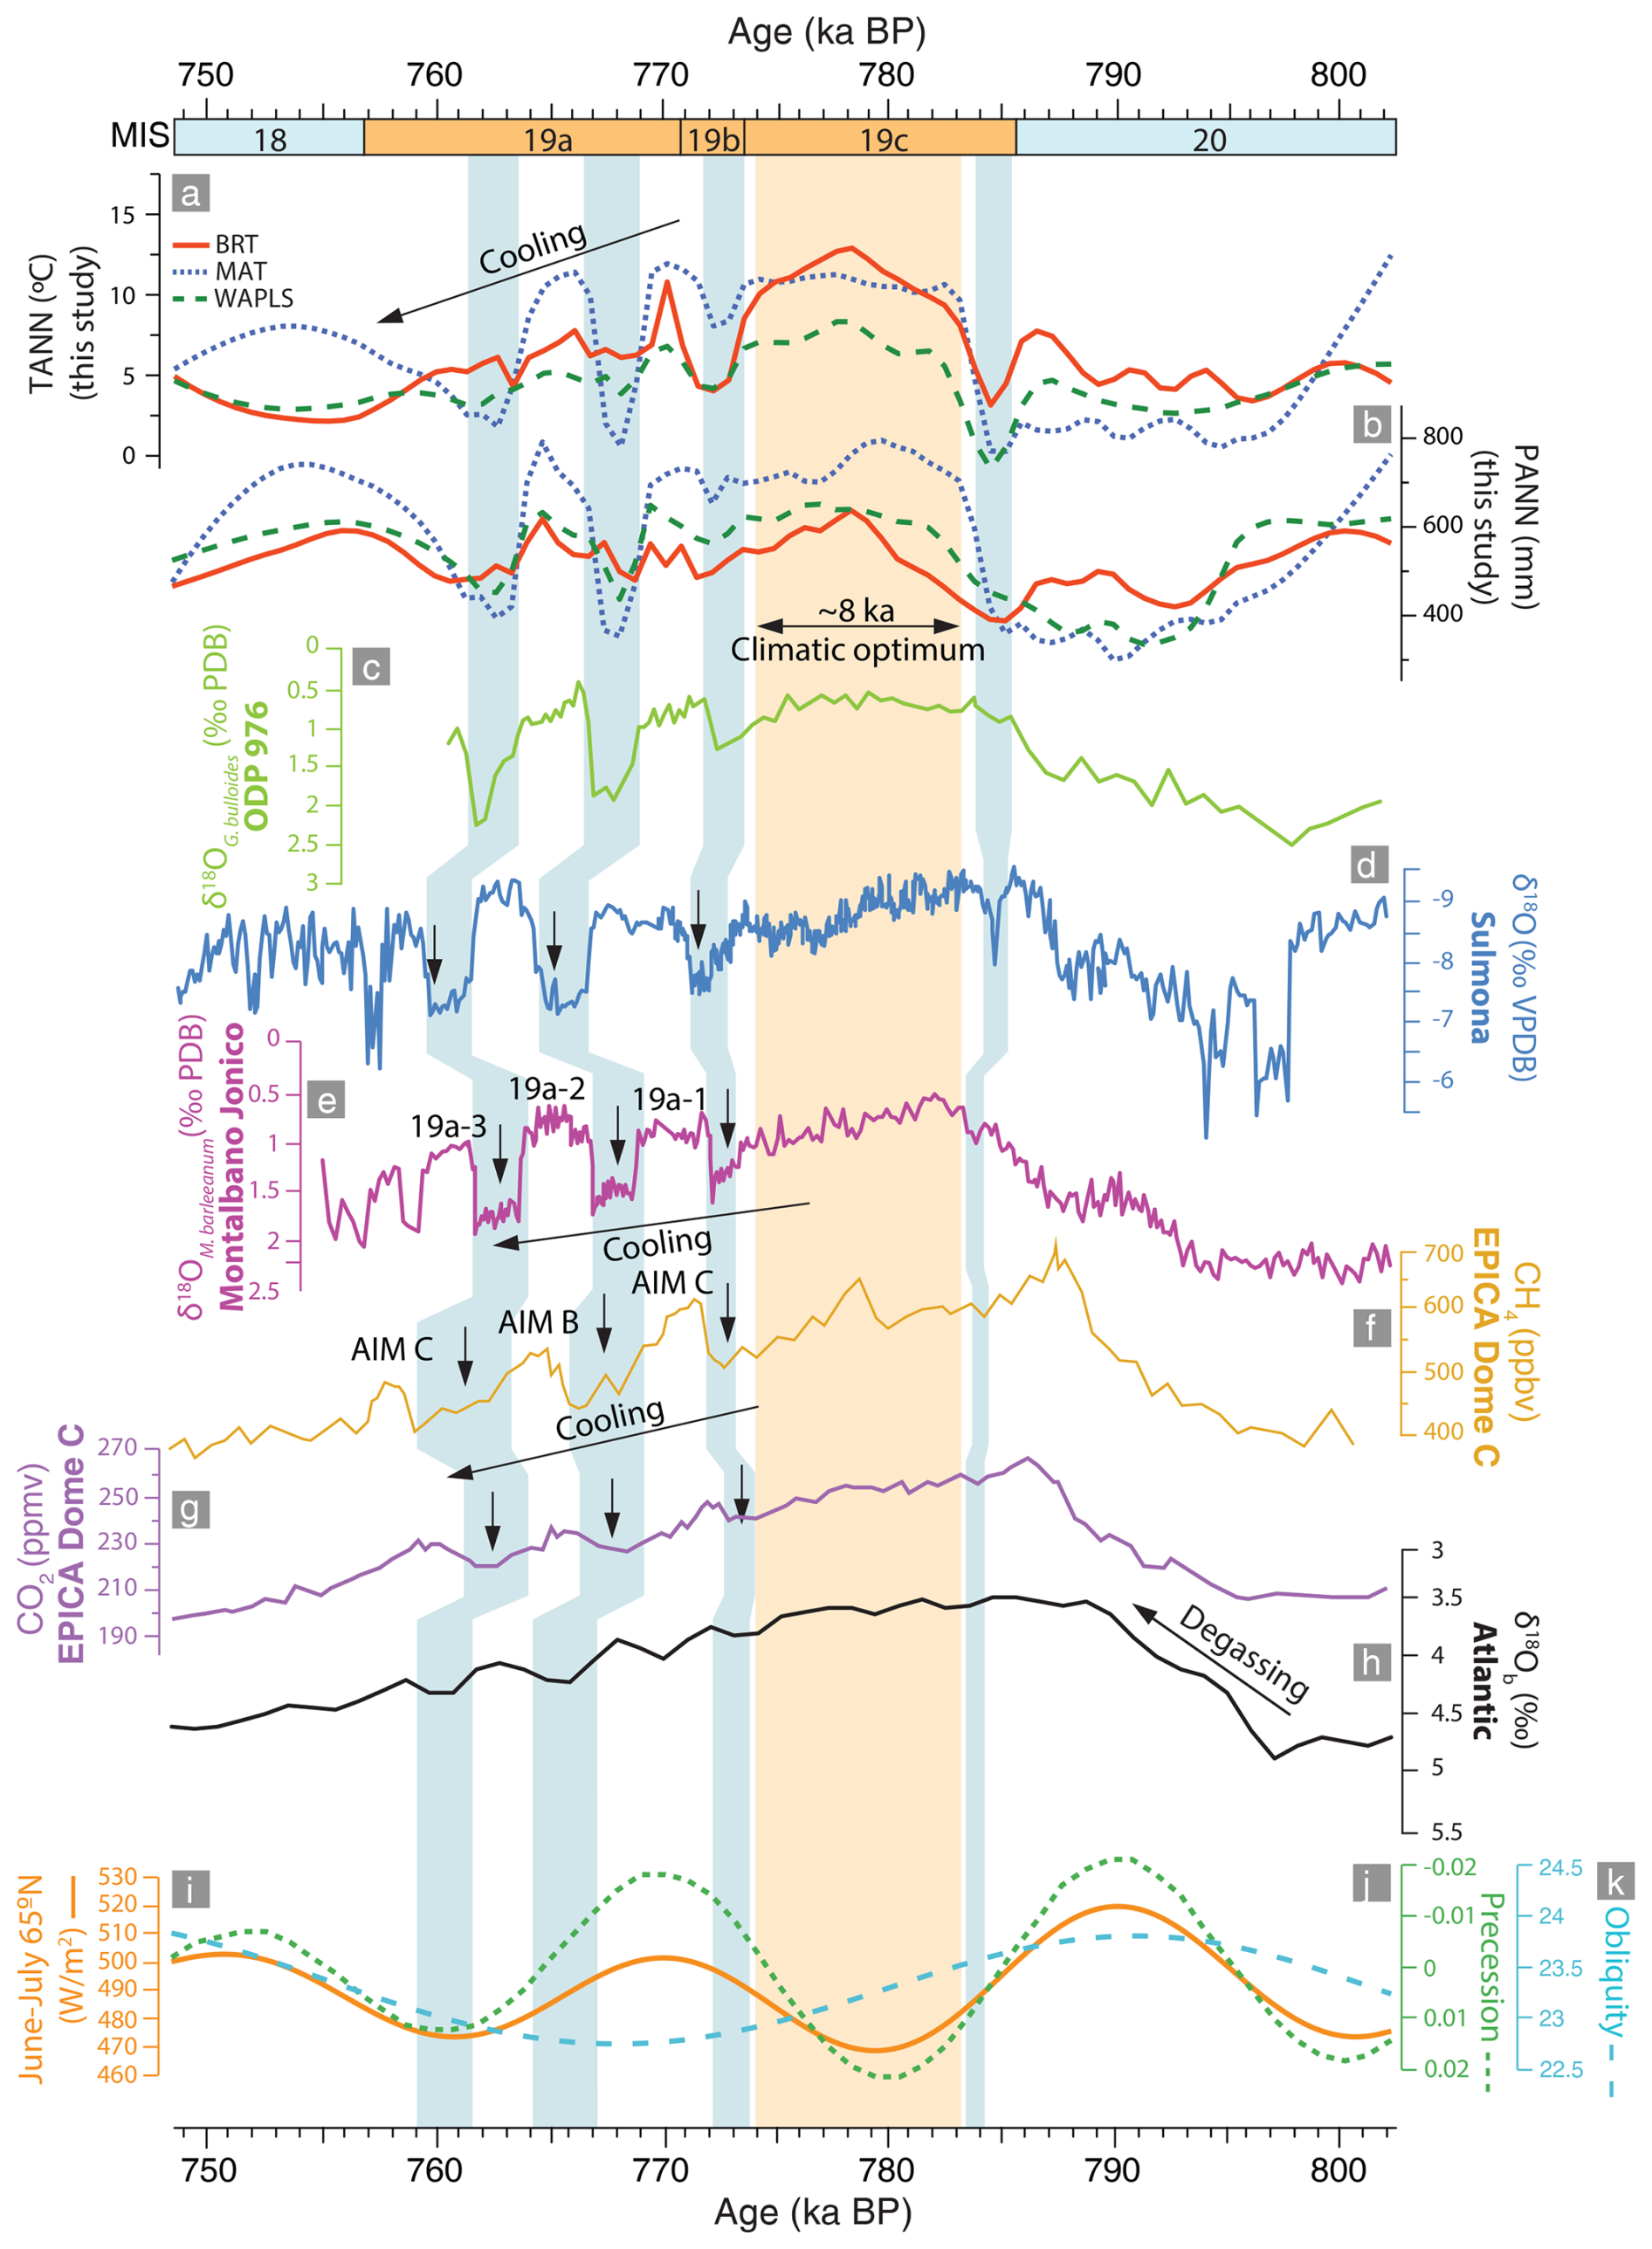
Figure 2Comparison of the pollen-based quantitative reconstructions from ODP976 for MIS 19, (a) TANN, and (b) PANN (BRT: solid red line; MAT: dotted blue line; WAPLS: dashed green line) with other regional and global proxies: (c) δ18OG. bulloides record from ODP976 (Toti et al., 2020a); (d) δ18O records of Sulmona basin sediments (Regattieri et al., 2016); (e) δ18OM. barleeanum record from Montalbano Jonico (Nomade et al., 2019); (f) methane (CH4) atmospheric concentrations (Loulergue et al., 2008) and (g) CO2 atmospheric concentrations from Antarctic EPICA Dome C ice cores (Nehrbass-Ahles et al., 2020); (h) Atlantic δ18O (Voelker et al., 2010); (i) summer insolation (Laskar et al., 2004); (j) precession index and (k) obliquity curve (Berger and Loutre, 1991). The orange band indicates the period encompassing the climatic optimum, and the blue bands highlight major millennial-scale climatic events.
Table 2Summary of results of the pollen-based climatic reconstructions for MIS 20–19.

From 786–773 ka BP, the reconstructions for TANN indicate a rise from 2–7 °C during the glacial to 6–13 °C, indicating the transition to MIS 19 (Fig. 2). This period is equivalent to the climatic optimum MIS 19c. This trend is also indicated by PANN, which increases from 350–500 mm during the glacial to between 600–800 mm across the three methods during the climatic optimum, indicating warmer and wetter conditions compared to MIS 20 (Toti et al., 2020a). This climatic amelioration is interrupted by a short-lived event to cooler and drier conditions and a change in seasonality around 785 ka BP. This event has been observed in other pollen records including Montalbano Jonico (Bertini et al., 2015) and speleothem records like Sulmona (Regattieri et al., 2016).
In the Alboran Sea, a peak in warmth and humidity is observed around 778 ka BP across the three methods, although some differences in the methods are observed, where WAPLS and BRT suggest a more gradual temperature and precipitation increase than MAT, which indicates greater-amplitude fluctuations (Fig. 2). TANN averages between 5 and 10 °C and PANN is around 500–700 mm, with Pwin values of around 150–300 mm and Twin around 0 °C, suggesting temperate summers and mild winters during MIS 19c (Figs. 2 and S2). These reconstructions correlate well (Fig. 2) with the progressive increase in CH4 and CO2 observed in the EPICA ice cores (Jouzel et al., 2007; Nehrbass-Ahles et al., 2020) and a decline in Atlantic δ18O (e.g. Voelker et al., 2010; Sánchez Goñi et al., 2016b).
There is a decisive fall in temperature centred between 773–771 ka BP, along with a slight decrease in precipitation (Table 2), consistent with a return to colder and drier conditions during MIS 19b-a (Toti et al., 2020a). Twin fluctuates from –9 to 7 °C, indicating substantial variability in winter temperatures, while Tsum ranges from 13 to 22 °C, suggesting fluctuations in summer warmth (Fig. S2). TANN varies between 0 and 14 °C, indicating overall climatic changes throughout the year. PANN ranges from 370 to 750 mm, reflecting fluctuations in annual precipitation levels. This is followed by three large-amplitude fluctuations during MIS 19a (Fig. 2 and Table 2), with extreme peaks at 770 and 765 ka BP, separated by two significant events of climatic deterioration at 768 and 764 ka BP, which are linked to the high-frequency alternation between forest and open vegetation observed in the pollen record. This shows good agreement with oscillations in the benthic δ18O record of Montalbano Jonico from Nomade et al. (2019), who labelled these 19a-1, 19a-2, and 19a-3. These fluctuations also correlate well with those observed in the benthic δ18O record from Sulmona (Giaccio et al., 2015; Regattieri et al., 2016), Atlantic δ18O (e.g. Voelker et al., 2010; Sánchez Goñi et al., 2016b), and the CH4 (Loulergue et al., 2008) and CO2 observed in the EPICA ice cores (Jouzel et al., 2007; Nehrbass-Ahles et al., 2020). These climatic oscillations may have been caused by a shift in the position of the Intertropical Convergence Zone (ITCZ), causing northward pressure on the Mediterranean and leading to more arid summers and enhanced winter precipitation (Toti et al., 2020a).
4.2.2 MIS 12–11 (434–356 ka BP)
Between 434 and 427 ka BP, reconstructions for the end of MIS 12 show a generally cold and dry climate (Fig. 3). Annual temperature reconstructions reveal consistently low values across methods, with the coldest period occurring before 430 ka BP (Table 3). During this period, Twin shows temperatures ranging –5–0 °C and Tsum does not rise above 17 °C (Fig. S3). Following a brief warming around 430 ka BP, a rapid return to colder conditions is observed at 428–426 ka BP across all three methods (Fig. 3). This abrupt shift to colder conditions coincides with decreased sea surface temperatures (SSTs) and increased δ18OG. bulloides in the record from the same ODP976 core by Brice (2007, unpublished thesis), who made the analogy with a Younger Dryas-like (YD-l) event. Other studies refer to this as the Ht4 Heinrich-type event (Hodell et al., 2008; Rodrigues et al., 2011; Girone et al., 2013; Marino et al., 2018). Vázquez Riveiros et al. (2013) noted enhanced ice-rafted debris (IRD) coeval with a sudden decrease in North Atlantic SSTs during this event, indicating significant ice rafting. Other pollen-based reconstructions, particularly those from Lake Ohrid which used the MAT method (Kousis et al., 2018), show a short-lived decrease in temperatures, precipitation, and forest cover prior to the onset of warmer and wetter conditions during Termination V.
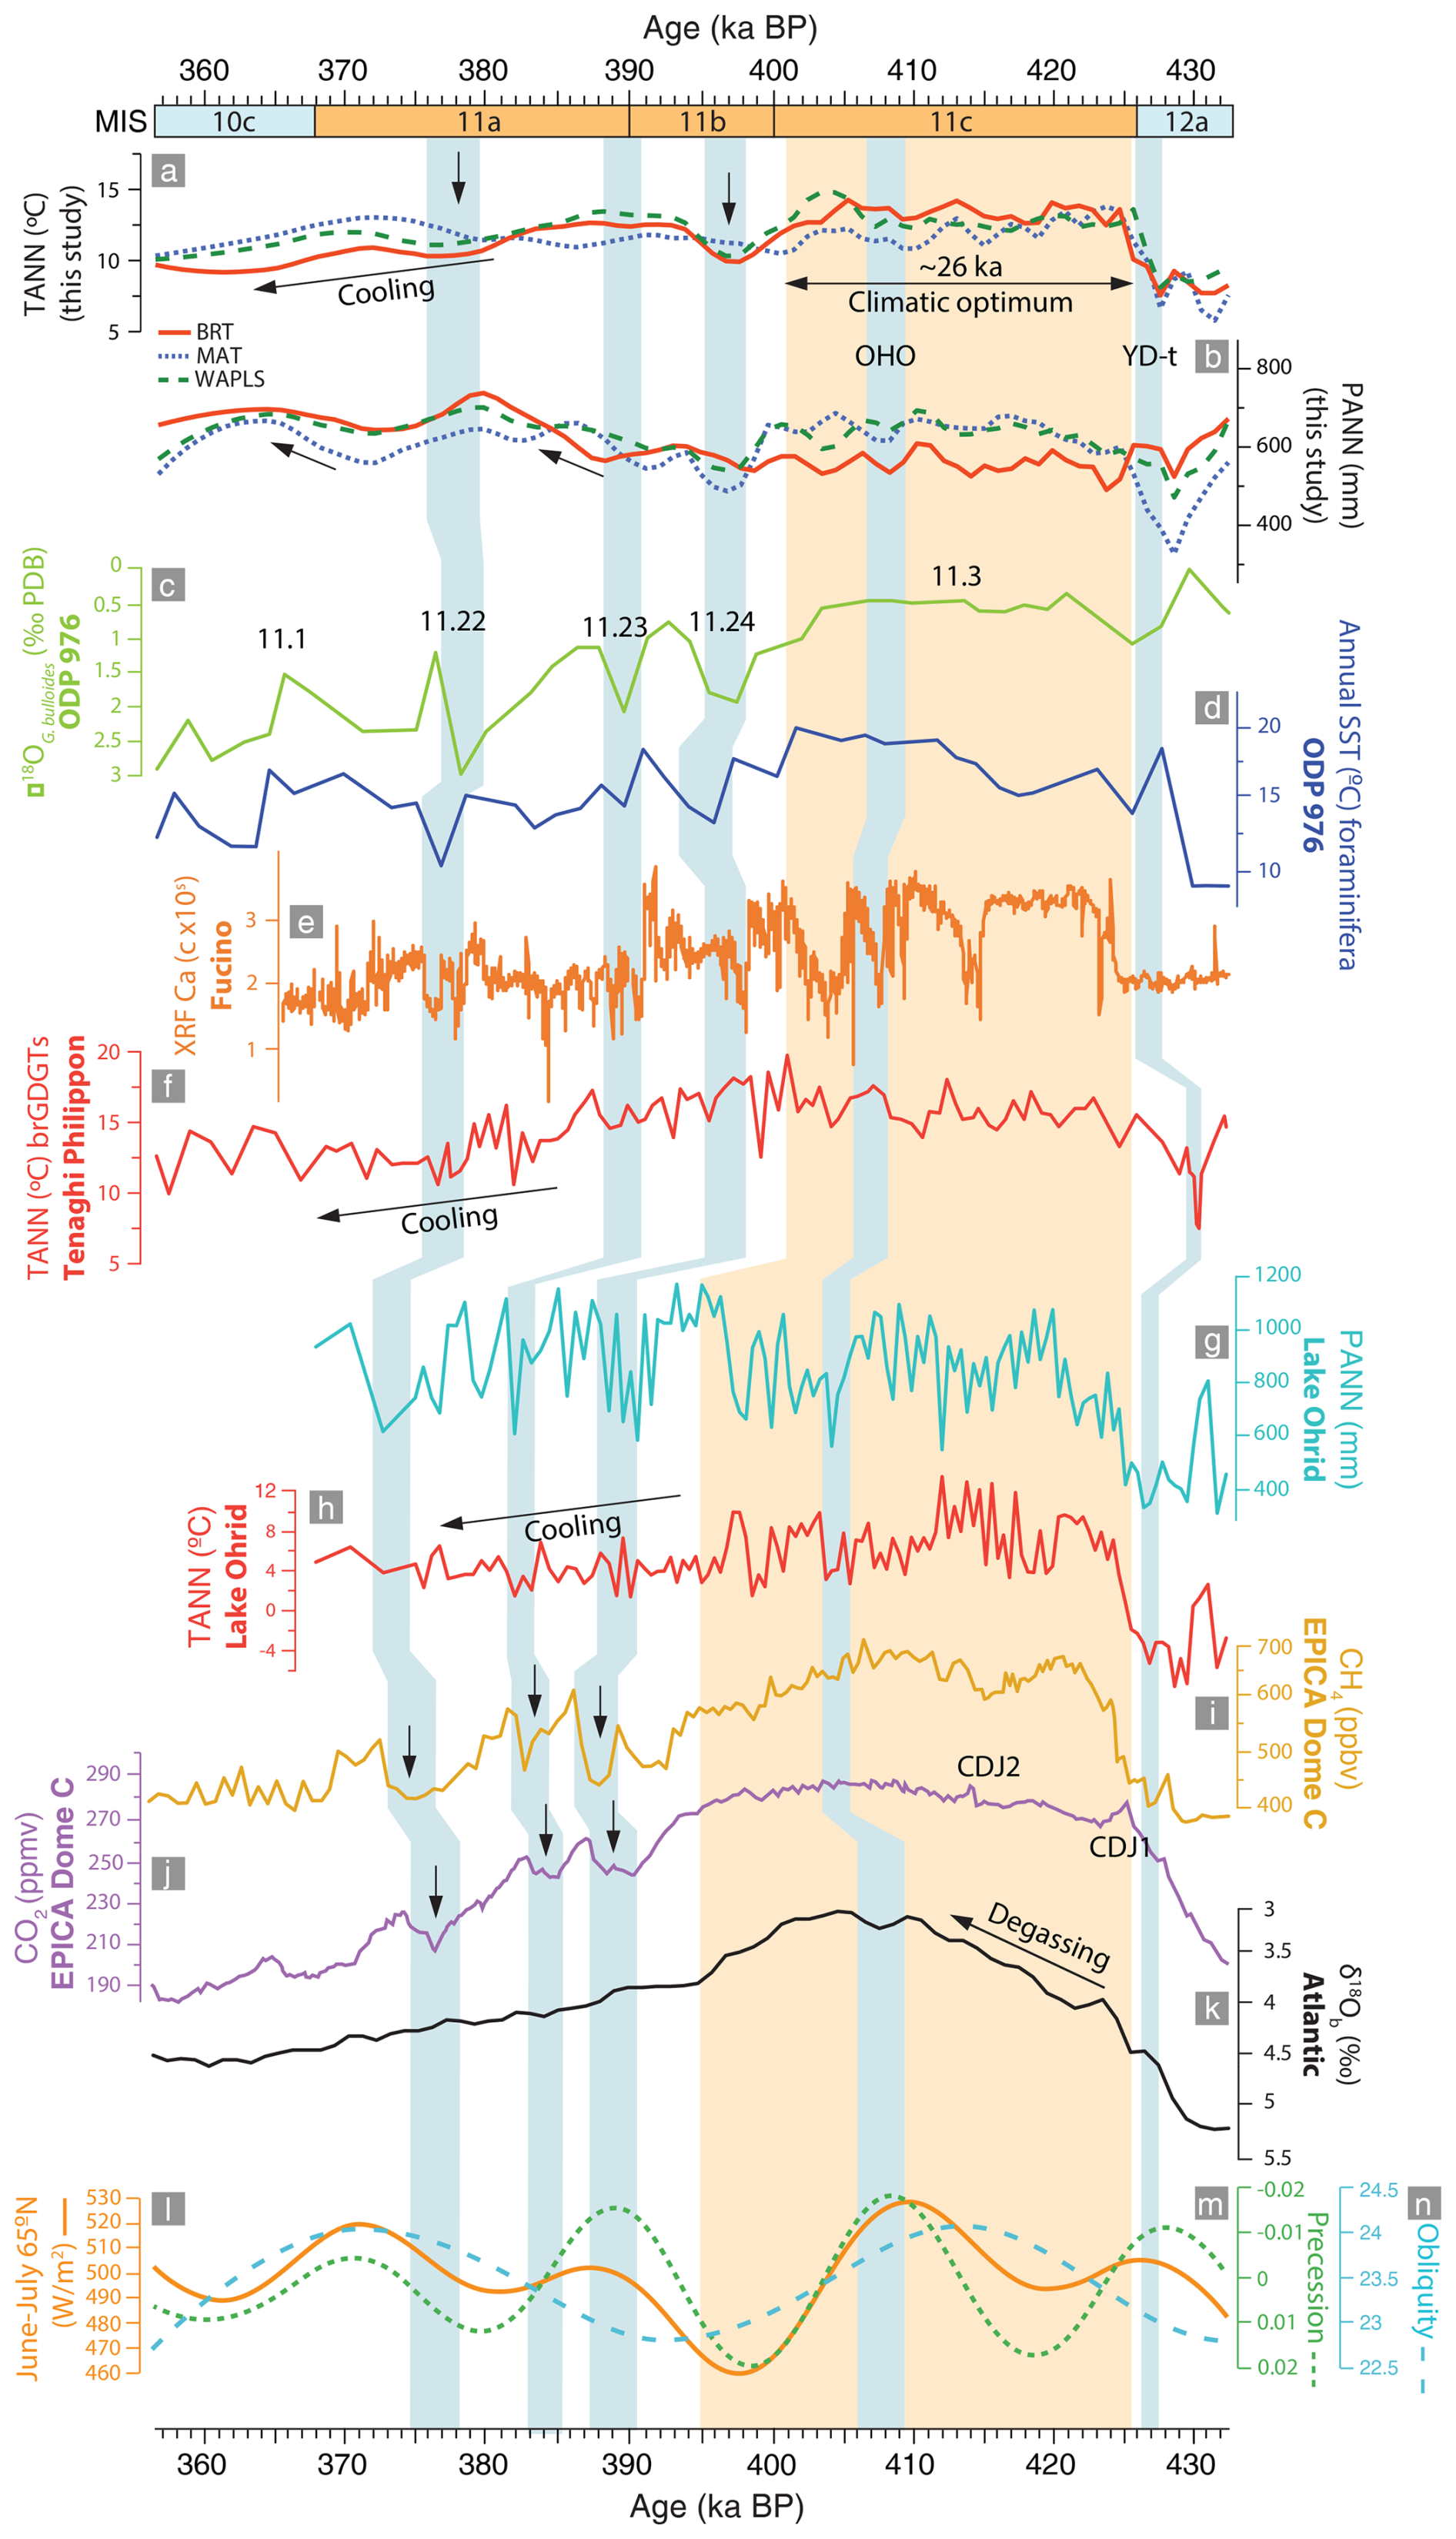
Figure 3Comparison of the pollen-based quantitative reconstructions from ODP976 for MIS 11, (a) TANN, and (b) PANN (BRT: solid red line; MAT: dotted blue line; WAPLS: dashed green line) with other regional and global proxies: (c) δ18OG. bulloides and (d) annual SSTs from the function transfer of foraminiferal assemblages from ODP976 (Brice, 2007, unpublished thesis); (e) XRF (calcium) counts per second (cps) record from the Fucino Basin (Giaccio et al., 2019; Monaco et al., 2021); (f) TANN derived from molecular biomarkers (brGDGT) from Tenaghi Philippon (Ardenghi et al., 2019); (g) PANN and (h) TANN from Lake Ohrid derived through the MAT method (Kousis et al., 2018); (i) methane (CH4) atmospheric concentrations (Loulergue et al., 2008) and (j) CO2 atmospheric concentrations from Antarctic EPICA Dome C ice cores (Nehrbass-Ahles et al., 2020); (k) Atlantic δ18O (Voelker et al., 2010); (l) summer insolation (Laskar et al., 2004); (m) precession index and (n) obliquity curve (Berger and Loutre, 2002). The orange band indicates the period encompassing the climatic optimum, and the blue bands highlight major millennial-scale climatic events.
Table 3Summary of results of the pollen-based climatic reconstructions for MIS 12–11.
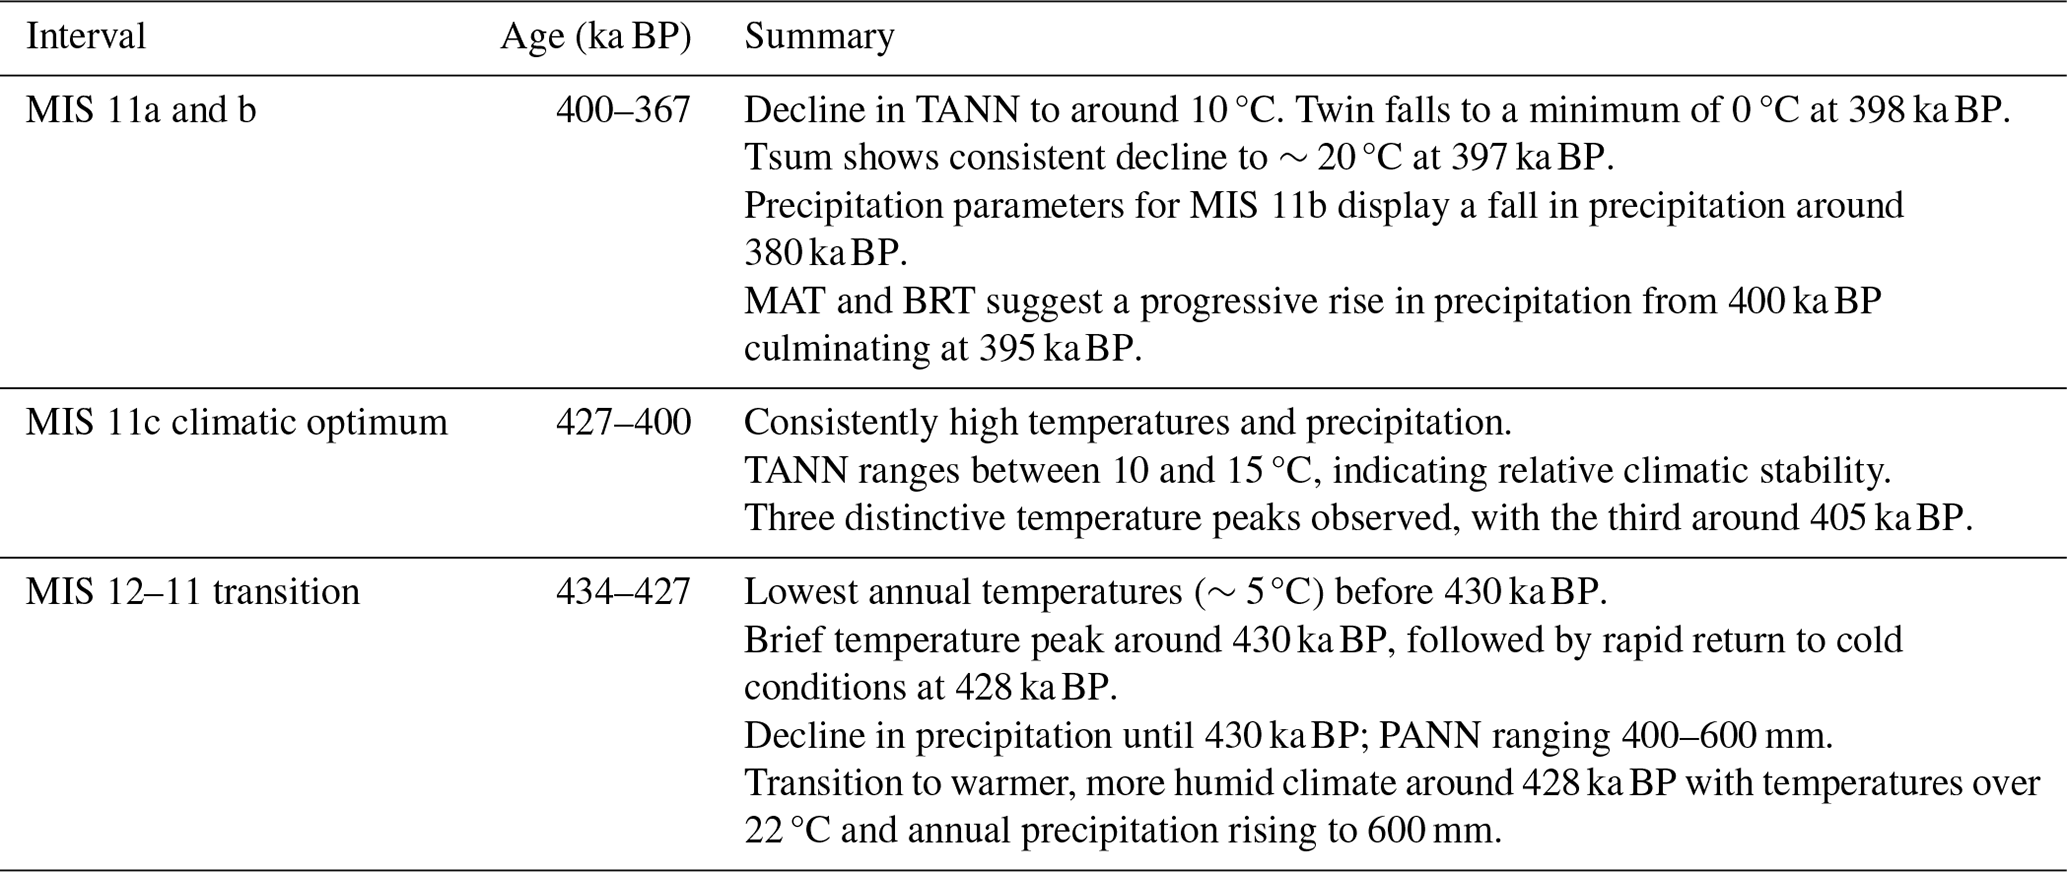
From 427 to 405 ka BP, consistently high temperatures and precipitation are observed (Fig. 3 and Table 3), in agreement with the warmest part of MIS 11, substage MIS 11c (Sassoon et al., 2023). This transition has also been observed in other records (Fig. 3) in the Mediterranean region (Tzedakis, 2010; Girone et al., 2013; Kousis et al., 2018; Ardenghi et al., 2019; Koutsodendris et al., 2019; Azibeiro et al., 2021), the North Atlantic off the Iberian coast (Desprat et al., 2005; Oliveira et al., 2018), and continental Europe (Reille and de Beaulieu, 1995). TANN rises from around 8 to over the time frame of ca. 2000 years. BRT and WAPLS show Tsum values of around 18 °C, while the MAT method estimates warmest-month temperatures of over 22 °C (Fig. S3). This warming is in agreement with the expansion of forest biomass observed in several other records from across the Mediterranean basin throughout Termination V including Lake Ohrid (Kousis et al., 2018), Tenaghi Philippon (Wijmstra and Smit, 1976; Tzedakis et al., 2006; Pross et al. 2015; Ardenghi et al., 2019; Koutsodendris et al., 2023), and Bouchet–Praclaux (Reille and de Beaulieu, 1995). This increase in temperatures during MIS 11c may be linked to the MIS 11.3 light isotopic event (Oliveira et al., 2018) and the highest summer insolation recorded for MIS11 in the Northern Hemisphere (Sassoon et al., 2023). The warming trend is also coeval with the rise in Antarctic air temperatures and Atlantic CO2 records (Fig. 3) (Jouzel et al., 2007; Loulergue et al., 2008; Nehrbass-Ahles et al., 2020). These results correlate with the highest SSTs, highest CO2 and CH4 concentrations (Jouzel et al., 2007; Nehrbass-Ahles et al., 2020), and reduced δ18O (e.g. Voelker et al., 2010; Oliveira et al., 2018).
Precipitation also increases during the climatic optimum, suggesting warm and humid conditions (Fig. 3 and Table 3). Annual precipitation results from BRT and WAPLS show a rise from 500 mm during the glacial to 600 mm for MIS 11c in the period between 429–427 ka BP, while MAT suggests a larger amplitude of change from around 380 to 600 mm. These results are consistent with pollen-based quantitative reconstructions of Kousis et al. (2018) at Lake Ohrid, which suggest a shift to more a humid and warmer climate at the beginning of MIS 11c. However, the reconstructions for precipitation at Lake Ohrid are comparatively higher than the results for ODP976, evidenced by a rise in PANN to 800–1000 mm at Lake Ohrid (Kousis et al., 2018). At Tenaghi Philippon, precipitation reconstructions derived from the calcium to iron (log(CaFe)) ratio by Koutsodendris et al. (2023) show that MIS 11c was one of the wettest interglacials at this site with a significant difference between the climatic optimum and the rest of MIS 11. This is a significant finding because this corroborates the hypothesis put forward by several authors (Kandiano et al., 2012; Kousis et al., 2018; Sassoon et al., 2023) who suggested, on the basis of pollen assemblages, that during MIS 11c, the climate in the southwestern Mediterranean was warmer and drier than Lake Ohrid and Tenaghi Philippon in the Balkan Peninsula. Although this might be an effect of a difference in altitude between the sites (which might also explain the difference in annual temperature) and the nature of the substrates observed (marine vs. terrestrial), it might be indicative of an easterly humidity gradient within the wider region owing to the formation of a bipolar seesaw pattern in precipitation between the western and eastern Mediterranean, possibly caused by a weakening of the AMOC during the deglaciation (Kousis et al., 2018).
During the MIS 11c optimum, a noteworthy fluctuation occurs around 408 ka BP, mainly indicated in our reconstructions by a decrease in PANN (Fig. 3). This is related to a moderate-intensity contraction in temperate and Mediterranean forests (Sassoon et al., 2023). Oliveira et al. (2016) and Kousis et al. (2018) have linked this forest contraction with the “Older Holstenian Oscillation” (OHO), also found in other records from Europe (West, 1956; Kelly, 1964; Turner, 1970; Kukla, 2003; Koutsodendris et al., 2011, 2012, 2023; Tye et al., 2016). Our reconstructions indicate a reduction in TANN by about 1–2 °C and in PANN by 50 mm on average across the three methods. This appears to be less intense than the changes inferred for Lake Ohrid (Kousis et al., 2018) and Tenaghi Philippon (Ardenghi et al., 2019), which suggest a higher amplitude of change in both precipitation and temperature in the Balkans.
Between 400 and 356 ka BP, the substages MIS 11a and 11b exhibit reduced climate variability. Around 400–390 ka BP, a synchronous decline across the reconstructions for temperature and precipitation is interpreted as a cooler and drier phase, recognized as MIS 11b, connected to a decrease in summer insolation. The reconstructions show a decline in temperature and precipitation parameters centred around 398 ka BP (Fig. 3). Similarly, reconstructions for Lake Ohrid demonstrate reductions in TANN and PANN (Kousis et al., 2018), indicating a synchronous cooling across the Mediterranean Basin. Around 390–367 ka BP, recognized as substage MIS 11a, a return to warmer and more humid conditions, though relatively less temperate than the conditions during MIS 11c, is observed. Temperature reconstructions vary depending on methods, with WAPLS and BRT indicating less variation than MAT suggests. PANN and Pwin also increase compared to previous levels at the end of MIS 11b, showing high variability during MIS 11a (Figs. 3 and S3). Overall, however, these trends correlate with patterns observed in palaeoclimatic records from the North Atlantic and Mediterranean and seem to reflect summer insolation (Candy et al., 2014, 2024).
The fluctuations during MIS 11a and 11b can be correlated with light isotopic events 11.24, 11.23, and 11.22 (Fig. 3) observed in δ18O records (Brice, 2007, unpublished thesis; Desprat et al., 2005; Oliveira et al., 2018). Particularly, the drop in precipitation and temperature around 397 ka BP, reflective of the rise in steppe taxa in ODP976, is synchronous with light isotopic event 11.24, also observed at IODP Site U1385 (Oliveira et al., 2018), MD01-2447 (Desprat et al., 2005, 2007), Lake Ohrid (Kousis et al., 2018), and Tenaghi Philippon (Ardenghi et al., 2019). The alkenone-based SST record from MD03-2699 shows reductions to ∼10 °C (Rodrigues et al., 2011). This trend can also be compared with falls in CO2 and CH4 concentrations in the Antarctic EPICA records, which exemplify the sensitivity of the Mediterranean to global-scale climate change.
From 367 ka BP onwards, the temperature and precipitation reconstructions across all methods collectively suggest a transition to a significantly colder and drier climate, consistent with the beginning of the glacial inception of MIS 10.
4.2.3 MIS 6–5 (133–80 ka BP)
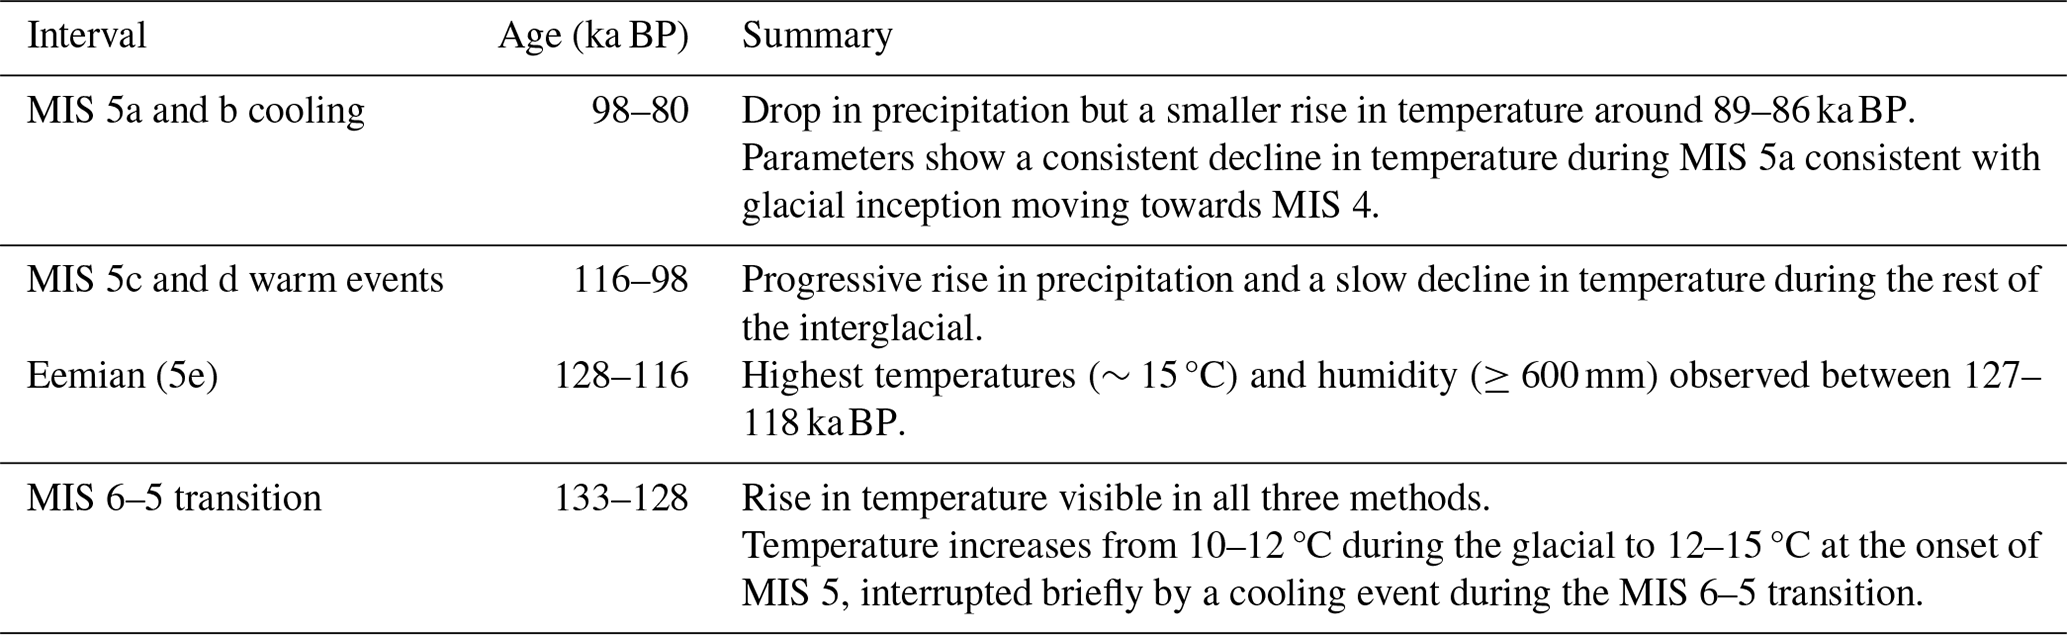
The climatic reconstructions for the period between 133 and 128 ka BP, equivalent to the end of the MIS 6 glacial period, also referred to as the penultimate glacial, indicate cold and dry conditions, though some differences between methods are observed (Fig. 4). Generally, the three methods show low values of TANN (range of 10–13 °C) and Twin (range of –5 °C to 3 °C) for the glacial period (Fig. 4), but there appears to be disagreement in the reconstruction of Tsum. While BRT and WAPLS suggest an average Tsum of 20 °C, which is already surprisingly high, MAT indicates higher values (Fig. S4), which might be due to the tendency of this method to overestimate parameters as it is more sensitive than the other two methods and has been shown in other studies to have a wider spread of estimates during glacial periods (Brewer et al., 2008; Sinopoli et al., 2019). On the other hand, precipitation reconstructions seem to be relatively in agreement with each other, suggesting dry conditions with PANN under 600 mm. The results for this time period are also observed in other records and pollen-based reconstructions from southern Europe and the Iberian Margin (e.g. Sánchez Goñi et al., 1999; Desprat et al., 2005; Brewer et al., 2008; Sinopoli et al., 2019; Leroy et al., 2023).
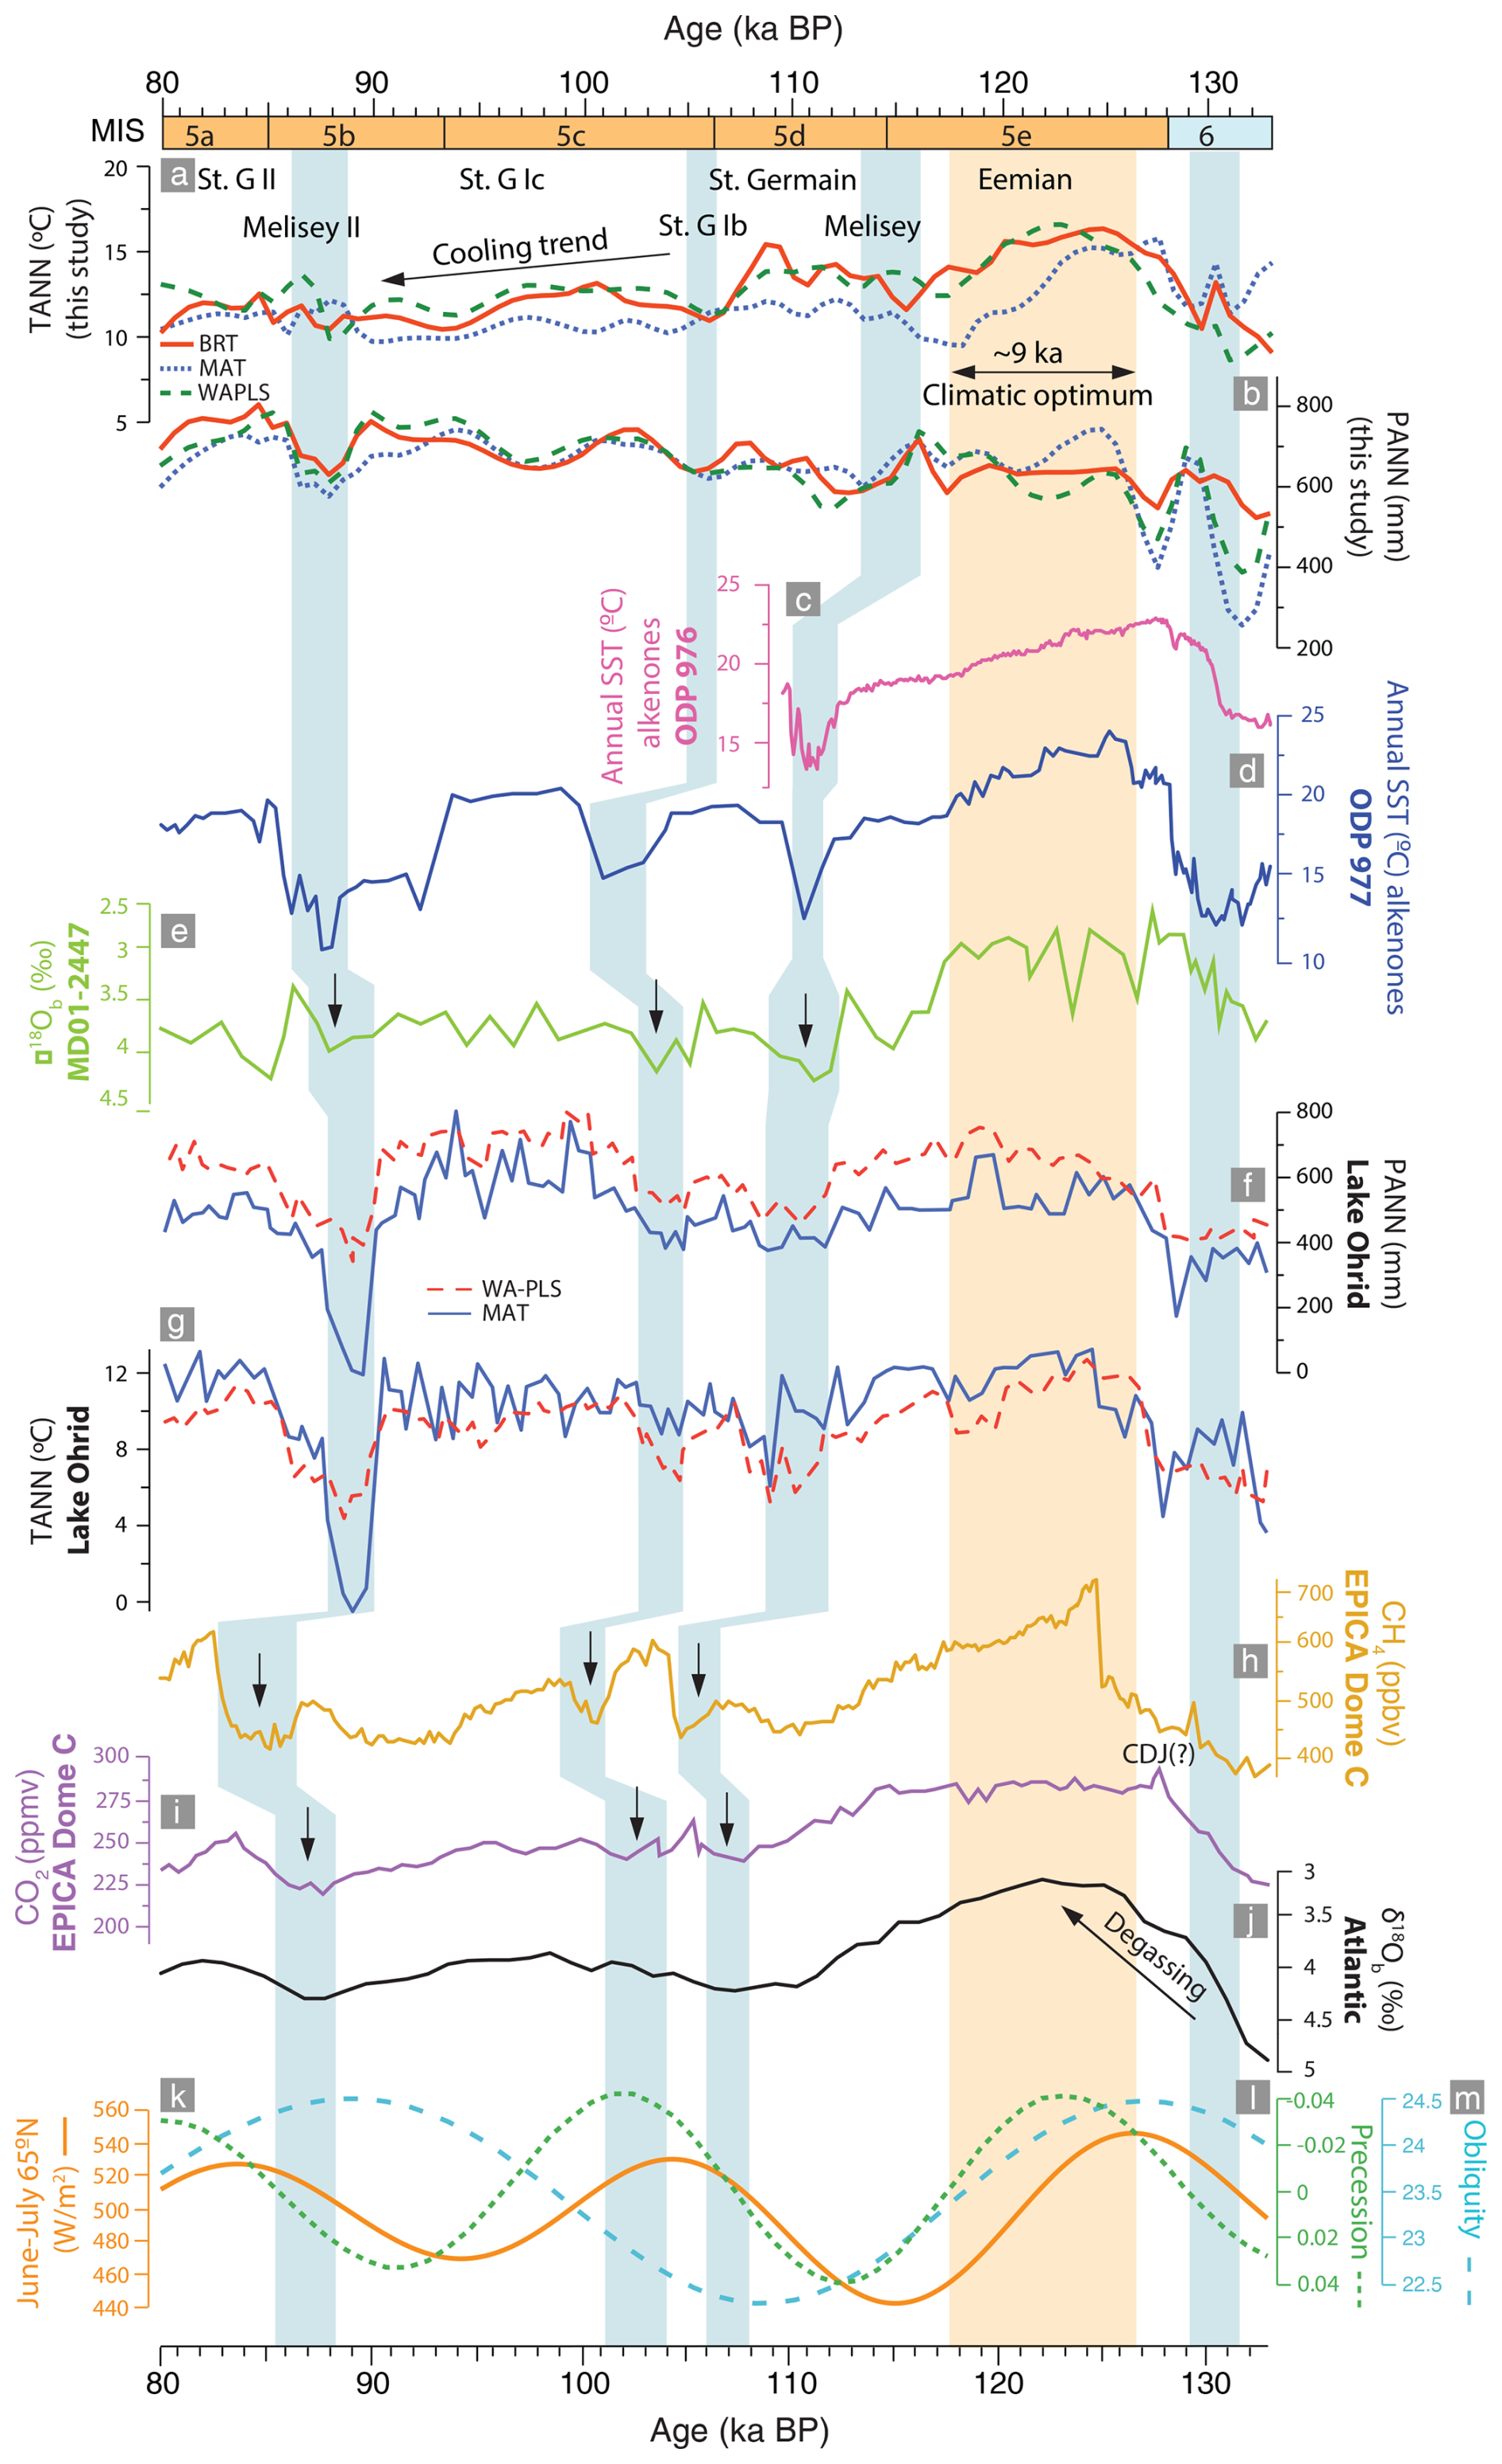
Figure 4Comparison of the pollen-based quantitative reconstructions from ODP976 for MIS 5, (a) TANN, and (b) PANN (BRT: solid red line; MAT: dotted blue line; WAPLS: dashed green line) with other regional and global proxies: (c) alkenone SSTs from ODP976 (Martrat et al., 2014); (d) alkenone SSTs from ODP977 (Martrat et al., 2004); (e) benthic δ18O from MD01-2447 (Desprat et al., 2007); (f) PANN and (g) TANN from Lake Ohrid derived through MAT and WAPLS (Sinopoli et al., 2019); (h) methane (CH4) atmospheric concentrations (Loulergue et al., 2008) and (i) CO2 atmospheric concentrations from Antarctic EPICA Dome C ice cores (Nehrbass-Ahles et al., 2020); (j) Atlantic δ18O (Voelker et al., 2010); (k) summer insolation (Laskar et al., 2004); (l) precession index and (m) obliquity curve (Berger and Loutre, 1991). The orange band indicates the period encompassing the climatic optimum, and the blue bands highlight major millennial-scale climatic events.
The transition from MIS 6 to MIS 5 is characterized by a rise in temperature and precipitation indicative of a gradually warmer and more humid climate. An increase in TANN is visible with all three methods, from between 10–12 °C during the glacial to 12–15 °C at the beginning of MIS 5e, equivalent to the early Eemian (Fig. 4). This reflects the shift from steppe taxa to Quercus and other temperate vegetation (Fig. S1) as was also recorded in the marine records of MD952042 (Sánchez Goñi et al., 1999) and MD01-2447 (Desprat et al., 2007) from the Iberian Margin. This progressive rise is paralleled by the rise in CO2 and CH4 from Antarctica and the decrease in δ18O (Desprat et al., 2005; Voelker et al., 2010; Oliveira et al., 2018). However, this transition towards climatic amelioration is interrupted by a short-lived event of abrupt cooling and drying, already observed in MIS 19 and 11. These events have previously been observed throughout the interglacials MIS 19, 11, and 5 in records from the Iberian Margin (Sánchez Goñi et al., 1999; Desprat et al., 2007) and were considered to be events analogue to Younger Dryas events or Heinrich-type events associated with the weakening of the AMOC during the deglaciation period. While these abrupt cooling and drying events during transitions to interglacials (MIS 19, 11, and 5) are well-documented in Mediterranean records, such as those from the Iberian Margin, similar YD/H1-like events are not always present in terrestrial records from mainland Europe such as Tenaghi Philippon and Lake Ohrid. This may be due to the fact that marine records capture more regional signals compared to terrestrial records and the greater sensitivity of sites like the Alboran Sea to such climatic shifts.
While there are some differences between the methods in terms of the specific timing of the peak climatic optimum during the Eemian (something that is itself under particular debate in the literature; e.g. Cheddadi et al. 1998; Sánchez Goñi et al., 1999), the reconstructions show that the highest temperatures (>15 °C) and humidity (≥600 mm) occurred between 127–118 ka BP (Fig. 4 and Table 4). This is coeval with the lightest isotopic δ18O signature from the Iberian Margin (Desprat et al., 2007) and the highest sea surface temperatures recorded in core ODP977 in the Alboran Sea (Martrat et al., 2004). During this climatic optimum, Tsum and Twin values peak with values higher than MIS 19 and 11 averaging>23 and 10 °C, respectively, indicating increased temperature during both winter and summer months (Fig. S4). These parameters indicate a more humid and warmer climate during the optimum of the Eemian than the present day, which corroborates the findings of several other studies in Europe (Guiot et al., 1989; Cheddadi et al. 1998; Sánchez Goñi et al., 1999; Desprat et al., 2007; Brewer et al., 2008; Leroy et al., 2023). For example, reconstructions from Lake Ohrid, La Grande Pile, Les Echets, and Le Bouchet also show a thermal maximum around this time, between 127 and 118 ka, followed by cooling around 117 ka (Brewer et al., 2008; Sinopoli et al., 2019).
Table 4Summary of results of the pollen-based climatic reconstructions for MIS 6–5.
Our results also match the findings by Brewer et al. (2008), who identified a difference between northern and southern Europe, whereby records from higher latitudes experience a sharp drop in temperatures and precipitation following the optimum, whereas the climate remained more stable conditions over a longer period in the south. Our reconstructions for ODP976, similarly to those from Lake Ohrid (Sinopoli et al., 2019) and Lago di Monticchio (Allen et al., 1999; Brewer et al., 2008), exhibit a gradual and continuous cooling trend without a sudden decrease in temperatures and precipitation following the Eemian optimum, suggesting an intermediate climate signal more similar to southern European sites than northern ones and possibly corroborating the idea of a weak latitudinal gradient during this period. However, our results for Psum and Pwin show that there was still strong seasonality during the Eemian climate optimum at least in the western Mediterranean, reflected more by precipitation parameters than temperature (Fig. S4). During this period, our reconstructions show that, while the climate was overall wetter than the glacial of MIS 6 (as well as the latter parts of the Eemian), the climatic optimum was characterized by very dry summers and contrastingly wetter winters. This might be linked to a strong Mediterranean climate during this time around the Alboran Sea, as previously suggested by Sánchez Goñi et al. (1999) for the Iberian Margin.
The tail end of the optimum is characterized by a decrease in temperature and a rise in precipitation, visible across all three methods, in agreement with other European records (Guiot et al., 1989; Brewer et al., 2008; Sinopoli et al., 2019). Throughout the rest of the interglacial, several fluctuations are observed between cool and warm periods, also observed in other southern European records, with counterparts in Atlantic δ18O records (Sánchez Goñi et al., 1999; Desprat et al., 2007; Sinopoli et al., 2019). Specifically, these occurred around 115 ka BP (Melisey I), 105 ka BP (St. Germain Ib), and 87 ka BP (Melisey II), events which are characterized by colonization by Cedrus and steppe vegetation; these are alternated with temperate phases St. Germain Ia and Ic and St. Germain II, during which heathlands and deciduous and Mediterranean forests expanded again (Sánchez Goñi et al., 1999). These events correlate well with the first Dansgaard–Oeschger events (Dansgaard et al., 1993): DO 25, 24, and 23 described by Masson-Delmotte et al. (2005). During this period of variability, our parameters suggest a progressive rise in precipitation and a slow decline in temperature throughout MIS 5c and the rest of the interglacial, consistent with climatic reconstructions from the Mediterranean such as Lake Ohrid (Sinopoli et al., 2019) and Lago di Monticchio (Brewer et al., 2008; Sinopoli et al., 2019), as well as records from the Iberian Margin (Sánchez Goñi et al., 1999; Desprat et al., 2007, 2013) and eastern Mediterranean (Leroy et al., 2023), showing similar trends throughout the Mediterranean. During MIS 5b, a notable drop in PANN is observed around 89–86 ka BP, alongside a moderate rise in TANN. During substage 5a, both parameters decrease further, consistent with glacial inception of MIS 4 (Fig. 4).
4.2.4 MIS 2–MIS1 (21 ka BP–present day)
Last Glacial Maximum to HE-1
During the Last Glacial Maximum (LGM), around 21–17.5 ka BP, MAT and WAPLS suggest peculiarly high TANN and Twin values, ranging between 12–15 and 0–10 °C, respectively (Fig. 5 and Table 5). MAT also suggests drastically higher Tsum values during this period when compared with BRT and WAPLS. This may once again be due to the tendency of MAT to overestimate parameters during glacial periods and is also linked to the inferior reliability of WAPLS when compared to the newer method BRT. Combourieu-Nebout et al. (2009) also noticed that their MAT reconstructions for the end of the LGM were higher than expected and closer to present-day levels, as it appears in the reconstruction methods of this current study. This discrepancy is due to the possible lack of good present-day analogues for the cedar and heath pollen association, which is dominant in the pollen record at the end of the LGM (Combourieu-Nebout et al., 2009). In contrast, BRT suggests relatively lower annual and seasonal temperatures than the other two methods for the LGM period, which is more in line with previous interpretations made by Combourieu-Nebout et al. (2009) on the basis of the ODP Site 976 pollen record during this period. In their study, TANN reconstructions suggested anomalies around –5 °C and Twin between –10 and –15 °C. Overall, precipitation during this period appears to be consistently low across all three methods, with PANN values remaining below 600 mm, indicating a dry climate in agreement with the previous study on the ODP976 core by Combourieu-Nebout et al. (2009), as well as the PANN reconstruction for the Padul record (Fig. 5), which shows a period of low precipitation patterns between 20 and 16 ka BP consistent with depleted δDC31 values (Camuera et al. 2018, 2019, 2022; García-Alix et al. 2021), and with the study by Davis et al. (2024), which shows an overall decline in mean annual precipitation during the LGM in southern Spain, especially during winter.
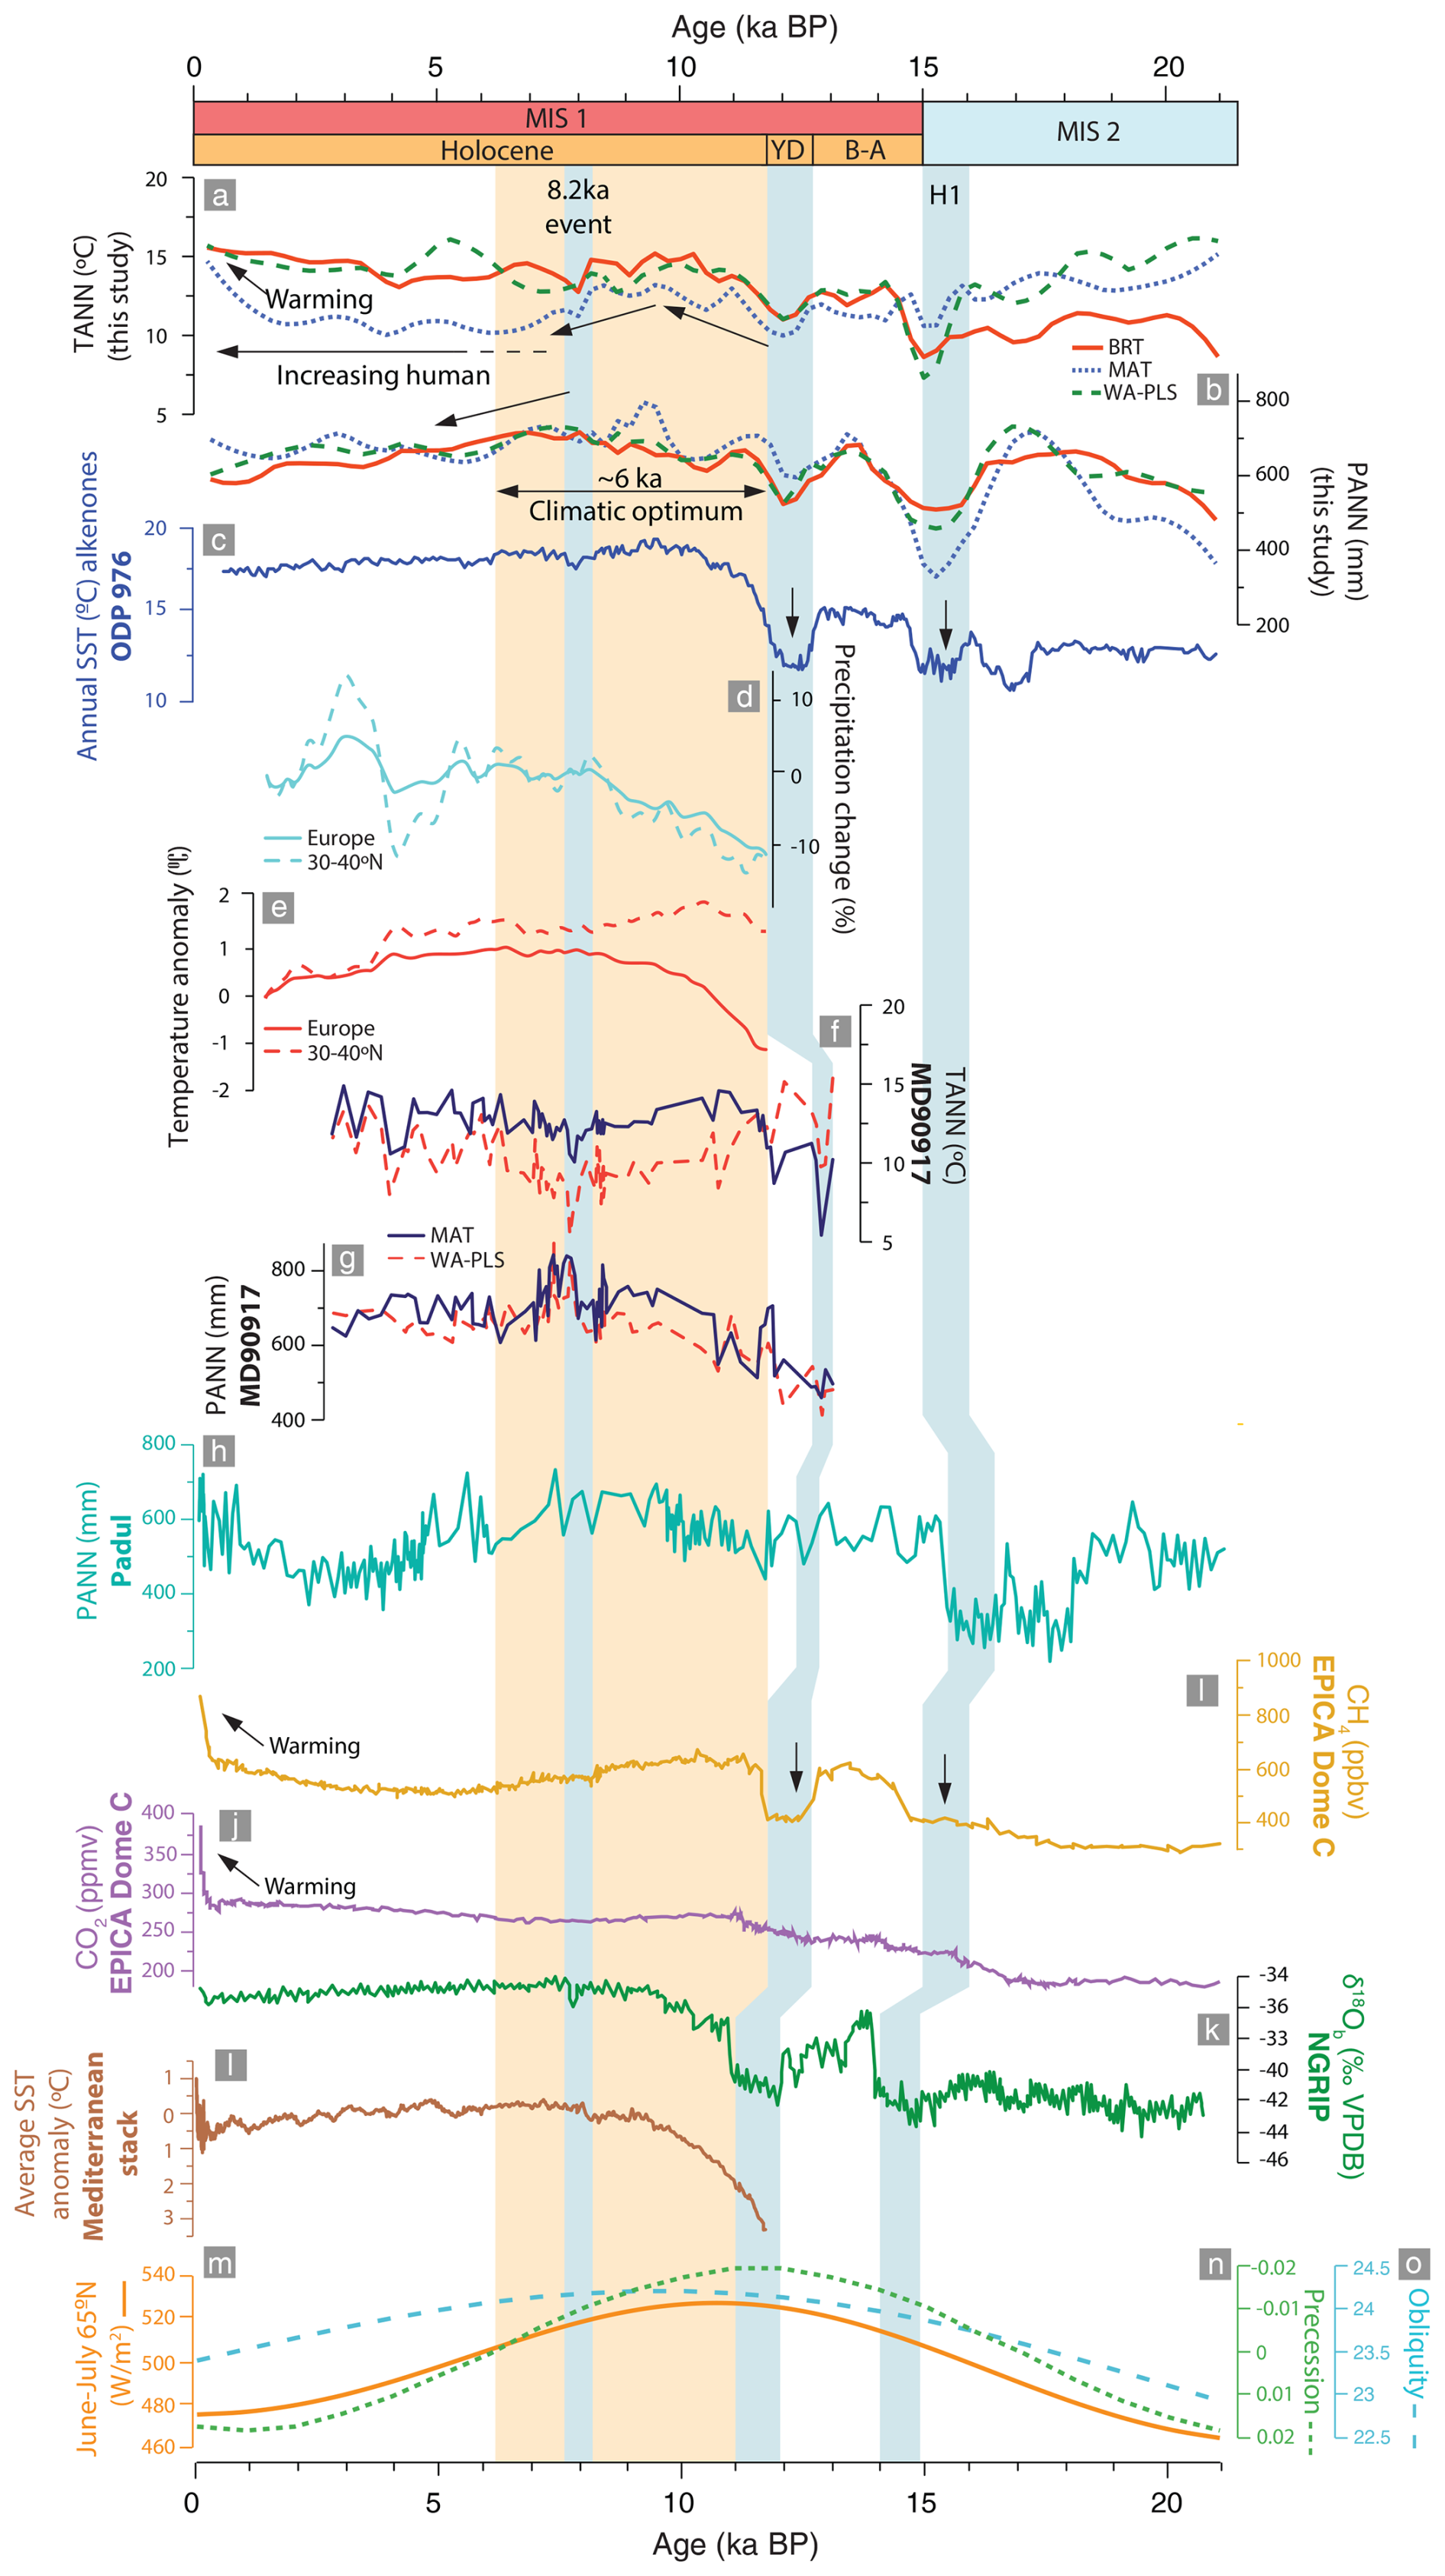
Figure 5Comparison of the pollen-based quantitative reconstructions from ODP976 for MIS 1, (a) TANN, and (b) PANN (BRT: solid red line; MAT: dotted blue line; WAPLS: dashed green line) with other regional and global proxies: (c) alkenone SSTs from ODP976 (Martrat et al., 2014); (d) precipitation change (%PANN) and (e) temperature anomaly (TANN) for Europe derived from WAPLS (Herzschuh et al., 2023); (f) PANN and (g) TANN obtained through quantitative pollen-based reconstructions using MAT and WAPLS (Combourieu-Nebout et al., 2013); (h) pollen-based quantitative reconstruction of PANN from Padul derived using WAPLS (Camuera et al., 2022); (i) methane (CH4) atmospheric concentrations (Loulergue et al., 2008) and (j) CO2 atmospheric concentrations from Antarctic EPICA Dome C ice cores (Nehrbass-Ahles et al., 2020); (k) NGRIP ice δ18O (North Greenland Ice Core Project Members, 2004); (l) average SST anomaly from the Mediterranean stack (Marriner et al., 2022); (m) summer insolation (Laskar et al., 2004); (n) precession index and (o) obliquity curve (Berger and Loutre, 1991). The orange band indicates the period encompassing the climatic optimum, and the blue bands highlight major millennial-scale climatic events.
Between 17 and 15 ka BP, a drastic fall in temperature and precipitation is observed (Fig. 5). This change is consistent with Heinrich Event 1 observed in several other marine and terrestrial records in the Mediterranean (Pons and Reille, 1988; Watts et al., 1996; Combourieu-Nebout et al., 1998, 2002; Allen et al., 2002; Peñalba et al., 1997; Turon et al., 2003; Naughton et al., 2007; Fletcher and Sánchez Goñi, 2008; Bordon et al., 2009) and has been interpreted as increased dryness over the Alboran Sea (Combourieu-Nebout et al., 2009). Our climatic reconstructions suggest minimum temperatures with Twin values of –5–0 °C across all methods and annual and seasonal precipitation values similar to the late Pleniglacial with a minimum of ∼300 mm shown by the MAT method. This event has a counterpart in marine records for alkenone-derived SSTs from ODP Site 976 (Martrat et al., 2014) and other proxies from other Mediterranean sites (Kallel et al., 1997; Rohling et al., 1998; Cacho et al., 2001; Combourieu-Nebout et al., 2002; Perez Folgado et al., 2003; Camuera et al., 2021). Recent studies from the new Padul record found a similar pattern in their PANN and TANN reconstructions (Camuera et al., 2022; Rodrigo-Gámiz et al., 2022), suggesting comparable conditions over the western Mediterranean during this period. This has also been corroborated by Ludwig et al., (2018) through model simulations of PANN and TANN over the Iberian Peninsula, which indicated a drastic decline in both parameters during HE-1.
Late glacial, beginning of MIS 1
A rise in temperature and precipitation is observed between 14.7 and 12.5 ka BP, shown consistently by the three reconstruction methods (Fig. 5 and Table 5). Although this is not reflected as strongly by the precipitation parameters, temperature reconstructions, particularly with BRT and WAPLS, show two distinctive periods of increased warmth centred around 14 and 13 ka BP, respectively attributed to the Bølling and Allerød (B-A) warm interstadials (Zonneveld, 1996; Combourieu-Nebout et al., 2009; Dormoy et al., 2009; Camuera et al. 2019, 2021; Rodrigo-Gámiz et al., 2022). During these periods, Twin values range 0–6 °C and TANN has values of 12–14 °C (Figs. 5 and S5). Precipitation reconstructions suggest similar seasonality to the present day in the Mediterranean, with wet winters and dry summers as evidenced by the increase in Pwin but relatively consistent Psum values (Fig. S5). In comparison with the values reconstructed for the Holocene, temperatures during the B-A remain slightly subdued (Fig. 5).
Table 5Summary of results of the pollen-based climatic reconstructions for MIS 2–1.
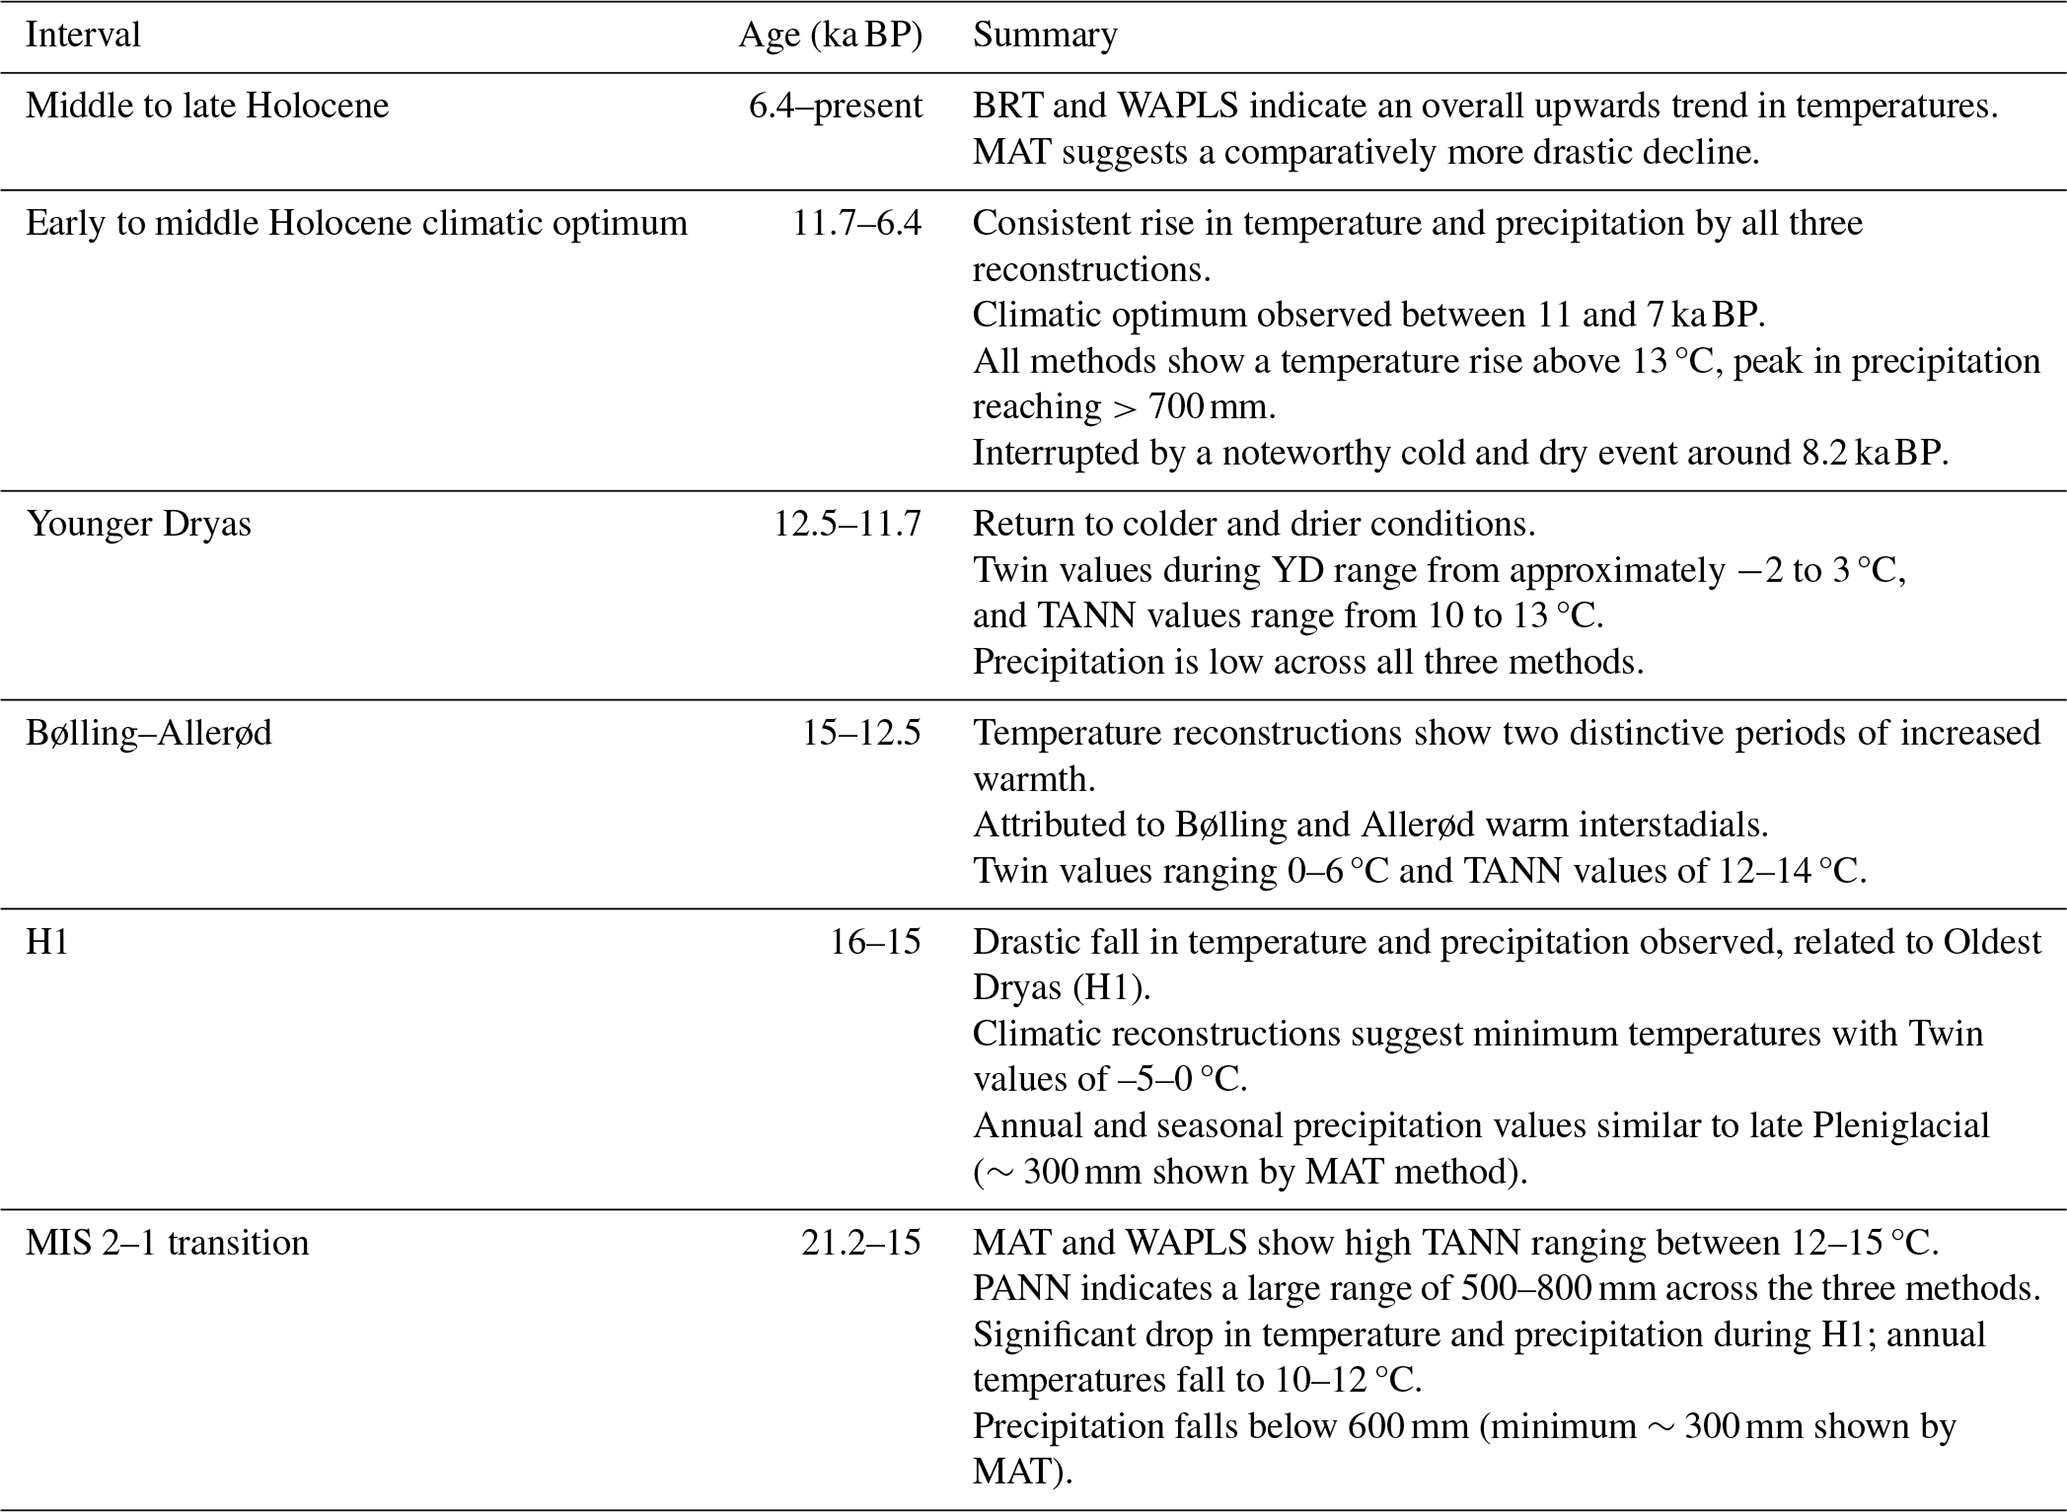
Between 12.5 and 11.7 ka BP, all three methods indicate a return to colder and drier conditions compared to the B-A interstadial, related to the Younger Dryas event (YD or H). Twin values during the YD range from approximately –2 to 3 °C, and TANN values range from 10 to 13 °C. Precipitation is also low across all three methods, especially in PANN and Pwin, which decline from 700 and 300 m during the B-A to 500 and 250 mm, respectively, during the YD. These results are similar to those reconstructed by Combourieu-Nebout et al. (2009) but are slightly higher than the values reconstructed by Dormoy et al. (2009). A comparably colder and more arid climate compared to the B-A in this region was also observed by Camuera et al. (2021, 2022) and by Rodrigo-Gámiz et al. (2022), although their values were slightly higher for both parameters, perhaps indicating a slight difference on land within the Iberian Peninsula compared to the conditions in the Alboran Sea at this time.
Overall, however, our results show similar timings, trends, and amplitudes to what has so far been observed in regional records from the Mediterranean and Iberian Margin, as well as global proxies such as CH4 records from Antarctica (Jouzel et al., 2007; Nehrbass-Ahles et al., 2020).
Holocene
The transition from the YD to the Holocene at 11.7 ka BP is marked by an increase in temperature and precipitation parameters across all three methods (Fig. 5). TANN reaches similar levels to the present day, and PANN reaches values above 600 mm. Seasonal temperature parameters Twin and Tsum show consistently high values with warmer summers and slightly cooler winters. There is a large difference between Psum and Pwin, indicating seasonal variation in wetness which may be related to the onset of present-day altitudinal vegetation belts and Mediterranean climate (Combourieu-Nebout et al., 2009). This amelioration is coeval with the increase in SST values from ODP976, which show warming in marine environments as well as on land at the beginning of the Holocene (Combourieu-Nebout et al., 2002, 2009). This is also shown by alkenone and foraminiferal-based SST records in the nearby core MD 95-2042 (Cacho et al., 2001; Perez-Folgado et al., 2004) and the δ13C and δ18O depletion in the MD 90-917 core in the Adriatic Sea (Siani et al., 2013).
Maximum temperatures and precipitation in our reconstructions mark the optimum climatic conditions of the Holocene between 9 and 7 ka BP, consistent with other studies in the Mediterranean (Bar-Matthews et al., 1998; Rossignol-Strick, 1999; Kotthoff et al., 2008; Ramos-Román et al. 2018, Marriner et al., 2022), as well as in central Europe (Magny et al., 2002; Martin et al., 2020; Cartapanis et al., 2022; d'Oliveira et al., 2023). As shown by our Pwin and Psum values, seasonality is strong during this period – winter precipitation increases significantly (300 to 400 mm), while summer precipitation reaches a minimum (around 50 mm), suggesting strong seasonal contrasts. In the early Holocene, Twin values range from approximately –0.85 to 5.81 °C, while Tsum values range from 19.15 to 23.59 °C. These findings match the reconstructions by Dormoy et al. (2009) and Jalut et al. (2009), who suggested that in the western and central Mediterranean, the climatic optimum of the Holocene was characterized by hot and dry summers and wet and cool winters. This has also been corroborated by more recent climatic reconstructions for Padul (Ramos-Román et al., 2018; Rodrigo-Gámiz et al., 2022). This contrasts with results from northern and eastern Europe (Herzschuh et al., 2023), where high year-round moisture and wet summers prevailed (Rossignol-Strick, 1999; Bar-Matthews et al., 1998), consistent with the east–west precipitation gradient observed during the climatic optima of Holocene analogues.
The optimum is interrupted by a short-lived cooling event around 8.4–8.2 ka BP, observed in many other global records (von Grafenstein et al., 1999; Mayewski et al., 2004; Alley and Agustsdottir, 2005; Pross et al., 2009; Marriner et al., 2022). The reduction in our reconstructed parameters during the 8.2 ka event, particularly the reduction in precipitation although not as much in temperature, can be explained by a reduction in North Atlantic Deep Water (NADW) formation due to increased meltwater from the Laurentide lakes into the North Atlantic (Barber et al., 1999; Ellison et al., 2006).
The reconstructions for PANN indicate a generally decreasing trend for the last 7 kyr with good consensus between methods (Fig. 6 and Table 6). Meanwhile, TANN shows different amplitudes of change; while BRT and WAPLS indicate an overall upwards trend in temperatures between 6–2 ka BP, MAT suggests a comparatively more drastic decline. Short-term fluctuations previously identified by Combourieu-Nebout et al. (2009) and Dormoy et al. (2009) are also observed in our record around 6–5, 4.3, and 3.7 ka BP, which roughly correlate with Bond events in the North Atlantic (Bond et al., 1997, 2001).
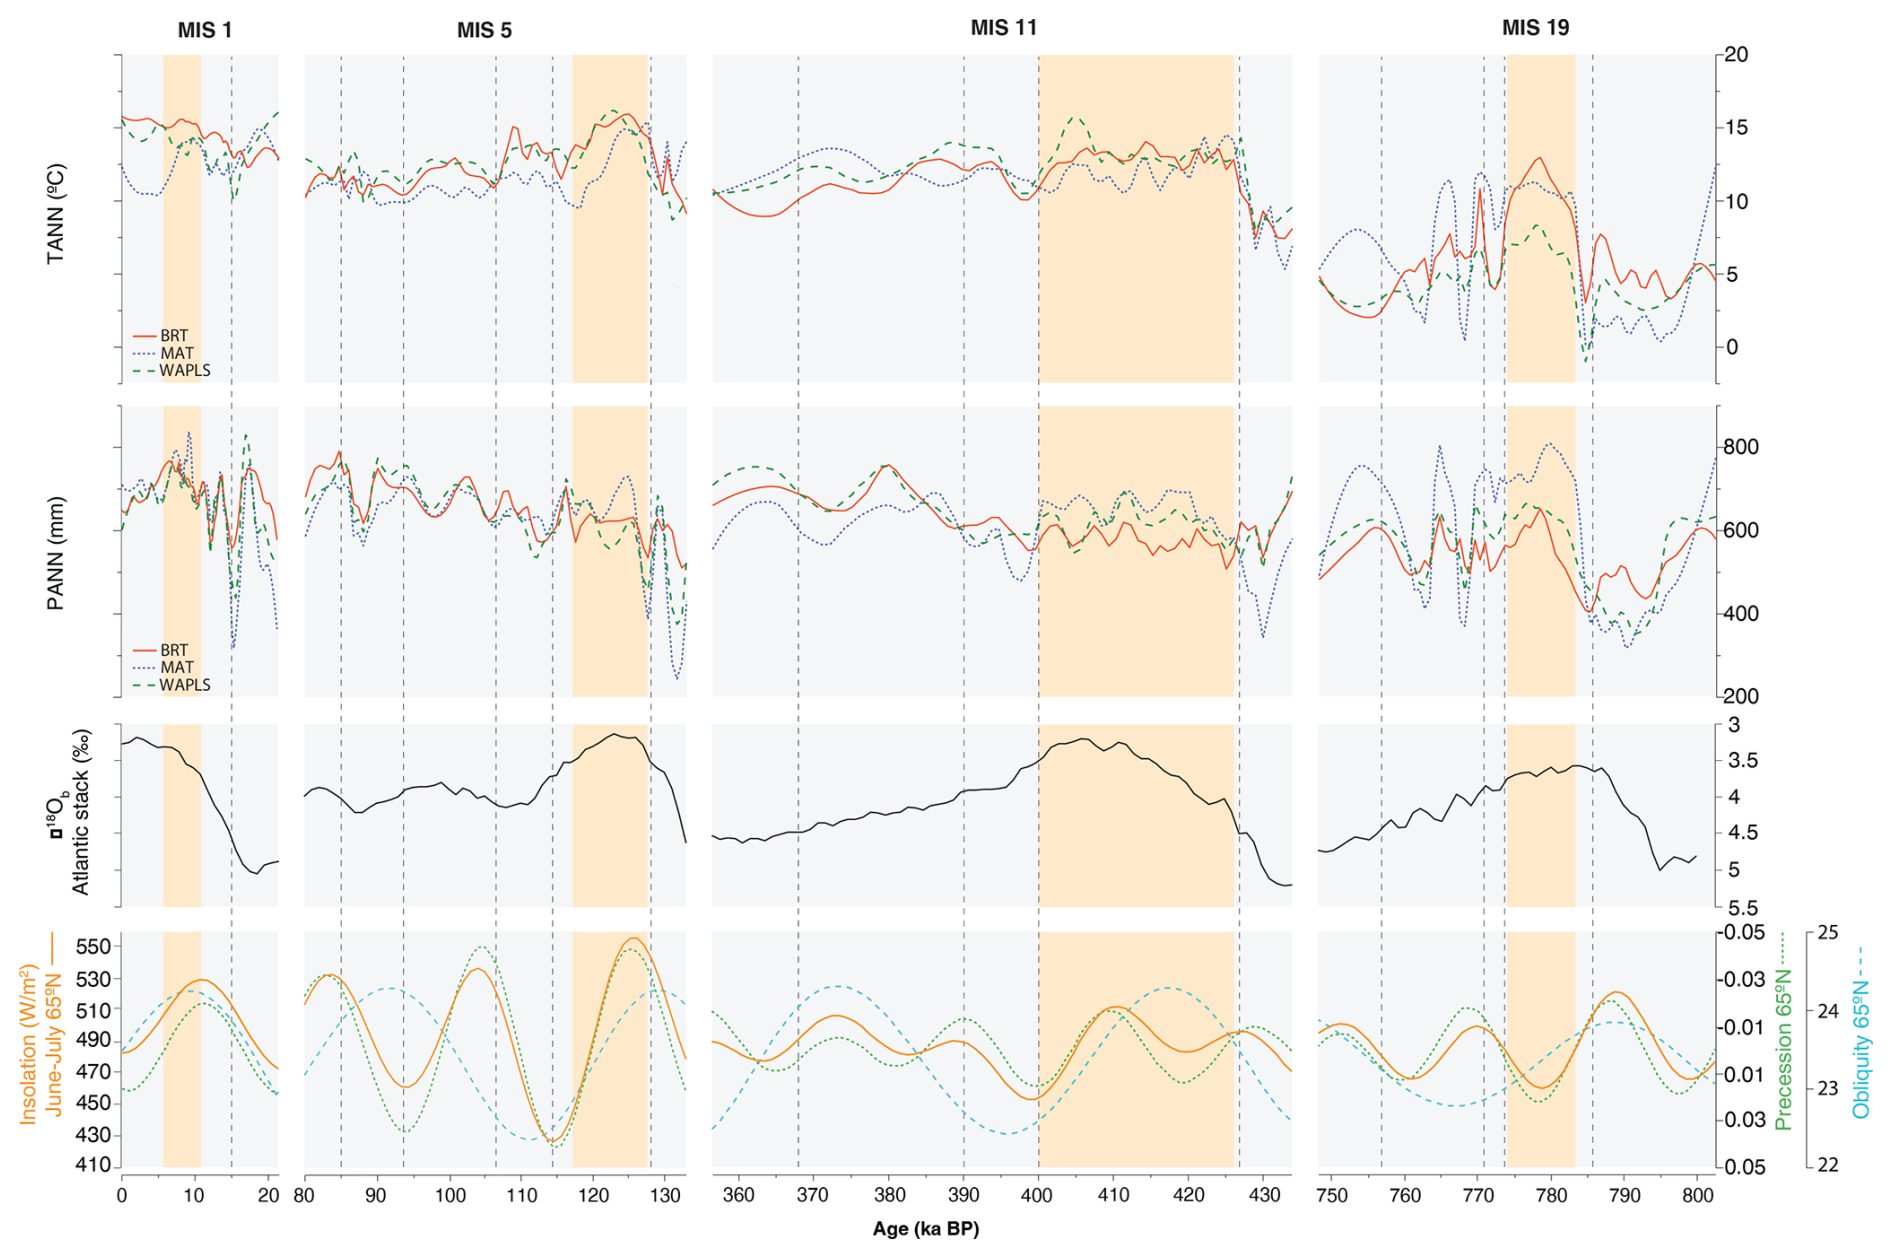
Figure 6Comparison of the quantitative pollen-based reconstructions (TANN and PANN) from ODP976 for MIS 19, 11, 5 and 1 with the Atlantic δ18O stack by Voelker et al. (2010) and solar orbital patterns: summer insolation (Laskar et al., 2004), precession index, and obliquity curve (Berger and Loutre, 1991). Orange bars indicate the period encompassing the climatic optimum in each interglacial.
Variability between the results obtained through the different transfer function methods could be attributed to a lack of top samples in our record, which may limit constraints for this period. Differences between our reconstructed records and other late Holocene pollen-based reconstructions may also reflect site-specific factors. As noted by Combourieu-Nebout et al. (2009) and Sassoon et al. (2023), the southwestern Mediterranean often shows a less pronounced response to terrestrial drying compared to other Mediterranean regions more influenced by continental conditions. Therefore, our pollen assemblages are likely to reflect relatively stable local conditions, contributing to the apparent differences in late Holocene trends between our site and others.
Still, the climatic reconstructions from 7 ka onwards must be interpreted cautiously due to the increasing anthropogenic impact during this period and particularly during the last 2 kyr. The decline in temperature and precipitation parameters, rather than being a result of progressive cooling, might in fact be an artificial result of an increase in semi-desert taxa such as Artemisia and a reduction in temperate and Mediterranean forest cover (Fig. S1) related to anthropogenic impact in the form of clearing (Combourieu-Nebout et al., 2009). However, although there is an overall warming trend in the last few millennia that could be affected by human activity, the lack of strong pollen signals from anthropogenic taxa (e.g. Cerealia type, Rumex, Plantago lanceolata, Brassicaceae) suggests that climatic reconstructions are minimally influenced by human impact. Several other reconstructions for this period in this region (Camuera et al., 2022; Rodrigo-Gámiz et al., 2022; Liu et al., 2023) and in the western Mediterranean (Di Rita et al., 2022) suggest similar findings. Liu et al. (2023) proposed that the consistency of climate reconstructions during this period signifies that the changes observed are a reflection of regional climate rather than human activity in the form of agriculture or landscape modification and should therefore be considered as such. On the other hand, during the past 2 kyr all methods indicate a substantial rise in temperatures and further decline in precipitation, most likely reflecting at this point the increasing human influence on overall vegetation composition, especially during the post-industrial era (Ruddiman et al., 2016).
4.3 Interglacial analogues of the Holocene in the southwestern Mediterranean
The climate reconstructions show changes in temperature and precipitation in the Alboran Sea during MIS 19, 11, and 5 and the Holocene (Fig. 6), which correlate with climatic changes observed in other regional and global proxies, indicating that overall the reconstructed parameters are reasonable and reliable. Our reconstructions enable a valuable comparison of the structure and amplitude of millennial-scale climate variation during these periods in the southwestern Mediterranean.
Before delving into a discussion about how MIS 19, 11, and 5 compare climatically and their suitability as interglacial analogues of the Holocene, the implications of anthropogenic impact over the past 7 kyr must be considered. The extent to which humans have altered the current interglacial and therefore what is considered “natural” climate change has been the subject of substantial debate over the past couple of decades (Ruddiman, 2003, 2007; Ruddiman et al., 2016). This is particularly with regard to the origin of the CO2 increase by 20 ppmv, as well as the rise in CH4, during the late Holocene (Yin and Berger, 2015), believed to be a result of the clearing of forests and agriculture over the past 7 kyr BP. Ruddiman (2003, 2007) hypothesized, under what is known as the early anthropogenic hypothesis, that the rise in GHGs between 7 ka BP and the industrial era is not caused by natural sources but rather by human intervention in the form of forest clearance, livestock domestication, and flooding of rice paddies (Ruddiman, 2003, 2007; Broecker and Stocker, 2006). The increase in GHGs resulting from pre-industrial farming was enough to cause anomalous warming and prolonged the duration of the interglacial, whereas based on solar precession the Holocene would be expected to be nearing the end of its natural course (Yin and Berger, 2015). This hypothesis has significant implications for the reliability of comparisons between MIS 1 and the interglacial analogues and leads to different conclusions about the natural trajectory of the Holocene (Tzedakis, 2010). Yin and Berger (2015) highlight that, regardless of the validity of the hypothesis, the 20 ppmv rise in CO2 levels during the late Holocene is modest compared to the dramatic 120 ppmv increase recorded in the 20th and 21st centuries. This smaller, gradual increase in greenhouse gases during the late Holocene suggests it was “natural enough” to serve as a baseline for comparison with earlier interglacial periods.
As shown in Fig. 6, the MAT method suggests a noticeable warming trend beginning around 2000 years ago, while both the BRT and WAPLS methods indicate a slower, more gradual warming over the last 4000 years. This gradual warming trend aligns with the slow rise in greenhouse gases documented in CH4 and CO2 records from EPICA, which show that the highest levels of these gases have only been reached in recent centuries with the onset of the industrial era (Jouzel et al., 2007; Pol et al., 2010; Nehrbass-Ahles et al., 2020). Although the human influence on climate is now well-established, the relatively minor contributions of pre-industrial human activities to GHG levels suggest that the late Holocene remains a suitable reference point for comparing Holocene and Pleistocene interglacials.
The reconstructions for MIS 19 (Fig. 6) display the highest degree of variability throughout the interglacial, with high-amplitude fluctuations across all three methods between warm and colder substages. Generally, the models show a colder climate than the other interglacials (Fig. 6). This matches the findings of other authors, and it has been widely recognized that MIS 19 is colder than the interglacials after Termination V (Jouzel et al., 2007; Candy et al., 2014, 2024). When comparing the EPICA records of MIS 19 to those of the other interglacials, the former shows lower concentrations of GHGs (Pol et al., 2010; Nehrbass-Ahles et al., 2020), supporting our findings of lower temperatures during this period. A colder climate than present during the climatic optimum of MIS 19c has been observed by Jouzel et al. (2007), who stated that this period was characterized by less pronounced warmth than interglacials MIS 5e, 7e, 9c, and 11c. Moreover, a main distinction between MIS 19 and the Holocene is that following the peak of MIS 19, temperatures decline relatively quickly, while during the Holocene there is a short-lived decline in temperature, followed by a renewed increase and stabilization during the late Holocene (Candy et al., 2014). In general, while the solar forcing of MIS 19 might be more similar to MIS 1, the climatic structure of MIS 19 has little resemblance to MIS 1 when considering the duration of the sustained warmth during the pre-industrial Holocene, at least in the region around the Alboran Sea.
MIS 11 differs from MIS 19 in the magnitude of temperature variations. It is also much longer than both MIS 19 and MIS 5, and indeed the Holocene, due to its unique anti-phasing between insolation and obliquity (Ruddiman, 2007; Tzedakis, 2010; Nomade et al. 2019; Tzedakis et al., 2022). While MIS 11 exhibits warmer temperatures compared to MIS 19, it still shows some degree of variability as observed with its high- and moderate-intensity climatic variability events and climatic fluctuations during the optimum. Overall, however, it is significantly more stable than MIS 19. According to Candy et al. (2014), if the early anthropogenic hypothesis is not accepted, MIS 11c is a closer climatic analogue, which means that the current interglacial may last for over 50 kyr (Loutre and Berger, 2003; McManus et al., 2003; Candy et al., 2014). If instead this hypothesis is accepted then MIS 19 and MIS 1 become more similar, meaning that the current interglacial would be close to its end if it were not for anthropogenic forcing (Candy et al., 2014; Tzedakis, 2010). The key particularity of accepting MIS 11 as an analogue is that it is the only interglacial with a combination of elevated GHG concentrations and an extended duration. Considering that human activity is affecting the length of the Holocene (Tzedakis et al., 2012; IPCC 2022), this makes MIS 11c an important analogue for how the Earth's climatic system functions under extended interglacial conditions (Candy et al., 2014, 2024).
Similarly to MIS 11, MIS 5 is characterized by elevated greenhouse gas levels and high sea levels, although this interglacial has been criticized as an analogue by previous authors due to its high-amplitude fluctuations in solar forcing. The reconstructions for MIS 5, particularly for MIS 5e (the Eemian), suggest a significantly warmer climate regime compared with the other interglacial analogues. In terms of duration, MIS 5e is slightly shorter than MIS 19, but similarly to MIS 11 it exhibits more stable climatic conditions as also corroborated by the lower variation in SSTs in records from the western Mediterranean (Martrat et al., 2004). A warmer climate than other interglacial analogues and the Holocene (specifically, warmer than pre-industrial levels) has been previously observed for the Eemian, for example in Padul (Camuera et al., 2019), La Grande Pile (Guiot et al. 1989; Brewer et al., 2008), and the North Atlantic (Zhuravleva, 2018). On global average, MIS 5e has been found to be the warmest interglacial of the past 800 kyr (Tzedakis et al., 2022). When considering the factors together, i.e. significantly higher temperatures, short duration, and high-amplitude fluctuations in solar forcing, in the case of our reconstructions MIS 5 appears to be the least suitable analogue when compared with MIS 19 and 11.
Our high-resolution climatic reconstructions have demonstrated that in terms of magnitude of warmth, structure, stability, and duration the interglacial analogues of the Holocene are, fundamentally, unique. Although they all are reoccurring events and share similar patterns such as the abrupt shifts from glacial to interglacial, the occurrence of climatic optimums soon after the transition, and cold events and Younger Dryas-like events, the associated climate feedbacks in each interglacial produce very different climatic histories that are difficult to compare with the Holocene. As Candy et al. (2014) point out, there is no reason to expect that the climate of MIS 1 should naturally follow the pattern of MIS 11 or 19 or indeed MIS 5, despite the close similarities in insolation forcing, greenhouse gas concentration, and temperatures. The study of past interglacials does not offer a direct blueprint for predicting the future evolution of the Holocene. However, these interglacial analogues are valuable for exploring the responses of the Earth's processes under different forcing factors which closely resemble the climate system during the Holocene. What emerges from the climatic reconstructions from ODP Site 976 and the close comparisons with global and regional records is that this site is extremely sensitive to global changes, which in turn can be used to infer that the southwestern Mediterranean will be highly susceptible to future climate change and anthropogenic forcing.
This study has provided insights into the climatic variations during MIS 19, 11, 5 and 1 within the southwestern Mediterranean region. Through pollen-based climatic reconstructions, we have established correlations between temperature and precipitation changes in our study area with those observed in other regional and global proxies, confirming the reliability of our findings. These reconstructions facilitate a comprehensive comparison of millennial-scale climate variations during these interglacials, shedding light on their unique climatic structures and amplitudes.
The reconstructions highlight a temperature increase from MIS 19 to the Holocene and distinct climatic characteristics of each interglacial period. MIS 19 exhibits high variability and colder temperatures compared to subsequent interglacials and the Holocene. Conversely, MIS 11 displays warmer temperatures and greater stability, offering an insight into interglacials of prolonged duration, crucial when considering that the anthropogenically driven warming of the post-industrial era might be artificially prolonging the current interglacial. Reconstructions for MIS 5 suggested overall warmer conditions, especially during the Eemian, but this higher temperature coupled with high-amplitude fluctuations in solar forcing makes it a less suitable Holocene analogue.
While past interglacials do not provide a straightforward blueprint for predicting the future evolution of MIS 1, they offer invaluable insights into Earth's responses to different forcing factors during periods with similar climatic conditions to the Holocene. The pollen-based climatic reconstructions for MIS 19, 11, and 5 serve as crucial benchmarks for understanding the sensitivity of the southwestern Mediterranean to global changes and underscore the importance of mitigating climate change in this region.
The pollen-based climatic reconstructions were conducted using established methods implemented in publicly available R packages. Specifically, the weighted-average partial least-squares (WAPLS) and modern analogue technique (MAT) methods were applied using the R package rioja (Juggins and Juggins, 2020, https://cran.r-project.org/package=rioja), while the boosted regression tree (BRT) method was applied using the R package dismo (Hijmans et al., 2021, https://cran.r-project.org/package=dismo). The underlying R code is not publicly available, as it relies on a modern pollen dataset that includes numerous unpublished pollen samples.
Data produced for this article can be found online at https://data.mendeley.com/datasets/m4kzgwk6b9/2 (Sassoon et al., 2025). Pollen data for MIS 19 are publicly available at https://doi.org/10.1594/PANGAEA.923093 (Toti et al., 2020b). Pollen data for MIS 11 are publicly available in Sassoon et al. (2023). Pollen data for the whole last cycle (MIS 5–MIS 1) are not available at this time as they are part of a PhD thesis which proposes additional analyses, especially for MIS 5; all pollen data for this period will be submitted to the PANGAEA repository during the ongoing year.
The supplement related to this article is available online at https://doi.org/10.5194/cp-21-489-2025-supplement.
This study was conceived by DS. Data collection and interpretation were conducted by DS, together with NCN, OP, and VL. AB and FT produced the pollen data used for the reconstructions of MIS 19, DS produced the pollen data used for the reconstructions of MIS 11, and NCN produced the pollen data used the for the reconstructions of MIS 5 and MIS 1. DS wrote the paper and created the visualizations, supported by NCN, OP, and VL. OP helped produce the climate reconstruction outputs. MHM supervised the work and provided funding for the study. All authors contributed to the discussion of the results and the conclusion of this study.
At least one of the (co-)authors is a member of the editorial board of Climate of the Past. The peer-review process was guided by an independent editor, and the authors also have no other competing interests to declare.
Publisher's note: Copernicus Publications remains neutral with regard to jurisdictional claims made in the text, published maps, institutional affiliations, or any other geographical representation in this paper. While Copernicus Publications makes every effort to include appropriate place names, the final responsibility lies with the authors.
We sincerely appreciate the financial support from the ANR (Agence Nationale de la Recherche) project Neandroots, the Muséum national d'Histoire naturelle (MNHN), and the Centre National de la Recherche Scientifique (CNRS). Thanks to the ISEM, the Institut des Sciences de l'Évolution de Montpellier, UMR CNRS 5554 ISEM (Université de Montpellier), for hosting Dael Sassoon on multiple occasions for training on transfer functions. Special thanks to Léa d'Oliveira for the assistance with the transfer function models and for her help troubleshooting the scripts. This is ISEM contribution number 2024-285.
This research has been supported by the Agence Nationale de la Recherche (grant no. ANR-19-CE27-0011-01).
This paper was edited by Shiling Yang and reviewed by two anonymous referees.
Allen, J. R. M.,Watts, W. A., McGee, E., and Huntley, B.: Holocene environmental variability – the record from Lago Grande di Monticchio, Italy, Quatern. Int., 88, 69–80, 2002.
Allen, J. R. M., Huntley, B., Brandt, U., Brauer, A., Hubberten, H., Keller, J., Kraml, M., Mackensen, A., Mingram, J., Negendank, J. F. W., Nowaczyk, N. R., Oberhansli, H., Watts, W. A., Wulf, S., and Zolitschka, B.: Rapid environmental changes in southern Europe during the last glacial period, Nature, 400, 740e743, https://doi.org/10.1038/23432, 1999.
Alley, R. B. and Agustsdottir, A. M.: The 8k event: cause and consequences of a major Holocene abrupt climate change, Quaternary Sci. Rev., 24, 1123–1149, 2005.
Alonso, B., Ercilla, G., Martínez-Ruiz, F., Baraza, J., and Galimont, A.: Pliocene-Pleistocene sedimentary facies at Site 976: Depositional history in the northwestern Alboran Sea, Proc. Integr. Ocean Drill Program, 161, 57–68, 1999.
Ardenghi, N., Mulch, A., Koutsodendris, A., Pross, J., Kahmen, A., and Niedermeyer, E. M.: Temperature and moisture variability in the eastern Mediterranean region during Marine Isotope Stages 11–10 based on biomarker analysis of the Tenaghi Philippon peat deposit, Quaternary Sci. Rev., 225, 105977, https://doi.org/10.1016/j.quascirev.2019.105977, 2019.
Azibeiro, L. A., Sierro, F. J., Capotondi, L., Lirer, F., Andersen, N., González-Lanchas, A., Alonso-Garcia, M., Flores, J. A., Cortina, A., Grimalt, J. O., Martrat, B., and Cacho, I.: Meltwater flux from northern ice-sheets to the Mediterranean during MIS 12, Quaternary Sci. Rev., 268, 107108, https://doi.org/10.1016/j.quascirev.2021.107108, 2021.
Bar-Matthews, M., Ayalon, A., and Kaufman, A.: Middle to late Holocene (6500 yr period) paleoclimate in the Eastern Mediterranean region from stable isotopic composition of speleothems from Soreq Cave, Israel, in: Environment and society in times of climate change, edited by: Issar, A. and Brown, N., Kluwer Academic, Dordrecht, 203–214, https://doi.org/10.1007/978-94-017-3659-6_9, 1998.
Barber, D. C., Dyke, A., Hillaire-Marcel, C., Jennings, A. E., Andrews, J. T., Kerwin, M. W., Bilodeau, G., McNeely, R., Southon, J., Morehead, M. D., and Gagnon, J. M.: Forcing of the cold event of 8200 years ago by catastrophic drainage of Laurentide lakes, Nature, 400, 344–348, 1999.
Barbero, M., Quézel, P., and Rivas-Martínez, S.: Contribution á l'étude des groupements forestiers et préforestiers du Maroc, Phytocoenologia, 9, 311–412, 1981.
Bard, E.: Geochemical and geophysical implications of the radiocarbon calibration, Geochim. Cosmochim. Ac., 62, 2025–2038, 1998.
Bauch, H. A., Erlenkeuser, H., Helmke, J. P., and Struck, U.: A paleoclimatic evaluation of marine oxygen isotope stage 11 in the high-northern Atlantic (Nordic seas), Global Planet. Change, 24, 27–39, https://doi.org/10.1016/S0921-8181(99)00067-3, 2000.
Benabid, A.: Bref aperçu sur la zonation altitudinale de la végétation climatique du Maroc, Ecol. Medit., 8, 301–315, 1982.
Berger, A. and Loutre, M. F. Insolation values for the climate of the last 10 million years, Quaternary Sci. Rev., 10, 297–317, https://doi.org/10.1016/0277-3791(91)90033-Q, 1991.
Berger, A. and Loutre, M. F.: An exceptionally Long Interglacial Ahead?, Science, 297, 1287–1288, https://doi.org/10.1126/science.1076120, 2002.
Berger, A. and Loutre, M.-F.: Climate 400,000 Years Ago, a Key to the Future?, in: Earth’s Climate and Orbital Eccentricity: The Marine Isotopic Stage 11 Question, Geophys. Monogr. Ser., vol. 137, edited by: Droxler, A. W., Poore, R. Z., and Burckle, L. H., AGU, Washington, D.C., 17–26, https://doi.org/10.1029/137GM02, 2003.
Bertini, A., Toti, F., Marino, M., and Ciaranfi, N.: Vegetation and climate across the early-middle Pleistocene transition at the Montalbano Jonico section (southern Italy), Quatern. Int., 383, 74–88, 2015.
Blain, H. A., Fagoaga, A., Ruiz-Sánchez, F. J., García-Medrano, P., Ollé, A., and Jiménez-Arenas, J. M.: Coping with arid environments: A critical threshold for human expansion in Europe at the Marine Isotope Stage 12/11 transition? The case of the Iberian Peninsula, J. Hum. Evol., 153, 102950, https://doi.org/10.1016/j.jhevol.2021.102950, 2021.
Bond, G., Kromer, B., Beer, J., Muscheler, R., Evans, M. N., Showers, W., Hoffmann, S., Lotti-Bond, R., Hajdas, I., and Bonani, G.: Persistent solar influence on North Atlantic climate during the Holocene, Science, 278, 1257–1266, 2001.
Bond, G., Showers, W., Cheseby, M., Lotti, R., Almasi, P., de Menocal, P., Priore, P., Cullen, H., Hajdas, I., and Bonani, G.: A pervasive millennial-scale cycle in the North Atlantic Holocene and glacial climates, Science, 294, 2130–2136, 1997.
Bordon, A., Peyron, O., Lézine, A.-M., Brewer, S., and Fouache, E.: Pollen-inferred Late-Glacial and Holocene climate in southern Balkans (Lake Maliq), Quatern. Int., 200, 19–30, 2009.
Brewer, S., Guiot, J., Sánchez-Goñi, M. F., and Klotz, S.: The climate in Europe during the Eemian: a multi-method approach using pollen data, Quaternary Sci. Rev., 27, 2303–2315, 2008.
Broecker, W. S. and Stocker, T. L.: The Holocene CO2 rise. Anthropogenic or natural Eos, T. Am. Geophys. Un., 87, 27, https://doi.org/10.1029/2006EO030002, 2006.
Bulian, F., Kouwenhoven, T. J., Jiménez-Espejo, F. J., Krijgsman, W., Andersen, N., and Sierro, F. J.: Impact of the Mediterranean-Atlantic connectivity and the late Miocene carbon shift on deep-sea communities in the Western Alboran Basin, Palaeogeogr. Palaeoecol., 589, 110841, https://doi.org/10.1016/j.palaeo.2022.110841, 2022.
Cacho, I., Grimalt, J. O., Sierro, F. J., Shackleton, N., and Canals, M.: Evidence for enhanced Mediterranean thermohaline circulation during rapid climatic coolings, Earth Planet. Sc. Lett., 183, 417–429, 2000.
Cacho, I., Grimalt, J. O., Canals, M., Sbaffi, L., Shackleton, N., Schönfeld, J., and Zahn, R.: Variability of the western Mediterranean Sea surface temperature during the last 25 000 years and its connection with the northern hemisphere climatic changes, Paleoceanography, 16, 40–52, 2001.
Camuera, J., Jiménez-Moreno, G., Ramos-Román, M. J., García-Alix, A., Toney, J. L., Anderson, R. S., Jiménez-Espejo, F., Kaufman, D., Bright, J., Webster, C., and Yanes, Y.: Orbital-scale environmental and climatic changes recorded in a new ∼ 200 000 year-long multiproxy sedimentary record from Padul, southern Iberian Peninsula, Quaternary Sci. Rev., 198, 91–114, 2018.
Camuera, J., Jiménez-Moreno, G., Ramos-Román, M. J., García-Alix, A., Toney, J. L., Anderson, R. S., Jiménez-Espejo, F., Bright, J., Webster, C., Yanes, Y., and Carrión, J. S.: Vegetation and climate changes during the last two glacial–interglacial cycles in the western Mediterranean: a new long pollen record from Padul (southern Iberian Peninsula), Quaternary Sci. Rev., 205, 86–105, 2019.
Camuera, J., Jiménez-Moreno, G., Ramos-Román, M. J., García-Alix, A., Jiménez-Espejo, F. J., Toney, J. L., and Anderson, R. S.: Chronological control and centennial-scale climatic subdivisions of the Last Glacial Termination in the western Mediterranean region, Quaternary Sci. Rev., 255, 106814, https://doi.org/10.1016/j.quascirev.2021.106814, 2021.
Camuera, J., Ramos-Román, M. J., Jiménez-Moreno, G., García-Alix, A., Ilvonen, L., Ruha, L., Gil-Romera, G., González-Sampériz, P., and Seppä, H.: Past 200 kyr hydroclimate variability in the western Mediterranean and its connection to the African Humid Periods, Sci. Rep., 12, 9050, https://doi.org/10.1038/s41598-022-12047-1, 2022.
Candy, I., Schreve, D. C., Sherriff, J., and Tye, G. J.: Marine Isotope Stage 11: Palaeoclimates, palaeoenvironments and its role as an analogue for the current interglacial, Earth-Sci. Rev., 128, 18–51, https://doi.org/10.1016/j.earscirev.2013.09.006, 2014.
Candy, I., Oliveira, D., Parkes, D., Sherriff, J., and Thornalley, D.: Marine Isotope Stage 11c in Europe: Recent advances in marine–terrestrial correlations and their implications for interglacial stratigraphy – a review, Boreas, 53, 455–475, https://doi.org/10.1111/bor.12656, 2024.
Cartapanis, O., Jonkers, L., Moffa-Sanchez, P., Jaccard, S. L., and de Vernal, A.: Complex spatio-temporal structure of the Holocene Thermal Maximum, Nat. Commun., 13, 5662, https://doi.org/10.1038/s41467-022-33362-1, 2022.
Cheddadi, R., Lamb, H. F., Guiot, J., and van der Kaars, S.: Holocene climatic change in Morocco: a quantitative reconstruction from pollen data, Clim. Dynam., 14, 883–890, 1998.
Chevalier, M., Davis, B. A. S., Heiri, O., Seppä, H., Chase B. M., Gajewski, K., Lacourse, T., Telford, R. J., Finsinger, W., Guiot, J., Kühl N., Maezumi, S. Y., Tipton, J. R., Carter, V. A., Brussel, T., Phelps, L. N., Dawson, A., Zanon, M., Vallé, F., Nolan, C., Mauri, A., de Vernal, A., Izumi, K., Holmström, L., Marsicek, J., Goring, S., Sommer P. S., Chaput, M., and Kupriyanov, D.: Pollen-based climate reconstruction techniques for late Quaternary studies, Earth-Sci. Rev., 210, 103384, https://doi.org/10.1016/j.earscirev.2020.103384, 2020.
Combourieu-Nebout, N., Paterne, M., Turon, J. L., and Siani, G.: A high-resolution record of the last deglaciation in the Central Mediterranean Sea: Palaeovegetation and Palaeohydrological evolution, Quaternary Sci. Rev., 17, 303–317, 1998.
Combourieu-Nebout, N., Londeix, L., Baudin, F., Turon, J.-L., von Grafenstein, R., and Zahn, R.: Quaternary marine and continental paleoenvironments in the western Mediterranean (Site 976, Alboran Sea): palynological evidence, in: Proc. ODP Sci. Results, 161, edited by: Zahn, R., Comas, M. C., and Klaus, A., College Station, TX (Ocean Drilling Program), 457–468, https://doi.org/10.2973/odp.proc.sr.161.238.1999, 1999.
Combourieu-Nebout, N., Bertini, A., Russo-Ermolli, E., Peyron, O., Klotz, S., Montade, V., Fauquette, S., Allen, J., Fusco, F., Goring, S., Huntley, B., Joannin, S., Lebreton, V., Magri, D., Martinetto, E., Orain, R., and Sadori, L.: Climate changes in the central Mediterranean and Italian vegetation dynamics since the Pliocene, Rev. Palaeobot. Palyno., 218, 127–147, 2015.
Combourieu-Nebout, N., Turon, J. L., Zahn, R., Capotondi, L., Londeix, L., and Pahnke, K.: Enhanced aridity and atmospheric high-pressure stability over the western Mediterranean during the North Atlantic cold events of the past 50 ky, Geology, 30, 863–866, https://doi.org/10.1130/0091-7613(2002)030<0863:EAAAHP>2.0.CO;2, 2002.
Combourieu Nebout, N., Peyron, O., Dormoy, I., Desprat, S., Beaudouin, C., Kotthoff, U., and Marret, F.: Rapid climatic variability in the west Mediterranean during the last 25 000 years from high resolution pollen data, Clim. Past, 5, 503–521, https://doi.org/10.5194/cp-5-503-2009, 2009.
Combourieu-Nebout, N., Peyron, O., Bout-Roumazeilles, V., Goring, S., Dormoy, I., Joannin, S., Sadori, L., Siani, G., and Magny, M.: Holocene vegetation and climate changes in the central Mediterranean inferred from a high-resolution marine pollen record (Adriatic Sea), Clim. Past, 9, 2023–2042, https://doi.org/10.5194/cp-9-2023-2013, 2013.
Davis, B. A. S., Fasel, M., Kaplan, J. O., Russo, E., and Burke, A.: The climate and vegetation of Europe, northern Africa, and the Middle East during the Last Glacial Maximum (21 000 yr BP) based on pollen data, Clim. Past, 20, 1939–1988, https://doi.org/10.5194/cp-20-1939-2024, 2024.
Dansgaard, W., Johnsen, S. J., Clausen, H. B., Dahl-Jensen, D., Gundestrup, N. S., Hammer, C. U., Hvidberg, C. S., Steffensen, J. P., Sveinbjörnsdottir, A. E., Jouzel, J., and Bond, G.: Evidence for general instability of past climate from a 250 kyr ice-core record, Nature, 364, 218–220, 1993.
De'ath, G.: Boosted trees for ecological modeling and prediction, Ecology, 88, 243–251, https://doi.org/10.1890/0012-9658(2007)88[243:BTFEMA]2.0.CO;2, 2007.
De Kaenel, E., Siesser, W. G., and Murat, A.: Pleistocene calcareous nannofossil biostratigraphy and the western Mediterranean sapropels, sites 974 to 977 and 979, in: Proceedings of the Ocean Drilling Program, edited by: Zahn, R., Comas, M. C., and Klaus, A., Scientific Results 161, ODP, College Station, Texas, 159–183, https://doi.org/10.2973/odp.proc.sr.161.1999, 1999.
Desprat, S., Sánchez Goñi, M. F., Turon, J. L., McManus, J. F., Loutre, M. F., Duprat, J., Malaizé, B., Peyron, O., and Peypouquet, J. P.: Is vegetation responsible for glacial inception during periods of muted insolation changes?, Quaternary Sci. Rev., 24, 1361–1374, https://doi.org/10.1016/j.quascirev.2005.01.005, 2005.
Desprat, S., Sánchez Goñi, M. F., Naughton, F., Turon, J. L., Duprat, J., Malaizé, B., Cortijo, E., and Peypouquet, J. P.: Climate variability of the last five isotopic interglacials: Direct land–sea-ice correlation from the multiproxy analysis of North-Western Iberian margin deep-sea cores, Develop. Quatern. Sci., 7, 375–386, https://doi.org/10.1016/S1571-0866(07)80050-9, 2007.
Desprat, S., Combourieu-Nebout, N., Essallami, L., Sicre, M. A., Dormoy, I., Peyron, O., Siani, G., Bout Roumazeilles, V., and Turon, J. L.: Deglacial and Holocene vegetation and climatic changes in the southern Central Mediterranean from a direct land–sea correlation, Clim. Past, 9, 767–787, https://doi.org/10.5194/cp-9-767-2013, 2013.
Di Rita, F., Ghilardi, M., Fagel, N., Vacchi, M., Warichet, F., Delanghe, D., Sicurani, J., Martinet, L., and Robresco, S.: Natural and anthropogenic dynamics of the coastal environment in northwestern Corsica (western Mediterranean) over the past six millennia, Quaternary Sci. Rev., 278, 107372, https://doi.org/10.1016/j.quascirev.2022.107372, 2022.
Donders, T., Panagiotopoulos, K., Koutsodendris, A., Bertini, A., Mercuri, A. M., Masi, A., Combourieu-Nebout, N., Joannin, S., Kouli, K., Kousis, I., and Peyron, O.: 1.36 million years of Mediterranean forest refugium dynamics in response to glacial–interglacial cycle strength. P. Natl. Acad. Sci. USA, 118, e2026111118, https://doi.org/10.1073/pnas.2026111118, 2021.
d'Oliveira, L., Dugerdil, L., Ménot, G., Evin, A., Muller, S. D., Ansanay-Alex, S., Azuara, J., Bonnet, C., Bremond, L., Shah, M., and Peyron, O.: Reconstructing 15 000 years of southern France temperatures from coupled pollen and molecular (branched glycerol dialkyl glycerol tetraether) markers (Canroute, Massif Central), Clim. Past, 19, 2127–2156, https://doi.org/10.5194/cp-19-2127-2023, 2023.
Dormoy, I., Peyron, O., Combourieu Nebout, N., Goring, S., Kotthoff, U., Magny, M., and Pross, J.: Terrestrial climate variability and seasonality changes in the Mediterranean region between 15 000 and 4000 years BP deduced from marine pollen records, Clim. Past, 5, 615–632, https://doi.org/10.5194/cp-5-615-2009, 2009.
Dugerdil, L., Joannin, S., Peyron, O., Jouffroy-Bapicot, I., Vannière, B., Boldgiv, B., Unkelbach, J., Behling, H., and Ménot, G.: Climate reconstructions based on GDGT and pollen surface datasets from Mongolia and Baikal area: calibrations and applicability to extremely cold–dry environments over the Late Holocene, Clim. Past, 17, 1199–1226, https://doi.org/10.5194/cp-17-1199-2021, 2021.
Ellison, C. R., Chapman, M. R., and Hall, I. R.: Surface and deep ocean interactions during the cold climate event 8200 years ago, Science, 312, 1929–1932, 2006.
Elith, J., Leathwick, J. R., Hastie, T. A working guide to boosted regression trees, J. Anim. Ecol., 77, 802–813, 2008.
Fletcher, W. and Sánchez Goñi, M. F.: Orbital- and sub-orbital-scale climate impacts on vegetation of the western Mediterranean basin over the last 48 000 yr, Quaternary Res., 70, 451–464, 2008.
García-Alix, A., Camuera, J., Ramos-Román, M. J., Toney, J. L., Sachse, D., Schefuß, E., Jiménez-Moreno, G., Jiménez-Espejo, F. J., López-Avilés, A., Anderson, R. S., and Yanes, Y.: Paleohydrological dynamics in the Western Mediterranean during the last glacial cycle, Global Planet. Change, 202, 103527, https://doi.org/10.1016/j.gloplacha.2021.103527, 2021.
Giaccio, B., Regattieri, E., Zanchetta, G., Nomade, S., Renne, P. R., Sprain, C. J., Drysdale, R. N., Tzedakis, P. C., Messina, P., Scardia, G., and Sposato, A.: Duration and dynamics of the best orbital analogue to the present interglacial, Geology, 43, 603–606, 2015.
Giaccio, B., Leicher, N., Mannella, G., Monaco, L., Regattieri, E., Wagner, B., Zanchetta, G., Gaeta, M., Marra, F., Nomade, S., Palladino, D. M., Pereira, A., Scheidt, S., Sottili, G., Wonik, T., Wulf, S., Zeeden, C., Ariztegui, D., Cavinato, G. P., Dean, J. R., Florindo, F., Leng, M. J., Macrì, P., Niespolo, E., Renne, P. R., Rolf, C., Sadori, L., Thomas, C., and Tzedakis, P. C.: Extending the tephra and palaeoenvironmental record of the Central Mediterranean back to 430 ka: A new core from Fucino Basin, central Italy, Quaternary Sci. Rev., 225, 106003, https://doi.org/10.1016/j.quascirev.2019.106003, 2019.
Girone, A., Maiorano, P., Marino, M., and Kucera, M.: Calcareous plankton response to orbital and millennial-scale climate changes across the Middle Pleistocene in the western Mediterranean. Palaeogeogr. Palaeoecol., 392, 105–116, https://doi.org/10.1016/j.palaeo.2013.09.005, 2013.
Gonzalez-Donoso, J. M., Serrano, F., and Linares, D.: Sea surface temperature during the Quaternary at ODP Sites 976 and 975 (western Mediterranean), Palaeogeogr. Palaeoecol., 162, 17–44, 2000.
Grieser, J., Giommes, R., and Bernardi, M.: New LocClim – the Local Climate Estimator of FAO, Geophys. Res. Abstr., 8, 08305, SRef-ID: 1607-7962/gra/EGU06-A-08305, 2006.
Guiot, J.: Methodology of the last climatic reconstruction in France from pollen data, Palaeogeogr. Palaeoecol., 80, 49–69, 1990.
Guiot, J. and Cramer, W.: Climate Change: The 2015 Paris Agreement Thresholds and Mediterranean Basin Ecosystems, Science, 354, 465–468, 2016.
Guiot, J., Pons, A., de Beaulieu, J.-L., and Reille, M.: A 140 000 year continental climate reconstruction from two European pollen records, Nature, 338, 309–313, 1989.
Herzschuh, U., Böhmer, T., Chevalier, M., Hébert, R., Dallmeyer, A., Li, C., Cao, X., Peyron, O., Nazarova, L., Novenko, E. Y., Park, J., Rudaya, N. A., Schlütz, F., Shumilovskikh, L. S., Tarasov, P. E., Wang, Y., Wen, R., Xu, Q., and Zheng, Z.: Regional pollen-based Holocene temperature and precipitation patterns depart from the Northern Hemisphere mean trends, Clim. Past, 19, 1481–1506, https://doi.org/10.5194/cp-19-1481-2023, 2023.
Hes, G., Sánchez Goñi, M. F., and Bouttes, N.: Impact of terrestrial biosphere on the atmospheric CO2 concentration across Termination V, Clim. Past, 18, 1429–1451, https://doi.org/10.5194/cp-18-1429-2022, 2022.
Heusser, L. E. and Balsam, W. L.: Pollen distribution in the north-east Pacific Ocean, Quaternary Res., 7, 45–62, 1977.
Hodell, D. A., Channeil, J. E. T., Curtis, J. H., Romero, O. E., and Röhl, U.: Onset of “Hudson Strait” Heinrich events in the eastern North Atlantic at the end of the middle Pleistocene transition (∼640 ka)?, Paleoceanography, 23, 1–16, https://doi.org/10.1029/2008PA001591, 2008.
Hijmans, R. J., Phillips, S., Leathwick, J., and Elith, J.: dismo: species distribution modeling, R package version 1.3-5, https://CRAN.R-project.org/package=dismo (last access: 19 July 2022), 2021.
IPCC: Climate Change: Impacts, Adaptation and Vulnerability, https://www.ipcc.ch/report/ar6/wg2/ (last access: 12 October 2022), 2022.
Jalut, G., Dedoubat, J. J., Fontugne, M., and Otto, T.: Holocene circum-Mediterranean vegetation changes: Climate forcing and human impact, Quatern. Int., 200, 4–18, 2009.
Joannin, S., Brugiapaglia, E., de Beaulieu, J.-L., Bernardo, L., Magny, M., Peyron, O., Goring, S., and Vannière, B.: Pollen-based reconstruction of Holocene vegetation and climate in southern Italy: the case of Lago Trifoglietti, Clim. Past, 8, 1973–1996, https://doi.org/10.5194/cp-8-1973-2012, 2012.
Jouzel, J., Masson-Delmotte, V., Cattani, O., Dreyfus, G., Falourd, S., Hoffmann, G., Minster, B., Nouet, J., Barnola, J. M., Chappellaz, J., Fischer, H., Gallet, J. C., Johnsen, S., Leuenberger, M., Loulergue, L., Luethi, D., Oerter, H., Parrenin, F., Raisbeck, G., Raynaud, D., Schilt, A., Schwander, J., Selmo, E., Souchez, R., Spahni, R., Stauffer, B., Steffensen, J. P., Stenni, B., Stocker, T. F., Tison, J. L., Werner, M., and Wolff, E. W.: Orbital and millennial Antarctic climate variability over the past 800 000 years, Science, 317, 793–796, 2007.
Juggins, S. and Juggins, M. S.: Rioja: analysis of quaternary science data, R package version 1.0-7, https://cran.r-project.org/package=rioja (last access: 19 July 2022), 2020.
Kallel, N., Paterne, M., Labeyrie, L., Duplessy, J.-C., and Arnold, M.: Temperature and salinity records of the Tyrrhenian Sea during the last 18 000 years, Palaeogeogr. Palaeoecol., 135, 97–108, 1997.
Kandiano, E. S., Bauch, H. A., Fahl, K., Helmke, J. P., Röhl, U., Pérez-Folgado, M., and Cacho, I.: The meridional temperature gradient in the eastern North Atlantic during MIS 11 and its link to the ocean–atmosphere system, Palaeogeogr. Palaeoecol., 333, 24–39, 2012.
Kelly, M. R.: The Middle Pleistocene of North Birmingham. Philos. T. R. Soc. Lon. B, 247, 533–592, 1964.
Kotthoff, U., Pross, J., Müller, U. C., Peyron, O., Schmiedl, G., Schulz, H., and Bordon, A.: Climate dynamics in the borderlands of the Aegean Sea during formation of sapropel S1 deduced from a marine pollen record, Quaternary Sci. Rev., 27, 832–845, https://doi.org/10.1016/j.quascirev.2007.12.001, 2008.
Kousis, I., Koutsodendris, A., Peyron, O., Leicher, N., Francke, A., Wagner, B., Giaccio, B., Knipping, M., and Pross, J.: Centennial-scale vegetation dynamics and climate variability in SE Europe during Marine Isotope Stage 11 based on a pollen record from Lake Ohrid, Quaternary Sci. Rev., 190, 20–38, https://doi.org/10.1016/j.quascirev.2018.04.014, 2018.
Koutsodendris, A., Brauer, A., Pälike, H., Müller, U. C., Dulski, P., Lotter, A. F., and Pross, J.: Sub-decadal- to decadal-scale climate cyclicity during the Holsteinian interglacial (MIS 11) evidenced in annually laminated sediments, Clim. Past, 7, 987–999, https://doi.org/10.5194/cp-7-987-2011, 2011.
Koutsodendris, A., Pross, J., Müller, U. C., Brauer, A., Fletcher, W. J., Kühl, N., Kirilova, E., Verhagen, F. T. M., Lücke, A., and Lotter, A. F.: A short-term climate oscillation during the Holsteinian interglacial (MIS 11c): An analogy to the 8.2 ka climatic event?, Global Planet. Change, 92–93, 224–235, https://doi.org/10.1016/j.gloplacha.2012.05.011, 2012.
Koutsodendris, A., Kousis, I., Peyron, O., Wagner, B., and Pross, J.: The Marine Isotope Stage 12 pollen record from Lake Ohrid (SE Europe): Investigating short-term climate change under extreme glacial conditions, Quaternary Sci. Rev., 221, 105873, https://doi.org/10.1016/j.quascirev.2019.105873, 2019.
Koutsodendris, A., Dakos, V., Fletcher, W. J., Knipping, M., Kotthoff, U., Milner, A. M., Müller, U. C., Kaboth-Bahr, S., Kern, O. A., Kolb, L., and Vakhrameeva, P.: Atmospheric CO2 forcing on Mediterranean biomes during the past 500 kyrs, Nat. Commun., 14, 1664, https://doi.org/10.1038/s41467-023-37388-x, 2023.
Kukla, G.: Continental records of MIS 11. Washington DC, American Geophysical Union Geoph. Monog. Series, 137, 207–211, https://doi.org/10.1029/137GM14, 2003.
Kukla, G., McManus, J. F., Rousseau, D.-D., and Chuine, I.: How long and how stable was the last interglacial?, Quaternary Sci. Rev., 16, 605–612, 1997.
Laskar, J., Robutel, P., Joutel, F., tineau, M. G., Correia, A. C. M., Levrard, B., Gastineau, M., Correia, A. C. M., and Levrard, B.: A long-term numerical solution for the insolation quantities of the earth, Astron. Astrophys., 428, 261–285, https://doi.org/10.1051/0004-6361:20041335, 2004.
Leroy, S. A. G., Henry, P., Peyron, O., Rostek, F., Kende, J., Bard, E., and Tachikawa, K.: Palynology, palaeoclimate and chronology from the Saalian Glacial to Saint-Germain II interstadial from two long cores at the limit between the Mediterranean and Euxinian regions, Quaternary Sci. Rev., 311, 108145, https://doi.org/10.1016/j.quascirev.2023.108145, 2023.
Lionello, P. and Scarascia, L.: The relation between climate change in the Mediterranean region and global warming, Reg. Environ. Chang., 18, 1481–1493, 2018.
Liu, M., Shen, Y., González-Sampériz, P., Gil-Romera, G., ter Braak, C. J. F., Prentice, I. C., and Harrison, S. P.: Holocene climates of the Iberian Peninsula: pollen-based reconstructions of changes in the west–east gradient of temperature and moisture, Clim. Past, 19, 803–834, https://doi.org/10.5194/cp-19-803-2023, 2023.
Loulergue, L., Schilt, A., Spahni, R., Masson-Delmotte, V., Blunier, T., Lemieux, B., Barnola, J. M., Raynaud, D., Stocker, T. F., and Chappellaz, J.: Orbital and millennial-scale features of atmospheric CH4 over the past 800 000 years, Nature, 453, 383–386, 2008.
Loutre, M. F. and Berger, A.: Marine Isotope Stage 11 as an analogue for the present interglacial, Global Planet. Change, 36, 209–217, https://doi.org/10.1016/S0921-8181(02)00186-8, 2003.
Ludwig, P., Shao, Y., Kehl, M., and Weniger, G. C.: The Last Glacial Maximum and Heinrich event I on the Iberian Peninsula: A regional climate modelling study for understanding human settlement patterns, Global Planet. Change, 170, 34–47, 2018.
Magny, M., Miramont, C., and Sivan, O.: Assessment of the impact of climate and anthropogenic factors on Holocene Mediterranean vegetation in Europe on the basis of palaeohydrological records, Palaeogeogr. Palaeoecol., 186, 47–59, 2002.
Maiorano, P., Bertini, A., Capolongo, D., Eramo, G., Gallicchio, S., Girone, A., Pinto, D., Toti, F., Ventruti, G., and Marino, M.: Climate signatures through the marine isotope stage 19 in the Montalbano Jonico section (southern Italy): a land–sea perspective, Palaeogeogr. Palaeoecol., 461, 341–361, 2016.
Marino, M., Girone, A., Maiorano, P., Di Renzo, R., Piscitelli, A., and Flores, J. A.: Calcareous plankton and the mid-Brunhes climate variability in the Alboran Sea (ODP Site 977). Palaeogeogr. Palaeoecol., 508, 91–106, https://doi.org/10.1016/j.palaeo.2018.07.023, 2018.
Marriner, N., Kaniewski, D., Pourkerman, M., and Devillers, B.: Anthropocene tipping point reverses long-term Holocene cooling of the Mediterranean Sea: A meta-analysis of the basin's Sea Surface Temperature records, Earth-Sci. Rev., 227, 103986, https://doi.org/10.1016/j.earscirev.2022.103986, 2022.
Martin, C., Menot, G., Thouveny, N., Peyron, O., Andrieu-Ponel, V., Montade, V., Davtian, N., Reille, M., and Bard, E.: Early Holocene thermal maximum recorded by branched tetraethers and pollen in Western Europe (Massif Central, France), Quaternary Sci. Rev., 228, 106109, https://doi.org/10.1016/j.quascirev.2019.106109, 2020.
Martrat, B., Grimalt, J. O., Lopez-Martinez, C., Cacho, I., Sierro, F. J., Flores, J. A., Zahn, R., Canals, M., Curtis, J. H., and Hodell, D. A.: Abrupt temperature changes in the Western Mediterranean over the past 250 000 years, Science, 306, 1762–1765, 2004.
Martrat, B., Jimenez-Amat, P., Zahn, R., and Grimalt, J. O.: Similarities and dissimilarities between the last two deglaciations and interglaciations in the North Atlantic region, Quaternary Sci. Rev., 99, 122–134, 2014.
Masson-Delmotte, V., Landais, A., Combourieu-Nebout, N., von Grafenstein, U., Jouzel, J., Caillon, N., Chappellaz, J., Dahl-Jensen, D., Johnsen, S. J., and Stenni, B.: Variabilité climatique rapide pendant les périodes chaudes et froides aux pôles et en Europe, C. R. Geosci., 337, 935–946, 2005.
Mauri, A., Davis, B., Collins, P. M., and Kaplan, J.: The climate of Europe during the Holocene: A gridded pollen-based reconstruction and its multi-proxy evaluation, Quaternary Sci. Rev., 112, 109–127, 2015.
Mayewski, P. A., Rohling, E. E., Stager, J. C., Karlen, W., Maasch, K. A., Meeker, L. D., Meyerson, E. A., Gasse, F., van Kreveld, S., Holmgren, K., Lee-Thorp, J., Rosqvist, G., Rack, F., Staubwasser, M., Schneider, R. R., and Steig, E. J.: Holocene climate variability, Quaternary Res., 62, 243–255, 2004.
McManus, J. F., Oppo, D. W., Cullen, J. L., and Healey, S.: Marine isotope stage 11 (MIS 11): analog for Holocene and future climate?, Washington, D.C., American Geophysical Union Geoph. Monog. Series, 137, 69–85, 2003.
MedECC: Climate and Environmental Change in the Mediterranean Basin – Current Situation and Risks for the Future. First Mediterranean Assessment Report, edited by: Cramer, W., Guiot, J., Marini, K., Union for the Mediterranean, Plan Bleu, UNEP/MAP, Marseille, France, 632 pp., ISBN 978-2-9577416-0-1, https://doi.org/10.5281/zenodo.4768833, 2020.
Monaco, L., Palladino, D. M., Gaeta, M., Marra, F., Sottili, G., Leicher, N., Mannella, G., Nomade, S., Pereira, A., Regattieri, E., Wagner, B., Zanchetta, G., Albert, P. G., Arienzo, I., D'Antonio, M., Petrosino, P., Manning, C. J., and Giaccio, B.: Mediterranean tephrostratigraphy and peri-Tyrrhenian explosive activity revaluated in light of the 430–365 ka record from Fucino Basin (central Italy), Earth-Sci. Rev., 220, 103706, https://doi.org/10.1016/j.earscirev.2021.103706, 2021.
Moncel, M. H., Arzarello, M., and Peretto, C.: The Hoslteinian period in Europe (MIS 11-9), Quatern. Int., 409, 1–8, 2016.
Moreno, A., Cacho, I., Canals, M., Grimalt, J. O., and Sanchez Vidal, A.: Millennial-scale variability in the productivity signal from the Alboran Sea record, western Mediterranean Sea. Palaeogeogr. Palaeoecol., 21, 205–219, 2004.
Naughton, F., Sánchez Goñi, M. F., Desprat, S., Turon, J. L., Duprat, J., Malaizé, B., Joli, C., Cortijo, E., Drago, T., and Freitas, M. C.: Present-day and past (last 25 000 years) marine pollen signal off western Iberia, Mar. Micropaleontol., 62, 91–114, 2007.
Nehrbass-Ahles, C., Shin, J., Schmitt, J., Bereiter, B., Joos, F., Schilt, A., Schmidely, L., Silva, L., Teste, G., Grilli, R., and Chappellaz, J.: Abrupt CO2 release to the atmosphere under glacial and early interglacial climate conditions, Science, 369, 1000–1005, 2020.
Nomade, S., Bassinot, F., Marino, M., Simon, Q., Dewilde, F., Maiorano, P., Isguder, G., Blamart, D., Girone, A., Scao, V., Pereira, A., Toti, F., Bertini, A., Combourieu-Nebout, N., Peral, M., Bourles, D. L., Petrosino, P., Gallicchio, S., and Ciaranfi, N.: High-resolution foraminifer stable isotope record of MIS 19 at Montalbano Jonico, southern Italy: a window into Mediterranean climatic variability during a low-eccentricity interglacial, Quaternary Sci. Rev., 205, 106–125, 2019.
NorthGRIP Members: High-resolution record of Northern Hemisphere climate extending into the last interglacial period, Nature, 431, 147–151, 2004.
Oliveira, D., Desprat, S., Rodrigues, T., Naughton, F., Hodell, D., Trigo, R., Rufino, M., Lopes, C., Abrantes, F., and Sánchez Goñi, M. F.: The complexity of millennial-scale variability in southwestern Europe during MIS 11, Quaternary Res., 86, 373e387, https://doi.org/10.1016/j.yqres.2016.09.002, 2016.
Oliveira, D., Desprat, S., Yin, Q., Naughton, F., Trigo, R., Rodrigues, T., Abrantes, F., and Sánchez Goñi, M. F.: Unraveling the forcings controlling the vegetation and climate of the best orbital analogues for the present interglacial in SW Europe, Clim. Dynam., 51, 667–686, 2018.
Olson, S. L. and Hearty, P. J. A.: A sustained 121 m sea level highstand during MIS 11 (400 ka): direct fossil and sedimentary evidence from Bermuda, Quaternary Sci. Rev., 28, 271–285, 2009.
Ortiz, J. E., Torres, T., Delgado, A., Llamas, J. F., Soler, V., Valle, M., Julià, R., Moreno, L., and Díaz-Bautista, A.: Palaeoenvironmental changes in the Padul Basin (Granada, Spain) over the last 1 Ma based on the biomarker content, Palaeogeogr. Palaeoecol., 298, 286–299, https://doi.org/10.1016/j.palaeo.2010.10.003, 2010.
Ozenda, P.: Sur les étages de végétation dans les montagnes du bassin méditerranéen. Documents de Cartographie Ecologique, 16, 1–32, 1975.
Past Interglacials Working Group of PAGES: Interglacials of the last 800 000 years, Rev. Geophys., 54, 162–219, 2016.
Peñalba, M. C., Maurice, A., Guiot, J., Duplessy, J. C., and de Beaulieu, J. L.: Termination of the last glaciation in the Iberian Peninsula Inferred from the Pollen Sequence of Quintanar de la Sierra, Quaternary Res., 48, 205–214, 1997.
Pérez-Folgado, M., Sierro, F. J., Flores, J. A., Grimalt, J. O., and Zahn, R.: Paleoclimatic variations in foraminifer assemblages from the Alboran Sea (Western Mediterranean) during the last 150 ka in ODP Site 977, Mar. Geol., 212, 113–131, 2004.
Peyron, O., Goring, S., Dormoy, I., Kotthoff, U., Pross, J., De Beaulieu, J. L., Drescher-Schneider, R., Vanniere, B., and Magny, M.: Holocene seasonality changes in the central Mediterranean region reconstructed from the pollen sequences of Lake Accesa (Italy) and Tenaghi Philippon (Greece), Holocene, 21, 131–146, https://doi.org/10.1177/0959683610384162, 2011.
Peyron, O., Magny, M., Goring, S., Joannin, S., de Beaulieu, J.-L., Brugiapaglia, E., Sadori, L., Garfi, G., Kouli, K., Ioakim, C., and Combourieu-Nebout, N.: Contrasting patterns of climatic changes during the Holocene across the Italian Peninsula reconstructed from pollen data, Clim. Past, 9, 1233–1252, https://doi.org/10.5194/cp-9-1233-2013, 2013.
Peyron, O., Combourieu-Nebout, N., Brayshaw, D., Goring, S., Andrieu-Ponel, V., Desprat, S., Fletcher, W., Gambin, B., Ioakim, C., Joannin, S., Kotthoff, U., Kouli, K., Montade, V., Pross, J., Sadori, L., and Magny, M.: Precipitation changes in the Mediterranean basin during the Holocene from terrestrial and marine pollen records: a model–data comparison, Clim. Past, 13, 249–265, https://doi.org/10.5194/cp-13-249-2017, 2017.
Pol, K., Masson Delmotte, V., Johnsen, S., Bigler, M., Cattani, O., Durand, G., Falourd, S., Jouzel, J., Minster, B., Parrenin, F., Ritz, C., Steen Larsen, C. H., and Stenni, B.: New MIS 19 EPICA Dome C high resolution deuterium data: hints for a problematic preservation of climate variability at sub-millennial scale in the “oldest ice”, Earth Planet. Sc. Lett., 298, 95–103, 2010.
Pons, A. and Reille, M.: The Holocene and Upper Pleistocene pollen record from Padul (Granada, Spain): a new study, Palaeogeogr. Palaeoecol., 66, 243–263, 1988.
Pross, J., Kotthoff, U., Müller, U. C., Peyron, O., Dormoy, I., Schmiedl, G., Kalaitzidis, S., and Smith, A. M.: Massive perturbation in terrestrial ecosystems of the Eastern Mediterranean region associated with the 8.2 kyr BP climatic event, Geology, 37, 887–890, 2009.
Pross, J., Christanis, K., Fischer, T., Fletcher, W. J., Hardiman, M., Kalaitzidis, S., Knipping, M., Kotthoff, U., Milner, A. M., Muller, U. C., and Schmiedl, G.: The 1.35-Ma-long terrestrial climate archive of Tenaghi Philippon, northeastern Greece: Evolution, exploration, and perspectives for future research, Newsl. Stratigr., 48, 253–276, 2015.
Quézel, P. and Médail, F.: Ecologie et biogéographie des forêts du basin méditerranéen, Elsevier, Paris, France, 571 pp., ISBN 9782842994518, 2003.
Ramos-Román, M. J., Jiménez-Moreno, G., Camuera, J., García-Alix, A., Anderson, R. S., Jiménez-Espejo, F. J., and Carrión, J. S.: Holocene climate aridification trend and human impact interrupted by millennial- and centennial-scale climate fluctuations from a new sedimentary record from Padul (Sierra Nevada, southern Iberian Peninsula), Clim. Past, 14, 117–137, https://doi.org/10.5194/cp-14-117-2018, 2018.
Raymo, M. E. and Mitrovica, J. X.: Collapse of polar ice sheets during the stage 11 interglacial, Nature, 483, 453–456, 2012.
Regattieri, E., Giaccio, B., Galli, P., Nomade, S., Peronace, E., Messina, P., Sposato, A., Boschi, C., and Gemelli, M.: A multi-proxy record of MIS 11–12 deglaciation and glacial MIS 12 instability from the Sulmona Basin (central Italy), Quaternary Sci. Rev., 132, 12–145, 2016.
Reille, M. and de Beaulieu, J. L.: Long Pleistocene pollen records from the Praclaux crater, south-central France, Quaternary Res., 44, 205–215, https://doi.org/10.1006/qres.1995.1065, 1995.
Rivas-Martínez, S.: Bioclimatic stages, chorological sectors and series of vegetation in Mediterranean Spain, Ecol. Mediterr., 8, 275–288, 1982.
Robles, M., Peyron, O., Ménot, G., Brugiapaglia, E., Wulf, S., Appelt, O., Blache, M., Vannière, B., Dugerdil, L., Paura, B., Ansanay-Alex, S., Cromartie, A., Charlet, L., Guédron, S., de Beaulieu, J.-L., and Joannin, S.: Climate changes during the Late Glacial in southern Europe: new insights based on pollen and brGDGTs of Lake Matese in Italy, Clim. Past, 19, 493–515, https://doi.org/10.5194/cp-19-493-2023, 2023.
Rodrigo-Gámiz, M., García-Alix, A., Jiménez-Moreno, G., Ramos-Román, M. J., Camuera, J., Toney, J. L., Sachse, D., Anderson, R. S., and Damsté, J. S. S.: Paleoclimate reconstruction of the last 36 kyr based on branched glycerol dialkyl glycerol tetraethers in the Padul palaeolake record (Sierra Nevada, southern Iberian Peninsula), Quaternary Sci. Rev., 281, 107434, https://doi.org/10.1016/j.quascirev.2022.107434, 2022.
Rodrigues, T., Voelker, A. H. L., Grimalt, J. O., Abrantes, F., and Naughton, F.: Iberian Margin sea surface temperature during MIS 15 to 9 (580–300 ka): glacial sub-orbital variability versus interglacial stability, Paleoceanography, 26, 1e16, https://doi.org/10.1029/2010PA001927, 2011.
Rohling, E. J., Fenton, M., Jorissen, F. J., Bertrand, P., Ganssen, G., and Caulet, J. P.: Magnitudes of sea-level lowstands of the past 500 000 years, Nature, 394, 162e165, https://doi.org/10.1038/28134, 1998.
Rossignol-Strick, M.: The Holocene climatic optimum and pollen records of sapropel 1 in the Eastern Mediterranean, 9000–6000 BP, Quaternary Sci. Rev., 18, 515–530, 1999.
Ruddiman, W. F.: The anthropogenic greenhouse era began thousands of years ago, Climatic Change, 61, 261–293, 2003.
Ruddiman, W. F.: The early anthropogenic hypothesis: Challenges and responses, Rev. Geophys., 45, RG4001, https://doi.org/10.1029/2006RG000207, 2007.
Ruddiman, W. F., Fuller, D. Q., Kutzbach, J. E., Tzedakis, P. C., Kaplan, J. O., Ellis, E. C., Vavrus, S. J., Roberts, C. N., Fyfe, R., He, F., and Lemmen, C.: Late Holocene climate: Natural or anthropogenic?, Rev. Geophys., 54, 93–118, 2016.
Sadori, L., Ortu, E., Peyron, O., Zanchetta, G., Vannière, B., Desmet, M., and Magny, M.: The last 7 millennia of vegetation and climate changes at Lago di Pergusa (central Sicily, Italy), Clim. Past, 9, 1969–1984, https://doi.org/10.5194/cp-9-1969-2013, 2013.
Sadori, L., Koutsodendris, A., Panagiotopoulos, K., Masi, A., Bertini, A., Combourieu-Nebout, N., Francke, A., Kouli, K., Joannin, S., Mercuri, A. M., Peyron, O., Torri, P., Wagner, B., Zanchetta, G., Sinopoli, G., and Donders, T. H.: Pollen-based paleoenvironmental and paleoclimatic change at Lake Ohrid (south-eastern Europe) during the past 500 ka, Biogeosciences, 13, 1423–1437, https://doi.org/10.5194/bg-13-1423-2016, 2016.
Salonen, J. S., Luoto, M., Alenius, T., Heikkilä, M., Seppä, H., Telford, R. J., and Birks, H. J. B.: Reconstructing palaeoclimatic variables from fossil pollen using boosted regression trees: comparison and synthesis with other quantitative reconstruction methods, Quaternary Sci. Rev., 88, 69–81, 2014.
Salonen, J. S., Korpela, M., Williams, J. W., and Luoto, M.: Machine-learning based reconstructions of primary and secondary climate variables from North American and European fossil pollen data, Sci. Rep., 9, 1–13, https://doi.org/10.1038/s41598-019-52293-4, 2019.
Sánchez Goñi, M., Eynaud, F., Turon, J. L., and Shackleton, N. J.: High resolution palynological record off the Iberian margin: direct land–sea correlation for the Last Interglacial complex, Earth Planet. Sc. Lett., 171, 123–137, 1999.
Sánchez Goñi, M. F., Llave, E., Oliveira, D., Naughton, F., Desprat, S., Ducassou, E., Hodell, D. A., and Hernández-Molina, F. J.: Climate changes in southwestern Iberia and Mediterranean Outflow variations during two contrasting cycles of the last 1 Myrs: MIS 31-MIS 30 and MIS 12-MIS 11. Global Planet. Change, 136, 18–29, https://doi.org/10.1016/j.gloplacha.2015.11.006, 2016a.
Sánchez Goñi, M. F., Rodrigues, T., Hodell, D. A., Polanco-Martinez, J. M., Alonso-Garcia, M., Hernandez-Almeida, I., Desprat, S., and Ferretti, P.: Tropically-driven climate shifts in southwestern Europe during MIS 19, a low eccentricity interglacial, Earth Planet. Sc. Lett., 448, 81–93, 2016b.
Sassoon, D., Lebreton, V., Combourieu-Nebout, N., Peyron, O., and Moncel, M. H.: Palaeoenvironmental Changes in the Southwest Mediterranean (ODP Site 976, Alboran Sea) During the MIS 12/11 Transition and the MIS 11 Interglacial, Quaternary Sci. Rev., 304, 108010, https://doi.org/10.1016/j.quascirev.2023.108010, 2023.
Sassoon, D., Combourieu-Nebout, N., Peyron, O., Bertini, A., Toti, F., Lebreton, V., and Moncel, M. H.: Pollen-based climatic reconstructions for the interglacial analogues of MIS 1 (MIS 19, 11 and 5) in the Southwestern Mediterranean: insights from ODP Site 976, Mendeley Data [data set], https://data.mendeley.com/datasets/m4kzgwk6b9/2 (last access: 6 February 2025), 2025.
Shackleton, N. J., Sánchez-Goñi, M. F., Pailler, D., and Lancelot, Y.: Marine isotope substage 5e and the Eemian interglacial, Global Planet. Change, 36, 151–155, 2003.
Shipboard Scientific Party: Site 976, in: Proc. ODP, Init. Repts., 161: College Station, TX (Ocean Drilling Program), edited by: Comas, M.C., Zahn, R., Klaus, A., et al., 179–297, http://www-odp.tamu.edu/publications/161_IR/VOLUME/CHAPTERS/ir161_06.pdf (last access: 10 November 2022), 1996
Siani, G., Michel, E., De Pol-Holz, R., DeVries, T., Lamy, F., Carel, M., Isguder, G., Dewilde, F., and Lourantou, A.: Carbon isotope records reveal precise timing of enhanced Southern Ocean upwelling during the last deglaciation, Nat. Commun., 4, 2758, https://doi.org/10.1038/ncomms3758, 2013.
Sinopoli, G., Peyron, O., Masi, A., Holtvoeth, J., Francke, A., Wagner, B., and Sadori, L.: Pollen-based temperature and precipitation changes in the Ohrid Basin (western Balkans) between 160 and 70 ka, Clim. Past, 15, 53–71, https://doi.org/10.5194/cp-15-53-2019, 2019.
Stuiver, M. and Reimer, P. J.: Extended 14C database and revised CALIB radiocarbon calibration program, Radiocarbon, 35, 215–230, 1993.
Stuiver, M., Reimer, P. J., Bard, E., Beck, W., Burr, G. S., Hughen, K. A., Kromer, B., McCormac, F. G., van der Plicht, J., and Spurk, M.: INTCAL98 radiocarbon age calibration, 24 000 cal BP, Radiocarbon, 40, 1041–1083, 1998.
ter Braak, C. J. F. and Juggins, S.: Weighted averaging partial least squares regression (WA-PLS): an improved method for reconstructing environmental variables from species assemblages, Hydrobiologia, 269–270, 485–502, https://doi.org/10.1007/BF00028046, 1993.
Toti, F., Bertini, A., Girone, A., Marino, M., Maiorano, P., Bassinot, F., Combourieu-Nebout, N., Nomade, S., and Buccianti, A.: Marine and terrestrial climate variability in the western Mediterranean Sea during marine isotope stages 20 and 19, Quaternary Sci. Rev., 243, : 106486, https://doi.org/10.1016/j.quascirev.2020.106486, 2020a.
Toti, F., Bertini, A., Girone, A., Marino, M., Maiorano, P., Bassinot, F., Combourieu-Nebout, N., Nomade, S., and Buccianti, A.: Pollen composition of sediment cores from ODP site 161-976, PANGAEA [data set], https://doi.org/10.1594/PANGAEA.923093, 2020b.
Turner, C.: The Middle Pleistocene deposits at Marks Tey, Essex. Philos. T. R. Soc. Lon. B, 257, 373–440, 1970.
Turon, J.-L., Lézine, A.-M., and Denèfle, M.: Land–sea correlations for the last deglaciation inferred from a pollen and dinocyst record from the Portuguese margin, Quaternary Res., 59, 88–96, 2003.
Tye, G. J., Sherriff, J., Candy, I., Coxon, P., Palmer, A., Mcclymont, E. L., and Schreve, D. C.: The d18O stratigraphy of the Hoxnian lacustrine sequence at Marks Tey, Essex, UK: implications for the climatic structure of MIS 11 in Britain, J. Quaternary Sci., 31, 75–92, https://doi.org/10.1002/jqs.2840, 2016.
Tzedakis, P. C.: The MIS 11 – MIS 1 analogy, southern European vegetation, atmospheric methane and the “early anthropogenic hypothesis”, Clim. Past, 6, 131–144, https://doi.org/10.5194/cp-6-131-2010, 2010.
Tzedakis, P. C., Hooghiemstra, H., and Pälike, H.: The last 1.35 million years at Tenaghi Philippon: revised chronostratigraphy and long-term vegetation trends, Quaternary Sci. Rev., 25, 3416–3430, https://doi.org/10.1016/j.quascirev.2006.09.002, 2006.
Tzedakis, P. C., Channell, J. E. T., Hodell, D. A., Kleiven, H. F., and Skinner, L. C.: Determining the natural length of the current interglacial, Nat. Geosci., 5, 138–141, 2012.
Tzedakis, P. C., Hodell, D. A., Nehrbass-Ahles, C., Mitsui, T., and Wolff, E. W.: Marine Isotope Stage 11c: An unusual interglacial, Quaternary Sci. Rev., 284, 107493, https://doi.org/10.1016/j.quascirev.2022.107493, 2022.
Vavrus, S. J., He, F., Kutzbach, J. E., Ruddiman, W. F., and Tzedakis, P. C.: Glacial Inception in Marine Isotope Stage 19: An Orbital Analog for a Natural Holocene Climate, Sci. Rep., 8, 10213, https://doi.org/10.1038/s41598-018-28419-5, 2018.
Vázquez Riveiros, N., Waelbroeck, C., Skinner, L., Duplessy, J. C., McManus, J. F., Kandiano, E. S., and Bauch, H. A.: The “MIS 11 paradox” and ocean circulation: Role of millennial scale events, Earth Planet. Sc. Lett., 371–372, 258–268, https://doi.org/10.1016/j.epsl.2013.03.036, 2013.
Voelker, A. H. L., Rodrigues, T., Billups, K., Oppo, D., McManus, J., Stein, R., Hefter, J., and Grimalt, J. O.: Variations in mid-latitude North Atlantic surface water properties during the mid-Brunhes (MIS 9–14) and their implications for the thermohaline circulation, Clim. Past, 6, 531–552, https://doi.org/10.5194/cp-6-531-2010, 2010.
von Grafenstein, U., Erlenkeuser, H., Brauer, A., Jouzel, J., and Johnsen, S. J.: A mid-European decadal isotope-climate record from 15 500 to 5000 years BP, Science, 284, 1654–1657, 1999.
Wagner, B., Vogel, H., Francke, A., Friedrich, T., Donders, T., Lacey, J. H., Leng, M. J., Regattieri, E., Sadori, L., Wilke, T., and Zanchetta, G.: Mediterranean winter rainfall in phase with African monsoons during the past 1.36 million years, Nature, 573, 256–260, 2019.
Wang, Y., Yang, X., Wang, Y., Wang, Q., and Edwards, R. L.: The structure of marine isotope Stage 11 and its alignment with the Holocene. Palaeogeogr. Palaeoecol., 609, 111311, https://doi.org/10.1016/j.palaeo.2022.111311, 2023.
Watts, W. A., Allen, J. R. M., Huntley, B., and Fritz, S. C.: Vegetation history and climate of the last 15 000 years at Laghi di Monticchio, Southern Italy, Quaternary Sci. Rev., 15, 113–132, 1996.
West, R.: The Quaternary deposits at Hoxne, Suffolk. Philos. T. R. Soc. Lon. B, 239, 265–356, 1956.
Wijmstra, T. A. and Smit, A.: Palynology of the middle part (30–78 metres) of the 120 m deep section in Northern Greece (Macedonia). Acta Bot. Neerl., 25, 297–312, 1976.
Yin, Q. and Berger, A.: Interglacial analogues of the Holocene and its natural near future, Quaternary Sci. Rev., 120, 28–46, https://doi.org/10.1016/j.quascirev.2015.04.008, 2015.
Zhuravleva, A.: Paleoceanographic and climatic teleconnections between the subarctic and subtropical North Atlantic during the last interglacial (MIS 5e), Doctoral dissertation, https://doi.org/10.13140/RG.2.2.26501.86242, 2018.
Zonneveld, K. A.: Palaeoclimatic reconstruction of the last deglaciation (18–8 ka BP) in the Adriatic Sea region; a land–sea correlation based on palynological evidence, Palaeogeogr. Palaeoecol., 122, 89–106, 1996.